Article

A Novel Method for the Quantitative Evaluation of Retrograde Condensate Pollution in Condensate Gas Reservoirs

1
China-France Bohai Geoservices Co., Ltd., Tianjin 300457, China
2
Tianjin Branch of CNOOC (China) Co. Limited, Tianjin 300459, China
3
College of Geosciences, Yangtze University, Wuhan 430100, China
*
Author to whom correspondence should be addressed.
Processes 2024, 12(3), 522; https://doi.org/10.3390/pr12030522
Submission received: 27 January 2024 / Revised: 26 February 2024 / Accepted: 27 February 2024 / Published: 5 March 2024

Abstract

:
During the development of condensate gas reservoirs, the phenomenon of retrograde condensation seriously affects the production of gas wells. The skin factor caused by retrograde condensation pollution is the key to measuring the consequent decrease in production. In this study, a multiphase flow model and a calculation model of retrograde condensate damage are first constructed through a dynamic simulation of the phase behavior characteristics in condensate gas reservoirs using the skin coefficient, and these models are then creatively coupled to quantitatively evaluate retrograde condensation pollution. The coupled model is solved using a numerical method, which is followed by an analysis of the effects of the selected formation and engineering parameters on the condensate saturation distribution and pollution skin coefficient. The model is verified using actual test data. The results of the curves show that gas–liquid two-phase permeability has an obvious effect on well production. When the phase permeability curve changes from the first to the third type, the skin coefficient increases from 3.36 to 26.6, and the condensate precipitation range also increases significantly. The distribution of the pollution skin coefficient also changes significantly as a result of variations in the formation and dew point pressures, well production, and formation permeability. The average error between the calculated skin of the model and the actual test skin is 3.87%, which meets the requirements for engineering calculations. These results have certain significance for guiding well test designs and the evaluation of condensate gas well productivity.

1. Introduction

Condensate gas reservoirs are a special class of gaseous deposits formed under certain geological conditions, such as during the retrograde phenomenon, where there is a drop in pressure during the formation process due to the high C5+ content of the gas components [1]. Condensate gas reservoirs are widely distributed worldwide, accounting for 7.5% of the total recoverable resources of hydrocarbons; therefore, there are broad prospects for their exploration and development [1,2,3]. The retrograde phenomenon is common in the development of condensate gas reservoirs due to their special fluid properties, which results in the precipitation of condensate oil near wells and leads to a reduction in gas well production [4,5,6,7]. To study the retrograde phenomenon and assess its impact on the yield during the development of condensate gas reservoirs, substantial research has been conducted on condensate gas phase characteristics, the evaluation of retrograde pollution, and the impact of retrograde pollution on production, which has mainly been carried out through physical experiments and numerical simulation methods [8,9,10,11]. In relation to the phase characteristics of condensate gas reservoirs, Onoabhagbe et al. [12] propose a novel approach for tracking the phase change based on simulating the formation of condensate blockage in tight as well as low- and high-permeability reservoirs; Wang et al. [13] improve the Peng–Robinson model to simulate the phase change of condensate gas and calculate the volume of condensate oil considering the effect of capillary forces; and Abbasov et al. [14] analyze the influence of gas components on the retrograde condensation of condensate gas based on the results of retrograde condensation simulation experiments. During the evaluation of retrograde pollution, Dinariev and Evseev [15] construct a condensate liquid production model for the multicomponent flow of condensate gas based on the dynamic characteristics of the condensate gas phase change. Xiao et al. [16] summarize a variety of methods for evaluating retrograde pollution and its impact on production capacity according to the mechanism of near-well retrograde pollution in condensate gas wells. Wang et al. [17] analyze the effectiveness of the non-equilibrium pressure drop method in mitigating the retrograde pollution of condensate wells through physical simulation experiments. Regarding the impact of retrograde pollution on production, Azin et al. [18] propose a novel and integrated strategy to evaluate the skin factor in optimizing the production of a low-production well. Jiang et al. [19] propose a method for evaluating the impact of retrograde condensation pollution on gas well productivity based on simulating the distribution of retrograde condensation saturation near the wellbore, which involves a combination of early well testing interpretation results and the pseudo-steady-state gas well productivity equation. The results of the above studies reveal the mechanism of the retrograde phenomenon in condensate reservoirs and its impact on the production capacity of gas wells, but they fail to accurately reflect the non-homogeneous characteristics of the retrograde region and quantitatively evaluate retrograde condensate pollution. In response to the above issues, in this study, a gas phase simulation model, a multiphase flow model, and a skin coefficient pollution model are combined to achieve the quantitative characterization of retrograde condensation pollution.

2. Methods

Based on the dynamic simulation of condensate gas phase characteristics, a gas phase simulation model, a multiphase flow model for condensate gas reservoirs, and a model are constructed for calculating the skin factor of retrograde damage. A model solution is realized using numerical methods, followed by analyses of relevant stratigraphic and engineering parameters regarding their influence on the distribution of condensate saturation and the skin factor of retrograde damage. Based on the well testing data of a condensate gas well, this constructed model is then used to calculate the skin factor of retrograde damage under various testing systems, and the results are consistent with the interpretation results of well testing, thus verifying the reliability of this model. These results have certain significance for guiding well test designs and the evaluation of condensate gas well productivity.

2.1. Construction of the Condensate Gas Phase Simulation Model

During the development of condensate gas reservoirs, condensate precipitates out of the formation around the wellbore due to the bottomhole pressure being lower than the dew point pressure of condensate gas. Since the gas belongs to a multicomponent system, laboratory research during the process of condensate gas reservoir extraction has focused on phase analysis in PVT tubes, in which the obtained parameters are used as a reference for the actual development dynamics of condensate gas reservoir depletion. Meanwhile, research has mostly focused on the phase change process of condensate gas reservoirs in practical engineering calculations, with relevant models proposed for condensate oil calculation. The Peng–Robinson equation is generally used to calculate the hydrocarbon content in a condensate reservoir under given conditions [20,21]. The equation can be expressed as follows [13]:
p = R T V b i a i V ( V + b i ) + b ( V b i )
where
a i = 0.45724 R 2 T c 2 p c [ 1 + m ( i ) × ( 1 T c 0.5 ) ] 2 m ( i ) = 0.37464 + 1.54226 w 0.26992 w 2 b i = 0.0778 R 2 T c 2 p c
where p is the formation pressure, MPa; R is the gas constant, 8.314 J/(mol·K); T is the formation temperature, K; V is the molar volume, m3/kmol; ɑi is a constant of state equation, MPa·m3/(mol·K); bi is a constant of state equation, m3/kmol; pc is the critical pressure, MPa; Tc is the critical temperature, K; and w is the eccentricity factor.
To verify the accuracy of this model, the changes in fluid state under given conditions are calculated using this model and a reservoir pressure of 46.93 MPa, formation temperature of 152.0 °C, and production gas–oil ratio of 1095 m3/m3. Through sampling, the composition of bottomhole fluid is determined as 61.19% C1 + N2, 30.84% C2~C6 + CO2, and C7+, being within the scope for condensate gas reservoirs. Through constant volume depletion experiments and constant mass expansion experiments, the dew point pressure is determined at a formation temperature of 45.61 MPa, maximum retrograde volume of 40.97%, and pressure of 28.62 MPa, and the deviation coefficient under dew point conditions is 1.198. The reliability of the gas phase simulation model is verified by fitting the results from this model and the fixed-volume depletion experiments, with the maximum relative error in the fitted values being 7.54% and the average relative error being 2.87% (Figure 1).

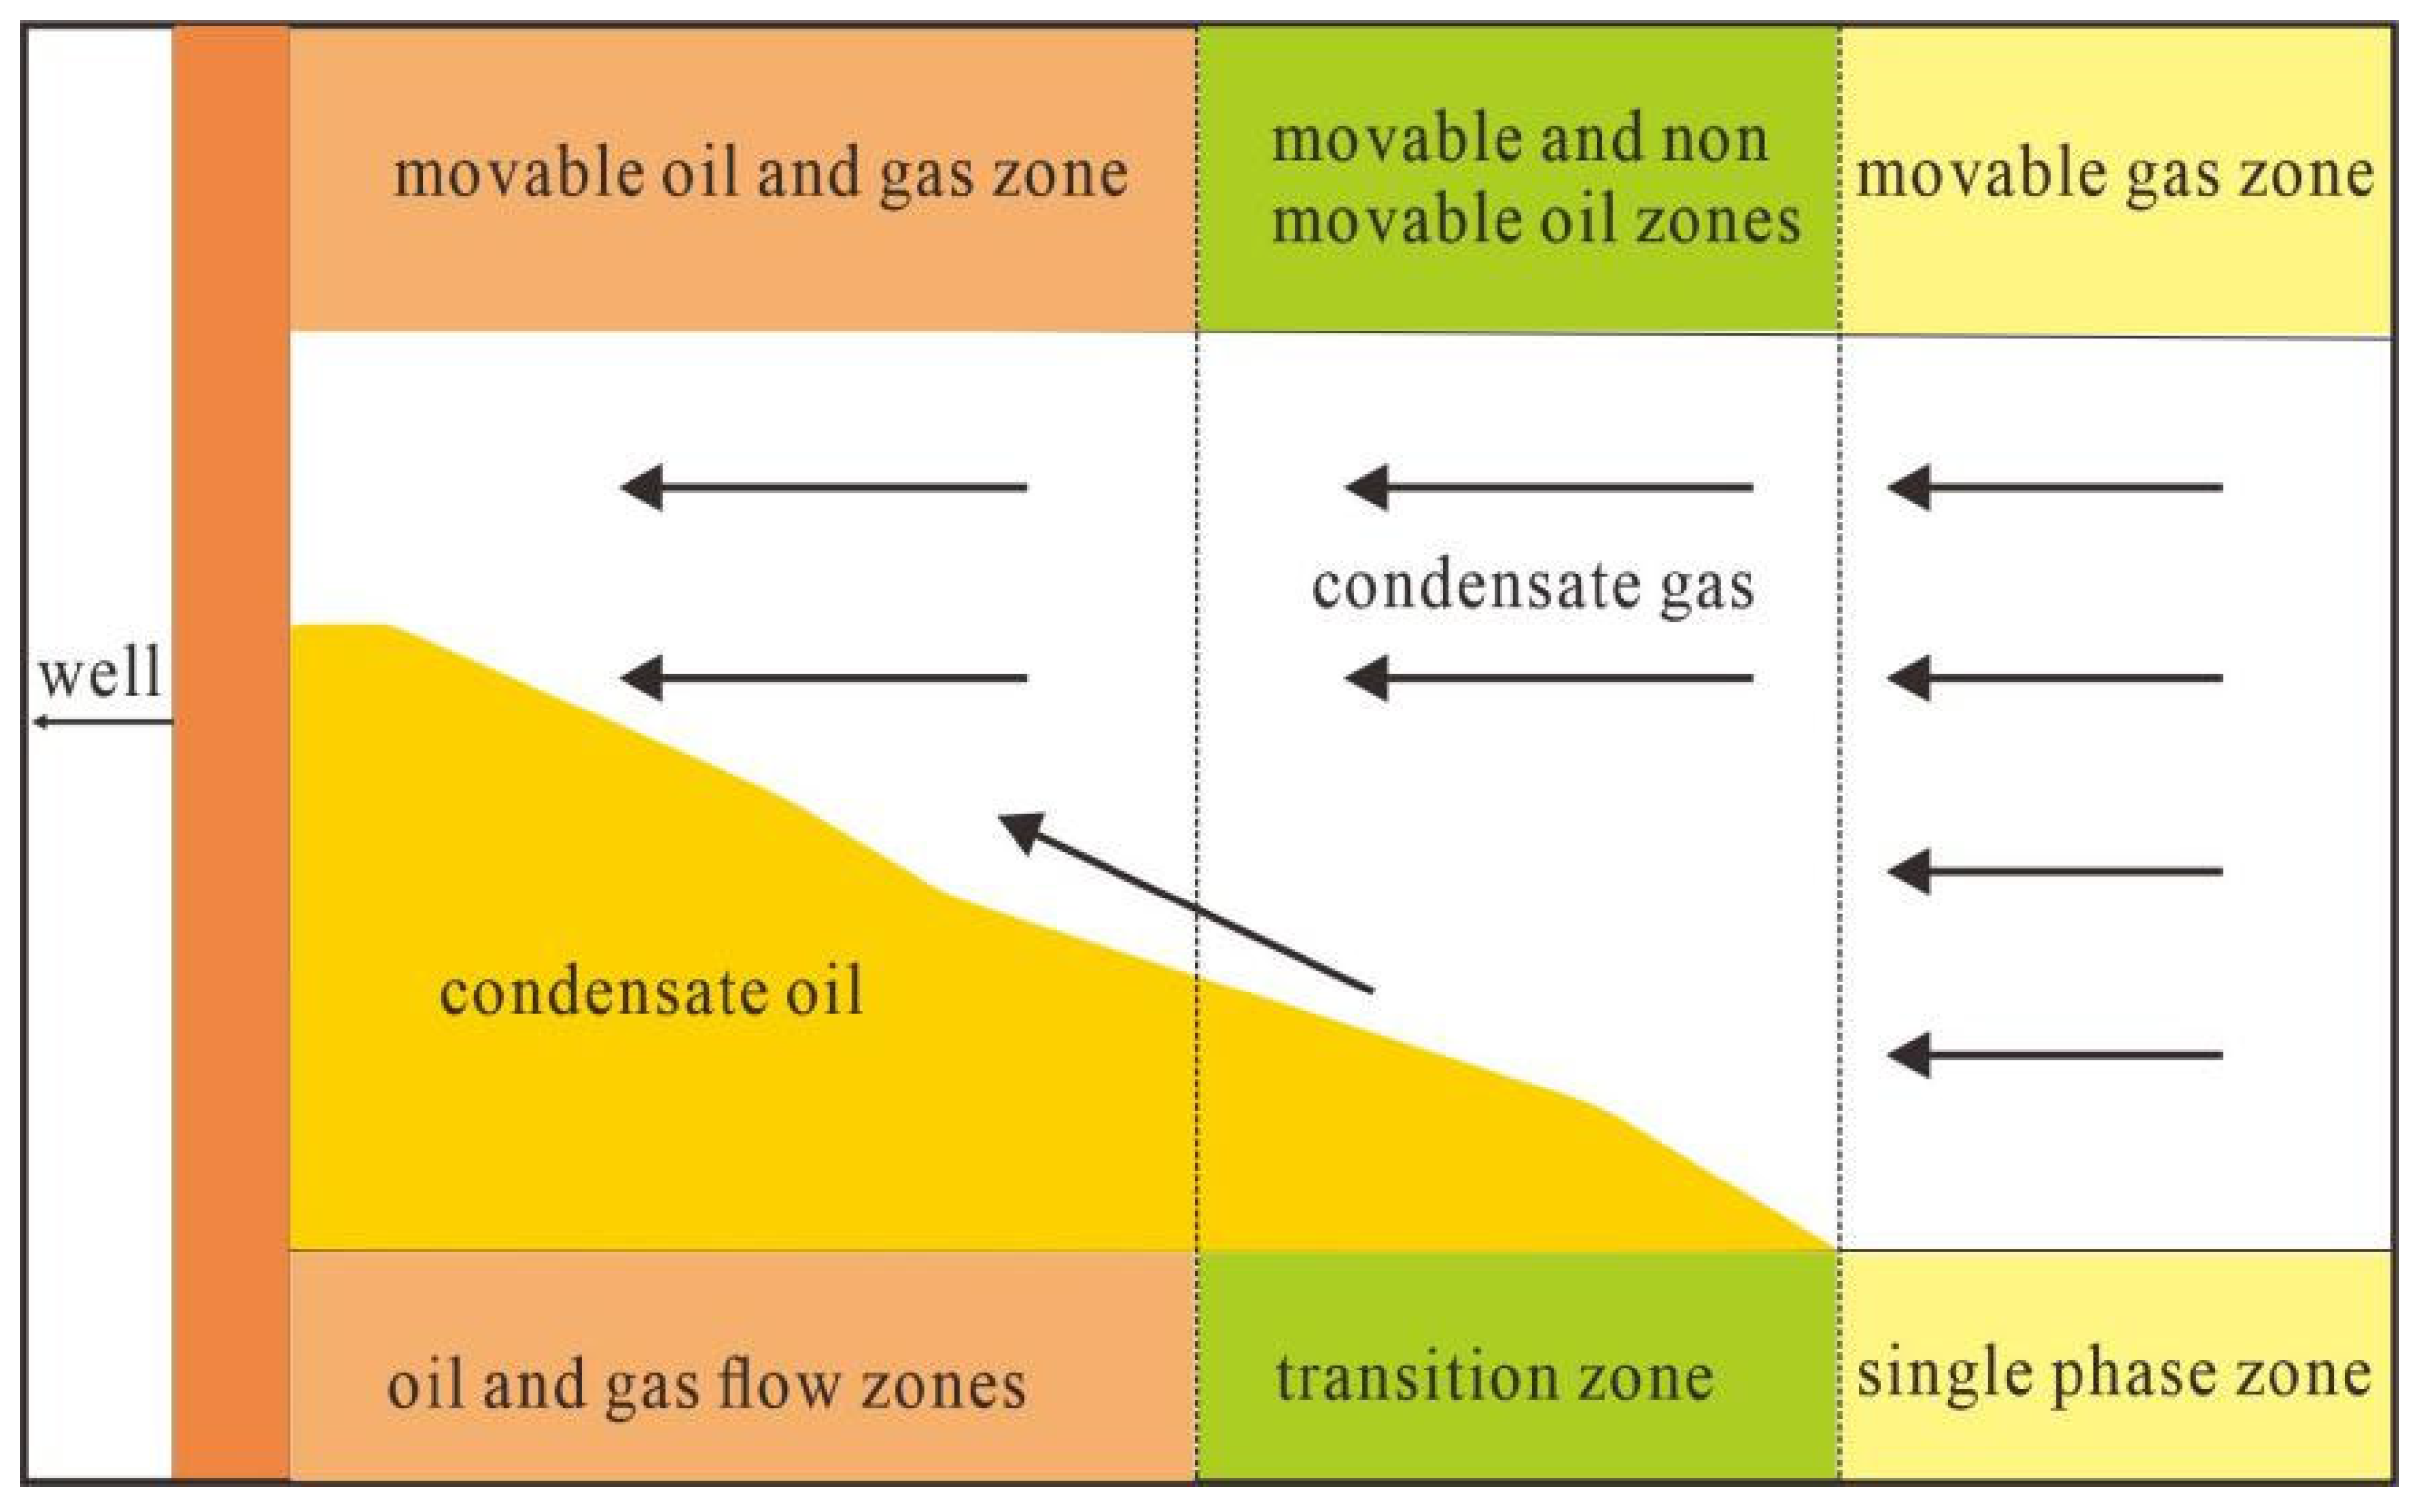
2.2. Construction of the Multiphase Flow Model for Condensate Gas Reservoirs

During the development of condensate gas reservoirs, the production of gas wells leads to a decrease in bottomhole pressure, which causes the gradual precipitation of condensate oil and results in a two-phase gas–liquid flow within the formation. When the saturation of the oil and gas phases reaches a certain value, both the oil and gas phases flow simultaneously. Assuming that gas flows isothermally in a mean horizontal formation without the effects of gravity and other factors, the flow follows Darcy’s law. Based on the fluid state and the principle of mass conservation, the flow equations for gas and oil in the formation can be expressed as follows [22]:
1 r [ ρ g R s v o + ( 1 y c ) ρ g v g ] + r [ ρ g R s v o + ( 1 y c ) ρ g v g ] = ϕ t [ ρ g R s S o + ( 1 y c ) ρ g S g ] 1 r [ ρ o v o + y c ρ g v g ] + r ( ρ o v o + y c ρ g v g ) = ϕ t ( ρ o S o + y c ρ g S g )
where r is the radius, m; ρ is the density, kg/m3; Rs is the dissolved gas–oil ratio, m3/m3; v is the velocity, m/s; yc is the molar mass of condensate oil contained in the condensate gas; t is the time, h; S is the saturation; and the subscripts g and o represent the gas phase and oil phase, respectively.
Since the flow of gas and oil in the formation obeys Darcy’s law, the flow velocity of the oil and gas can be expressed as follows [23,24]:
v o = K K r o μ o p r v g = K K r g μ g p r
where K is the permeability, mD; Kro is the relative permeability of the oil phase; Krg is the relative permeability of the gas phase; μo is the viscosity of the oil phase, mPa·s; μg is the viscosity of the gas phase, mPa·s; and p is the pressure, MPa.
Based on the flow state, motion equation, and continuity equation of fluid [25,26], the flow equations for the gas and oil phases in the formation can also be written as follows:
1 r r [ ( K r g μ g B g + K r o μ o B o R s ) r p r ] = ϕ K t ( S g B g + S o B o R s ) 1 r r [ ( K r o μ o B o + K r g μ g B g R v ) r p r ] = ϕ K t ( S o B o + S g B g R v )
where B is the volume factor, m3/m3, and Rv is the oil–gas ratio in condensate gas, m3/m3.
The initial condition of a gas reservoir can be written as
p ( t = 0 ) = p i
Assuming that the gas well is producing at a constant production rate and the gas–oil ratio is constant, the inner boundary conditions can be characterized by production as follows:
( K r g μ g B g + K r o μ o B o R s ) r p r | r = r w = Q g 2 π K h ( K r g μ g B g + K r o μ o B o R v ) r p r | r = r w = Q o 2 π K h
Assuming the formation is a fixed pressure boundary layer, its outer boundary conditions can be expressed as follows:
p ( r = r e ) = p i

2.3. Construction of the Retrograde Pollution Skin Coefficient Model
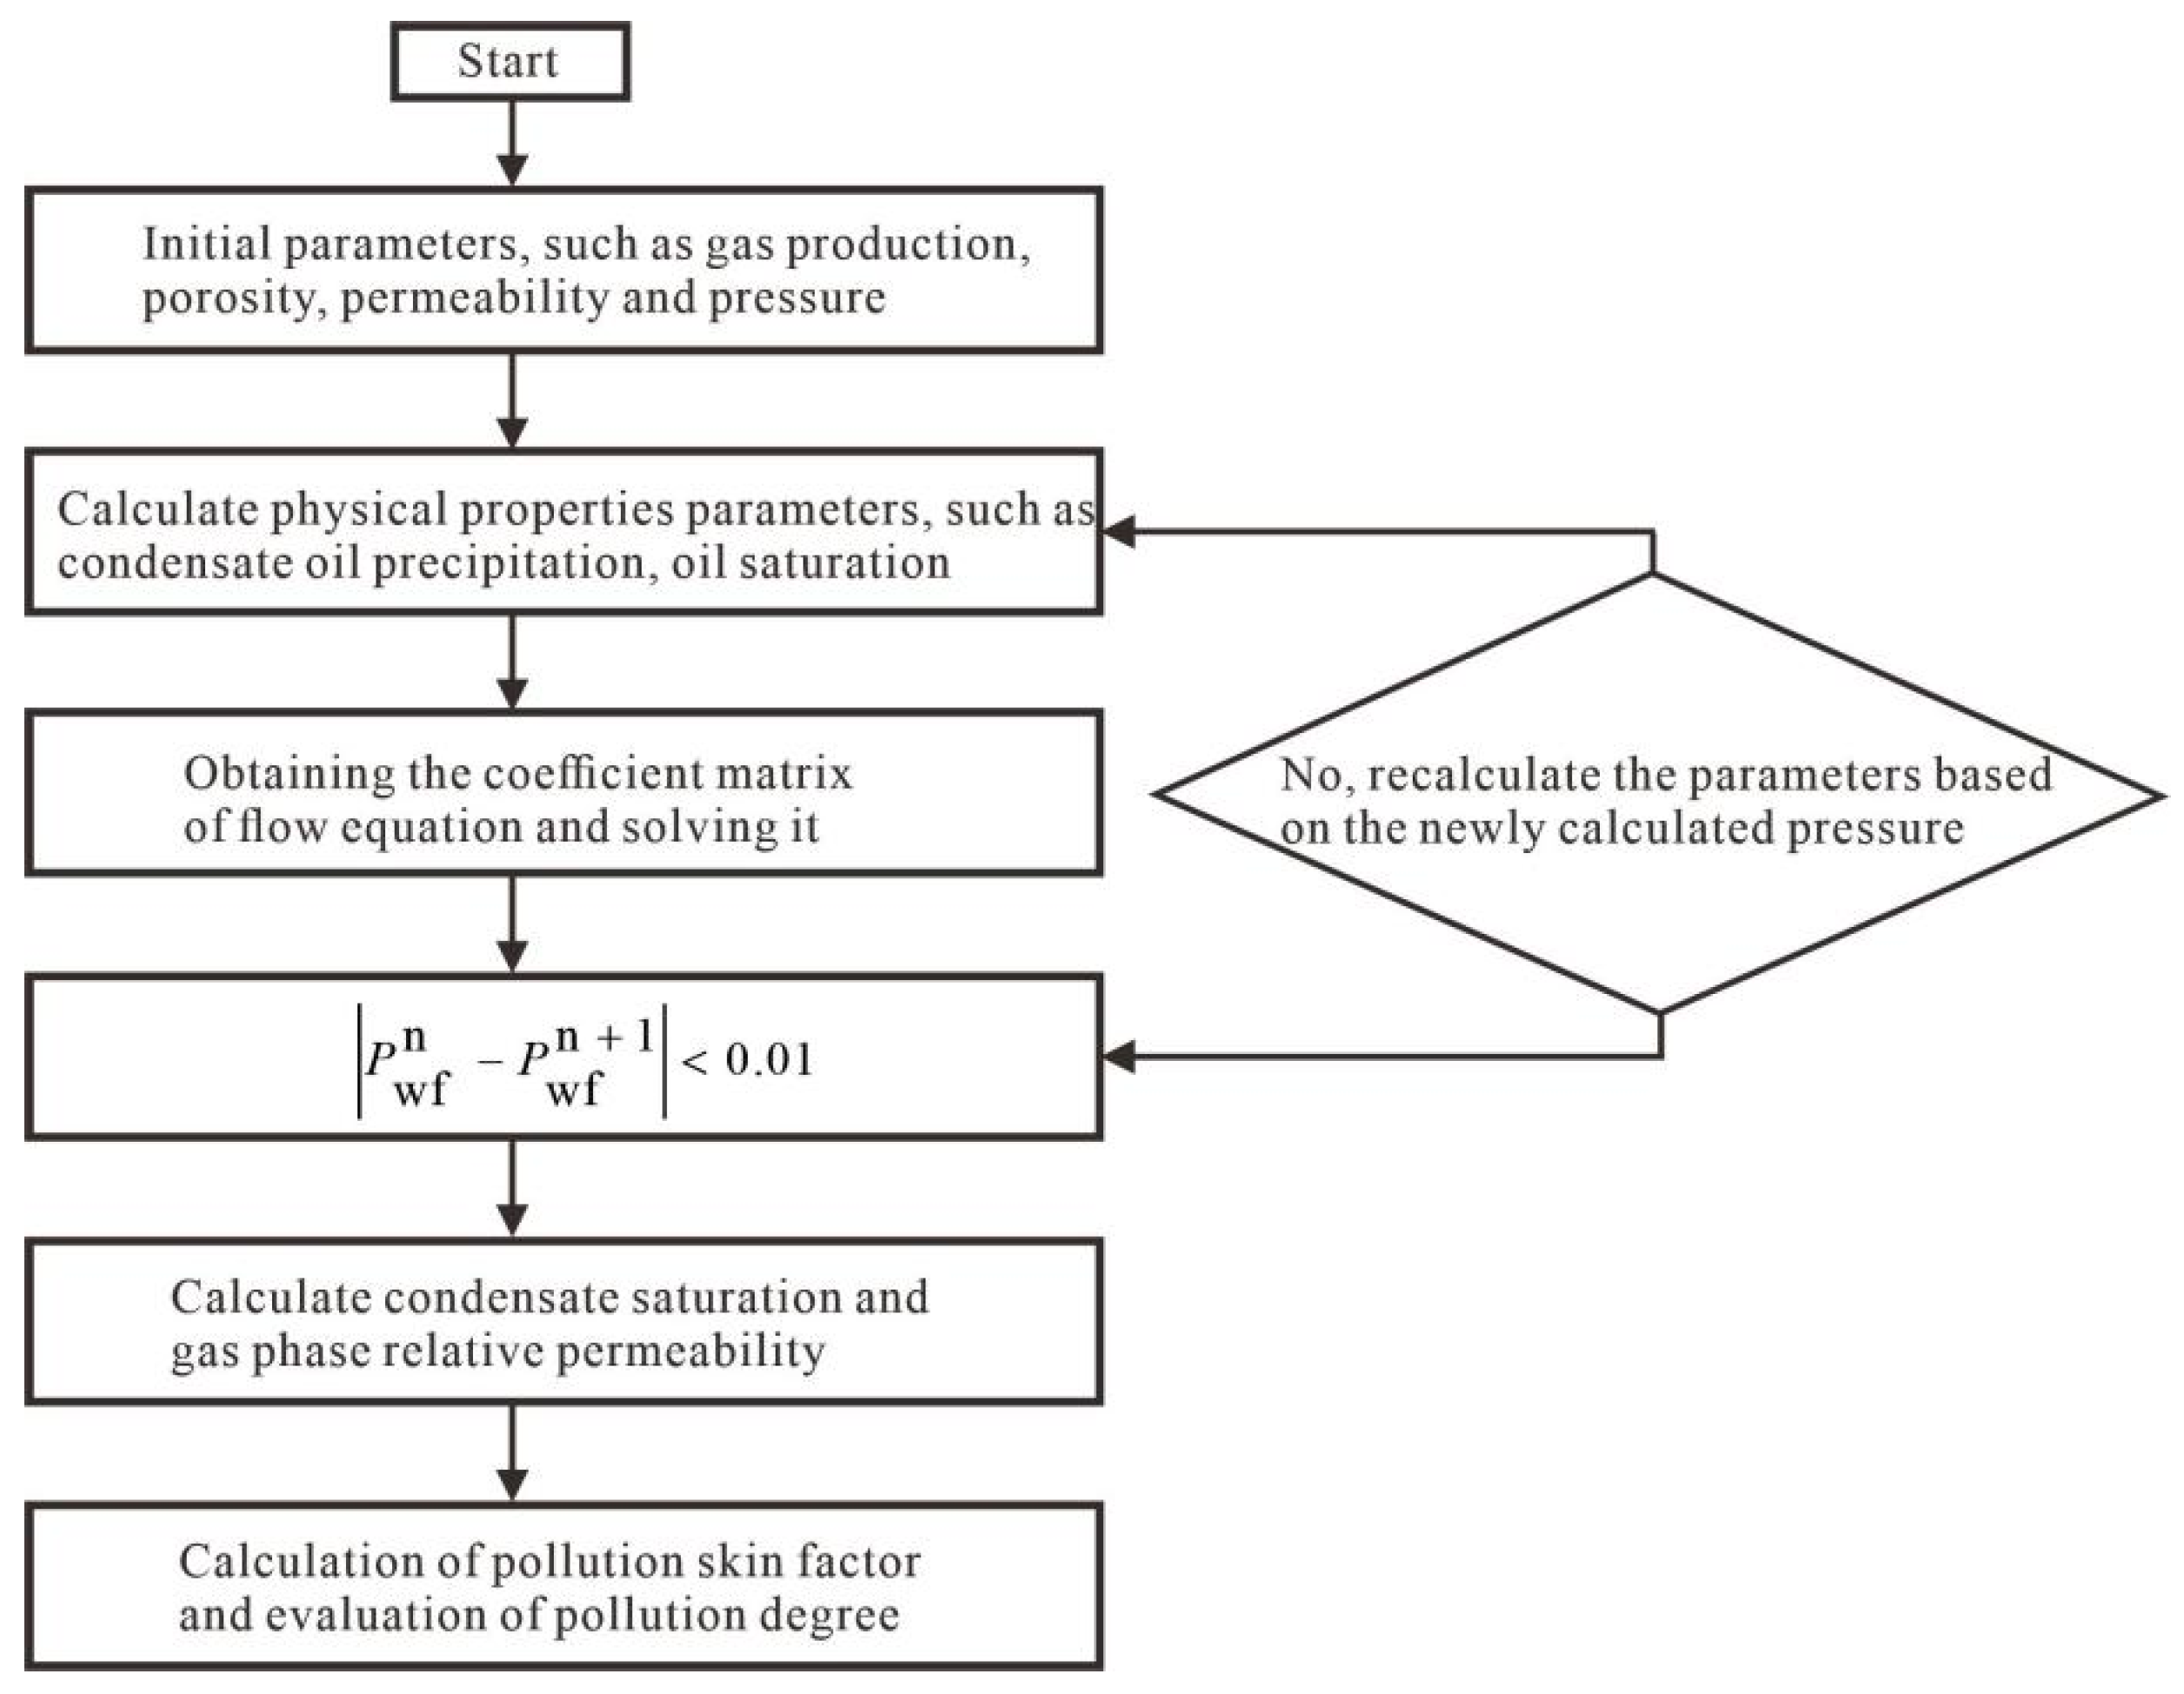
As the formation pressure in condensate gas reservoirs declines, the retrograde condensate phenomenon occurs around the wellbore [27,28], and the flow of fluid around the wellbore changes from a single-phase flow to a two-phase flow (Figure 2). Three flow zones slowly develop in formation, namely the single-phase zone, transition zone, and two-phase flow zone of the oil and gas [22]. As condensate oil precipitates in the transition zone and the two-phase flow zone, the gas flow channel becomes smaller, which results in a significant increase in the gas phase flow resistance and a decrease in production [29,30]. In order to evaluate the impact of condensate precipitation on well production, the condensate contamination skin coefficient is usually introduced to characterize the impact of retrograde condensate phenomenon on production capacity. In most studies where the skin factor is calculated, the contaminated area is represented as causing uniform damage, but this highly deviates from the reality. In this study, a model for calculating the retrograde contamination skin factor under real conditions is derived based on the distribution of condensate saturation calculated using a fluid flow model for condensate gas reservoirs.
Due to the fact that physical parameters such as viscosity and the volume coefficient of gases are functions of pressure, a pseudo-pressure function is introduced to simplify operations. Based on the flow characteristics during stable gas well production, the single well production equation can be expressed as follows:
Q g = 2 π K h Δ ψ ( p ) ln r e r w
where Qg is the gas well production, 104 m3/d; h is the formation thickness, m; ΔΨ(p) is the proposed pressure, MPa2/(mPa·s); and re is the outer boundary radius, m.
According to the principle of equivalent resistance, the flow resistance during gas reservoir production can be expressed as follows:
R 1 = 1 2 π K h ln r e r w
Because the bottom pressure is lower than the dew point pressure, condensate oil precipitates in the formation, resulting in the eventual formation of three flow zones. Due to variations in the gas saturation between different regions, there is a significant change in the relative permeability of the gas phase. When the bottomhole pressure is lower than the dew point pressure of reservoir, the impact of changes in the saturation field on gas well production should be considered. Based on the theory of seepage mechanics, the production equation can be expressed as follows:
Q g = 2 π K h Δ ψ ( p ) ln r e r 1 + r 2 r 1 1 K r g ( S g ) 1 r d r + r w r 2 1 K r g ( S g ) 1 r d r
According to the principle of equivalent resistance, the flow resistance of gas is the sum of the flow resistance in the three regions. After the occurrence of retrograde condensation in the formation, the flow resistance can be expressed as follows:
R 2 = 1 2 π k h ( ln r e r 1 + r 2 r 1 1 K r g ( S g ) 1 r d r + r w r 2 1 K r g ( S g ) 1 r d r )
In calculating well production, the increase in the flow resistance within the control area of the gas well can be seen as an additional resistance effect introduced near the wellbore. With the inclusion of the skin factor after geological contamination, the production equation for a steady flow can be expressed as follows:
Q g = 2 π k h Δ ψ ( p ) ln r e r w + S d
where Sd is the pollution skin factor.
In the comparison of flow resistance under multiphase and single-phase flow conditions, the skin factor generated after the precipitation of condensate oil can be expressed as follows:
S d = R 2 R 1 = ln r e r 1 + r 2 r 1 1 K r g ( S g ) 1 r d r + r w r 2 1 K r g ( S g ) 1 r d r ln r e r w
Based on the above models, after obtaining the distribution of the gas saturation field in the formation, which is combined with the gas phase relative permeability curve, the skin factor of gas well reverse condensation pollution can be obtained under non-uniform damage conditions.

2.4. Model Solution

To quantitatively evaluate the degree of damage caused by retrograde condensation pollution, the three above models must be coupled for a solution. For this, numerical calculation methods are required due to the strong nonlinearity of the multiphase flow model. Exponential grids are used to mesh the reservoir, and block-centered grids and implicit center difference schemes are used for differentiating the multiphase flow model. Through a combination with the boundary condition difference results, the solution coefficient matrix of the flow model is obtained as a large, sparse matrix that can be solved using the Gauss–Jordan method. Since the oil saturation, gas saturation, oil viscosity, gas viscosity, and other parameters in the coefficient matrix are functions of formation pressure, the above characteristic parameters are firstly obtained using the previous time step pressure value and then iteratively solved to obtain their accurate values. After obtaining the fluid saturation distribution by solving the multiphase flow model and combining it with the permeability curve and the retrograde pollution skin coefficient model, the damage process caused by the reverse condensation effect on the gas well in the condensate gas reservoir can be determined (Figure 3).

3. Results and Discussion

In the buried mountain reservoirs of the Bohai Sea region, the development of reservoirs is controlled by factors such as tectonic movement, weathering operations, and rock types, which result in significant differences in pore space as well as strong heterogeneity. In addition, due to the small difference between formation pressure and dew point pressure, the precipitation of condensate oil has a serious impact on gas production capacity, making it urgent to evaluate the impact of retrograde condensation on well production. Because the pore structure and flow capacity of reservoirs are different, their permeability and relative permeability curves also differ. Due to the particularity of condensate gas reservoirs, the difference between dew point pressure and formation pressure can cause the occurrence of retrograde condensation. In order to analyze the influence of formation parameters on condensate precipitation and gas flow capacity during the process of gas well production, the influence of the relative permeability curve, reservoir permeability, differences between dew point pressure and formation pressure, and well production are discussed. The physical parameters of gas components and of formation are shown in Table 1 and Table 2, respectively.

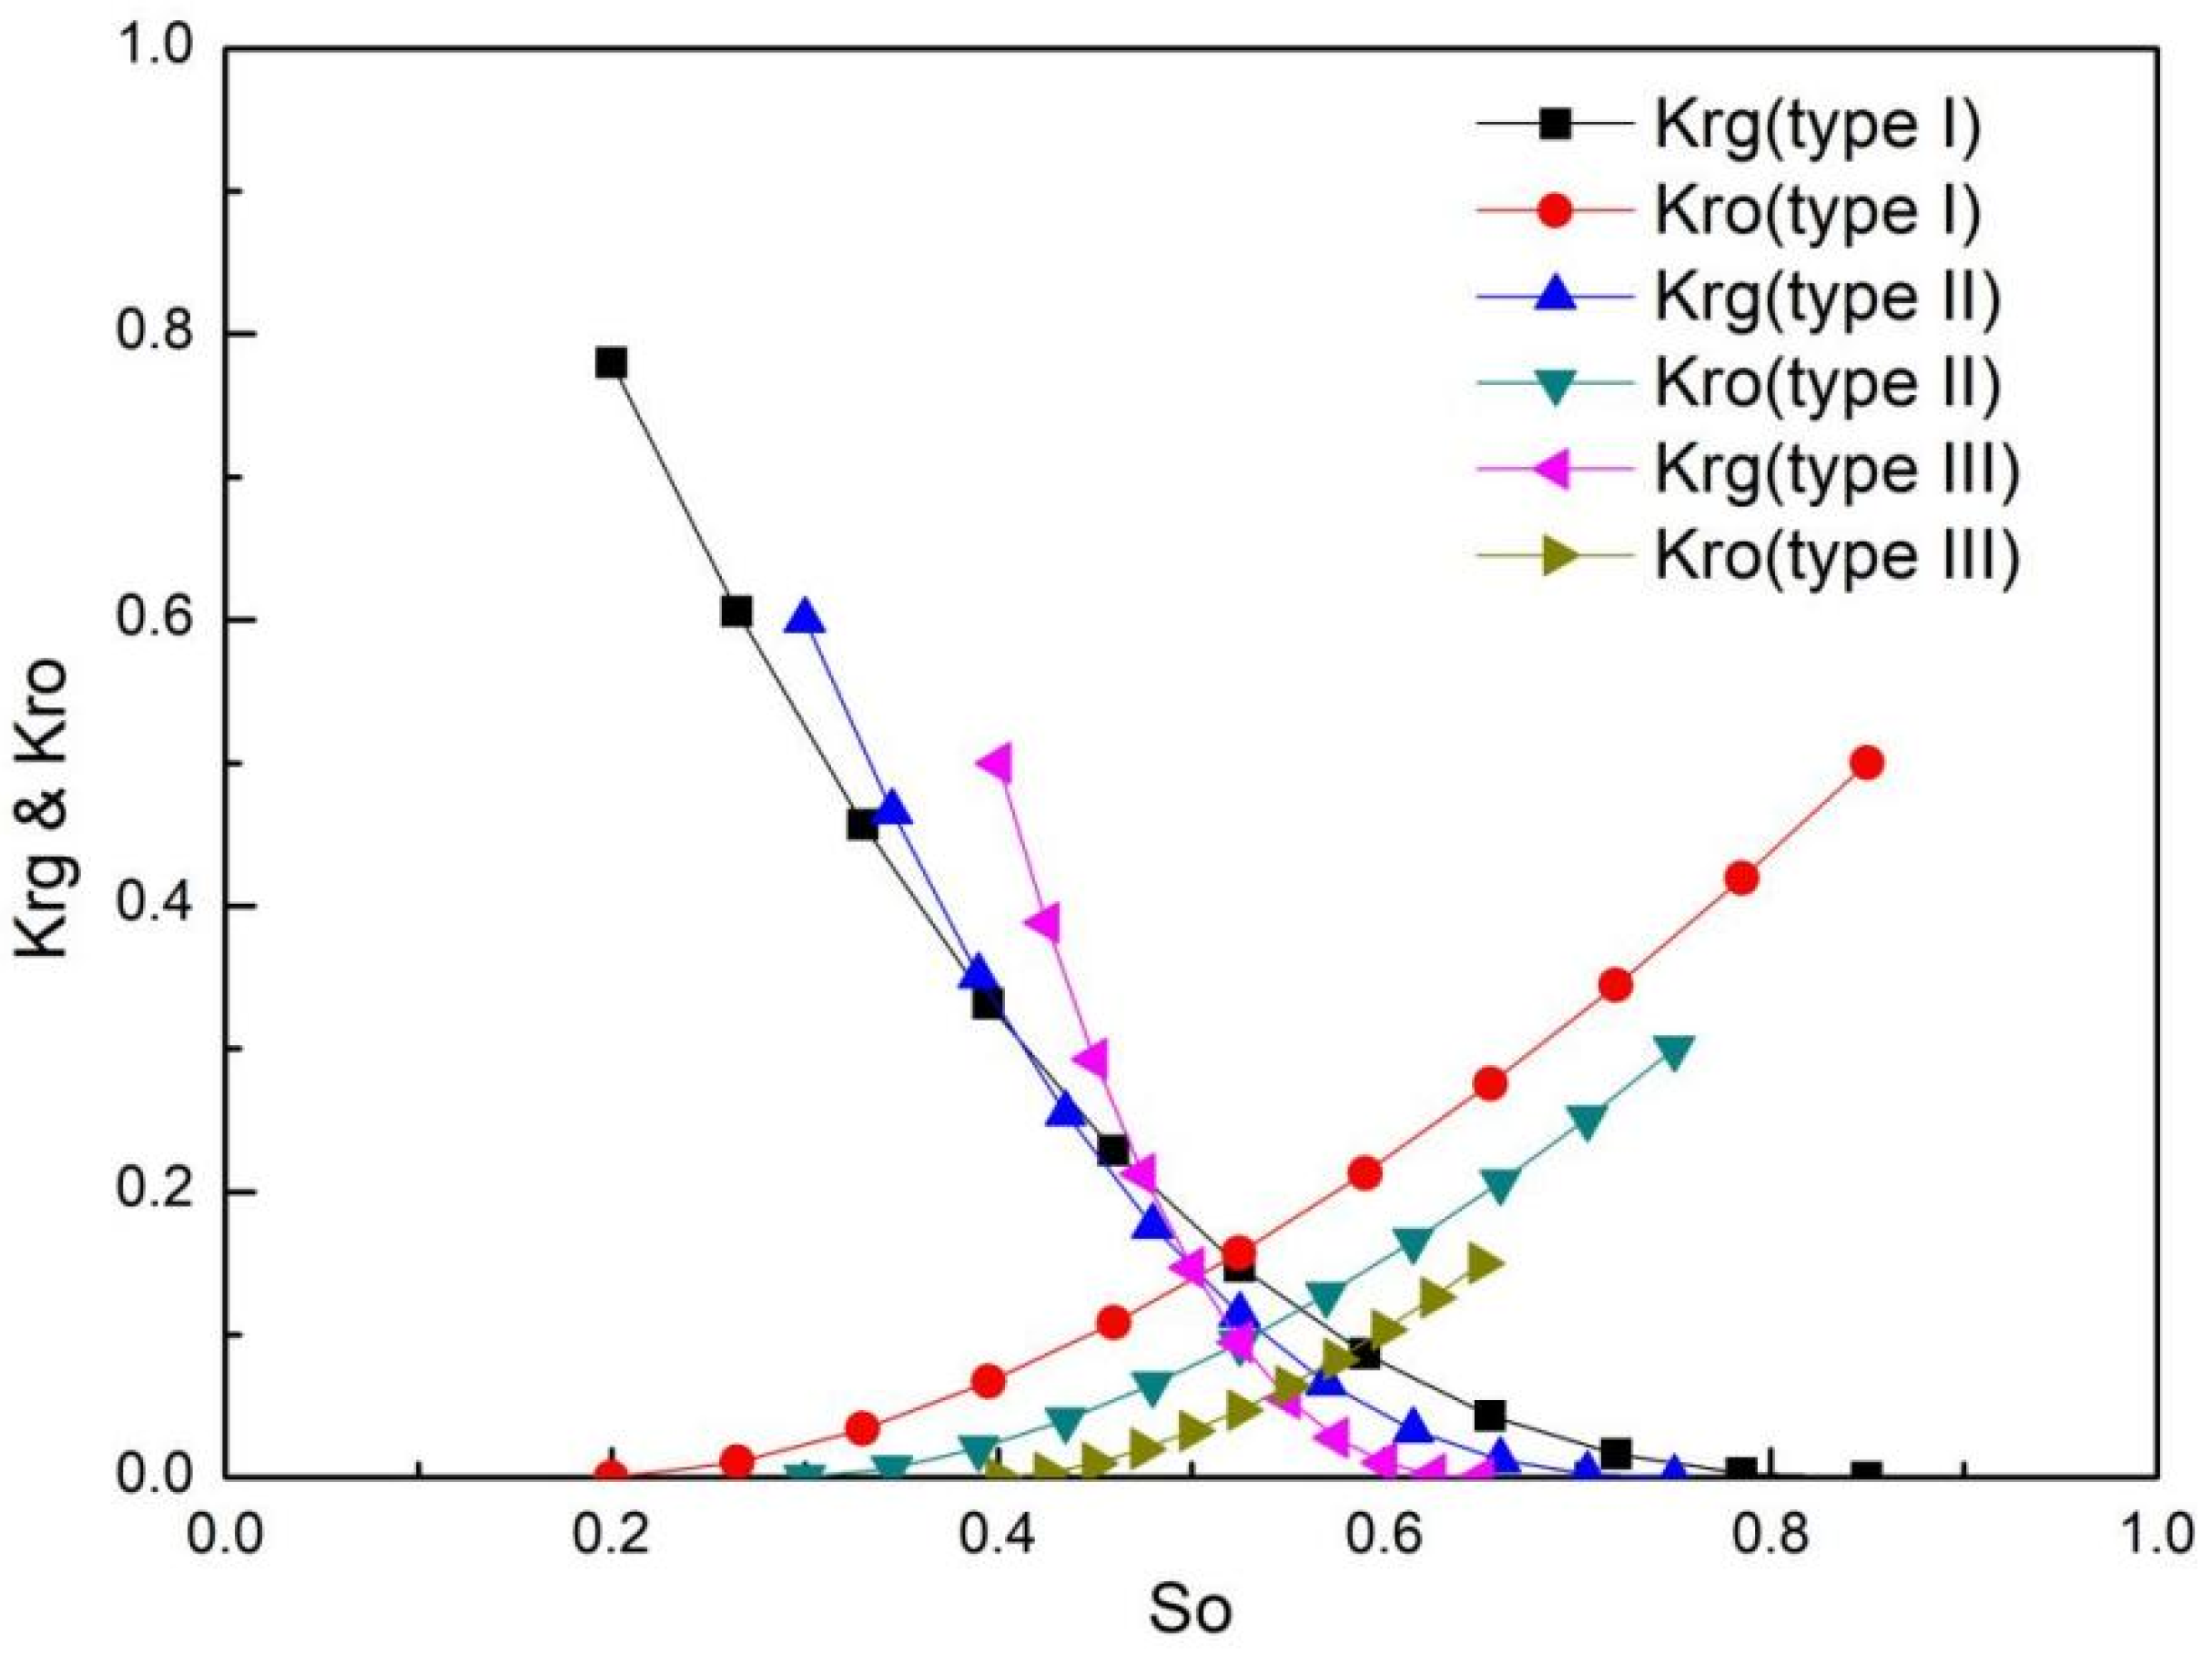
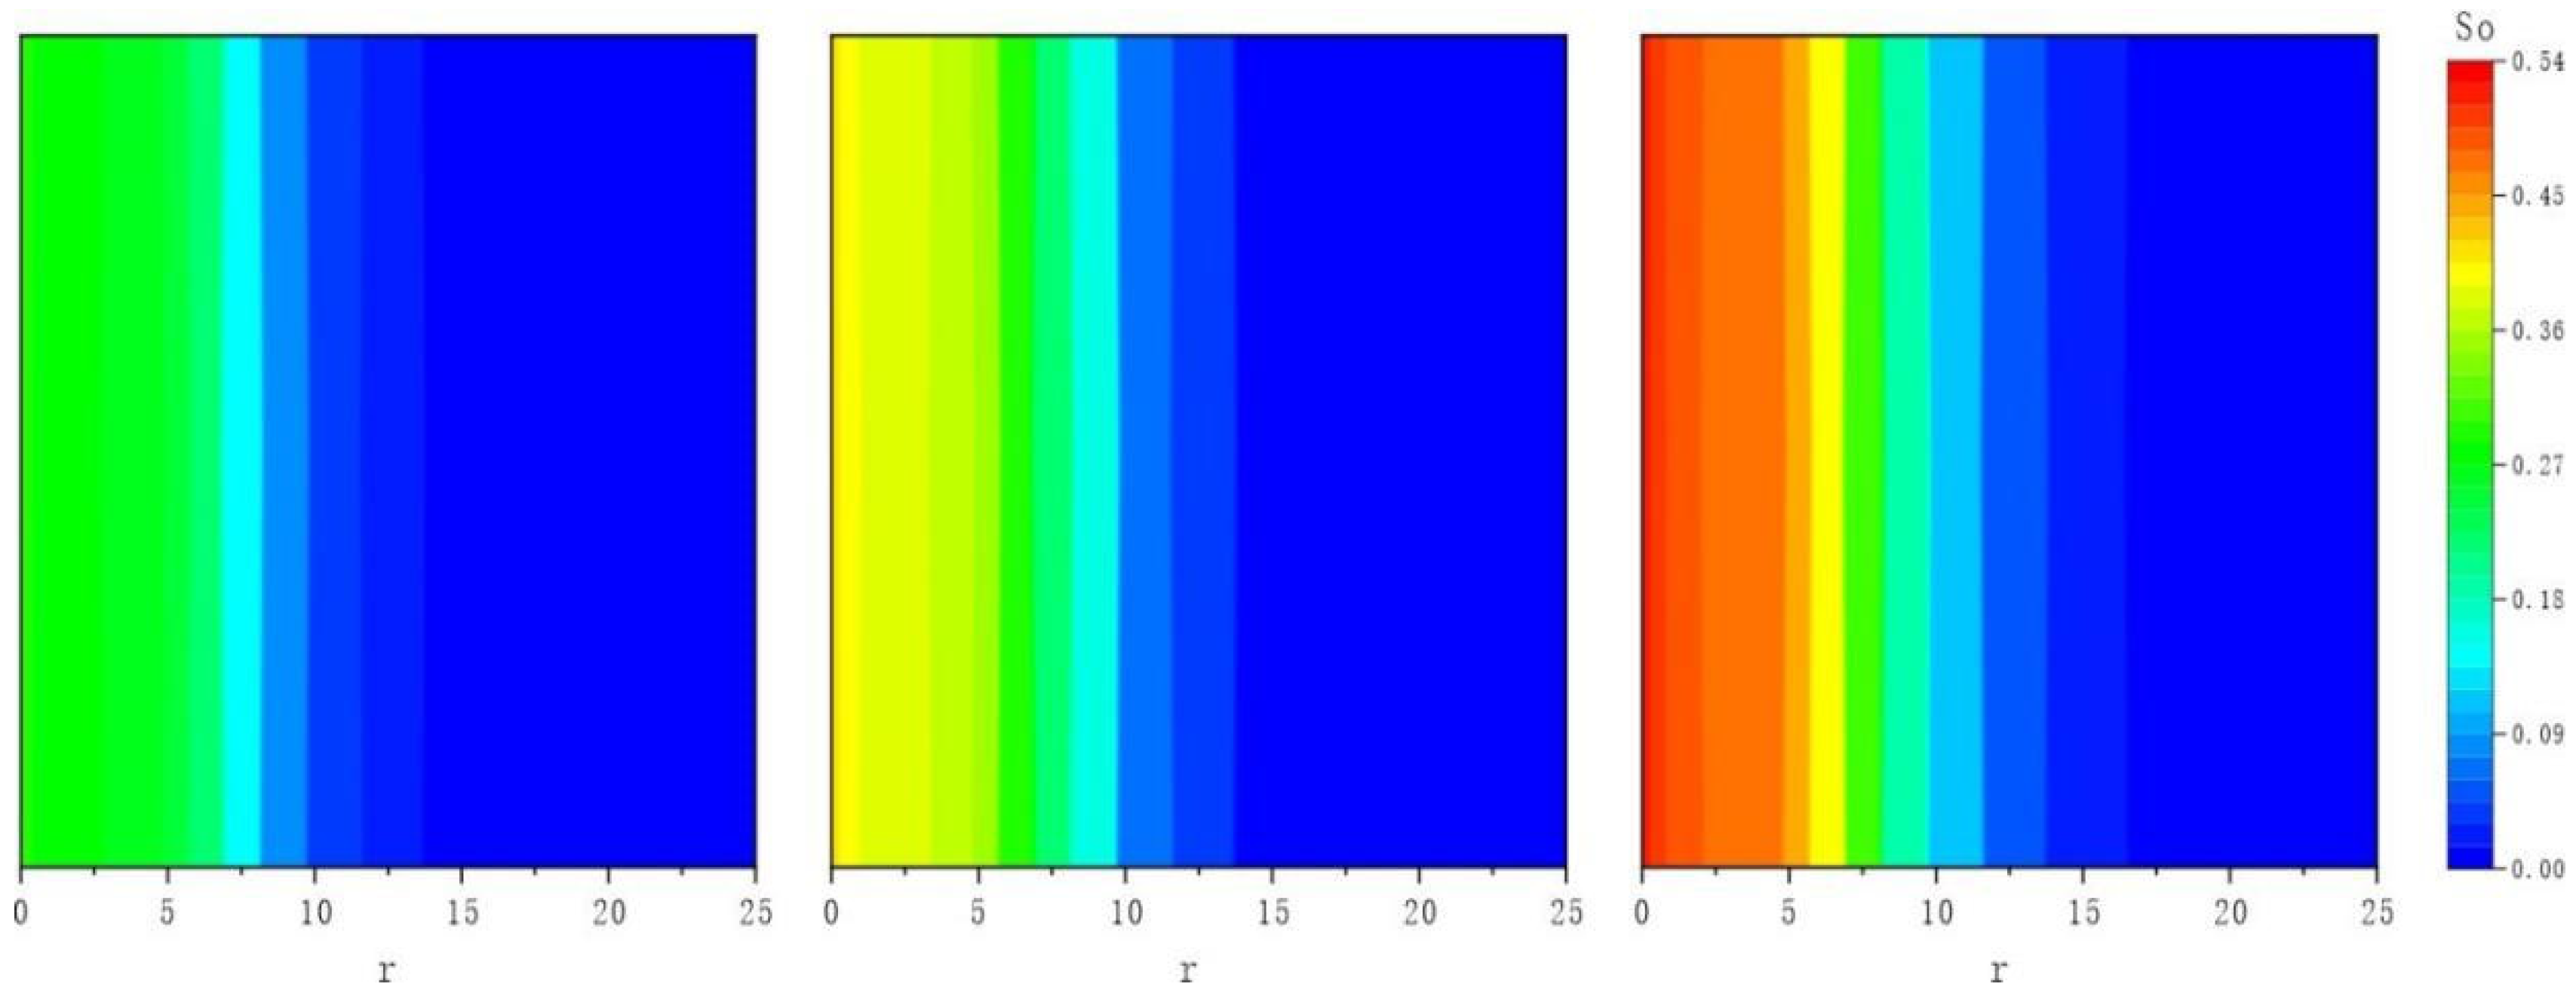
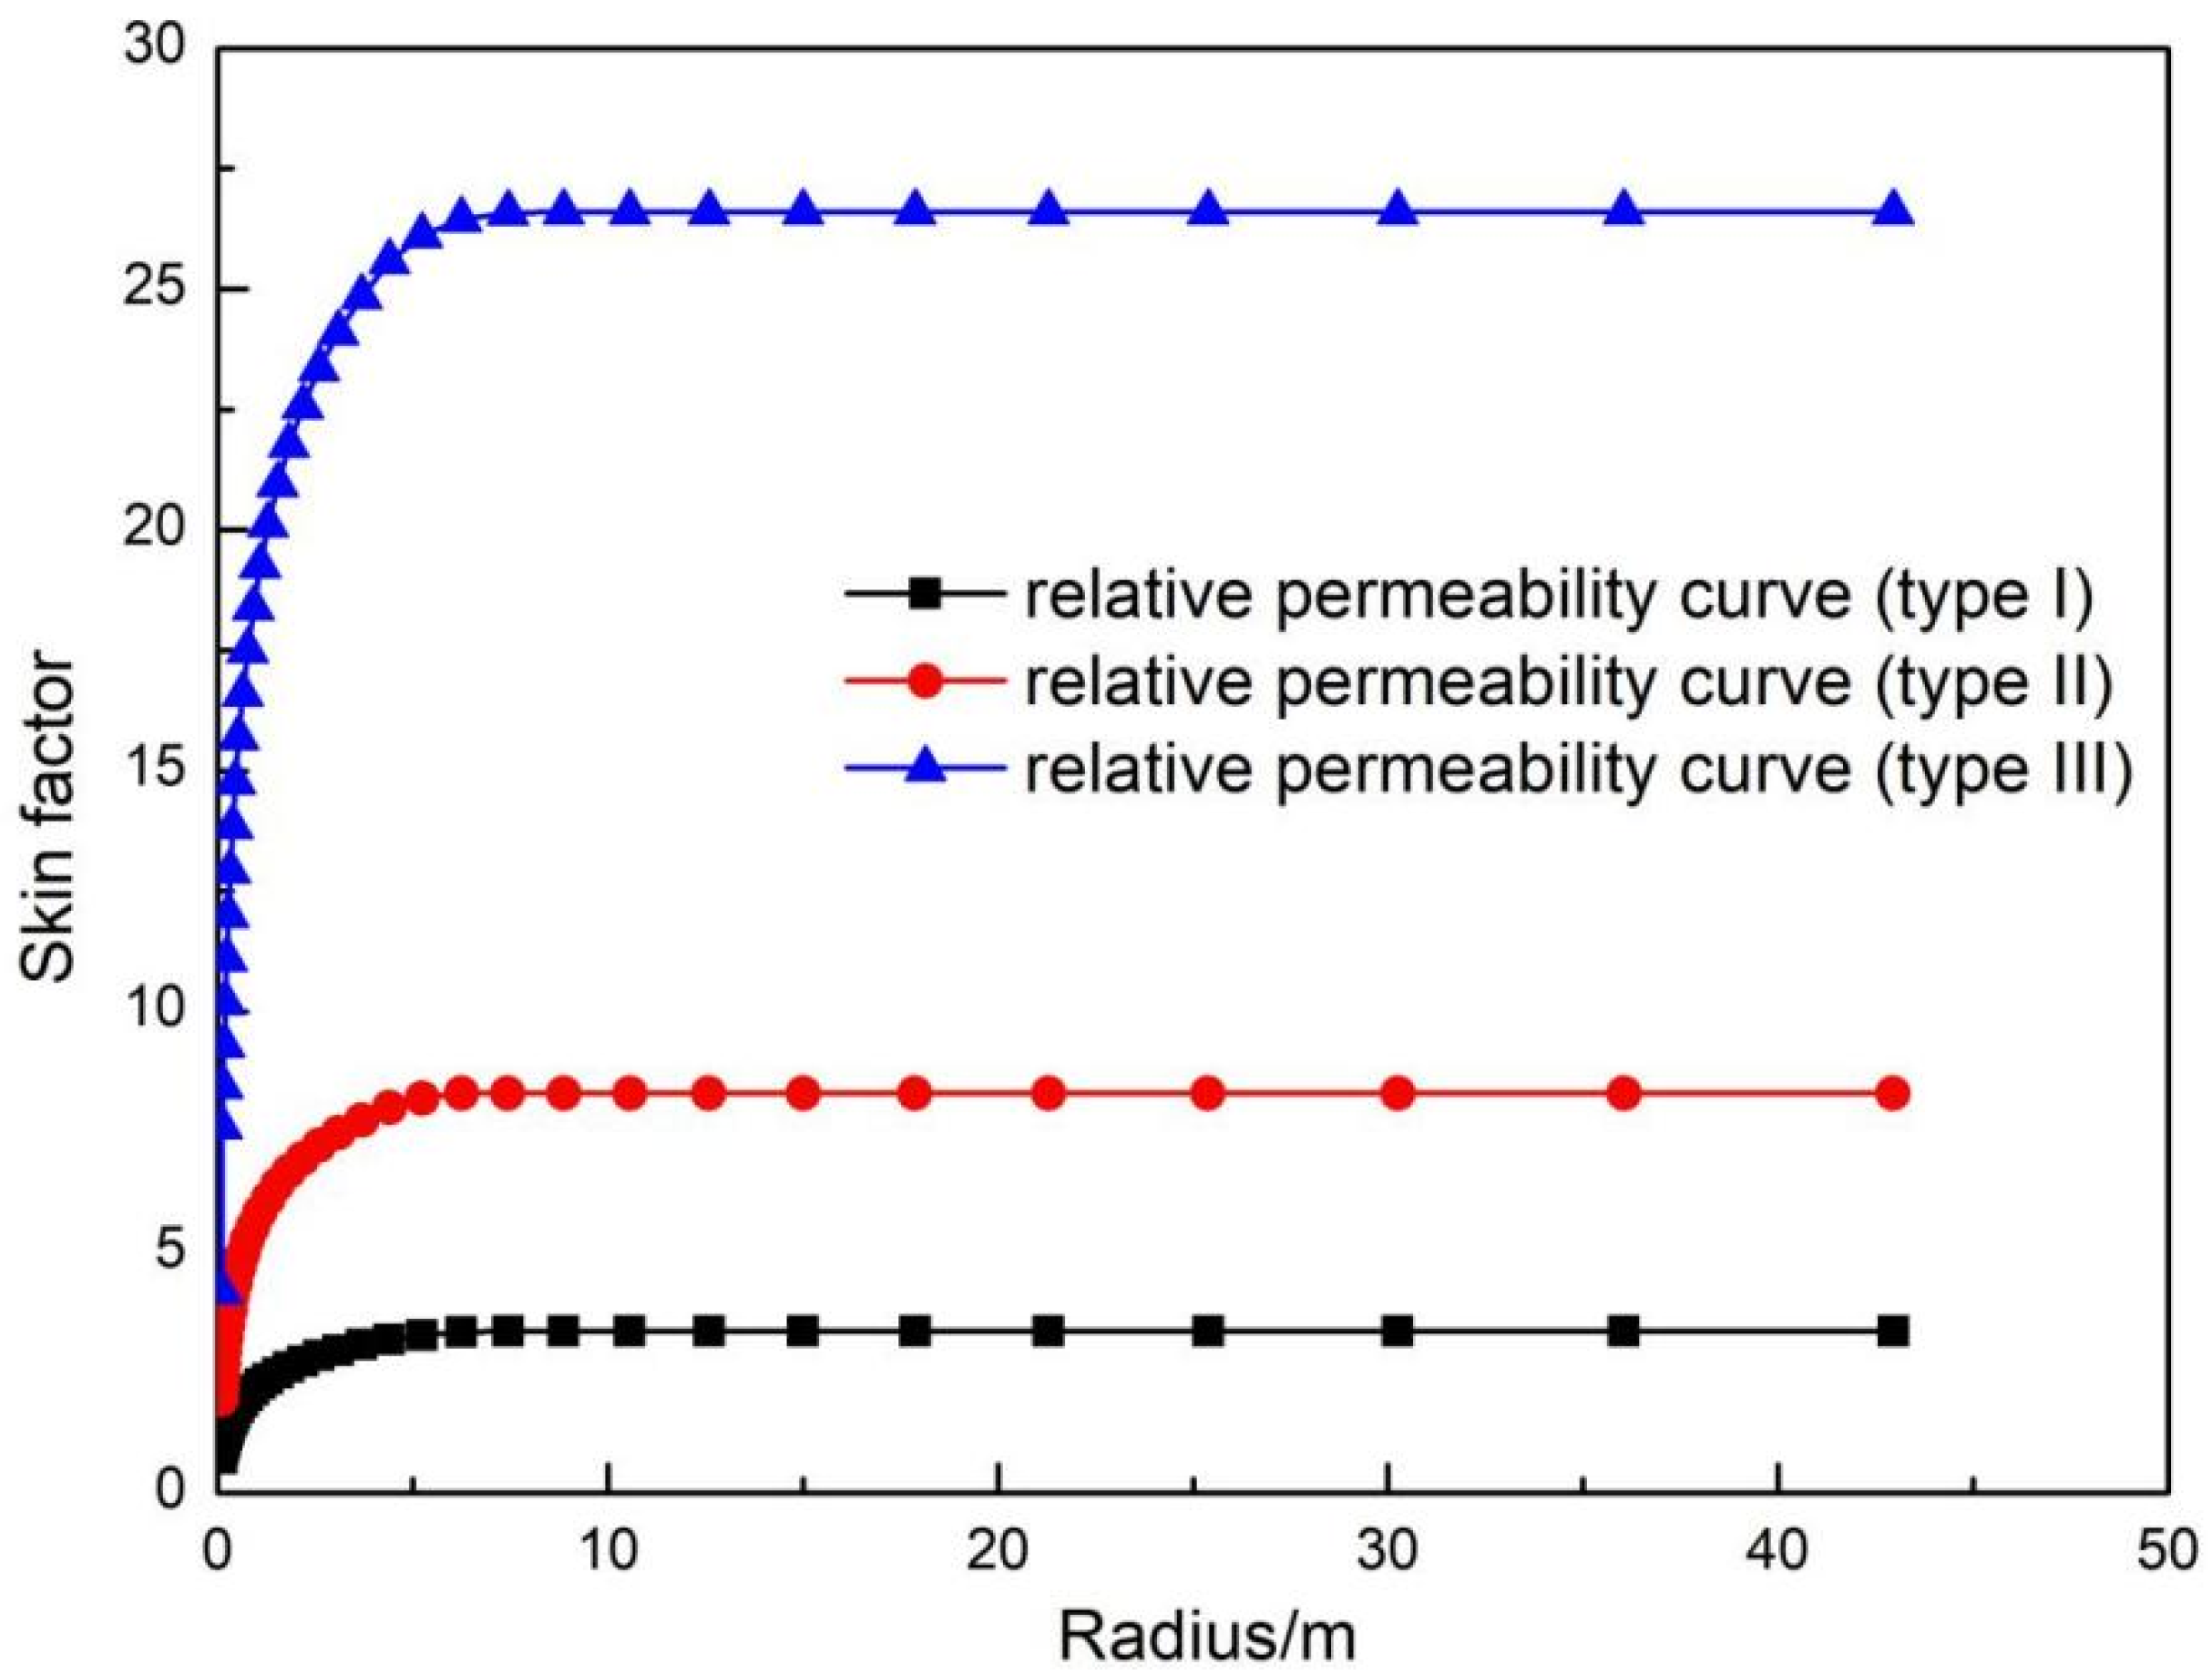
3.1. Influence of the Relative Permeability Curve

In the process of oil and gas reservoir development, the relative permeability curve is affected not only by the reservoir and fluid physical properties but also by factors such as temperature and mineralization. The study area is characterized by complex lithology and strong heterogeneity resulting in multiple characteristic phase permeability curves during the oil and gas two-phase flow. Three representative phase permeability curves in the reservoir are selected to analyze the impact of the relative permeability curves on the phenomenon of retrograde condensation (Figure 4). The radius of condensate precipitation in the formation is basically the same after 10 h hours of fixed production under the three different types of relative permeability curves, but there are some differences in the distribution of saturation. In the first type of permeability curve, the condensate oil has the lowest saturation in the formation, while the condensate oil has the highest saturation in the third type of relative permeability curve (Figure 5). The first type of relative permeability curve reflects that the pores in the formation are well connected, with favorable physical properties and low critical saturation of the condensate oil flow. Condensate oil is easily produced in the formation and can flow to the wellbore with a small pressure difference. Relatively little condensate oil precipitates in the formation, and the saturation near the wellbore is relatively low. For the third type of relative permeability curve, however, the pore throat of the formation is fine, the physical properties are poor, there is high critical saturation of the condensate flow, and it is difficult for condensate oil to flow after precipitation. The flow pressure difference is relatively high, relatively more condensate oil is precipitated in the formation, and the saturation in the near-well zone is relatively high. The increase in condensate saturation leads to decreased gas saturation in the pore space and a decrease in the gas flow ability, which can be characterized using the skin coefficient. The skin coefficient generated is 3.36 for the first type of permeability curve, 8.3 for the second type of permeability curve, and 26.6 for the third type of permeability curve (Table 3 and Figure 6). This indicates that the contamination of the near-well zone increases significantly with the deterioration in the pore structure and the increase in condensate oil saturation.

3.2. Influence of the Difference between Formation Pressure and Dew Point Pressure

The distribution of condensate oil saturation in the formation under various differences between the formation pressure and dew point pressure is shown in Figure 7. The higher the pressure difference, the smaller the range of condensate precipitation under the same production conditions. When there is no condensate precipitation in the formation, the pressure difference produced by the gas flow is equal. Condensate oil can only be precipitated when the pressure difference between the formation pressure and dew point pressure increases from 1.32 MPa to 5.28 MPa. As the pressure difference increases, the radius of condensate oil precipitation in all formations correspondingly shrinks from 15 m to 0.15 m (Figure 8). As the range of condensate oil precipitation decreases, the flow resistance of gas also decreases dramatically, and the skin factor decreases from 8.3 to 0.69 (Table 3). Thus, to maintain a higher gas recovery rate, it is beneficial to appropriately maintain the formation pressure during the development of condensate gas reservoirs.

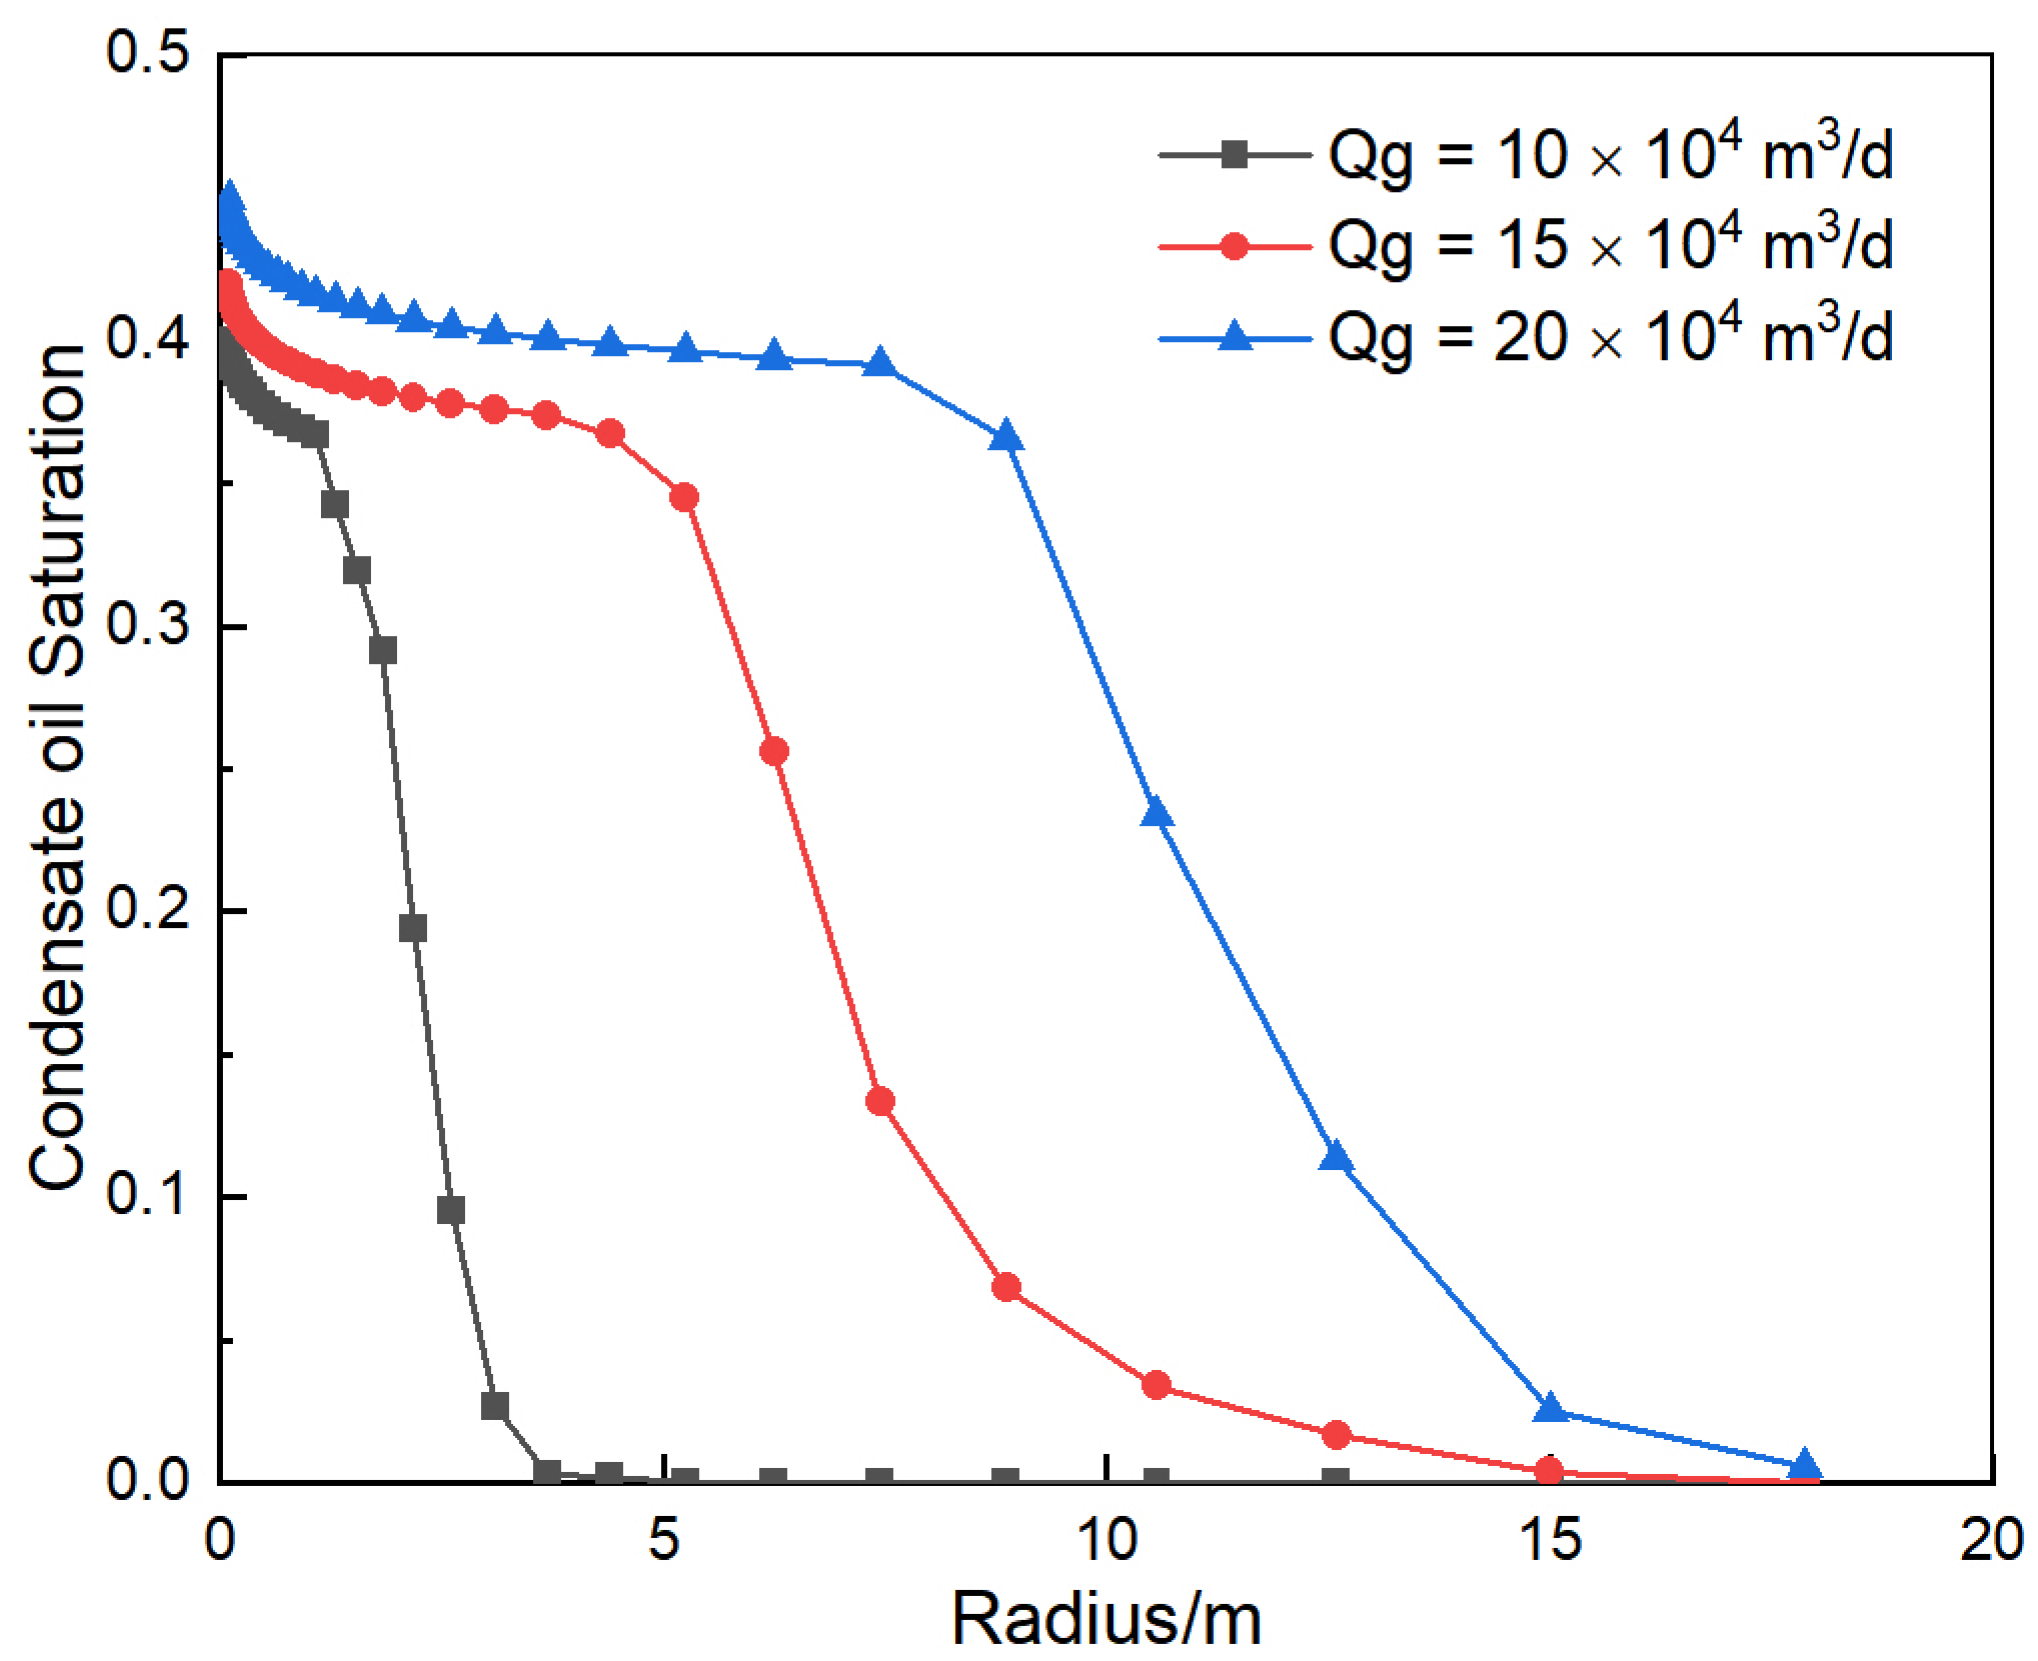
3.3. Influence of Well Production

The distribution of condensate oil saturation under varying production is shown in Figure 9. As both the production of gas wells and the production pressure difference increase, the range of condensate oil precipitation in the formation gradually increases and the oil saturation near the wellbore also increases. Due to the increase in condensate oil saturation, the gas phase flow capacity decreases significantly, and the gas phase flow resistance increases significantly. When the production of gas wells increases from 10 × 104 m3/d to 20 × 104 m3/d, the skin factor generated by condensate precipitation increases from 5.15 to 12.09 (Table 3). In the actual production process of gas reservoirs, the turbulence effect around the wellbore increases and the skin factor further increases.

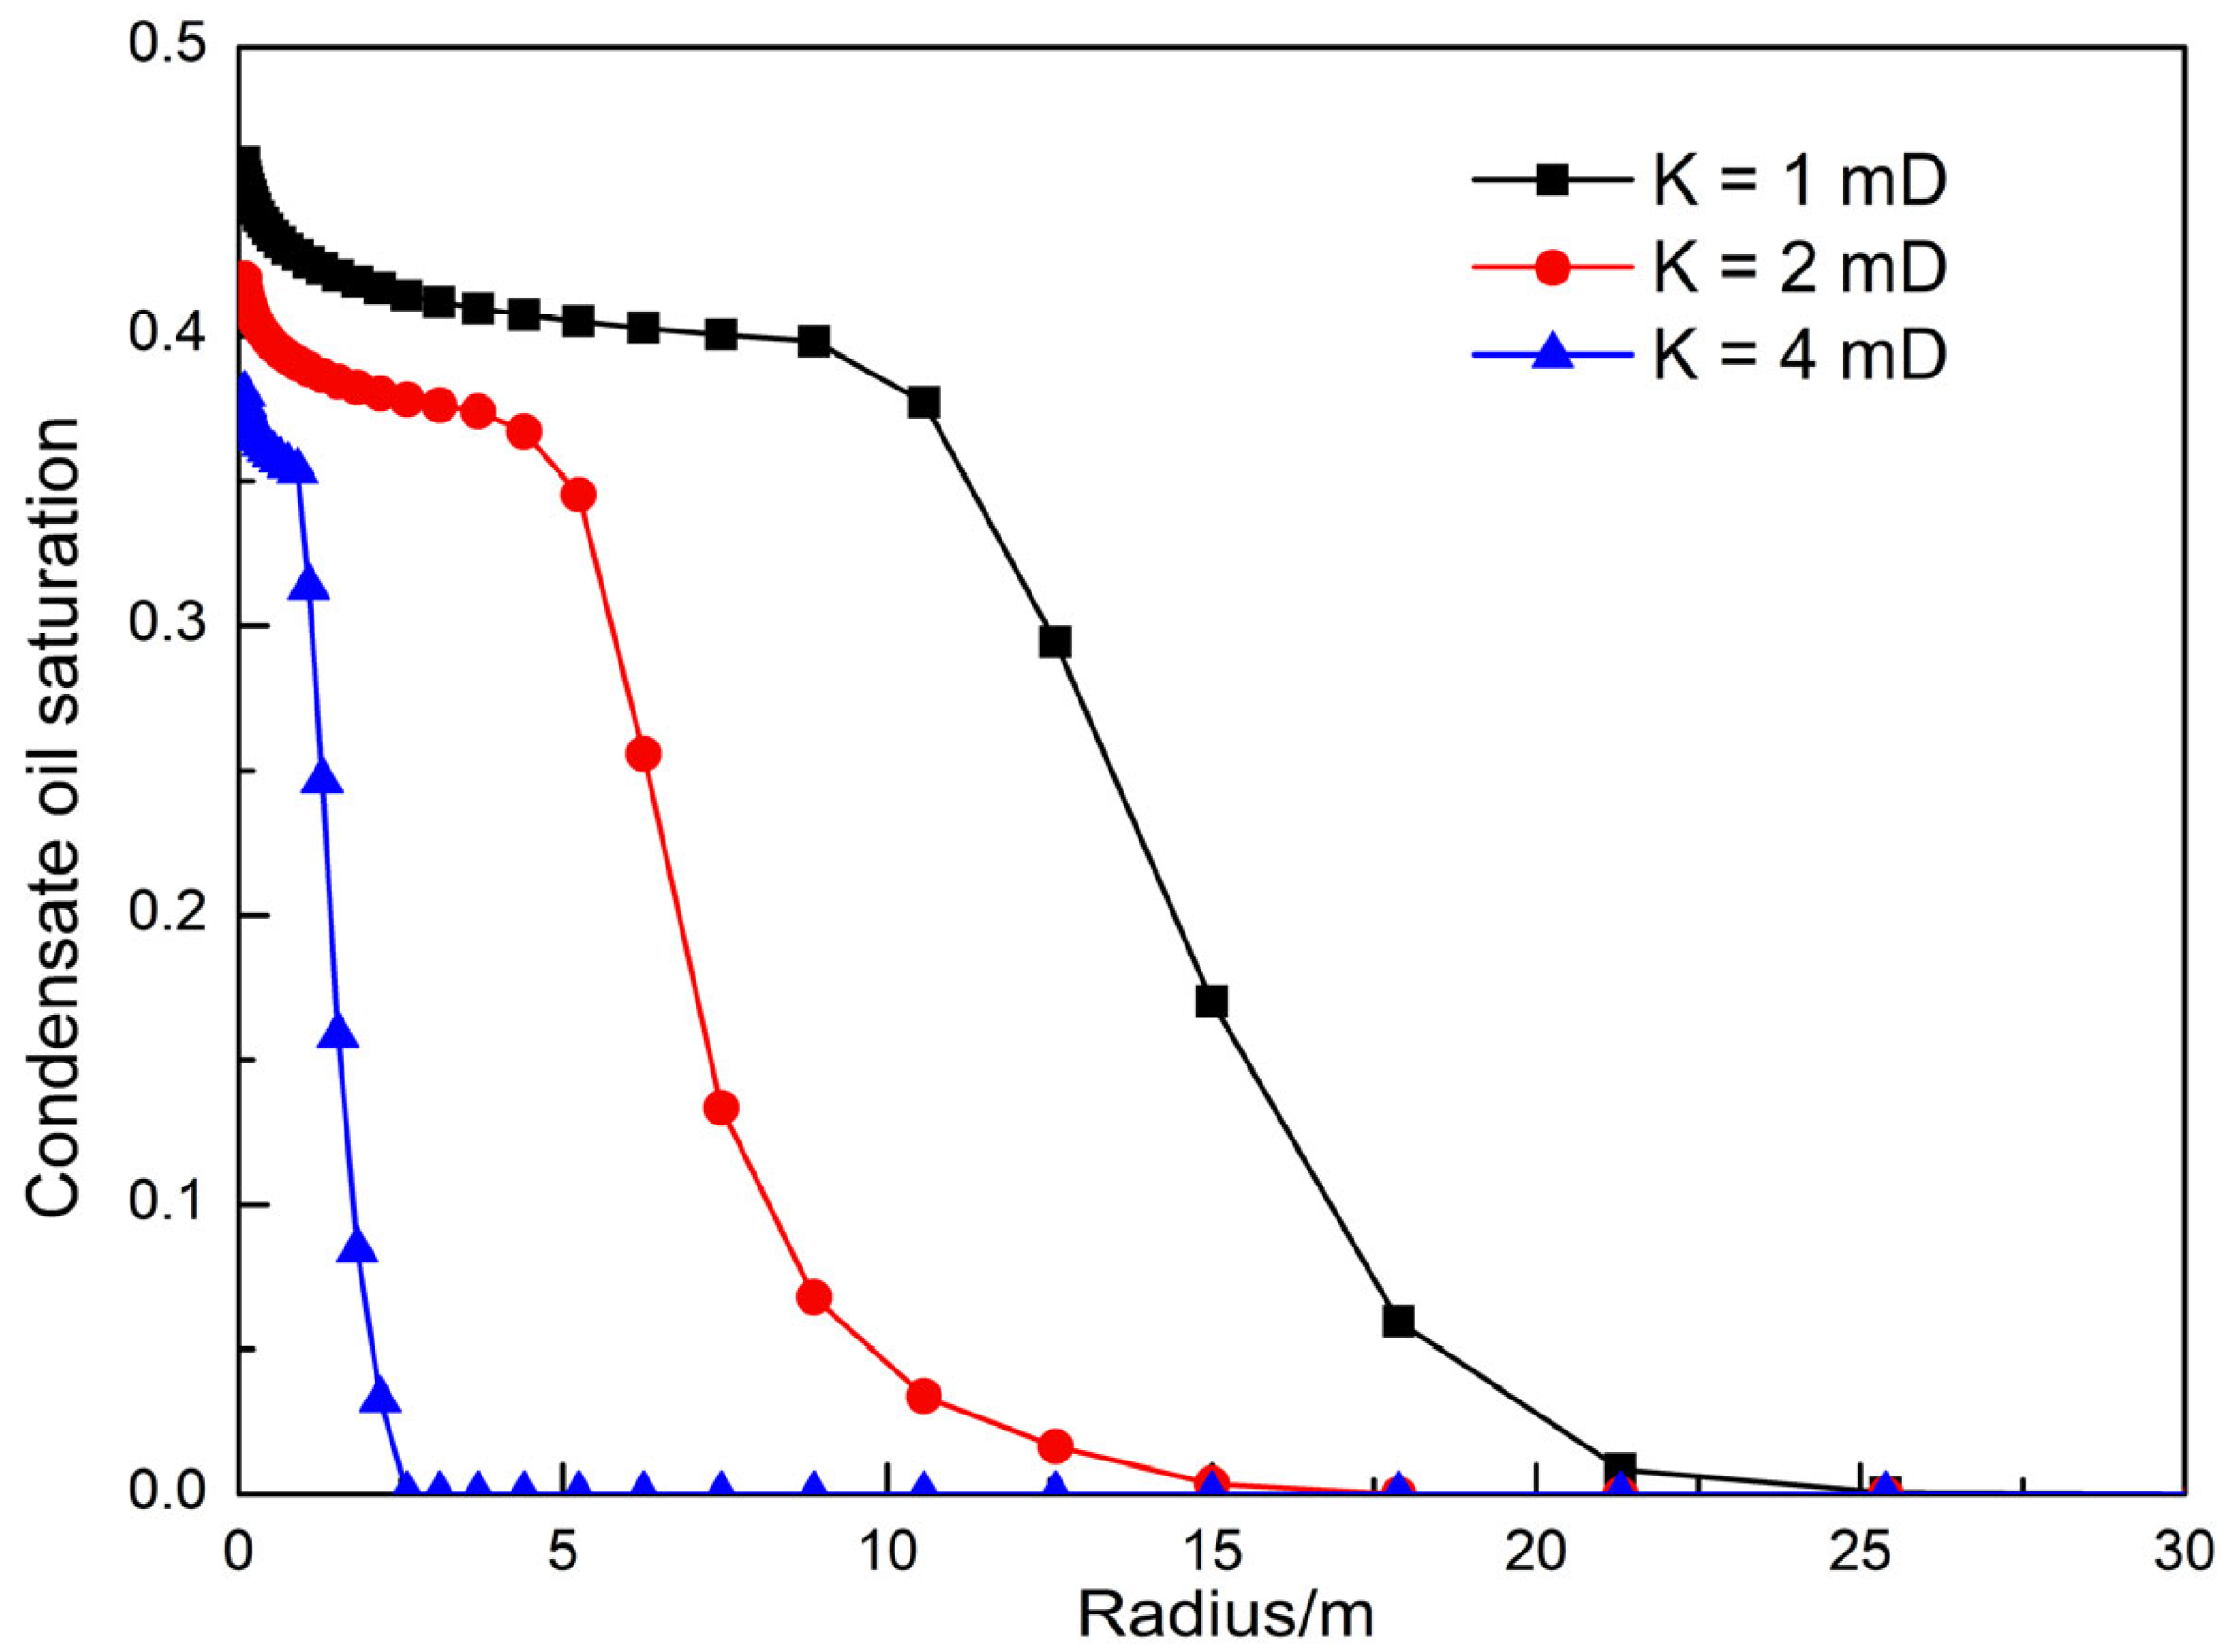
3.4. Influence of Formation Permeability

The distribution of condensate oil saturation under different formation permeability conditions is shown in Figure 10. With increasing formation permeability, the production pressure difference gradually decreases under the same production rate, the range of condensate precipitation gradually decreases, and the saturation near the well also decreases. Due to the decrease in condensate oil saturation, the gas phase flow capacity increases significantly. When the formation permeability is increased from 1 mD to 4 mD, the skin factor decreases from 13.79 to 3.88 (Table 3). The retrograde condensation pollution mainly occurs in the near-wellbore zone. In low-permeability reservoirs, fracturing and other methods can increase the flow capacity of the near-wellbore zone to reduce the skin factor of retrograde condensation pollution.

4. Practical Applications

Well A is located in the southwestern part of the BZ depression, which is seated in the Bohai Sea. The test interval is 3879.00–3998.66 m, and it is a buried mountain reservoir in the Archean period. The pressure of the formation is 46.93 MPa, the temperature is 152.0 °C, and the production gas–oil ratio is 1095 m3/m3. The composition of the well bottom fluid as determined from sampling is 61.19% C1 + N2, 30.84% C2~C6 + CO2, and 7.97% C7+, corresponding to the range for the condensate gas reservoirs. During the production capacity testing, 6.35 mm, 7.94 mm, and 9.53 mm nozzles are used for production; gas production is 10.73 × 10⁴ m3/d, 14.11 × 10⁴ m3/d, and 18.41 × 10⁴ m3/d; and oil production is 100.48 m3/d, 136.72 m3/d, and 168.08 m3/d under different working systems. Due to the relatively small production of gas wells, the skin factor caused by the non-Darcy flow can be ignored. The tested skin factor can be regarded as the pollution skin factor caused by condensate oil precipitation. After calculation, the skin factors for the three systems are 10.4, 14.3, and 18.8. The skin coefficient model can be used to calculate values of 9.76, 14.05, and 19.5 by fitting the relative permeability curve, with a maximum error of 6.15% and an average error of 3.87% (Table 4). The accuracy of this model is verified by comparing the results with those of the production capacity testing.
Well B is seated in the South China Sea. The test interval is 2566.1–2644.3 m, and it is a sandstone reservoir located in the Sanya Formation. The pressure of the formation is 23.2 MPa, the temperature is 105.3 °C, and the production gas–oil ratio is 2860 m3/m3. The composition of the well bottom fluid sampling is as follows: 80.25% of C1 + N2, 14.63% of C2~C6 + CO2, and 5.12% of C7+, which belongs to the range of the condensate gas reservoir. During the production capacity testing, 9.53 mm, 12.7 mm, and 15.88 mm nozzles are used for production; gas production is 22.76 × 10⁴ m3/d, 31.53 × 10⁴ m3/d, and 37.85 × 10⁴ m3/d; and oil production is 78.35 m3/d, 112.34 m3/d, and 135.18 m3/d under different working systems. Due to the good physical properties of the formation, the non-Darcy flow skin factor can be ignored. The tested skin factor can be regarded as the pollution skin factor caused by condensate oil precipitation. After calculation, the skin factors for the three systems are 6.7, 9.8, and 13.2, respectively. The skin coefficient model can be calculated to be 6.38, 9.24, and 13.85 by fitting the relative permeability curve (Table 5). The comparison of the two results can demonstrate the accuracy of this model.

5. Conclusions

Based on the dynamic simulation of the condensate gas phase characteristics and the flow simulation of the condensate reservoirs, the magnitude of the skin factor generated by retrograde condensation during the development of condensate gas reservoirs was investigated. Through the above research, the following conclusions are obtained:
(1)
The gas phase simulation model, the multiphase flow model, and the skin coefficient pollution model were constructed to simulate the impact of retrograde condensation on gas flow in allowing the quantitative characterization of retrograde condensation pollution.
(2)
In the development of condensate gas reservoirs, the difference between the formation pressure and dew point pressure in addition to gas well production and formation permeability all have a significant impact on retrograde condensation pollution. In the development of gas reservoirs, production systems should be rationally set up according to the characteristics of the gas reservoir.
(3)
The model was used to calculate the pollution skin factor of two actual test wells under three different testing systems. The values for the maximum error between the calculated skin factor and the actual test skin factor of these wells are 6.15% and 6.06%, and the average errors are 3.87% and 5.26%, which meet the requirements for engineering calculations.

Author Contributions

Investigation, conceptualization, and writing—original draft, H.Z.; supervision and review, X.Z.; analysis and validation, X.G.; data processing and writing—original draft, P.C.; graphical processing, K.G. All authors have read and agreed to the published version of the manuscript.

Funding

This research received no external funding.

Data Availability Statement

All data and materials are available upon request from the corresponding author. The data are not publicly available due to ongoing research using a part of the data.

Conflicts of Interest

Hongxu Zhao and Xinghua Zhang was employed by China-France Bohai Geoservices Co., Ltd. and Tianjin Branch of CNOOC (China) Co. Limited. The remaining authors declare that the research was conducted in the absence of any commercial or financial relationships that could be construed as a potential conflict of interest.

References

  1. Wang, Z.M.; Wen, Z.X.; He, Z.J.; Song, C.; Liu, X.; Chen, R.; Liu, Z.; Bian, H.; Shi, H. Global condensate oil resource potential and exploration fields. Acta Pet. Sin. 2021, 42, 1556–1565. [Google Scholar]
  2. Alafnan, S.; Aljawad, M.; Alismail, F.; Almajed, A. Enhanced recovery from gas condensate reservoirs through renewable energy sources. Energy Fuels 2019, 33, 10115–10122. [Google Scholar] [CrossRef]
  3. Hosseinzadegan, A.; Raoof, A.; Mahdiyar, H.; Nikooee, E.; Ghaedi, M.; Qajar, J. Review on pore-network modeling studies of gas-condensate flow: Pore structure, mechanisms, and implementations. Geoenergy Sci. Eng. 2023, 226, 211693. [Google Scholar] [CrossRef]
  4. Maleki, M.R.; Rashidi, F.; Mahani, H.; Khamehchi, E. A simulation study of the enhancement of condensate recovery from one of the Iranian naturally fractured condensate reservoirs. J. Pet. Sci. Eng. 2012, 92–93, 158–166. [Google Scholar] [CrossRef]
  5. Ghorbani, H.; Moghadasi, J.; Wood, D.A. Prediction of gas flow rates from gas condensate reservoirs through wellhead chokes using a firefly optimization algorithm. J. Nat. Gas Sci. Eng. 2017, 45, 256–271. [Google Scholar] [CrossRef]
  6. Igwe, U.; Khishvand, M.; Piri, M. Retrograde condensation in natural porous media: An in situ experimental investigation. Phys. Fluids 2022, 34, 13102. [Google Scholar] [CrossRef]
  7. Liu, N.X.; Huang, X.L.; Luo, H.; Yang, C.; Wang, Z.H.; Min, C.R. Study on eliminating retrograde condensate pollution in low-permeability condensate gas reservoir. J. Porous Media 2023, 26, 1–19. [Google Scholar] [CrossRef]
  8. Jing, W.; Zhang, L.; Zhang, Y.; Memon, B.S.; Li, A.; Zhong, J.; Sun, H.; Yang, Y.; Cheng, Y.; Yao, J. Phase behavior of gas condensate in fractured-vuggy porous media based on microfluidic technology and real-time computed tomography scanning. Phys. Fluids 2023, 35, 122002. [Google Scholar] [CrossRef]
  9. Kamari, E.; Shadizadeh, S.R. An experimental phase diagram of a gas condensate reservoir. Pet. Sci. Technol. 2012, 30, 2114–2121. [Google Scholar] [CrossRef]
  10. Davani, K.; Kord, S.; Mohammadzadeh, O.; Moghadasi, J. Numerical simulation and three-phase pressure transient analysis considering capillary number effect—Case study of a gas condensate reservoir. Int. J. Oil Gas Coal Technol. 2020, 25, 258–291. [Google Scholar] [CrossRef]
  11. Rahimzadeh, A.; Bazargan, M.; Darvishi, R.; Mohammadi, A.H. Condensate blockage study in gas condensate reservoir. J. Nat. Gas Sci. Eng. 2016, 33, 634–643. [Google Scholar] [CrossRef]
  12. Onoabhagbe, B.B.; Russell, P.; Ugwu, J.; Gomari, S.R. Application of phase change tracking approach in predicting condensate blockage in tight, low, and high permeability reservoirs. Energies 2020, 13, 6551. [Google Scholar] [CrossRef]
  13. Wang, A.; Li, J.H.; Zhang, B. Study on the phase behaviors of the condensate gas in porous media. Pet. Geol. Oilfield Dev. Daqing 2021, 40, 61–67. [Google Scholar]
  14. Abbasov, Z.Y.; Fataliyev, V.M.; Hamidov, N.N. The solubility of gas components and its importance in gas-condensate reservoir development. Pet. Sci. Technol. 2017, 35, 249–256. [Google Scholar] [CrossRef]
  15. Dinariev, O.Y.; Evseev, N.V. Non-equilibrium transport of a gas-condensate mixture in a porous medium. J. Appl. Mech. Tech. Phys. 2023, 64, 667–674. [Google Scholar] [CrossRef]
  16. Xiao, L.X.; Du, J.F.; Guo, P.; Yang, S.Y.; Zeng, S. Pollution caused by retrograde condensate gas reservoir. Fault-Block Oil Gas Field 2009, 16, 102–104. [Google Scholar]
  17. Wang, W.C.; Wu, K.L.; Chen, Z.X.; Li, Z.; Chen, S.; He, Y.; Yuan, J.; Liu, H. Non-equilibrium pressure drop method for alleviating retrograde condensate effect on gas condensate well deliverability. Acta Pet. Sin. 2022, 43, 719–726. [Google Scholar]
  18. Azin, R.; Sedaghati, H.; Fatehi, R.; Osfouri, S.; Sakhaei, Z. Production assessment of low production rate of well in a supergiant gas condensate reservoir: Application of an integrated strategy. J. Pet. Explor. Prod. Technol. 2019, 9, 543–560. [Google Scholar] [CrossRef]
  19. Jiang, Y.W.; Bi, J.X.; Li, M.; Luo, Y.; Zou, J.B. Study of the effect of retrograde condensation pollution on the productivity of condensate gas well. J. Southwest Pet. Univ. 2005, 27, 46. [Google Scholar]
  20. Hosein, R.; Dawe, R. A parametric methodology in tuning the Peng-Robinson (PR) equation of state for gas condensate systems. Pet. Sci. Technol. 2014, 32, 662–672. [Google Scholar] [CrossRef]
  21. Alarouj, M.; Alomair, O.; Elsharkawy, A. Gas condensate reservoirs: Characterization and calculation of dew-point pressure. Pet. Explor. Dev. 2020, 47, 1091–1102. [Google Scholar] [CrossRef]
  22. Zou, C.M.; Tang, Y.; Yan, J.; Sun, J.W.; Li, Y.H.; Cui, T.N. The evaluation methods and application of retrograde condensation damage in condensate gas reservoir. Reserv. Eval. Dev. 2019, 9, 30–34. [Google Scholar]
  23. Chang, A.; Sun, H.; Zhang, Y.; Zheng, C.; Min, F. Spatial fractional Darcy’s law to quantify fluid flow in natural reservoirs. Phys. A Stat. Mech. Its Appl. 2019, 519, 119–126. [Google Scholar] [CrossRef]
  24. Xu, P.; Yu, B.; Qiao, X.; Qiu, S.; Jiang, Z. Radial permeability of fractured porous media by Monte Carlo simulations. Int. J. Heat Mass Transf. 2013, 57, 369–374. [Google Scholar] [CrossRef]
  25. Canelas, R.B.; Domínguez, J.M.; Crespo, A.J.; Gómez-Gesteira, M.; Ferreira, R.M. A Smooth Particle Hydrodynamics discretization for the modelling of free surface flows and rigid body dynamics. Fluids 2015, 78, 581–593. [Google Scholar] [CrossRef]
  26. Li, S.; Zhang, N.; Li, Q.; Vadim, S. Stability study of fluid-solid coupled dynamic system of seepage in accumulative broken rock. Arab. J. Geosci. 2020, 13, 647. [Google Scholar] [CrossRef]
  27. Santos, M.P.P.C.; Carvalho, M.S. Pore network model for retrograde gas flow in porous media. J. Pet. Sci. Eng. 2020, 185, 106635. [Google Scholar] [CrossRef]
  28. Liu, Y.; Pan, Y.; Sun, Y.; Liang, B. Experimental Study on the Control Mechanism of Non-Equilibrium Retrograde Condensation in Buried Hill Fractured Condensate Gas Reservoirs. Processes 2023, 11, 3242. [Google Scholar] [CrossRef]
  29. Tang, Y.; Long, K.; Wang, J.; Xu, H.; Wang, Y.; He, Y.; Shi, L.; Zhu, H. Change of phase state during multi-cycle injection and production process of condensate gas reservoir based underground gas storage. Pet. Explor. Dev. 2021, 48, 395–406. [Google Scholar] [CrossRef]
  30. Mohammad, I.R.A.; Behnam, S.S. Investigating the effect of fracture–matrix interaction in underground gas storage process at condensate naturally fractured reservoirs. J. Nat. Gas Sci. Eng. 2014, 19, 161–174. [Google Scholar]
Figure 1. Comparison between model calculation results and experimental results.
Processes 12 00522 g001
Figure 2. Schematic diagram of the fluid flow region around a wellbore [22].
Processes 12 00522 g002
Figure 3. Flow chart of the solution process.
Processes 12 00522 g003
Figure 4. Schematic diagram of relative permeability curves.
Processes 12 00522 g004
Figure 5. Distribution map of condensate oil saturation in near-well zones with different relative permeability curves.
Processes 12 00522 g005
Figure 6. Variation in the skin factor with the radius under different relative permeability curves.
Processes 12 00522 g006
Figure 7. Distribution of condensate saturation near the wellbore under varying differences between the formation pressure and dew point pressure.
Processes 12 00522 g007
Figure 8. Condensate oil saturation near the wellbore under varying differences between the formation pressure and dew point pressure.
Processes 12 00522 g008
Figure 9. Curve of condensate oil saturation near the wellbore under different production levels.
Processes 12 00522 g009
Figure 10. Distribution of condensate oil saturation under different permeability conditions.
Processes 12 00522 g010
Table 1. Physical parameters of gas components.
ComponentMole Fraction/%ComponentMole Fraction/%ComponentMole Fraction/%
Carbon dioxide14.49Nitrogen0Methane61.19
Ethane9.84Propane3.5Isobutane0.59
Butane1.13Isopentane0.37n-Pentane0.43
Hexane0.5Heptane0.46Octane0.49
Nonane1Decane0.66C11+5.35
Table 2. Physical parameters of formation.
ParameterValueParameterValue
Formation depth/m3897Formation compression coefficient/MPa−10.0004
Wellbore radius/m0.078Porosity/%3.5
Formation pressure/MPa46.93Temperature/°C152
Formation thickness/m118Permeability/mD2
Table 3. Skin coefficient under different influencing factors.
Relative Permeability CurveSdΔPd (MPa)SdQg (×104 m3/d)SdK (mD)Sd
Type I3.361.328.32105.14113.79
Type II8.32.641.75158.2528.25
Type III26.65.280.692012.0943.88
Table 4. Comparison of results between this model and the production capacity testing of well A.
Testing SystemNozzle (mm)Production
(×104 m3/d)
Calculating Skin
Coefficient
Testing Skin
Coefficient
Relative Error (%)
Test 16.3510.739.7610.46.15
Test 27.9414.1114.0514.31.75
Test 39.5318.4119.518.83.72
Table 5. Comparison results between this model and the production capacity testing of well B.
Testing SystemNozzle (mm)Production
(×104 m3/d)
Calculating Skin
Coefficient
Testing Skin
Coefficient
Relative Error (%)
Test 19.5322.766.386.75.02
Test 212.731.539.249.86.06
Test 315.8837.8513.8513.24.69
Disclaimer/Publisher’s Note: The statements, opinions and data contained in all publications are solely those of the individual author(s) and contributor(s) and not of MDPI and/or the editor(s). MDPI and/or the editor(s) disclaim responsibility for any injury to people or property resulting from any ideas, methods, instructions or products referred to in the content.

