Article

Exploring the REEs Energy Footprint: Interlocking AI/ML with an Empirical Approach for Analysis of Energy Consumption in REEs Production

by
Subbu Venkata Satyasri Harsha Pathapati
,
Rahulkumar Sunil Singh
,
Michael L. Free
and
Prashant K. Sarswat
*
Department of Materials Science and Engineering, University of Utah, Salt Lake City, UT 84112, USA
*
Author to whom correspondence should be addressed.
Processes 2024, 12(3), 570; https://doi.org/10.3390/pr12030570
Submission received: 21 February 2024 / Revised: 5 March 2024 / Accepted: 11 March 2024 / Published: 13 March 2024

Abstract

:
Rare earth elements (REEs including Sc, Y) are critical minerals for developing sustainable energy sources. The gradual transition adopted in developed and developing countries to meet energy targets has propelled the need for REEs in addition to critical metals (CMs). The rise in demand which has propelled REEs into the spotlight is driven by the crucial role these REEs play in technologies that aim to reduce our carbon footprint in the atmosphere. Regarding decarbonized technologies in the energy sector, REEs are widely applied for use in NdFeB permanent magnets, which are crucial parts of wind turbines and motors of electric vehicles. The underlying motive behind exploring the energy and carbon footprint caused by REEs production is to provide a more complete context and rationale for REEs usage that is more holistic. Incorporating artificial intelligence (AI)/machine learning (ML) models with empirical approaches aids in flowsheet validation, and thus, it presents a vivid holistic picture. The energy needed for REEs production is linked with the source of REEs. The availability of REEs varies widely across the globe. REEs are either produced from ores with associated gangue or impurities. In contrast, in other scenarios, REEs can be produced from the waste of other mineral deposits or discarded REEs-based products. These variations in the source of feed materials, and the associated grade and mineral associations, vary the process flowsheet for each type of production. Thus, the ability to figure out energy outcomes from various scenarios, and a knowledge of energy requirements for the production and commercialization of multiple opportunities, is needed. However, this type of information concerning REEs production is not readily available as a standardized value for a particular material, according to its source and processing method. The related approach for deciding the energy and carbon footprint for different processing approaches and sources relies on the following three sub-processes: mining, beneficiation, and refining. Some sources require incorporating all three, whereas others need two or one, depending on resource availability. The available resources in the literature tend to focus on the life cycle assessment of REEs, using various sources, and they focus little on the energy footprint. For example, a few researchers have focused on the cumulative energy needed for REE production without making assessments of viability. Thus, this article aims to discuss the energy needs for each process, rather than on a specific flowsheet, to define process viability more effectively regarding energy need, availability, and the related carbon footprint.

1. Introduction

The lanthanide group of elements in the periodic table consists of Rare Earth Elements (REEs), which range from Lanthanum (La) to Lutetium (Lu), in addition to Scandium (Sc) and Yttrium (Y). The “rare” term herein is misleading as it assumes these elements are barely available. However, researchers have discovered and estimated 200 REE-bearing minerals, of which, 160 have a remarkably high abundance. Ideally, the crystal abundance would be higher than some precious and base metals. Therefore, here, the term “rare” means that the concentration values of REE, within a specific mineral type, are less than only a few parts per million (ppm) [1,2]. In recent decades, the importance of REEs to industrial needs has increased because these exhibit highly valued magnetic, spectral, and mechanical properties. Their addition enhances the strength of steel and magnesium-based alloys in metallurgy, stabilizes catalytic structures, and controls pollutants in the automobile industry. Moreover, it increases dielectric constants and permeability values in the electronics sector, captures UV radiation, aids glass polishing in the glass industry, reduces magnet weight in manufacturing, enables the emission of a specific wavelength in phosphor applications, and contributes to neutron absorption in the nuclear industry [3].
Additionally, REEs facilitate the increased storage of solid-state hydrogen as a metal hydride [3]. According to data from the European market from 2012–2023, the magnets, catalysts, and ceramics manufacturing industries showed a tremendous increase (nearly twice) in the utilization of REEs [2,4,5]. Due to supply chain vulnerabilities and material availability challenges in the transition to green energy, the United States Department of Energy categorizes REEs as energy-critical elements [6]. We have highlighted this categorization because government policies promote sustainable extractions and they reduce dependence on foreign suppliers like China, a global producer and supplier of REEs with market shares [7]. Today, the global production of REEs relies heavily on the conventional processing of primary ore bodies since they are highly suitable for superior leaching efficiency. Despite this advantage, these ore bodies’ non-renewable nature and limitations underline the need to explore sustainable alternatives for sustaining REE production. Urban processing seems to be a potential alternative; thus, tapping into these secondary sources ensures a more sustainable supply of REEs [7,8]. A simple overview in Figure 1 depicts the flowsheets of both conventional and urban processing concepts. Here, the process cycle is explained, from mining to metal production, emphasizing the significant stages and sources.
The best economic mineable primary sources of REEs are bastnasite, monazite, and xenotime deposits, which are associated with various gangue minerals based on the type of deposit and its host rock. These deposits are processed through conventional processing, as depicted in Figure 1. The REEs recovery from these sources is fast and high due to their high concentration (>1%), as compared with secondary sources [9]. Cerium (Ce) is highly abundant among the naturally occurring deposits, and Thulium (Tm) is the least abundant. Secondary resources comprising REEs encompass a wide range of sources, including mine/mill tailings from the processing of gold/tungsten ores, electronic waste products such as earphones, laptops, and batteries, residues from ore processing (e.g., bauxite), impurities from refining processes (dross/slag), residues from coal combustion (ash), and some rare earth-based alloys which may be recycled (LTR) [10,11]. The urban processing route, as shown on the right-hand side in Figure 1, is used for extracting REEs from secondary sources. Recycling these resources using adaptable conventional methods is critical because the concentration and associated impurities vary depending on mineralogical factors and diverse feed sources. Therefore, the primary extraction processes are partially modified when processing these sourced materials, and the same applies to the associated constraints, conditions, and chemicals utilized. Moreover, regarding metal production, the demand to meet consumers’ daily product needs is forcing manufacturers to implement widely applicable and innovative techniques, thereby enforcing a need for mapping energy consumption [12]. Therefore, estimating energy consumption (KWh) is needed, and these values vary from place to place, depending on the sources of the REEs. Energy consumption (EC) analysis involves deeply understanding intrinsic and extrinsic parameters. This topic is quite familiar in the 21st century; it rose to prominence in 1968 in the U.K., and in 1972 in the USA. The main aim of EC analysis is to provide a precise and correct analysis by accounting for the factors of both the direct and indirect energy sources used in production processes. Industrialists use EC as the quantitative analysis method for task accomplishment [13]. The estimation of EC for REEs started in 1976, with an estimation of 35.46 GJ; it was derived from the mining to leaching process, which produced 1 ton of Rare Earth Oxide (RO) from Bastnasite ore [14]. In 2013, the theoretical EC was estimated as having produced 1 ton of REM from the primary sources of REEs (namely, the Bastnasite required EC of 33.16–75.83 GJ, the Monazite required EC of 25.94–68.61 GJ, and the Xenotime required EC of 26.02–68.69 GJ [15]. In 2015, the primary EC needed to produce 1 ton of RO was 300–600 GJ, which is significantly higher than other estimates [16]. In 2016, the EC for the world’s deposits was analyzed, and the average was approximately 1218 GJ per 1 ton of RO [12]. The estimated EC for Ion adsorption clays to produce 1 ton of RO was 19.86 GJ in 2016 [17] and 442.60 GJ [18] in 2019. In 2019, the estimated EC for mining and mineral processing operations, to process 1 ton of mine/mill tailings, was 0.02–0.05 GJ [19,20]. Moreover, the estimated EC for producing 1 ton of RO from waste fluorescent powders was 17.78 GJ [21]. In 2021, the estimated EC for the Bayan Obo deposit varied from 10.60–291.07 GJ, to produce 1 ton of RO [22].
However, the available literature from the past to the present is focused only on the life cycle assessments (LCA) and the carbon footprints of REEs, emphasizing environmental impacts [12,20,22,23]. Furthermore, the variations in EC results, generated by different researchers for similar types of ore bodies, are difficult to comprehend. Additionally, the EC information is limited and discrete because its scope of explanation varies depending on the type of process considered during the data collection period, and the types of process vary significantly in terms of continent, conditions, and data assumptions. There is still no brief discussion on the processes and factors that are considered for calculating energy estimations. There are only a few studies in the literature that explain the energy demand. However, these discussions are restricted to highlighting a particular set of processes. Precise information concerning these aspects tends to be confined to the industries. Thus, understanding and estimating the energy used is not yet known, and there are no answers to the question of which route is most energy efficient. Therefore, this article is aimed at discussing the empirical calculation for the specific energy consumption (SEC) (KJ/t) needed to generate one metric ton of final product (Rare Earth Oxide/Metal) after processing a specific feed with a known REE concentration. Although the conditions for this article are similar to those in the available literature, we nevertheless used them as a basis and focused on constructing a comprehensive and transparent depiction of EC, using those datasets and ensuring the accuracy of the analysis through well-justified assumptions when the data were insufficient or incomplete. The present article analyzes the extracted data and processes from those ten datasets for diverse feed grades. These datasets helped us to generate an empirical equation, as discussed in Section 3. This analysis was further extended by training AI and ML-based systems using these datasets, resulting in a predictive estimation of dimensionless scales for a given type of feed with a known REEs percentage, which aided in the validation of our approach. Moreover, this analysis has opportunity for application in designing flowsheets because it highlights the factor-to-factor considerations that are either intrinsic or extrinsic to energy consumption.

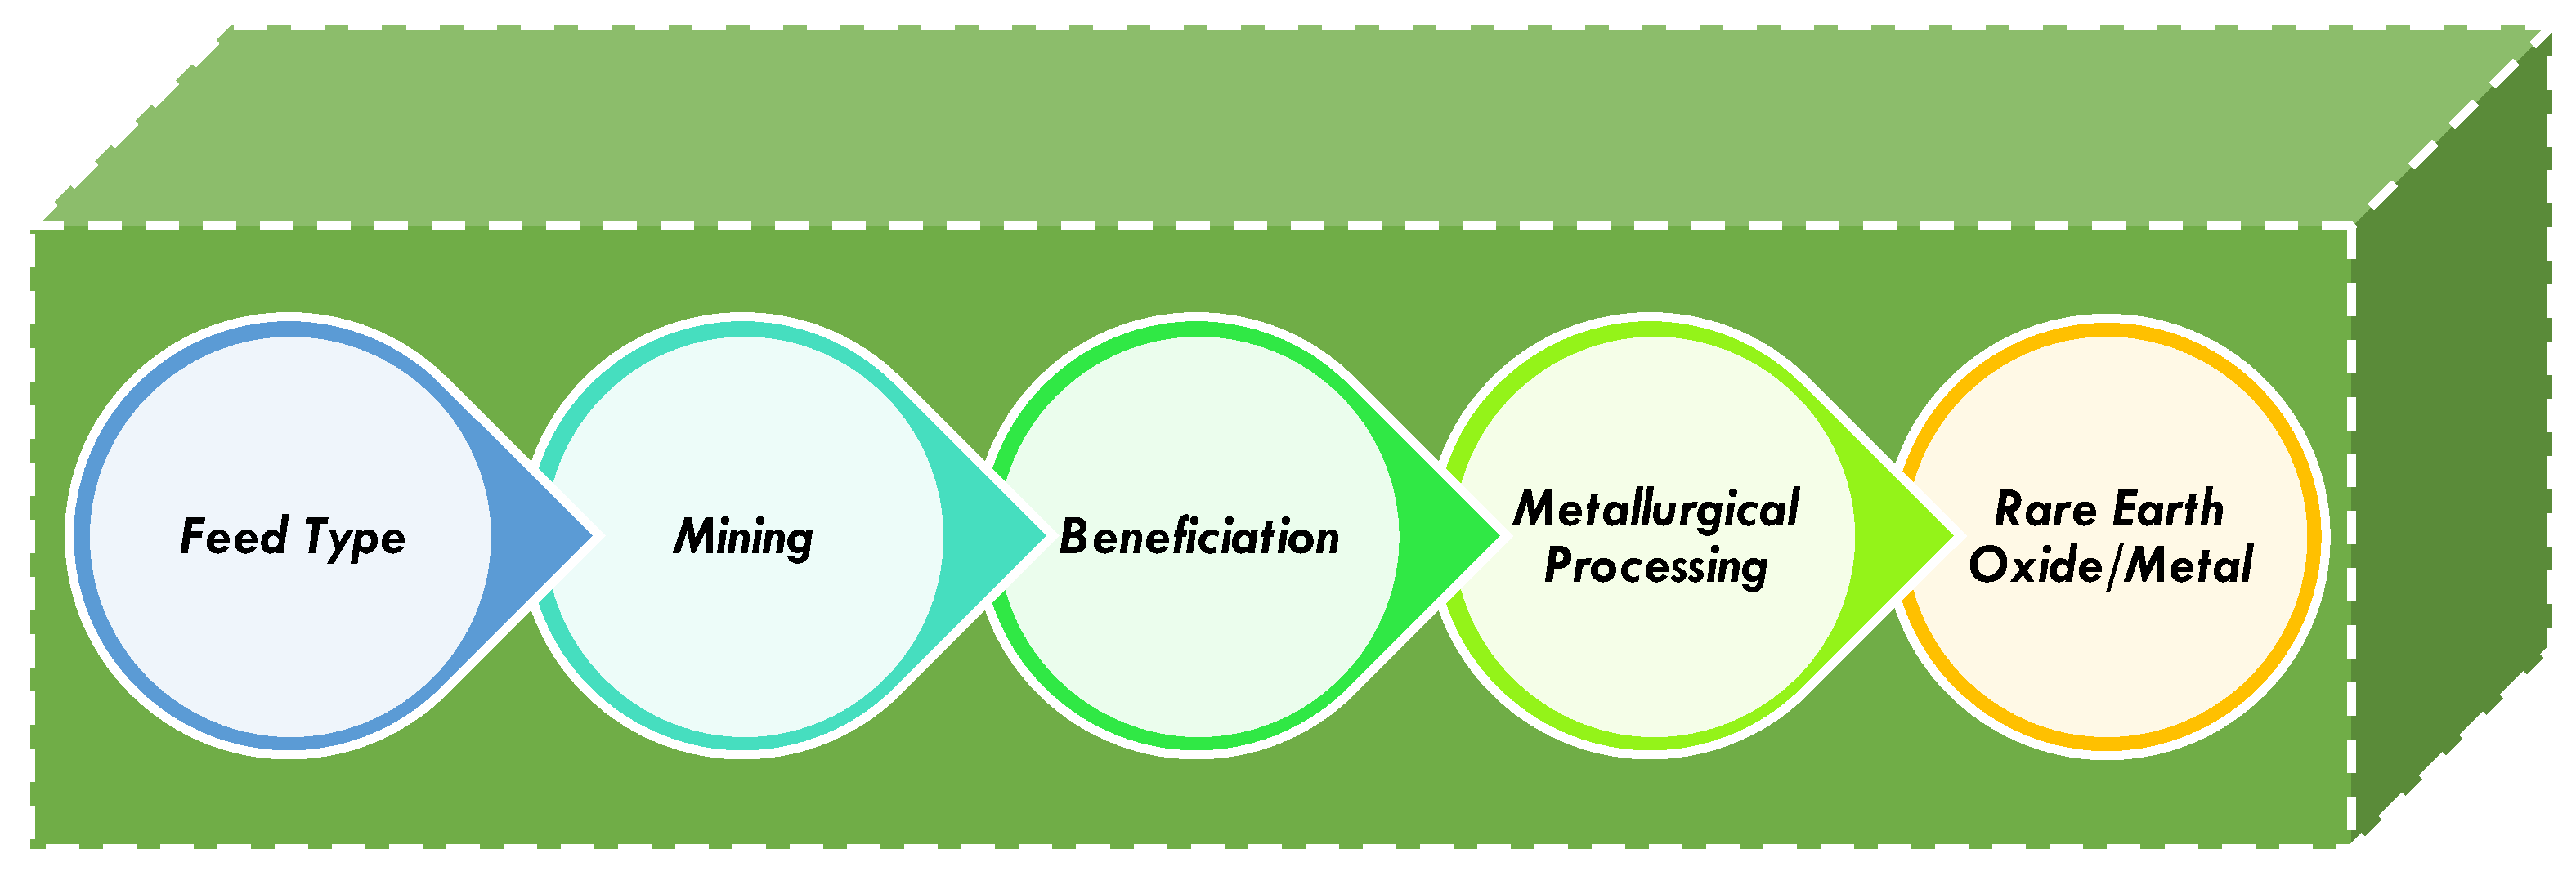
2. Methodology and Scope

This work’s main goal and scope are focused on deriving the theoretical EC needed to produce a holistic processing route. The aim was to formulate a mathematical relationship, using the necessary information from those datasets, to obtain an extensive understanding of the EC for each unit operation by considering all the associated auxiliary operations. The methodological framework adopted here involves steps which systematically progress to yield a reasonable and well-founded conclusion. The procedure followed here is based on directions and guidelines in the literature [13,24].
The commencement of the EC assessment starts with defining the system boundaries, as shown in Figure 2. The first boundary is type of feed, followed by mining, beneficiation, and metallurgical processing to achieve rare earth oxide. The next vital step concerns defining the method for the processing route, which is crucial for extracting the auxiliary unit operations and identifying parameters. This step is vital as it involves the REEs concentrations across feed sources; thus, the processing route defines the need for unit operations. In this work, we focused on two processing routes, namely, conventional (primary sources) and urban (secondary sources) mining, with variations in the initial unit operations. This analysis explicitly focuses on feed sources that were chosen for the primary processing route, as follows: the bastnaesite, monazite, xenotime deposits, Ion adsorption clay (IAC), and their process flow sheets, as obtained through industrial databases and LCA reports. Concurrently, the feed sources for the chosen secondary resource processing routes are extracted from coal ash and mine/mill tailings. Thus, using the available information, an illustrative schematic flowsheet was created, as was the additional objective to consider all the interconnected factors; this was followed by standardized unit conversion for the feed and product, as expressed in ppm or as a percentage of rare earth oxide. This conversion eases the EC needed to produce one metric ton of REEs oxide/metal. The following process concerns training the AI and ML model obtained from AIandLearn (https://aiandlearn.com/, accessed on 7 January 2024) software; here, a predictive analysis of the EC was performed to understand how the EC varies with REE content. Additionally, a deeper exploration further revealed that understanding the individual unit operation involved in EC estimation could be a sustainable way to estimate the cumulative EC for the derived theoretical flowsheet, which varies depending on research needs. Thus, the final empirical equation concerns that which comprises all the factors that are associated with each processing stage, which therefore provides a holistic picture. The following section will provide a detailed description of the unit operations and the factors considered.

3. Functional Units and Factor Determination

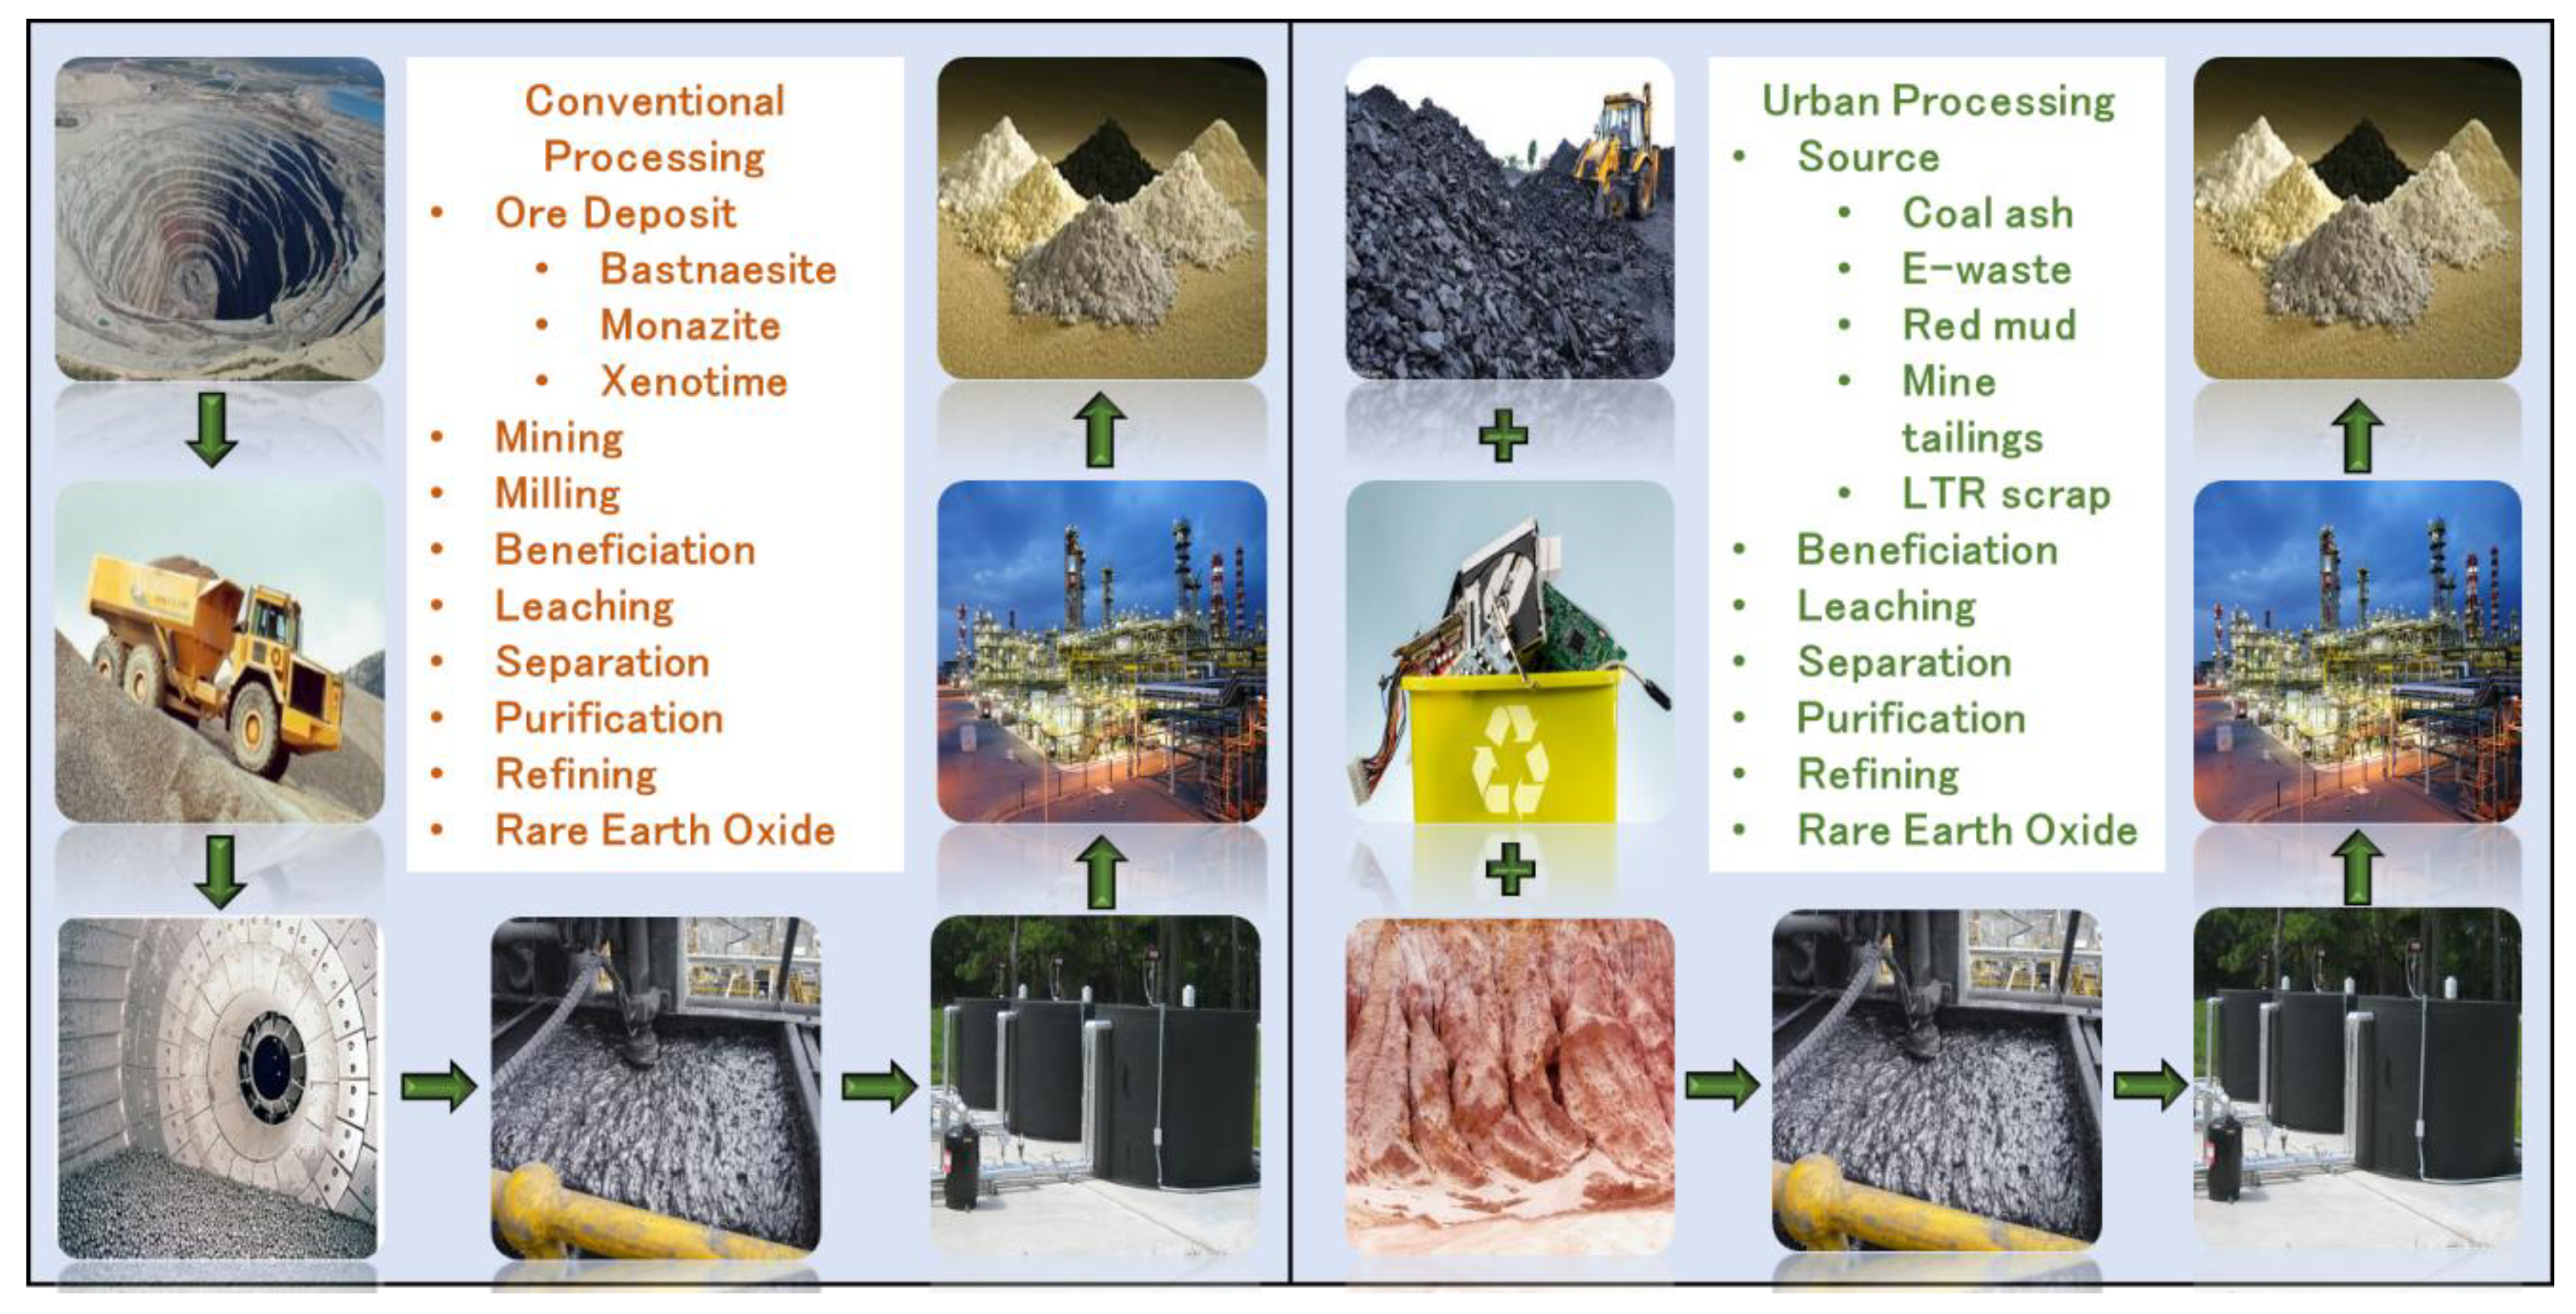
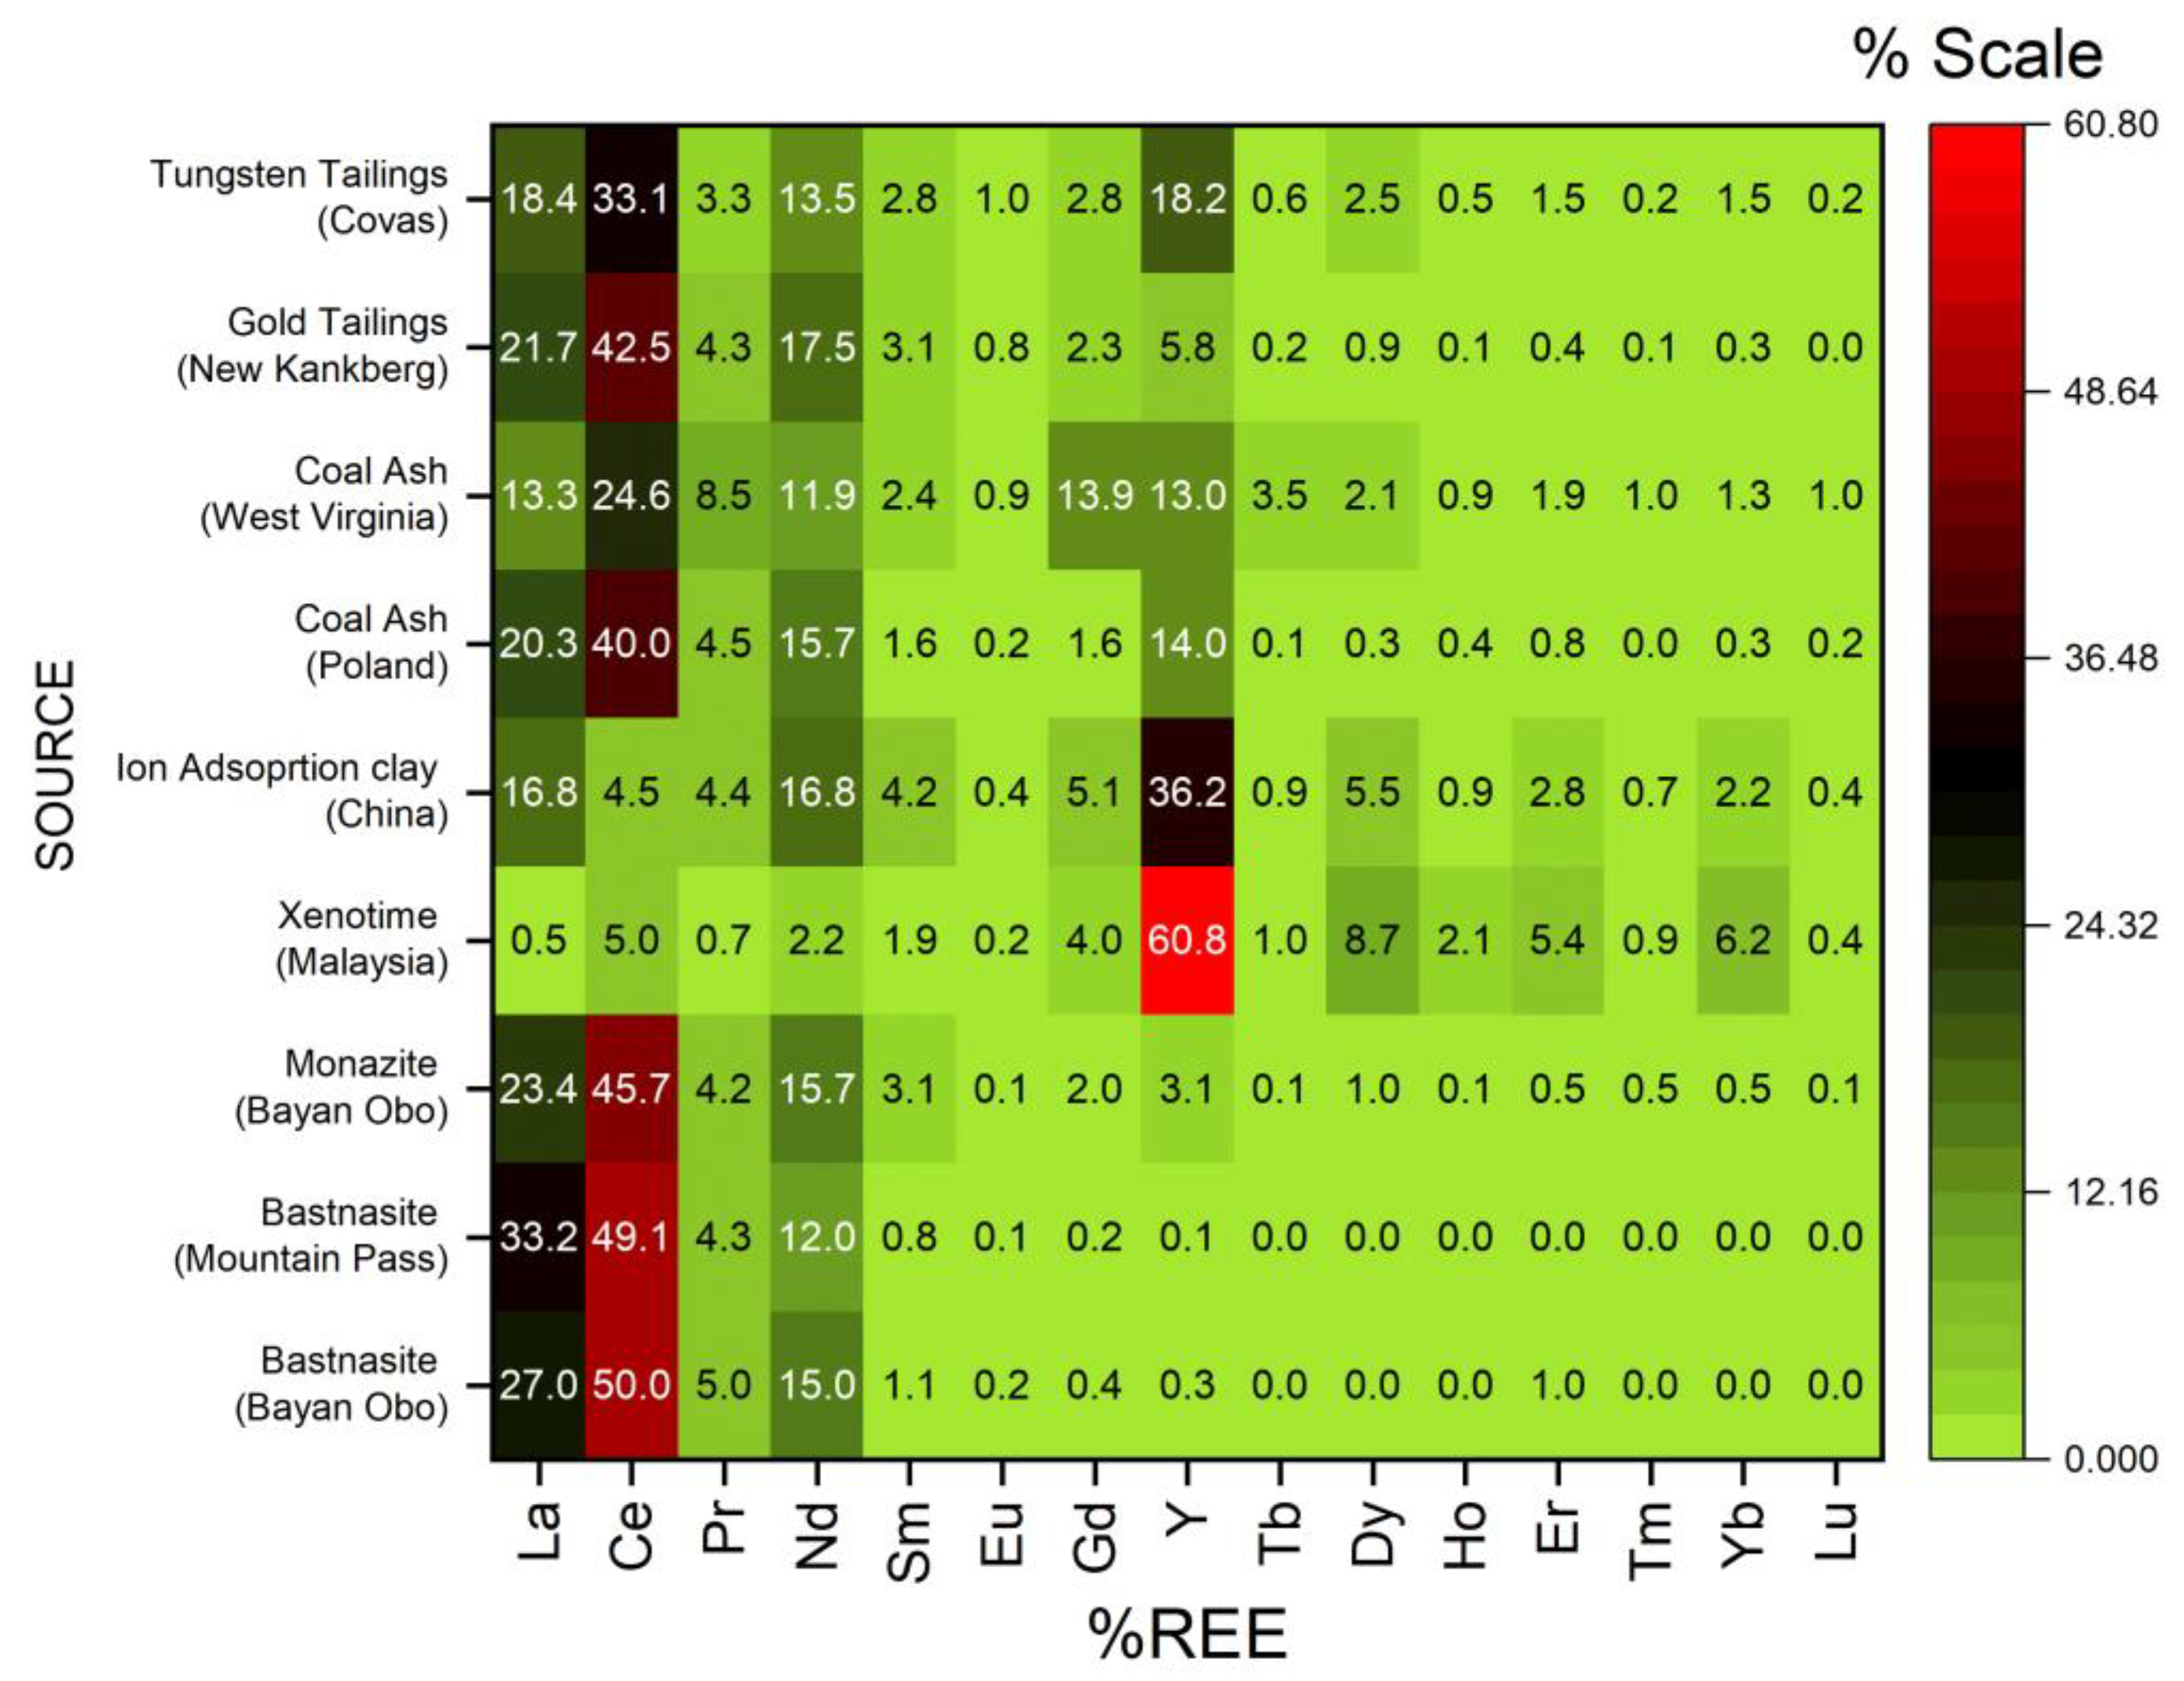
3.1. Composition of REEs in Feed Type

The REE feed sources considered in this work are the bastnaesite, monazite, xenotime deposits, ion adsorption clays, coal ash, and mine/mill tailings. The EC estimation is based on the REEs content because the unit operations are decided using these parameters. Based on the literature data available [17,19,25,26], the analysis of the variations in REEs content (except Sc) is explained using Figure 3. This heatmap helps to understand the variations in La-Lu based on the feed source. Additionally, it is evident that almost all of the resources are Ce-dominant (other than Xenotime, which is Y-dominant). This aspect of Ce/Y dominance reflects initial researchers’ attempts at a sort of early segregation of REEs. The supporting graph, shown in Figure 4, clearly explains where almost all of the resources (except Xenotime resources) are potentially rich in light REEs (REEs), as compared with heavy REEs (HREEs), and this also emphasizes the importance of selecting both of the required primary and auxiliary operations.

3.2. Mining Unit

In mining operations, a diverse array of techniques are accessed, depending on the geological factors of the deposit found; for instance, the type (weathered/sedimentary), location, and feasibility of cost-efficient extractions, as well as the depths, grade, and mineralogy of the deposit. These factors segregate mining operations into open-pit, underground, and leaching-based (heap and dump) mining. To simplify EC estimations in this article, the factors associated with leaching-based mining were not considered in the mining section, but were explained by the metallurgical processing unit. The mining operations implemented were open pit/underground for deposits like Bayan Obo and Mountain Weld. These methods involve the auxiliary process of the Drill-Blast-Load-Haul (D-B-L-H). The primary energy consumption factor for open pit operations was fuel usage for heavy machinery. For the underground operations, the EC was related to mine development and infrastructure, like tunnel creation, ventilation, and electrification. Therefore, the EC in mining was related to all factors, such as the consumption of explosives, diesel, and power usage in mine electrification [12,14,27], and their details are listed in Table 1. Table 1 features the factors considered, as well as their quantity and the net energy consumption needed. However, these factors were either partially or fully linked with the feed grade and recovery percentage. More precisely, feed grade and mineral (ore) recovery from the host rock at the mine site were used to figure out the quantity of ore to be mined. Furthermore, the diesel consumption factors were drilling equipment, blasting agents, load and haul vehicles, and auxiliary mine vehicles for developed mine maintenance. Likewise, the host rock hardness was essential for the blasting agent, which was governed by the feed grade and recovery [28].
The theoretical material needed to produce 1 ton of RO is explained in Equation (1), where NO tons of Ore are to be mined, or NT tons of tailings are to be processed with a feed grade of f % and recovery of r % during processing.
N o , T = 1 f % × r % × 10,000
Equation (2) is a modified form of Equation (1) where the scale is changed in terms of REE metal (RM), and to produce 1 ton of RM, K tons of ore need to be mined if the RO contains m % of RM per ton of RO.
K = N O , T m % × 100
Therefore, Equation (3) estimates the mining unit’s net theoretical EC (KJ).
E C M i n i n g u n i t = N O × [ a 1,2 , 3 × e 1,2 , 3 ] + N T × [ a 2,3 × e 2,3 ]

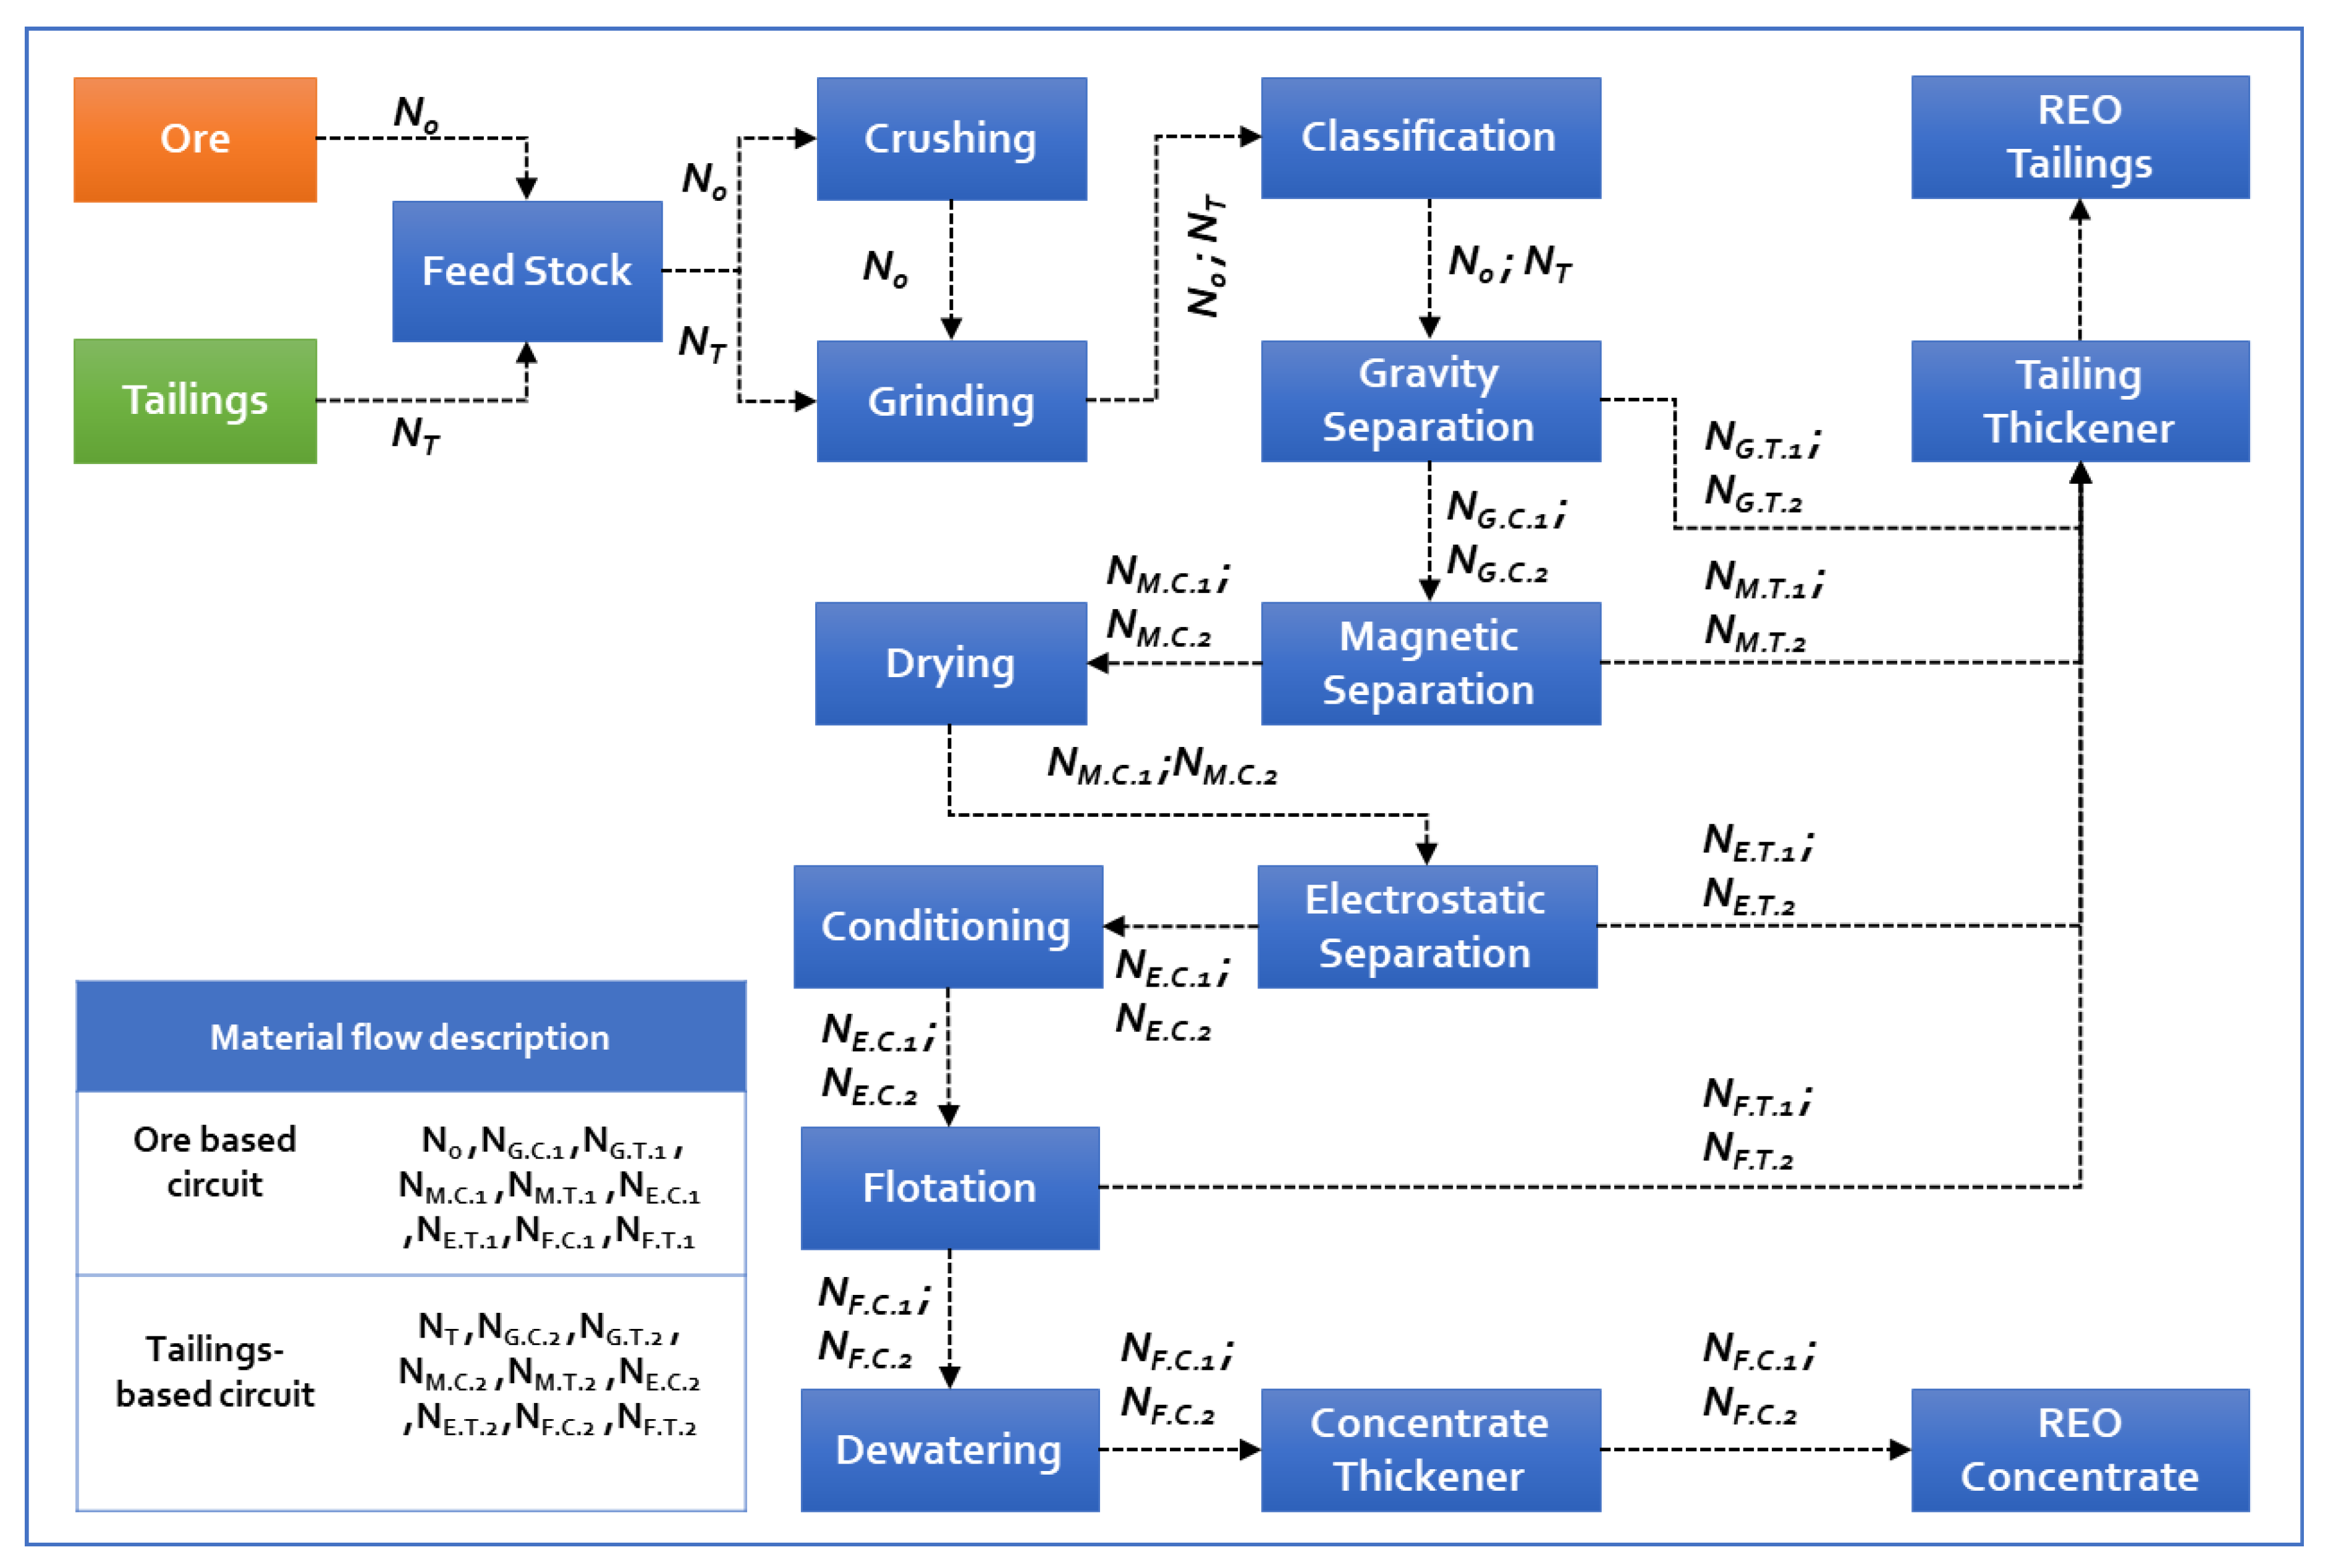
3.3. Beneficiation Unit

Once the mining of a particular ore body is completed, the following process of enriching the ore occurs through the beneficiation unit, where the choice of equipment and the unit operations are related to the mineralogy and the liberation characteristics of the ore body. During this process, the ore and a mixture of REE-bearing minerals are unlocked from the gauge associated with it, due to deposit formation in the host rock. This unlocking process exploits a wide range of properties, like particle size reduction, using comminution, density, electrostatic and magnetic behavior, and surface charge modifications (namely flotation, but no change occurs in the chemical composition). Therefore, the beneficiation operations are decided based on either the processing of the ore deposit (bastnaesite, monazite, and xenotime) or tailings (mill/mine/coal ash). The ideal flowsheets for designing a REEs-based beneficiation operation for these feed sources are represented in Figure 5. In Figure 5, the process for primary and secondary sources are explained with material flows (presented in the figure) in order to help us exactly understand the process that is followed for a given feed type. The unit operations considered for these feed sources are crushing, grinding, classification, conditioning, flotation, gravity separation, magnetic separation, dewatering, and tailing disposal [19,23,29,30]. Magnetic separation is sometimes essential for ores rich in high iron content, like Bayan Obo [22]. Table 2 explains the intrinsic and extrinsic factors associated with unit operations, as shown in Figure 5. Moreover, Table 2 provides a comprehensive understanding of net energy consumption in relation to recovery. This section explains the most energy-intensive operations, where the energy requirement and extraction properties are aligned with the properties [12]. Thus, the calculation for EC in this section is both intrusive and extrusive to the factors of all these operations, and it is aligned with feed grade, recovery, and ore hardness. Therefore, the net EC (K.J.) of the beneficiation unit was calculated using Equation (4).
E C B e n e f i c i a t i o n   u n i t = a x × e x × N k . x
x = c, g, cl, gs, ms, d, es, flo, con, dew;
k = concentrate (c.c), tailing (t.t).
Figure 5. Generalized flowsheet of the beneficiation circuit.
Processes 12 00570 g005
Table 2. Estimation of energy consumption at the beneficiation unit.
Unit
Operation
FactorsQuantity
Required
Equivalent
Energy
Recovery
%
Material Flow (Tons)Net Energy Consumption
(KJ)
Crushing (c)Electrical
Energy
ae.c (KWh)ee.c (KJ/KWh)-Noae.c × ee.c × No
Steel
(Installation)
ac.s (Kg)ec.s (KJ/Kg)-Noac.s × ec.s × No
Grinding (g)Electrical
Energy
ae.g (KWh)ee.g (KJ/KWh)-No, NT(ae.g × ee.g × No)
+
(ae.g × ee.g × NT)
Steel
(Installation and grinding media)
ag.s (Kg)eg.s (KJ/Kg)-No, NT(ag.s × eg.s × No)
+
(ag.s × eg.s × NT)
Water
Pumping
aw.g (KWh)ew.g (KJ/KWh)-No, NT(aw.g × ew.g × No)
+
(aw.g × ew.g × NT)
Classification (cl)Electrical
Energy
ae.cl (KWh)ee.cl (KJ/KWh)-No, NT(ae.cl × ee.cl × No)
+
(ae.cl × ee.cl × NT)
Steel
(Installation)
acl.s (Kg)ecl.s (KJ/Kg)-No, NT(acl.s × ecl.s × No)
+
(acl.s × ecl.s × NT)
Water
Pumping
aw.cl (KWh)ew.cl (KJ/KWh)-No, NT(aw.cl × ew.cl × No)
+
(aw.cl × ew.cl × NT)
Gravity separation (gs)Electrical
Energy
ae.gs (KWh)ee.gs (KJ/KWh)-No, NT(ae.gs × ee.gs × No)
+
(ae.gs × ee.gs × NT)
Steel
(Installation)
ags.s (Kg)egs.s (KJ/Kg)-No, NT(ags.s × egs.s × No)
+
(ags.s × egs.s × NT)
Water
Pumping
aw.gs (KWh)ew.gs (KJ/KWh)-No, NT(aw.gs× ew.gs × No)
+
(aw.gs × ew.gs × NT)
Concentrate Pumpingac.gs (KWh)ec.gs (KJ/KWh)RgsNG.C.1, NG.C.2(ac.gs× ec.gs × NG.C.1)
+
(ac.gs × ec.gs × NG.C.2)
Tailings
Pumping
at.gs (KWh)et.gs (KJ/KWh)1-RgsNG.T.1, NG.T.2(at.gs× et.gs × NG.T.1)
+
(at.gs × et.gs × NG.T.2)
Magnetic separation (ms)Electrical
Energy
ae.ms (KWh)ee.ms (KJ/KWh)-NG.C.1, NG.C.2(ae.ms × ee.ms × NG.C.1)
+
(ae.ms × ee.ms × NG.C.2)
Steel
(Installation)
ams.s (Kg)ems.s (KJ/Kg)-NG.C.1, NG.C.2(ams.s × ems.s × NG.C.1)
+
(ams.s × ems.s × NG.C.2)
Water
Pumping
aw.ms (KWh)ew.ms (KJ/KWh)-NG.C.1, NG.C.2(aw.ms× ew.ms × NG.C.1)
+
(aw.ms × ew.ms × NG.C.2)
Concentrate Pumpingac.ms (KWh)ec.ms (KJ/KWh)RmsNM.C.1, NM.C.2(ac.ms× ec.ms × NM.C.1)
+
(ac.ms × ec.ms × NM.C.2)
Tailings
Pumping
at.ms (KWh)et.ms (KJ/KWh)1-RmsNM.T.1, NM.T.2(at.ms× et.ms × NM.T.1)
+
(at.ms × et.ms × NM.T.2)
Drying (d)Electrical
Energy
ae.d (KWh)ee.d (KJ/KWh)-NM.C.1, NM.C.2(ae.d × ee.d × NM.C.1)
+
(ae.d × ee.d × NM.C.2)
Fuel oil/Steamao.d (gal)eo.d (KJ/gal)-NM.C.1, NM.C.2(ao.d × eo.d × NM.C.1)
+
(ao.d × eo.d × NM.C.2)
Electrical separation (es)Electrical
Energy
ae.es (KWh)ee.es (KJ/KWh)-NM.C.1, NM.C.2(ae.es × ee.es × NM.C.1)
+
(ae.es × ee.es × NM.C.2)
Steel
(Installation)
aes.s (Kg)ees.s (KJ/Kg)-NM.C.1, NM.C.2(aes.s × ees.s × NM.C.1)
+
(aes.s × ees.s × NM.C.2)
Electrical Energy (Concentrate
processing)
ae.c.es (KWh)ee.c.es (KJ/KWh)ResNE.C.1, NE.C.2(ae.c.es × ee.c.es × NE.C.1)
+
(ae.c.es × ee.c.es × NE.C.2)
Electrical Energy (Tailing
processing)
ae.t.es (KWh)ee.t.es (KJ/KWh)1-ResNE.T.1, NE.T.2(ae.t.es × ee.t.es × NE.T.1)
+
(ae.t.es × ee.t.es × NE.T.2)
Conditioning (con)Electrical
Energy
ae.con (KWh)ee.con (KJ/KWh)-NE.C.1, NE.C.2(ae.con × ee.con × NE.C.1)
+
(ae.con × ee.con × NE.C.2)
Steel
(Installation)
acon.s (Kg)econ.s (KJ/Kg)-NE.C.1, NE.C.2(acon.s × econ.s × NE.C.1)
+
(acon.s × econ.s × NE.C.2)
Water
Pumping
aw.con (KWh)ew.con (KJ/KWh)-NE.C.1, NE.C.2(aw.con × ew.con × NE.C.1)
+
(aw.con × ew.con × NE.C.2)
Fuel oilao.con (gal)eo.con (KJ/gal)-NE.C.1, NE.C.2(ao.con × eo.con × NE.C.1)
+
(ao.con × eo.con × NE.C.2)
Chemicalsachem.con (Kg)echem.con (KJ/Kg)-NE.C.1, NE.C.2(achem.con × echem.con × NE.C.1)
+
(achem.con × echem.con × NE.C.2)
Electrical Energy (Slurry
pumping)
ae.sl.con (KWh)ee.sl.con (KJ/KWh)-NE.C.1, NE.C.2(ae.sl.con × ee.sl.con × NE.C.1)
+
(ae.sl.con × ee.sl.con × NE.C.2)
Flotation (flo)Electrical
Energy
ae.flo (KWh)ee.flo (KJ/KWh)-NE.C.1, NE.C.2(ae.flo × ee.flo × NE.C.1)
+
(ae.flo × ee.flo × NE.C.2)
Steel
(Installation)
aflo.s (Kg)eflo.s (KJ/Kg)-NE.C.1, NE.C.2(aflo.s × eflo.s × NE.C.1)
+
(aflo.s × eflo.s × NE.C.2)
Water
Pumping
aw.flo (KWh)ew.flo (KJ/KWh)-NE.C.1, NE.C.2(aw.flo × ew.flo × NE.C.1)
+
(aw.flo × ew.flo × NE.C.2)
Fuel oilao.flo (gal)eo.flo (KJ/gal)-NE.C.1, NE.C.2(ao.flo × eo.flo × NE.C.1)
+
(ao.flo × eo.flo × NE.C.2)
Reagentsarea.flo (Kg)erea.flo (KJ/Kg)-NE.C.1, NE.C.2(area.flo × erea.flo × NE.C.1)
+
(area.flo × erea.flo × NE.C.2)
Concentrate Pumpingac.flo (KWh)ec.flo (KJ/KWh)RfloNF.C.1, NF.C.2(ac.flo × ec.flo × NF.C.1)
+
(ac.flo × ec.flo × NF.C.2)
Tailings
Pumping
at.flo (KWh)et.flo (KJ/KWh)1-RfloNF.T.1, NF.T.2(at.flo × et.flo × NF.T.1)
+
(at.flo × et.flo × NF.T.2)
Dewatering (dew) (Thickening -Filtration)Electrical
Energy
ae.dew (KWh)ee.dew (KJ/KWh)-NF.C.1, NF.C.2(ae.dew × ee.dew × NF.C.1)
+
(ae.dew × ee.dew × NF.C.2)
Steel
(Installation)
adew.s (Kg)edew.s (KJ/Kg)-NF.C.1, NF.C.2(adew.s × edew.s × NF.C.1)
+
(adew.s × edew.s × NF.C.2)
Water
Pumping
aw.dew (KWh)ew.dew (KJ/KWh)-NF.C.1, NF.C.2(aw.dew × ew.dew × NF.C.1)
+
(aw.dew × ew.dew × NF.C.2)
Concentrate
Disposal
ac.dew (KWh)ec.dew (KJ/KWh)-NF.C.1, NF.C.2(ac.dew × ec.dew × NF.C.1)
+
(ac.dew × ec.dew × NF.C.2)
Tailing
Disposal
at.dew (KWh)et.dew (KJ/KWh)-NG.T.1, NG.T.2,
NM.T.1, NM.T.2,
NE.T.1, NE.T.2,
NF.T.1, NF.T.2
(at.dew × et.dew × (NG.T.1 + NM.T.1 + NE.T.1 + NF.T.1))
+
(at.dew × et.dew × (NG.T.2 + NM.T.2 + NE.T.2 + NF.T.2))
The material flow for either concentrate or tailing was calculated using recovery ( R x ) , as shown in Equations (5) and (6).
N c . c . x . n = R x . n 100 × N c . c . x . ( n 1 )
N t . t . x . n = ( 100 R x . n 100 ) × N t . t . x . ( n 1 )
here, n = output operation and n − 1 = input operation.

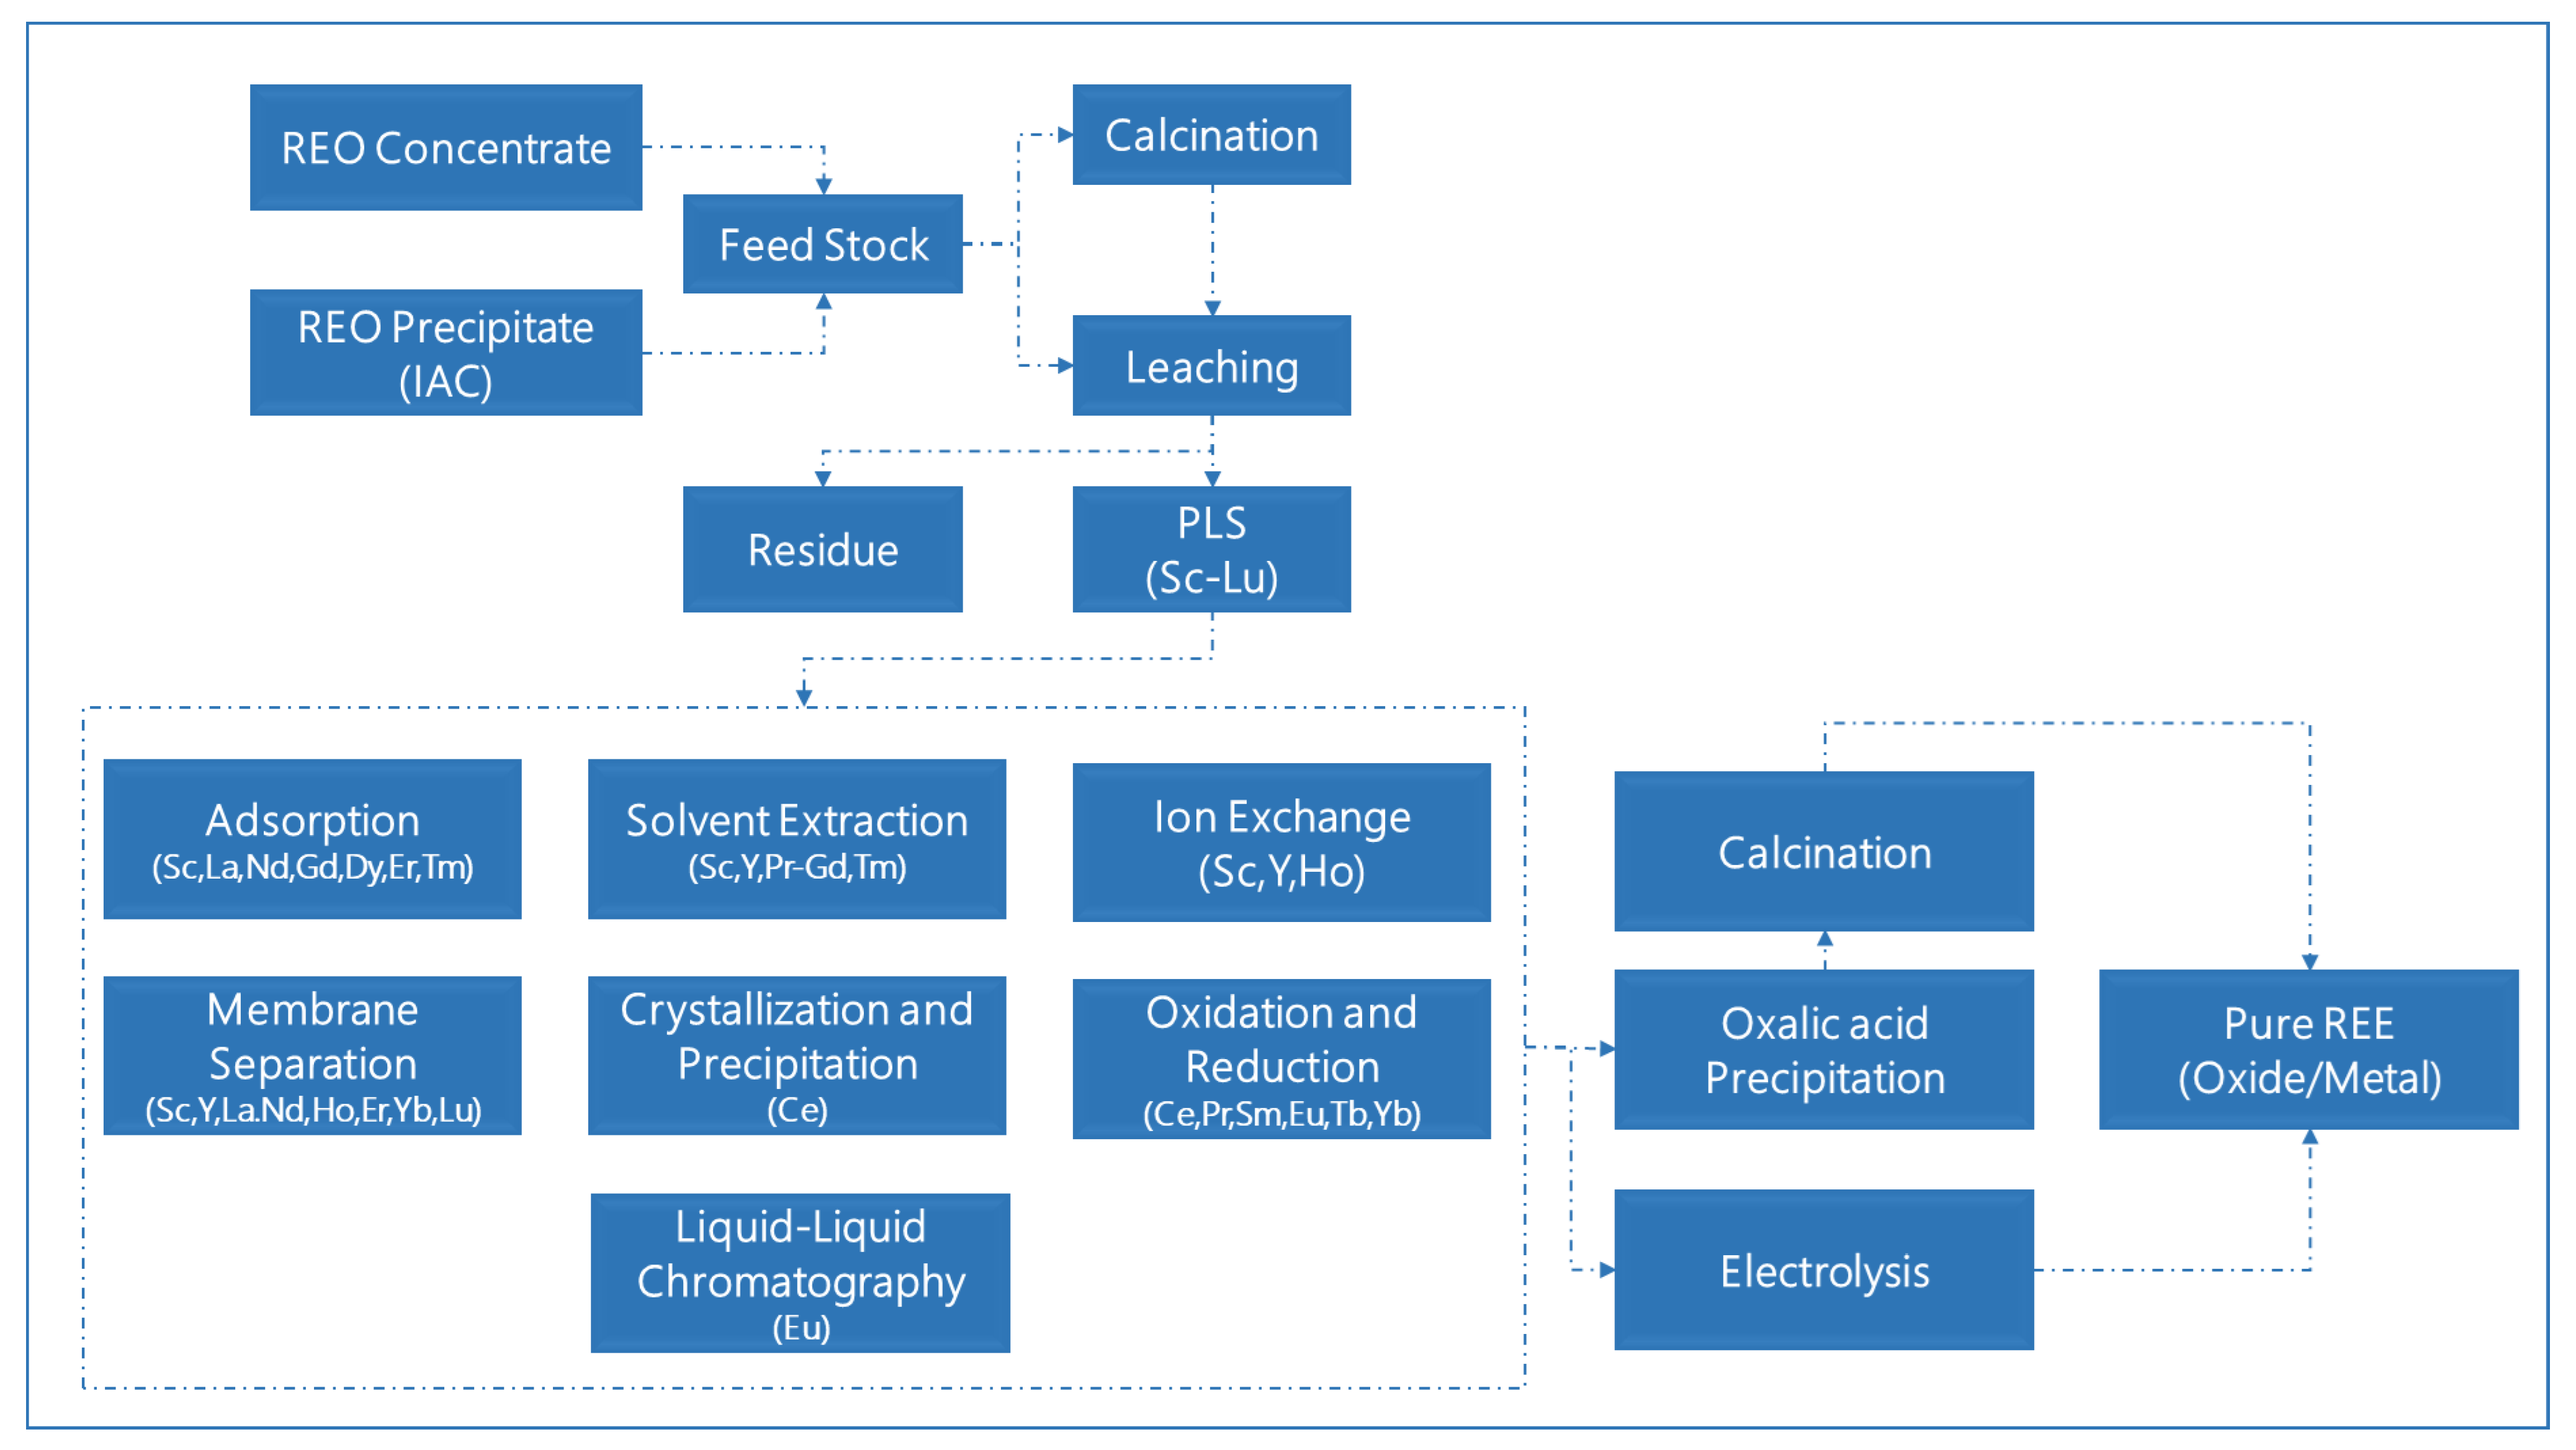
3.4. Metallurgical Processing Unit

The beneficiation of REE concentrate produced from ore/tailings has an enriched REE product in mixed REE carbonates/chlorides/phosphates/fluorides. The REE concentration can vary from 0–100% for a specific REE, depending on the material obtained from mining. Since it is a mixed product, metallurgical processing aims to produce products that are oxides of a specific REE with 99% purity. The overview of the metallurgical processing unit is presented in Figure 6. As shown in Figure 6, the REE concentrate can be directly leached in these operations using an acid/alkali-based solution. An example of this type of operation is the Mountain Pass Mine operation. However, some ore mineralogies, as in Bayan Obo, are initially cracked/calcined (C) in a rotary kiln using an acid, as this operation can enhance recovery [15]. This roasting residue is sent for leaching (L) to dissolve the solid forms of REEs so that they become ionic forms. In addition to these concentrates, the ion adsorption clay ores do not need any beneficiation operations; the precipitate (obtained as a REE carbonate/sulfate) can either be calcinated or directly leached and sent for further processing [22,23]. At this point, REE-based solids are converted to REE-based liquids through leaching.
The ions that enter the solution via RO through leaching need to be separated. Among the several procedures described in the literature, the industrially commercialized processes are adsorption (A), solvent extraction (SX), ion exchange (IC), membrane separation (MB), crystallization (CN), precipitation (PP), oxidation (OX) and reduction (RD), and liquid–liquid chromatography (LC). Table 3 and Figure 6 explain the details of those processes, which have been proven with appreciable selectivity, as per the literature, for individual REE elements. From Table 3, it can be inferred that A is preferred for alternate lanthanides, starting with La. SX is suitable for most of the REEs, IX is preferred for Sc, Y, and Ho, MB is suitable for HREEs, CN, PP, OX, and RD are preferred for those that can exhibit variable valency, and finally, LC is most suitable for Y. The net EC consumption in this unit depends on the process route that is linked with the grade of concentrate and mineralogy of the ore body. The calculation for the net EC can be performed using a modified form of Equations (4)– (6), as shown in Equations (7)– (9),
E C M e t a l l u r g i c a l   P r o c e s s i n g   u n i t = a y × e y × N k . y . n
y= C, L, A, SX, IC, MB, CN, PP, OX, RD, LC;
k = valuable concentrate (v.c), gangue (g).
The material flow for each operation can either be in the form of a valuable concentrate or gangue, and it is calculated using recovery ( R y ), as shown in Equations (5) and (6)
N v . c . y . n = R y . n 100 × N v . c . y . ( n 1 )
N g . y . n = ( 100 R y . n 100 ) × N g . y . ( n 1 )
here, n =output operation and n − 1 = input operation.
If individual REEs produce oxide from the separated solutions, the general approach concerns oxalic acid precipitation and calcination. Hence, Equations (7)–(9) can be applicable for those calculations. However, if the target is to produce metallic film, the electrolysis process can be used for ionic solvents. Then, the EC (KJ/Ton of REE metal) for the electrolysis operation can be calculated using Equation (10) [31].
E . C . E l e c t r o l y s i s = E × n × 26,800 × 3600 A . w . × β % 100
here E = Voltage applied (V), n = number of e consumed in the reaction,
Aw = atomic weight of ion (gm/mol), β = efficiency of the electrolytic cell (%).
Table 3. REEs’ separation mechanisms with appreciable selectivity.
Separation MethodSuitable REEs
AdsorptionSc [32], La [33], Nd [34], Gd [35,36], Dy [37,38], Er [39], Tm [40]
Solvent ExtractionSc [41], Y [42], Pr [43], Nd [44], Sm [45], Eu [46], Gd [36], Tb [47], Tm [48]
Ion exchangeSc [49,50], Y [51], Ho [52]
Membrane SeparationSc [53], Y [54], La [55], Nd [56,57], Ho [58,59], Er [60], Yb [61,62], Lu [63,64]
Crystallization and PrecipitationCe [65]
Oxidation and ReductionCe [1], Pr [1], Sm [1], Eu [1,46], Tb [1], Yb [1]
Liquid–Liquid ChromatographyY [66]

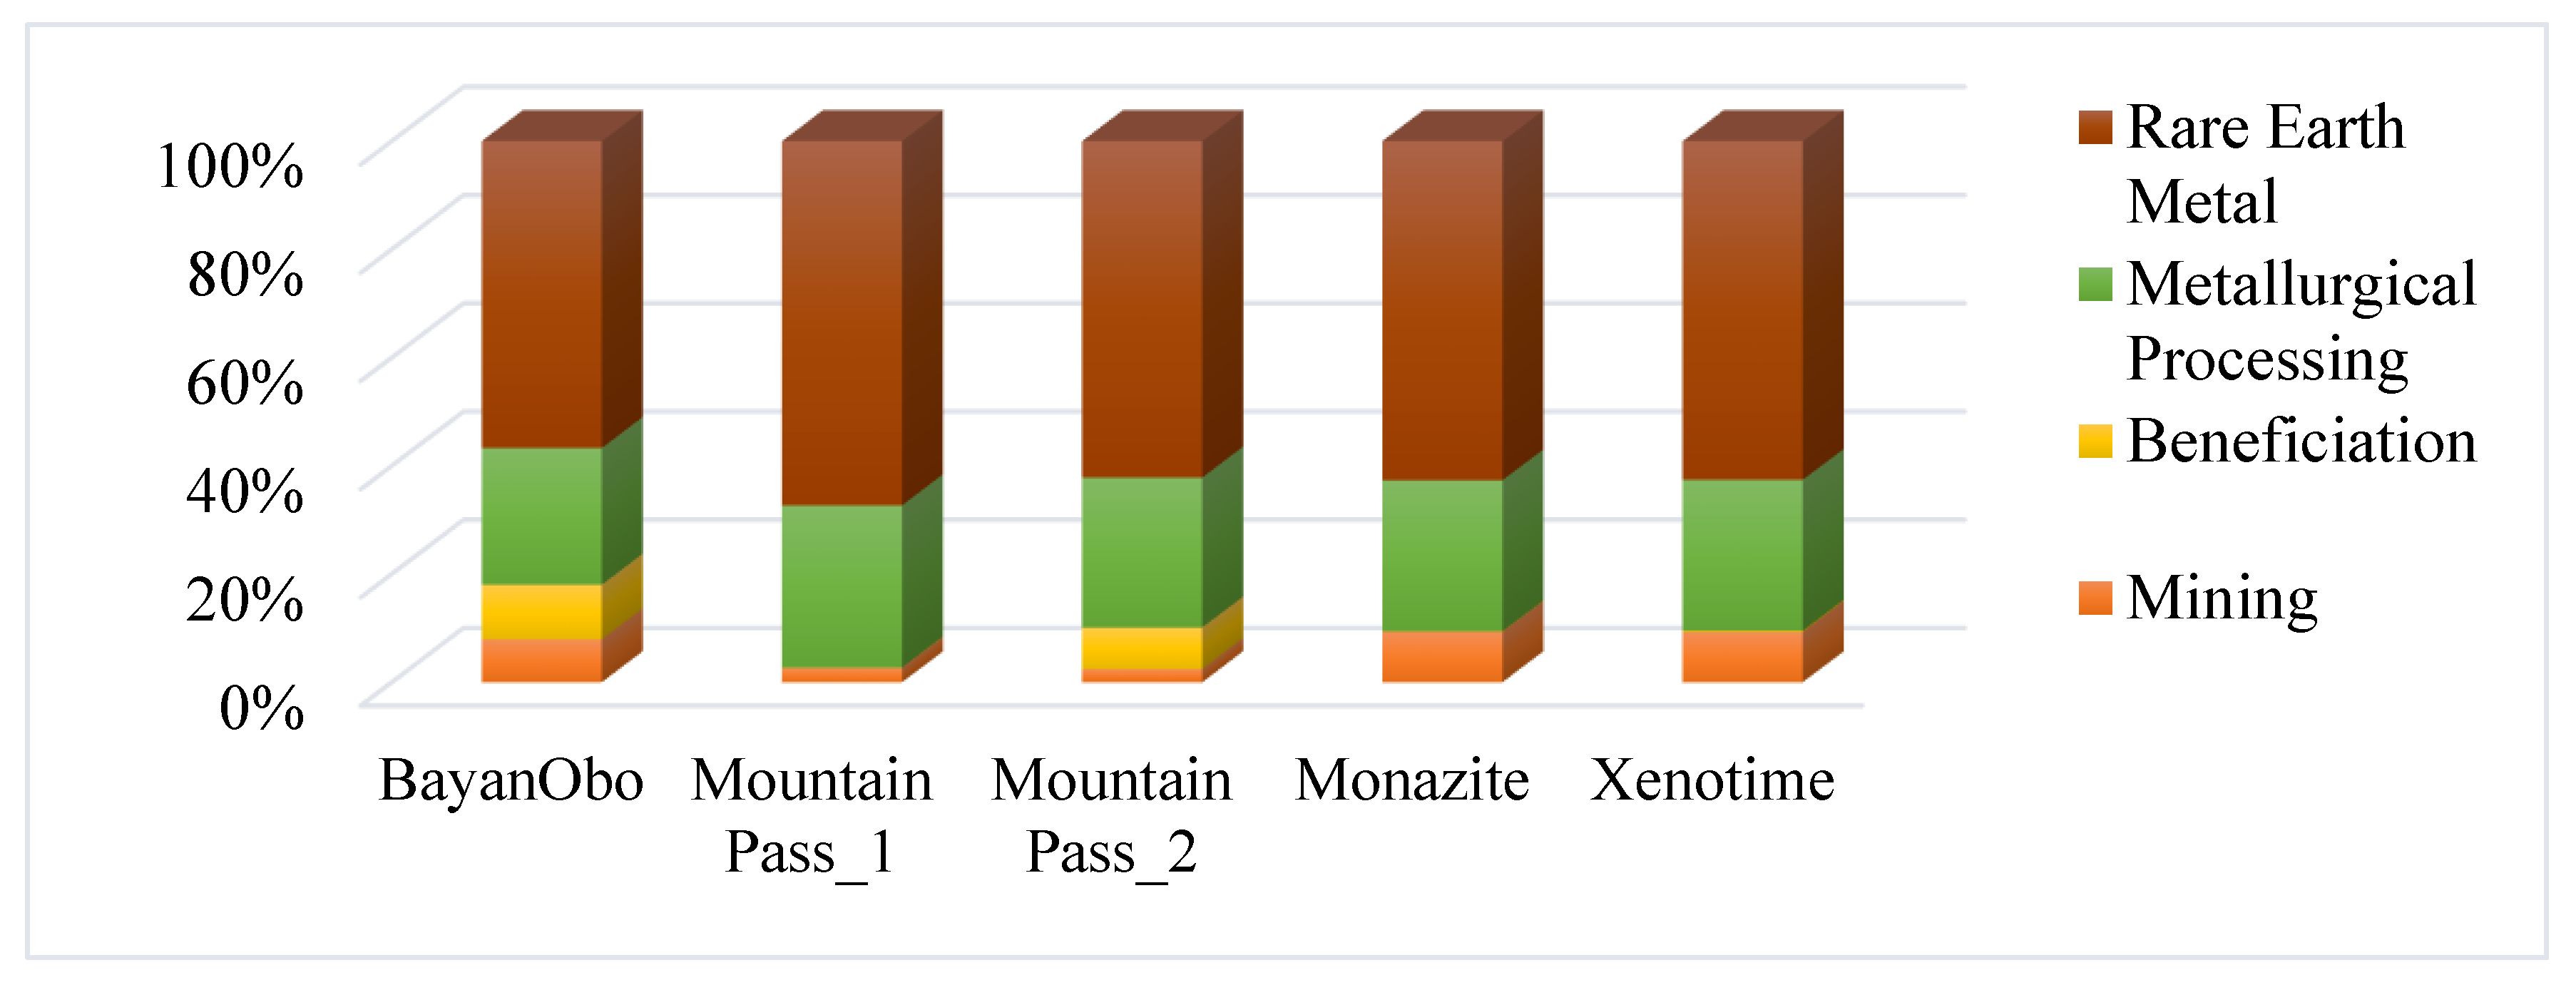
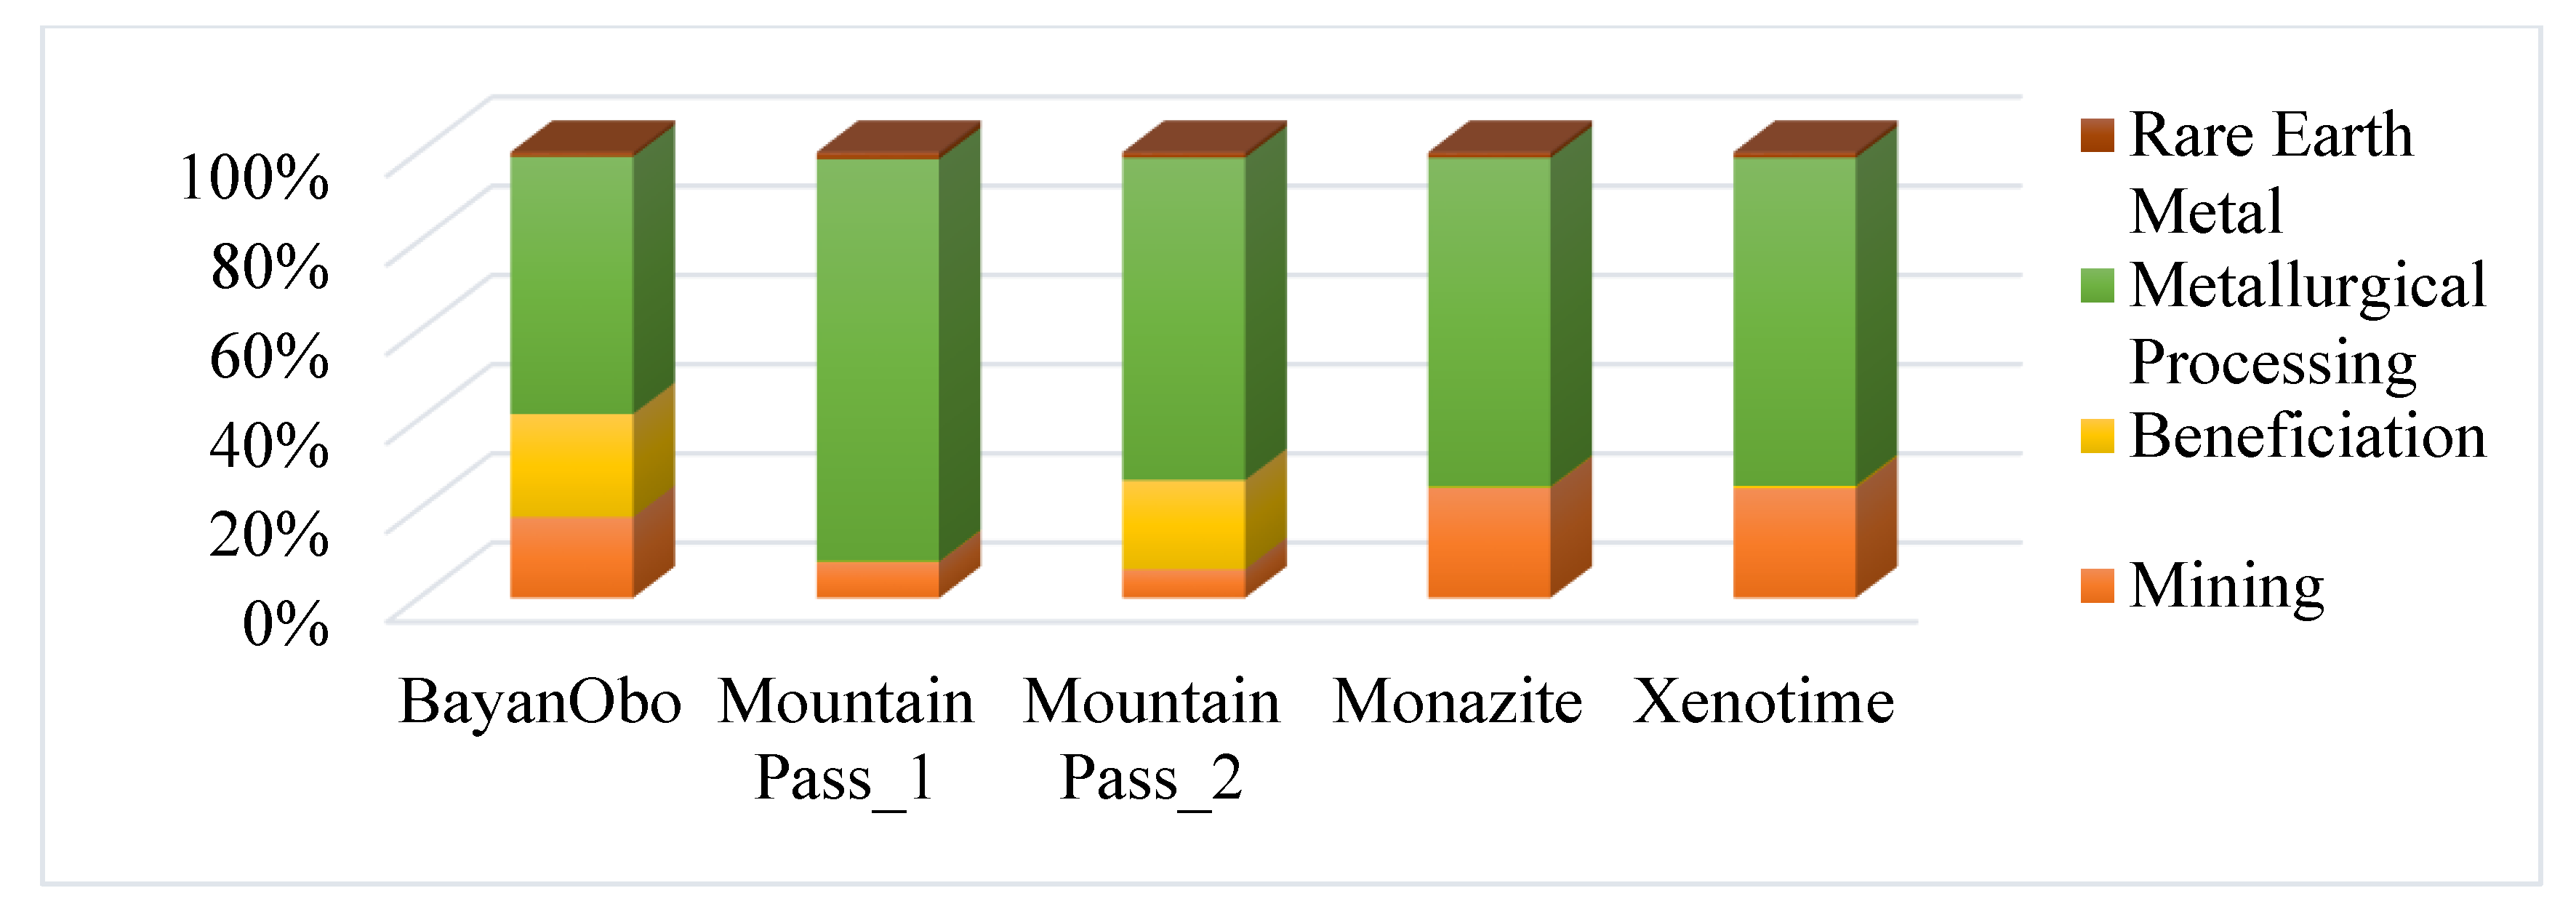
4. Analysis of Energy Consumption and Opportunities for Reduction

The total EC (KJ/Ton of REE oxide, metal) in a plant operation is the cumulative sum of the individual EC function units, as represented in Equation (11).
E C C u m u l a t i v e   = E C M i n i n g + E C B e n e f i c i a t i o n   + E C M e t a l l u r g i c a l   P r o c e s s i n g  

4.1. Data Analysis of the Literature Concerning the EC per Ton of REE Metal Produced

Based on the theoretical energy consumption values, as per the literature [15], the analysis of the EC, per ton of REE metal produced, is presented in Figure 7 and Figure 8. Most of the EC in metal production occurs due to electrolysis operations. However, the EC can be reduced by replacing the operations with metallothermic reductions (*the EC calculation was performed using on the theoretical estimate for Ce production). Based on these figures, the mineralogy of the ore deposit significantly impacted EC. During the beneficiation stage for Bastnaesite ore (Bayan Obo and Mountain Pass), the EC was higher due to its high grade, and the fact that it comprised significantly more unit operations than the Xenotime and Monazite ores. Moreover, the selection of unit operations in a functional unit is related to the EC values. This is evident in the graph where the MountainPass_1 has the Moly Corp process implemented within the beneficiation stage; here, the EC is relatively low compared with MountainPass_2 and the Goldschmidt process [15]. Further analysis of Figure 8 shows that the metallurgical processing stage contributes to a larger share of the EC (*the process assumed here is SX). These inferences in the data suggest that some major or minor modifications in the functional unit operation or the subunit can cause the EC to vary by 10–50%.

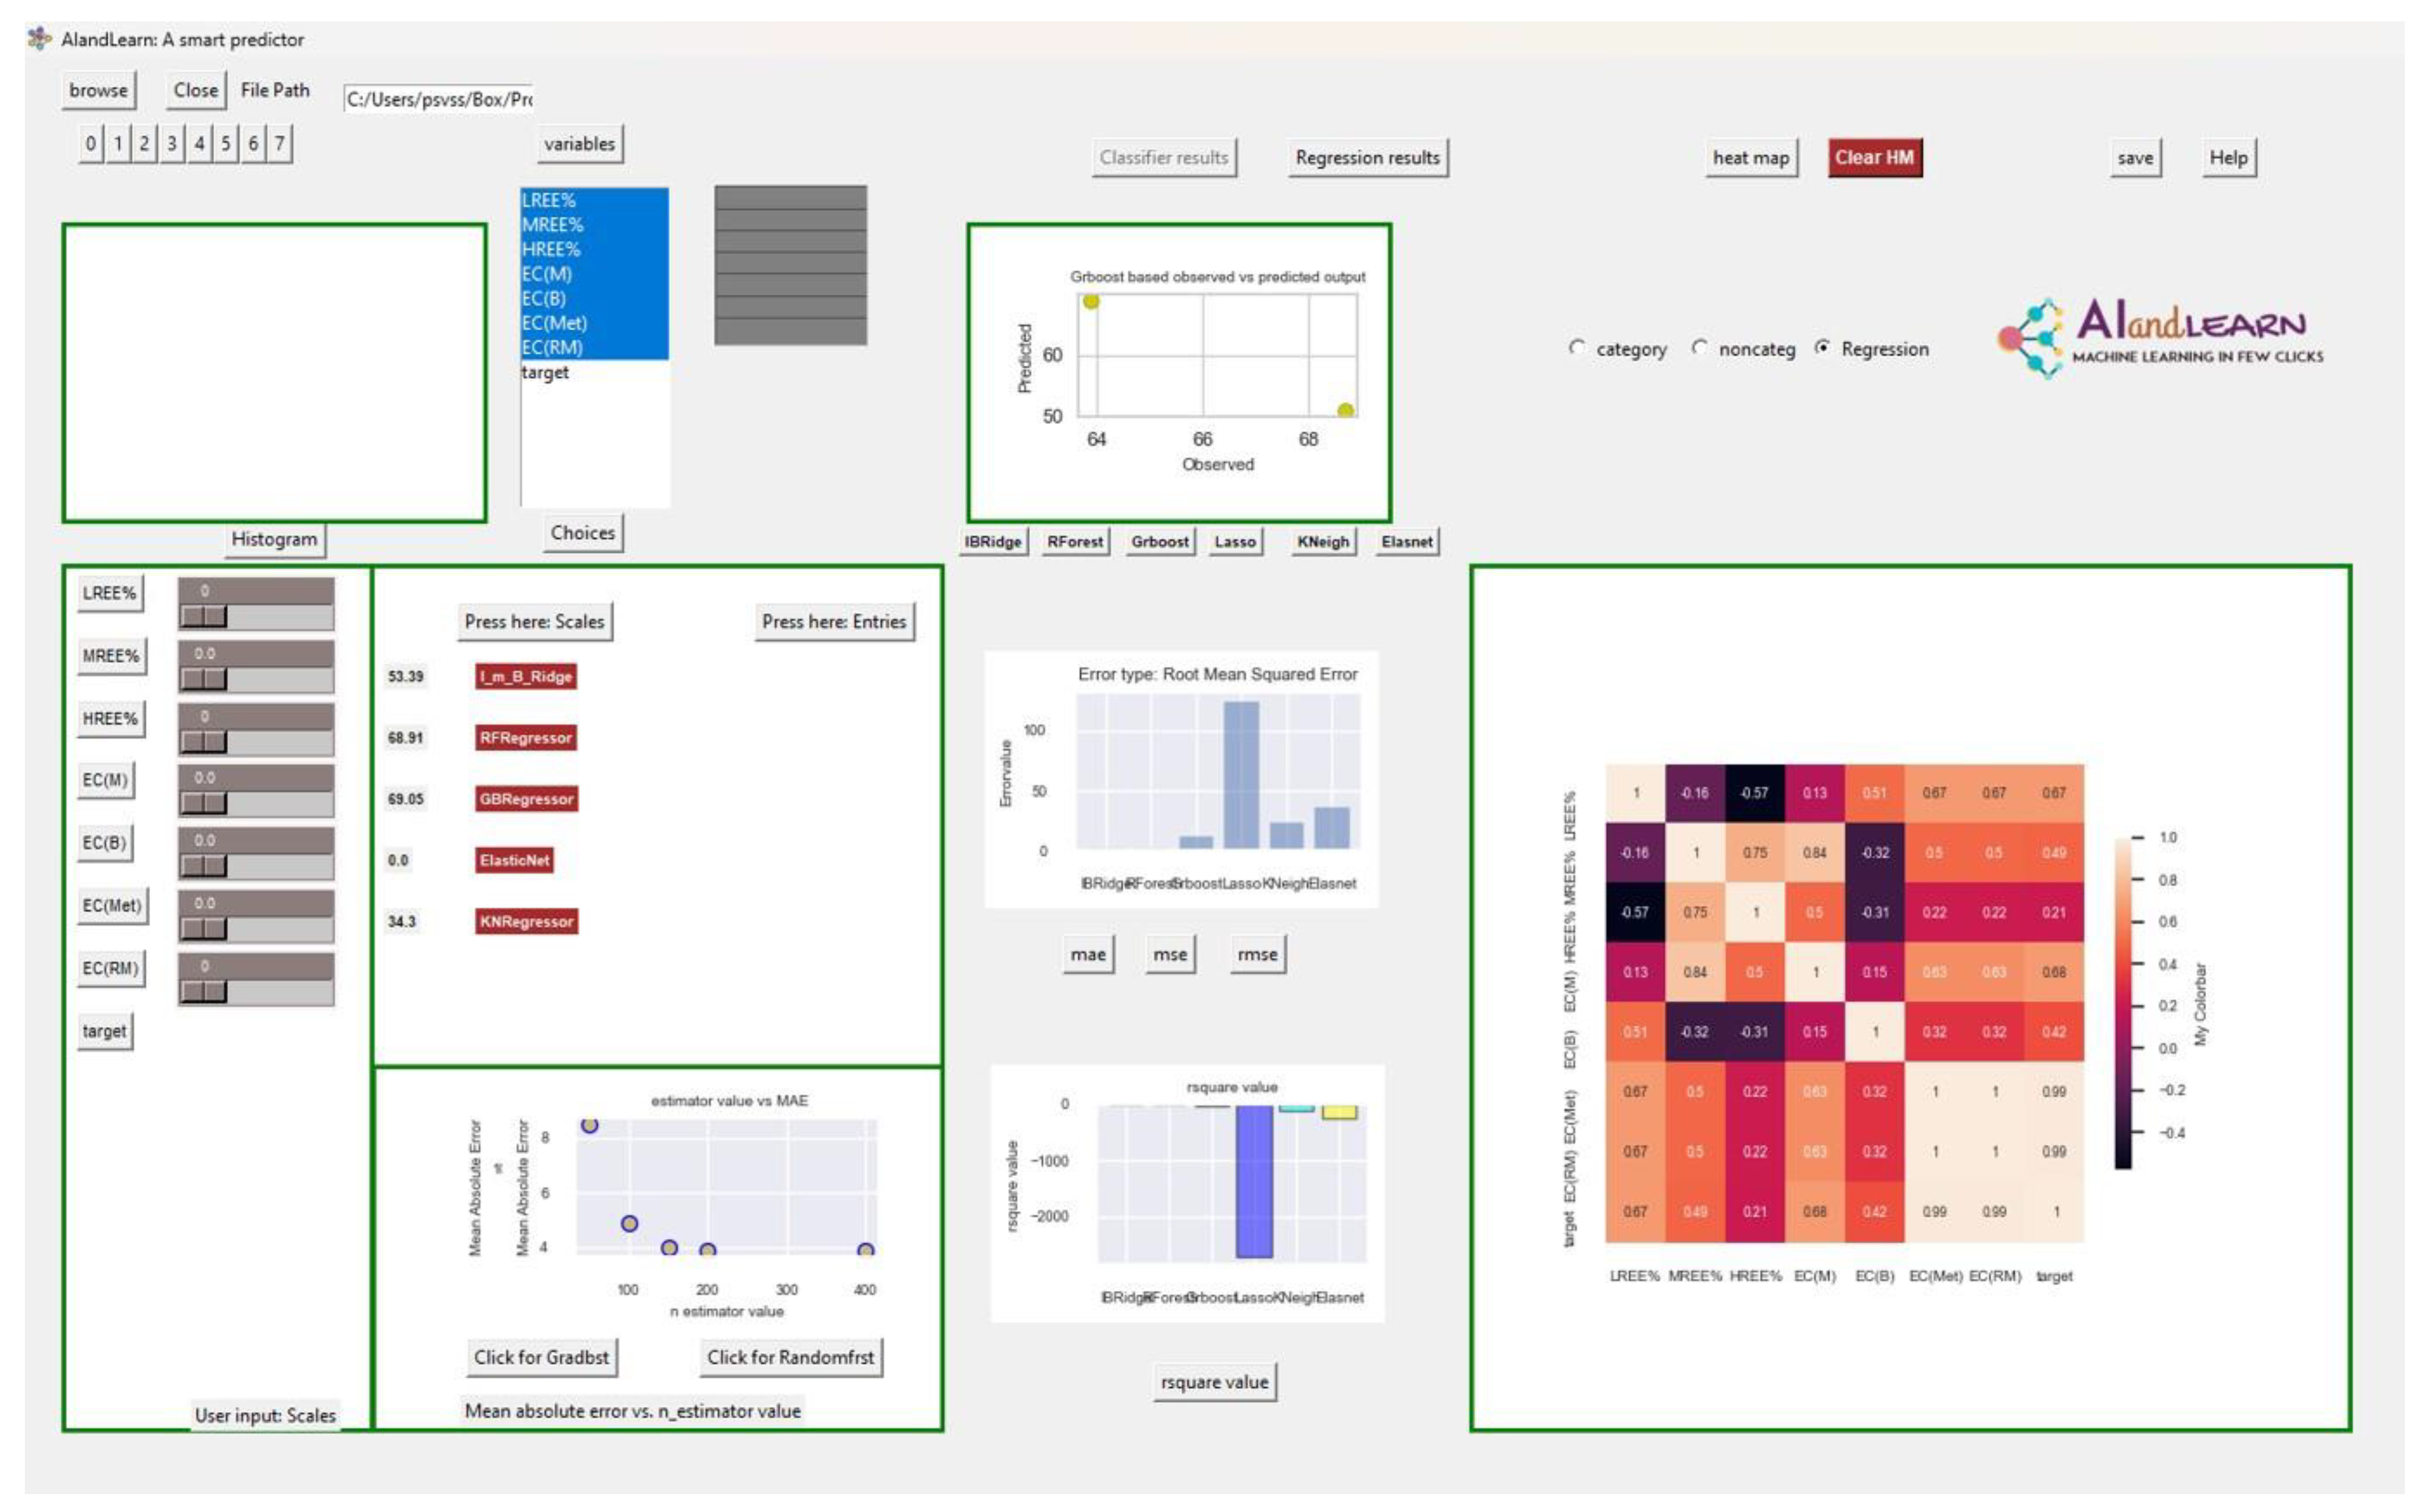
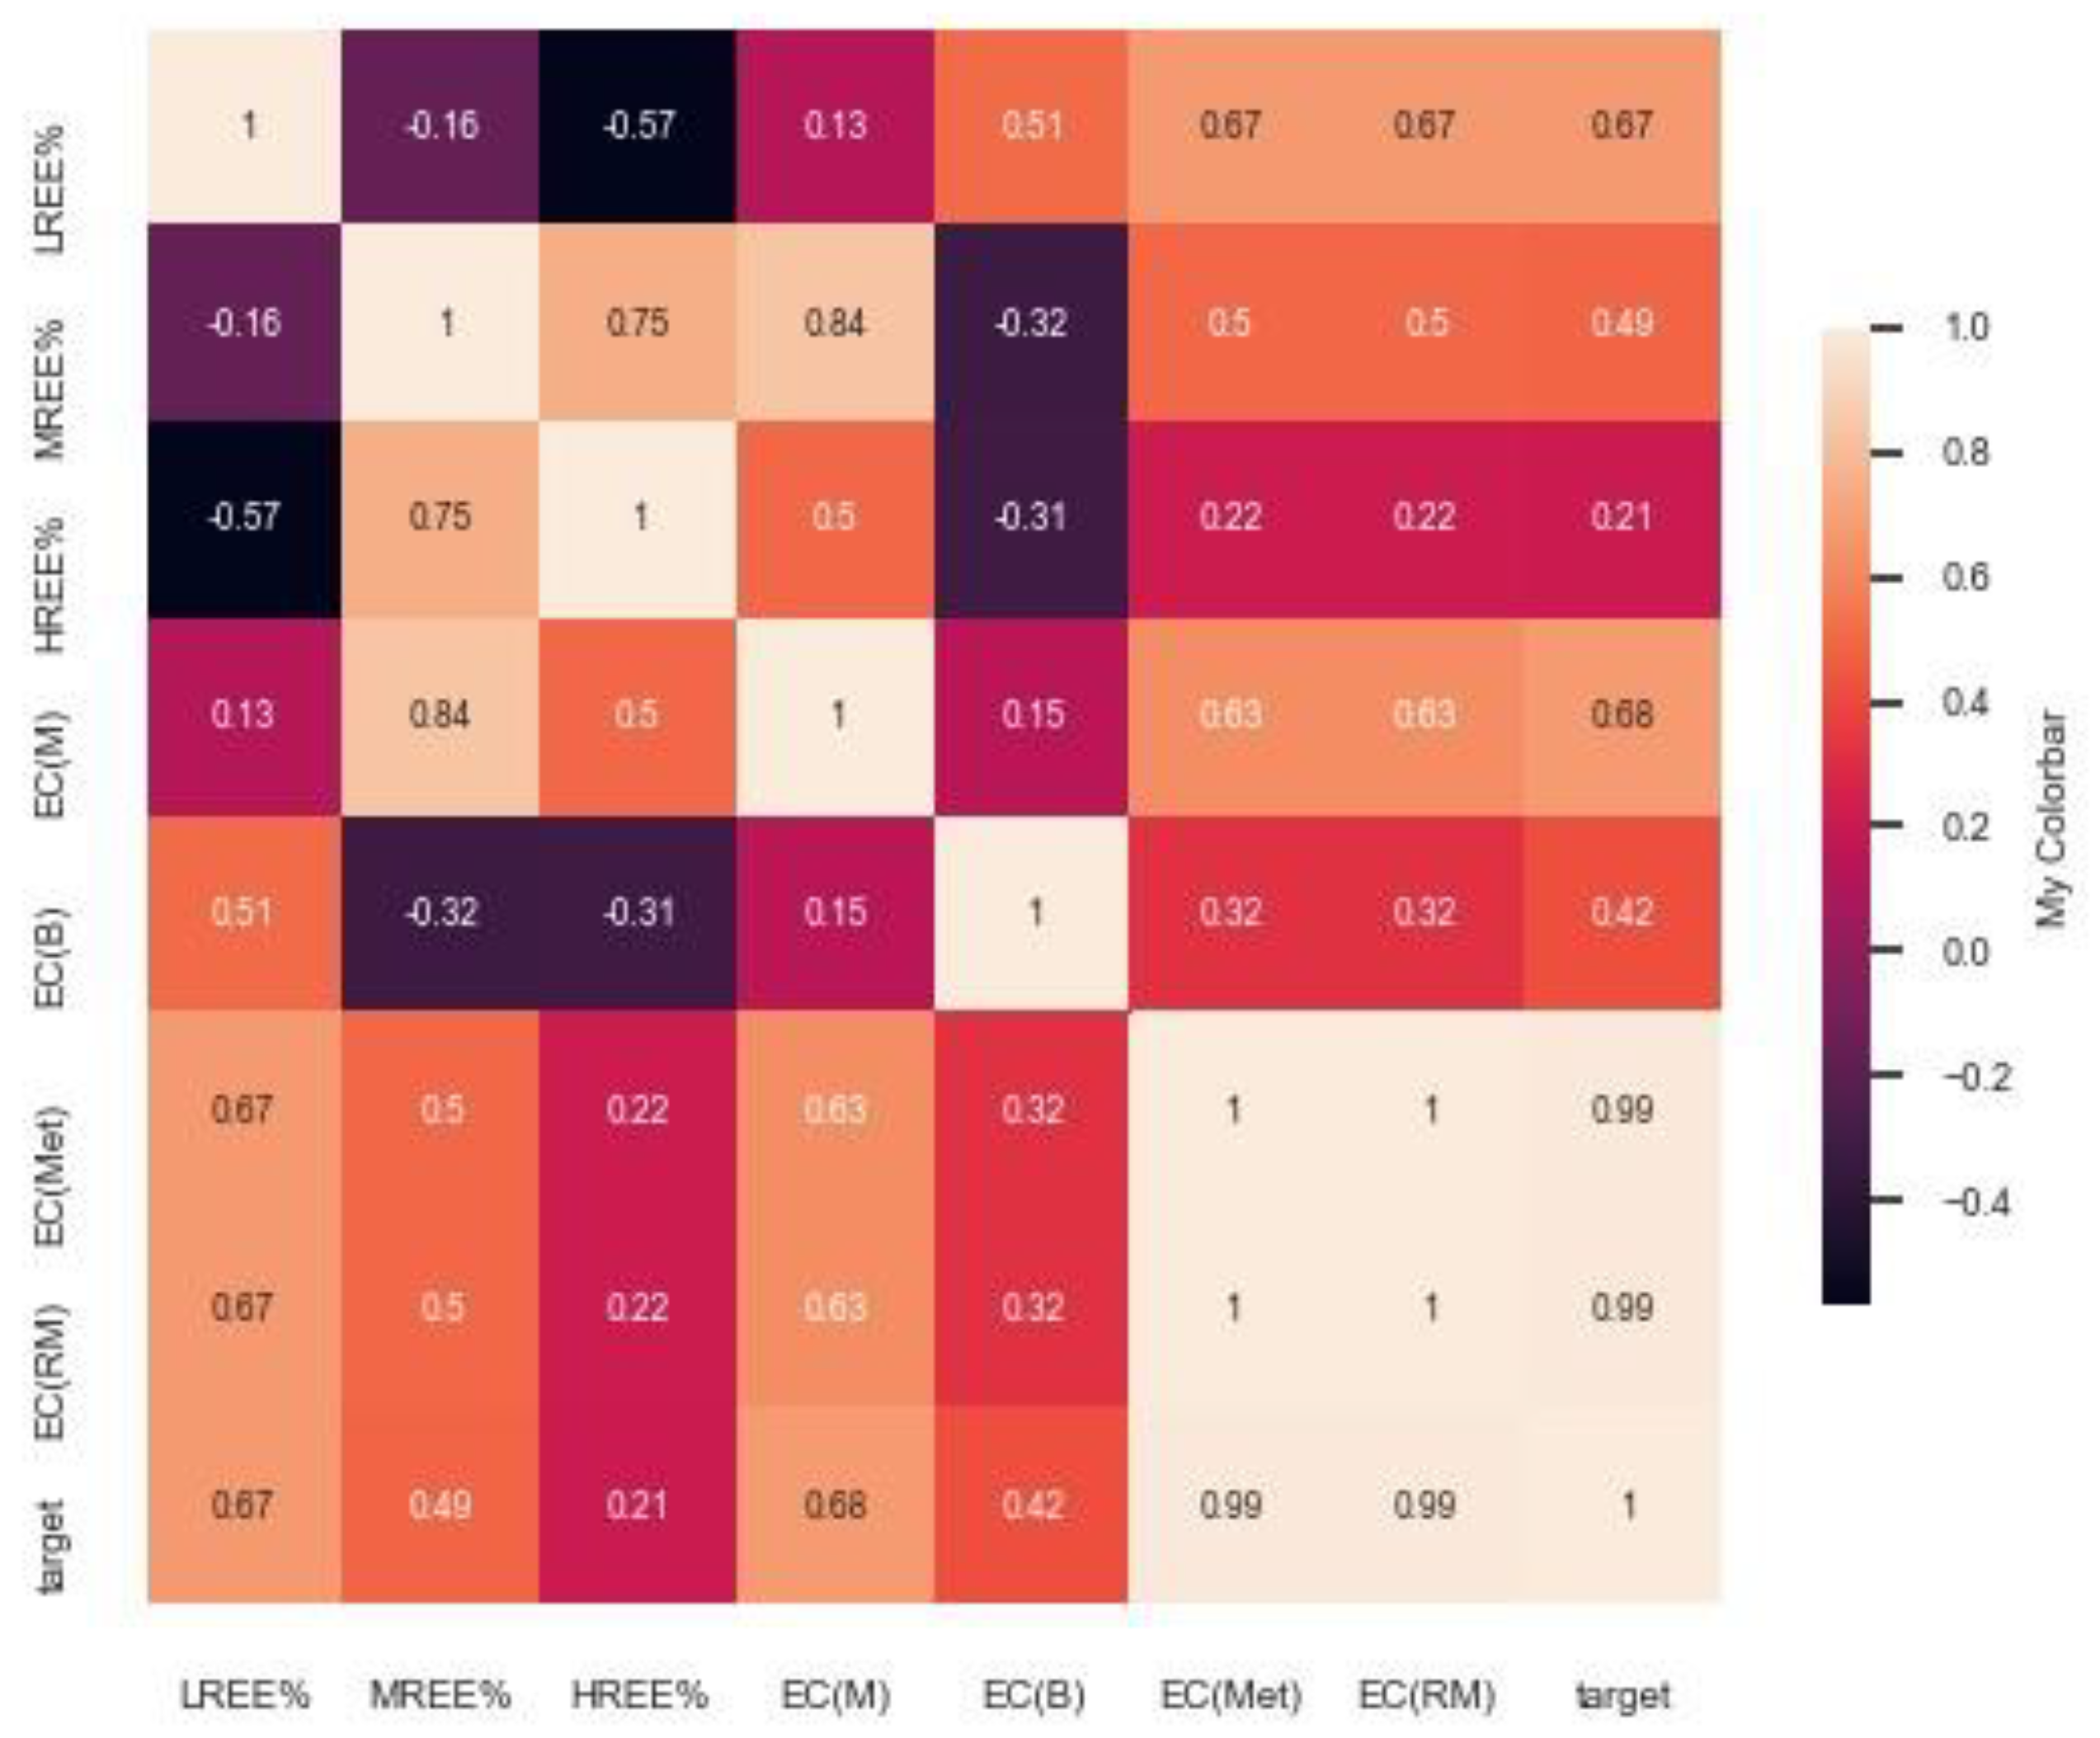
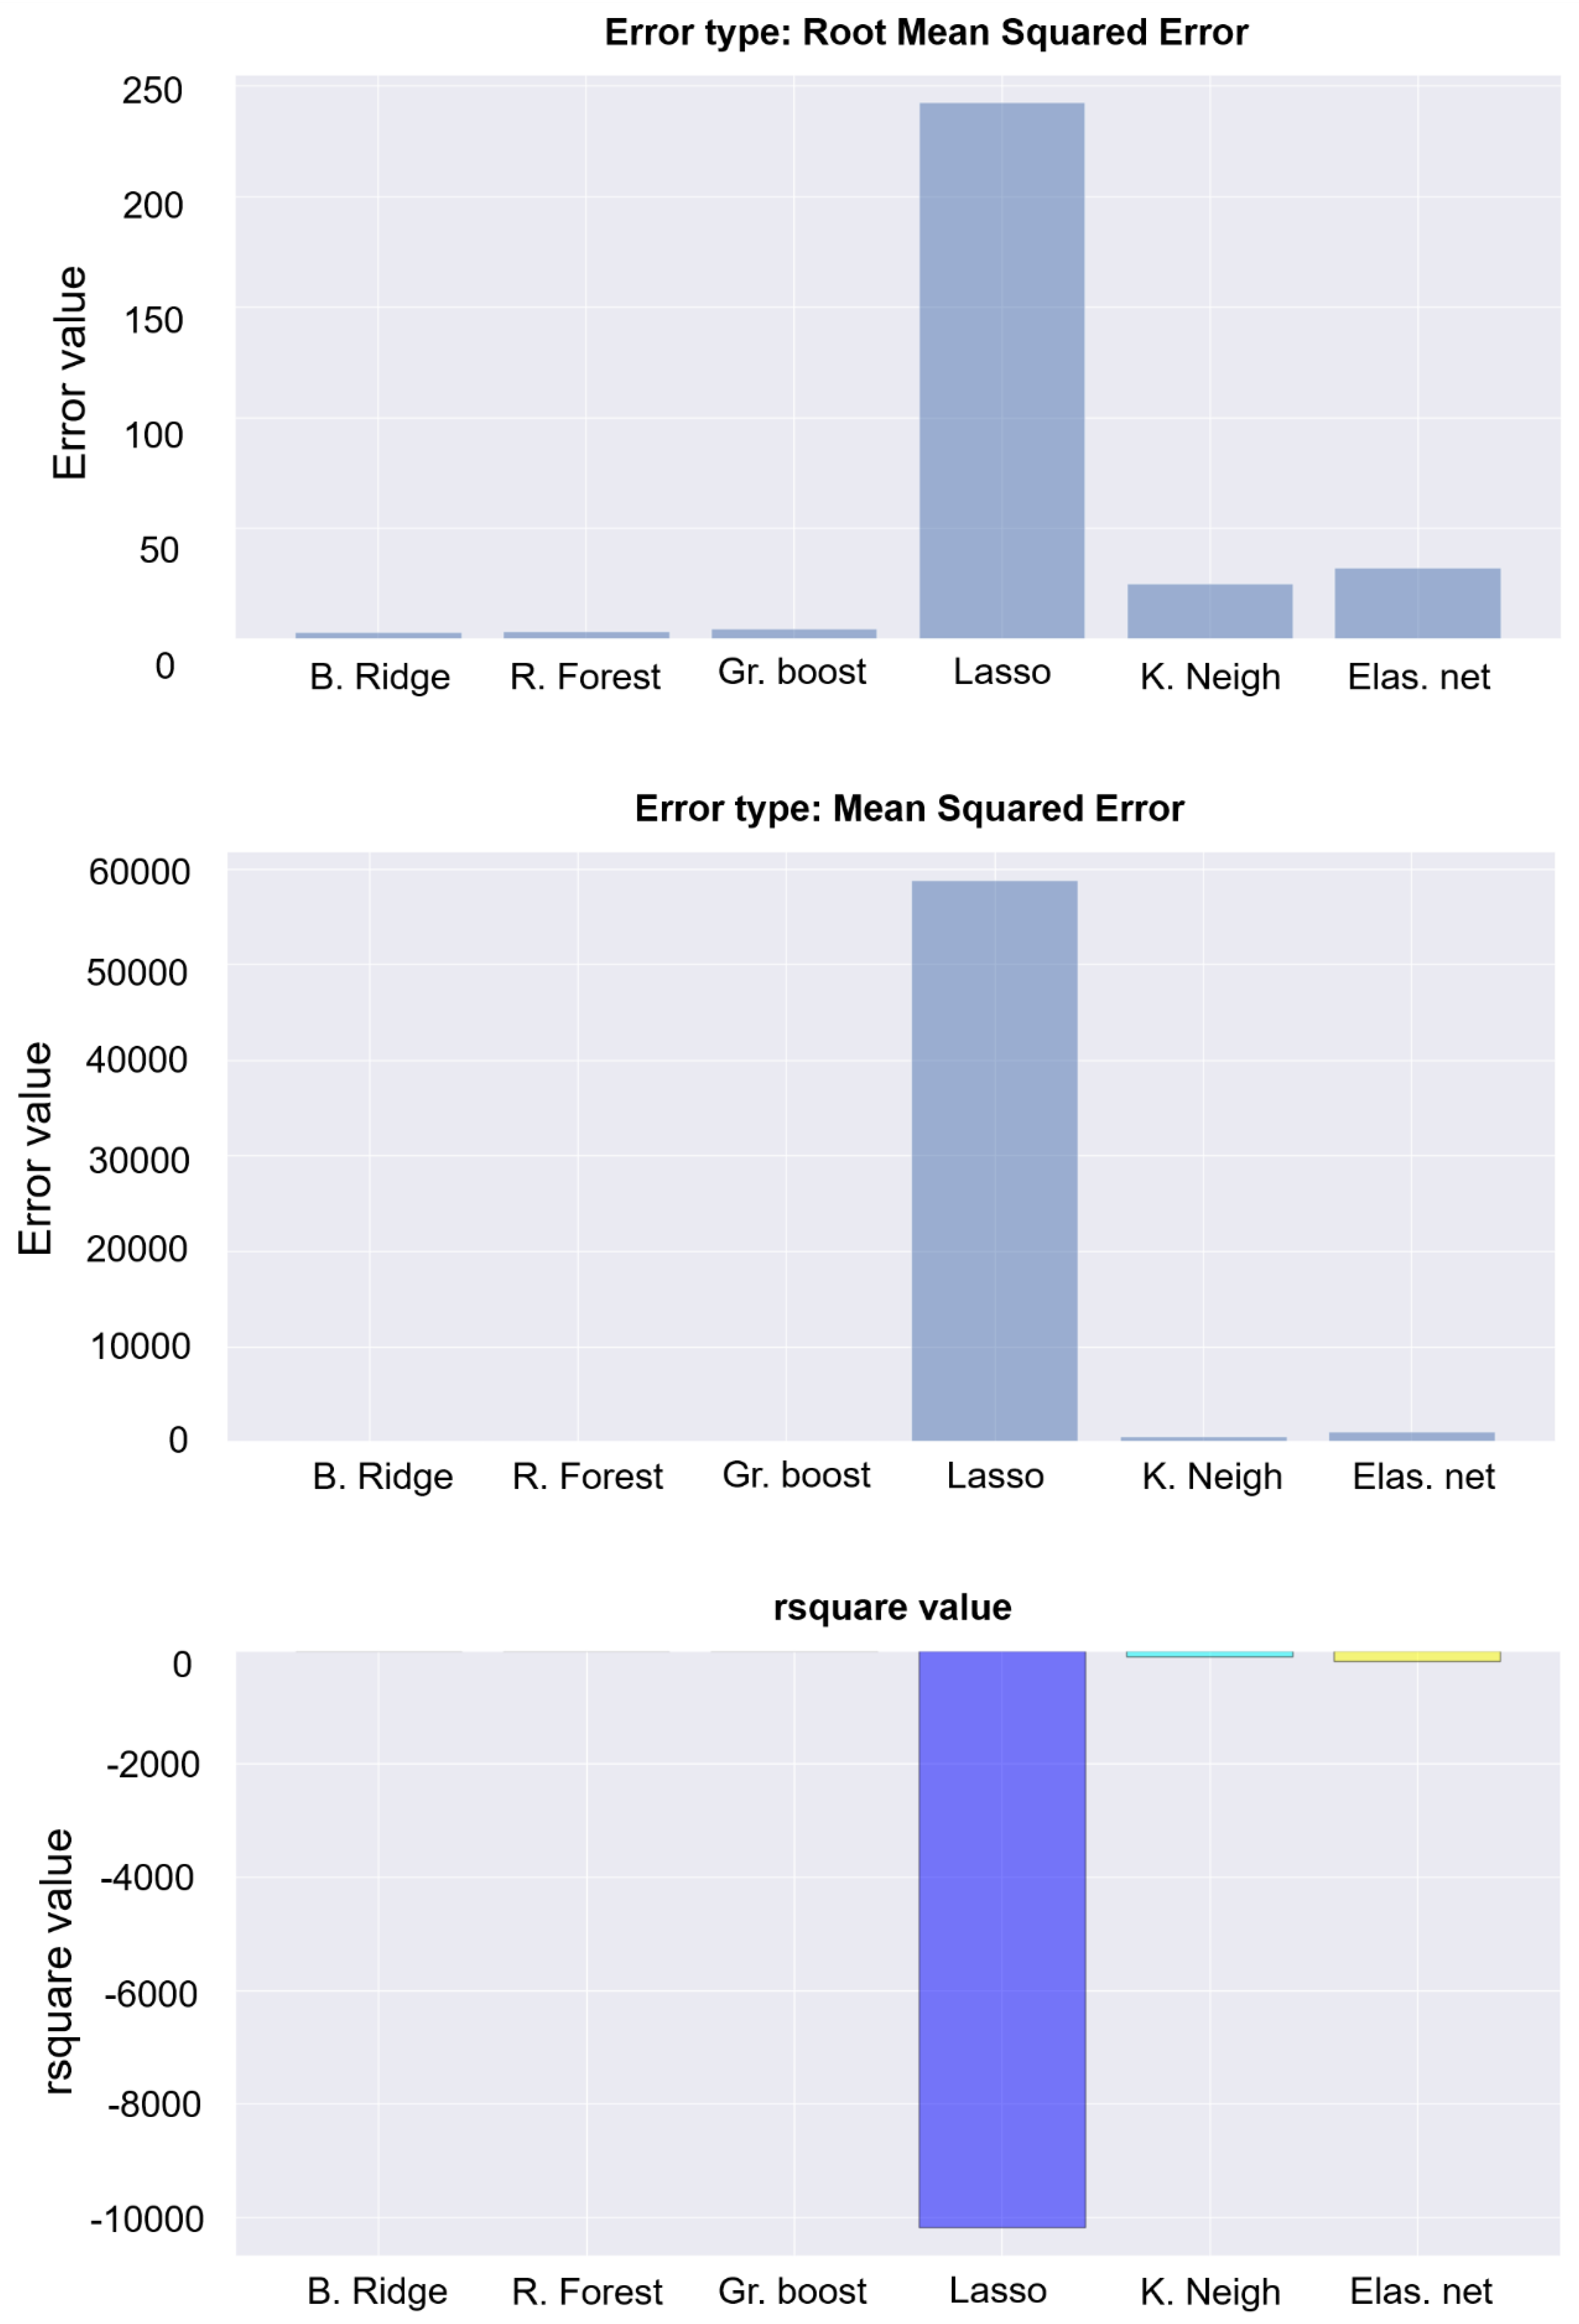
4.2. Prediction of EC for Secondary Sources Using an AI/ML-Based Approach

The AI/ML-based methodology is a new regression-based prediction. This process eases the flowsheet design and validation aspect, as these factors can be considered engineer-driven strategies. The integration of the AI/ML approach into the conventional empirical equation aided in generating a (normalized) dimensionless scale of outputs, which is shown in Table 4. Furthermore, understanding the selection of the particular process flowsheets that can be implemented during commercial production was made significantly more accessible. Another helpful aspect of flowsheet validation was the predicted output, which helped the operations set and defined the threshold EC, thus aligning the subprocess of major sections, as discussed in Section 3. The output generated was performed after several iterations, and the validation of those values was based on root mean squared error, mean squared error and r-squared values. The specific reason why AIandLearn software was used for this approach is that it can handle multiple variables (up to 13) to produce output. Moreover, it provides a holistic comparison of multiple models in a single interface, in addition to a heatmap, in order to help us better understand the correlation between the several factors in the dataset that were used for training the model.
The dataset used in Section 3.1 and Section 4.1 (*as shown in Figure 7) were visualized using AIandLearn software, as shown in Figure 9. The model was trained to produce a linear regression output to understand each parameter’s dependency on the target (Net EC). Details of the +/− correlation between various inputs are presented as a heatmap in Figure 10, and the root mean squared error (not same as Standard deviation), mean squared error (Sum of variance), and r-squared value are presented in Figure 11. Figure 11 suggests that the error and r-squared values were better for the Bayesian Ridge regression model than for the Random Forest, Gradient Boosting regressor, Lasso, KNeighbour regressor, and Elastic net. Therefore, this model was used for further analysis. The EC scales for the secondary sources were predicted based on the inputs of the REEs distribution, as per Figure 4, for the Coal Ash/Mine and Mill tailings, where ECMining was assumed to be 0.5 times the primary source, ECBeneficiation was assumed to be 1.5 times the primary source, and ECMetallurgical processing was assumed to be similar to that of the primary source. The net EC’s AI/ML-based prediction estimates for primary and secondary sources were almost similar, as shown in Table 4. The comparison seems rational since the Bastnasite processing routes were almost the same. Table 4 shows the scale of the Net EC value when this secondary feed source was processed through the Bastnasite route. However, this prediction is only valid if the same feed grades exist for primary and secondary sources, otherwise, it is generally invalid. This type of prediction is assumed to be logical because it supports the fact, as discussed earlier, that any slight modification in the unit operation will modify the net EC by a factor of 0.05–0.3 on a normalized scale. Additionally, it can be inferred that variation in feed grades will undoubtedly impact the EC, and a significant reduction in feed grade will surely raise the EC demand.

4.3. Perspectives on Opportunities for Energy Reduction

Based on the estimation above, the low-grade REEs deposits (<1%), such as IAC/mine/mill tailings, used for conventional mining and processing, require large volumes of material and often involve a great deal of comminution energy to liberate particles unless other techniques are used. The EC for low-grade ore scenarios can be reduced by extensively utilizing alternative approaches such as blunging and bioleaching techniques [67,68,69,70,71]. Innovative beneficiation and alternative processing can reduce the overall EC. Applying energy-efficient separation processes, such as A, MB, and IX, can also reduce the EC in metallurgical processing. These operations require less process equipment, thereby reducing the EC. These processes can be implemented as auxiliary processes, or they can replace some SX stages. In addition, ore blending or geo-metallurgical knowledge of ore bodies can help operations to be more consistent at the plant, thus reducing EC caused by variations.

5. Conclusions

In conclusion, rare earth elements are critical minerals that are essential for sustainable energy development. The global shift towards renewable energy sources has heightened the demand for REEs, especially in technologies that reduce carbon emissions. Notably, the application of REEs in NdFeB permanent magnets, which are crucial components of wind turbines and electric vehicle motors, underscores their significance in terms of creating decarbonized technologies. The diverse sources of REEs, ranging from ores to recycled materials, result in varied production processes and energy requirements. Despite the extensive literature on the life cycle assessment of REEs, there is a notable gap in terms of understanding the specific energy footprint associated with different production processes. This paper aims to address this gap by delving into the distinct energy needs of each production process, providing valuable insights into the viability of REE production in terms of energy demand and availability. We have provided a step-by-step calculation methodology, in addition to an explanation of the reasonable impact of a few parameters, to calculate the energy needs. Thus, we have provided a more effective comparison of energy use, which is also directly linked to the carbon footprint, concerning overall REE processing.

Author Contributions

Conceptualization, S.V.S.H.P. and P.K.S.; methodology, S.V.S.H.P. and P.K.S.; formal analysis, R.S.S., M.L.F. and P.K.S.; investigation, S.V.S.H.P. and R.S.S.; resources, M.L.F. and P.K.S.; data curation, S.V.S.H.P. and R.S.S.; writing—original draft preparation, S.V.S.H.P. and R.S.S.; writing—review and editing, P.K.S. and M.L.F.; visualization, P.K.S. and M.L.F.; supervision, P.K.S. and M.L.F.; project administration, M.L.F. and P.K.S.; funding acquisition, M.L.F. and P.K.S. All authors have read and agreed to the published version of the manuscript.

Funding

This research received no external funding.

Data Availability Statement

The data presented in this study are available on request from the authors.

Conflicts of Interest

The authors declare no conflict of interest.

References

  1. Gupta, C.K.; Krishnamurthy, N. Extractive metallurgy of rare earths. Int. Mater. Rev. 1992, 37, 197–248. [Google Scholar] [CrossRef]
  2. Pathapati, S.V.S.H.; Free, M.L.; Sarswat, P.K. A Comparative Study on Recent Developments for Individual Rare Earth Elements Separation. Processes 2023, 11, 2070. [Google Scholar] [CrossRef]
  3. Preinfalk, C.; Morteani, G. The Industrial Applications of Rare Earth Elements. In Lanthanides, Tantalum and Niobium: Mineralogy, Geochemistry, Characteristics of Primary Ore Deposits, Prospecting, Processing and Applications Proceedings of a workshop in Berlin, November; Springer: Berlin/Heidelberg, Germany, 1989; pp. 359–370. [Google Scholar] [CrossRef]
  4. Vaughan, J.; Gontijo, V.L.; Valenta, R.; Alonso, E. Rare earth element sources, end-use demand trends, and hydrometallurgical separations. In Proceedings of the 26th World Mining Congress, Brisbane, Australia, 26–29 June 2023; pp. 713–723. [Google Scholar]
  5. Cardoso, C.E.D.; Almeida, J.C.; Lopes, C.B.; Trindade, T.; Vale, C.; Pereira, E. Recovery of rare earth elements by carbon-based nanomaterials—A review. Nanomaterials 2019, 9, 1–35. [Google Scholar] [CrossRef] [PubMed]
  6. Available online: https://css.umich.edu/publications/factsheets/material-resources/critical-materials-factsheet (accessed on 23 November 2023).
  7. Wall, F. Rare Earth Elements. In Encyclopedia of Geology; Elsevier: Amsterdam, The Netherlands, 2021; pp. 680–693. [Google Scholar] [CrossRef]
  8. Julapong, P.; Numprasanthai, A.; Tangwattananukul, L.; Juntarasakul, O.; Srichonphaisarn, P.; Aikawa, K.; Park, I.; Ito, M.; Tabelin, C.B.; Phengsaart, T. Rare Earth Elements Recovery from Primary and Secondary Resources Using Flotation: A Systematic Review. Appl. Sci. 2023, 13, 8364. [Google Scholar] [CrossRef]
  9. Balaram, V. Rare earth elements: A review of applications, occurrence, exploration, analysis, recycling, and environmental impact. Geosci. Front. 2019, 10, 1285–1303. [Google Scholar] [CrossRef]
  10. Fujita, Y.; McCall, S.K.; Ginosar, D. Recycling rare earths: Perspectives and recent advances. MRS Bull. 2022, 47, 283–288. [Google Scholar] [CrossRef]
  11. Gaustad, G.; Williams, E.; Leader, A. Rare earth metals from secondary sources: Review of potential supply from waste and byproducts. Resour. Conserv. Recycl. 2021, 167, 105213. [Google Scholar] [CrossRef]
  12. Weng, Z.; Haque, N.; Mudd, G.M.; Jowitt, S.M. Assessing the energy requirements and global warming potential of the production of rare earth elements. J. Clean. Prod. 2016, 139, 1282–1297. [Google Scholar] [CrossRef]
  13. Broussaud, A.; Barbery, G. Applications of Energy Analysis to Mineral and Metallurgical Process Selection and Development. Int. J. Miner. Process. 1978, 5, 93–105. [Google Scholar] [CrossRef]
  14. Hale, R.W. Energy Use Patterns in Metallurgical and Nonmetallic Mineral Processing; Battelle Columbus Laboratories for US Bureau of Mines: Columbus, OH, USA, 1976. [Google Scholar]
  15. Talens, P.L.; Villalba Méndez, G. Material and energy requirement for rare earth production. JOM 2013, 65, 1327–1340. [Google Scholar] [CrossRef]
  16. Zaimes, G.G.; Hubler, B.J.; Wang, S.; Khanna, V. Environmental life cycle perspective on rare earth oxide production. ACS Sustain. Chem. Eng. 2015, 3, 237–244. [Google Scholar] [CrossRef]
  17. Vahidi, E.; Navarro, J.; Zhao, F. An initial life cycle assessment of rare earth oxides production from ion-adsorption clays. Resour. Conserv. Recycl. 2016, 113, 1–11. [Google Scholar]
  18. Deng, H.; Kendall, A. Life cycle assessment with primary data on heavy rare earth oxides from ion-adsorption clays. Int. J. Life Cycle Assess. 2019, 24, 1643–1652. [Google Scholar] [CrossRef]
  19. Grzesik, K.; Kossakowska, K.; Bieda, B.; Kozakiewicz, R. Screening Life Cycle Assessment of beneficiation processes for Rare Earth Elements recovery from secondary sources. IOP Conf. Ser. Earth Environ. Sci. 2019, 214, 012068. [Google Scholar] [CrossRef]
  20. Kossakowska, K.; Grzesik, K. The significance of energy consumption in environmental impact of rare earth elements recovery from tailings and mining waste. E3S Web Conf. 2019, 108, 02011. [Google Scholar] [CrossRef]
  21. Yang, D.; Gao, S.; Hong, J.; Ye, L.; Ma, X.; Qi, C.; Li, X. Life cycle assessment of rare earths recovery from waste fluorescent powders—A case study in China. Waste Manag. 2019, 99, 60–70. [Google Scholar] [CrossRef]
  22. Schreiber, A.; Marx, J.; Zapp, P. Life Cycle Assessment studies of rare earths production—Findings from a systematic review. Sci. Total Environ. 2021, 791, 148257. [Google Scholar] [CrossRef]
  23. Navarro, J.; Zhao, F. Life-cycle assessment of the production of rare-earth elements for energy applications: A review. Front. Energy Res. 2014, 2, 45. [Google Scholar] [CrossRef]
  24. Guyonnet, D.; Planchon, M.; Rollat, A.; Escalon, V.; Tuduri, J.; Charles, N.; Vaxelaire, S.; Dubois, D.; Fargier, H. Material flow analysis applied to rare earth elements in Europe. J. Clean. Prod. 2015, 107, 215–228. [Google Scholar] [CrossRef]
  25. Das, S.; Gaustad, G.; Sekar, A.; Williams, E. Techno-economic analysis of supercritical extraction of rare earth elements from coal ash. J. Clean. Prod. 2018, 189, 539–551. [Google Scholar] [CrossRef]
  26. Gupta, C.K.; Krishnamurthy, N. Extractive Metallurgy of Rare Earths, 2nd ed.; CRC Press: Boca Raton, FL, USA, 2005. [Google Scholar] [CrossRef]
  27. Norgate, T.; Haque, N. Energy and greenhouse gas impacts of mining and mineral processing operations. J. Clean. Prod. 2010, 18, 266–274. [Google Scholar] [CrossRef]
  28. Wills, B.A.; Finch, J.A. Wills’ Mineral Processing Technology; Elsevier: Amsterdam, The Netherlands, 2016. [Google Scholar] [CrossRef]
  29. Jeswiet, J.; Szekeres, A. Energy Consumption in Mining Comminution. Procedia CIRP 2016, 48, 140–145. [Google Scholar] [CrossRef]
  30. Sunil, S.R.; Rayapudi, V.; Dhawan, N. Recovery of Iron Values from Discarded Iron Ore Slimes. Min. Metall Explor. 2020, 37, 287–295. [Google Scholar] [CrossRef]
  31. Free, M.L. Hydrometallurgy; Springer International Publishing: Cham, Switzerland, 2022. [Google Scholar] [CrossRef]
  32. Iftekhar, S.; Srivastava, V.; Hammouda, S.B.e.n.; Sillanpää, M. Fabrication of novel metal ion imprinted xanthan gum-layered double hydroxide nanocomposite for adsorption of rare earth elements. Carbohydr. Polym. 2018, 194, 274–284. [Google Scholar] [CrossRef] [PubMed]
  33. Liu, E.; Dai, J.; Wang, Y.; Li, C.; Yan, Y. Fabrication of phosphate functionalized chiral nematic mesoporous silica films for the efficient and selective adsorption of lanthanum ions. J. Mol. Liq. 2019, 277, 786–793. [Google Scholar] [CrossRef]
  34. Ravi, S.; Lee, Y.-R.; Yu, K.; Ahn, J.-W.; Ahn, W.-S. Benzene triamido-tetraphosphonic acid immobilized on mesoporous silica for adsorption of Nd3+ ions in aqueous solution. Microporous Mesoporous Mater. 2018, 258, 62–71. [Google Scholar] [CrossRef]
  35. Zheng, X.; Liu, E.; Zhang, F.; Dai, J.; Yan, Y. Selective adsorption and separation of gadolinium with three-dimensionally interconnected macroporous imprinted chitosan films. Cellulose 2017, 24, 977–988. [Google Scholar] [CrossRef]
  36. Asadollahzadeh, M.; Torkaman, R.; Torab-Mostaedi, M.; Hemmati, A.; Ghaemi, A. High performance separation of gadolinium from samarium with the imidazolium ionic liquid through selective complexation of organophosphorus extractants. Environ. Technol. Innov. 2020, 19, 100979. [Google Scholar] [CrossRef]
  37. Biju, V.M.; Gladis, J.M.; Rao, T.P. Effect of γ-irradiation of ion imprinted polymer (IIP) particles for the preconcentrative separation of dysprosium from other selected lanthanides. Talanta 2003, 60, 747–754. [Google Scholar] [CrossRef]
  38. Liu, E.; Xu, X.; Zheng, X.; Zhang, F.; Liu, E.; Li, C. An ion imprinted macroporous chitosan membrane for efficiently selective adsorption of dysprosium. Sep. Purif. Technol. 2017, 189, 288–295. [Google Scholar] [CrossRef]
  39. Ramakrishnan, K.; Prasada Rao, T. Ion imprinted polymer solid phase extraction (IIP-SPE) for preconcentrative separation of erbium(III) from adjacent lanthanides and yttrium. Sep. Sci. Technol. 2006, 41, 233–246. [Google Scholar] [CrossRef]
  40. Kubra, K.T.; Hasan, M.; Hasan, N.; Salman, S.; Khaleque, A.; Sheikh, C.; Rehan, A.I.; Rasee, A.I.; Waliullah, R.M.; Awual, E.; et al. The heavy lanthanide of Thulium(III) separation and recovery using specific ligand-based facial composite adsorbent. Colloids Surf. A Physicochem. Eng. Asp. 2023, 667, 131415. [Google Scholar] [CrossRef]
  41. Zhao, Z.; Zhao, Z.; Baba, Y.; Kubota, F.; Kamiya, N.; Goto, M. Synergistic extraction of rare-earth metals and separation of scandium using 2-thenoyltrifluoroacetone and tri-n-octylphosphine oxide in an ionic liquid system. J. Chem. Eng. Jpn. 2014, 47, 656–662. [Google Scholar] [CrossRef]
  42. Sengupta, A.; Mohapatra, P.K.; Kadam, R.M.; Manna, D.; Ghanty, T.K.; Iqbal, M.; Huskensc, J.; Verboomc, W. Diglycolamide-functionalized task specific ionic liquids for nuclear waste remediation: Extraction, luminescence, theoretical and EPR investigations. RSC Adv. 2014, 4, 46613–46623. [Google Scholar] [CrossRef]
  43. Matsumiya, M.; Nomizu, D.; Tsuchida, Y.; Sasaki, Y. Separation of rare earth elements by synergistic solvent extraction with phosphonium-based ionic liquids using a β-diketone extractant and a neutral ligand. Solvent Extr. Ion Exch. 2021, 39, 764–784. [Google Scholar] [CrossRef]
  44. Xing, L.; Ma, X.; Hu, K.; Yuan, H.; Wei, J.; Gao, H.; Nie, Y. Selective separation of Nd from La/Ce/Pr using phosphate-based ionic liquids: Solvent extraction studies and density functional theory. Miner. Eng. 2023, 191, 107967. [Google Scholar] [CrossRef]
  45. Chen, Y.; Wang, H.; Pei, Y.; Ren, J.; Wang, J. PH-Controlled Selective Separation of Neodymium (III) and Samarium (III) from Transition Metals with Carboxyl-Functionalized Ionic Liquids. ACS Sustain. Chem. Eng. 2015, 3, 3167–3174. [Google Scholar] [CrossRef]
  46. Mishra, B.B.; Devi, N. Solvent extraction and separation of europium (III) using a phosphonium ionic liquid and an organophosphorus extractant—A comparative study. J. Mol. Liq. 2018, 271, 389–396. [Google Scholar] [CrossRef]
  47. Abreu, R.D.; Morais, C.A. Study on separation of heavy rare earth elements by solvent extraction with organophosphorus acids and amine reagents. Miner. Eng. 2014, 61, 82–87. [Google Scholar] [CrossRef]
  48. Zeng, Z.; Su, X.; Gao, Y.; Yu, G.; Ni, S.; Su, J.; Sun, X. Separation of lutetium using a novel bifunctional ionic liquid based on phosphonate functionalization. Sep. Purif. Technol. 2021, 264, 118439. [Google Scholar] [CrossRef]
  49. Hamaguchi, H.; Ohuchi, A.; Onuma, N.; Kuroda, R. Anion exchange behavior of rare earth elements in potassium sulfate medium. J. Chromatogr. A 1964, 16, 396–402. [Google Scholar] [CrossRef]
  50. Hamaguchi, H.; Ohuchi, A.; Shimizu, T.; Onuma, N.; Kuroda, R. Separation of Scandium from Yttrium, Rare Earths, Thorium, Zirconium, Uranium, and Other Elements by Anion Exchange Chromatography in Ammonium Sulfate Media. Anal. Chem. 1964, 36, 2304–2306. [Google Scholar] [CrossRef]
  51. Rychkov, V.N.; Kirillov, E.V.; Kirillov, S.V.; Bunkov, G.M.; Mashkovtsev, M.A.; Botalov, M.S.; Semenishchev, V.S.; Volkovich, V.A. Selective ion exchange recovery of rare earth elements from uranium mining solutions. AIP Conf. Proc. 2016, 1767, 020017. [Google Scholar]
  52. El-Dessouky, S.I.; El-Sofany, E.A.; Daoud, J.A. Studies on the sorption of praseodymium (III), holmium (III) and cobalt (II) from nitrate medium using TVEX-PHOR resin. J. Hazard. Mater. 2007, 143, 17–23. [Google Scholar] [CrossRef] [PubMed]
  53. Cherkasov, R.A.; Garifzyanov, A.R.; Galeev, R.R.; Kurnosova, N.V.; Davletshin, R.R. Membrane transport of metal ions with lipophilic aminomethylphosphine oxides. Russ. J. Gen. Chem. 2011, 81, 1464–1469. [Google Scholar] [CrossRef]
  54. Kunthakudee, N.; Sunsandee, N.; Pancharoen, U.; Ramakul, P. Separation of yttrium from rare earth using hollow fiber-supported liquid membrane: Factorial design analysis. Desalination Water Treat. 2016, 57, 3985–3994. [Google Scholar] [CrossRef]
  55. Li, L.; Yu, B.; Davis, K.; King, A.; Dal-Cin, M.; Nicalek, A.; Du, N. Separation of Neodymium (III) and Lanthanum (III) via a Flat Sheet-Supported Liquid Membrane with Different Extractant-Acid Systems. Membranes 2022, 12, 1197. [Google Scholar] [CrossRef] [PubMed]
  56. Wannachod, T.; Leepipatpiboon, N.; Pancharoen, U.; Nootong, K. Separation and mass transport of Nd(III) from mixed rare earths via hollow fiber supported liquid membrane: Experiment and modeling. Chem. Eng. J. 2014, 248, 158–167. [Google Scholar] [CrossRef]
  57. Wannachod, T.; Leepipatpiboon, N.; Pancharoen, U.; Nootong, K. Synergistic effect of various neutral donors in D2EHPA for selective neodymium separation from lanthanide series via HFSLM. J. Ind. Eng. Chem. 2014, 20, 4152–4162. [Google Scholar] [CrossRef]
  58. Moreno, C.; Valiente, M. Studies on the mechanism of transport of lanthanide ions through supported liquid membranes containing di-(2-ethylhexyl) phosphoric acid (D2EHPA) as a carrier. J. Membr. Sci. 1999, 155, 155–162. [Google Scholar] [CrossRef]
  59. Kenichi Akiba, K.; Hashimoto, H.; Nakamura, S.; Saito, Y. Mutual separation of holmium, erbium, and yttrium by high-speed countercurrent chromatography. J. Liq. Chromatogr. 1995, 18, 2723–2741. [Google Scholar] [CrossRef]
  60. Kubota, F.; Kakoi, T.; Goto, M.; Furusaki, S.; Nakashio, F.; Hano, T. Permeation behavior of rare earth metals with a calix [4]arene carboxyl derivative in a hollow-fiber membrane. J. Membr. Sci. 2000, 165, 149–158. [Google Scholar] [CrossRef]
  61. Wang, Y.; Chen, L.; Yan, Y.; Chen, J.; Dai, J.; Dai, X. Separation of adjacent heavy rare earth Lutetium (III) and Ytterbium (III) by task-specific ionic liquid Cyphos IL 104 embedded polymer inclusion membrane. J. Membr. Sci. 2020, 610, 118263. [Google Scholar] [CrossRef]
  62. Croft, C.F.; Almeida, M.I.G.S.; Cattrall, R.W.; Kolev, S.D. Separation of lanthanum (III), gadolinium (III) and ytterbium (III) from sulfuric acid solutions by using a polymer inclusion membrane. J. Membr. Sci. 2018, 545, 259–265. [Google Scholar] [CrossRef]
  63. Chen, L.; Chen, J. Asymmetric Membrane Containing Ionic Liquid [A336][P507] for the Preconcentration and Separation of Heavy Rare Earth Lutetium. ACS Sustain. Chem. Eng. 2016, 4, 2644–2650. [Google Scholar] [CrossRef]
  64. Gaikwad, A.G. Behavior of the transport and separation of lanthanum, yttrium and lutetium metal ions through a celluose fiber supported solid membrane. Maced. J. Chem. Chem. Eng. 2012, 31, 255–269. [Google Scholar] [CrossRef]
  65. Yang, P.; Zhuang, Q.; Li, Y.; Gu, J. Green separation of rare earth elements by valence-selective crystallization of MOFs. Chem. Commun. 2019, 55, 14902–14905. [Google Scholar] [CrossRef]
  66. Dybczyński, R.S.; Kulisa, K.; Pyszynska, M.; Bojanowska-Czajka, A. New reversed phase-high performance liquid chromatographic method for selective separation of yttrium from all rare earth elements employing nitrilotriacetate complexes in anion exchange mode. J. Chromatogr. A 2015, 1386, 74–80. [Google Scholar] [CrossRef]
  67. Zhang, Z.; Allen, L.; Podder, P.; Free, M.L.; Sarswat, P.K. Recovery and enhanced upgrading of rare earth elements from coal-based resources: Bioleaching and precipitation. Minerals 2021, 11, 484. [Google Scholar] [CrossRef]
  68. Noble, A.; Tech, V. Development of a Cost-Effective Extraction Process for the Recovery of Heavy and Critical Rare Earth Elements from the Clays and Shales Associated with Coal; Virginia Polytechnic Institute and State University: Blacksburg, VA, USA, 2020. [Google Scholar]
  69. Sarswat, P.K.; Leake, M.; Allen, L.; Free, M.L.; Hu, X.; Kim, D.; Noble, A.; Luttrell, G.H. Efficient recovery of rare earth elements from coal based resources: A bioleaching approach. Mater. Today Chem. 2020, 16, 100246. [Google Scholar] [CrossRef]
  70. Azimi, G.; Forsberg, K.; Ouchi, T.; Kim, H.; Alam, S.; Baba, A.A. Rare Metal Technology 2020; Springer International Publishing: Cham, Switzerland, 2021. [Google Scholar] [CrossRef]
  71. Sarswat, P.K.; Podder, P.; Zhang, Z.; Free, M.L. Autogenous acid production using a regulated bio-oxidation method for economical recovery of REEs and critical metals from coal-based resources. Appl. Surf. Sci. Adv. 2022, 11, 100283. [Google Scholar] [CrossRef]
Figure 1. Schematic diagram of conventional and urban processing.
Processes 12 00570 g001
Figure 2. System boundary for energy estimation.
Processes 12 00570 g002
Figure 3. Rare Earth Distribution across primary and secondary resources.
Processes 12 00570 g003
Figure 4. Segregation of REE% based on LREEs, medium REEs (MREE), and HREEs.
Processes 12 00570 g004
Figure 6. Flowsheet of the Metallurgical processing unit.
Processes 12 00570 g006
Figure 7. EC analysis for primary ore sources with electrolysis operations to produce RM.
Processes 12 00570 g007
Figure 8. EC analysis for primary ore sources with metallothermic reduction operations to produce RM.
Processes 12 00570 g008
Figure 9. Representation of the AIandLearn interface.
Processes 12 00570 g009
Figure 10. Heat Map analysis of the data from the literature.
Processes 12 00570 g010
Figure 11. Root Mean squared error (top), Mean squared error (middle), and r-squared value (bottom).
Processes 12 00570 g011
Table 1. Estimation of energy consumption at the mining unit.
FactorsQuantity NeededEquivalent EnergyNet Energy Consumption
Blasting Explosivea1 (Kg)e1 (KJ/Kg)a1 × e1
Diesela2 (gal)e2 (KJ/gal)a2 × e2
Electricitya3 (KWh)e3 (KJ/KWh)a3 × e3
Table 4. Prediction of EC scales using AIandLearn software.
Bayesian Ridge Model ScalesIdeal
Situation
Bastnasite (Bayan Obo)Bastnasite (Mountain Pass_1)Coal Ash
(Poland)
Coal Ash
(West
Virginia)
Gold Tailings
(New Kankberg)
Tungsten Tailings
(Covas)
Predicted Scales53.39142.06130.41141.68136.75144.14138.05
Normalized scales1.002.662.442.652.562.702.59
Disclaimer/Publisher’s Note: The statements, opinions and data contained in all publications are solely those of the individual author(s) and contributor(s) and not of MDPI and/or the editor(s). MDPI and/or the editor(s) disclaim responsibility for any injury to people or property resulting from any ideas, methods, instructions or products referred to in the content.

