
Risk Analysis of Wellbore Instability of “Felt Layer” in Qiudong Sag Based on Monte Carlo Method

1
National Engineering Research Center for Oil & Gas Drilling and Completion Technology, School of Petroleum Engineering, Yangtze University, Wuhan 430100, China
2
Hubei Provincial Key Laboratory of Oil and Gas Drilling and Production Engineering (Yangtze University), Wuhan 430100, China
3
PetroChina Tuha Oilfield Branch, Hami 839000, China
*
Author to whom correspondence should be addressed.
Processes 2024, 12(3), 578; https://doi.org/10.3390/pr12030578
Submission received: 31 January 2024
/
Revised: 11 March 2024
/
Accepted: 12 March 2024
/
Published: 14 March 2024
(This article belongs to the Section Chemical Processes and Systems)
Abstract
:Both domestic and international scholars have conducted in-depth research on wellbore stability issues. They have established various empirical models, analytical models, and numerical simulation methods. However, there is relatively little research on the impact of the uncertainty of input parameters on wellbore stability, and the understanding of this aspect remains unclear. To address this, this paper introduces a probability distribution method. It is based on a wellbore stability mechanical analytical model and, using reliability theory, establishes a method for evaluating wellbore instability risks. By employing the Monte Carlo random simulation method, this study investigates the sensitivity of input parameters to wellbore stability, clarifying that ground stress is the main controlling factor affecting wellbore stability. Combining the analysis of the “felt layer” ground stress profile, this study utilizes two-dimensional simulation experiments to validate the accurate determination of ground stress magnitude in wellbore stability analysis. It also examines the impact of reducing its uncertainty. The results show that this approach significantly reduces the risk of wellbore instability, addressing the challenging issue of identifying wellbore instability in the Qiu Dong Depression’s “felt layer” within the TH Basin.
1. Introduction
Wellbore instability is a challenging and complex issue in drilling engineering, often manifesting as collapses in the wellbore and fluid losses. Accurately controlling the wellbore pressure to be higher than the collapse pressure but lower than the fracture pressure can effectively prevent underground complexities and accidents such as blowouts, wellbore losses, well collapses, and stuck pipe incidents [1,2].
In the Qiu Dong Depression of the TH Basin, the Sankong River Formation is widely distributed, predominantly composed of lacustrine gray-green sandstone. The weathered surfaces resemble a green carpet, often referred to as the “felt layer”, and are buried at considerable depths. Due to the concealed and uncertain nature of the deep geological environment, there is significant fluctuation in the geological mechanical parameters. This leads to strong uncertainties in the geological mechanical parameters such as ground stress, pore pressure, and rock mechanics parameters. Therefore, studying the impact of the uncertainty of input parameters on wellbore stability is of significant importance. Uncertainty analysis methods mainly include reliability analyses, grey system methods, artificial intelligence methods, and others. Currently, the reliability theory based on probability analysis has become a trend in the computational analysis of wellbore stability. Within reliability analysis, the Monte Carlo method is widely adopted due to its advantages such as fewer limitations, more conservative calculation results, and strong adaptability. Ottesen et al. (1999) [3] introduced Quantitative Risk Assessment into petroleum and natural gas drilling engineering. Based on the principles of quantitative risk analysis, they considered a certain degree of wellbore collapse and studied the wellbore instability risks in both vertical and inclined wells. De Fontoura et al. (2002) [4] utilized three methods—a first-order second-moment analysis, a first-order reliability model, and statistical error analysis—to evaluate the impact of input parameter uncertainty on the stability of vertical wellbores. They compared their results with simulations using the Monte Carlo method. Mostafavi et al. (2011) [5] employed a stochastic simulation method to study the effects of wellbore diameter, drilling fluid density, and ground stress on wellbore stability. Udegbunam et al. (2014) [6] investigated the impact of input parameter uncertainty on the instability of vertical wellbores using two functions: triangular distribution and uniform distribution. They also conducted a sensitivity analysis using analytical methods. Gholami et al. (2015) [7] applied the Quantitative Risk Assessment (QRA) method to study the impact of input parameter uncertainty on the stability of vertical wellbores under different criteria, including Mohr–Coulomb, Modified Lade, and Hoek–Brown. Plazas et al. (2015) [8] applied reliability methods to assess the risk of wellbore instability in the Colombian Cretaceous formation. Kinik (2016) [9] employed the Quantitative Risk Assessment (QRA) method to study the probability density distribution of reliability under the influence of input parameter uncertainty for fracture pressure in vertical wells. They also considered the impact of temperature-induced effective stress. Zhang et al. (2012) [10] derived a reliability calculation formula for collapse pressure in vertical coalbed methane wells. They conducted a simulation study using the Hoek–Brown criterion, the Weibull distribution function, and the Monte Carlo method. Wei et al. (2014) [11] developed a method for identifying the instability zone in vertical wellbores and used the Monte Carlo method to determine the area of wellbore instability. Ma et al. (2019) [12], considering both the Mogi–Coulomb criterion and the impact of wellbore collapse, quantitatively evaluated the reliability of the safety density window in vertical wells using the Monte Carlo method. Zhang et al. (2019) [13] introduced weight coefficients to represent the influence of different strength criteria. They used the Analytic Hierarchy Process (AHP) to determine the weight coefficients and established a new model for the collaborative evaluation of wellbore stability in vertical wells based on different strength criteria. Furthermore, they conducted a detailed analysis of wellbore stability under parameter uncertainty. It can be observed that there is relatively limited research in China regarding the uncertainty of input parameters and its impact on wellbore stability analysis results. The specific influence of parameter uncertainty and sensitivity factors on wellbore stability analysis results is not yet clear. This indicates that further in-depth research is needed to enhance our understanding of these influences in this field. Therefore, based on a wellbore stability mechanical analytical model and utilizing reliability theory along with the Monte Carlo simulation method, the authors analyzed the impact of parameter uncertainty on wellbore stability. Through a quantitative assessment of the wellbore stability analysis model, they conducted an analysis of the influence of parameter uncertainty. The study identified ground stress as the main controlling factor affecting the reliability of wellbore stability. Combining the ground stress profile of the “felt layer”, they used a two-dimensional simulation experiment to clarify the accurate determination of ground stress magnitude and the reduction of its uncertainty in wellbore stability analysis. This approach significantly reduces the risk of wellbore instability, providing important guidance for the analysis of wellbore stability in the Qiu Dong Depression of the TH Basin with the “felt layer”.
2. Wellbore Stability Analysis Model
In the deep layers of a formation, rocks are subjected to overlying formation pressure, horizontal stress, and formation pore pressure. Before drilling a wellbore, the underground rocks are in a state of stress equilibrium. After drilling a wellbore, the pressure of the drilling fluid column inside the well replaces the original support of the drilled rocks on the wellbore walls, disrupting the original stress equilibrium in the formation. This leads to a redistribution of stress around the wellbore, causing instability in the wellbore walls. Wellbore instability mainly manifests in two forms: shear collapse of the wellbore walls (wellbore collapse) and tensile failure of the wellbore walls [14]. From a mechanical perspective, the primary cause of wellbore collapse is often attributed to the inadequate pressure exerted by the fluid column inside the well, leading to shear failure in the surrounding rocks as the stress exceeds the strength of the rocks [15,16,17].
2.1. Vertical Wellbore Wall Stress Distribution
In the wellbore cylindrical coordinate system , the stress at the wellbore wall can be obtained using the Kirsch equation, , and organized as derived in reference [18].
In the equation above, , , and represent the radial, tangential, and axial stresses at the wellbore, respectively, in MPa; , , and represent the maximum and minimum horizontal stresses and the overburden pressure, respectively, in MPa; represents the hydrostatic pressure of the wellbore fluid column in MPa; represents Poisson’s ratio; and represents the circumferential angle corresponding to any position on the wellbore wall, in radians.
2.2. Collapse Pressure Calculation Model
The selection of strength criteria is another crucial aspect in the calculation of wellbore collapse pressure. The most commonly used strength criteria include the Mohr–Coulomb criterion, Drucker–Prager criterion, and Hoek–Brown criterion. Practical experience has shown that for relatively hard rocks, the Mohr–Coulomb criterion yields reliable results. Here, the Mohr–Coulomb criterion is employed, which can be expressed as follows:
In the equation, and represent the maximum and minimum principal stresses, respectively, in MPa; represents the cohesion, in MPa; and represents the internal friction angle, in degrees.
Whether rock undergoes shear failure largely depends on the stress state it experiences. The greater the difference between the maximum and minimum principal stresses, the more likely wellbore collapse is to occur. In most cases, the maximum and minimum principal stresses at the wellbore are the tangential stress and radial stress, respectively. Therefore, whether wellbore collapse occurs mainly depends on the difference between the tangential stress () and the radial stress (). From Equation (1), it can be observed that when the azimuthal angle () is such that is maximized, the differential stress () at that location will reach its maximum value. This indicates that the critical point for wellbore collapse instability is located at , where the wellbore instability direction aligns with the direction of the minimum horizontal stress. If we consider the nonlinear characteristics of rocks and the pore pressure () acting in rock pores, the maximum and minimum effective stresses at the critical point of wellbore instability are as follows [2]:
In the equation above, represents Biot’s coefficient; represents the formation pore pressure, in MPa; represents the wellbore fluid column pressure, in MPa; and represents the stress nonlinearity correction factor, typically = 0.95.
Therefore, substituting Equation (3) into Equation (2), we obtain the collapse pressure calculation model:
In the equation above, represents the collapse pressure, in MPa; represents the maximum horizontal principal stress, in MPa; and represents the minimum horizontal principal stress, in MPa.
2.3. Fracture Pressure Calculation Model
Formation fracturing occurs due to the excessive density of drilling fluid inside the wellbore, causing the radial stress on the rock to reach the tensile strength of the rock. In other words,
In the equation above, represents the tensile strength of the rock, in MPa.
From Equation (1), it can be easily observed that when the wellbore pressure increases, the tangential stress decreases. When the wellbore pressure increases to a certain level, the tangential stress will become negative. This means that the radial stress on the rock changes from compressive stress to tensile stress. When the tensile stress is sufficient to overcome the tensile strength of the rock, the formation undergoes rupture, resulting in wellbore fractures. Fracture occurs at the location of the minimum tangential stress, specifically at the critical point where or . If we consider the pore pressure () acting in rock pores, the minimum effective stress at the critical point of wellbore fracture is given by
Therefore, substituting Equation (7) into Equation (6) yields the critical pressure value for fracturing the wellbore, which is the fracture pressure:
In the equation, represents the formation fracture pressure, in MPa.
3. Construction of Reliability Evaluation Method
3.1. Reliability Evaluation Method of Wellbore Instability Risk
According to reliability theory [19,20], the factors influencing wellbore instability are categorized into two comprehensive quantities, namely the load () and the resistance (). Here, k can take values C and F, representing wellbore collapse and fracture situations. The functional expression for wellbore instability can be represented as [21,22]
where is a random variable, and there are three possible scenarios based on the different magnitudes of loads and resistances:
- (1)
- : the structure satisfies functional requirements, indicating that the wellbore is in a stable state.
- (2)
- : the structure fails, leading to wellbore collapse or fracture.
- (3)
- : the structure is in a limit state, indicating that the wellbore is in a critical state.
Since both the load () and resistance () are influenced by basic random variables such as ground stress, pore pressure, rock strength, etc., assuming the basic random variables for wellbore instability are denoted as (, , …), the functional expression can be represented as
According to Equations (4) and (8), the functional expressions for the wellbore collapse and wellbore fracturing cases can be further represented as follows:
In the equations, and represent the functional expressions for wellbore collapse and fracture, respectively.
According to the properties of linear combinations of mutually independent normally distributed random variables, the mean and variance of can be expressed as follows:
In the equations, and represent the mean and variance of the functional function , respectively.
According to reliability theory, the reliability metric can be expressed as [21]
Under normal circumstances, the probability of the functional function being in an unstable state is referred to as the instability probability. If the functional function follows a normal distribution, the instability probability and reliability corresponding to wellbore collapse and rupture can be expressed as
In the equations, represents the probability of wellbore collapse; represents the probability of wellbore fracture; and represents the standard normal distribution function.
By plugging Equation (11) into Equations (12) to (13), the mean () and variance () of the functional function () under wellbore collapse and rupture conditions can be calculated. Furthermore, by substituting the mean and variance of the functional function () into Equation (14), the reliability index () can be calculated. Finally, the reliability index can be substituted into Equation (15) to compute the probabilities corresponding to wellbore instability and stability.
The relationship between reliability and instability probability is as follows:
3.2. Monte Carlo Simulations Method
The Monte Carlo simulation method is a numerical computational approach for approximating solutions to engineering and technical problems. Some scholars analyzed [23], suggesting that the results obtained based on Monte Carlo simulation are more conservative and favor the maintenance of wellbore stability. Based on the theory of statistical sampling, utilizing random numbers for sampling experiments or random simulations, the basic idea is as follows: If the probability distribution type of the state variables is known, based on the limit state conditions for wellbore stability, , utilizing the Monte Carlo method to generate a set of random numbers , , …, that conform to the probability distribution of the state variables. Substituting these numbers into the functional expression allows the establishment of the stability state function. This article is based on the Monte Carlo random simulation method for wellbore instability risk analysis. The specific solution steps are as follows:
- (1)
- Combining the probability distributions of geological mechanical parameters and employing the Monte Carlo simulation method, the simulation was conducted with 4000 iterations. During each iteration, 4000 random numbers, consistent with the characteristics of the probability distributions of geological mechanical parameters, were generated. These random numbers were then input into the models for formation collapse pressure and fracture pressure calculations. As a result, 4000 computation outcomes were obtained.
- (2)
- Statistically analyzing the computation results and based on the principles of normal information diffusion, the probability distributions of collapse pressure and fracture pressure were determined for different probability distributions of geological mechanical parameters. The mean, variance, and coefficient of variation for both collapse pressure and fracture pressure were obtained.
- (3)
- By comparing and analyzing the coefficients of variation in the probability distributions of collapse pressure and fracture pressure obtained under different probability distributions of geological mechanical parameters, we discuss the sensitivity of the random reliability variables of wellbore stability.
In order to enhance the reliability of the samples, it is necessary to increase the sample size. To achieve a 98% reliability level, the required number of samples for the study should encompass 3000 samples. However, to further improve the reliability of the research, it is recommended to increase the sample size and set the simulation iterations to at least 4000 times. This not only helps reduce the occurrence of errors but also provides a more accurate reflection of the true outcomes of the study [12,24].
The flowchart of the Monte Carlo simulation method is illustrated in Figure 1.
4. Applicable Analysis
The Ji 7 Block in the eastern depression of the TH Basin is currently a key focus area for deep exploration and the assessment of tight oil and gas reserves in the TH Oilfield. In the region, preliminary confirmation has been achieved for three sets of stratigraphic traps, namely J2x3, J2x1, and J1s2. Among them, the West Mountain Formation (J2x) reservoir has an average burial depth of 4600–5100 m, with J2x3 in the upper section and J2x1 in the lower section. This coal-bearing interval is widely distributed with significant individual coal bed thickness. The second segment of the Sankong Formation (J1s) reservoir has an average burial depth of 5350 m. From the current drilling operations, it can be observed that the occurrence of complex accidents is relatively high, primarily concentrated in the top thick coal bed of the J2x1 sand layer and the collapse (falling rocks) of the massive mudstone cap of J1s2, resulting in severe sticking and drilling accidents. Among them, the bottom 10 m of the particularly complex mudstone layer at the base of the J1s2 massive mudstone cap is especially challenging (see Figure 2), significantly impacting the normal and safe drilling progress. Therefore, the “felt layer” in the eastern depression of the basin is selected for a case study analysis.
Based on the logging and drilling data, the geological and rock mechanics parameters for the formation in the Ji 7 Block of the eastern depression of the basin, ranging from 4600 to 5476 m, are as follows: the vertical stress is 115.33~142.24 MPa, the maximum horizontal stress is 112.90~143.13 MPa, the minimum horizontal stress is 86.41~118.50 MPa, the pore pressure is 45.06~72.90 MPa, the rock cohesion is 7.71~12.81 MPa, and the rock internal friction angle is 36.84°~48.24°. The tensile strength of rock is 6.23~6.41 MPa.
4.1. Uncertainty Analysis of Input Parameters
In reliability theory, various mathematical methods are used to describe the uncertainty of parameters. These methods include uniform distribution, triangular distribution, normal distribution, log-normal distribution, Beta distribution, Gumbel distribution, Weibull distribution, Gamma distribution, etc. The most commonly used distributions are normal distribution, log-normal distribution, and Weibull distribution [25].
If the geological and rock mechanics parameters of the “felt layer” approximately follow a normal distribution, with the mean values given by logging interpretation results, the variation coefficients and standard deviations for each parameter are set based on the possible error ranges calculated from various on-site testing methods.
From a statistical perspective, the mean reflects the central tendency of the distribution, and the variance reflects the degree of data dispersion. In general, a larger variance indicates higher dispersion, indicating greater heterogeneity and uncertainty. Therefore, the mean and variance are used to describe the heterogeneity and uncertainty of rock materials. The Monte Carlo method is used to randomly sample and simulate input parameters, conducting multiple random samples of random variables and generating multiple sets of parameter samples to reduce the randomness of the results. The random simulation was conducted for 4000 iterations, and the uncertainty statistics results for each parameter are presented in Table 1.
Through analysis, the parameters in the wellbore stability calculation model are categorized into three groups: wellbore trajectory parameters, initial in-situ stress, and rock mechanics parameters. Among them, the wellbore trajectory can be accurately obtained based on drilling design or Measurement While Drilling (MWD) data. On the other hand, the initial in situ stress and rock mechanics parameters are typically derived from indirect mathematical models based on logging or seismic interpretation data. Consequently, there is a significant amount of uncertainty associated with these geological mechanics parameters, making them key considerations for sensitivity analysis. According to the formulas for wellbore collapse and fracturing pressure, the parameters requiring sensitivity analysis include formation pore pressure, maximum horizontal principal stress, minimum horizontal principal stress, vertical stress, rock internal friction angle, rock cohesion, and tensile strength of rock.
From the simulated statistical results and normal distribution fitting curves for partial parameters (Figure 3), it can be observed that the uncertainty distribution patterns of each parameter follow the normal distribution. The higher the coefficient of variation, the stronger the uncertainty of the sample data; conversely, the lower the coefficient of variation, the weaker the uncertainty. For example, the cohesion coefficient variation within the rock reaches 0.43, corresponding to a confidence interval of 2.45 to 12.98 MPa at a 95% confidence level. The vertical ground stress coefficient variation is 0.06, corresponding to a confidence interval of 115.81 to 141.50 MPa at a 95% confidence level. In contrast, a lower coefficient of variation indicates a narrower confidence interval, reflecting less variability in the range of values. In other words, lower variability suggests more concentrated sample data and weaker uncertainty. It is evident that such pronounced parameter uncertainty will inevitably have a significant impact on wellbore stability.
During the computation of wellbore collapse and fracturing pressure, in order to mitigate the impact of the uncertainty in rock mechanics parameters on the calculation results, one can perform multiple random samplings on the random variables of rock properties based on the probability distribution characteristics of the rock mechanics parameters. This process generates multiple sets of parameter samples, allowing for the calculation of wellbore collapse and fracturing pressure to reduce the randomness of the results.
Based on the probability distribution of the ground stress and rock mechanics parameters in Table 1, a certain quantity of random numerical values was generated using Monte Carlo simulation. These random values were then substituted into Equations (11) and (15). A collapse pressure calculation program was developed using MATLAB software R2022a, and theoretical values for 4000 collapse pressures were computed. Statistical analysis was performed on the results, as shown in Table 2.
The probability distribution of the 4000 collapse pressure data points is illustrated in Figure 4.
By utilizing MATLAB software R2022a for programming calculations, 4000 fracture pressure data points were obtained. The statistical results of the theoretical calculation values for fracture pressure are presented in Table 3.
The probability distribution of the 4000 fracture pressure data points is shown in Figure 4.
4.2. Quantitative Evaluation Results of Wellbore Stability
In accordance with the quantitative evaluation method for wellbore stability [26], the probability of wellbore instability at the “felt layer” in the Qiudong Depression was calculated and compared with the actual conditions. The probability distribution of the uncertainty in drilling fluid circulating equivalent density was determined based on actual drilling data. The distribution characteristics of the drilling fluid circulating equivalent density were obtained through Monte Carlo simulation, where the computer generates random numbers that conform to the probability distribution of this parameter. The results are illustrated in Figure 4.
From Figure 5a, it can be observed that the probability distribution characteristics of formation collapse pressure have the parameters = 1.45, = 0.07, with a distribution range of [1.11, 1.78]. The probability distribution characteristics of drilling fluid circulating equivalent density have the parameters = 1.52, = 0.05, with a distribution range of [1.31, 1.72]. The shaded area in the diagram indicates interference between the two, demonstrating the occurrence of wellbore instability. The calculated probability of wellbore instability is 83%. In the actual drilling process, frequent occurrences of wellbore collapse in the “felt layer” section complicate the situation. The evaluation results align with the actual conditions. From Figure 5b, it can be observed that the characteristic parameters of the probability distribution of formation fracturing pressure are as follows: μ = 2.04, σ = 0.15, with a distribution range of [1.51, 2.57]. The calculated probability of wellbore instability risk is 5%. In the actual drilling process, there was no occurrence of wellbore fracturing risk at this location, consistent with the actual conditions. The case analysis validates the reliability and accuracy of the quantitative evaluation method. The wellbore instability risk assessment results derived from reliability theory align with the overall trend of conventional wellbore stability analysis results.
4.3. Parameter Mean Sensitivity Analysis
In order to identify the key factors influencing wellbore instability and provide a basis for wellbore stability analysis, prevention, and control, a sensitivity analysis was conducted on the mean values of input parameters affecting wellbore collapse and formation fracturing.
For vertical wells (Figure 6), (1) the ranking of factors influencing wellbore collapse from largest to smallest is as follows: maximum horizontal stress, cohesion, pore pressure, internal friction angle, minimum horizontal stress, vertical stress, and Poisson’s ratio. (2) Wellbore collapse is positively correlated with maximum horizontal stress, pore pressure, minimum horizontal stress, and vertical stress. It is negatively correlated with cohesion and internal friction angle, while Poisson’s ratio has minimal impact. (3) The ranking of factors influencing wellbore fracturing from largest to smallest is as follows: minimum horizontal stress, maximum horizontal stress, pore pressure, tensile strength, and vertical stress. The impact of Poisson’s ratio is similar to that of vertical stress. (4) Wellbore fracturing is positively correlated with minimum horizontal stress and tensile strength, while it is negatively correlated with maximum horizontal stress and pore pressure. Vertical stress and Poisson’s ratio have almost no influence on fracturing pressure.
For horizontal wells (Figure 7), (1) the ranking of factors influencing wellbore collapse from largest to smallest is as follows: vertical stress, internal friction angle, cohesion, pore pressure, minimum horizontal stress, maximum horizontal stress, and Poisson’s ratio. (2) Wellbore collapse is positively correlated with vertical stress and pore pressure, while it is negatively correlated with internal friction angle, cohesion, and minimum horizontal stress. Poisson’s ratio has minimal impact. (3) The ranking of factors influencing wellbore fracturing from largest to smallest is as follows: maximum horizontal stress, minimum horizontal stress, pore pressure, vertical stress, tensile strength, and Poisson’s. (4) Wellbore fracturing is positively correlated with maximum horizontal stress, vertical stress, and tensile strength, while it is negatively correlated with minimum horizontal stress and pore pressure. Vertical stress and Poisson’s ratio have almost no influence.
The aforementioned analysis on the sensitivity of parameter mean values was conducted under the condition where the original stress field has vertical stress as the maximum principal stress (σv > σH > σh).
4.4. Risk Analysis of Wellbore Instability
4.4.1. Geostress State Analysis
From the earlier analysis of parameter mean sensitivity, it is evident that with an increase in wellbore inclination, the parameter most significantly affecting wellbore collapse transitions from maximum horizontal stress to vertical stress. The most significant factor influencing wellbore fracturing becomes the minimum horizontal stress, but the impact of vertical stress gradually increases. In light of this, the focus is placed on discussing the influence of the geostress state on wellbore instability.
Using the Kaiser effect method based on acoustic emission, the magnitudes of in situ stress in core samples from wells such as J7H and J10 in the Qiudong Depression were determined. Experimental data are presented in Table 4, and before-and-after comparison photos are shown in Figure 8. Subsequently, the in situ stress profile for the “felt layer” of well J10 in the Qiudong Depression was calculated and established, as depicted in Figure 9.
As the well depth increases, the vertical stress gradually approaches and surpasses the maximum horizontal principal stress. For the Xinjiang region, it is generally considered that influenced by strike-slip fault structures, the distribution characteristics of geostress magnitude are as follows: maximum horizontal stress (σH) > vertical stress (σv) > minimum horizontal stress (σh) [27].
However, it was observed from the Kaiser effect test results in the Qiudong Depression that the predominant structural type and geostress distribution in this region differ from previous empirical knowledge. After reaching a depth of 4900 m, the relationship in the magnitudes of principal stresses changes to vertical stress (σv) > maximum horizontal stress (σH) > minimum horizontal stress (σh). Under normal geostress conditions, as the wellbore inclination increases, the wellbore stability gradually deteriorates. In other words, the wellbore stability in vertical wells is better than that in deviated or horizontal wells [28].
The relationship between σv/σh and σH/σh can visually describe the type of deep stress state (see Figure 10). During the drilling process, as depth increases, the geostress field around the wellbore in the deep formations gradually transitions from a potential slip type (σH > σv > σh) to a potential normal faulting type (σv > σH > σh). Namely, the red arrow in the following Figure 10.
The original geostress state has a decisive impact on the stability of the wellbore. Under identical conditions, different geostress field states result in varying levels of wellbore stability. Among them, vertical wellbores are more sensitive to the magnitude of σH/σh, meaning that an increase in the difference between the three principal stresses in the original geostress state will intensify wellbore instability.
4.4.2. Two-Dimensional Simulation Validation
The two-dimensional simulation based on Oracle software (11.1.2.4) considers two sources of variability in the model, namely uncertainty and variability. Uncertainty is a lack of information or knowledge about input quantities; variability is the dispersion of values around the overall or observed set. Distinguishing between these two types of handling in simulations can more accurately identify the characteristics of true risks in the model and clarify different variations in predictions.
The two-dimensional simulation tool will initially step through a trial to generate a set of new values for the outer loop based on the assumption of uncertainty. Subsequently, with these assumptions frozen, the inner loop (for the entire model) will run simulations based on the assumption of variability. This process is repeated for a certain number of outer simulations until the specified number of simulations in the outer loop is completed. This provides an overview of the predictive distribution that varies due to uncertainty.
To further analyze the impact of geostress on wellbore stability, collapse pressure was selected as the target prediction in the model. Simulations were conducted under two different scenarios.
The first scenario involves selecting the type of geostress variables (maximum horizontal stress, minimum horizontal stress, and vertical stress) as uncertainty (outer loop), while the rock mechanics parameters (pore pressure, cohesion, internal friction angle, and tensile strength) are treated as variability (inner loop). This results in an overlay plot of the risk curves (Figure 11). In this instance, the majority of risk curves are densely clustered towards the center, while a few outlier curves disperse towards the cumulative frequency axis. This indicates that the probability of having significant risks is relatively low.
The second scenario involves selecting the type of rock mechanics parameters (pore pressure, cohesion, internal friction angle, and tensile strength) as uncertainty (outer loop), while the type of geostress variables (maximum horizontal stress, minimum horizontal stress, and vertical stress) is considered variability (inner loop). This results in an overlay plot of the risk curves (Figure 12).
The two-dimensional simulation analysis further confirms the significant role of variations in geostress parameters in the assessment of wellbore instability. In the deep formations of the Qiudong Depression in the TH Basin, as the well depth increases, the vertical stress in the “felt layer” gradually approaches and surpasses the maximum horizontal principal stress, exacerbating wellbore instability. In future research and analysis, extra caution should be taken in formations where geostress changes significantly to prevent wellbore instability.
The data-driven wellbore instability analysis method, compared to traditional prediction methods, avoids cumbersome calculation processes and provides a new approach to wellbore stability issues. For wellbore stability studies on similar types of formations, a substantial amount of experimental results should be the foundation for research and analysis, with equal emphasis on the application of well logging data. This article, based on the Monte Carlo simulation method for wellbore instability analysis, addresses the challenging issue of identifying complex formations in the deep wells of the Qiudong Depression. It can provide valuable references for the reliability analysis of wellbore stability. Furthermore, the author suggests establishing a wellbore stability assessment model for the entire lifecycle of oil and gas wells, considering the impact of the uncertainty of parameter variables at different stages on wellbore stability. At the same time, consideration could be given to expanding the application of reliability in various domains within the petroleum industry.
5. Conclusions
- (1)
- A wellbore stability analysis model was established, and Monte Carlo methods were used to simulate the reliability and instability probability of the wellbore. Quantitative analysis and calculations for wellbore stability were conducted based on the specific distribution characteristics of lithological parameters in the research area. The evaluation results obtained from the quantitative risk calculation model were consistent with the actual conditions. The case analysis validated the reliability and accuracy of wellbore instability risk analysis based on the Monte Carlo method.
- (2)
- The sensitivity ranking of geological and rock mechanics parameters under a normal distribution is as follows: geostress > pore pressure > rock strength. The use of two-dimensional simulation experiments clarified the impact of accurately determining the magnitude of geostress and reducing its uncertainty in wellbore stability analysis. This, in turn, enhances the accuracy of wellbore stability assessments.
- (3)
- In the deep formations of the Qiudong Depression, the stress field around the wellbore gradually transitions from a potential slip type to a potential normal faulting type. Under conditions of normal stress, with the increase in wellbore inclination, the stability of the wellbore gradually deteriorates. Straight wells exhibit better stability compared to directional or horizontal wells. Accurately analyzing and evaluating the impact of stress distribution in deep formations on wellbore stability is crucial for ensuring the economic and rapid drilling of deep wells.
Author Contributions
Conceptualization, R.J. and X.S.; methodology, L.Z.; software, R.J. and X.S.; validation, J.C.; formal analysis, R.J.; investigation, R.J.; writing original draft preparation, R.J.; writing—review and editing, L.Z.; visualization, J.C.; supervision, L.Z.; funding acquisition, X.S. All authors have read and agreed to the published version of the manuscript.
Funding
This research was funded by 13th Five-Year National Science and Technology Major Project grant number 2016ZX05061-009 and Oil and Gas Well Drilling Technology National Engineering Research Center Scientific Research Fund (NERCDCT202319).
Data Availability Statement
Data are unavailable due to privacy. Because the model research involves the project content of the source of funds, the data cannot be disclosed.
Acknowledgments
The author thanks Zhu of Yangtze University for his valuable research ideas and writing help.
Conflicts of Interest
All authors declare that there are no conflicts of interest in this paper.
References
- Lou, Y.; Jin, Y. Rock Mechanics and Petroleum Engineering; Petroleum Industry Publications: Beijing, China, 2006. [Google Scholar]
- Chen, M.; Jin, Y.; Zhang, G. Petroleum Related Rock Mechanics; Science Press: Beijing, China, 2008. [Google Scholar]
- Ottesen, S.; Zheng, R.H.; McCann, R.C. SPE/IADC 52864: Borehole Stability Assessment Using Quantitative Risk Analysis. In Drilling Conference; International Association of Drilling Contractors: Huston, TC, USA, 1999; Volume 2, pp. 313–316. [Google Scholar]
- de Fontoura, S.A.; Holzberg, B.B.; Teixeira, É.C.; Frydman, M. Probabilistic analysis of wellbore stability during drilling. In Proceedings of the SPE/ISRM Rock Mechanics Conference, Irving, TX, USA, 20–23 October 2002. [Google Scholar]
- Mostafavi, V.; Aadnoy, B.S.; Hareland, G. Model—Based uncertainty assessment of wellbore stability analyses and downhole pressure estimations. In Proceedings of the 45th U.S. Rock Mechanics/Geomechanics Symposium, San Francisco, CA, USA, 26–29 June 2011. [Google Scholar]
- Udegbunam, J.E.; Aadnøy, B.S.; Fjelde, K.K. Uncertainty evaluation of wellbore stability model predictions. J. Pet. Sci. Eng. 2014, 124, 254–263. [Google Scholar] [CrossRef]
- Gholami, R.; Rabiei, M.; Rasouli, V.; Aadnøy, B.S.; Fakhari, N. Application of quantitative risk assessment in wellbore stability analysis. J. Pet. Sci. Eng. 2015, 135, 185–200. [Google Scholar] [CrossRef]
- Plazas, F.; Calderon, Z.; Quintero, Y. Wellbore stability analysis:a stochastic approach applied to a Colombian Cretaceous Formation. In Proceedings of the SPE Latin American and Caribbean Petroleum Engineering Conference, Quito, Ecuador, 18–20 November 2015. [Google Scholar]
- Kinik, K.; Wojtanowicz, A.K.; Gumus, F. Probabilistic assessment of the temperature-induced effective fracture pressures. SPE Drill. Complet. 2016, 31, 40–52. [Google Scholar] [CrossRef]
- Zhang, L.; Yan, X.; Tian, Z.; Yang, H.; Yang, X. A collapse pressure analysis in reservoir drilling based on the reliability method. Acta Pet. Sin. 2012, 33, 477–482. [Google Scholar]
- Wei, K.; Ma, J.; Guan, Z. Method for determining the unstable area of wellbore and analysis of influencing factors. Mech. Pract. 2014, 36, 54–58. [Google Scholar]
- Ma, T.; Tang, T.; Chen, P.; Yang, C. Uncertainty evaluation of safe mud weight window utilizing the reliability assessment method. Energies 2019, 12, 942. [Google Scholar] [CrossRef]
- Zhang, L.; Bian, Y.; Zhang, S.; Yan, Y. A new analytical model to evaluate uncertainty of wellbore collapse pressure based on advantageous synergies of different strength criteria. Rock Mech. Rock Eng. 2019, 52, 2649–2664. [Google Scholar] [CrossRef]
- Zheng, D.; Miska, S.; Ozbayoglu, E.; Zhang, J. Combined experimental and well log study of anisotropic strength of shale. In Proceedings of the SPE Annual Technical Conference and Exhibition, San Antonio, TX, USA, 16–18 October 2023. [Google Scholar]
- Long, Z.; Zhong, J.; Ding, J.; Zeng, X. Wellbore stability of slimhole in deep shale-gas horizontal wells, Yongchuan southern area. Nat. Gas Technol. Econ. 2023, 17, 22–29. [Google Scholar]
- Lin, H.; Deng, J.; Xie, T.; Huo, H.; Chen, Z. Influence of Formation Anisotropy on Wellbore Stability of Hard and Brittle Mudstone. J. Northeast. Pet. Univ. 2021, 45, 85–94+10–11. [Google Scholar]
- Zheng, D.; Ozbayoglu, E.; Miska, S.; Zhang, J. Experimental study of anisotropic strength properties of shale. In Proceedings of the ARMA US Rock Mechanics/Geomechanics Symposium, Atlanta, GA, USA, 25–28 June 2023. [Google Scholar]
- Xu, S.; Liu, R.; Meng, X.; Liu, B.; Sun, Z.; Fu, J.; Zhai, X.; Zhang, J. Evaluation Method of Wellbore Stability in Mudstone Horizontal Section Based on Prediction Model of Collapse Angle and Collapse Depth of Borehole. Oil Drill. Prod. Technol. 2023, 45, 136–142. [Google Scholar]
- Zhao, G.; Jin, W.; Gong, J. Structural Reliability Theory; China Architecture & Building Press: Beijing, China, 2000. [Google Scholar]
- Zhang, L.; Zhang, J.; Xu, Y.; Li, X. Reliability Theory in Geotechnical Engineering; Tongji University Press: Shanghai, China, 2011. [Google Scholar]
- Zhang, L.L.; Zhang, J.; Xu, Y.; Li, X. Analysis of API formulas and calculation of casing strength based on reliability theory. Pet. Sin. 2007, 28, 122–126. [Google Scholar]
- Liao, H.; Guan, Z.; Yan, Z.; Ma, G. Assessment method of casing failure risk based on structure reliability theory. Acta Pet. Sin. 2010, 31, 161–164. [Google Scholar]
- Sheng, Y.; Guan, Z.; Xu, Y.; Wang, Q.; Zhang, B. Exploration of Uncertainty Analysis Methods for Wellbore Stability Issues. Fault-Block Oil Gas Field 2017, 24, 847–850+866. [Google Scholar]
- Ye, J. The Application of ANSYS in Structural Reliability Analysis. Civ. Eng. Archit. Guangdong 2008, 4, 27–28. [Google Scholar]
- Guan, Z.; Shegn, Y. The quantitative method of ECD uncertainty based on Uncertainty Theory. Drill. Complet. Fluid 2018, 35, 62–67. [Google Scholar]
- Wang, Q. Quantitative evaluation method of wellbore stability based on reliability theory. Sci. Technol. Eng. 2022, 22, 11880–11886. [Google Scholar]
- Deng, J.; Zhang, H. Mechanical Mechanisms of Borehole Instability in Drilling Engineering; Petroleum Industry Press: Beijing, China, 1998. [Google Scholar]
- Li, Y.; Fu, Y.; Tang, G.; She, Z.; Zhang, J. Influence of Ground Stress Types on the Stability of Directional Wellbore Walls. Nat. Gas Ind. 2012, 32, 78–80. [Google Scholar]
Figure 1.
Monte Carlo simulation method flowchart.

Figure 2.
Comparison chart of wells drilled in the same area, showing encounters with “felt layers” and complex strata. (In the Figure header, ‘1, 2, 3’ correspond to Depth (m), Lithology In Situ, and Core Sampling and In Situ, respectively).
Figure 2.
Comparison chart of wells drilled in the same area, showing encounters with “felt layers” and complex strata. (In the Figure header, ‘1, 2, 3’ correspond to Depth (m), Lithology In Situ, and Core Sampling and In Situ, respectively).
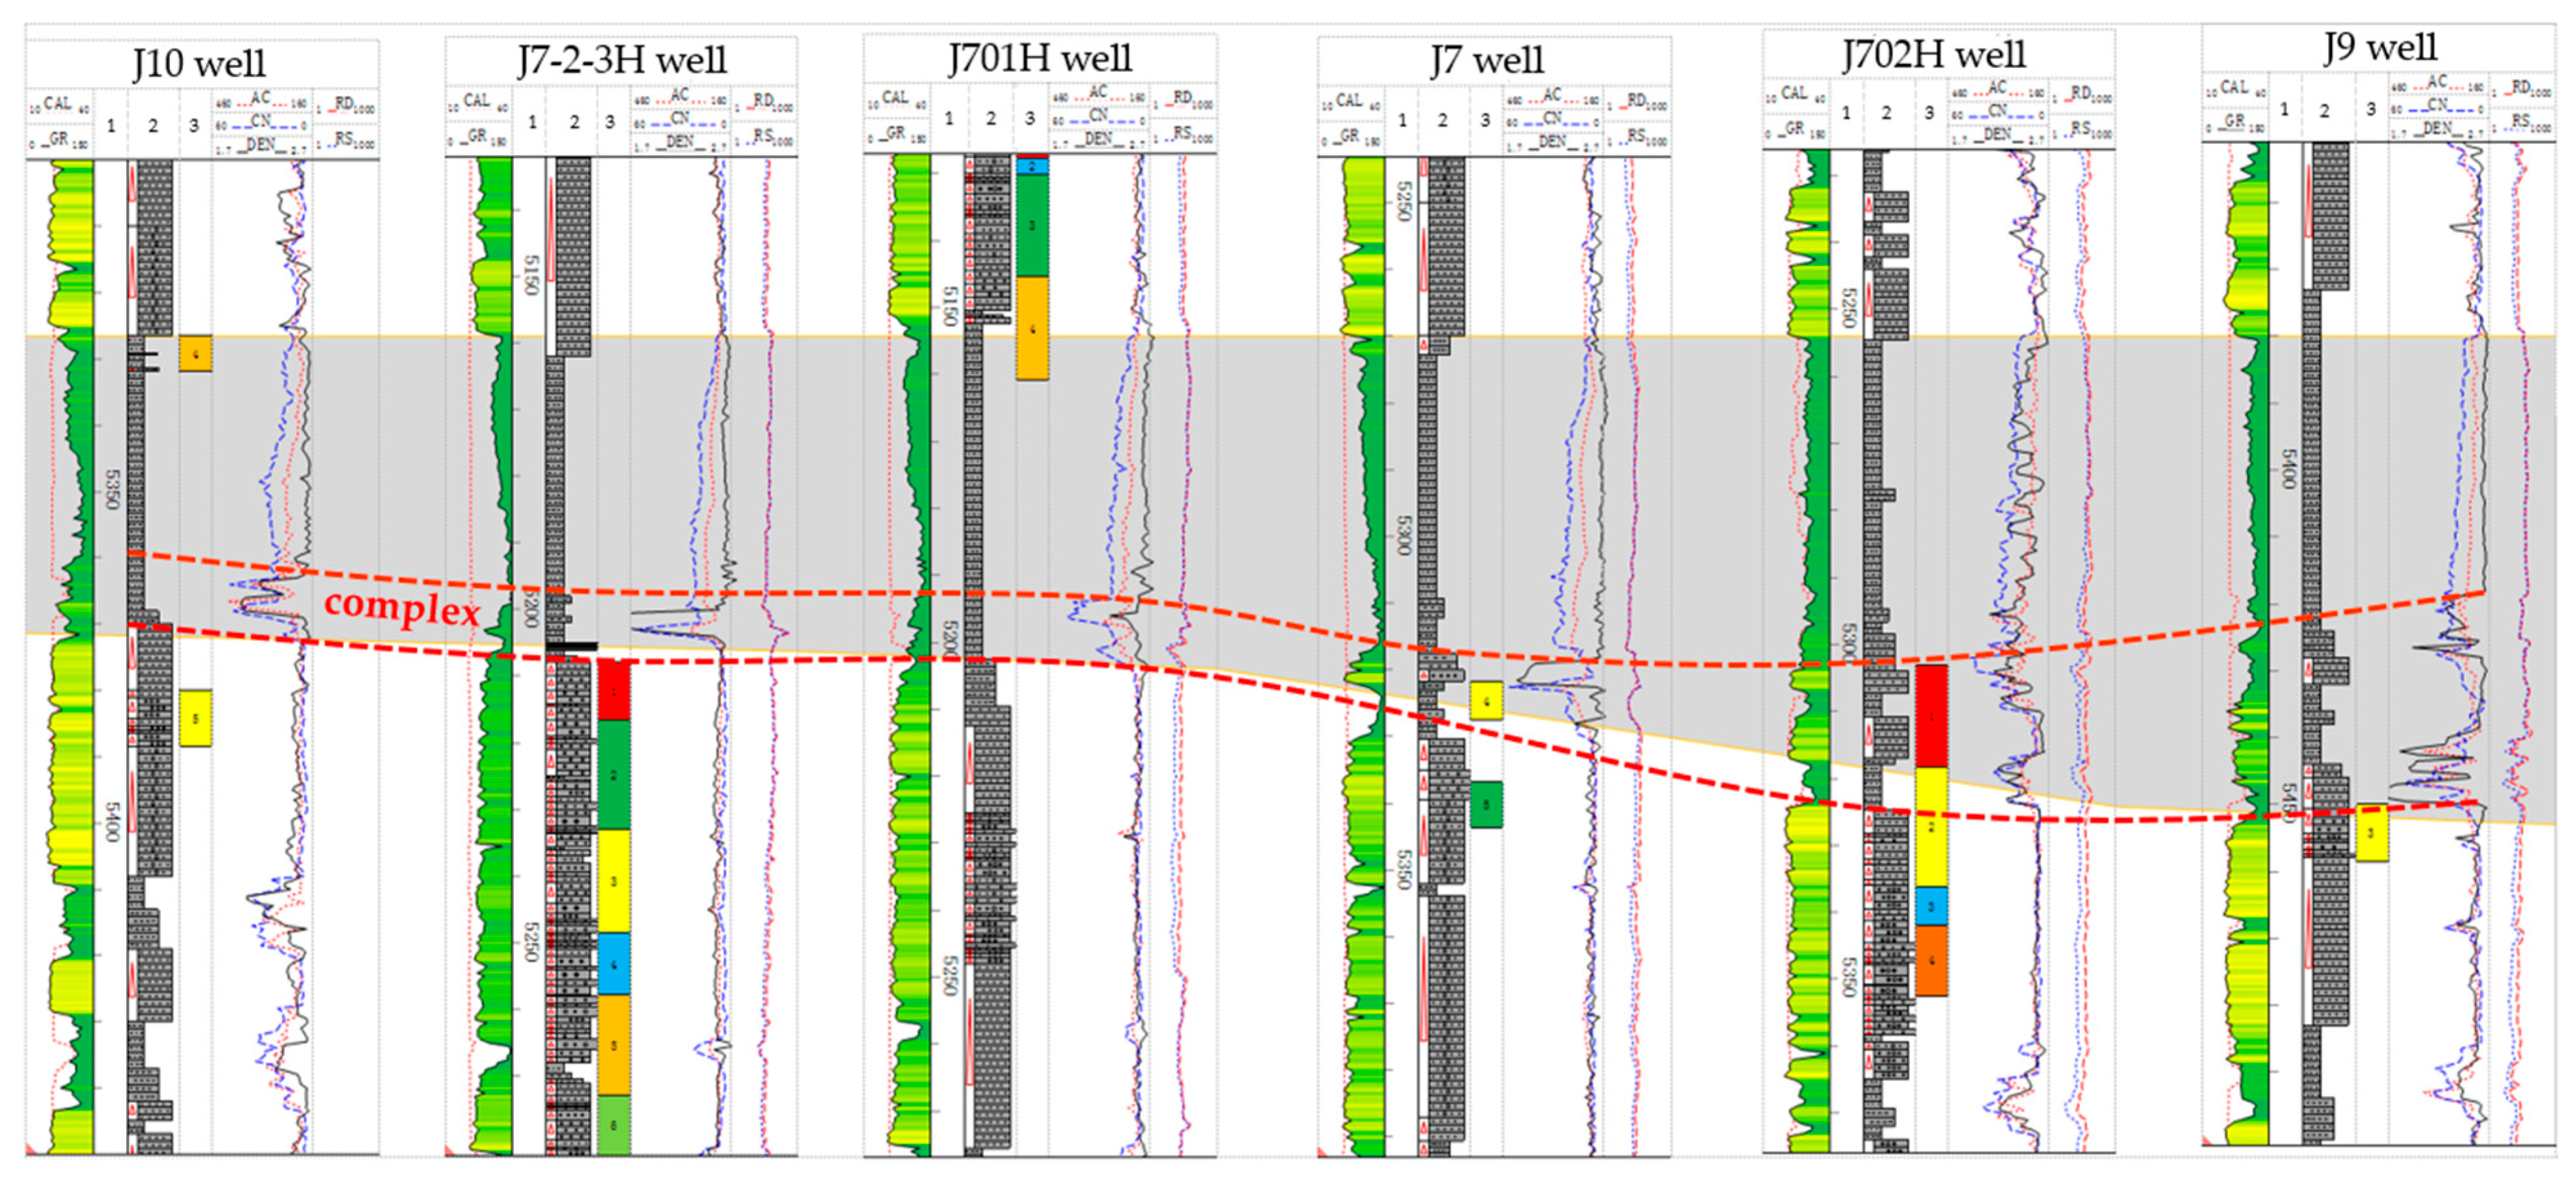
Figure 3.
Statistics of simulation results with uncertain input parameters.
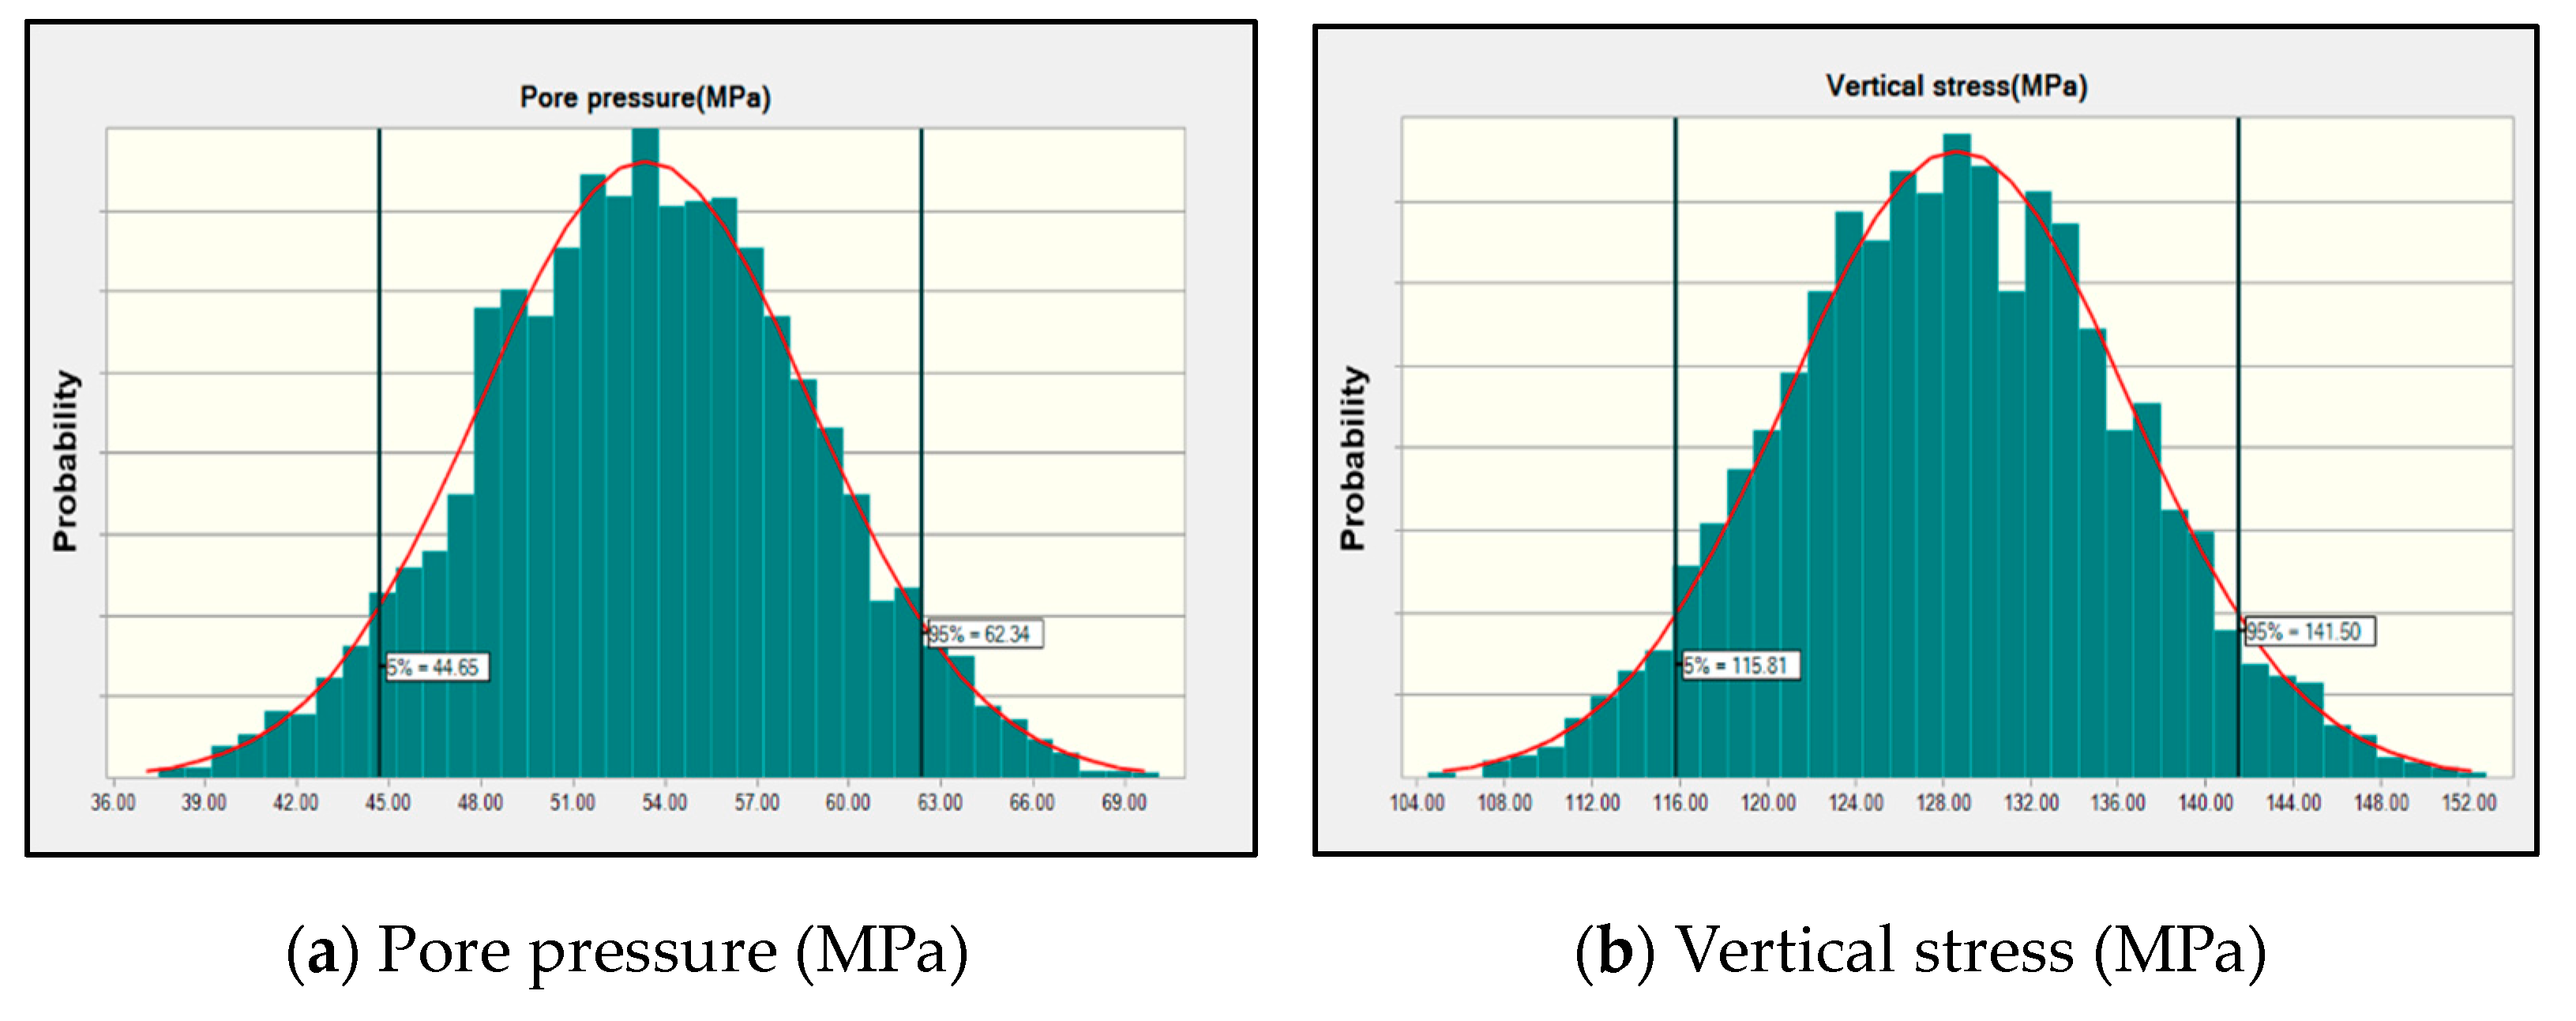

Figure 4.
(a) Probability distribution of formation collapse pressure. (b) Probability distribution of formation fracture pressure.
Figure 4.
(a) Probability distribution of formation collapse pressure. (b) Probability distribution of formation fracture pressure.

Figure 5.
Wellbore instability risk assessment: (a) wellbore collapse risk; (b) wellbore fracture risk.
Figure 5.
Wellbore instability risk assessment: (a) wellbore collapse risk; (b) wellbore fracture risk.

Figure 6.
Sensitivity analysis of parameter means for collapse and fracture in vertical wells: (a) collapse pressure sensitivity; (b) fracture pressure sensitivity.
Figure 6.
Sensitivity analysis of parameter means for collapse and fracture in vertical wells: (a) collapse pressure sensitivity; (b) fracture pressure sensitivity.

Figure 7.
Sensitivity analysis of parameter means for collapse and fracture in horizontal wells: (a) collapse pressure sensitivity; (b) fracture pressure sensitivity.
Figure 7.
Sensitivity analysis of parameter means for collapse and fracture in horizontal wells: (a) collapse pressure sensitivity; (b) fracture pressure sensitivity.
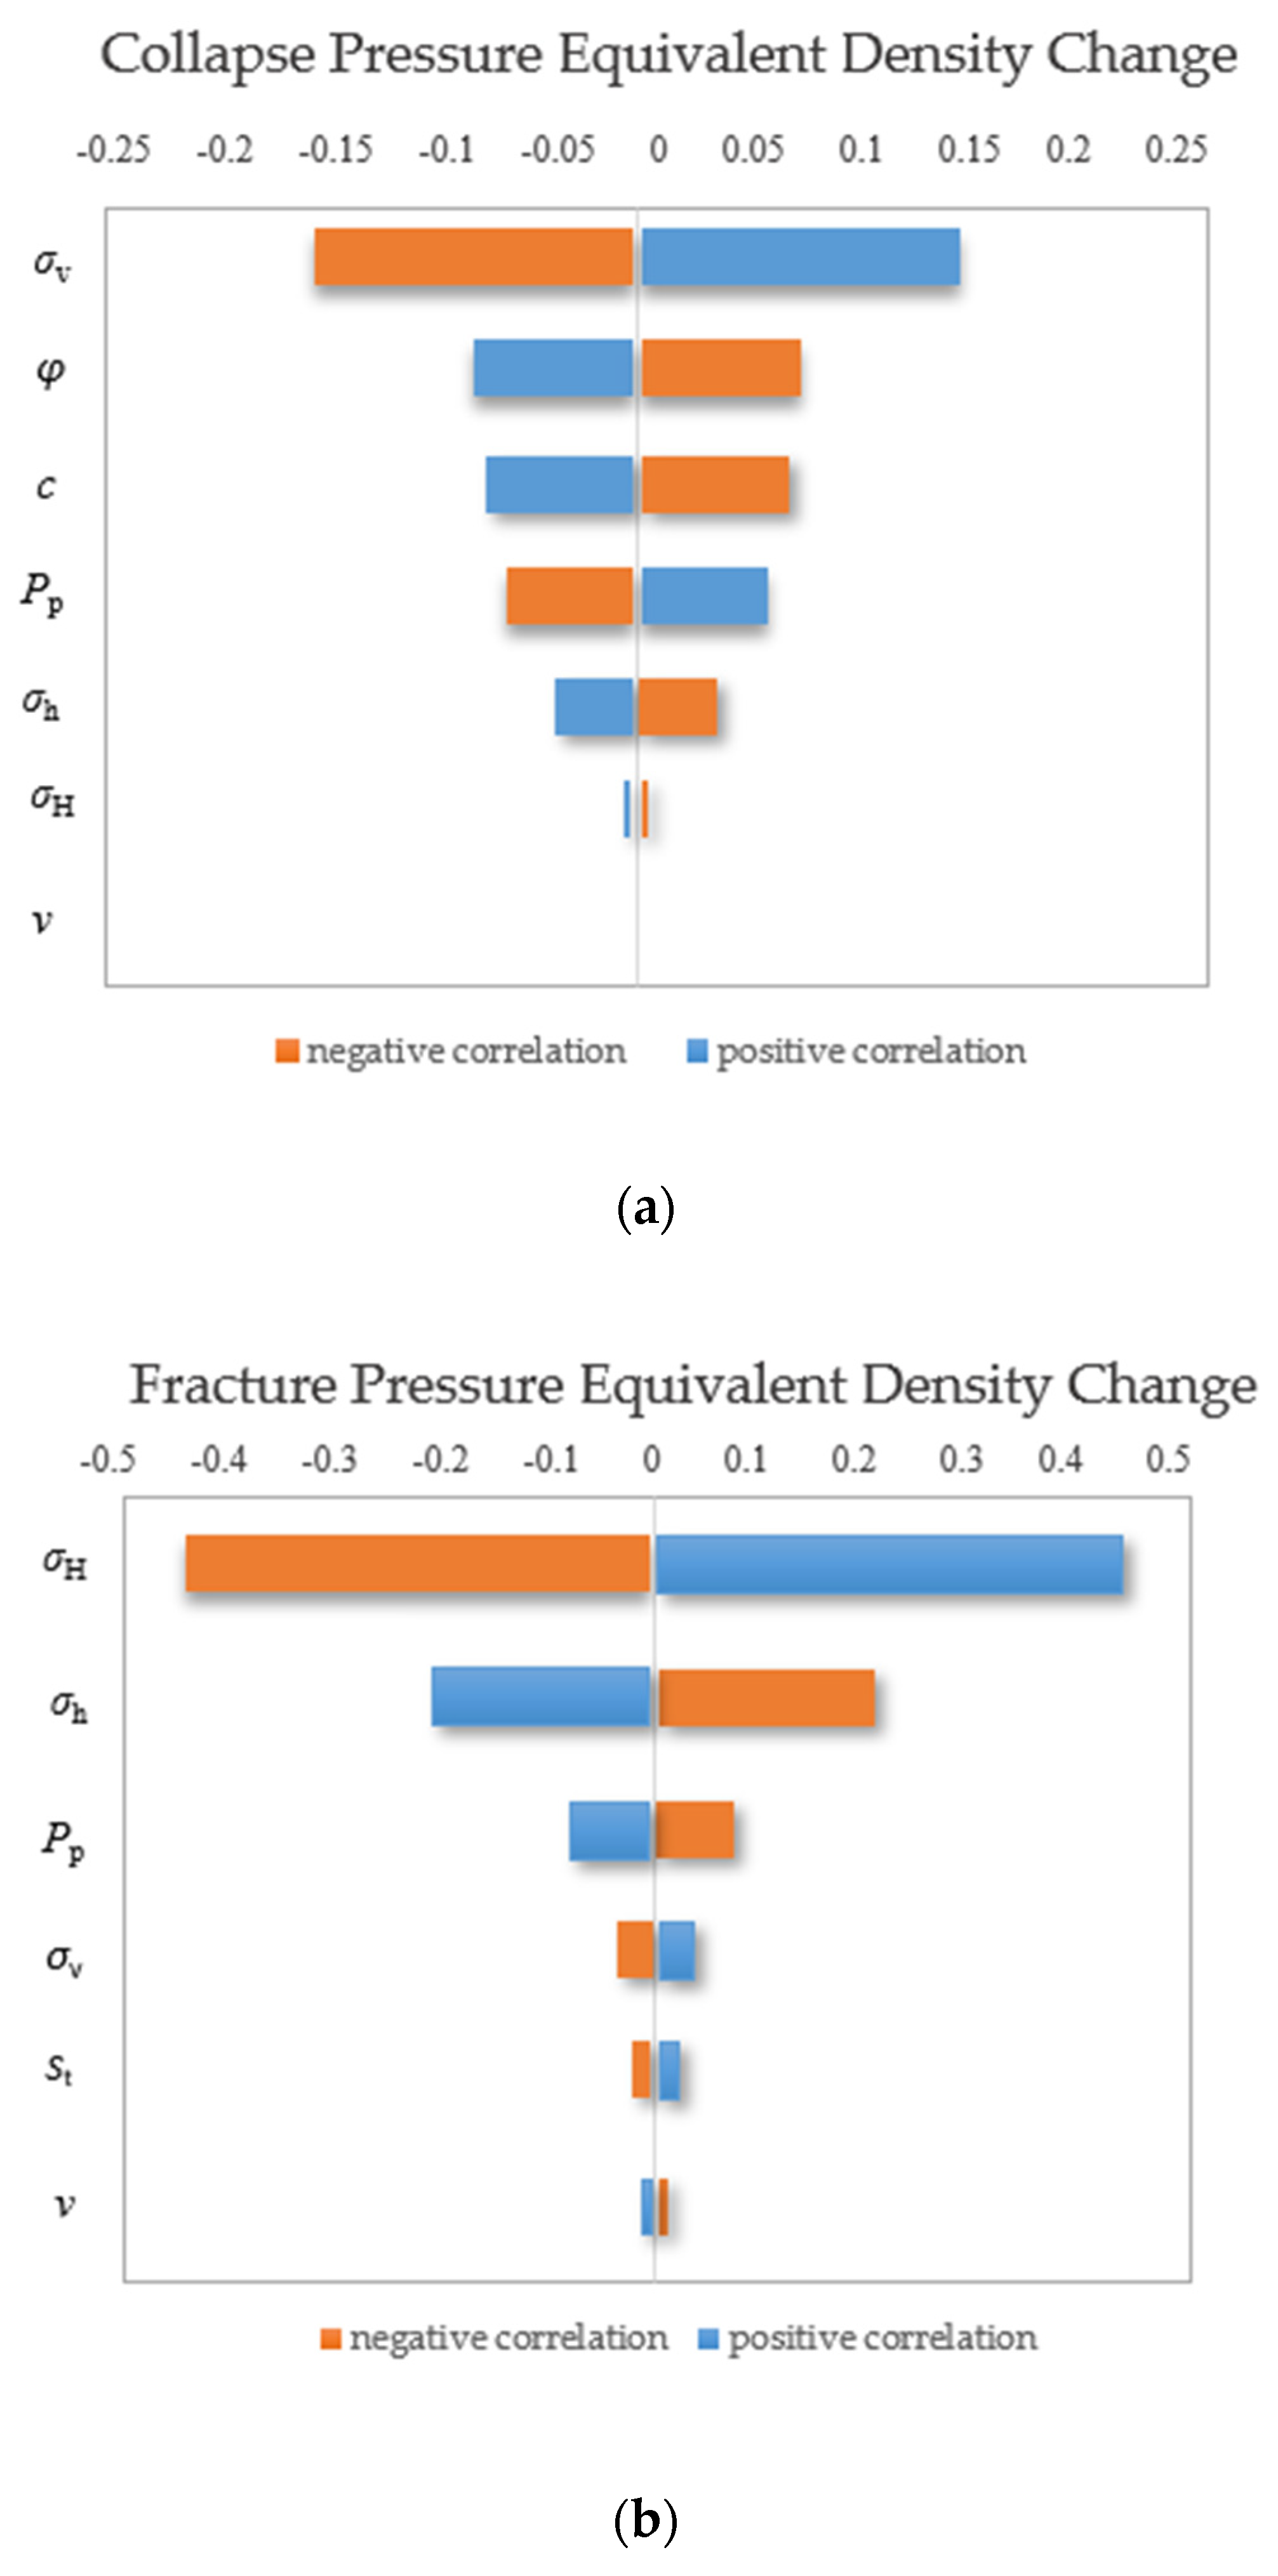
Figure 8.
Before and after Kaiser’s experiment.
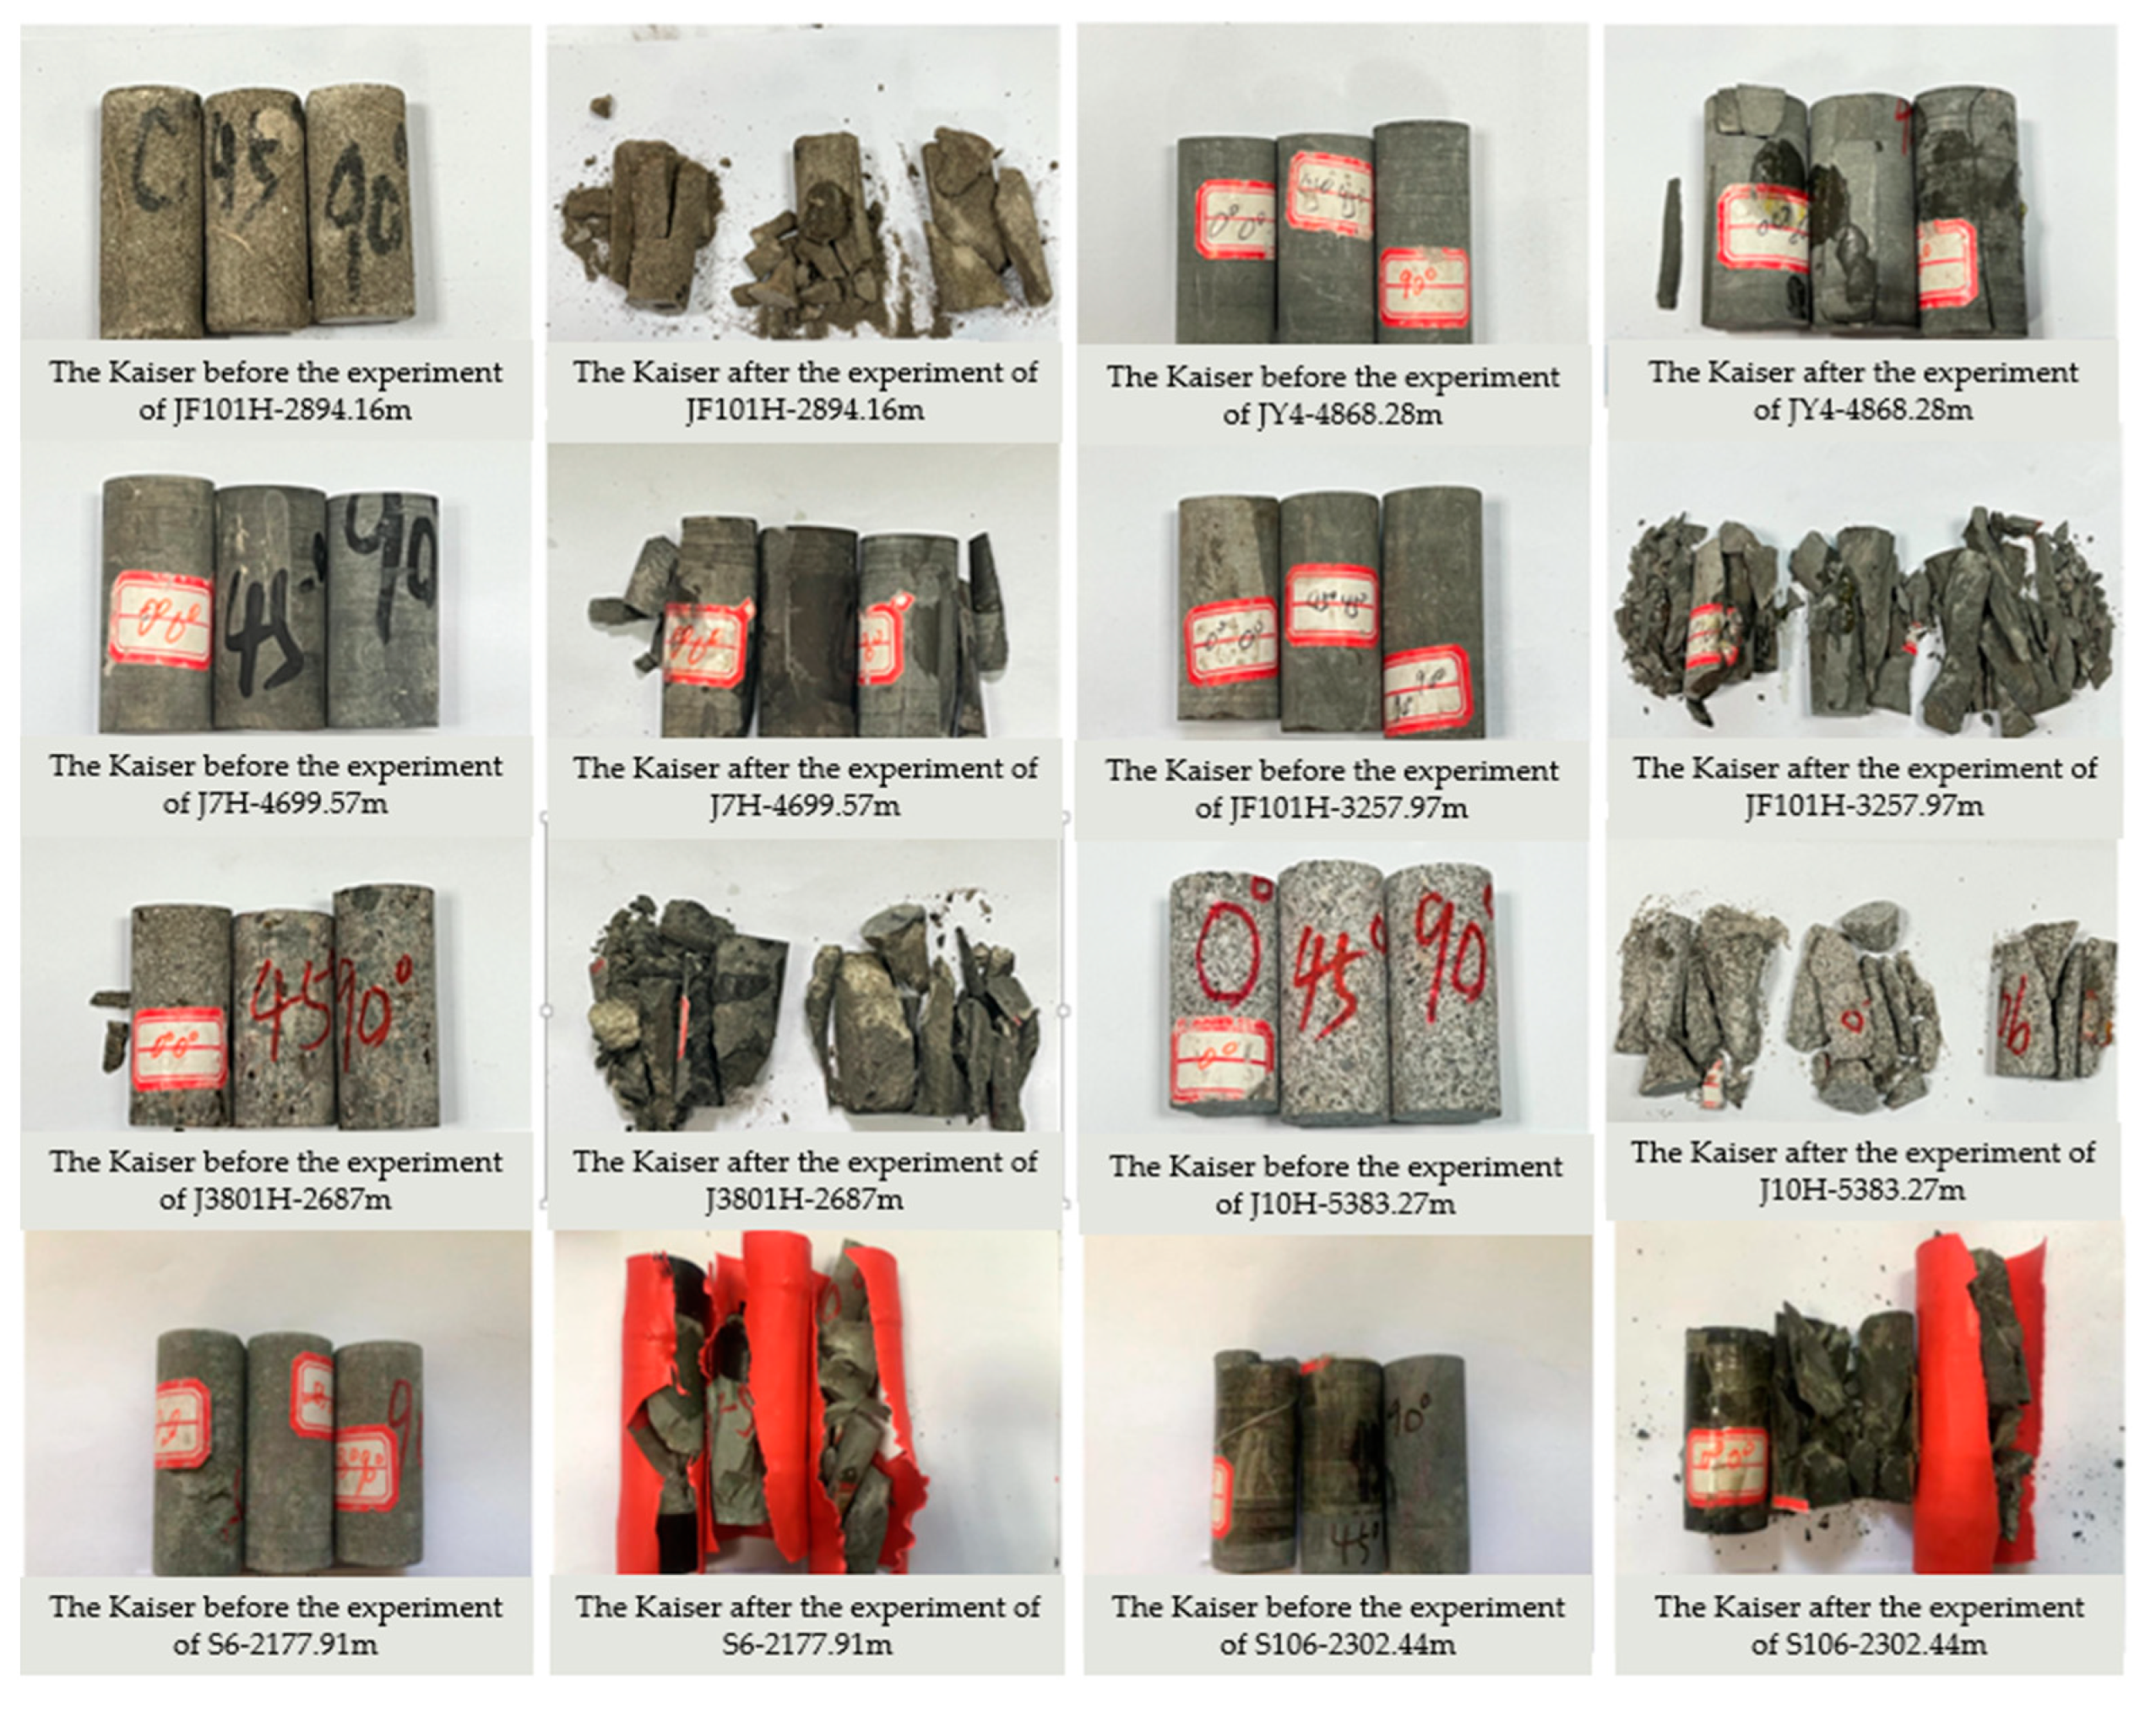
Figure 9.
Geostress profile.

Figure 10.
Types of deep crustal stress.
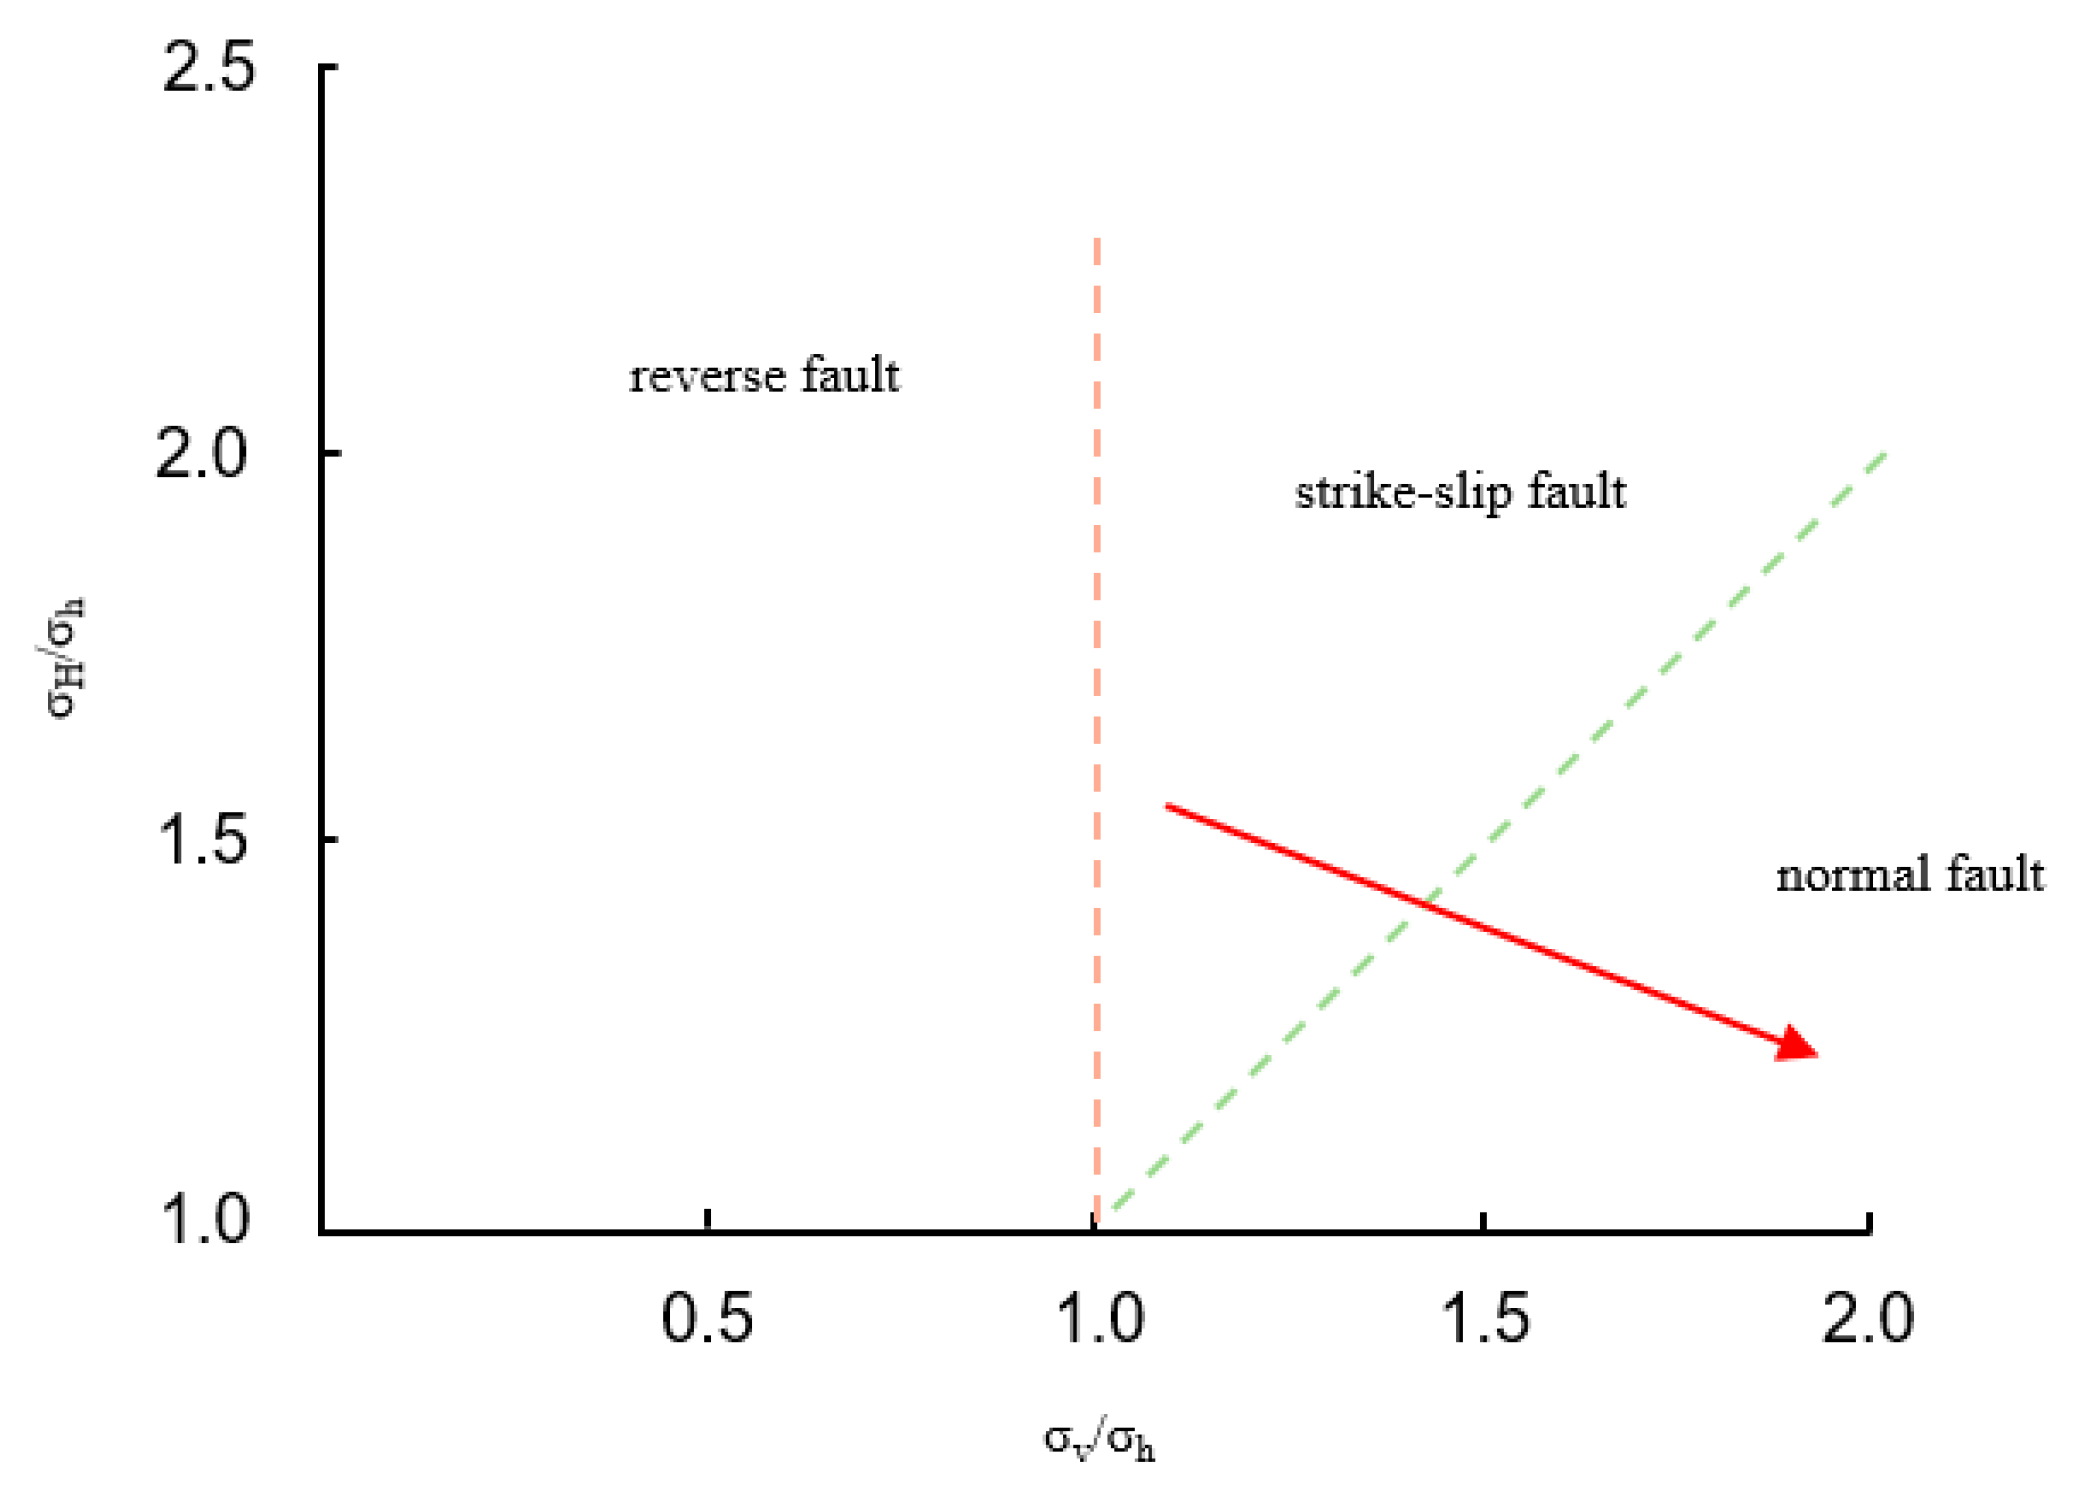
Figure 11.
Risk curve superposition diagram—uncertainty of geostress.
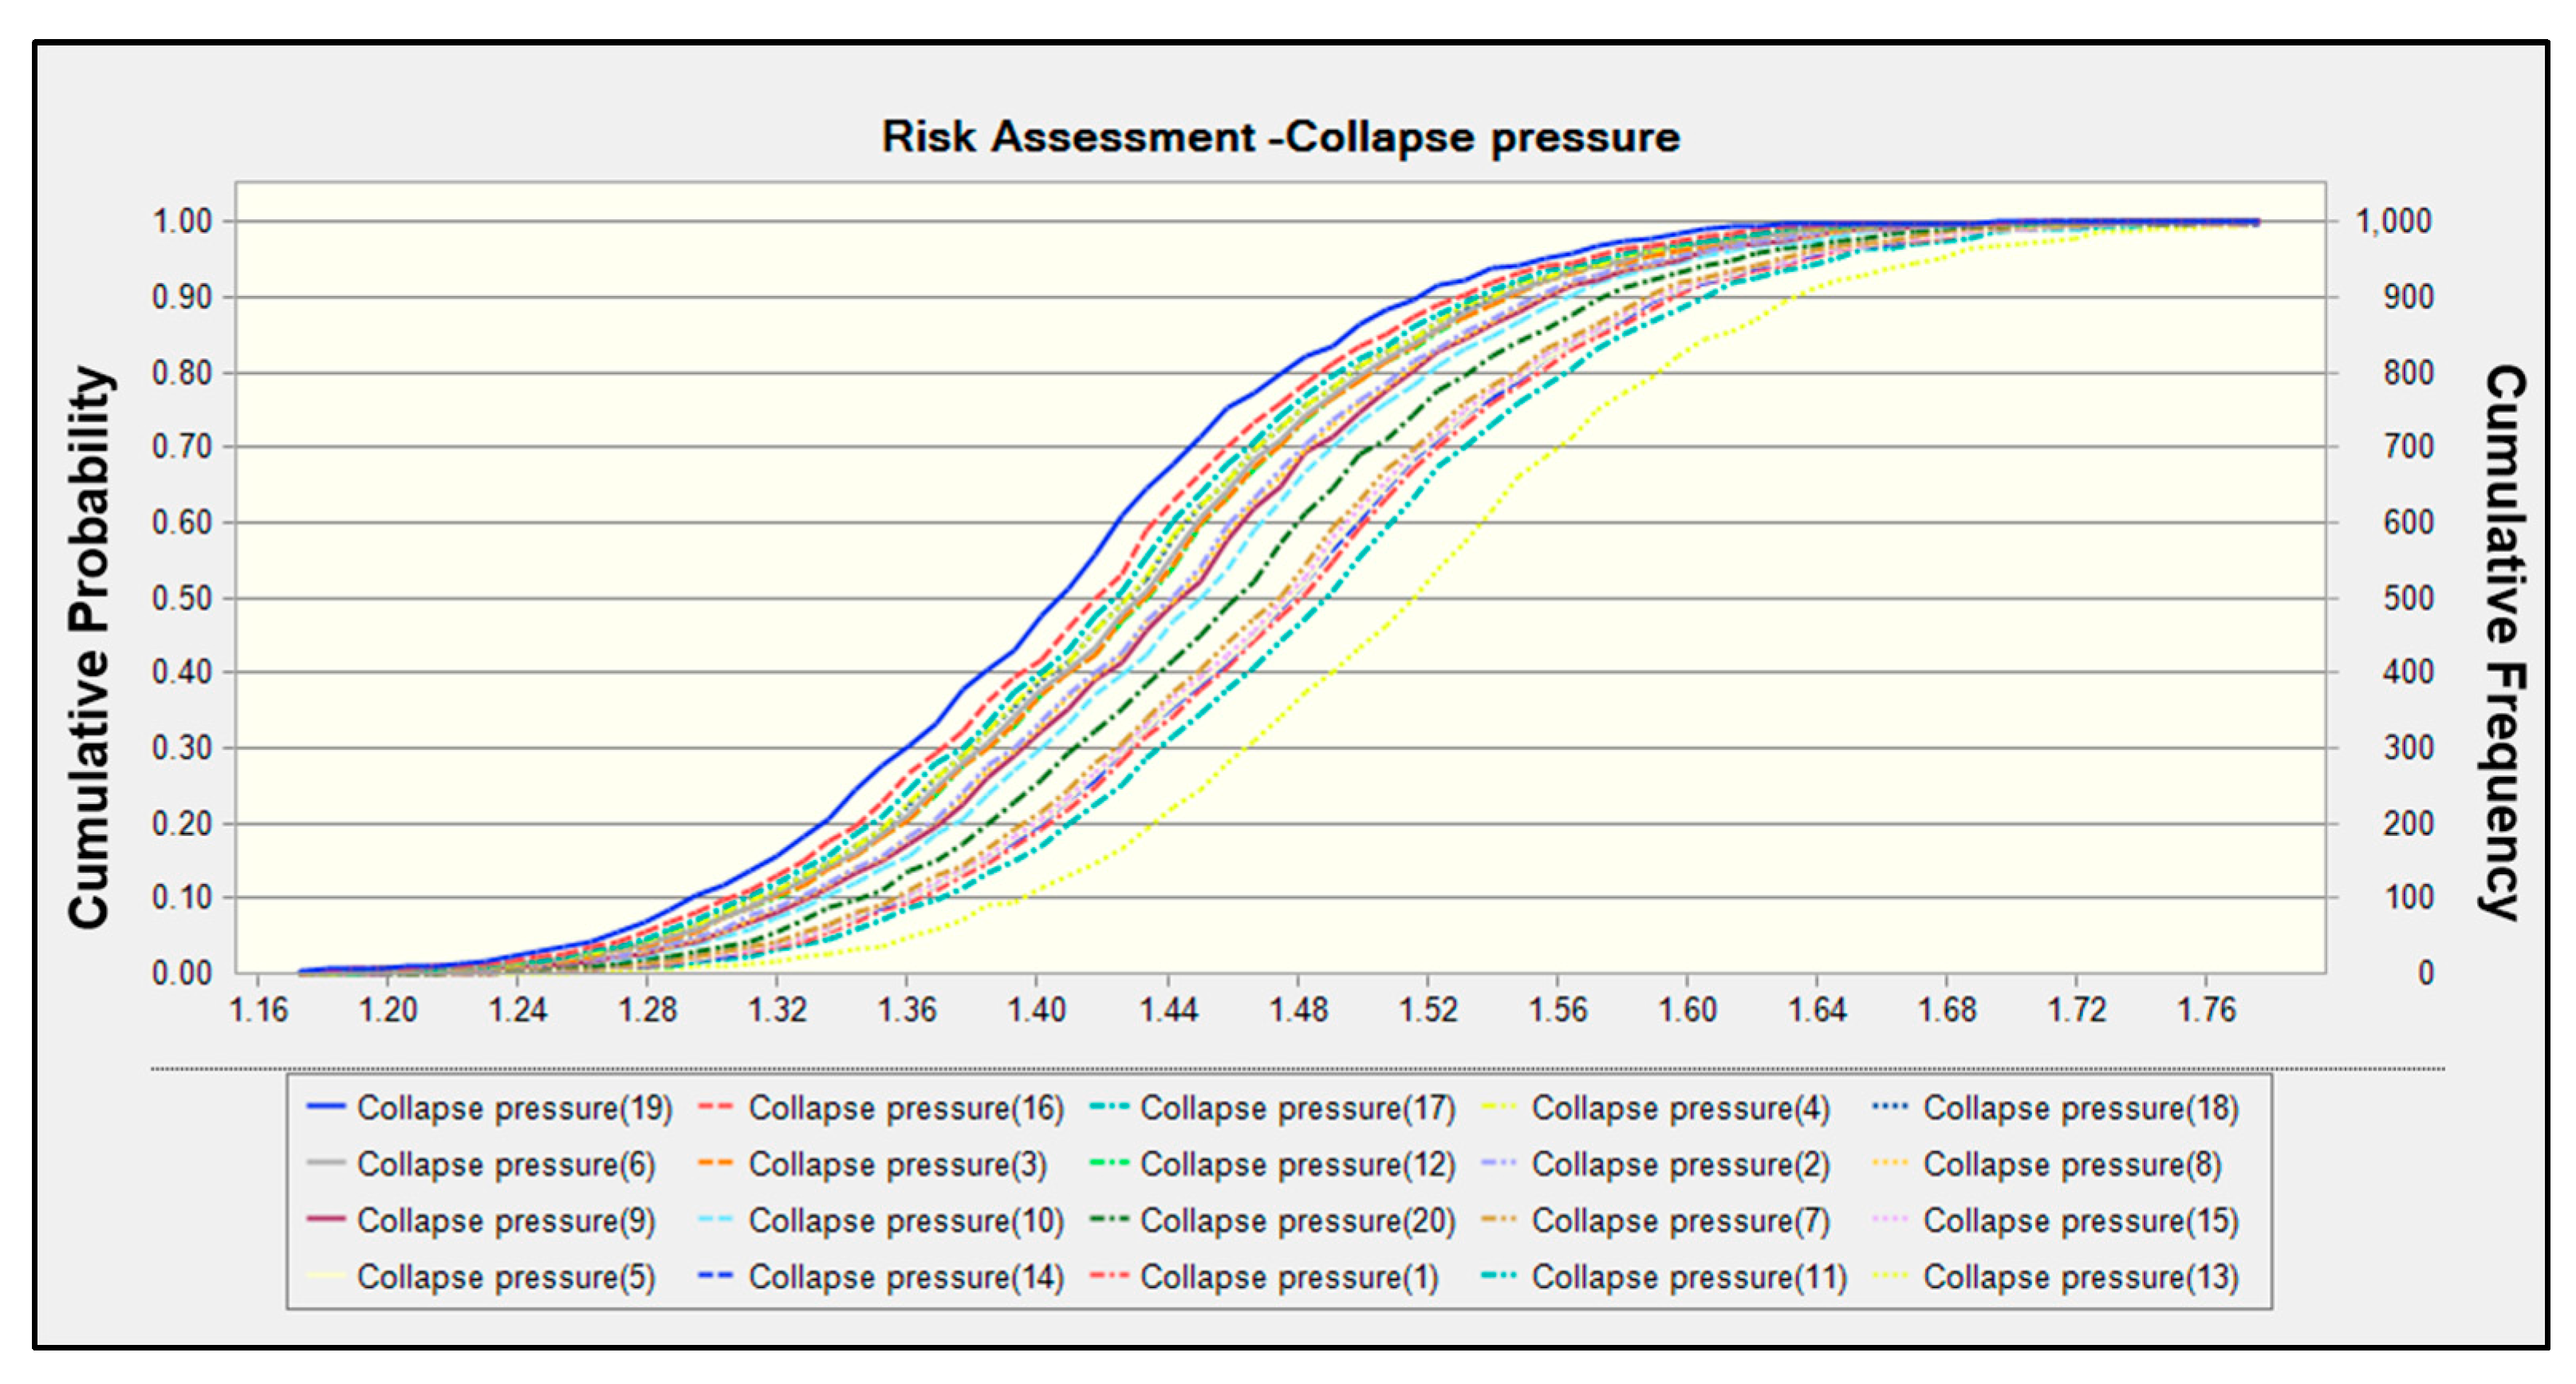
Figure 12.
Risk curve superposition diagram-uncertainty of rock mechanics.


Table 1.
Statistical characteristics of random input parameters.
| Random Variable | Mean | Standard Deviation | Coefficient of Variation | Cumulative Probability | |
|---|---|---|---|---|---|
| 5% | 95% | ||||
| Vertical stress/MPa | 128.65 | 7.80 | 0.06 | 115.81 | 141.50 |
| Maximum horizontal stress/MPa | 125.75 | 7.93 | 0.06 | 112.50 | 138.66 |
| Minimum horizontal stress/MPa | 97.03 | 6.93 | 0.07 | 85.65 | 108.07 |
| Pore pressure/MPa | 53.35 | 5.41 | 0.10 | 44.65 | 62.34 |
| Cohesion/MPa | 7.58 | 3.25 | 0.43 | 2.45 | 12.98 |
| Rock internal friction angle/° | 41.51 | 2.9 | 0.07 | 36.91 | 46.22 |
| Tensile strength/MPa | 3.79 | 1.62 | 0.43 | 1.10 | 6.52 |
Table 2.
Statistical results of collapse pressure.
| Amount | Mean g/cm3 | Standard Deviation g/cm3 | Coefficient of Variation | Cumulative Probability | Minimum Value g/cm3 | Maximum Value g/cm3 | |
|---|---|---|---|---|---|---|---|
| 5% | 95% | ||||||
| 4000 | 1.45 | 0.07 | 0.0483 | 1.27 | 1.64 | 1.11 | 1.78 |
Table 3.
Statistical results of fracture pressure.
| Amount | Mean g/cm3 | Standard Deviation g/cm3 | Coefficient of Variation | Cumulative Probability | Minimum Value g/cm3 | Maximum Value g/cm3 | |
|---|---|---|---|---|---|---|---|
| 5% | 95% | ||||||
| 4000 | 2.04 | 0.15 | 0.0735 | 1.98 | 2.94 | 1.51 | 2.57 |
Table 4.
The experimental stress data of Qiudong Depression.
| Name | Depth /m | Maximum Horizontal Stress /MPa | Minimum Horizontal Stress /MPa | Vertical Stress /MPa |
|---|---|---|---|---|
| J3801H | 2687 | 68.09 | 57.21 | 59.75 |
| Jf101H | 2894.16 | 71.19 | 59.75 | 60.30 |
| 3257.97 | 80.52 | 70.19 | 68.68 | |
| J7H | 4699.57 | 125.96 | 107.43 | 103.1 |
| J10 | 5366 | 135.54 | 101.09 | 140.17 |
| 5383.27 | 134.31 | 115.51 | 144.13 |
Disclaimer/Publisher’s Note: The statements, opinions and data contained in all publications are solely those of the individual author(s) and contributor(s) and not of MDPI and/or the editor(s). MDPI and/or the editor(s) disclaim responsibility for any injury to people or property resulting from any ideas, methods, instructions or products referred to in the content. |
© 2024 by the authors. Licensee MDPI, Basel, Switzerland. This article is an open access article distributed under the terms and conditions of the Creative Commons Attribution (CC BY) license (https://creativecommons.org/licenses/by/4.0/).
Share and Cite
MDPI and ACS Style
Jia, R.; Zhu, L.; Song, X.; Chen, J. Risk Analysis of Wellbore Instability of “Felt Layer” in Qiudong Sag Based on Monte Carlo Method. Processes 2024, 12, 578. https://doi.org/10.3390/pr12030578
AMA Style
Jia R, Zhu L, Song X, Chen J. Risk Analysis of Wellbore Instability of “Felt Layer” in Qiudong Sag Based on Monte Carlo Method. Processes. 2024; 12(3):578. https://doi.org/10.3390/pr12030578
Chicago/Turabian StyleJia, Ruixue, Liang Zhu, Xiaoping Song, and Jian Chen. 2024. "Risk Analysis of Wellbore Instability of “Felt Layer” in Qiudong Sag Based on Monte Carlo Method" Processes 12, no. 3: 578. https://doi.org/10.3390/pr12030578
Note that from the first issue of 2016, this journal uses article numbers instead of page numbers. See further details here.