Article

Northern Lights: Prospecting Efficiency in Europe’s Renewable Energy Sector

Department of Industrial Engineering and Management, National Kaohsiung University of Science and Technology, Kaohsiung 80778, Taiwan
*
Author to whom correspondence should be addressed.
Processes 2024, 12(3), 618; https://doi.org/10.3390/pr12030618
Submission received: 4 March 2024 / Revised: 19 March 2024 / Accepted: 19 March 2024 / Published: 20 March 2024

Abstract

:
Northern European nations are at the forefront of renewable energy adoption but face challenges in optimizing energy conversion efficiency. There is a lack of detailed understanding of how behavioral factors affect the efficiency of renewable energy conversion in these countries. This study aims to evaluate and compare the renewable energy conversion efficiency of Northern European countries, intending to inform strategic policy making and identify best practices for technology deployment in the renewable energy sector. Employing a Data Envelopment Analysis (DEA) model, the study integrates behavioral economic parameters—specifically, the aversion loss and gain significance coefficients—to assess the efficiency of renewable energy conversion, accounting for psychological factors in decision making. A comprehensive sensitivity analysis was conducted, varying the gain significance coefficient while maintaining the aversion loss coefficient at constant levels. This experiment was designed to observe the impact of behavioral parameters on the efficiency ranking of each country. The analysis revealed that Latvia consistently ranked highest in efficiency, irrespective of the gain significance valuation, whereas Iceland consistently ranked lowest. Other countries demonstrated varying efficiency rankings with changes in gain significance, indicating different behavioral economic influences on their renewable energy sectors. Theoretically, the study enhances the DEA framework by integrating behavioral economics, offering a more holistic view of efficiency in renewable energy. Practically, it provides a benchmarking perspective that can guide policy and investment in renewable energy, with sensitivity analysis underscoring the importance of considering behavioral factors. The research offers a practical tool for policymakers and energy stakeholders to align renewable energy strategies with behavioral incentives, aiming to improve the adoption and effectiveness of these initiatives.

1. Introduction

The transition towards renewable energy (RE) sources has emerged as a critical global mandate, driven by the escalating environmental concerns and the geopolitical instability that impacts fossil fuel markets [1]. The global energy landscape is undergoing a significant transformation, with renewable energy’s share in the power sector expected to increase from 25% in 2019 to over 30% by 2024, according to the International Energy Agency (IEA) [2]. This shift is further emphasized by the urgent need to reduce greenhouse gas emissions, where the energy sector accounts for approximately two-thirds of global emissions, underscoring the critical role of renewable energy in achieving climate goals [3].
Compounding these environmental imperatives is the geopolitical volatility associated with traditional energy sources [4]. A dependence on Russia’s oil and gas industry, for example, has been a stark reminder of the vulnerabilities many regions face concerning energy security and autonomy. In 2021, Europe imported approximately 40% of its natural gas and 27% of its oil from Russia, highlighting the region’s exposure to geopolitical risks and the urgency of diversifying energy sources [5].
In this context, the Northern European countries—Denmark, Estonia, Finland, Iceland, Ireland, Latvia, Lithuania, Norway, Sweden, and the United Kingdom—stand out for their proactive approach to embracing renewable energy [6]. Blessed with abundant natural resources, these nations have demonstrated a strong commitment to renewable energy, at least 20% of their energy consumption coming from renewable sources as of 2020 [7]. Their efforts are not only aimed at enhancing national energy security but also at contributing to global sustainability objectives [8]. However, transitioning to renewable energy is fraught with challenges, particularly regarding the need for substantial advancements in the efficiency of renewable energy conversion technologies and systems to meet growing energy demands sustainably [9,10].
Despite an increasing focus on renewable energy, a significant research gap persists in understanding and quantifying the efficiency of renewable energy conversion processes, especially within the Northern European context. This gap is critical as it influences the development of effective policies and the optimization of renewable energy systems for maximum productivity and sustainability. A review of the existing literature reveals a proliferation of studies on renewable energy deployment, yet few delve into the nuanced analysis of conversion efficiency in the Northern European region [11,12,13,14]. This lack of detailed efficiency metrics hinders the ability to fully leverage the potential of renewable resources, necessitating a more focused and analytical approach to assess and enhance the performance of renewable energy technologies.
The urgency of addressing these challenges cannot be overstated. As the world moves towards a more sustainable and secure energy future, the insights gained from evaluating the efficiency of renewable energy conversion in the Northern European countries could provide valuable lessons for global energy policy and technology development. This underscores the need for comprehensive research that not only identifies the current state of renewable energy efficiency but also proposes innovative solutions to improve it, thereby supporting the global transition towards a more resilient and sustainable energy system.
This study is motivated by the need to bridge these gaps through a comprehensive evaluation of the efficiency of renewable energy conversion in Northern European countries. It aims to provide actionable insights for policymakers and industry stakeholders to foster the development of more efficient, resilient, and sustainable energy systems. To achieve this, the study sets forth two primary objectives: a practical objective to evaluate the efficiency of renewable energy conversion for policy development, and a theoretical objective to propose and apply a robust Data Envelopment Analysis (DEA) model enhanced with prospect theory. This dual approach will facilitate a more nuanced understanding of the efficiency landscapes and the decision-making processes governing renewable energy investments and operations in the Northern European region.
This article is structured as follows: Section 1 outlines the study’s background, motivation, and aims. Section 2 conducts a thorough literature review, identifying prior research and research gaps. Section 3 details the study’s methodologies, particularly the use of a data analysis envelopment model enhanced with prospect theory. Section 4 delivers the numerical findings, analyzing renewable energy conversion efficiency in the Nordic countries. Section 5 wraps up the research, summarizing the main insights, policy implications, and directions for further investigation.

2. Literature Review

2.1. Renewable Energy Studies in Northern Eupopean

The research landscape on renewable energy in Europe encompasses studies that span various aspects, including policy frameworks, economic impacts, technological advancements, and environmental sustainability [15,16]. Campos et al. (2020) underscore the evolving role of RE prosumers within the EU, influenced by policies that transition consumers to active energy participants [17]. This study identifies France, Germany, the Netherlands, and the United Kingdom as leaders in creating favorable conditions for collective prosumers, marking a significant move towards energy democratization and sustainability. Economic relationships between growth, carbon emissions, and renewable energy consumption have been explored by Radmehr, Riza et al. in their 2021 study, alongside Simionescu et al. (2023), both of which reveal strong spatial correlations across EU countries [13,18]. They highlight a bidirectional link between economic growth and renewable energy consumption, offering vital insights for policy development aimed at sustainable growth.
From an environmental perspective, the 2020 study by Destek and Aslan emphasizes the varied impacts of different renewable energy sources on carbon emissions, suggesting the need for policies tailored to the characteristics of each energy type [19]. Johannsen et al.’s 2023 research on decarbonizing the European industrial sector further stresses the potential of existing technologies, energy savings, and electrification for achieving environmental goals [20]. Potrč et al. (2021) and Tutak et al. (2022) investigate the socio-economic benefits of the EU’s renewable energy transition, aiming for a carbon-neutral status by 2050 [3,21,22]. Their findings point to the significant potential of wind and solar power and the positive effects of renewable energy on economic growth and emission reductions. In terms of technology innovation, Panchenko et al. (2023) delve into “green” hydrogen production’s future, emphasizing its importance in moving towards cleaner energy sources and enhancing energy independence [23]. This highlights the sector’s continuous innovation and technological progress.
Despite the breadth of research, a notable gap exists in the detailed analysis of renewable energy conversion efficiency, especially within Northern European countries. This study seeks to address this by evaluating the efficiency of renewable energy conversion in these regions, employing a data analysis envelopment model with prospect theory enhancements. This comprehensive approach aims to shed light on efficiency dynamics, guiding policy and technological advancements in Northen Europe.

2.2. Data Envelopment Analysis Studies

The exploration of DEA across a diverse array of sectors, with a notable emphasis on the renewable energy domain, showcases its broad applicability and efficiency in performance evaluations and efficiency assessments. In 2020, the work of Kaffash brought to light DEA’s growing significance within the insurance sector, highlighting its capacity to evaluate the operational efficiency of insurance firms amidst rapidly evolving market conditions and technological advancements [24]. This pivotal insight not only underscores the adaptability of DEA but also sets the stage for its application in critical areas such as the assessment of renewable energy efficiency, marking a significant leap towards broader utility in various industrial domains. Building upon this foundation, the research conducted by Tao Xu et al. further reinforces the importance of DEA in the energy sector, illuminating its widespread adoption for conducting detailed energy efficiency studies spanning the years from 2011 to 2019 [25]. In a similar vein, the work of Fotova Čiković and Lozić (2022) [26], along with Dutta et al. (2022) [27], ventures beyond traditional applications, extending DEA’s reach into the realms of Information and Communication Technology (ICT) and supply chain management, respectively. These studies collectively highlight DEA’s instrumental role in streamlining processes and bolstering sustainability efforts, attributes that are directly translatable and immensely beneficial to renewable energy initiatives.
The innovative approach introduced by Le and Nhieu represents a significant advancement in the application of DEA, marrying the methodology with behavioral insights and fuzzy Multi-Criteria Decision-Making (MCDM) techniques in 2022. This novel integration facilitates the selection of offshore wind and wave energy projects, demonstrating DEA’s flexibility and effectiveness in navigating the intricate decision-making landscapes inherent in renewable energy projects [28]. Additionally, research by Kyrgiakos et al. (2023) showcases DEA’s application within the agricultural sector with a focus on sustainability, offering valuable insights into how the methodology can be leveraged to evaluate renewable energy initiatives through a comprehensive sustainability framework [29]. The groundbreaking work of Tavana et al. (2023) and Chia-Nan Wang et al. (2024) marks a significant evolution in DEA’s application, incorporating behavioral theories and hybrid decision-making frameworks to refine and enhance the evaluation of renewable energy projects [30,31,32].
These developments not only underscore the methodological advancements within DEA but also spotlight the promising potential of applying DEA within Europe’s renewable energy sector. Specifically, these advancements point towards the optimization of offshore energy exploitation and the meticulous selection of projects, guided by a thorough analysis of efficiency metrics. Such applications of DEA promise to offer comprehensive insights and robust frameworks for evaluating the sustainability and efficiency of renewable energy projects, thereby contributing significantly to the advancement of Europe’s renewable energy objectives.
The comprehensive review underscores the significant strides made in the application of DEA across various sectors, highlighting its evolving role in enhancing efficiency and performance evaluations. Notably, although DEA’s adaptability and effectiveness have been demonstrated in fields ranging from insurance to agriculture, its application within the renewable energy sector, particularly in Northern European countries, remains underexplored. This identified gap in the detailed analysis of renewable energy conversion efficiency in these regions presents a critical area for further research.
The current study aims to bridge this gap by employing a data analysis envelopment model, enhanced with prospect theory, to evaluate the efficiency of renewable energy conversion in Northern Europe. This endeavor seeks not only to understand the efficiency dynamics but also to inform policy and technological advancements in the region. The methodological advancements within DEA, highlighted by the research reviewed, underscore the potential for DEA’s application in optimizing offshore energy exploitation and in the careful selection of renewable energy projects. By conducting a thorough analysis of efficiency metrics, this approach promises to offer comprehensive insights and robust frameworks for evaluating the sustainability and efficiency of renewable energy projects.

3. Methodology

3.1. Traditional DEA Model

In 1978, a groundbreaking achievement in operations research and efficiency assessment was marked by the introduction of the pioneering DEA model by Charnes and his collaborators, commonly known as the CCR (Charnes, Cooper and Rhodes) model. This model revolutionized the evaluation of technical efficiency across various sectors, operating on the premise of constant returns to scale, a fundamental concept in optimization [33]. However, as real-world applications unfolded, the limitation of universal applicability became apparent, leading to further advancements in DEA methodologies. In response, Banker and his team introduced the BCC (Banker, Chames and Cooper) model, accounting for variable returns to scale and enhancing flexibility and realism in analysis [34]. The comprehensive DEA framework, comprising both CCR and BCC models, serves as a vital tool for evaluating the performance of Decision-Making Units (DMUs) managing multiple inputs to produce diverse outputs. Technical efficiency ( E k ) for each DMU ( k th) is calculated using a mathematical model (1), which considers intricate input–output relationships, enabling not only efficiency quantification but also identification of improvement areas and resource optimization. The DEA methodology remains integral in addressing efficiency challenges across industries, evolving continually to meet the needs of decision makers and analysts alike.
m a x i m i z e   E k = ρ + t = 1 T u t m t k S . t . j = 1 J v j n j k = 1 ρ + t = 1 T u t m t i j = 1 J v j n j i 0 i = 1 , , I u t , v j 0 j = 1 , , J ; t = 1 , , T ρ   is   free
In this model, u t and v j represent the weights assigned to the t th output and the j th input, respectively, playing a crucial role in determining the relative importance of each input and output in the efficiency assessment process. Moreover, the values of n j i and m t i hold significance, where n j i denotes the value of the j th input for the i th DMU and m t i signifies the value of the t th output for the same DMU, serving as the actual data for inputs and outputs used in the efficiency calculation. These values form the foundation upon which DEA evaluates the performance of DMUs. The primary objective of DEA is to ascertain the effectiveness of each DMU, with a DMU being deemed effective when its technical efficiency ( E k ) equals 1. This signifies that the DMU is operating optimally, utilizing its inputs fully to generate the desired outputs without inefficiencies, thereby serving as a benchmark for others to emulate, indicative of exceptional performance and operating at the frontier of its production possibility.

3.2. Prospect Theory

Introduced by Kahneman and Tversky in 1979 [35], prospect theory has emerged as a foundational concept in behavioral economics, permeating numerous disciplines [36,37]. This theory delineates three key principles governing human decision making. Firstly, individuals evaluate gains and losses in relation to a reference point rather than absolute values, shaping their perception of outcomes—a concept known as reference dependence. Secondly, the theory highlights loss aversion, revealing that individuals are typically more sensitive to losses than equivalent gains, resulting in an asymmetrical impact on decision-making processes. Finally, prospect theory suggests diminishing sensitivity, indicating that individuals exhibit risk-seeking behavior in scenarios of potential losses but tend to be risk averse when facing potential gains, underscoring how the marginal utility of wealth decreases as wealth increases.
These principles collectively underpin the prospective value function, graphically represented by an asymmetrical S-shaped curve. This function embodies reference dependence, loss aversion, and diminishing sensitivity, providing a visual framework for understanding decision-making processes. Mathematically expressed as Equation (2), the value function ( f Δ t ) incorporates parameters such as γ , δ , and θ to quantify decision makers’ attitudes towards risk and loss aversion. By leveraging these parameters, the equation offers a quantitative model for analyzing human behavior influenced by prospect theory, facilitating predictive insights across diverse decision-making scenarios [38]. In Equation (2), Δ t represents the difference in value with respect to the reference point. If Δ t is positive, this difference is considered a gain and it is calculated into the value function corresponding to the level of concern the decision maker has for gains ( γ ). Conversely, if Δ t is negative, it is included in the value function based on the decision maker’s level of concern about losses ( δ ) . Furthermore, losses can also be mitigated depending on the psychological behavior of the decision maker calculated through the loss aversion coefficient ( θ ).
f Δ t = Δ t γ , Δ t 0 ;   0 < γ < 1 θ Δ t δ , Δ t < 0 ;   0 < δ < 1

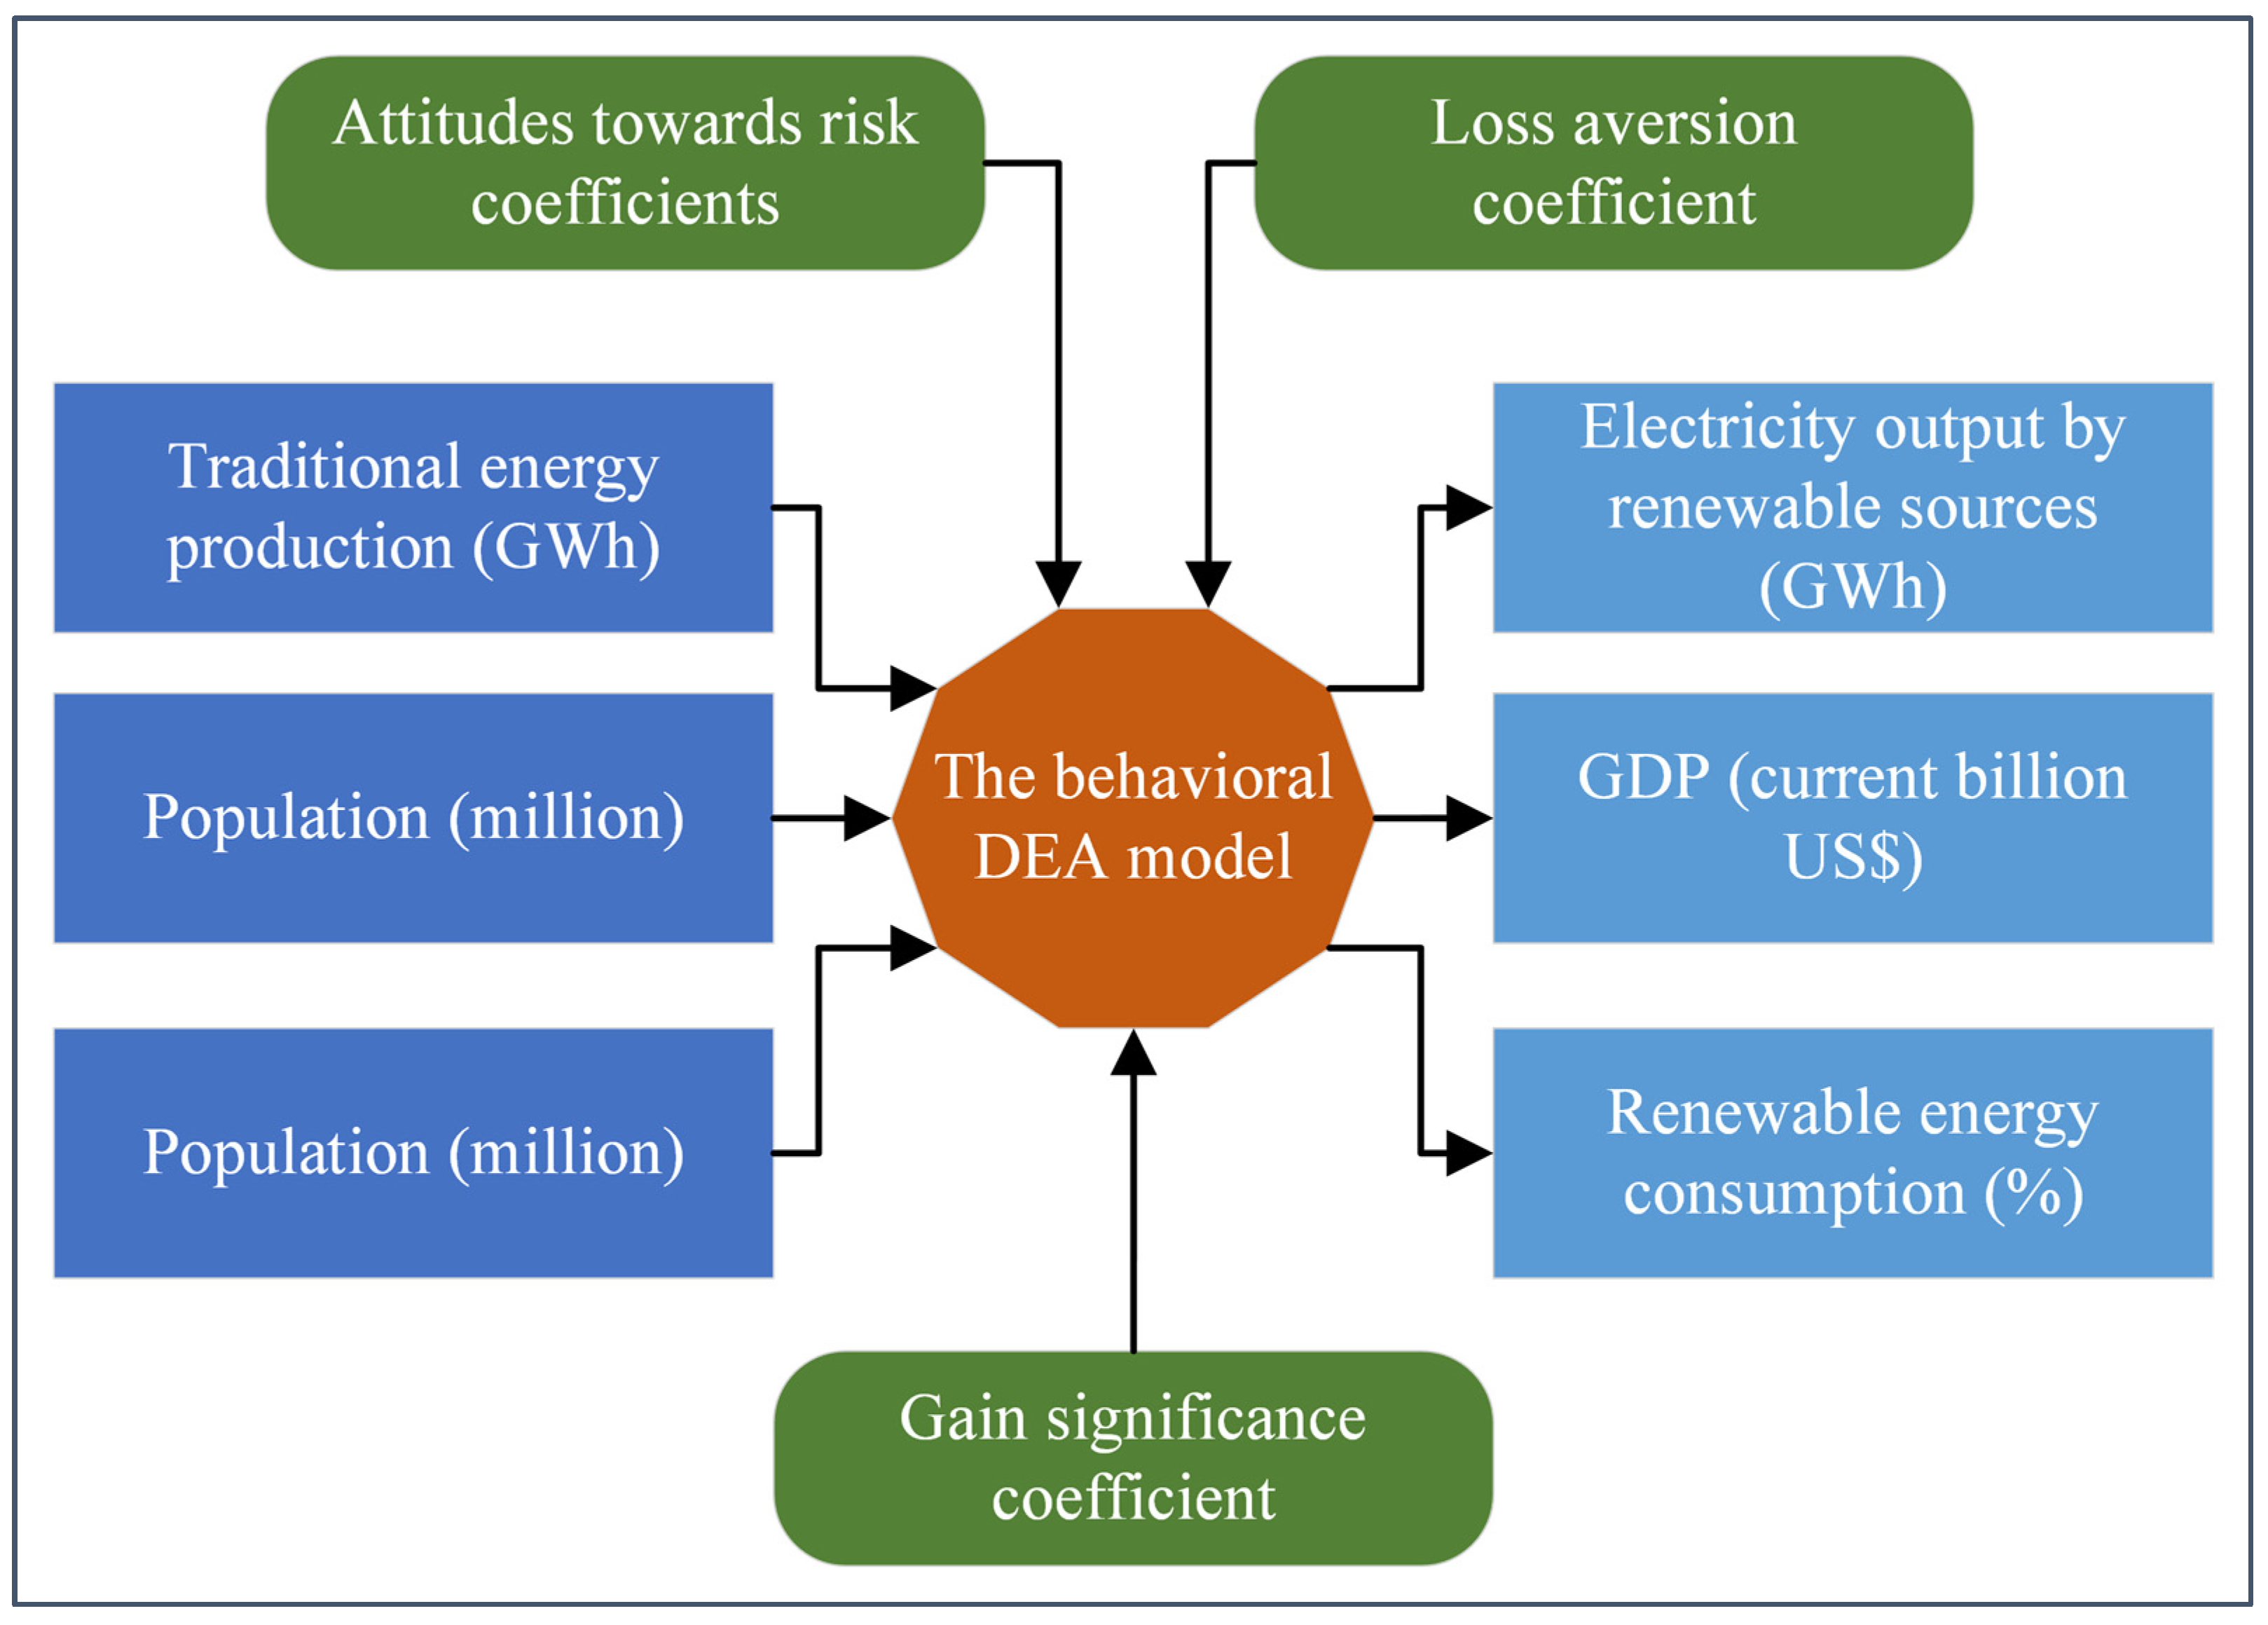
3.3. The Behavioral DEA Model

Chen et al. have innovatively applied prospect theory principles to the domain of DEA, introducing a novel approach to assessing efficiency with a consideration of risk [39]. This novel behavioral DEA model unfolds through distinct steps tailored to capture the cognitive intricacies inherent in decision making under risk and uncertainty.
The initial step involves the normalization of inputs and outputs ( x j i and y i j , respectively), as delineated by Equations (3) and (4). Normalization plays a pivotal role in enabling a fair comparison among varied decision-making units, effectively accommodating the inherent biases and subjectivity inherent in human decision-making processes.
x j i = n j i m a x n j i n j i m a x n j i m i n i = 1 , , I ; j = 1 , , J
y t i = m t i m t i m i n m t i m a x m t i m i n i = 1 , , I ; t = 1 , , T
The second step entails the identification of reference points to integrate the psychological aspects emphasized by prospect theory into the model. Both positive and negative reference points are identified to comprehend how individuals perceive and respond to gains and losses. These reference points, as depicted in Equations (5) and (6), serve as crucial benchmarks against which gains and losses are assessed, aligning with the reference dependence principle elucidated in prospect theory.
The positive reference points ( n j +   a n d   m t + ) :
n j + = min i ( x j i ) ; m t + = max i ( y t i )
The negative reference points ( n j   a n d   m t ) :
n j = max i ( x j i ) ; m t = min i ( y t i )
In the third and final step, the behavioral DEA model is formulated, as delineated in Model (7). This model integrates the normalized inputs and outputs, reference points, and the principle of diminishing sensitivity, which reflects individuals’ responses to gains and losses. The coefficient φ holds significance within this framework, representing the relative weight assigned to gains compared to losses. A value of 0.5 for φ denotes an equal consideration of gains and losses, indicating a balanced approach by decision makers. In model (7), the objective function is divided into two parts. The first parentheses are the gains, and the second parentheses describe the losses of each DMUs. The basis of this objective function is developed from the idea of expected value discussed in Equation (2). Meanwhile, the constraints of the model comply with the principles of the traditional DEA model as presented in Model (1).
M a x i m i z e   Z = φ ρ + t = 1 T u t k y t k m t γ + j = 1 J v j k n j x j k γ 1 φ ρ + t = 1 T u t k θ m t + y t k δ + j = 1 J v j k θ x j k n j + δ S u b j e c t   t o j = 1 J v j k n j k = 1 ρ + t = 1 T u t i m t i j = 1 J v j i n j i 0 i = 1 , , I u t i ,   v j i 0 , ρ   is   free j = 1 , , J ; t = 1 , , T ; i = 1 ,   , I

4. Numerical Results

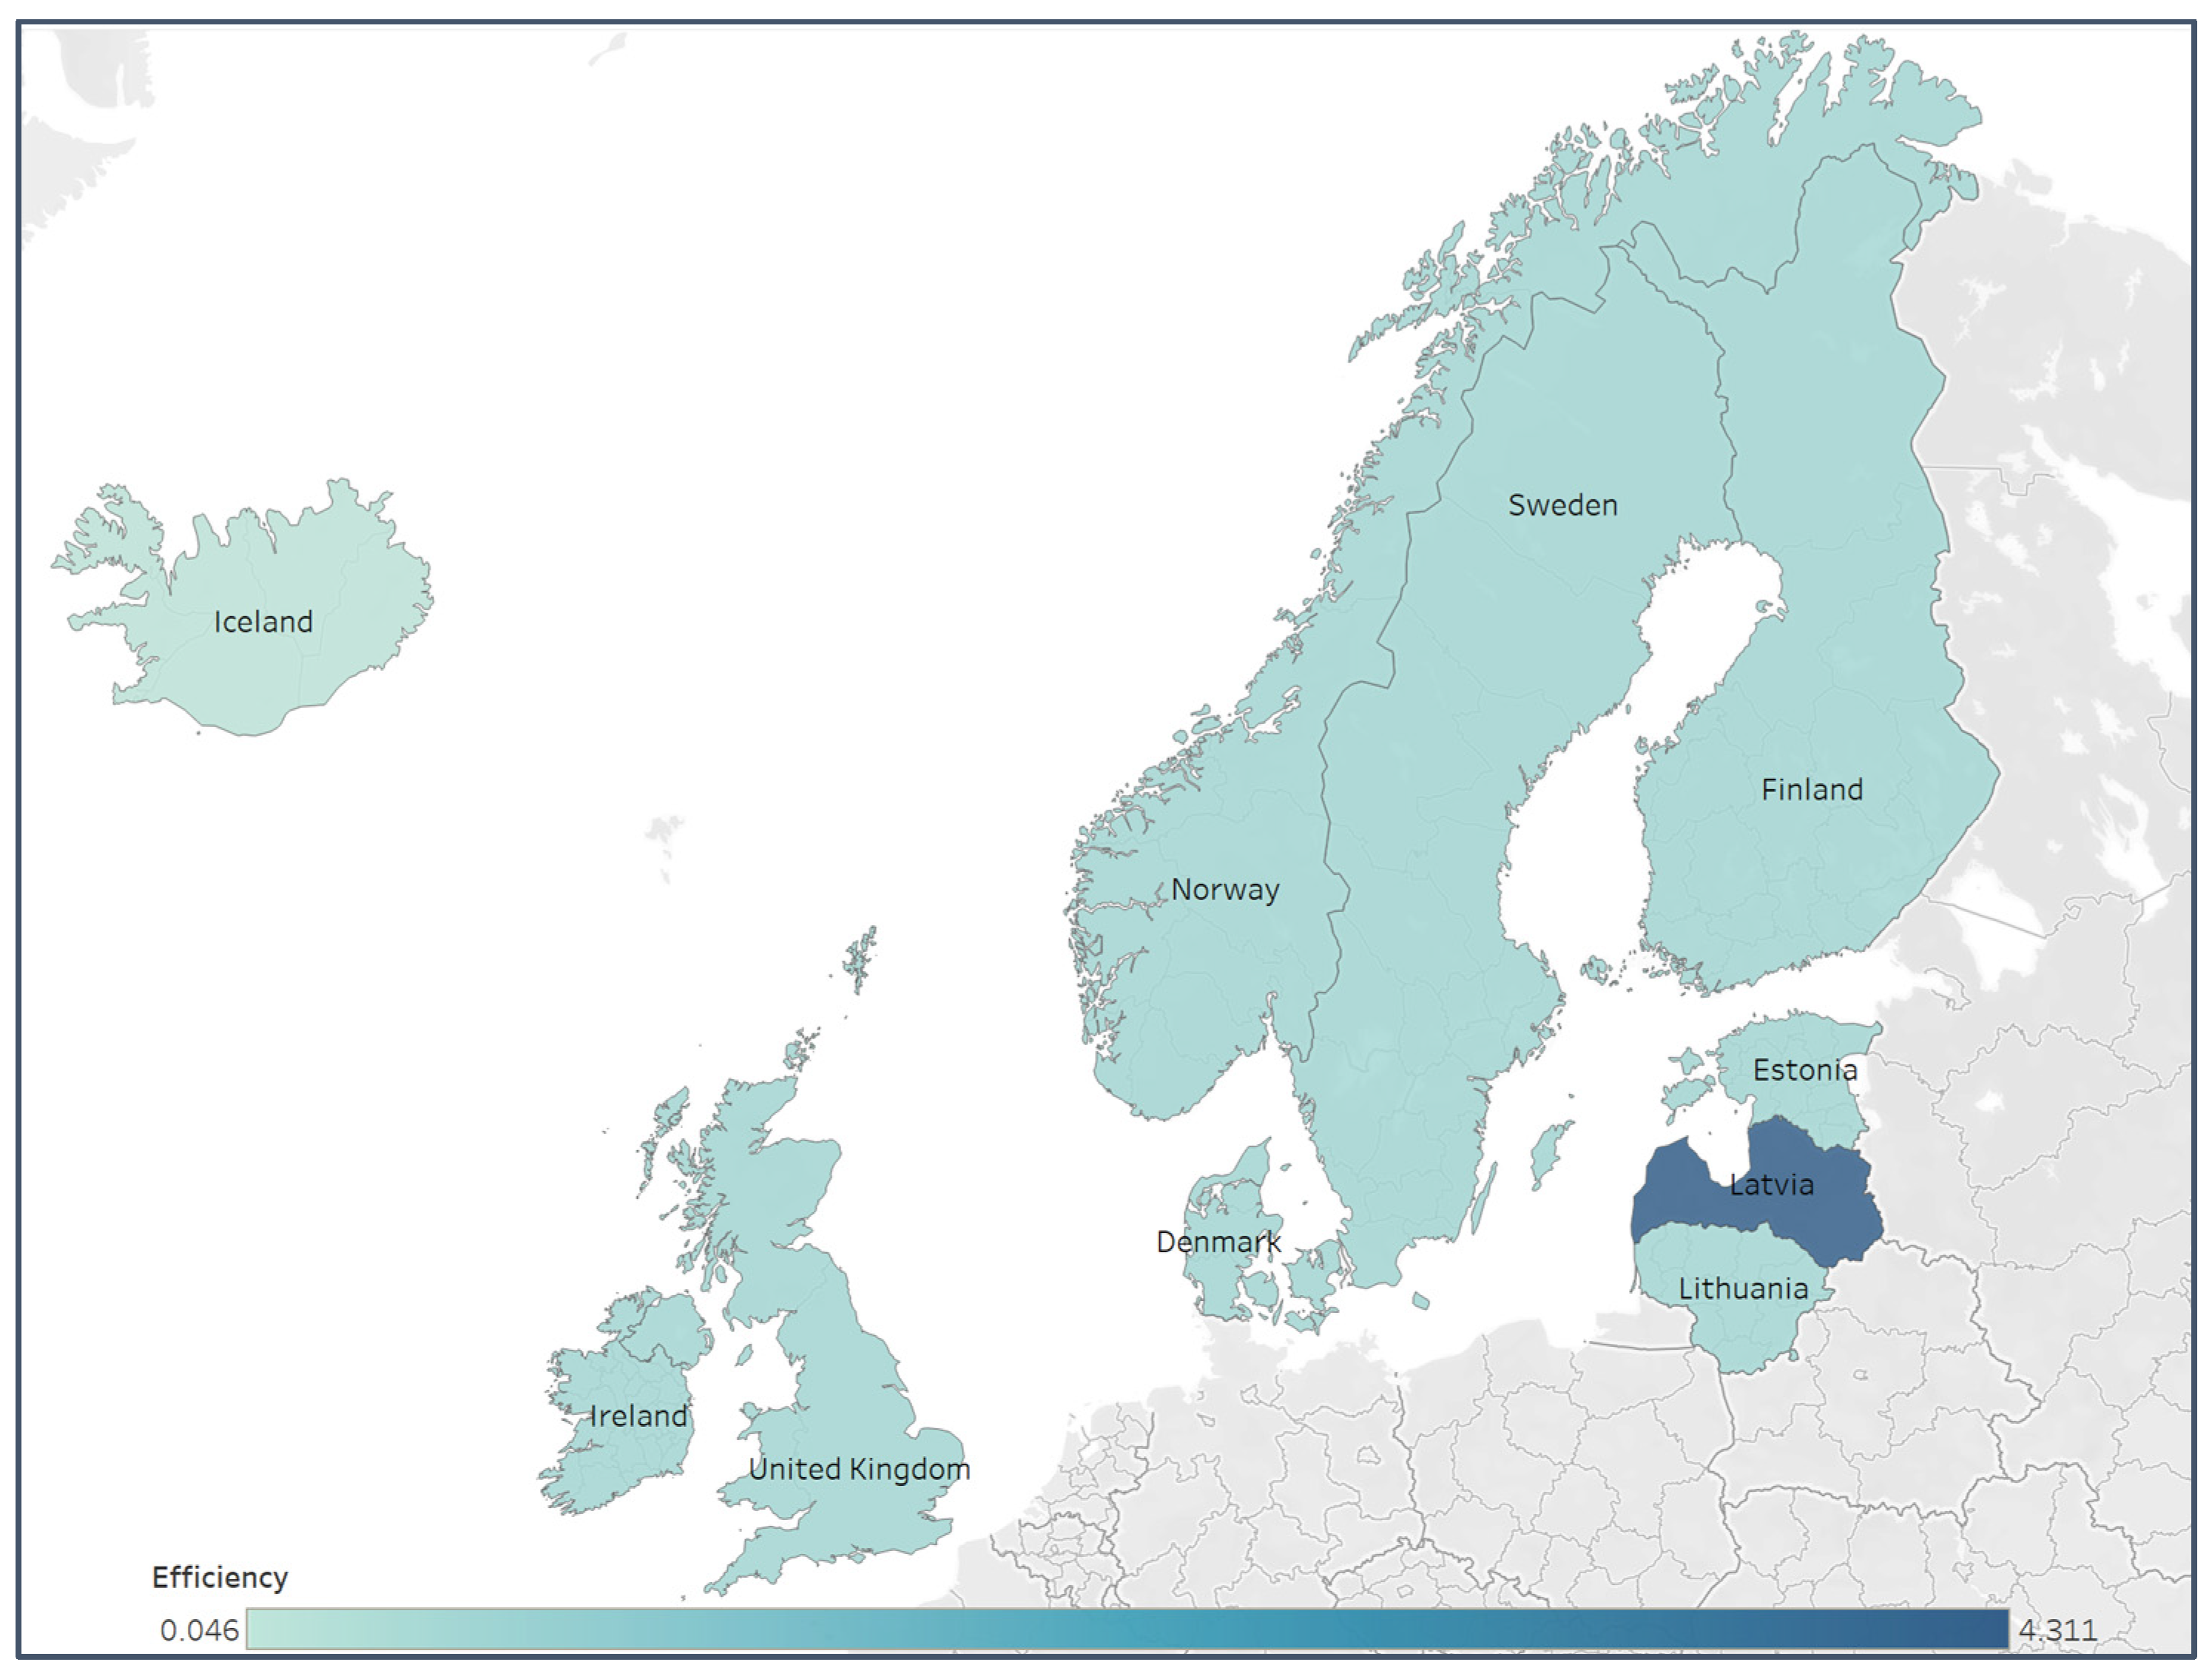
4.1. Problem Description

The pursuit of renewable energy efficiency in Northern European countries, including Denmark, Estonia, Finland, Iceland, Ireland, Latvia, Lithuania, Norway, Sweden, and the United Kingdom, has been underscored by the unique challenges and opportunities presented by their geographical and socio-economic conditions. Despite these countries’ commendable strides towards integrating renewable energy into their national grids, there remains a significant problem: the optimization of renewable energy efficiency varies widely across this region. Moreover, the pressing need to transition from fossil fuel dependency to sustainable energy sources has highlighted the urgency of addressing these efficiency variances. The challenge, therefore, lies in identifying and implementing strategies that can elevate the efficiency of renewable energy conversion processes, ensuring that these nations not only meet but exceed their ambitious sustainability targets. This backdrop sets the stage for the proposed study, aiming to delve into the efficiency dynamics of renewable energy conversion within these Northern European countries, employing a comprehensive DEA model to uncover insights that could guide future enhancements in the sector.
In the assessment of renewable energy conversion efficiency within the Northern European context, a set of indicators has been meticulously selected according to references for integration into the proposed behavioral DEA model, where each is assigned a specific role as either an input or an output [14,40,41,42,43,44,45,46]. As shown in Figure 1, traditional energy production (Input 1), quantified through the gigawatt-hours (GWh) of electricity generated from fossil fuels, has been included as an input to serve as a foundational comparison point for the efficiency of renewable sources. This is augmented by the inclusion of the population size (Input 2) of the region, which is utilized to contextualize the demand for energy, thereby providing a backdrop against which the necessity for energy solutions is understood. Furthermore, the environmental repercussions of energy production processes are encapsulated through an indicator that represents the economic impact of particulate emissions (Input 3), calculated as a percentage of the Gross National Income (GNI), thereby underscoring the environmental costs associated with energy production.
On the spectrum of outputs within our model, the focus is directed towards the electricity output derived from renewable sources (Output 1), also measured in GWh, to directly gauge the volume of clean energy generated. The economic impact of energy production and consumption is captured through the Gross Domestic Product (GDP) (Output 2), expressed in current US dollars, which serves as a linkage between energy efficiency and economic prosperity. Moreover, the proportion of renewable energy within the total energy consumption (Output 3) mix is incorporated as an output indicator, reflecting the degree of adoption and integration of renewable sources into the energy landscape, thereby making strides towards achieving sustainability goals.

4.2. Data Collection and Behavioral DEA Application

The study leverages an array of robust data sources to underpin its analysis of renewable energy efficiency in Northern European countries, notably drawing from the World Bank [47], the International Energy Agency (IEA) [48,49], and the International Renewable Energy Agency databases [50,51]. These repositories are renowned for their comprehensive and reliable datasets on global energy statistics.
The comprehensive process of data gathering and its subsequent synthesis have been meticulously documented in Table 1. This initial step set the foundation for the analysis, whereupon the collected data pertaining to the inputs and outputs were subjected to a normalization process, as delineated by Equations (3) and (4), with the normalized figures being systematically presented in Table 2. Following this preparatory phase, the study advanced to the application of the behavioral DEA model, as specified in model (7), which serves as the analytical tool for assessing the efficiency levels across the surveyed countries. The intricate process of efficiency calculation, employing the behavioral DEA model, takes into consideration a set of predefined psychological behavioral parameters. These parameters— φ set at 0.5, θ at 2.25, γ at 0.85, and δ at 0.92—play a crucial role in the model, reflecting the psychological dimensions incorporated into the efficiency analysis.
The results derived from this sophisticated calculation are then graphically represented in Figure 2, offering a visual depiction of the efficiency outcomes across the countries under study. This visual representation not only highlights the efficiency scores determined by the behavioral DEA model but also illustrates the impact of incorporating psychological behavioral parameters into the analysis, as corroborated by references [35,52,53]. Through this detailed approach, the study endeavors to provide a nuanced understanding of efficiency in the context of renewable energy utilization among Northern European countries, accounting for the behavioral factors that influence decision-making processes within this domain.
The efficiency results for renewable energy conversion in Northern European countries present a diverse picture, with efficiency scores ranging notably from as low as 0.046 to an exceptional high of 4.311. Different from traditional DEA models, the DEA model proposed in this study considers the effects of gains and losses at the same time. When the decision maker’s psychology focuses on losses more than gains (reflected through the psychological behavior coefficient), the value of the objective function in the proposed DEA model can be negative. This leads to the proposed DEA model being unsolvable. To overcome this problem, a positive constant is added to the objective function, as ρ in model (7). This is to ensure that the proposed DEA model can solve and describe the difference in efficiency between DMUs. Therefore, the efficiency of DMUs by the proposed DEA model can be larger than 1. Furthermore, this also addresses the situation where two or more DMUs have an efficiency of 1. This makes it impossible to rank or provide more detailed assessments.
The majority of the countries, including Denmark, Estonia, Finland, and Ireland, display a median efficiency score of 0.500. This uniformity suggests these countries are at an average efficiency level, potentially utilizing half of their renewable energy capacity when benchmarked against best practices within the data set. Lithuania, Norway, and Sweden are marginally below this median mark with a score of 0.499, indicating they are very close to their peers in terms of efficiency and might require minimal interventions to enhance their performance. In stark contrast, Iceland’s efficiency score stands at 0.046, signaling a significant efficiency gap compared to other countries in the study. This low score may reflect unique national challenges that hinder efficient renewable energy conversion, necessitating a detailed investigation into potential technological, infrastructural, or policy improvements. On the other end of the spectrum, Latvia’s outlier score of 4.311 is remarkably high, exceeding the conventional DEA score range and suggesting a highly effective renewable energy sector, though this anomalous value could also prompt a verification of data integrity and model specifications to confirm its accuracy.
The United Kingdom slightly exceeds the median with a score of 0.508, hinting at a relatively more efficient renewable energy conversion process compared to most of its regional counterparts. The consistency in the median scores and Latvia’s extraordinary efficiency call for a critical review of the DEA model’s structure, including input–output specification, scale assumptions, and orientation choices. These results underscore the need for both a comprehensive understanding of the factors driving Latvia’s efficiency and a focused analysis of Iceland’s renewable energy strategies to address its efficiency shortfall.

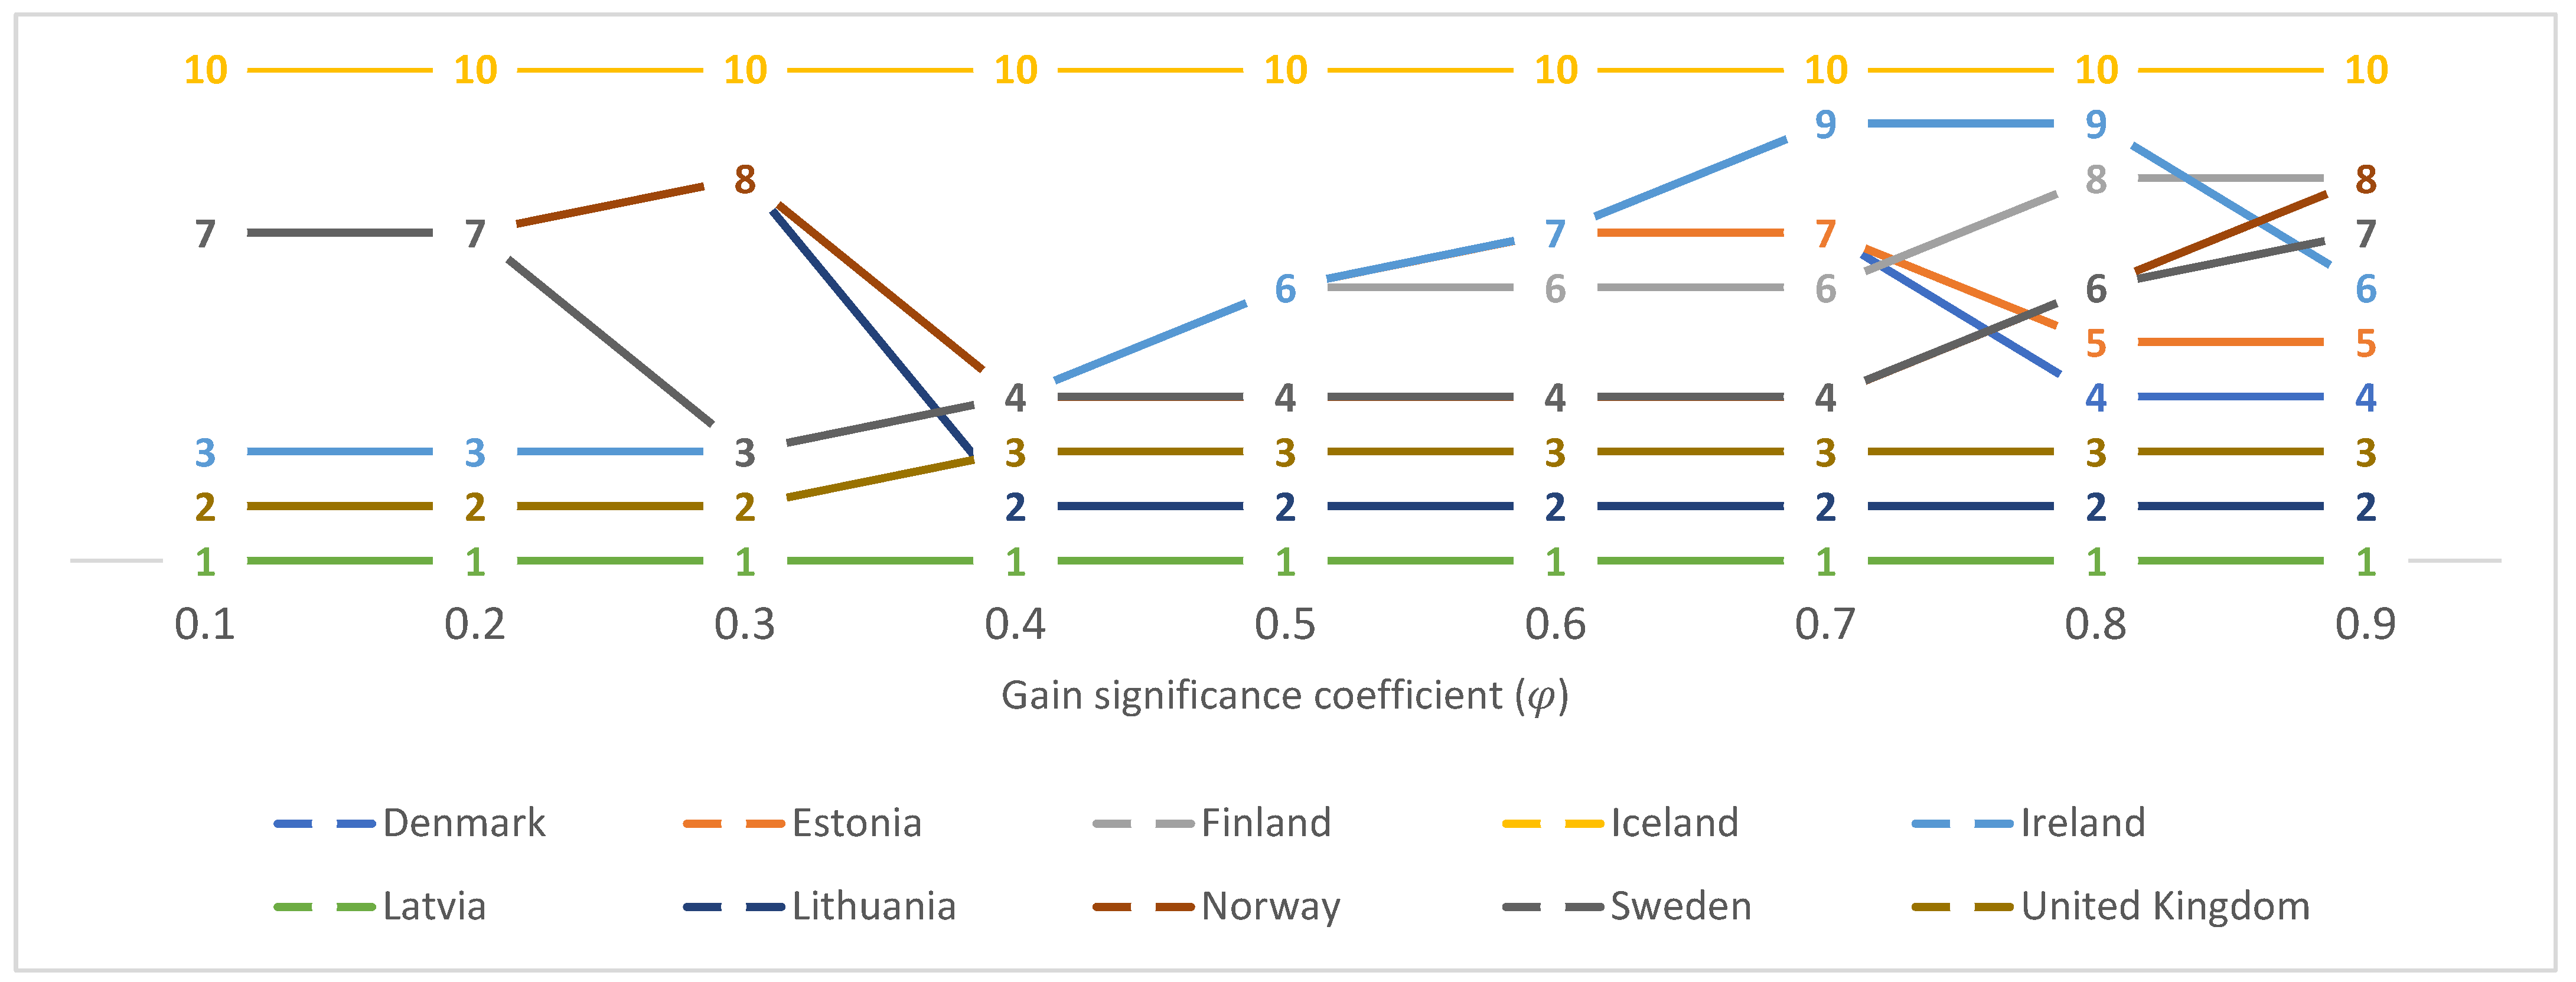
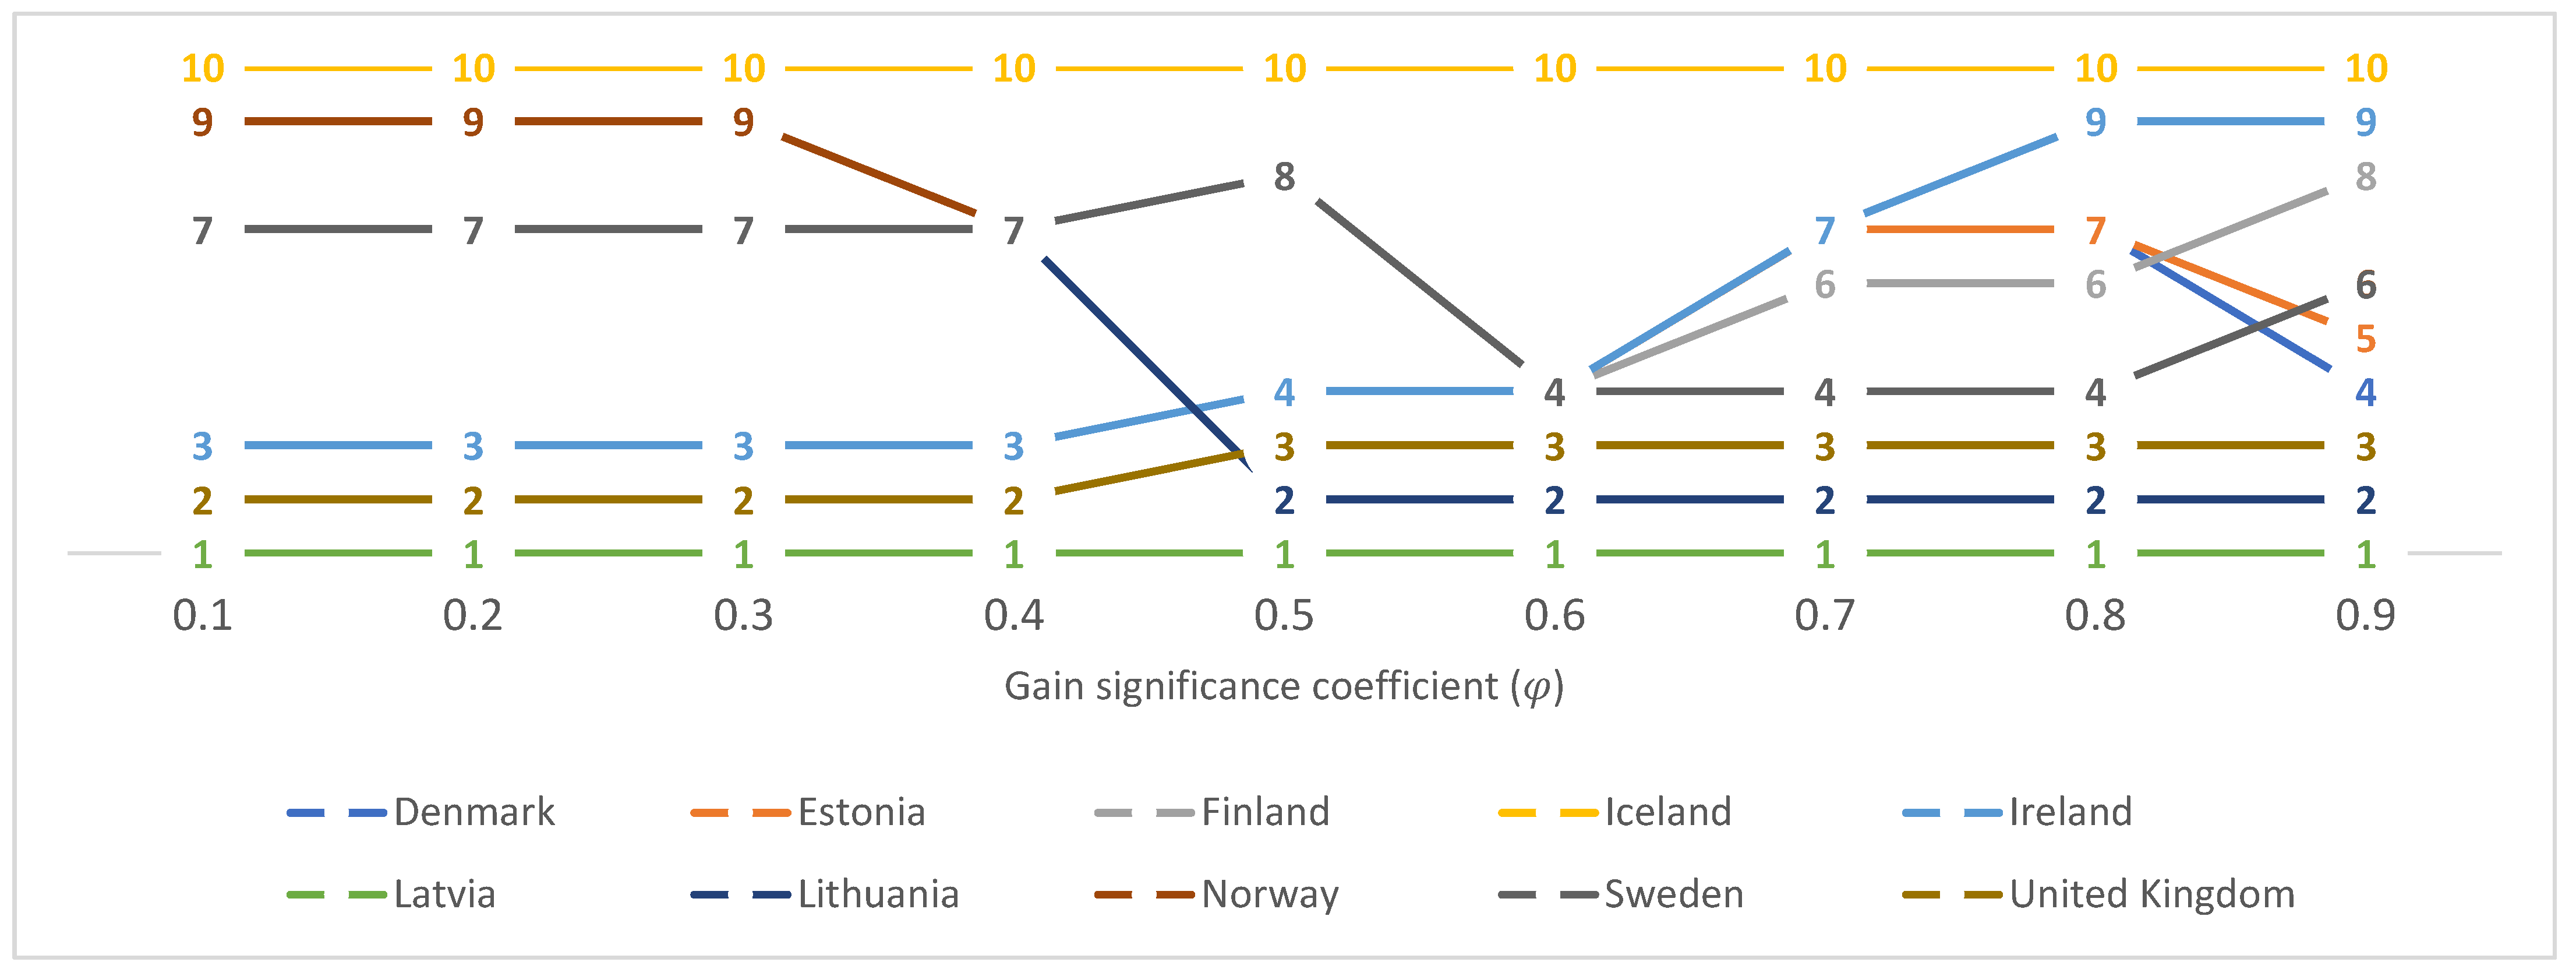
4.3. The Loss Aversion Sensitivity Analysis

In this section, a sensitivity analysis is performed to examine the influence of the aversion loss coefficient ( θ ) and gain significance coefficient ( φ ) on the efficiency of the countries. Accordingly, the behavioral DEA model was solved many times with different values of the aversion loss coefficient and gain significance coefficient. The ranking results of the solutions are summarized in Figure 3 and Figure 4.
The ranking results in Figure 3, anchored by an aversion loss coefficient ( θ ) fixed at 1, reveal the dynamic effects of varying the gain significance coefficient ( φ ) on the perceived efficiency of renewable energy conversion in Northern European countries. Throughout the range of φ from 0.1 to 0.9, Latvia consistently emerges as the most efficient, suggesting that its renewable energy sector is robust against changes in the valuation of gains. Conversely, Iceland persistently ranks at the bottom, indicating that its renewable energy efficiency is lower compared to its regional counterparts, regardless of the psychological weighting of gains. As φ increases, depicting a higher valuation of gains, the rankings of countries like Finland improve, pointing to a positive response in its renewable energy sector to the increasing importance of gains. This could reflect a scenario where Finnish policies or technologies gain greater efficacy under conditions where gains are more significantly valued. Meanwhile, the rankings of Sweden and Norway exhibit a distinct variability, improving at intermediate φ values but decreasing at higher φ values, suggesting a non-linear response to the changing valuation of gains. The United Kingdom displays a moderate change in rankings with varying φ , suggesting a moderate sensitivity to the valuation of gains in its renewable energy efficiency. Notably, Lithuania’s efficiency ranking fluctuates considerably across the spectrum of φ , indicating a more complex relationship between the efficiency of its renewable energy sector and the valuation of gains. These ranking shifts underscore the nuanced impact that behavioral factors can have on the evaluation of energy policy and technology effectiveness. Countries that demonstrate fluctuating efficiency with changes in φ may require a more tailored approach to policy making that aligns with the behavioral tendencies of their energy sectors. The consistency of Latvia’s top-ranking position suggests that it could serve as a model for best practices, whereas Iceland’s consistently lower ranking points to a need for strategic policy interventions to enhance its renewable energy efficiency.
With the aversion loss coefficient ( θ ) set at 2, indicating a stronger aversion to losses, the sensitivity analysis of the gain significance coefficient ( φ ) provides an intriguing view into the rankings of renewable energy efficiency across Northern European countries.
The results show that with a higher aversion to loss, the countries’ rankings are influenced variably by the gain significance, as shown in Figure 4. For instance, Latvia’s top rank is consistent across all levels of φ , suggesting that its renewable energy sector’s performance is perceived as efficient regardless of the psychological weight placed on gains. This could signify a robust energy policy or a highly effective implementation of renewable energy technologies in Latvia. Iceland, on the other hand, maintains the lowest rank across the board, indicating persistent challenges or inefficiencies in its renewable energy sector. This consistently low ranking could be due to factors such as less favorable natural conditions for renewable energy generation, less developed infrastructure, or policies that are not as conducive to promoting renewable energy efficiency. The rankings for countries like Lithuania and Norway show variability when the gain significance coefficient changes, indicating a fluctuating perception of efficiency as the emphasis on gains shifts. This may suggest that these countries’ renewable energy sectors respond differently to psychological factors, and hence, could benefit from policies that align more closely with behavioral incentives. Sweden and the United Kingdom exhibit interesting patterns; their rankings remain relatively stable at lower φ values, but as φ increases, indicating a higher valuation of gains, their rankings improve. This suggests that these countries might have a good potential for efficiency gains that are not fully realized or valued at lower φ levels.
The changes in rankings for Denmark, Estonia, and Finland as φ increases suggest that these countries’ renewable energy efficiencies may be more sensitive to the valuation of gains. For policy implications, these countries might consider strategies that emphasize the positive aspects of renewable energy investment and focus on the benefits rather than the costs.

4.4. Discussion

This study provides significant insights into the renewable energy conversion efficiency across Northern European countries by integrating behavioral economics into a DEA framework. By applying sensitivity analysis to the gain significance coefficient ( φ ) while holding the aversion loss coefficient ( θ ) coefficient, the research highlights the influence of behavioral factors on efficiency rankings among the countries studied. The innovative incorporation of behavioral economics into the DEA model has elucidated the role of psychological factors in energy policy and technology adoption, potentially transforming how policymakers and industry stakeholders approach renewable energy deployment. The sensitivity analysis reveals that the perception of efficiency is affected by the valuation placed on gains, a finding that could influence the design of incentive structures and policy measures aimed at boosting renewable energy use. For instance, the consistent high efficiency of Latvia across various levels of φ suggests that its renewable energy policies are well-aligned with both economic and behavioral incentives. Conversely, the consistently low ranking of Iceland indicates potential areas for policy intervention, perhaps suggesting a need for strategies that better leverage behavioral incentives to drive efficiency improvements. A notable finding is the fluctuation in rankings for countries like Lithuania and Norway at different levels of φ . This variability could reflect a unique interplay between existing renewable energy policies and the behavioral tendencies within these countries, signaling an opportunity for tailored policy adjustments that could enhance the efficiency of renewable energy conversion.

5. Conclusions

This study embarked on an exploration of renewable energy efficiency within Northern European countries, a region at the forefront of the global shift towards sustainable energy sources. Recognizing the imperative to transition from fossil fuel dependency to renewable alternatives, this study aimed to quantify and compare the efficiency of renewable energy conversion across Denmark, Estonia, Finland, Iceland, Ireland, Latvia, Lithuania, Norway, Sweden, and the United Kingdom. The primary objective was to evaluate the efficiency of renewable energy conversion, using a robust analytical framework that could inform policy and technology enhancements. The study sought to uncover how different countries perform relative to each other within the context of behavioral factors that influence energy policy and investment decisions.
A DEA model, enhanced with behavioral economics through the inclusion of the aversion loss coefficient (θ) and gain significance coefficient (φ), was employed. This approach allowed for the assessment of renewable energy conversion efficiency while accounting for the psychological dimensions that can impact decision-making processes within energy sectors. The sensitivity analysis revealed distinct patterns of efficiency rankings among the countries, with notable consistency for some and significant variability for others across different values of φ. Latvia consistently ranked as the most efficient, whereas Iceland was persistently at the lower end of the efficiency spectrum. These rankings shifted for other countries with changes in φ, indicating different levels of responsiveness to the psychological valuation of gains in renewable energy investment.
Theoretically, this study expands the DEA methodology by weaving in behavioral economics, providing a richer understanding of the factors driving efficiency in renewable energy. Practically, it offers a comparative analysis that can serve as a benchmarking tool for policymakers and energy sector stakeholders. It lays the groundwork for developing tailored strategies that align renewable energy initiatives with behavioral incentives, potentially enhancing the adoption and effectiveness of these initiatives.
Although the results are robust, the study acknowledges limitations. The DEA model used does not account for the dynamic nature of energy markets or the evolving policy landscape, which could significantly impact efficiency. Furthermore, cultural factors and individual country policies are not specifically accounted for, which may influence the interpretation of the behavioral parameters used in the model. Given these considerations, further research is warranted. Future studies could expand upon this work by incorporating dynamic models that track efficiency over time, explore the impact of individual renewable energy types, and consider country-specific behavioral factors. Qualitative analyses could also be valuable, providing a richer context for the quantitative findings and helping to understand the nuanced influences on renewable energy efficiency.

Author Contributions

Conceptualization, Y.-H.H. and F.-C.Y.; methodology, Y.-H.H. and F.-C.Y.; validation, Y.-H.H. and F.-C.Y.; formal analysis, Y.-H.H.; investigation, Y.-H.H. and F.-C.Y.; resources, Y.-H.H. and F.-C.Y.; data curation, Y.-H.H. and F.-C.Y.; writing—original draft preparation, Y.-H.H. writing—review and editing, Y.-H.H. and F.-C.Y.; visualization, Y.-H.H.; supervision, F.-C.Y.; project administration, F.-C.Y.; funding acquisition, F.-C.Y. All authors have read and agreed to the published version of the manuscript.

Funding

This research received no external funding.

Data Availability Statement

Data are contained within the article.

Conflicts of Interest

The authors declare no conflicts of interest.

Abbreviations

Notation/AcronymsDescription
DEAData Envelopment Analysis
RERenewable energy
IEAThe International Energy Agency
EUthe European Union
ICTInformation and Communication Technology
MCDMMulti-Criteria Decision-Making
CCR modelCharnes, Cooper and Rhodes model
BCC modelBanker, Chames and Cooper model
DMUsthe Decision-Making Units
GWhgigawatt-hours
GDPthe Gross Domestic Product
USThe United States
E k Technical efficiency of k th DMU
I Number of DMUs
J Number of input indicators
T Number of output indicators
u t The weight assigned to the t th output of DEA model
v j The weight assigned to the j th input DEA model
m t i The value of the t th input for the i th DMU
n j i The value of the j th input for the i th DMU
ρ The non-negative adjustment constants
Δ l The difference in value with respect to the reference point according to Prospect theory
γ The decision-makers’ attitudes towards gains
δ The decision-makers’ attitudes towards losses
θ The loss aversion coefficient
x j i The normalized value of n j i
y t i The normalized value of m t i
n j + The positive reference points for inputs
m t + The positive reference points for outputs
n j The negative reference points for inputs
m t The negative reference points for outputs
φ The gain significance coefficient
Z The behavior DEA model’s objective function value

References

  1. Jordana, J.; Saz, A.; Marx, A.; Holesch, A.; Vandendriessche, M.; Coen, D.; Levi-Faur, D.; Rogers, C.; Zürn, M.; Tokhi, A.; et al. Trends in Global Governance and Future Scenarios 2030; Institut Barcelona d’Estudis Internacionals (IBEI): Barcelona, Spain, 2023. [Google Scholar]
  2. The Global Power Mix Will Be Transformed by 2028. 2023. Available online: https://www.iea.org/energy-system/renewables (accessed on 11 November 2023).
  3. Brodny, J.; Tutak, M. Assessing the energy security of European Union countries from two perspectives—A new integrated approach based on MCDM methods. Appl. Energy 2023, 347, 121443. [Google Scholar] [CrossRef]
  4. Duarte, P.A.B.; FLeandro, J.B.S.; Galán, E.M. The Palgrave Handbook of Globalization with Chinese Characteristics: The Case of the Belt and Road Initiative; Springer Nature: Berlin/Heidelberg, Germany, 2023. [Google Scholar]
  5. Where Does the EU’s Gas Come from? 2024. Available online: https://www.consilium.europa.eu/en/infographics/eu-gas-supply (accessed on 1 February 2024).
  6. Cross, S.; Hast, A.; Kuhi-Thalfeldt, R.; Syri, S.; Streimikiene, D.; Denina, A. Progress in renewable electricity in Northern Europe towards EU 2020 targets. Renew. Sustain. Energy Rev. 2015, 52, 1768–1780. [Google Scholar] [CrossRef]
  7. Renewable Energy Targets. 2023. Available online: https://energy.ec.europa.eu/topics/renewable-energy/renewable-energy-directive-targets-and-rules/renewable-energy-targets_en (accessed on 11 May 2023).
  8. Bahgat, G. Europe’s energy security: Challenges and opportunities. Int. Aff. 2006, 82, 961–975. [Google Scholar] [CrossRef]
  9. Bigerna, S.; Bollino, C.A.; Micheli, S. The Sustainability of Renewable Energy in Europe; Springer: Berlin/Heidelberg, Germany, 2015. [Google Scholar]
  10. Parhamfar, M.; Sadeghkhani, I.; Adeli, A.M. Towards the application of renewable energy technologies in green ports: Technical and economic perspectives. IET Renew. Power Gener. 2023, 17, 3120–3132. [Google Scholar] [CrossRef]
  11. Durakovic, G.; del Granado, P.C.; Tomasgard, A. Powering Europe with North Sea offshore wind: The impact of hydrogen investments on grid infrastructure and power prices. Energy 2023, 263, 125654. [Google Scholar] [CrossRef]
  12. Dogan, E.; Hodžić, S.; Šikić, T.F. Do energy and environmental taxes stimulate or inhibit renewable energy deployment in the European Union? Renew. Energy 2023, 202, 1138–1145. [Google Scholar] [CrossRef]
  13. Simionescu, M.; Rădulescu, M.; Cifuentes-Faura, J. Renewable Energy Consumption-Growth Nexus in European Countries: A Sectoral Approach. Eval. Rev. 2023, 47, 287–319. [Google Scholar] [CrossRef] [PubMed]
  14. Gyamfi, B.A.; Kwakwa, P.A.; Adebayo, T.S. Energy intensity among European Union countries: The role of renewable energy, income and trade. Int. J. Energy Sect. Manag. 2023, 17, 801–819. [Google Scholar] [CrossRef]
  15. Do, T.C.; Dang, T.D.; Dinh, T.Q.; Ahn, K.K. Developments in energy regeneration technologies for hydraulic excavators: A review. Renew. Sustain. Energy Rev. 2021, 145, 111076. [Google Scholar] [CrossRef]
  16. Ha, K.; Truong, H.V.A.; Dang, T.D.; Ahn, K.K. Recent Control Technologies for Floating Offshore Wind Energy System: A Review. Int. J. Precis. Eng. Manuf. Green Technol. 2021, 8, 281–301. [Google Scholar] [CrossRef]
  17. Inês, C.; Guilherme, P.L.; Esther, M.-G.; Swantje, G.; Stephen, H.; Lars, H. Regulatory challenges and opportunities for collective renewable energy prosumers in the EU. Energy Policy 2020, 138, 111212. [Google Scholar] [CrossRef]
  18. Radmehr, R.; Henneberry, S.R.; Shayanmehr, S. Renewable Energy Consumption, CO2 Emissions, and Economic Growth Nexus: A Simultaneity Spatial Modeling Analysis of EU Countries. Struct. Chang. Econ. Dyn. 2021, 57, 13–27. [Google Scholar] [CrossRef]
  19. Destek, M.A.; Aslan, A. Disaggregated renewable energy consumption and environmental pollution nexus in G-7 countries. Renew. Energy 2020, 151, 1298–1306. [Google Scholar] [CrossRef]
  20. Johannsen, R.M.; Mathiesen, B.V.; Kermeli, K.; Crijns-Graus, W.; Østergaard, P.A. Exploring pathways to 100% renewable energy in European industry. Energy 2023, 268, 126687. [Google Scholar] [CrossRef]
  21. Potrč, S.; Čuček, L.; Martin, M.; Kravanja, Z. Sustainable renewable energy supply networks optimization—The gradual transition to a renewable energy system within the European Union by 2050. Renew. Sustain. Energy Rev. 2021, 146, 111186. [Google Scholar] [CrossRef]
  22. Tutak, M.; Brodny, J. Renewable energy consumption in economic sectors in the EU-27. The impact on economics, environment and conventional energy sources. A 20-year perspective. J. Clean. Prod. 2022, 345, 131076. [Google Scholar] [CrossRef]
  23. Panchenko, V.; Daus, Y.; Kovalev, A.; Yudaev, I.; Litti, Y. Prospects for the production of green hydrogen: Review of countries with high potential. Int. J. Hydrogen Energy 2023, 48, 4551–4571. [Google Scholar] [CrossRef]
  24. Kaffash, S.; Azizi, R.; Huang, Y.; Zhu, J. A survey of data envelopment analysis applications in the insurance industry 1993–2018. Eur. J. Oper. Res. 2020, 284, 801–813. [Google Scholar] [CrossRef]
  25. Xu, T.; You, J.; Li, H.; Shao, L. Energy Efficiency Evaluation Based on Data Envelopment Analysis: A Literature Review. Energies 2020, 13, 3548. [Google Scholar] [CrossRef]
  26. Čiković, K.F.; Lozić, J. Application of Data Envelopment Analysis (DEA) in Information and Communication Technologies. Teh. Glas. 2022, 16, 129–134. [Google Scholar] [CrossRef]
  27. Dutta, P.; Jaikumar, B.; Arora, M.S. Applications of data envelopment analysis in supplier selection between 2000 and 2020: A literature review. Ann. Oper. Res. 2022, 315, 1399–1454. [Google Scholar] [CrossRef]
  28. Le, M.-T.; Nhieu, N.-L. An Offshore Wind–Wave Energy Station Location Analysis by a Novel Behavioral Dual-Side Spherical Fuzzy Approach: The Case Study of Vietnam. Appl. Sci. 2022, 12, 5201. [Google Scholar] [CrossRef]
  29. Kyrgiakos, L.S.; Kleftodimos, G.; Vlontzos, G.; Pardalos, P.M. A systematic literature review of data envelopment analysis implementation in agriculture under the prism of sustainability. Oper. Res. 2023, 23, 1–38. [Google Scholar] [CrossRef]
  30. Tavana, M.; Soltanifar, M.; Santos-Arteaga, F.J.; Sharafi, H. Analytic hierarchy process and data envelopment analysis: A match made in heaven. Expert Syst. Appl. 2023, 223, 119902. [Google Scholar] [CrossRef]
  31. Wang, C.-N.; Nhieu, N.-L.; Tran, H.-V. Wave Energy Site Location Optimizing in Chile: A Fuzzy Serial Linear Programming Decision-Making Approach. Environ. Dev. Sustain. 2024; early access. [Google Scholar]
  32. Wang, C.; Nguyen, H.; Nhieu, N.; Hsu, H. A prospect theory extension of data envelopment analysis model for wave-wind energy site selection in New Zealand. Manag. Decis. Econ. 2023, 45, 539–553. [Google Scholar] [CrossRef]
  33. Charnes, A.; Cooper, W.W.; Rhodes, E. Measuring the efficiency of decision making units. Eur. J. Oper. Res. 1978, 2, 429–444. [Google Scholar] [CrossRef]
  34. Banker, R.D.; Charnes, A.; Cooper, W.W. Some Models for Estimating Technical and Scale Inefficiencies in Data Envelopment Analysis. Manag. Sci. 1984, 30, 1078–1092. [Google Scholar] [CrossRef]
  35. Kahneman, D.; Tversky, A. Prospect Theory: An Analysis of Decision under Risk. Econometrica 1979, 47, 263. [Google Scholar] [CrossRef]
  36. Liang, H.; Xiong, W.; Dong, Y. A prospect theory-based method for fusing the individual preference-approval structures in group decision making. Comput. Ind. Eng. 2018, 117, 237–248. [Google Scholar] [CrossRef]
  37. Wang, L.; Wang, Y.-M.; Martínez, L. A group decision method based on prospect theory for emergency situations. Inf. Sci. 2017, 418–419, 119–135. [Google Scholar] [CrossRef]
  38. Le, M.-T.; Nhieu, N.-L. A Behavior-Simulated Spherical Fuzzy Extension of the Integrated Multi-Criteria Decision-Making Approach. Symmetry 2022, 14, 1136. [Google Scholar] [CrossRef]
  39. Chen, X.; Liu, X.; Wang, W.; Gong, Z. Behavioral DEA model and its application to the efficiency evaluation of manufacturing transformation and upgrading in the Yangtze River Delta. Soft Comput. 2019, 24, 10721–10738. [Google Scholar] [CrossRef]
  40. Tian, J.; Yu, L.; Xue, R.; Zhuang, S.; Shan, Y. Global low-carbon energy transition in the post-COVID-19 era. Appl. Energy 2022, 307, 118205. [Google Scholar] [CrossRef]
  41. IRENA. Renewable Energy Country Profiles; International Renewable Energy Agency: New York, NY, USA, 2022. [Google Scholar]
  42. Gunny, A.A.N.; Shahimin, M.F.M.; Mohamed, A.R.; Jalil, M.F.A. Current Status of Renewable Energy Development. In Renewable Energy from Bio-Resources in Malaysia; Springer: Singapore, 2022; pp. 1–19. [Google Scholar]
  43. Wang, C.-N.; Nhieu, N.-L. Integrated DEA and hybrid ordinal priority approach for multi-criteria wave energy locating: A case study of South Africa. Soft Comput. 2023, 27, 18869–18883. [Google Scholar] [CrossRef]
  44. Wang, C.-N.; Nhieu, N.-L.; Nguyen, H.-P.; Wang, J.-W. Simulation-Based Optimization Integrated Multiple Criteria Decision-Making Framework for Wave Energy Site Selection: A Case Study of Australia. IEEE Access 2021, 9, 167458–167476. [Google Scholar] [CrossRef]
  45. Le, M.-T.; Nhieu, N.-L.; Pham, T.-D.T. Direct-Use Geothermal Energy Location Multi-Criteria Planning for On-Site Energy Security in Emergencies: A Case Study of Malaysia. Sustainability 2022, 14, 15132. [Google Scholar] [CrossRef]
  46. Wang, C.-N.; Pham, T.-D.T.; Nhieu, N.-L.; Huang, C.-C. Smart Technology Prioritization for Sustainable Manufacturing in Emergency Situation by Integrated Spherical Fuzzy Bounded Rationality Decision-Making Approach. Processes 2022, 10, 2732. [Google Scholar] [CrossRef]
  47. The World Bank. World Bank Open Data. Available online: https://databank.worldbank.org/ (accessed on 11 November 2023).
  48. IEA. Energy Statistics Data; International Energy Agency: Paris, France, 2022. [Google Scholar]
  49. IEA. World Energy Investment 2022; International Energy Agency (IEA): Paris, France, 2022. [Google Scholar]
  50. IRENA. Global Atlas for Renewable Energy; International Renewable Energy Agency: Abu Dhabi, United Arab Emirates, 2022. [Google Scholar]
  51. IRENA. Renewable Energy Statistics 2022; International Renewable Energy Agency (IRENA): Abu Dhabi, United Arab Emirates, 2022. [Google Scholar]
  52. Tversky, A.; Kahneman, D. Advances in prospect theory: Cumulative representation of uncertainty. J. Risk Uncertain. 1992, 5, 297–323. [Google Scholar] [CrossRef]
  53. Wang, C.-N.; Nhieu, N.-L.; Dao, T.-H.; Huang, C.-C. Simulation-Based Optimized Weighting TODIM Decision-Making Approach for National Oil Company Global Benchmarking. IEEE Trans. Eng. Manag. 2022, 71, 1215–1229. [Google Scholar] [CrossRef]
Figure 1. The behavioral DEA model application.
Processes 12 00618 g001
Figure 2. The renewable energy efficiency in Northern European with default psychological behavioral parameters.
Processes 12 00618 g002
Figure 3. The ranking results with θ = 1 .
Processes 12 00618 g003
Figure 4. The ranking results with θ = 2 .
Processes 12 00618 g004
Table 1. The renewable energy performance indicators in Northern European 2021.
CountryTraditional Energy Production (GWh)Population (Million)Particulate Emission Damage Savings (% of GNI)Electricity Output by Renewable Sources (GWh)GDP (Current Billion US$)Renewable Energy Consumption (% of Total Final Energy Consumption)
Input 1Input 2Input 3Output 1Output 2Output 3
Denmark6158.385.860.0426,095.91405.6939.70
Estonia4233.781.330.032878.5337.1940.00
Finland9582.005.540.0138,175.37296.4747.49
Iceland2.460.370.0219,611.7325.6082.79
Ireland19,651.085.030.0211,613.51513.3913.69
Latvia2128.401.880.133717.8239.4443.75
Lithuania1316.502.800.092621.7066.8031.70
Norway897.805.410.01156,101.28503.3761.29
Sweden1375.0010.420.01115,737.00639.7158.40
United Kingdom132,429.8567.030.05122,178.143141.5113.50
Table 2. The normalized performance data.
CountryInput 1Input 2Input 3Output 1Output 2Output 3
Denmark0.9540.9680.9281.0000.8520.984
Estonia0.9180.9860.9221.0000.9300.977
Finland0.7530.8100.9690.9430.9200.000
Iceland0.1530.0020.2320.1110.0590.007
Ireland0.1220.0040.0870.0000.1570.004
Latvia0.3780.3820.4911.0000.0030.437
Lithuania0.9540.9680.9281.0000.8520.984
Norway0.9180.9860.9221.0000.9300.977
Sweden0.7530.8100.9690.9430.9200.000
United Kingdom0.1530.0020.2320.1110.0590.007
Disclaimer/Publisher’s Note: The statements, opinions and data contained in all publications are solely those of the individual author(s) and contributor(s) and not of MDPI and/or the editor(s). MDPI and/or the editor(s) disclaim responsibility for any injury to people or property resulting from any ideas, methods, instructions or products referred to in the content.

