Abstract
The objective of this inquiry is to illuminate the attributes of heavy metal contamination and evaluate the potential ecological hazards inherent in the surface soil of Chenzhou City. A comprehensive analysis was conducted on 600 systematically collected soil samples within the study area, utilizing enrichment factors, geo-accumulation indices, comprehensive pollution indices, potential ecological hazard indices, and health risk assessment models to evaluate the degree of heavy metal contamination in the soil, potential ecological risks, and associated health hazards. The findings reveal that the average enrichment factor (EF) for each heavy metal is below 2, with the hierarchy from highest to lowest being Hg > Cd > Cu > Pb > Ni > Zn > Cr > As. Approximately 78.67% of soil samples exhibit no pollution to weak pollution levels based on heavy metal enrichment factors. Moreover, the comprehensive pollution index (IPIN) indicates that 95.17% of soil samples are within safe and pollution-free levels, indicating an overall environmentally secure setting. However, 2.67% of samples display heightened potential ecological risk levels, primarily concentrated in the southwestern region of the study area, influenced by nearby industrial activities. Additionally, it is noteworthy that both the non-carcinogenic and carcinogenic health hazards emanating from soil heavy metals to adult individuals lie within tolerable thresholds. Among these, arsenic (As), chromium (Cr), and lead (Pb) have been discerned as the principal non-carcinogenic agents. It is of particular significance that only a solitary soil specimen, located in the southwestern quadrant of the investigative region, manifests detectable health perils for children.
1. Introduction
Soil contamination has emerged as a ubiquitous global environmental concern, attracting considerable scrutiny, particularly in light of the pervasive infiltration of heavy metals [1]. Soil contamination by heavy metals can be delineated into natural and anthropogenic origins. The former emanates from inherent processes intrinsic to soil genesis, encompassing the dissolution of elements through mineral weathering and background sources [2]. Amidst the swift evolution of the Chinese economy and its hastened industrialization, diverse heavy metal constituents have permeated the soil via assorted conduits. This incursion not only disrupts the intrinsic ecological functionalities and equilibrium of the soil milieu, but also poses formidable hazards to human well-being, significantly constraining the sustainable progression of regional soil ecosystems.
The heavy metals entrenched within the soil manifest distinctive traits, encompassing concealment, temporal lag, accumulation, and facile enrichment. Perturbed by exogenous pollution, these heavy metals persist in accumulating within the soil, precipitating a diminution in the soil environment’s carrying capacity and engendering substantial ecological and environmental perils [3,4]. Heavy metals residing within the soil possess the potential to engender risks to elevated trophic strata of organisms and human well-being via the transmission and enrichment within the food chain. The quandary of soil heavy metal pollution has garnered considerable focus from pertinent regulatory entities and presently stands as a paramount subject in the realm of environmental science research.
Anthropogenic sources serve as extrinsic agents influencing the heavy metal landscape within the soil. Human activities, encompassing industrial coal combustion, mining, metallurgy, the utilization of agricultural fertilizers and pesticides, emissions stemming from vehicular exhaust, and the disposal of electronic products, can induce varying degrees of heavy metal contamination in the soil [5,6]. Nevertheless, heavy metal pollution is distinguished by its formidable concealment, enduring presence, and bio-accumulative proclivity, rendering its remediation from the soil a formidable undertaking. Elevated concentrations of heavy metals not only impede the flourishing of plants within the soil, but also yield diminished crop output and compromised quality of agricultural products. Moreover, these metallic elements can infiltrate the human body through various pathways, precipitating a range of health complications, whether directly or indirectly.
Elevated consumption of lead (Pb) not only precipitates hypertension, but also imposes deleterious effects upon the skeletal, immune, and endocrine systems. It diminishes cognitive faculties in both juveniles and adults, concurrently compromising renal and cardiac functionality. Likewise, the excessive assimilation of copper (Cu), mercury (Hg), and chromium (Cr) engenders adverse health ramifications. Moreover, protracted exposure to cadmium (Cd) renders individuals increasingly susceptible to pulmonary carcinoma and skeletal fractures. Nickel (Ni), too, qualifies as a heavy metal carcinogen. Depending on the dosage and duration of exposure, it exhibits immunotoxic and carcinogenic properties. The accrual of nickel within the body can precipitate pulmonary fibrosis, and kidney and cardiovascular ailments, as well as respiratory malignancies. Furthermore, an estimated 20% of the global populace suffers from nickel allergies.
Henceforth, the principal objective of this investigation is to utilize Chenzhou City as a case study to examine the attributes of heavy metal pollution in urban surface soil and conduct an ecological health risk assessment. This endeavor holds immense importance for fostering the harmonious coexistence between urban inhabitants and their environment, and for promoting the sustainable progression of human society.
2. Literature Review
Presently, a multitude of scholars have employed a diverse array of research methodologies to undertake pertinent inquiries into soil heavy metal contamination across varied urban settings. With regards to research substance, their primary emphasis revolves around elucidating the attributes of heavy metal presence in urban soil, appraising pollution degrees, dissecting pollution origins, and appraising potential ecological hazards.
For instance, an investigation delved into the pollution status and spatial characteristics of heavy metals in soil across diverse verdant landscapes, including urban parklands, roadside greenery, and adjacent expanses of green. The findings unveiled the pollution levels of these heavy metals, all indicating a state of mild contamination [7]. The concentrations of zinc (Zn), chromium (Cr), nickel (Ni), manganese (Mn), copper (Cu), lead (Pb), and cadmium (Cd) in soils from various types and regions in Shanghai were assessed, revealing that their average concentrations exceeded the local background levels for soil elements [8]. Another investigation discerned that soil heavy metal contamination in industrial zones and bustling traffic corridors in Nanjing exhibits a relatively severe profile, in contrast with the comparatively lighter pollution levels observed in residential and parkland domains. The principal contributors to soil heavy metal pollution have been attributed to vehicular emissions and industrial discharges [9]. A study scrutinizing soil heavy metal pollution along thoroughfares, residential vicinities, parks, and other sectors in Guangzhou revealed that 61% of soil samples demonstrated moderate to severe levels of heavy metal pollution, with human activities discerned as the principal catalyst of this contamination [10]. The mean concentrations of heavy metals in the soil within Xi’an’s industrial sectors, transportation hubs, commercial and transit amalgamated regions, residential quarters, cultural enclaves, and parklands surpass the baseline values of soil elements in Shaanxi Province [11].
Research on related underground heavy metal migration phenomena has also made progress. The migration behavior and patterns of persistent pollutants in soil–groundwater systems through heterogeneous distribution characteristics have been studied. The migration mode of heavy metals (HM) may be dominated by solute transport due to groundwater flow [12]. Studies have also been conducted in metallogenic zones along river basins. Self-organizing map (SOM) calculations and stable isotopes were employed to elucidate groundwater hydrochemistry and the migration of heavy metals, with particular emphasis on iron [13]. Additionally, there are pertinent studies in this domain. Through the establishment of an enhanced one-dimensional convection-diffusion model and air deposition model, alongside fitting experiments utilizing authentic urban soil data, the findings demonstrate that the refined model adeptly incorporates factors such as adsorption, decomposition, crop root absorption and discharge, topography, and air deposition. Consequently, it accurately delineates the transmission characteristics and diffusion process of heavy metal pollution [14]. The manner in which metals migrate within sewage sludge is of paramount importance, significantly influencing the assessment of their potential utilization. A study devised a metal mobility ecological risk index and an environmental risk index, with meticulous focus on the mobility of metals within the soil environment [15].
Within the domain of research methodologies, both domestic and international pursuits primarily deploy sophisticated frameworks, such as the geo-accumulation index, single-item pollution index, potential ecological risk index, Nemeiro comprehensive pollution index, and the enrichment factor method. These tools serve as instrumental means to evaluate the intricate landscape of heavy metal pollution within the soil [16,17]. Each of these methodologies possesses inherent advantages and drawbacks in its utilization. As a result, it is judicious to concurrently employ two or more methodologies during pollution assessment, thus augmenting the reliability of research findings. Furthermore, certain investigations employ mathematical statistical techniques such as correlation analysis and principal component analysis to scrutinize the origins of heavy metal concentrations.
In conclusion, considerable research endeavors have been dedicated to the exploration of heavy metal pollution in urban soil. Nevertheless, the focus of study locales primarily revolves around major metropolises and industrial hubs, with relatively limited attention directed towards small and medium-sized cities. The majority of research content delves into the characteristics of heavy metal pollution in soil, spatial variances, pollution degree assessments, and pollution source identification. However, studies concerning the ecological health risk assessment of heavy metal pollution in urban soil remain relatively scarce.
As Chenzhou’s urbanization progresses, the issue of “urban maladies” has gained prominence, drawing increased attention from pertinent researchers towards urban heavy metal pollution. Currently, investigations into heavy metal pollution in Chenzhou City primarily center on assessing pollution levels in street dust, riverbeds, forest soil, and farmland soil flanking highways. Nonetheless, there is a dearth of research on the characteristics and evaluation of heavy metal pollution in urban surface soil, and a conspicuous lack of data regarding human exposure to soil heavy metals and investigations into ecological health risks.
This article aims to bridge this scholarly lacuna by selecting Chenzhou City as its focal point, delving into the complexities of heavy metal pollution within urban surface soils, and conducting a thorough ecological health risk assessment. The goal is to provide a theoretical framework supporting the amelioration and mitigation of urban soil pollution, the enhancement of ecological environment quality, and the safeguarding of resident health.
3. Materials and Methods
3.1. Study Area Overview
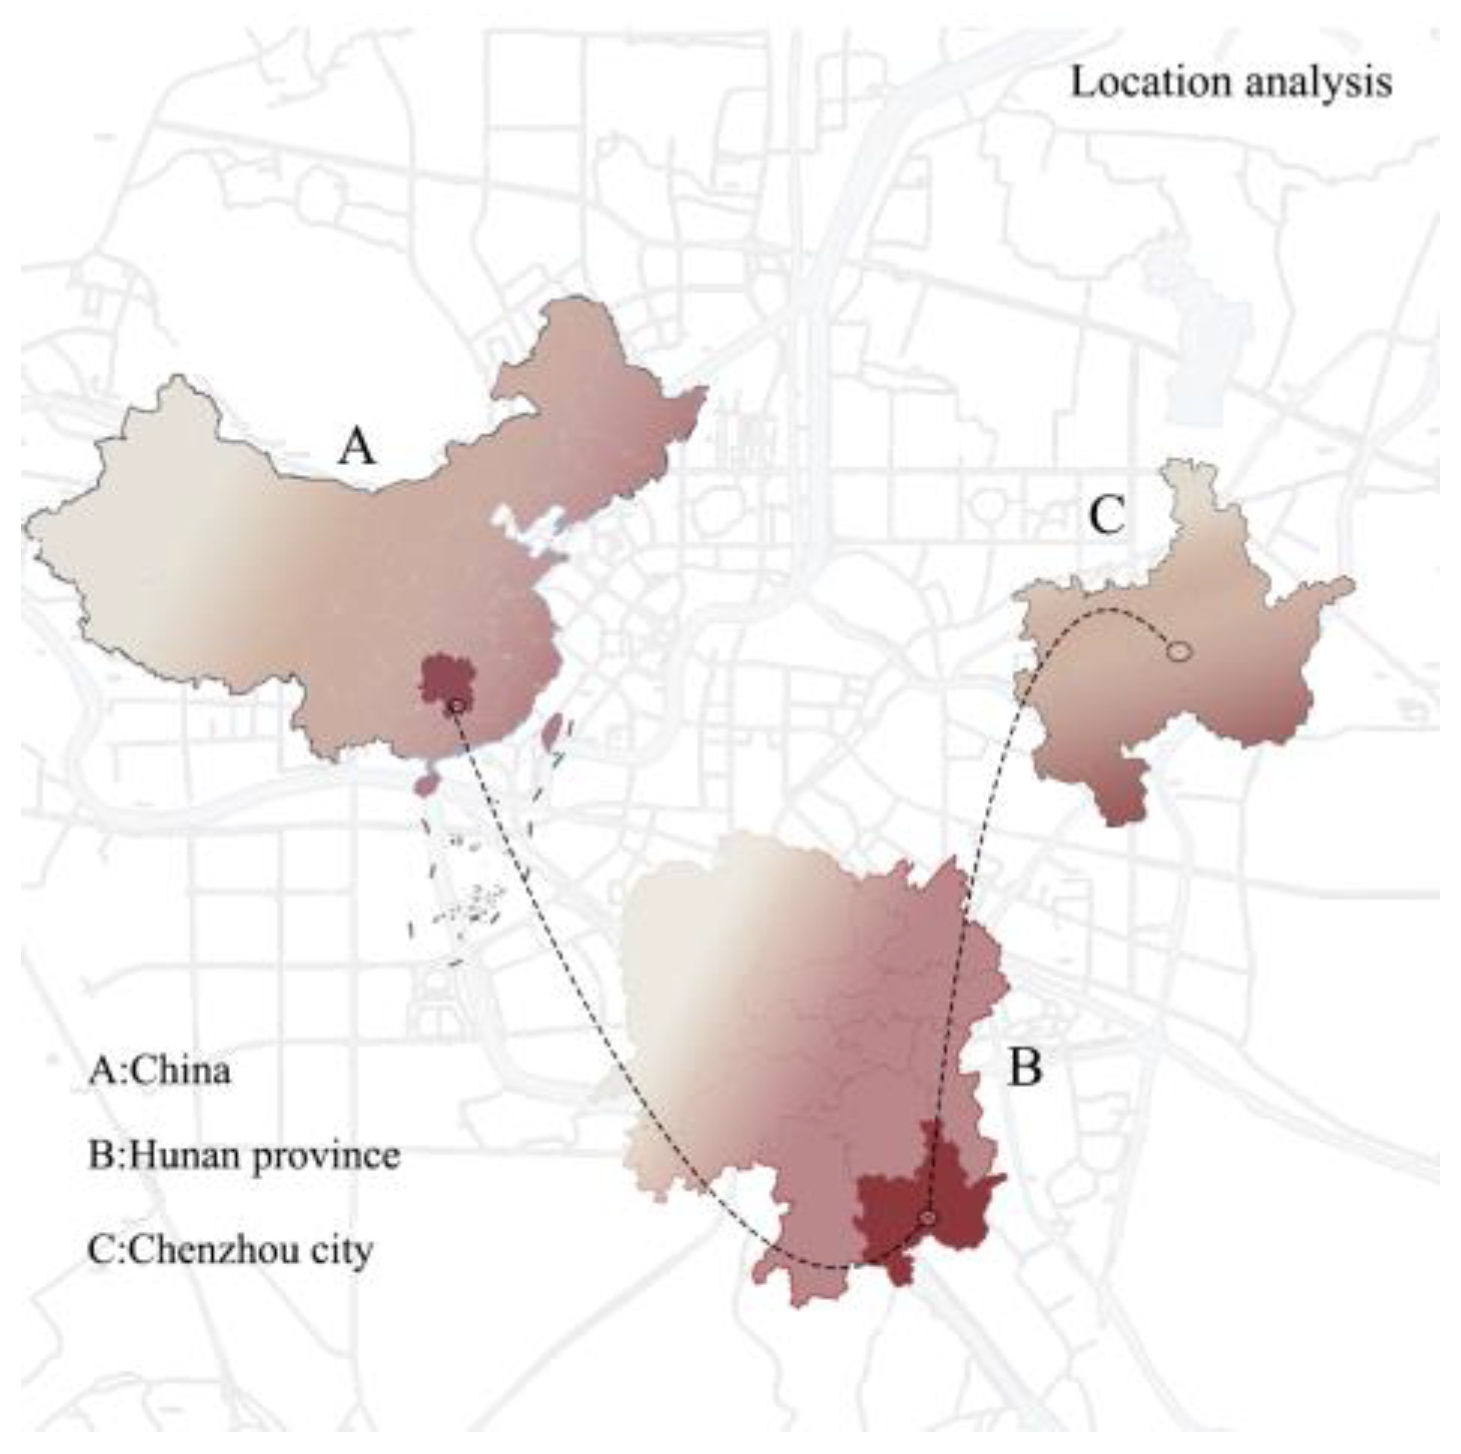
Chenzhou City resides in the southeastern domain of Hunan Province, cradled between the magnificent Nanling Mountains and the esteemed Luoxiao Mountains. Poised at the crossroads of the Yangtze River and Pearl River systems, its geographical coordinates span from 112°13’ to 114°14’ E longitude and from 24°53′ to 26°50′ N latitude (Figure 1). This locale, endowed with a subtropical monsoon climate, bestows upon its inhabitants a tableau of distinct seasons—a tapestry woven with sultry, rain-laden summers and crisp, arid winters. The annual mean temperature oscillates between 17 and 19 °C, while the average annual precipitation is within the range of 1300 to 1600 mm, adding to the region’s atmospheric allure [18,19]. The topographical tapestry of Chenzhou unfolds in a rich panorama, where nearly three-quarters of the terrain is adorned with undulating mountains and hills. Embraced by majestic peaks to the southeast, the western expanse unfolds with more modest elevations, while the central precinct unveils a harmonious blend of hills, plains, and plateaus, painting a tableau of geographic diversity [20]. The undulating terrain gracefully descends from the southeast to the northwest, and this intricate interplay of topography and climate begets a myriad of soil types in the region. Notable among them are limestone red soil, granite red soil, and other variants. Chenzhou’s distinctive landscape, characterized by predominant hills, plains with a plateau-like semblance, and an intricately contoured terrain, engenders a rich tapestry of diverse soil compositions [21].
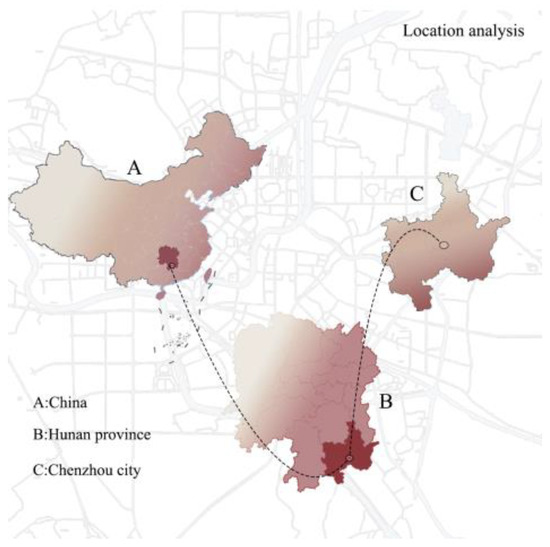
Figure 1.
Geographic location analysis map of Chenzhou City.
3.2. Sample Acquisition and Analysis
3.2.1. Sample Acquisition
This investigation and exploration adopted a stratified, staggered, non-equilibrium methodology to strategically position sampling locations and meticulously collect surface soil specimens within the designated study area. The term “stratification” entails the division of the study area into distinct sampling units of varying magnitudes, delineated based on spatial dimensions. Notably, the sampling units of higher echelons harmoniously integrate with those of lower orders in this layered framework [22]. The term “staggered-unbalanced” denotes that the sampling units within higher strata are not evenly dispersed among lower tiers. Instead, a stochastic element is introduced by selectively choosing one or several units from each tier, thus perpetuating the hierarchical division into subsequent layers of sampling units [23].
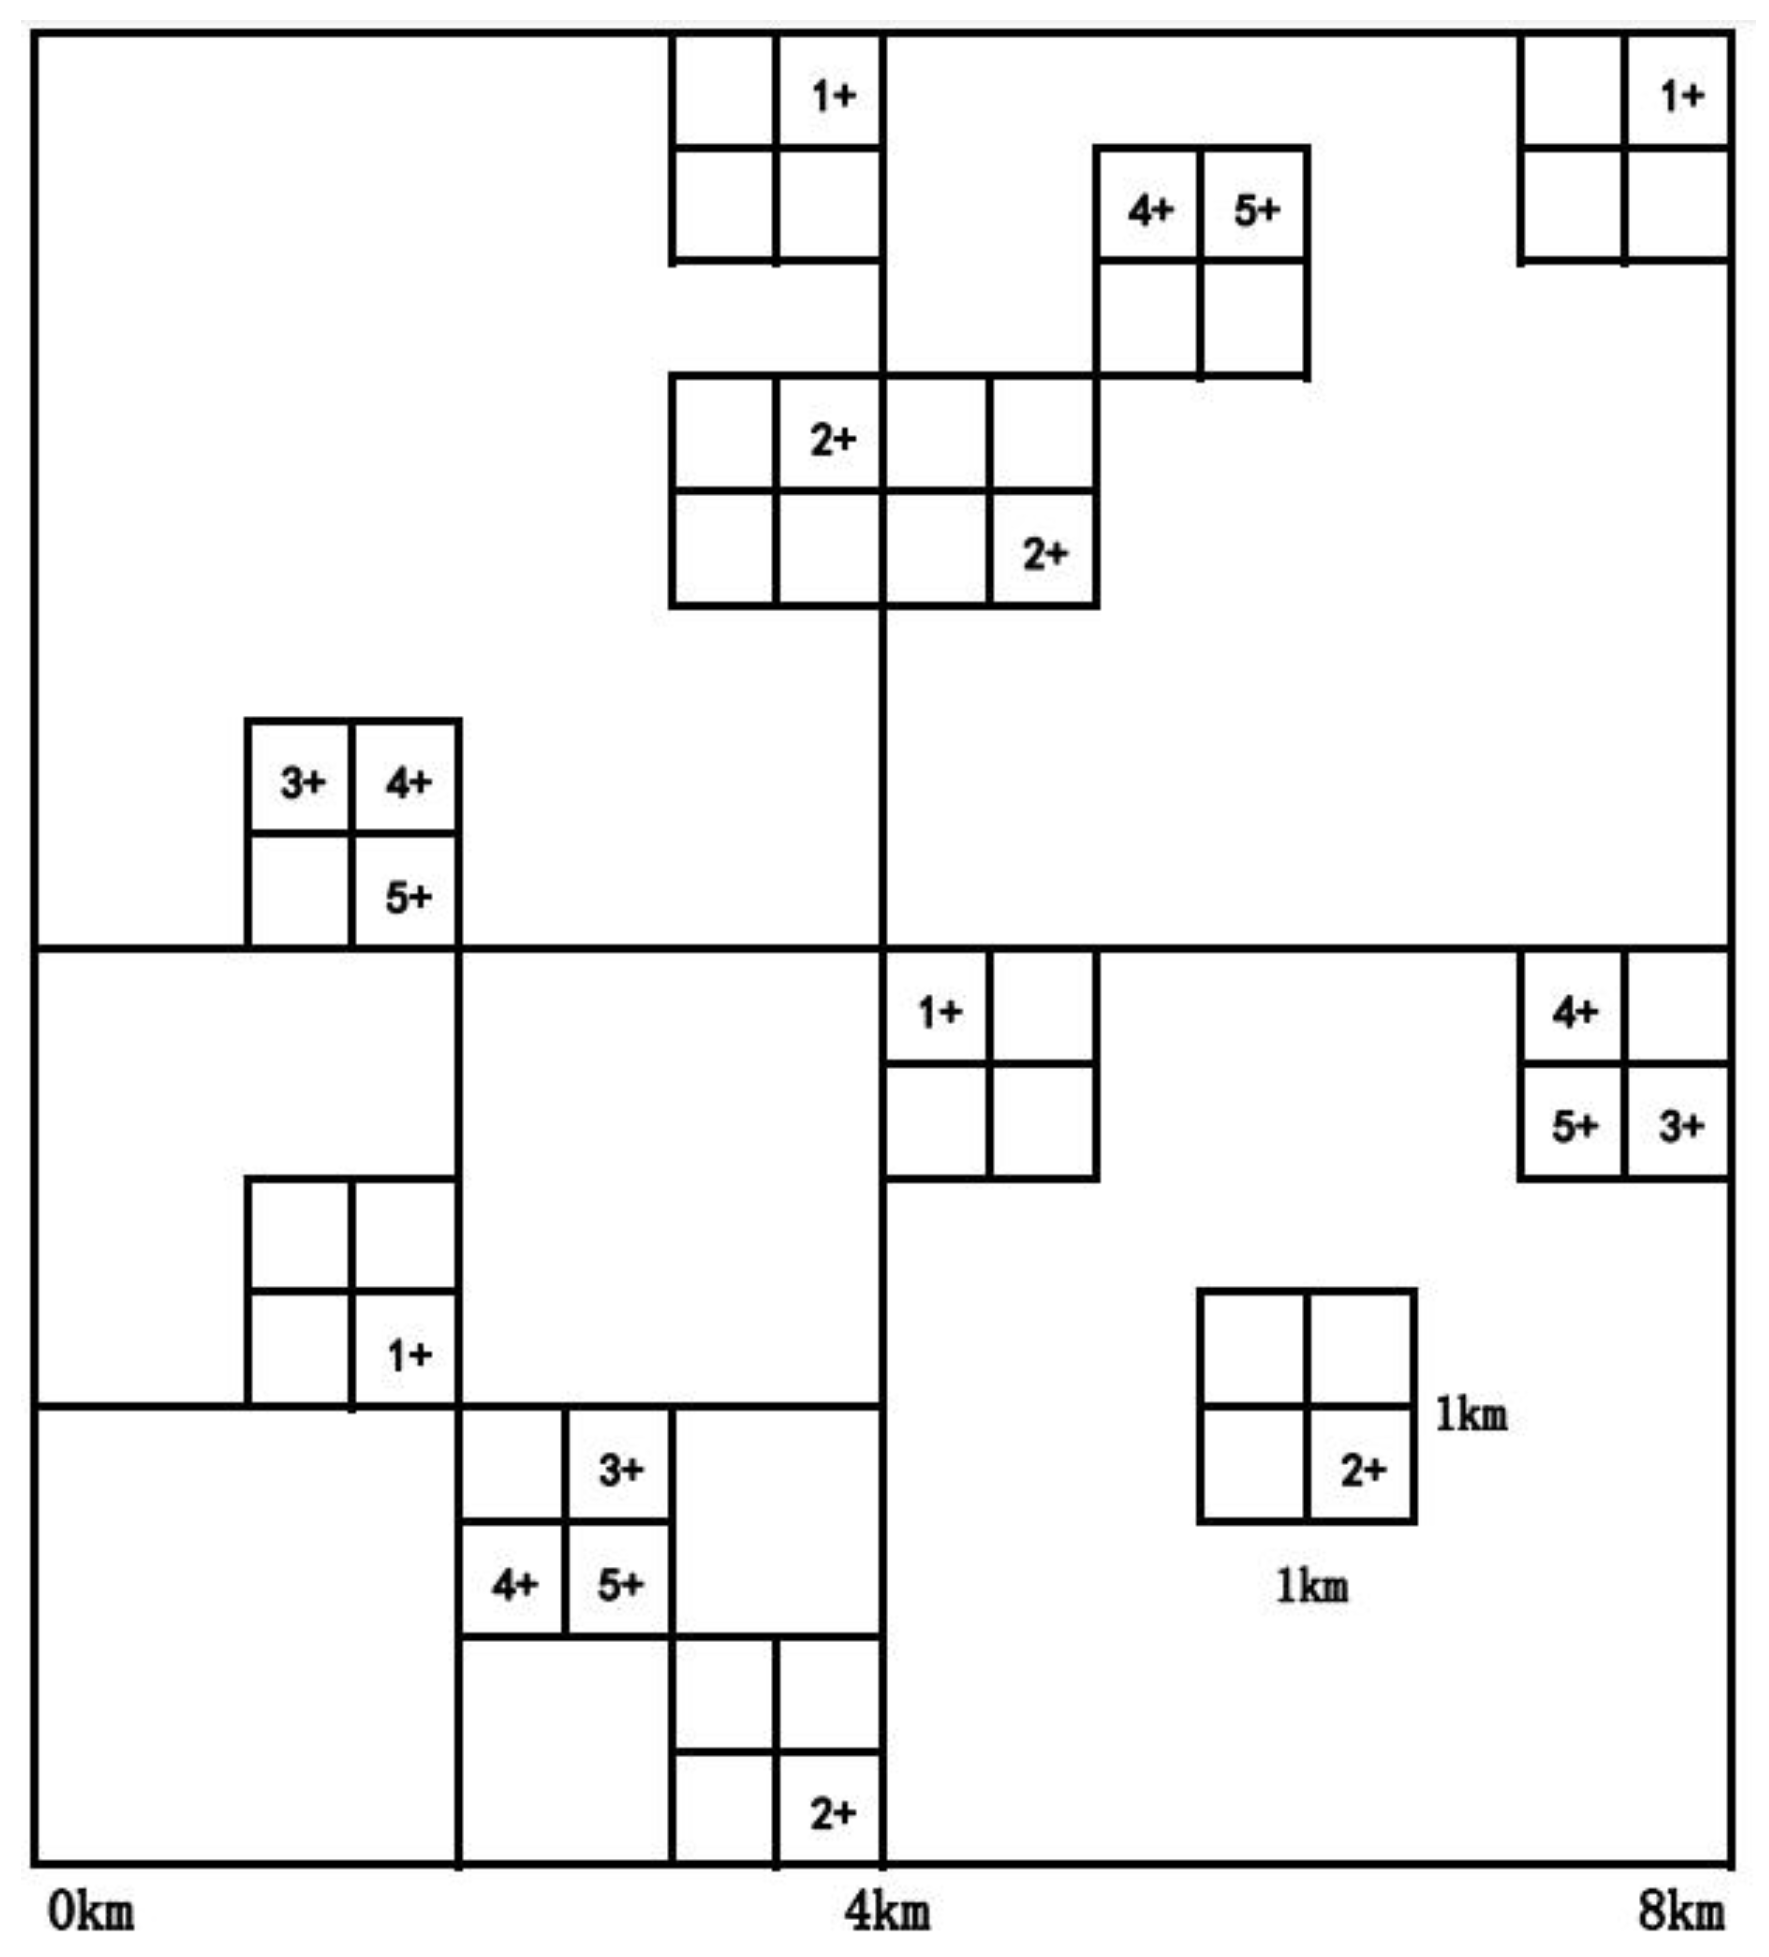
After comprehensive consideration of the study area, grid density, the significance of statistical analysis data, efficiency, and economic feasibility, a grid with a sampling density of 8 km × 8 km was selected as the top-level cell, which contains multiple lower-level nested levels. Those of 4 km × 4 km, 2 km × 2 km, 1 km × 1 km, 500 m × 500 m, and 250 m × 250 m were randomly selected as target cells (Figure 2). According to the area of the study area, 30 top-level cells were deployed without affecting the layout of each level. In this case, each top-level sampling cell contains 20 survey samples. The specific locations of sample points in each sampling cell can be manually fine-tuned according to soil types, land types, etc., to ensure that when statistics are derived according to different classifications, the data satisfy the statistics requirements.
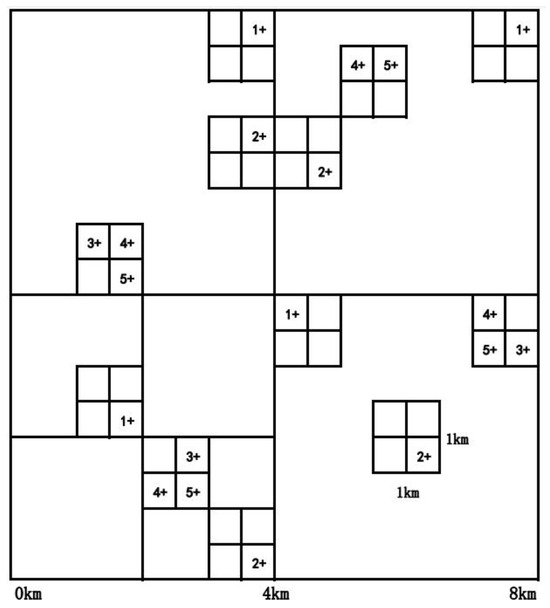
Figure 2.
Layered, staggered, non-equilibrium mode sampling point deployment diagram (Note: The numbers represent the sample point numbers deployed within the 4 km × 4 km sampling unit).
At designated sampling nodes, with the GPS positioning point serving as the focal point, 3–5 sampling nodes are delineated within a radius of 20–50 m in all directions. These nodes were amalgamated into composite samples, constituting a total of 600 soil specimens extracted from depths ranging within 0–20 cm beneath the surface (see Figure 3). Positioned across diverse land use categories, the sampled areas encompass 460 parcels of arable land, 13 parcels of orchards, 5 parcels of pastures, 72 parcels of woodlands, 42 parcels of urbanized land, and 8 parcels of miscellaneous land (refer to Figure 4).
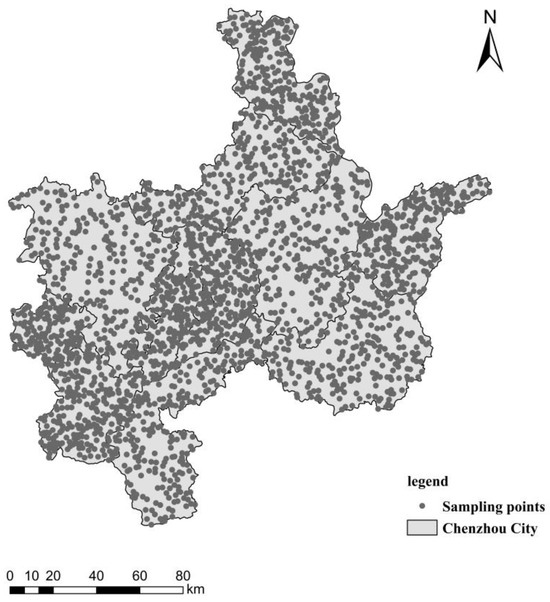
Figure 3.
Distribution of soil sampling points in Chenzhou City.
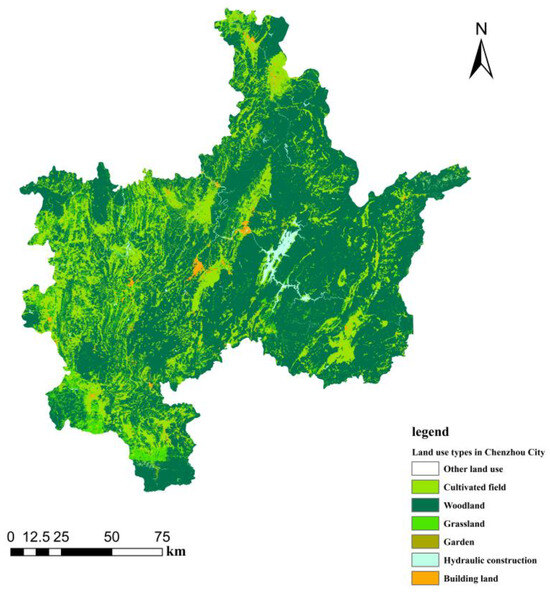
Figure 4.
Different land use types in Chenzhou City.
When sampling, unrepresentative plots such as ditches, field ridges, and roadbeds were avoided. Litter on the surface was manually removed. Where there were plant growth points, the plants and their roots were removed first. Foreign matter such as gravel was removed at the sampling site. Attention was paid to cleaning sampling tools in time to avoid cross-contamination.
In this study, after digging with shovels and soil augers, bamboo chips were used to scrape off the parts in contact with the metal samplers, and then bamboo chips were used to collect samples. For samples of contaminated soil, appropriate protective measures were taken according to the nature of the pollutants to avoid direct contact with the human body. Following meticulous blending, 1.0–1.5 kg was retained and transferred into a specimen pouch. The soil specimen underwent a process of natural desiccation, pulverization, and filtration through a 10-mesh nylon sieve before being dispatched to the laboratory for meticulous analysis and evaluation. The procedures for soil sampling and processing adhered rigorously to the specifications outlined in DZ/T 0295-2016 [24,25].
3.2.2. Sample Testing and Quality Control
Soil sample analysis test indicators include As, Cd, Cr, Hg, Pb, Ni, Zn, Cu, soil acidity and alkalinity (pH value) indices, Sc, and other element indices.
The methodologies employed for the analysis and testing of soil heavy metals were as follows: As and Hg were scrutinized utilizing atomic fluorescence spectrometry (AFS) [26,27]; Cd, Ni, Cu, Pb, Zn, and Se were scrutinized through the sophisticated technique of inductively coupled plasma mass spectrometry (ICP-MS) [28,29]. Cr was analyzed by X-ray fluorescence spectroscopy (XRF) [30], and the pH value was analyzed using the potentiometric method (POT) [31]. In the course of analysis and testing, soil samples of national premier quality were enlisted to oversee the precision of the procedures. The integrity of the analysis and testing was ensured through the utilization of repetitive samples for precision monitoring. Remarkably, the first-tier reference materials for all analytically tested elements achieved an unblemished 100% success rate, attesting to the rigor of the process. Furthermore, the overall success rate for repetitive sample examination stood at an impressive 99.7%. In parallel, the overall success rate for scrutinizing abnormal point samples reached a commendable 98.9%. The quality of sample analysis and testing, alongside the detection thresholds for each elemental index, aligned impeccably with the technical specifications for ecological geochemical evaluation sample analysis, thereby affirming the reliability of the analytical data.
3.3. Evaluation Methods
3.3.1. Enrichment Coefficient
The enrichment factor (EF) represents the enrichment degree of a certain element or substance in a certain area, and is usually used to describe pollution levels or the accumulation of certain chemical elements in the ecosystem [32,33]. The extent of the contribution from anthropogenic and natural origins to the elemental composition of particulate matter was examined and assessed, and pivotal metrics indicative of pollution severity and its sources were quantitatively appraised. This entailed the selection of elements meeting specific criteria as reference or standard elements. The enrichment factor is defined as the quotient between the concentration of contaminating elements within the sample and the concentration of reference elements, juxtaposed with the ratio of these concentrations in the ambient background region [34]. The calculation formula is:
Within the equation EF denotes the enrichment factor; Ci signifies the concentration of element i; Cr denotes the concentration of the designated reference element; and “sample” and “baseline” delineate the sample and background, respectively. In this investigation, Sc was chosen as the reference element due to the discernible influence of human activities on its source. The Sc content within the Earth’s crust is relatively stable, thereby minimizing its susceptibility to external perturbations [35,36]. The relationship between soil heavy metals and Sc content can serve as a criterion for discerning the extent to which an element is influenced by human activities. Southerland classifies the enrichment factor (EF) into five distinct levels [37,38]. An enrichment factor (EF) less than 2 signifies marginal contamination, while EF values between 2 and 5 denote moderate pollution. EF values falling between 5 and 20 indicate substantial pollution, whereas values ranging from 20 to 40 suggest severe contamination. EF values surpassing 40 denote egregious pollution levels. The categorization of EF is elaborated upon in Table 1.

Table 1.
Enrichment factor (EF) classification.
3.3.2. Geo-Accumulation Index
The geo-accumulation index, conceived by the esteemed German scientist G. Müller, serves as a metric to quantify the degree of accumulation of heavy metals or other pollutants within soil matrices [39,40]. In contrast to alternative methodologies for assessing pollution, the geo-accumulation index method stands as distinct because of its inclusion of factors influencing shifts in baseline values due to natural diagenesis. This conceptual framework finds primary application within the domains of environmental science and soil science [41]. Geo-accumulation indices are frequently employed to evaluate the magnitude of soil contamination and aid in the formulation of suitable soil management and remediation strategies. The computational formula is as follows:
In the equation, Igeo represents the geo-accumulation index of heavy metal i, where Ci denotes the measured concentration of heavy metal i in soil, and Si stands for the background concentration of element i. The correction coefficient, denoted by k, typically assumes a value of 1.5. Taking into account the genetic type and geomorphology of the surface soil within the study region, alongside the evolutionary dynamics of the environment, this investigation employed the soil environmental background values derived from a comprehensive survey conducted in the northern Haihe Plain area as reference points. These background values serve as benchmarks for comparison. The geo-accumulation index is subsequently categorized into seven tiers based on the Igeo values, as delineated in Table 2.
Table 2.
Classification of the geo-accumulation index (Igeo).
3.3.3. Comprehensive Pollution Index
The pollution index (PIi) and comprehensive pollution index (IPIN) of each soil heavy metal are employed to assess the degree of soil contamination [42,43]. The calculation formula is delineated as follows:
In the equation, Ci represents the measured concentration of element i in the surface soil, while Ti signifies the target management value for trace element i in soil. This assessment relies upon the screening threshold outlined in the Soil Environmental Quality Standard for Agricultural Land and Soil Pollution Risk Management and Control (GB15618-2018) [44]. IPIavg represents the mean value of all pollution indices (PIi) of heavy metals within the surveyed soil, while IPImax denotes the highest recorded value. Based on the magnitude of the IPIN value, which reflects the extent of soil contamination, it is categorized into five levels ranging from absence of pollution to severe pollution. The corresponding relationship between IPIN and pollution severity is outlined as follows: IPIN values less than or equal to 0.7 indicate safety, those exceeding 0.7 but not surpassing 1.0 signify an early warning, while values between 1.0 and 2.0 indicate mild pollution. Similarly, IPIN values ranging from 2.0 to 3.0 suggest moderate pollution, and values exceeding 3.0 indicate severe pollution. The parameters of IPIN are detailed in Table 3.
Table 3.
Classification of the integrated pollution index (IPIN).
3.3.4. Potential Ecological Risk Index
The potential ecological risk index (RI) method stands as the prevailing approach for evaluating the magnitude of soil heavy metal contamination and its concomitant ecological ramifications. This method, pioneered by the esteemed Swedish geochemist, Lars Hakanson, embodies a cornerstone in environmental assessment [45]. This method not only considers the concentration of heavy metals, but also integrates ecological, environmental, and toxicological effects, rendering it a widely adopted approach for ecological risk assessment. Its computational formula is delineated as follows:
In the formula, represents the pollution index of a specific metal; Ci denotes the measured concentration of a specific heavy metal within the soil; and represents the reference concentration of a specific heavy metal. Given the geographical context of the study area nestled within the middle and lower reaches of the Yangtze River Plain, the fluctuation in heavy metal concentrations within its soil is predominantly influenced by the underlying soil parent material and geological backdrop. Consequently, this investigation adopts the eastern Gansu Plain as a comparative model due to its similar genetic characteristics and analogous material origins to those found in the study area. The soil environmental baseline in the eastern territory serves as the benchmark value; represents a singular potential ecological risk index for heavy metals; signifies the toxicity response parameter of a particular heavy metal.
The toxicity factor increases with the increase in metal toxicity. The toxicity response parameters of each heavy metal are 1 for Zn; 2 for Cr and Mn; 5 for Cu, Ni, and Pb; 10 for As; 30 for Cd; and 40 for Hg.
RI represents the cumulative potential ecological risk index. Based on and RI, the classification is conducted for both the potential ecological hazards attributed to individual factors and the comprehensive total potential ecological hazards [46,47] (Table 4).
Table 4.
Hakanson potential ecological hazard evaluation indicators.
3.3.5. Health Risk Assessment
Health risk assessment entails establishing a nexus between human well-being and environmental contamination, while quantitatively scrutinizing and elucidating the perils posed by environmental pollution to human health [48]. The assessment of health risks posed by soil heavy metals entails a meticulous inquiry into the potential detrimental effects these elements may inflict upon human well-being. The accumulation of excessive quantities of heavy metals such as arsenic (As), cadmium (Cd), chromium (Cr), mercury (Hg), lead (Pb), nickel (Ni), zinc (Zn), copper (Cu), and scandium (Sc) within soil matrices may precipitate adverse consequences for both the local ecosystem and human health [49].
Soil heavy metals permeate the human organism through three primary avenues: direct oral ingestion, respiratory inhalation, and dermal contact. They pose both non-carcinogenic and carcinogenic hazards to human health. Presently, the predominant international framework for assessing health risks comprises carcinogenic risk assessment models and non-carcinogenic risk assessment models [50,51]. The formulas for their calculation are as follows:
In the formulas, HQ signifies the composite index of non-carcinogenic health risks associated with all heavy metals, where HQ < 1 denotes that the non-carcinogenic risk posed by heavy metals is negligible, whereas any deviation from this indicates a non-carcinogenic risk; CR denotes the carcinogenic health risk index associated with all heavy metals, and CR values below 1 × 10⁻⁶ indicate it will not have a significant impact on health. A CR value between 1 × 10⁻⁶ and 1 × 10⁻⁴ is with the acceptable range. A CR value exceeding 1 × 10⁻⁴ indicates that exposure to a specific environment will cause an individual to have a certain risk of cancer.
ADDiing, ADDiinh, and ADDiderm symbolize the mean daily exposure of a heavy metal via oral ingestion, respiratory inhalation, and dermal contact, respectively. RfDi represents the non-carcinogenic average daily intake of heavy metal “i”, while SF symbolizes the carcinogenic slope factor.
Within the framework of the soil heavy metal health risk assessment model, the average daily exposure to heavy metals varies between children and adults. It becomes imperative to factor in the average exposure for each individual child and adult, subsequently distributing this exposure uniformly over their entire lifespan. The calculation formulas are as follows:
In the equations, IngR and InhR denote the daily rates of soil intake and soil inhalation, respectively; Ci signifies the concentration of a particular contaminant heavy metal within the soil; EF denotes the frequency of exposure; ED represents the duration of exposure in years; BW denotes the mean body weight; AT represents the mean duration of exposure; PEF signifies the emission factor for surface dust; SA denotes the surface area of exposed skin; SL represents the coefficient of skin adhesion; and ABS signifies the factor of skin absorption.
The exposure parameters, along with the reference dose (RfD) and slope factor (SF) values pertaining to various exposure pathways within the soil heavy metal health risk assessment model, are drawn from the prescribed values delineated in HJ 25.3-2019, issued by the Ministry of Ecology and Environment of China, and the “Outline of the Chinese Population Exposure Parameters Manual (Children’s Volume)” [52,53,54]. The reference measurements and exposure parameters for various exposure pathways in this investigation are elaborated upon in Table 5 and Table 6.
Table 5.
The reference quantities and carcinogenic slope factors for diverse heavy metal exposure pathways.
Table 6.
Parameters for exposure risks associated with heavy metals.
4. Results and Discussion
4.1. Examination of Soil Heavy Metal Levels and Contamination Severity
The average contents of heavy metals As, Cd, Cr, Cu, Hg, Ni, Pb, and Zn in the surface soil of Chenzhou in the study area were 11.2, 0.23, 69.7, 31.1, 0.049, 32.9, 27.81, and 82.9 mg/kg, respectively (Table 7). The values ranging from 7.6 to 9.3 were mainly alkaline and strongly alkaline. The coefficient of CV serves as an indicator of the uniformity and extent of variation among elements present in the soil. In the study area, the soil heavy metals As, Cd, Cu, Hg, and Pb exhibit notable variability. Notably, cadmium displays the most pronounced coefficient of variation and highest level of heterogeneity, potentially influenced by anthropogenic activities. Conversely, Cr, Ni, and Zn demonstrate moderate variability.
Table 7.
Characteristics of heavy metal content in surface soil in Chenzhou.
As per the guidelines stipulated in GB15618-2018 [55] Soil Environmental Quality Agricultural Land Soil Pollution Risk Management and Control Standards, the concentrations of Cr, Hg, Ni, and Zn in all 600 soil samples within the study area fell below the threshold designated for agricultural land soil pollution risk screening. This observation suggests a safe and uncontaminated level of risk. While the levels of As, Cd, Cu, and Pb in certain soil samples surpassed the specified threshold for agricultural land soil pollution risk screening, they remained below the threshold for agricultural land soil pollution risk control. Notably, cadmium concentrations exceeded the agricultural land soil pollution risk screening threshold at 22 sampling points, predominantly situated in the southwest region of Chenzhou.
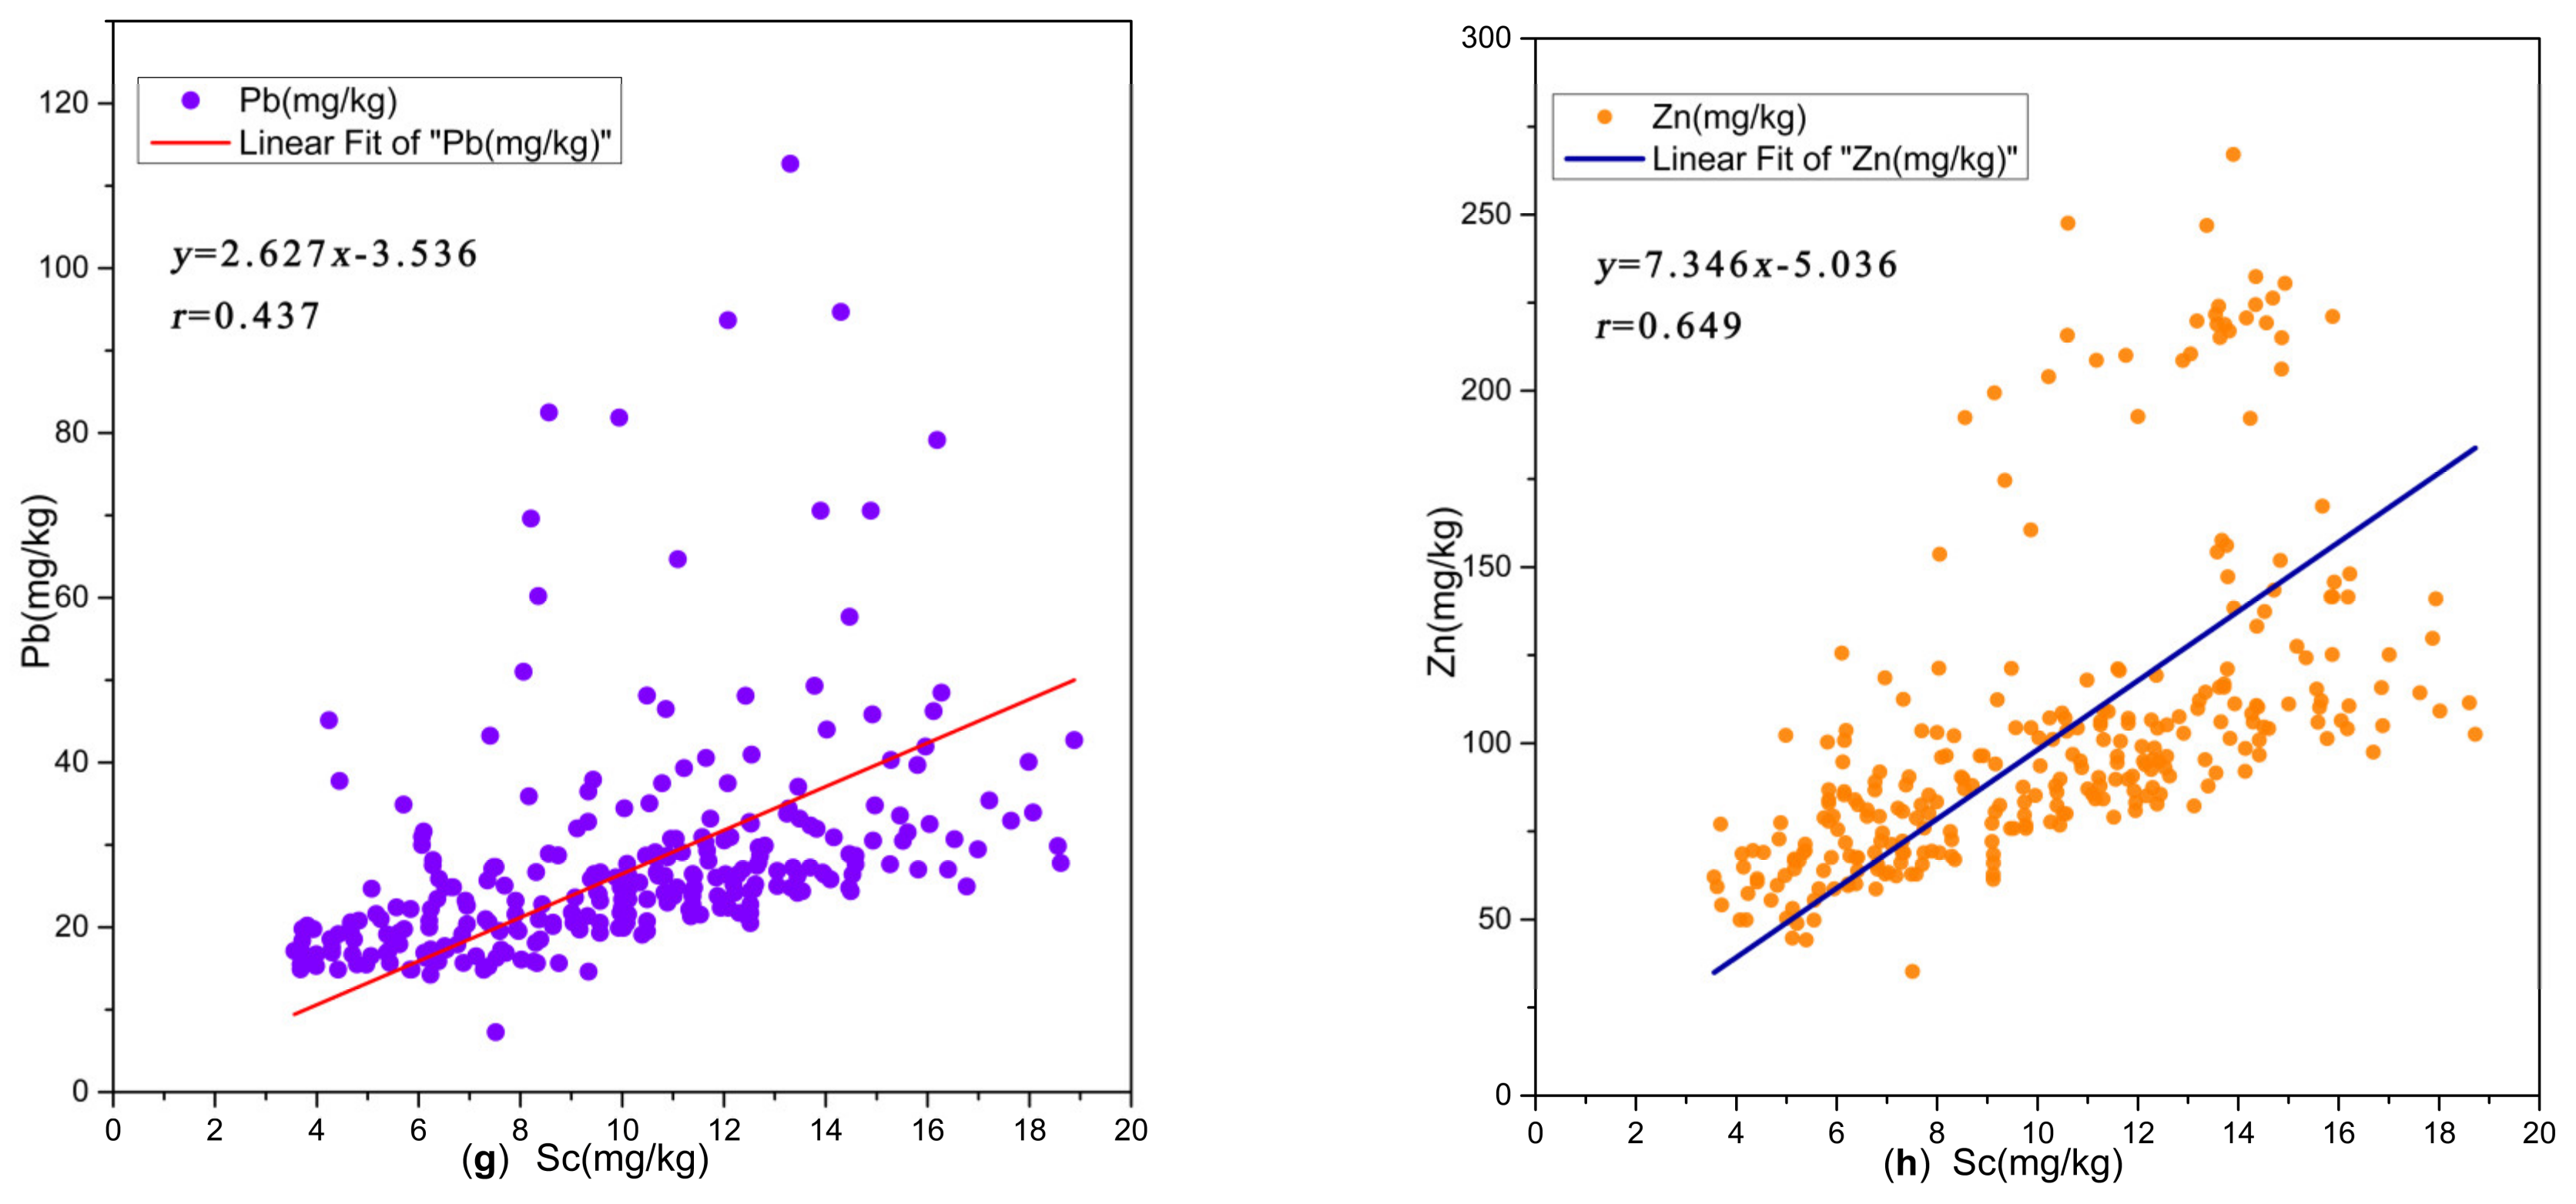
The heavy metals arsenic (As), cadmium (Cd), chromium (Cr), copper (Cu), lead (Pb), nickel (Ni), and zinc (Zn) in the study region exhibit a pronounced positive correlation with the content of Sc (p < 0.01), and there exists a positive correlation between mercury (Hg) and the content of Sc (p < 0.05) (Figure 5). Hence, in the evaluation of soil heavy metal enrichment factors within the study area, it is judicious to designate Sc as the reference element. Sc stands out due to its solitary natural geological provenance, its intimate association with pollutants, and its consistent spatial dispersion [56,57].
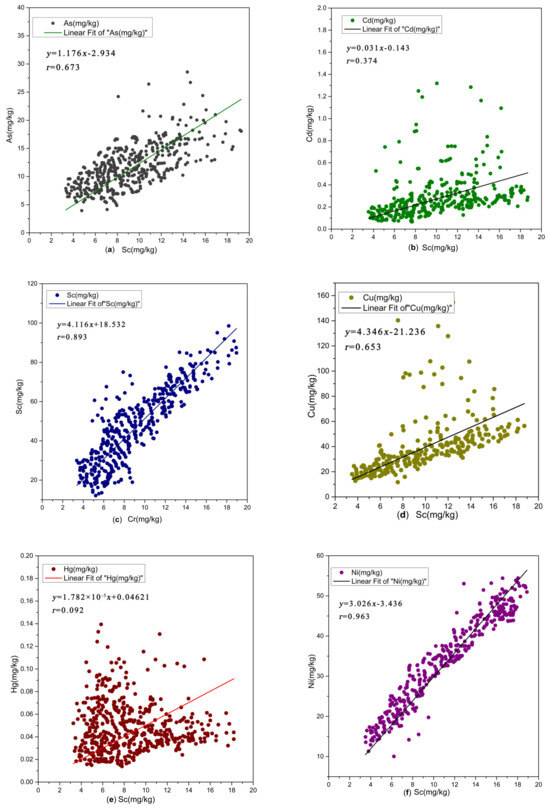
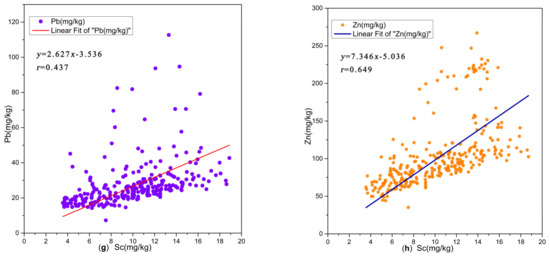
Figure 5.
Correlation between heavy metals and Sc content in soil in the study area. ((a): Correlation between As and Sc content; (b): Correlation between Cd and Sc content; (c): Correlation between Cr and Sc content; (d): Correlation between Cu and Sc content; (e): Correlation between Hg and Sc content; (f): Correlation between Ni and Sc content; (g): Correlation between Pb and Sc content; (h): Correlation between Zn and Sc content).
The assessment of soil heavy metal enrichment factors within the study locale, as delineated in Table 8, indicates that the enrichment factors for chromium (Cr) and nickel (Ni) across all soil samples were below 2, suggesting a general state of minimal to negligible pollution. The manifestations of pollution wrought by mercury (Hg) and cadmium (Cd) were large, with their impact weightier than that of other heavy metals, and a multitude of samples exhibiting contamination. Specifically, there are 94 sample points demonstrating moderate contamination by Hg, and 26 by Cd, constituting 15.67% and 4.33% of the total samples, respectively. Moreover, seven samples evinced significant pollution levels, accounting for 1.17% of the total, while no samples registered highly or extremely contaminated levels.
Table 8.
Classification statistics of heavy metal enrichment factors in surface soil within Chenzhou City.
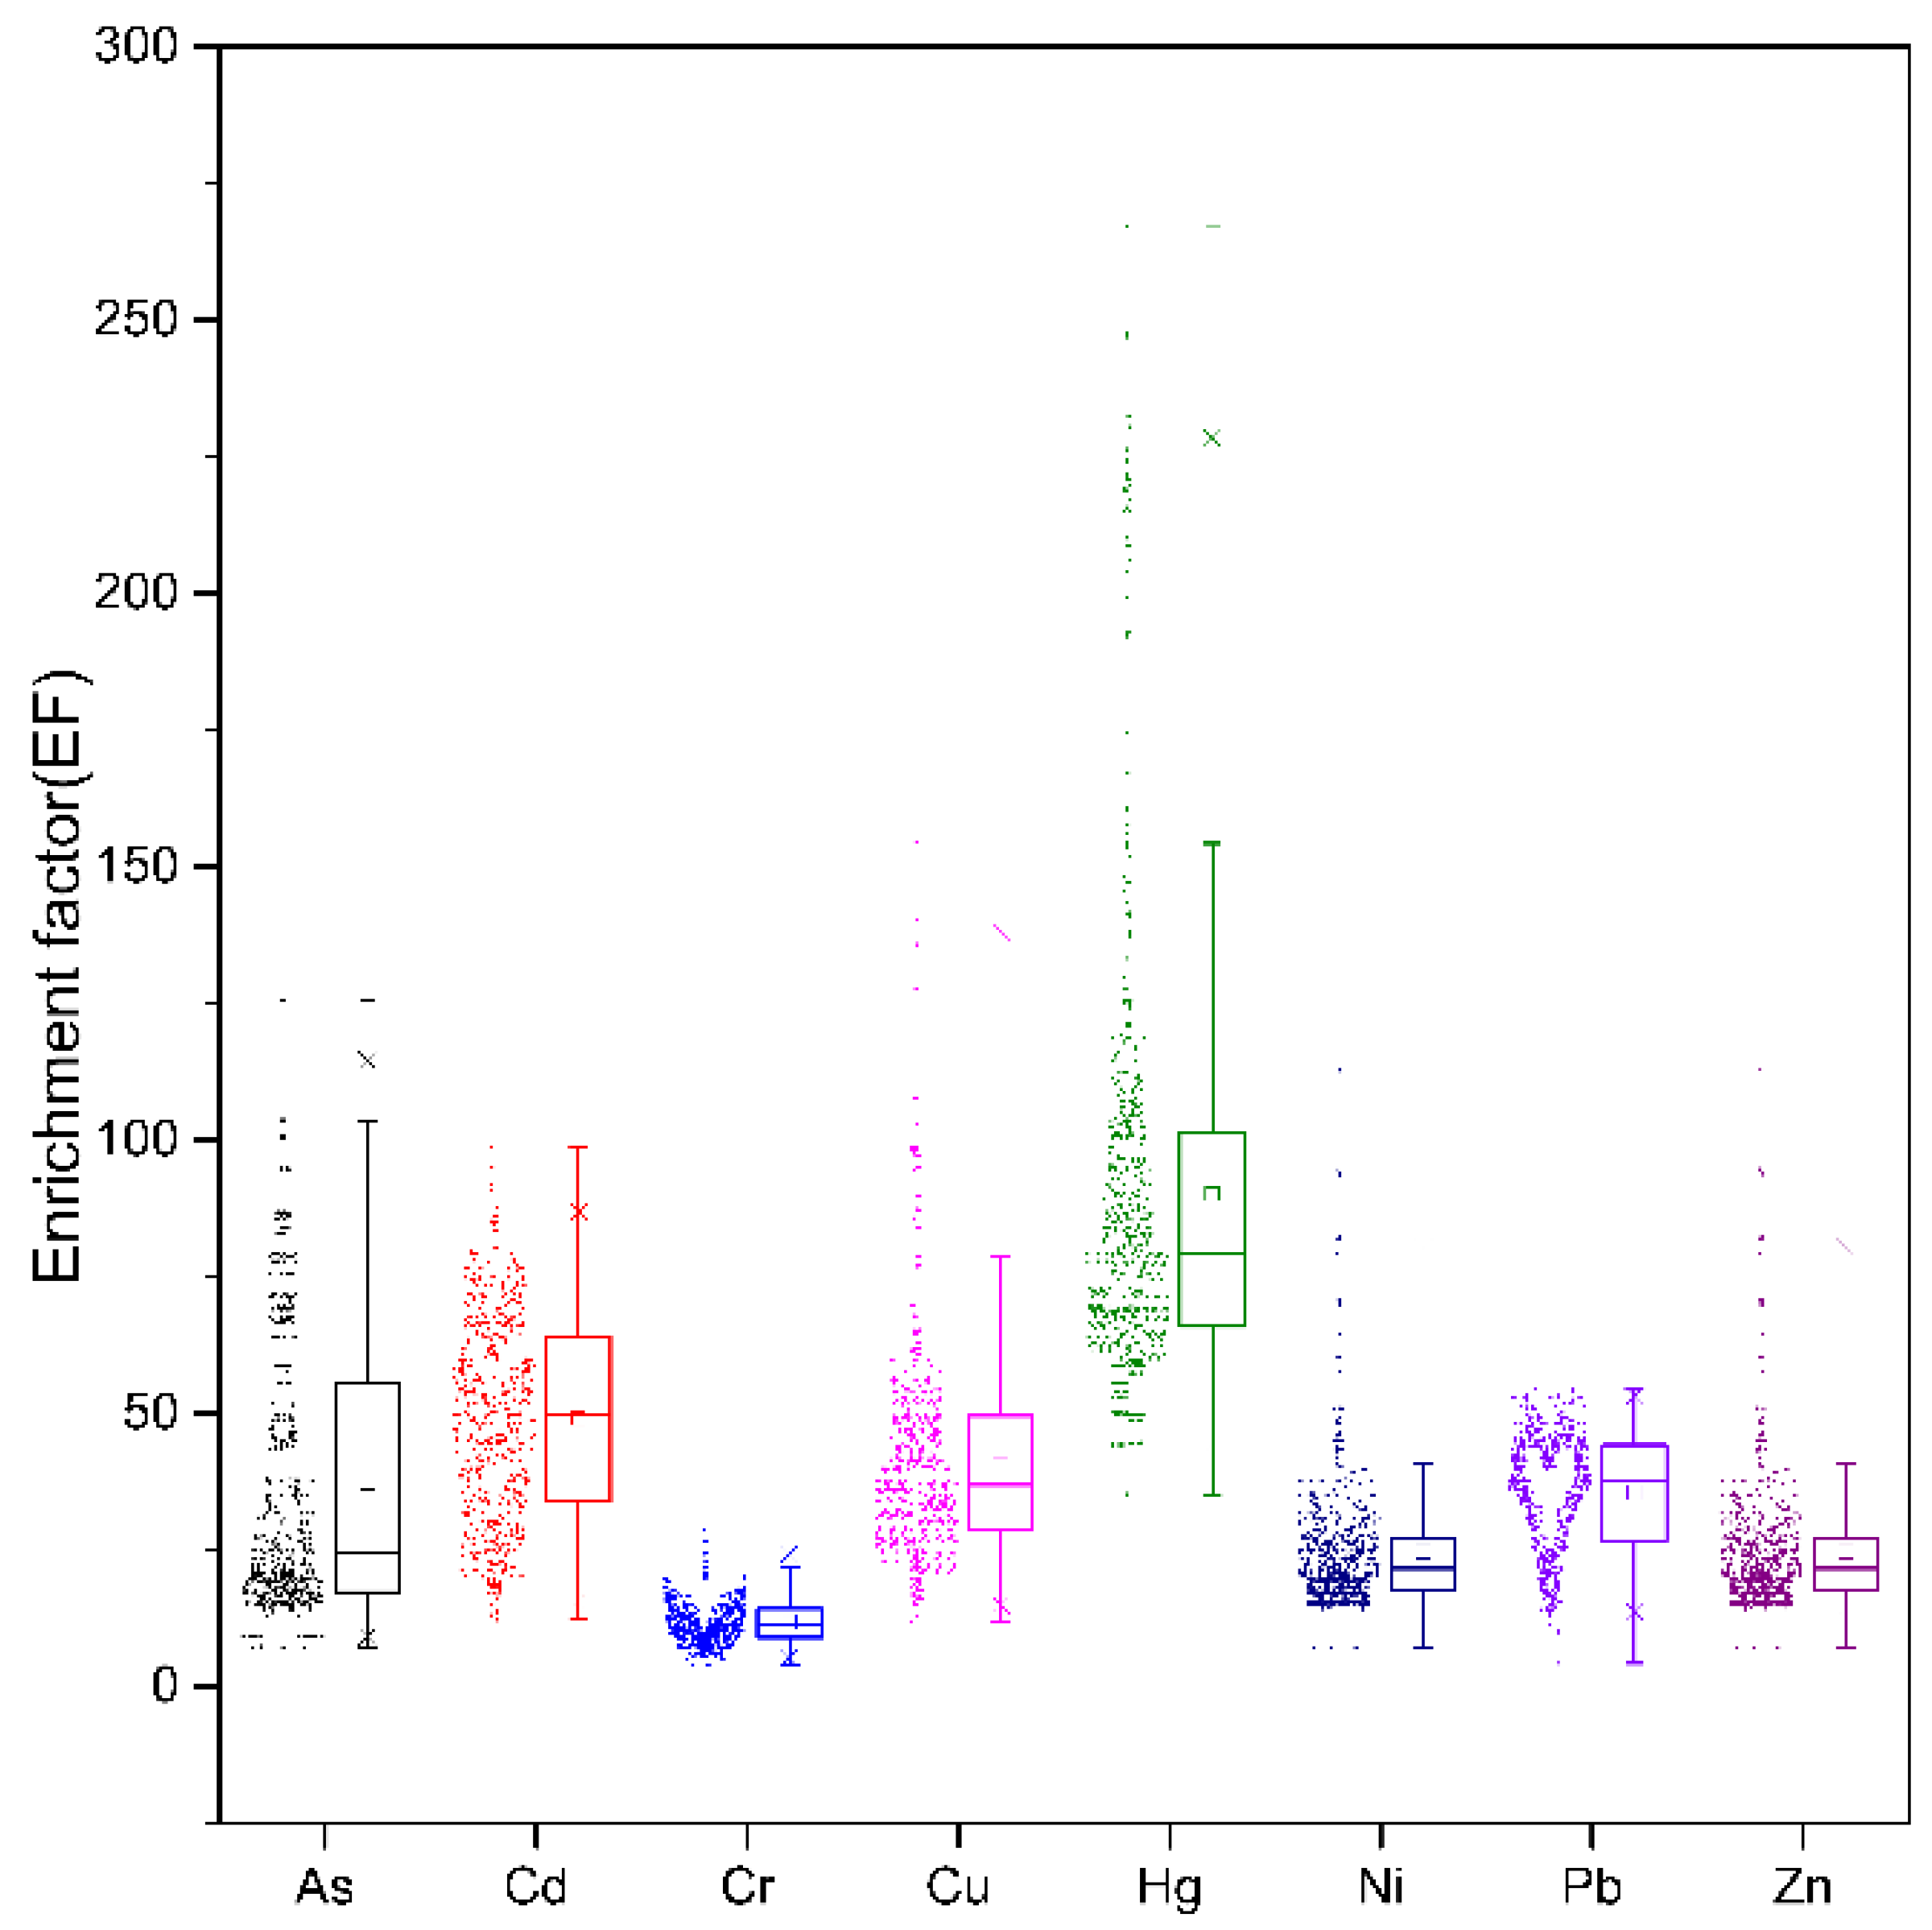
The enrichment factors of Pb and Cu each reached a significant level of pollution in one sample. The average soil heavy metal enrichment factors in descending order were Hg > Cd > Cu > Pb > Ni > Zn > Cr > As. The factor mean values were generally at no pollution to weak pollution levels (Figure 6).
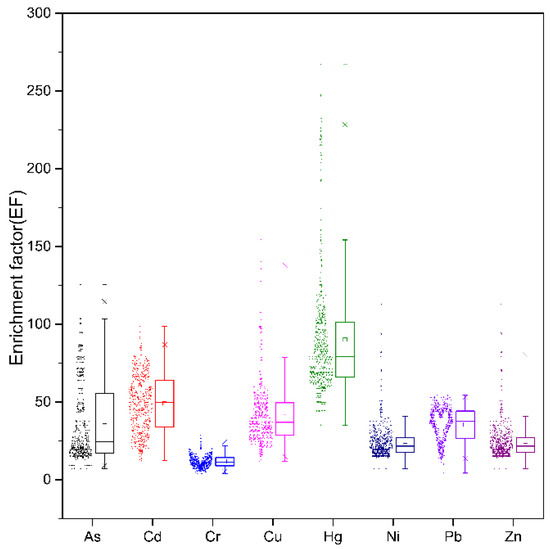
Figure 6.
Box plot of soil heavy metal enrichment factors.
The statistical analysis of soil heavy metal enrichment factors across various land use categories in the study area reveals that the mean disparities in chromium (Cr) and nickel (Ni) enrichment factors remain relatively stable across different land use types. This suggests that the spatial dispersion of these heavy metals is predominantly influenced by geological background variables. Conversely, in comparison to other land use types, construction areas exhibit the highest average enrichment factors for cadmium (Cd), copper (Cu), and zinc (Zn), indicative of the significant impact of human activities on the enrichment levels of these metals.
Table 9 delineates the assessment outcomes regarding soil heavy metal accumulation indices in the designated region. The descending order of average accumulation index values for heavy metals is as follows: mercury (Hg), cadmium (Cd), copper (Cu), lead (Pb), nickel (Ni), zinc (Zn), chromium (Cr), and arsenic (As), aligning with the enrichment factor evaluation results. Notably, the investigation reveals significant soil pollution attributable to mercury (Hg) and cadmium (Cd) within the area. Mercury-contaminated samples constitute 44.50%, 6.33%, and 1.00% of the total samples, respectively, while Cd-contaminated samples comprise 22.83% of the total, including one sample reaching a level of severe pollution. However, no samples exhibit heavy to extremely severe pollution. On the other hand, the geo-accumulation index (Igeo) of arsenic (As), chromium (Cr), nickel (Ni), lead (Pb), and zinc (Zn) generally indicates a non-polluted state, with a minor presence of copper (Cu) and lead (Pb) samples exhibiting light to moderate pollution levels. Samples displaying severe contamination or above are absent.
Table 9.
Classification statistics of heavy metal accumulation indices in surface soil within Chenzhou City.
The comprehensive soil heavy metal pollution index (IPIN) within the study region spans from 0.2 to 3.32, with an average of 0.39, underscoring a relatively low level of soil heavy metal pollution and an overall environment that is deemed relatively safe.
The assessment outcomes of the comprehensive pollution index (PIN) reveal that the IPIN of 571 samples within the study area indicates a level of safety and absence of pollution, constituting 95.17% of the total sample pool. The IPIN of 14 samples reached an early warning status, representing 2.33% of the total sample set. Among these, twelve samples exhibited a light contamination level, while two samples showed moderate contamination, and only one sample reached a severe contamination level. Thus, the proportion of samples in a contaminated state amounted to 2.50% of the total samples.
Of the aforementioned fifteen samples exhibiting contamination, thirteen samples were dominated by cadmium (Cd) in terms of the IPImax of the comprehensive soil heavy metal pollution index, while the remaining two contaminated samples were predominantly influenced by copper (Cu) in this regard. This suggests that cadmium (Cd) primarily contributes to the contamination level surpassing the threshold in these samples.
The soil heavy metal content is affected by different land use patterns. The ranking of the average soil heavy metal comprehensive pollution index IPIN of each land use pattern in the region is construction land (0.425) > cultivated land (0.397) > water and hydraulic construction land (0.391) > forested land (0.374) > artificial grass (0.344) > garden (0.308). The statistical results further reflect that the intensity of human production activities directly affects the degree of soil heavy metal pollution.
4.2. Evaluation of Prospective Ecological Hazards Associated with Soil Heavy Metals
The assessment outcomes regarding the potential ecological risk extent of soil within the study domain, as elucidated in Table 10, indicate that the single-factor potential ecological risk indices of chromium (Cr), copper (Cu), nickel (Ni), and zinc (Zn) across all soil samples in the region fall below 40, signifying a minor ecological risk. The potential ecological risk index for arsenic (As) ranges from 3.64 to 41.52, while, for lead (Pb), it varies from 2.06 to 45.93, indicating slight to moderate ecological risks, but primarily slight. Conversely, the potential ecological risk index for cadmium (Cd) ranges from 11.98 to 511.26, encompassing slight to very severe ecological risks, with predominantly minor risks constituting 67.00% of the total samples, followed by samples exhibiting moderate and severe ecological risks accounting for 27.67% and 3.50% of the total samples, respectively. Regarding mercury (Hg), the risk index spans from 21.18 to 391.12, with a distribution ranging from minor to very severe ecological risks, with mainly medium risks, constituting 61.17% of the total samples, while samples with severe ecological risks make up 22.83% of the total samples. Consequently, the primary potential ecologically hazardous heavy metal elements present in the soil of the study area are mercury (Hg) and cadmium (Cd).
Table 10.
Classification statistics of the potential ecological risk index of soil heavy metals in Chenzhou City.
The range of distribution for the overall potential ecological index (RI) of soil heavy metals spans from 58.21 to 837.53. Within this range, ecological risks vary from slight to severe, predominantly comprising slight and moderate risks, which constitute 69.67% and 27.33% of the total, respectively. Additionally, a minority of sample points exhibit strong potential ecological risks, comprising 2.67% of the total sample set.
The spatial distribution map of RI (Figure 7) illustrates that Linwu County, situated in the southwestern region of Chenzhou, exhibits the most elevated ecological risk. In the local soils there exist formidable potential ecological risks alongside a minor presence of exceedingly potent ecological risks. The inquiry has revealed the presence of localized areas with significant potential ecological risks within Linwu County. Enterprises engaged in the reclamation of non-ferrous metal waste and mining activities are prevalent. Linwu County boasts a mining legacy spanning over four centuries. However, the operations of mining enterprises have inflicted significant environmental pollution upon the mining locale. Following enterprise production, myriad tailings and waste ores remain, extensively scattered throughout the rainfall catchment area spanning hundreds of square kilometers in the upper reaches of the Wushui River. This accumulation has precipitated severe heavy metal pollution and latent safety perils, including landslides and debris flows, within the soil environment of the mining zone and downstream areas. Prolonged industrial activities have escalated ecological risks associated with heavy metals such as cadmium (Cd) and mercury (Hg) in the surrounding soil.
Figure 7.
Distribution of soil potential ecological risk levels in the study area.
4.3. Health Risk Appraisal
4.3.1. Non-Carcinogenic Health Hazard Evaluation
The outcomes of the daily exposure risk assessment within the non-carcinogenic health risk model, as delineated in Table 11, reveal a notable disparity. Specifically, the mean daily exposure to soil heavy metals via direct oral ingestion, primarily through crops, far surpasses the average daily exposure via skin contact and inhalation.
Table 11.
The mean daily exposure to non-carcinogenic heavy metals in soil [mg/(kg·d)].
The hierarchy of non-carcinogenic average daily exposure, ranging from most to least significant, through the three distinct pathways, is as follows: ADDing > ADDderm > ADDinh. In sequence from greatest to least, the average daily intake of various heavy metals through the three pathways unfolds as follows: Zn > Cr > Ni > Cu > Pb > As> Cd > Hg. The solitary-path average daily exposure and cumulative daily exposure of children to all soil heavy metals surpassed those of adults.
The outcomes of the non-carcinogenic health risk assessment reveal a distinctive order in the non-carcinogenic health risk index across diverse exposure routes: HQing > HQderm > HQinh. This hierarchy underscores that oral ingestion serves as the predominant avenue for non-carcinogenic risks associated with soil heavy metals. Indeed, non-carcinogenic health risks exhibit a correlation with exposure pathways. Notably, whether pertaining to children or adults, the mean value of each soil heavy metal’s non-carcinogenic risk index registers below 1. The ranking of non-carcinogenic risk for different heavy metals, from highest to lowest, delineates as follows: As > Cr > Pb > Ni > Cu > Hg > Zn > Cd. This sequence reflects the varied conditions prevailing within the study area. Importantly, individual soil heavy metals do not present non-carcinogenic risks to human health.
The non-carcinogenic health risk index, denoted as HQadult, spans from 0.078 to 0.371 among adults, with an average of 0.122. All HQadult values fall below 1, signifying that the non-carcinogenic health risks posed by the eight heavy metals in the soil to adults are negligible and may be disregarded.
The pediatric heavy metal non-carcinogenic health risk index, denoted as HQchild, spans from 0.198 to 1.007, with an average value of 0.310. Notably, one sample exhibits an HQchild greater than 1, suggesting that heavy metals present in 99.83% of the study area’s samples pose minimal non-carcinogenic health risks to children and may be deemed inconsequential. Nonetheless, a mere 0.17% of isolated soil samples harbor heavy metals that entail non-carcinogenic health risks to children.
The non-carcinogenic risk index for children surpasses that of adults, owing to their distinctive behavioral and physiological traits, rendering them more susceptible to environmental contaminants per unit of body weight than adults. Upon examining the average composition ratio of the non-carcinogenic risk index HQ, as delineated in Table 12, it becomes evident that arsenic (As), chromium (Cr), and lead (Pb) stand out as the primary non-carcinogenic factors among heavy metals in the region. Indeed, the collective HQi values of these three elements collectively represent over 95% of the non-carcinogenic risk index HQ.
Table 12.
Contribution rate of soil heavy metals HQ for adults and children.
4.3.2. Cancer Health Risk Assessment
In light of the absence of established carcinogenic slope factors pertaining to the remaining six heavy metals, save for arsenic (As) and cadmium (Cd), this inquiry exclusively delved into the carcinogenic hazards emanating from soil contact with As and Cd. Correspondingly, the findings from the daily exposure risk assessment employing the non-carcinogenic health risk model remain unaltered. The hierarchy of average daily carcinogenic exposure, in descending order, delineates ingestion as surpassing dermal contact, followed by inhalation. Notably, the primary contributor to the cancer risk index (CR) emerges as the direct oral ingestion of soil-borne heavy metals through the consumption of crops.
The assessment outcomes derived from the cancer health risk model within the study locale reveal that the adult cancer risk index value (CRadult) is dispersed within the range of 4.40 × 10⁻⁶ to 4.22 × 10⁻⁵, with an average value of 9.82 × 10⁻⁶. Based on the CRadult value of 600 samples in the study area within the acceptable range of 10−6~10−4, soil exposure will not cause significant carcinogenic health risks to adults.
The cancer risk index values for children (CRchild) are distributed across a spectrum between 1.13 × 10⁻⁵~1.09 × 10⁻⁴, with an average value of 2.53 × 10⁻⁵. Among them, the CRchild values of 599 samples in the study area are between 10−6~10−4, and the soil exposure is not significant. It will not engender considerable carcinogenic health hazards for children. The cancer risk index (CRchild) value of a singular soil sample fell beyond the anticipated range, exhibiting an excess rate of 0.17%.
Within this set, the individual child cancer risk indices pertaining to each heavy metal, arsenic (As) and cadmium (Cd), fall within the acceptable spectrum. Thus, on the whole, the cumulative cancer risk attributed to soil heavy metals within the study vicinity remains within acceptable bounds. Only isolated soil samples containing heavy metals pose carcinogenic health risks to children, warranting due attention.
5. Conclusions
- (1)
- The variation coefficients of soil elements such as arsenic (As), cadmium (Cd), copper (Cu), mercury (Hg), and lead (Pb) in the study area exceed 36%, rendering them highly variable constituents. Notably, cadmium exhibits the highest variation coefficient, displaying localized enrichment characteristics attributed to external influences.
- (2)
- The mean heavy metal enrichment factor (EF) value for each soil sample was below 2, indicating an overall absence to minimal pollution level in the soil. Evaluation using the geo-accumulation index (Igeo) suggests that soil samples exhibit generally pollution-free levels of arsenic (As), chromium (Cr), nickel (Ni), lead (Pb), and zinc (Zn). Moreover, the comprehensive soil pollution index (IPIN) indicates that 95.17% of soil samples in the area are within safe and pollution-free levels, underscoring the overall environmental safety of the region.
- (3)
- The soil within the region predominantly exhibits mild and moderate levels of potential ecological risk, comprising 69.67% and 27.33% respectively. A minority of samples, constituting 2.67% of the total, demonstrate pronounced potential ecological risk levels, primarily concentrated within the research area. In the southwestern sector of the district, influenced by the waste nonferrous metal recycling, mining, and other associated industrial operations of neighboring enterprises, the ecological hazards posed by heavy metals such as cadmium (Cd) and mercury (Hg) in the surrounding soil are relatively elevated.
- (4)
- The human health risk assessment outcomes pertaining to heavy metals indicate that oral ingestion constitutes the primary pathway of exposure to heavy metals present in soil. In the study area, arsenic (As), chromium (Cr), and lead (Pb) emerge as the principal non-carcinogenic factors within the soil matrix. The non-carcinogenic health risk index (HQadult) for adults remains consistently below 1, rendering the associated hazards negligible. However, the non-carcinogenic health risk index (HQchild) for children exceeds 1 in one sample, signifying a certain level of non-carcinogenic risk to children. This underscores the heightened vulnerability of children to the threats posed by heavy metals compared to adults.
6. Future Directions and Research Opportunities
In contemplating future trajectories and avenues for research concerning soil heavy metal risk assessment in Chenzhou, it is imperative to accentuate the significance of bioavailability scores in evaluating heavy metal risks. These scores offer critical insights into the accessibility and potential harm posed by heavy metals present in soil to biological organisms. Moving forward, further exploration into refining and standardizing methodologies for determining bioavailability scores across diverse environmental contexts holds great promise. Additionally, the examination of the effect of various factors such as soil properties, land use patterns, and climatic conditions on heavy metal bioavailability warrants diligent attention. Environmental purification can be conducted using organisms and using plants. It is hoped that, in the future, progress can be made in the decomposition of heavy metals in soil. Moreover, the integration of advanced techniques such as molecular biology and spectroscopy with traditional approaches can enrich our comprehension of heavy metal dynamics in soil ecosystems. Embracing interdisciplinary collaboration and harnessing cutting-edge technologies will undoubtedly pave the way for more comprehensive and precise assessments of soil heavy metal risks, thereby contributing to the formulation of effective mitigation strategies and the preservation of environmental and human health in Chenzhou and beyond.
Author Contributions
Conceptualization, C.Z.; Data curation, X.C.; Formal analysis, Y.K., X.C. and C.Z.; Methodology, Y.K. and C.Z.; Software, Y.K. and X.C.; Writing—original draft, Y.K. and X.C.; Writing—review and editing, Y.K., X.C. and C.Z. All authors have read and agreed to the published version of the manuscript.
Funding
This research received no external funding.
Data Availability Statement
The data presented in this study are available on request from the corresponding author.
Conflicts of Interest
The authors declare no conflicts of interest.
References
- Kutralam-Muniasamy, G.; Pérez-Guevara, F.; Martínez, I.E.; Shruti, V. Overview of microplastics pollution with heavy metals: Analytical methods, occurrence, transfer risks and call for standardization. J. Hazard. Mater. 2021, 415, 125755. [Google Scholar] [CrossRef]
- Tapia-Gatica, J.; Selles, I.; Bravo, M.A.; Tessini, C.; Barros-Parada, W.; Novoselov, A.; Neaman, A. Global issues in setting legal limits on soil metal contamination: A case study of Chile. Chemosphere 2022, 290, 133404. [Google Scholar] [CrossRef]
- Peng, J.-Y.; Zhang, S.; Han, Y.; Bate, B.; Ke, H.; Chen, Y. Soil heavy metal pollution of industrial legacies in China and health risk assessment. Sci. Total Environ. 2022, 816, 151632. [Google Scholar] [CrossRef]
- Peng, C.; Zhang, K.; Wang, M.; Wan, X.; Chen, W. Estimation of the accumulation rates and health risks of heavy metals in residential soils of three metropolitan cities in China. J. Environ. Sci. 2022, 115, 149–161. [Google Scholar] [CrossRef] [PubMed]
- Liu, P.; Wu, Q.; Wang, X.; Hu, W.; Liu, X.; Tian, K.; Xie, E.; Zhao, Y.; Huang, B.; Yoon, S.J. Spatiotemporal variation and sources of soil heavy metals along the lower reaches of Yangtze River, China. Chemosphere 2022, 291, 132768. [Google Scholar] [CrossRef] [PubMed]
- Anaman, R.; Peng, C.; Jiang, Z.; Liu, X.; Zhou, Z.; Guo, Z.; Xiao, X. Identifying sources and transport routes of heavy metals in soil with different land uses around a smelting site by GIS based PCA and PMF. Sci. Total Environ. 2022, 823, 153759. [Google Scholar] [CrossRef] [PubMed]
- Chen, T.-B.; Zheng, Y.-M.; Lei, M.; Huang, Z.-C.; Wu, H.-T.; Chen, H.; Fan, K.-K.; Yu, K.; Wu, X.; Tian, Q.-Z. Assessment of heavy metal pollution in surface soils of urban parks in Beijing, China. Chemosphere 2005, 60, 542–551. [Google Scholar] [CrossRef] [PubMed]
- Wu, S.; Liu, X.; Liu, M.; Chen, X.; Liu, S.; Cheng, L.; Lin, X.; Li, Y. Sources, influencing factors and environmental indications of PAH pollution in urban soil columns of Shanghai, China. Ecol. Indic. 2018, 85, 1170–1180. [Google Scholar] [CrossRef]
- Zhou, W.; Li, R.; Yue, H.; Shen, S.; Zhu, H.; Xie, X. Characteristics and assessment of heavy metal pollution in vegetable soils in Jiangbei area of Nanjing City. Trans. Atmos. Sci. 2009, 32, 574–581. [Google Scholar]
- Zhou, H.; Ouyang, T.; Guo, Y.; Peng, S.; He, C.; Zhu, Z. Assessment of soil heavy metal pollution and its ecological risk for city parks, vicinity of a landfill, and an industrial area within Guangzhou, South China. Appl. Sci. 2022, 12, 9345. [Google Scholar] [CrossRef]
- Chen, X.; Lu, X. Contamination characteristics and source apportionment of potentially toxic elements in the topsoil of Huyi District, Xi’an City, China. Environ. Earth Sci. 2021, 80, 153–160. [Google Scholar] [CrossRef]
- Shi, W.; Li, T.; Feng, Y.; Su, H.; Yang, Q. Source apportionment and risk assessment for available occurrence forms of heavy metals in Dongdahe Wetland sediments, southwest of China. Sci. Total Environ. 2022, 815, 152837. [Google Scholar] [CrossRef]
- Qiao, P.; Wang, S.; Li, J.; Zhao, Q.; Wei, Y.; Lei, M.; Yang, J.; Zhang, Z. Process, influencing factors, and simulation of the lateral transport of heavy metals in surface runoff in a mining area driven by rainfall: A review. Sci. Total Environ. 2023, 857, 159119. [Google Scholar] [CrossRef]
- Li, Z.; Lu, W.; Huang, J. Monitoring, Diffusion and Source Speculation Model of Urban Soil Pollution. Processes 2020, 8, 1339. [Google Scholar] [CrossRef]
- Janaszek, A.; Silva, A.F.d.; Jurišević, N.; Kanuchova, M.; Kozáková, Ľ.; Kowalik, R. The Assessment of Sewage Sludge Utilization in Closed-Loop Economy from an Environmental Perspective. Water 2024, 16, 383. [Google Scholar] [CrossRef]
- Williams, J.A.; Antoine, J. Evaluation of the elemental pollution status of Jamaican surface sediments using enrichment factor, geoaccumulation index, ecological risk and potential ecological risk index. Mar. Pollut. Bull. 2020, 157, 111288. [Google Scholar] [CrossRef]
- Günal, E.; Budak, M.; Kılıç, M.; Cemek, B.; Sırrı, M. Combining spatial autocorrelation with artificial intelligence models to estimate spatial distribution and risks of heavy metal pollution in agricultural soils. Environ. Monit. Assess. 2023, 195, 317. [Google Scholar] [CrossRef] [PubMed]
- Xiaofeng, W.; Wenbo, L.; Qipeng, X.; Yanbin, M.; Bin, Q.; Zeyan, L.; Liping, H. Evaluation of soil environmental quality of cultivated land in the Donghe River Basin of Chenzhou City, Hunan Province by three methods. J. Environ. Occup. Med. 2022, 39, 684–689. [Google Scholar]
- Zheng, B.; Li, J.; Chen, X.; Luo, X. Evaluating the Effects of Roof Greening on the Indoor Thermal Environment throughout the Year in a Chinese City (Chenzhou). Forests 2022, 13, 304. [Google Scholar] [CrossRef]
- Xue, B.; Liu, B.; Yang, Q.; Sun, X.; Wang, W.; Li, L. Formalizing an evaluation-prediction based roadmap towards urban sustainability: A case study of Chenzhou, China. Habitat. Int. 2021, 112, 102376. [Google Scholar] [CrossRef]
- Luo, X.; Wang, J.; Li, J. Study on the Effect of Vegetation Coverage on Urban Cooling and Energy Conservation: A Case Study of a Typical Hilly City, Chenzhou, China. Buildings 2022, 12, 640. [Google Scholar] [CrossRef]
- Zhu, L.; Carlin, B.P. Comparing hierarchical models for spatio-temporally misaligned data using the deviance information criterion. Stat. Med. 2000, 19, 2265–2278. [Google Scholar] [CrossRef]
- Cui, X.; Mei, C.; Qin, Y.; Yan, G.; Fu, Q. In-motion alignment for low-cost SINS/GPS under random misalignment angles. J. Navig. 2017, 70, 1224–1240. [Google Scholar] [CrossRef]
- Fan, C.-Z.; Liu, Y.-B.; Yuan, J.-H.; Guo, W.; Sun, D.-Y.; Liu, C.-H. Characteristics of Heavy Metals and Other Elements in Atmospheric Dry and Wet Deposition and Health Risk Assessment of a Typical Industrial and Mining City in Central Yunnan. Huan Jing Ke Xue Huanjing Kexue 2022, 43, 3923–3933. [Google Scholar] [PubMed]
- Li, M.; Yang, B.; Ju, Z.; Qiu, L.; Xu, K.; Wang, M.; Chen, C.; Zhang, K.; Zhang, Z.; Xiang, S. Do high soil geochemical backgrounds of selenium and associated heavy metals affect human hepatic and renal health? Evidence from Enshi County, China. Sci. Total Environ. 2023, 883, 163717. [Google Scholar] [CrossRef]
- Parker, C.; Rees, W. Fluorescence spectrometry. A review. Analyst 1962, 87, 83–111. [Google Scholar] [CrossRef]
- Chen, Y.; Zhang, Q.; Zhang, L.; Wang, Y.; Song, Y.; Li, Y.; Yin, Y.; Cai, Y. An improved method for rapid and safe preparation and measurement of dimethylmercury using gas chromatography-atomic fluorescence spectrometry. J. Chromatogr. A 2023, 1712, 464472. [Google Scholar] [CrossRef]
- Roberts, N.M.; Drost, K.; Horstwood, M.S.; Condon, D.J.; Chew, D.; Drake, H.; Milodowski, A.E.; McLean, N.M.; Smye, A.J.; Walker, R.J. Laser ablation inductively coupled plasma mass spectrometry (LA-ICP-MS) U–Pb carbonate geochronology: Strategies, progress, and limitations. Geochronology 2020, 2, 33–61. [Google Scholar] [CrossRef]
- Bolea-Fernandez, E.; Rua-Ibarz, A.; Velimirovic, M.; Tirez, K.; Vanhaecke, F. Detection of microplastics using inductively coupled plasma-mass spectrometry (ICP-MS) operated in single-event mode. J. Anal. At. Spectrom. 2020, 35, 455–460. [Google Scholar] [CrossRef]
- Weindorf, D.C.; Chakraborty, S. Portable X-ray fluorescence spectrometry analysis of soils. Soil Sci. Soc. Am. J. 2020, 84, 1384–1392. [Google Scholar] [CrossRef]
- Cui, M.-J.; Lai, H.-J.; Hoang, T.; Chu, J. One-phase-low-pH enzyme induced carbonate precipitation (EICP) method for soil improvement. Acta Geotech. 2021, 16, 481–489. [Google Scholar] [CrossRef]
- Chung, M.-T.; Peng, Y.-Y.; Nazir, A.; Wang, Y.-C.; Wang, P.-L.; Shiao, J.-C. Species-specific trophic enrichment factor of stable nitrogen and carbon isotopes in fish otolith organic matter. Mar. Freshw. Res. 2023, 74, 956–968. [Google Scholar] [CrossRef]
- Lauderdale, L.K.; Shorter, K.A.; Zhang, D.; Gabaldon, J.; Mellen, J.D.; Granger, D.A.; Walsh, M.T.; Miller, L.J. Environmental Enrichment Factors Associated with the Activity Level of Bottlenose Dolphins under Professional Care. J. Zool. Bot. Gard. 2022, 3, 44–55. [Google Scholar] [CrossRef]
- Suyatno, A.P.; Afiati, N.; Muskananfola, M.R. Analysis of Enrichment Factors and Contamination Factors of Cd, Cr and Cu in Western Flood Canal Semarang, Central Java. Berk. Perikan. Terubuk 2021, 49, 1042–1052. [Google Scholar]
- Qin, H.-B.; Yang, S.; Tanaka, M.; Sanematsu, K.; Arcilla, C.; Takahashi, Y. Scandium immobilization by goethite: Surface adsorption versus structural incorporation. Geochim. et Cosmochim. Acta 2021, 294, 255–272. [Google Scholar] [CrossRef]
- Artemenkov, A. Content of Rare-Earth Elements in Soils of Technogeochemical Anomalies. Russ. J. Gen. Chem. 2020, 90, 2573–2581. [Google Scholar] [CrossRef]
- Fahman, G.; Sianita, M.M. Calculation of enrichment factor in chloramphenicol analysis in shrimp with variation of concentration using molecularly imprinted polymer. World J. Adv. Res. Rev. 2022, 15, 362–368. [Google Scholar] [CrossRef]
- Yasuda, K.; Hamada, K.; Asakura, Y. Enrichment of amino acids from its aqueous solution by ultrasonic atomization and ultrafine bubbles. Jpn. J. Appl. Phys. 2022, 61, SG1009. [Google Scholar] [CrossRef]
- Abdullah, M.I.C.; Sah, A.S.R.M.; Haris, H. Geoaccumulation index and enrichment factor of arsenic in surface sediment of Bukit Merah Reservoir, Malaysia. Trop. Life Sci. Res. 2020, 31, 109. [Google Scholar] [CrossRef]
- Wardani, N.; Prartono, T.; Sulistiono, S. Sediments quality based on Geo-Accumulation Index in heavy metals (Pb, Cu, and Cd) of Cengkok coastal waters, Banten Bay. J. Pendidik. IPA Indones. 2020, 9, 574–582. [Google Scholar] [CrossRef]
- Senoro, D.B.; Monjardin, C.E.F.; Fetalvero, E.G.; Benjamin, Z.E.C.; Gorospe, A.F.B.; de Jesus, K.L.M.; Ical, M.L.G.; Wong, J.P. Quantitative Assessment and Spatial Analysis of Metals and Metalloids in Soil Using the Geo-Accumulation Index in the Capital Town of Romblon Province, Philippines. Toxics 2022, 10, 633. [Google Scholar] [CrossRef] [PubMed]
- Wang, Y.; Zhao, S.; Sun, M.; Lv, X.; Cai, W.; Xu, X.; Ge, H.; Lei, K. Assessment of river ecosystem health in Tianjin City, China: Index of ecological integrity and water comprehensive pollution approach. Front. Earth Sci. 2021, 15, 936–946. [Google Scholar] [CrossRef]
- Yang, H.; Jia, C.; Yang, F.; Yang, X.; Wei, R. Water quality assessment of deep learning-improved comprehensive pollution index: A case study of Dagu River, Jiaozhou Bay, China. Environ. Sci. Pollut. Res. 2023, 30, 66853–66866. [Google Scholar] [CrossRef]
- Wang, X.-B.; Xiang, Y.; Li, X.-Y. Environmental risks for application of magnesium slag to soils in China. J. Integr. Agric. 2020, 19, 1671–1679. [Google Scholar] [CrossRef]
- Nalan, K.; Dengiz, O. Assessment of potential ecological risk index based on heavy metal elements for organic farming in micro catchments under humid ecological condition. Eurasian J. Soil. Sci. 2020, 9, 194–201. [Google Scholar]
- Ranjani, M.; Veerasingam, S.; Venkatachalapathy, R.; Mugilarasan, M.; Bagaev, A.; Mukhanov, V.; Vethamony, P. Assessment of potential ecological risk of microplastics in the coastal sediments of India: A meta-analysis. Mar. Pollut. Bull. 2021, 163, 111969. [Google Scholar] [CrossRef]
- Saha, A.; Gupta, B.S.; Patidar, S.; Martínez-Villegas, N. Evaluation of potential ecological risk index of toxic metals contamination in the soils. Chem. Proc. 2022, 10, 59. [Google Scholar]
- Khamraev, K.; Cheriyan, D.; Choi, J.-h. A review on health risk assessment of PM in the construction industry–Current situation and future directions. Sci. Total Environ. 2021, 758, 143716. [Google Scholar] [CrossRef]
- Cabral-Pinto, M.M.; Inácio, M.; Neves, O.; Almeida, A.A.; Pinto, E.; Oliveiros, B.; Ferreira da Silva, E.A. Human health risk assessment due to agricultural activities and crop consumption in the surroundings of an industrial area. Expo. Health 2020, 12, 629–640. [Google Scholar] [CrossRef]
- Arshad, H.; Mehmood, M.Z.; Shah, M.H.; Abbasi, A.M. Evaluation of heavy metals in cosmetic products and their health risk assessment. Saudi Pharm. J. 2020, 28, 779–790. [Google Scholar] [CrossRef]
- Nag, R.; Cummins, E. Human health risk assessment of lead (Pb) through the environmental-food pathway. Sci. Total Environ. 2022, 810, 151168. [Google Scholar] [CrossRef]
- Bazeli, J.; Ghalehaskar, S.; Morovati, M.; Soleimani, H.; Masoumi, S.; Rahmani Sani, A.; Saghi, M.H.; Rastegar, A. Health risk assessment techniques to evaluate non-carcinogenic human health risk due to fluoride, nitrite and nitrate using Monte Carlo simulation and sensitivity analysis in Groundwater of Khaf County, Iran. Int. J. Environ. Anal. Chem. 2022, 102, 1793–1813. [Google Scholar] [CrossRef]
- Liu, X.; Gu, S.; Yang, S.; Deng, J.; Xu, J. Heavy metals in soil-vegetable system around E-waste site and the health risk assessment. Sci. Total Environ. 2021, 779, 146438. [Google Scholar] [CrossRef]
- Yu, G.; Wang, J.; Liu, L.; Li, Y.; Zhang, Y.; Wang, S. The analysis of groundwater nitrate pollution and health risk assessment in rural areas of Yantai, China. BMC Public Health 2020, 20, 437. [Google Scholar] [CrossRef] [PubMed]
- GB 15618-2018; Soil Environmental Quality Risk Control Standard for Soil Contamination of Agriculture Land. China Environmental Science Press: Beijing, China, 2018.
- Junior, A.B.; Espinosa, D.C.R.; Vaughan, J.; Tenório, J.A.S. Recovery of scandium from various sources: A critical review of the state of the art and future prospects. Miner. Eng. 2021, 172, 107148. [Google Scholar] [CrossRef]
- Gentzmann, M.C.; Schraut, K.; Vogel, C.; Gäbler, H.-E.; Huthwelker, T.; Adam, C. Investigation of scandium in bauxite residues of different origin. Appl. Geochem. 2021, 126, 104898. [Google Scholar] [CrossRef]


Disclaimer/Publisher’s Note: The statements, opinions and data contained in all publications are solely those of the individual author(s) and contributor(s) and not of MDPI and/or the editor(s). MDPI and/or the editor(s) disclaim responsibility for any injury to people or property resulting from any ideas, methods, instructions or products referred to in the content. |
© 2024 by the authors. Licensee MDPI, Basel, Switzerland. This article is an open access article distributed under the terms and conditions of the Creative Commons Attribution (CC BY) license (https://creativecommons.org/licenses/by/4.0/).