Article

Research on the Influencing Factors of the Void Volume of Insoluble Sediment in Salt Cavern Gas Storage

1
Underground Storage Research Center, Research Institute of Petroleum Exploration & Development, China National Petroleum Corporation, Beijing 100083, China
2
Key Laboratory of Oil & Gas Underground Storage Engineering, China National Petroleum Corporation, Langfang 065007, China
3
College of Petroleum Engineering, China University of Petroleum (Beijing), Beijing 102249, China
*
Author to whom correspondence should be addressed.
Processes 2024, 12(4), 636; https://doi.org/10.3390/pr12040636
Submission received: 31 January 2024 / Revised: 14 March 2024 / Accepted: 19 March 2024 / Published: 22 March 2024
(This article belongs to the Section Chemical Processes and Systems)

Abstract

:
Utilizing voids of insoluble sediment (IS) to store gas is an effective way to improve the efficiency of salt cavern gas storage (SCGS) in China. In this study, a suitable method for predicting the void volume of insoluble sediments (VVISs) is established. This study explores three key factors affecting the VVISs through laboratory experiments. Firstly, in order to make the experimental results more in line with production realities, an analysis of the characteristics of IS in X SCGS was conducted to provide a basis for setting parameters for subsequent experiments. Secondly, experimental setups and methods for measuring the VVISs were designed. Finally, the experimental results were used to predict the VVISs in on-site cavity wells. The results indicate that the higher the proportion of quartz, illite, and large-grain particles in IS, the larger the VVISs. Under different parameters, the VVISs can account for approximately 10–40% of the IS accumulation volume. Different particle sizes can cause a variation of approximately 5–30% in the VVISs, while different mineral compositions can result in a difference of 6–23% in the VVISs. With increasing compaction pressure, the VVISs can decrease by around 5–80%. The prediction of the VVISs in on-site cavity wells shows a high degree of fit with empirical algorithms. This study can provide a reference basis for the utilization of the void space of IS in SCGS.

1. Introduction

In the initial phase, SCGS in China prioritized salt mines characterized by the high purity of salt rock, the considerable thickness of the salt layer, the minimal content of the insoluble matter within the strata, and sparse interlayers for construction purposes [1,2,3,4]. However, driven by the imperatives of economic and societal progress, particularly in light of the gas storage reservoir construction area in key consumption zones across central and eastern China, the establishment of SCGS necessitated a shift towards developing sites featuring multiple interlayers and elevated levels of IS [5,6,7,8]. Moreover, IS accumulates at the cavity bottom, occupying approximately half of the cavity space and resulting in diminished economic benefits [9]. Consequently, the effective utilization of the void space of IS has emerged as a critical concern in SCGS. It has been demonstrated that IS exhibits a high void ratio and good connectivity, making it capable of large-scale gas storage [10,11,12,13]. Therefore, achieving a breakthrough in low-grade salt mines holds substantial promise for expanding the site selection and effectively utilizing the underground space of salt caverns.
During SCGS cavity creation, IS within the strata gradually accumulates at the bottom of the cavity following water-soluble flaking, sediment deposition, and compaction from overlying IS [14,15]. Thus, ISs are the loose and porous accumulations. Researchers have conducted extensive studies on IS.
One research aspect is the investigation of the morphology and distribution of IS accumulations. For instance, Li et al. performed simulations on IS particles by mechanically crushing cores and studied the accumulation morphology through laboratory simulation experiments and mathematical methods [16,17]. They developed morphology equations for two-dimensional axisymmetric salt cavities, providing valuable insights into the shape of accumulations.
Additionally, Yvan Charnavel et al. studied the impact of different morphologies on storable space [18]. If the IS top surface morphology mirrors a “triangle” or “wave” shape, it will lead to an approximate 10% reduction in gas storage space during the present gas injection and brine discharge operations.
Based on the rock core of Jintan SCGS, Zhang et al. analyzed the physical characteristics of IS during the core water solution process and the flow law of IS in brine during gas injection and brine discharge [19]. Another important aspect is the characteristic of the particle size distribution and porosity of IS, which Ren et al. studied through core water solution experiments [20,21]. Their findings indicate a significant void ratio in IS, which is critical for using void space in IS.
Regarding the issue of the water swelling of IS, Chen Xiaoyuan et al. found that the bulking coefficient of IS is independent of the size of the IS and is inversely proportional to the IS surface area. The more edge-to-edge contacts, the smaller the bulking coefficient, while the more edge-to-corner contacts, the greater the bulking coefficient; the more uneven the particle size ratio, the greater the bulking coefficient [22].
In addition to investigating the particle size and water swelling of IS in relation to accumulation patterns, a number of studies have conducted physical simulation experiments to quantify the available gas storage space within IS. Liang et al. proposed a method based on liquid injection testing to derive the volume balance relationship of liquid injection testing to predict the effective volume of IS. The results showed a difference of 0.79% compared to on-site testing [23]. Researchers, such as Li et al., have also analyzed the void network characteristics of IS using advanced imaging techniques like x-ray computed tomography. They found that IS permeability positively correlates with porosity, highlighting the importance of porosity in enhancing gas storage capacity [24,25]. He et al. conducted an analysis of IS in the docking well and investigated the gas injection pressure and particle size influencing sediment space in the connecting channel through experiments of gas injection and brine discharge [26].
Moreover, based on these scientific investigations, researchers are developing innovative approaches to utilize void space effectively. Li et al. designed a gas injection and brine discharge simulation experimental setup to determine the void ratio of IS, which aids in optimizing gas storage operations [27]. These findings provide critical insights into the behavior of IS and can guide the optimization of gas storage strategies.
Liu et al. provided a new idea for the reconstruction of SCGS with multiple interlayers and low salt purity in China. They utilized complex connected old cavities to shorten the construction period and increase economic benefits [28]. This idea avoids various problems caused by IS.
Previous studies have focused on the composition, properties, and behavior of IS in SCGS. Various analytical techniques, such as X-ray diffraction, geophysical surveys, laboratory experiments, and numerical modeling, have been employed to characterize IS. But in the earliest studies of IS, they obtained IS for experiments by water solution or mechanically fractured cores. Due to the lack of production data for cavity wells in research, relevant prediction methods are not applicable to this field.
To align more closely with actual conditions and to guide production practice, this study, for the first time, used ISs salvaged from the X SCGS site as experimental materials and analyzed their particle size distribution. Additionally, this study analyzes X SCGS logging data, core lithology, interlayer conditions, and IS accumulation. The conclusion provides a basis for setting parameters such as IS particle size, mineral composition, and compaction pressure for subsequent experiments on measuring the VVISs.

2. Basic Overview of IS in X SCGS

This study is based on the characteristics of IS in X SCGS. The analysis of IS on-site provides a basis for the setting of subsequent experimental parameters, which will also make the experimental results more in line with production.

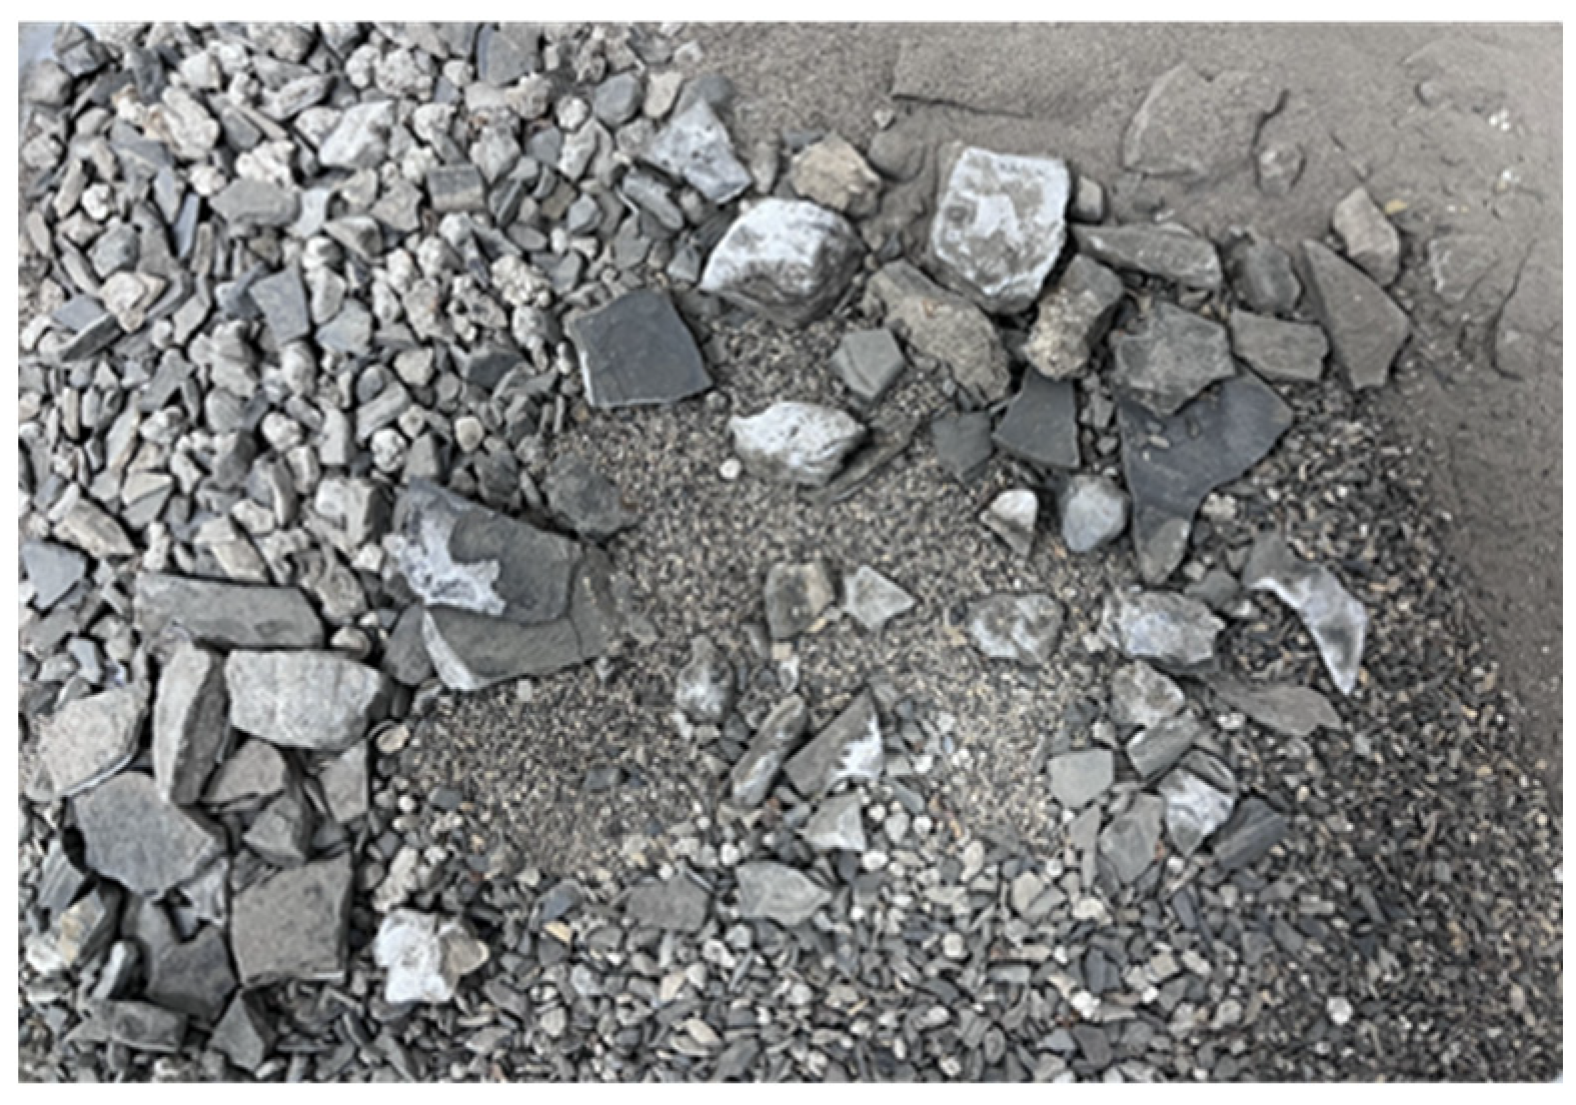
2.1. Characterization of IS in X SCGS

Based on a comprehensive analysis of the logging results of X SCGS, the top boundary of the salt rock is to be buried at a depth range of 1000~2000 m. The thickness of the salt-bearing strata ranges from approximately 300 to 750 m, with an average of 450 m. The cumulative thickness of the salt layer ranges from approximately 200 to 50 m, with the NaCl content generally ranging from approximately 80 to 90%. The interlayer consists mainly of mudstone, salt-bearing mudstone, and mudstone with anhydrite, with the thickness of the interlayer being generally less than 4 m. The content of anhydrite in the interlayer ranges from approximately 1 to 5%, with some cases reaching up to 12%. The clay substance content ranges from approximately 1 to 5%, with some cases reaching up to 10%. Illite is the dominant clay mineral, followed by small amounts of kaolinite and chlorite. Clastic rocks are not typically developed within the salt-bearing layer system, except for the presence of quartz and feldspar fragments found in mudstone.
By conducting interlayer statistics and core lithology analysis on cavity wells, the thickness of the interlayer in well H is observed to range from 2 to 13.2 m, with an average thickness of 4.1 m. The thinnest is 0.36 m, while the thickest is 13.2 m, as shown in Figure 1. The interlayer composition consists of 0.7~13.8% quartz, 4.2~17.7% calcite, 0.9~54.6% anhydrite, and a total clay content ranging approximately from 21 to 60.3%, as shown in Table 1. In well Z, the thickness of the interlayer ranges from 0.5 to 14 m, with an average thickness of 3.4 m. The thinnest is 0.11 m, while the thickest is 14 m. The interlayer composition in well Z consists of 2.3~20.5% quartz, 2.3~30.4% calcite, 13.2~82.4% anhydrite, and a total clay content ranging from approximately 4.9 to 38.3%. Further analysis of the lithology of other cores reveals that the interlayer consists mainly of mudstone and salt-bearing mudstone. The interlayer components are primarily composed of clay minerals, anhydrite, calcite, and quartz.

2.2. Experimental Analysis of Particle Size of IS

We conducted screening experiments using a standard sample sieve with mesh numbers of 120, 100, 80, 50, 35, 20, 10, and 5, respectively, in accordance with GB/T 6003.1-2012 [29]. ISs were obtained through Venturi salvage tools from the on-site cavity at X SCGS. ISs were utilized to analyze the distribution pattern of particle size, as illustrated in Figure 2.
Before the experiment, in order to prevent the oil, salt, and other substances in the IS from affecting the experimental results [30], the samples were washed with pure water 3~5 times. Considering that the samples contained a large number of clay, anhydrite, and other minerals, they were dried in a controlled humidity oven with a relative humidity of 40% and a temperature of 60 °C. Subsequently, using a balance with an accuracy of 0.01 g weighed four groups of 1000 g IS samples. The above samples were sieved from large to small using a standard sample sieve, and the samples with different particle sizes were weighed and their volume was measured, as illustrated in Figure 3.
For the four groups of IS samples, it was observed that particles larger than 0.125 mm were predominant, constituting over 50 percent of the total mass and volume of the particles analyzed, as illustrated in Figure 4. Moreover, the mass and volume proportion of 2.5, 5, 10, and 20 meshes in different samples exceeded 10%. And the experimental results were utilized to establish the parameters of the VVISs measured in the experiment, ensuring a closer alignment of the experimental findings with practical production.

2.3. IS Accumulation in Different Cavity Wells

At X SCGS, multiple cavity wells were surveyed using sonar-based cavity inversion techniques to assess the accumulation of IS at the bottom of the cavities [31]. It was discovered that IS reached heights of approximately one hundred meters and occupied around 60% of the cavity space, as shown in Table 2. This condition significantly reduces the efficiency of the cavity creation of SCGS.
Assuming that the IS density is 2600 kg/m3, the one hundred meters of IS exerts significant compaction pressure on the lowermost IS, considering only the influence of self-weight. And the lowermost IS experiences compaction pressure ranging from 0.5 to 2.5 MPa. Therefore, when measuring the VVISs, it is necessary to take into account the impact of compaction.
Based on the previous analysis of the lithology, particle size, and accumulation of IS in the X SCGS cavity, this paper selects quartz, albite, illite, chlorite, and anhydrite as experimental materials. The focus is on studying coarse-grained particles and considering the influence of different compaction pressures.

3. Experiments on VVISs Measurement

To simulate the IS, different particle sizes (mesh 5–10, 10–20, 20–40, 30–50, 40–80, 80–100) and mineral compositions (quartz, chlorite, albite, illite, and anhydrite) were selected to conduct experiments. Additionally, mechanical compaction was conducted under various compaction pressures (0.2 MPa, 0.4 MPa, 0.6 MPa, 0.8 MPa, 1.0 MPa, 1.2 MPa, 1.5 MPa, 1.8 MPa, and 2.0 MPa). Through laboratory experiments, the effects of particle size, mineral composition, and compaction on the VVISs were investigated.

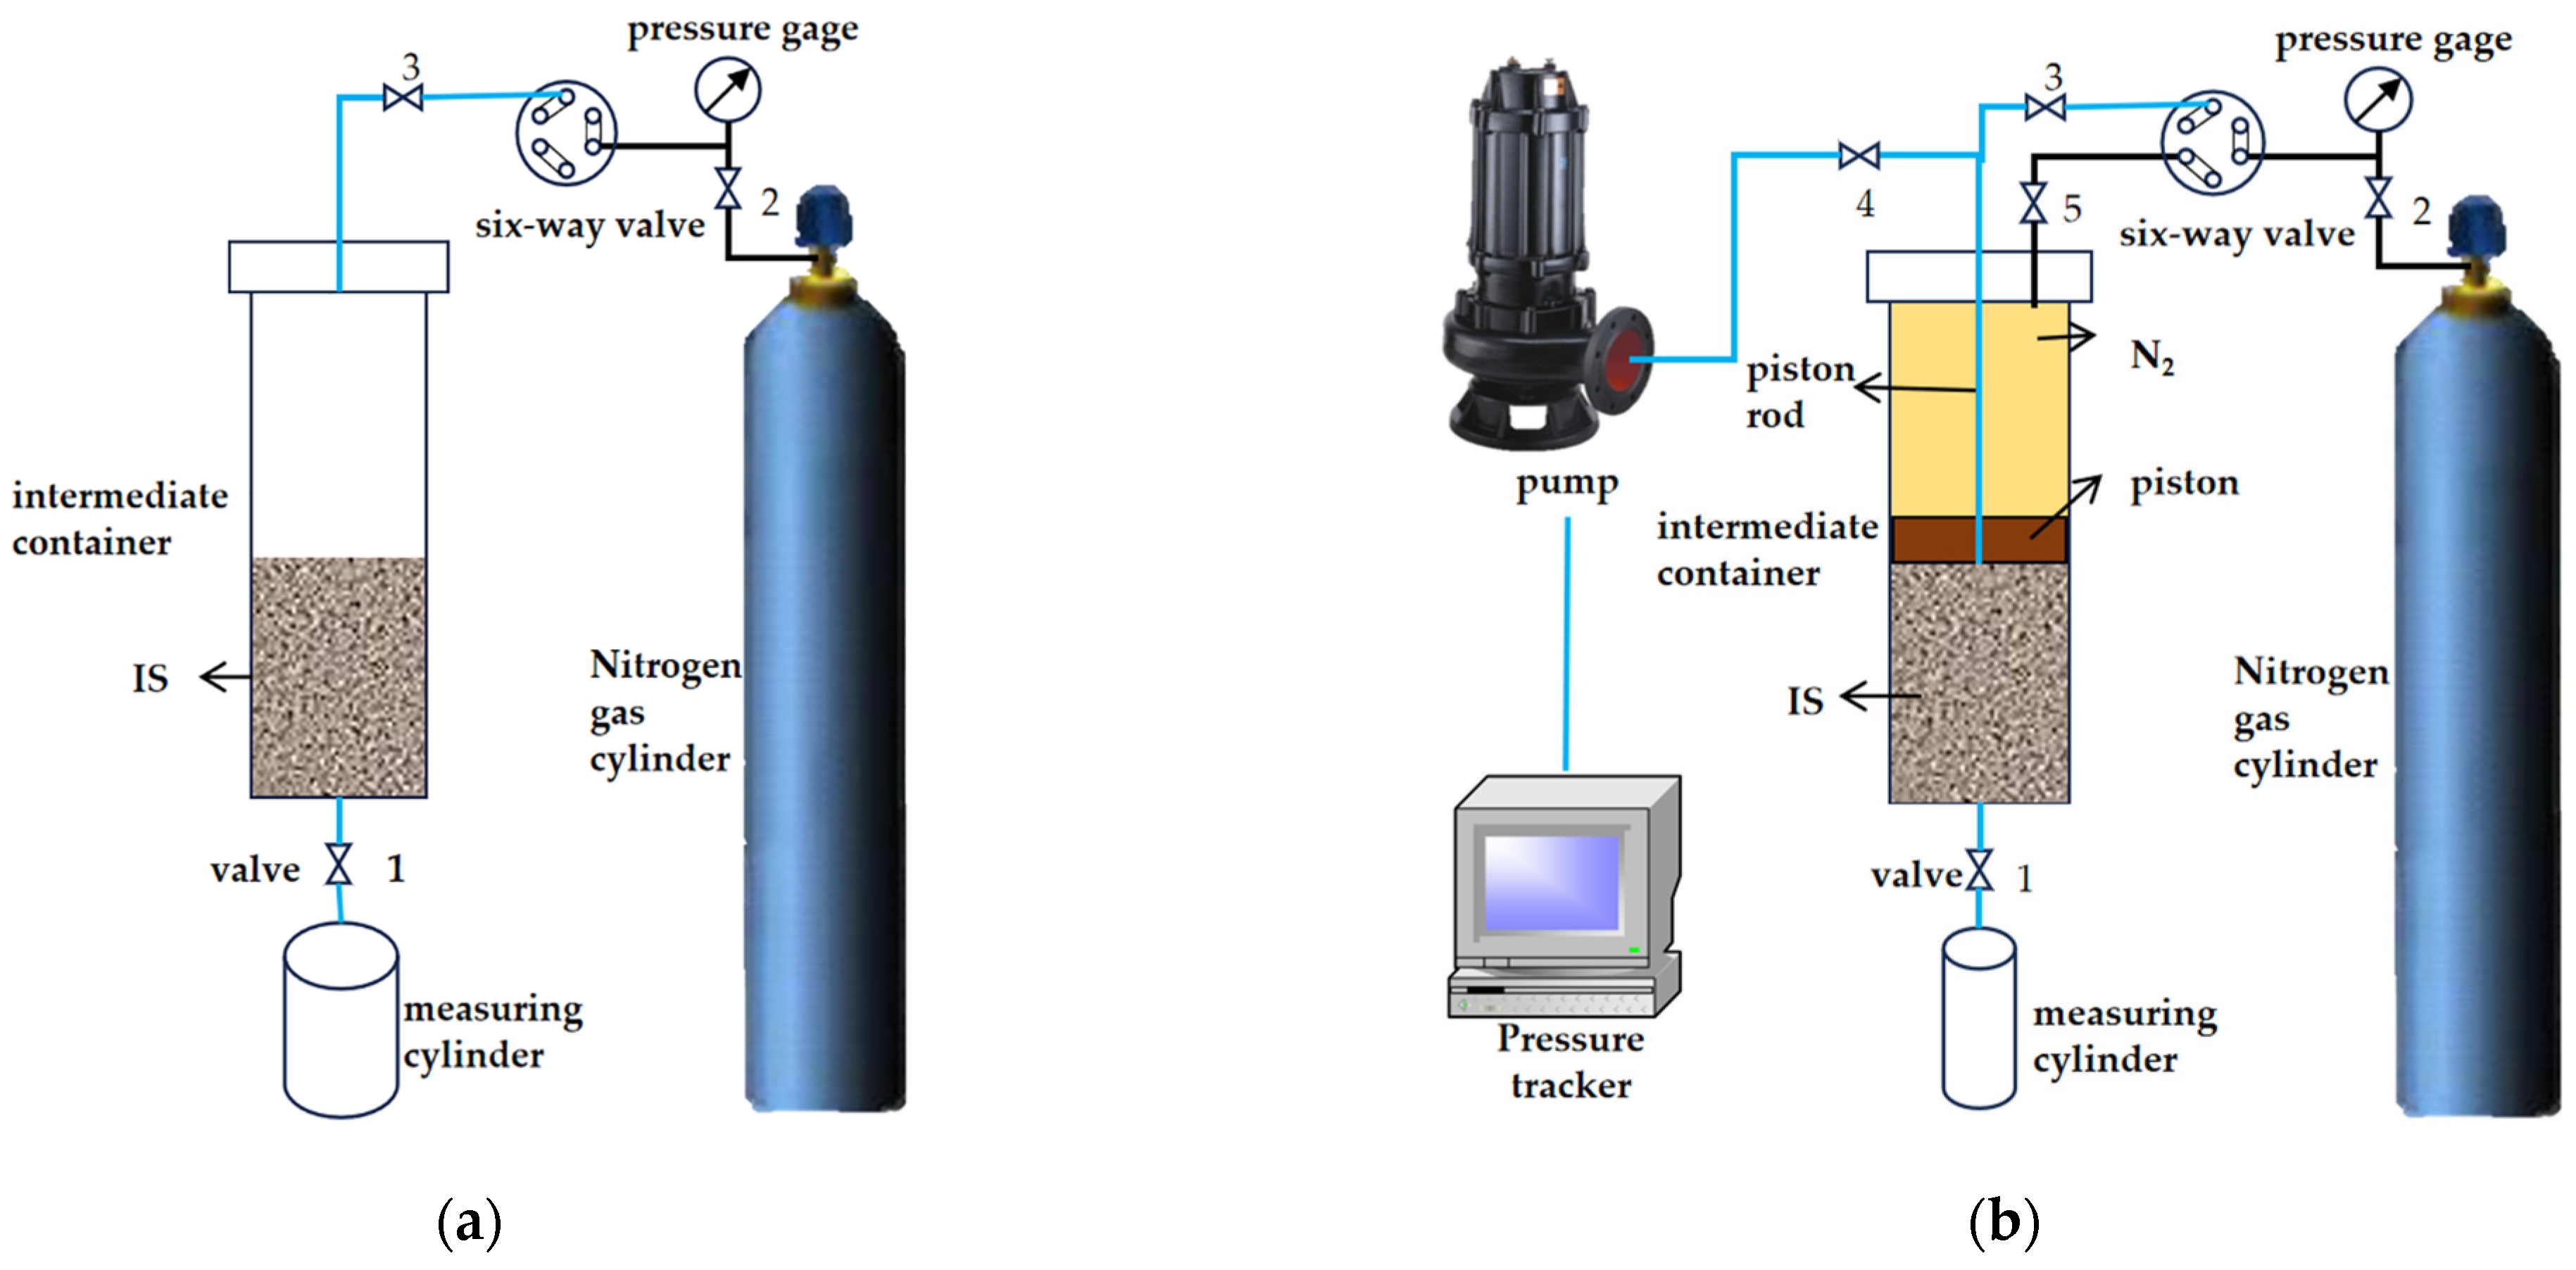
3.1. Experimental Setup and Methods

For this study, the IS gas drive experimental device developed by the China Petroleum Exploration and Development Research Institute [5] was utilized as the basis. The following setup is used to measure the porosity of IS: firstly, place the mechanically crushed core samples into the intermediate container; then, add water until it covers the surface; lastly, displace the water with gas at a certain pressure. It was further updated and transformed into a VVIS measurement experimental device. By studying the change in the patterns of the VVISs under individual factors and determining the magnitude of influence for different factors, this research provides valuable insights for the practical utilization of IS in the field.

3.1.1. Experiments on VVISs Measurement under the Influence of Particle Size and Mineral Composition

The experimental setup for investigating the effects of particle size and mineral composition on the VVISs is illustrated in Figure 5a. It mainly consists of an intermediate container, gas cylinder, measuring cylinder, six-way valve, pressure gauge, and other components. The intermediate container is filled with rock particles saturated with water. The gas cylinder is used to inject gas into the intermediate container, driving the water from the voids within the rock particles. The displaced water is collected and measured in a measuring cylinder. Valves and pressure gauges are employed to control and monitor the displacement pressure in real time. Once the experimental setup is installed and connections are made, the air tightness is checked, and if no issues are found, the experiment begins. Valve 2 is adjusted to control the inlet gas pressure, valve 3 is opened to inject gas into the intermediate container, and valve 1 is opened to allow the displaced water to flow into the measuring cylinder. At the end of the experiment, the volume is measured, which approximately represents the VVISs.
In this study, groups of different particle sizes of quartz, chlorite, albite, illite, and anhydrite were placed into the intermediate container, and the VVISs was measured. The volume of water that remained unchanged in the measuring cylinder for a duration of 10 min was recorded as the final result.

3.1.2. Experiments on Void Volume Measurement under the Influence of Particle Size and Mineral Composition

The experimental setup for studying the effect of compaction on the VVISs is shown in Figure 5b. The same experimental setup as earlier was used, it will not be repeated here. This setup primarily divides the intermediate container into two separate sealed spaces using a connecting rod piston. Valve 2 is opened to reach the set pressure, subsequently opening valve 5 to inject gas into the space above the piston, pushing the piston to compact the rock particles below. After the compaction is stabilized under the set pressure, valve 5 is closed, valve 3 is opened, and gas is injected into the interior of the rock particles through the piston rod, displacing the water in the voids for measurement. Upon completion of a set of experiments, valves 2 and 3 are closed, and valve 4 is opened to connect the pump, allowing water to be injected into the rock particles at a constant flow rate through the piston rod until the outflow rate matches, and this indicates that the rock particles have reached saturation again. The pressure transducer can detect changes in pressure and flow rate within the pump.
Different pressures should be sequentially to compact rock particles, the above operations are repeated, and the variation in the VVISs under different compaction pressures is obtained. At the same time, except for observing the volume of displacement water inside the measuring cylinder, it is also necessary to observe the movement of the piston rod.
The advantages of this experiment are as follows: Firstly, to ensure the accuracy of the experimental results, each set of identical experiments was repeated three times, with unreasonable outcomes eliminated and the average value taken. Secondly, to make the experimental results more convincing, under the consideration of three factors, the study also compared the VVISs changes in different accumulation volumes, as well as various mineral components of IS with different particle sizes. Moreover, the setting of the parameters is based on actual field conditions. For example, the experiment measured the VVIS changes under compaction pressure from 0.2 to 2 MPa, which equivalently represents the VVISs at different depths.
As for areas requiring improvement in this study, on the one hand, because of the limitations of the experimental setups, the experiments conducted involved accumulation volumes of no more than 2000 mL. So, it remains to be seen whether the patterns discovered would differ with an increase in accumulation volume. On the other hand, the experimental setups involve the aspect of gas displacement, necessitating the airtight testing of all valves and pipeline connections. Leakage during the experimental process would significantly impact the results [32].

3.2. Experimental Results

The experiment approximates the volume of discharged water Vout as the VVISs. Based on the analysis of the experimental results, the influence between particle size (mesh N), mineral composition (M), compaction pressure (P), and changes in the VVISs is obtained.
1.
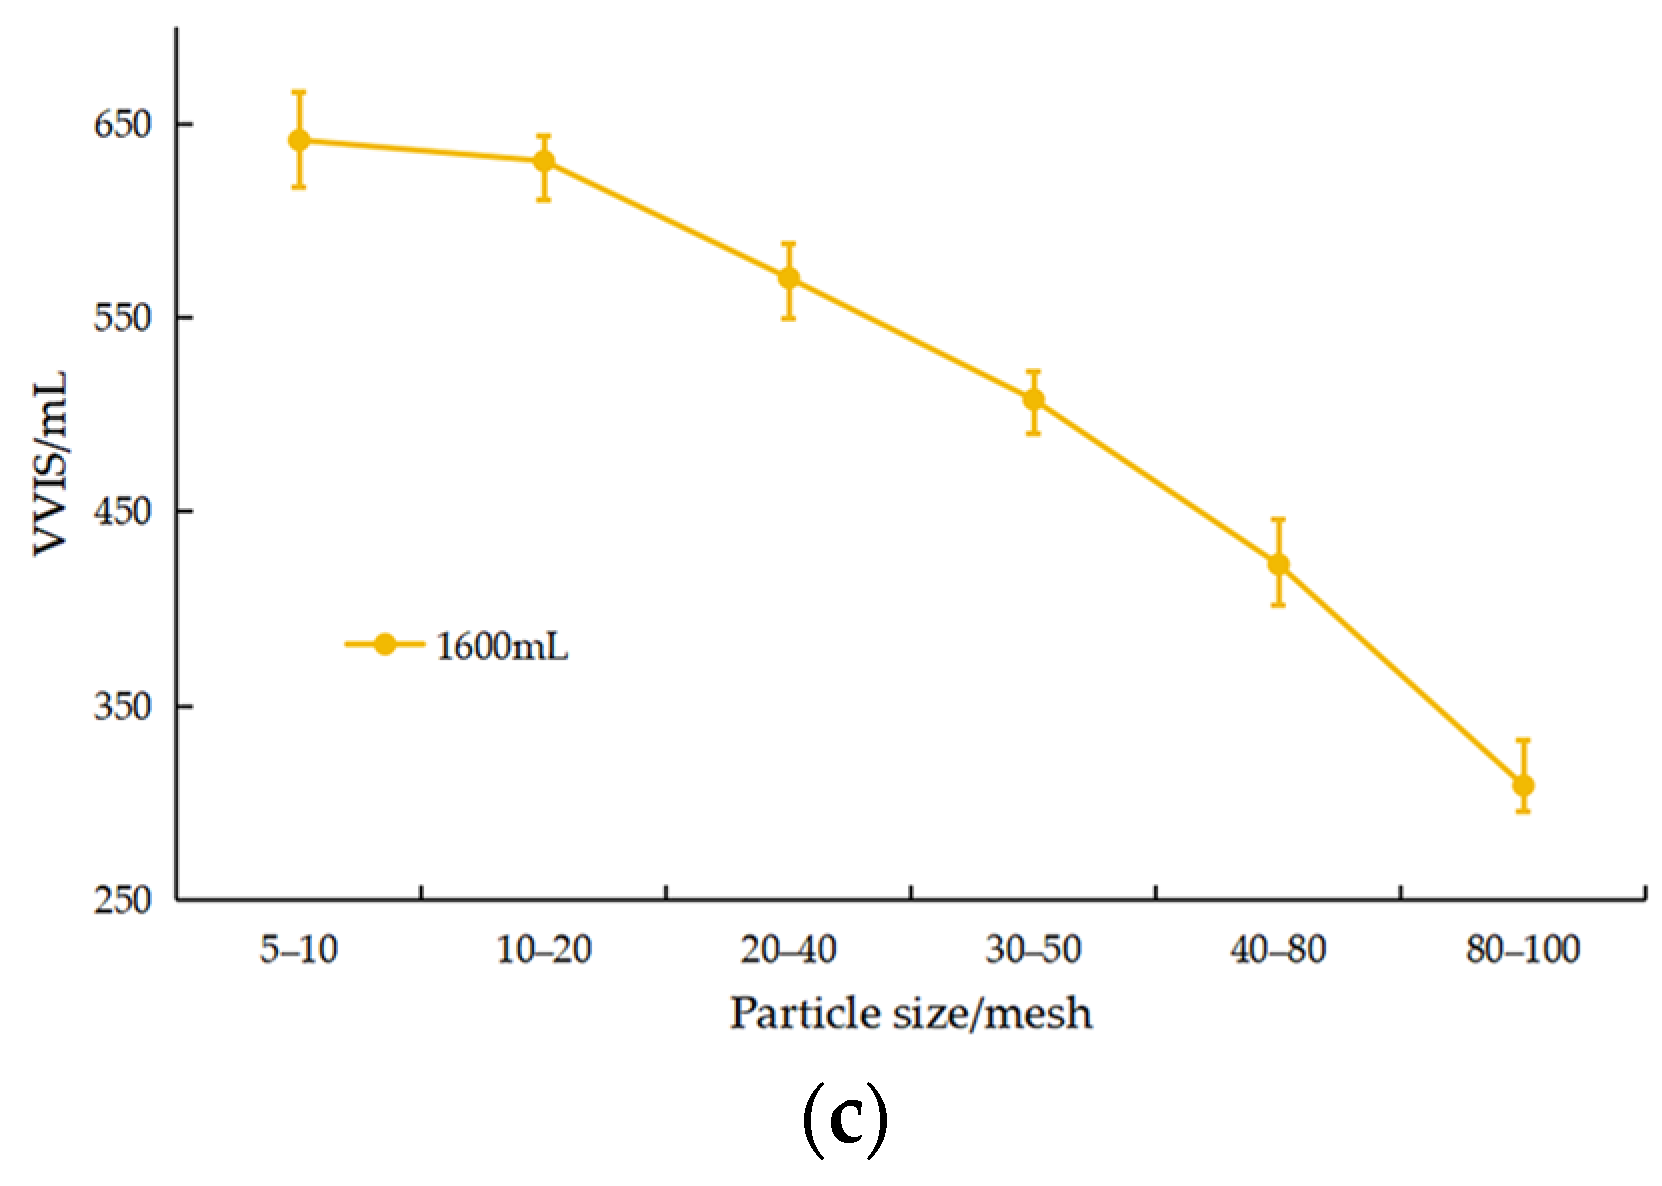
The influence of particle size on the VVISs is significant. With the change in particle size, the range of the VVISs will change from 5% to 30%, as illustrated in Figure 6. As particle size decreases, the mutual accumulation between rock particles becomes tighter, leading to a continuous decrease in the VVISs [33]. When comparing the reduction in the VVISs between 30 and 50 mesh and 40 and 80 mesh, as well as between 40 and 80 mesh and 80 and 100 mesh, it is evident that a more mixed particle size distribution results in a slower rate of the VVISs reduction. Moreover, with an increase in accumulation volume, the VVISs also tends to increase for rock particles of different sizes, although this effect is less pronounced for small particles. Overall, it is assumed that the experiment involved uniformly distributed rock particles of varying sizes. For every 10-mesh increase in particle size, the VVISs in 1 m3 is estimated to decrease by approximately 1000–2500 mL.
2.
Different mineral compositions can result in a difference of 6–23% in the VVISs, as illustrated in Figure 7. Under the same particle size, the internal void volume of minerals such as quartz, albite, and illite is relatively large; mineral components such as anhydrite are prone to water absorption and expansion [34,35]. They decompose into small particles or mix with water to form mud-like deposits at the bottom or adhere to the surface of rock particles, which is not conducive to the expulsion of void water; therefore, the VVISs is also low. Considering mineral compositions with different particle sizes, the trend of a variation in void volume is relatively consistent. Similarly, when the particle size decreases to a certain extent, the difference in the VVISs also becomes inapparent. Overall, when other factors are consistent, the more mineral components such as quartz, albite, and illite are present in IS, and the larger the VVISs will be.
The variation in the VVISs with different particle sizes was fitted to obtain the fitting relationship, as shown in Table 3.
Vvoid = f (N)
3.
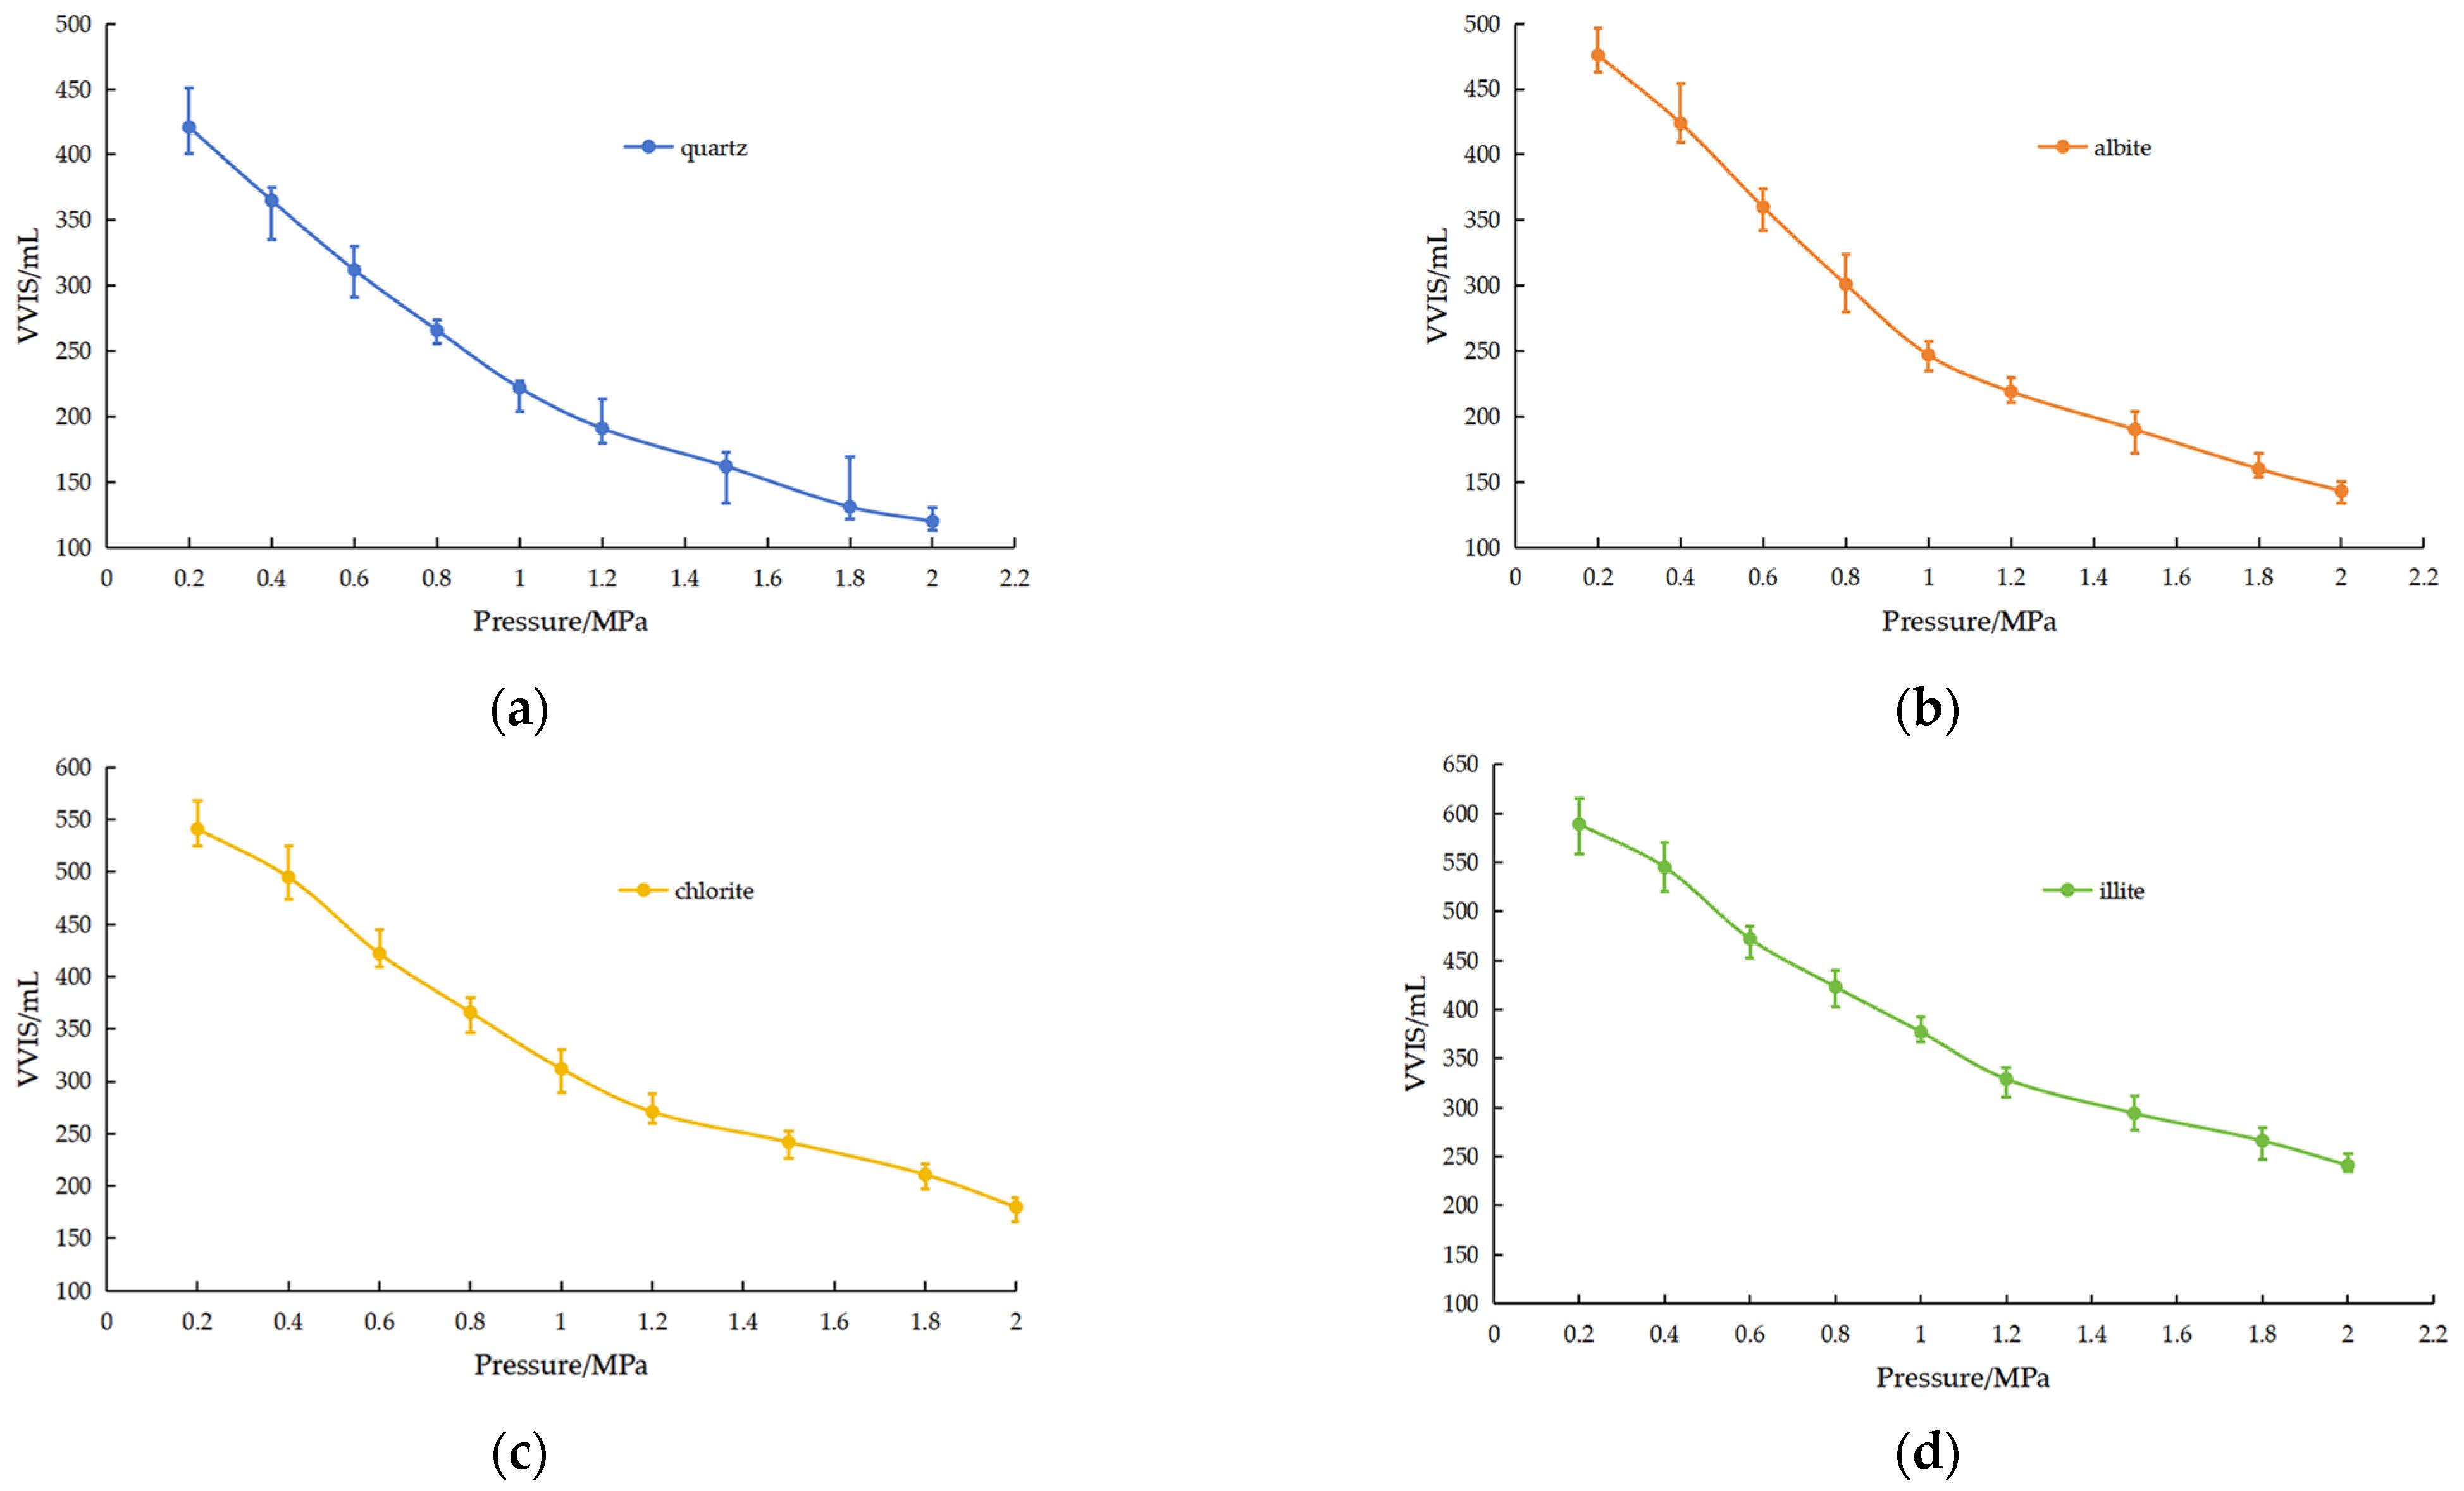
It is observed that the VVISs is inversely proportional to compaction pressure, with VVISs decreasing by 5% to 80% as the compaction pressure increases, as illustrated in Figure 8. Larger IS particles exhibit a more rapid decrease in the VVISs compared to smaller particles under increasing pressure due to the initial VVISs between the particles. However, as the compaction pressure continues to rise, the rate of the VVISs’ reduction gradually slows down [36,37]. The mutual support force between rock particles can explain why the VVISs does not decrease initially during mechanical compression. Additionally, mineral components like chlorite and illite are more susceptible to compression [38,39,40], leading to a more pronounced reduction in the VVISs as the compaction pressure increases. Ultimately, when the compaction pressure reaches 2 MPa, the void volume is approximately 100 mL. Considering the principle of similarity analysis, in practical scenarios, IS of the deepest can provide a little space for gas storage.
For different mineral compositions, the fitting relationship between compaction pressure and the VVISs can be obtained, as shown in Table 4.
Vvoid = f (M, P)
4.
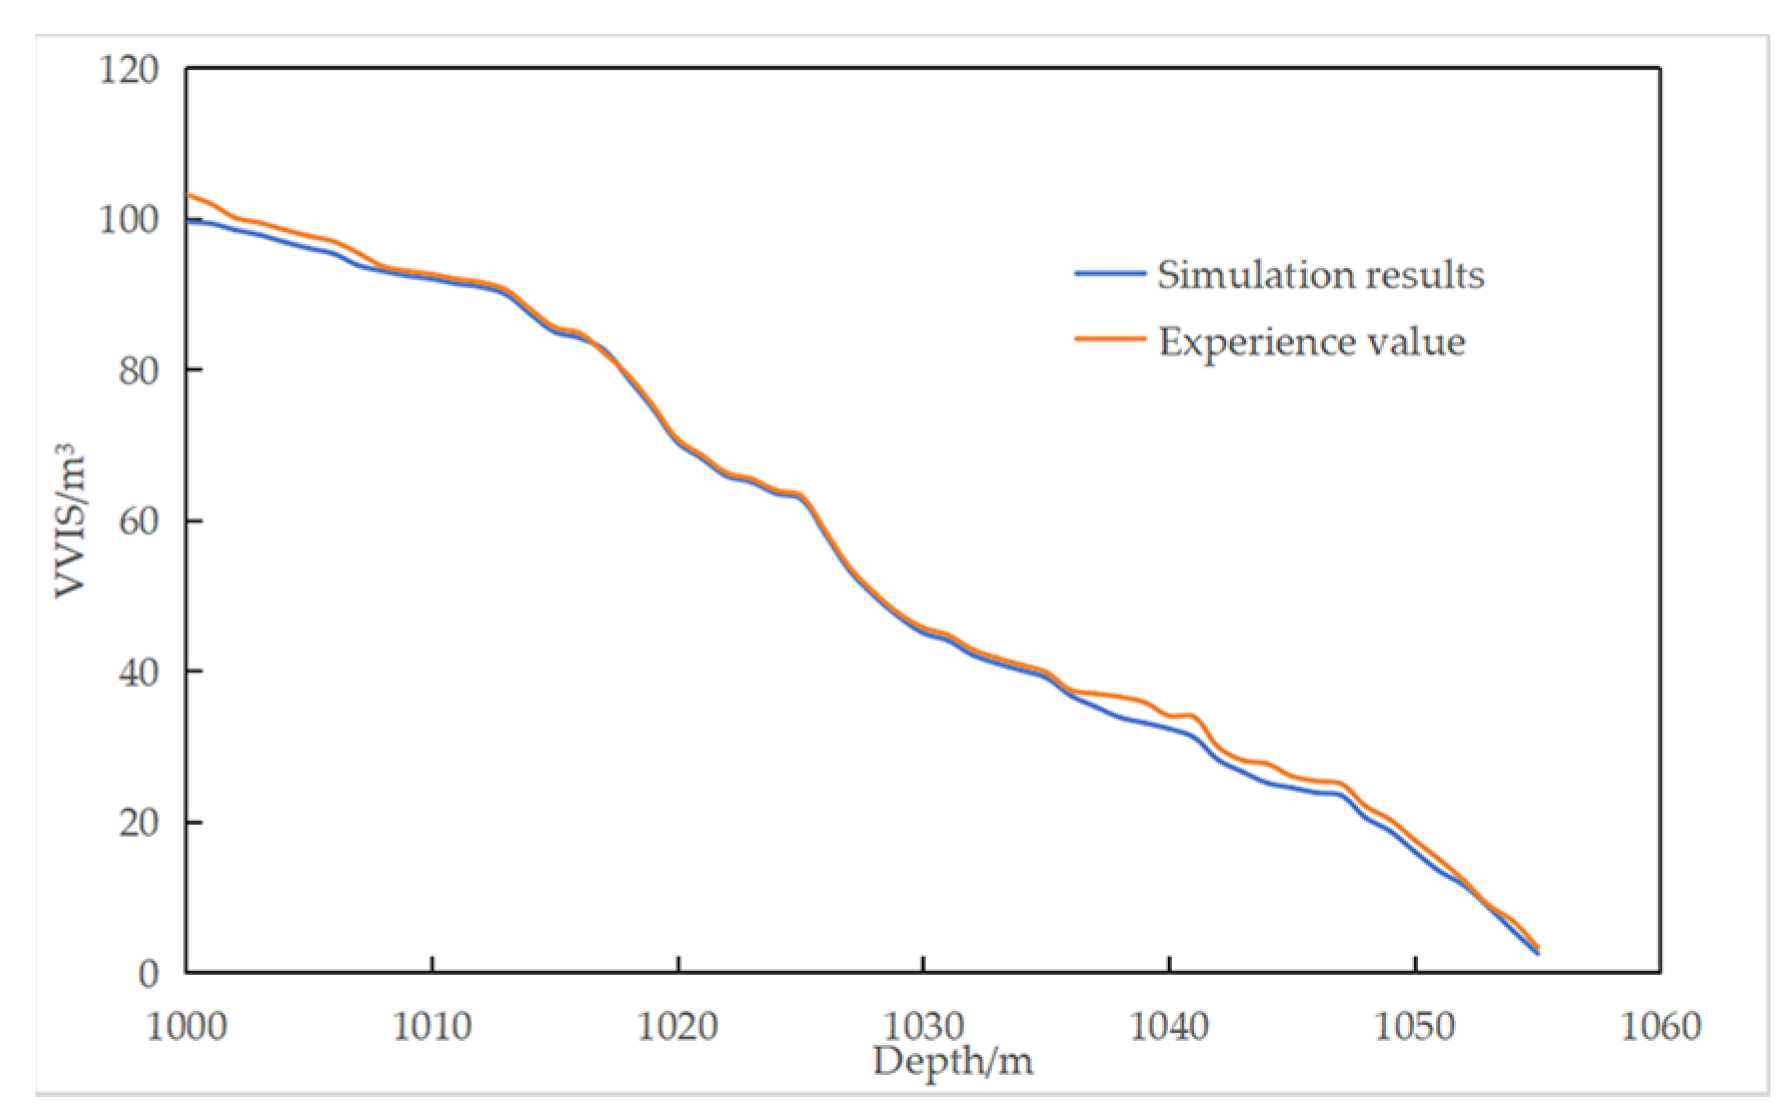
Here, a method for predicting the VVISs is proposed. The basic model of this method is a cylinder with a height of 60 m and a radius of 40 m in the middle, and a broach with a height of 20 m above and below, as shown in Figure 9a. The prediction involves the following steps, as shown in Figure 9b: Firstly, based on the logging results and the analysis of the core physical properties of each cavity well, the IS content and mineral components of unit formation (in units of 2 m) are determined. Secondly, based on the above results, the compaction pressure on IS at different depths is calculated. Finally, by combining the fitting formula obtained in this study and assigning weights to various factors, the VVISs is predicted. Furthermore, a large amount of relevant data from multiple cavity wells are used for data training to derive patterns that are more closely aligned with field conditions. The results of the empirical value algorithm are derived by field personnel. They combine the geological conditions of cavity creation and the inversion results of sonar cavity measurement to obtain a fragmentation coefficient of IS. Through conversion relationships, the VVISs is then calculated. These values are compared with the predictive results of this study. There is a high degree of fit between the two results, as shown in Figure 10.

4. Conclusions and Discussion

Based on the analysis of IS in the X SCGS, this paper provides a basis for setting experimental parameters to make the results more in line with actual production. It also designs experimental setups and methods to measure the VVISs. Although there are shortcomings, the conclusions also provide references for practical predictions.
The analysis of core lithology in the X SCGS suggests that the main mineral components of IS are illite, anhydrite, quartz, and albite, with proportions exceeding 20%. The particle size analysis of IS collected from the on-site cavity bottom revealed that particle sizes larger than 0.125 mm constitute the majority. And in all four sample groups, these particles’ mass and volume proportions exceed 50%. Considering the self-weight effect of IS in different cavity wells, the compaction pressure from the upper part to the lower part can reach 0.5–2.5 MPa.
Laboratory experiments on measuring the VVISs showed that particle size, mineral composition, and compaction pressure all have significant effects on the VVISs. Different particle sizes can cause a variation of approximately 5–30% in the VVISs, while different mineral compositions can result in a difference of 6–23% in the VVISs. With increasing compaction pressure, the VVISs can decrease by 5–80%.
Relatively little is understood about ISs’ ability to store gas, and there is a lack of large-scale application examples. There is still a deviation between the theoretically proposed method and actual production. To consider factors such as temperature, pressure, salt rock creep, and crystallization of brine under geological conditions, further research is needed to accurately predict the VVISs and provide more scientific support for IS to store gas.

Author Contributions

Conceptualization, X.S. and K.L.; methodology, Z.W.; validation, H.L., S.B. and J.W.; formal analysis, L.R.; investigation, Y.G.; data curation, X.S.; writing—original draft preparation, X.S.; writing—review and editing, C.X.; supervision, G.D. All authors have read and agreed to the published version of the manuscript.

Funding

The authors declare that this study received funding from Fundamental and Prosp-ective Research Project (Number: 2022DJ8303) and the Technology Special Projects (Number: 2023YQX10603) from PetroChina Co., Ltd. The funder was not involved in the study design, collection, analysis, interpretation of the data, the writing of this article, or the decision to submit it for publication.

Data Availability Statement

The data that support the findings of this study are available from the corresponding author upon reasonable request.

Acknowledgments

The authors acknowledge the technical support provided by Research Institute of Petroleum Exploration & Development, and the experimental help of tester in CNPC Key Laboratory of Oil & Gas Underground Storage Engineering.

Conflicts of Interest

Authors Xiangrui Sun, Guosheng Ding, Kang Li, Zhide Wu, Yanxia Gou, Li’na Ran, Haitao Li, Song Bai and Jia’nan Wu were employed by China National Petroleum Corporation. The remaining author declares that the research was conducted in the absence of any commercial or financial relationships that could be construed as potential conflicts of interest.

References

  1. Yang, C.; Liang, W.; Wei, D.; Yang, H. Investigation on possibility of energy storage in salt rock in China. Chin. J. Rock Mech. Eng. 2005, 24, 4409–4417. [Google Scholar]
  2. Yang, C.; Wang, T.; Li, Y.; Yang, H.; Li, J.; Qu, D. Feasibility analysis of using abandoned salt caverns for large-scale underground energy storage in China. Appl. Energy 2014, 137, 467–481. [Google Scholar] [CrossRef]
  3. Wu, B.; Zhang, M.; Deng, W.; Que, J.; Liu, W.; Zhou, F.; Wang, Q.; Li, Y.; Liang, T. Study and Mechanism Analysis on Dynamic Shrinkage of Bottom Sediments in Salt Cavern Gas Storage. Processes 2022, 10, 1511. [Google Scholar] [CrossRef]
  4. Li, J.; Shi, X.; Yang, C.; Li, Y.; Wang, T.; Ma, H.; Shi, J.; Li, J. Repair of irregularly shaped salt cavern gas storage by re-leaching under gas blanket. J. Nat. Gas Sci. Eng. 2017, 45, 848–859. [Google Scholar] [CrossRef]
  5. Yuan, G.; Shen, R.; Tian, Z.; Yuan, J.; Wang, Q.; Yang, M. Review of Underground Gas Storage in the Bedded Salt Deposit in China. In Proceedings of the SPE Gas Technology Symposium, Calgary, Alberta, AB, Canada, 15–17 May 2006. [Google Scholar]
  6. Wang, T.; Yang, C.; Li, J. Failure analysis of overhanging blocks in the walls of a gas storage salt cavern: A case study. Rock Mech. Rock Eng. 2017, 50, 125–137. [Google Scholar] [CrossRef]
  7. Shi, X.; Ma, H.; Zhang, Y. Advances of large-scale gas storage technology in existing salt caverns in high-insoluble salt formations. J. Shandong Univ. Sci. Technol. (Nat. Sci.) 2020, 39, 55–65. [Google Scholar] [CrossRef]
  8. Shi, X.; Yang, C.; Li, Y.; Li, J.; Ma, H.; Wang, T.; Guo, Y.; Chen, T.; Chen, J.; Liu, W.; et al. Development Prospect of Salt Cavern Gas Storage and New Research Progress of Salt Cavern Leaching in China. In Proceedings of the U.S. Rock Mechanics/Geomechanics Symposium (ARMA), San Francisco, CA, USA, 25 June 2017. [Google Scholar]
  9. Zheng, Y.; Zhao, Y.; Ding, G.; Wu, Z.; Lu, S.; Lai, X.; Qiu, X.; Yang, D.; Han, B.; Wang, L. Solution mining technology of enlarging space for thick-sandwich salt cavern storage. Pet. Explor. Dev. 2017, 44, 137–143. [Google Scholar] [CrossRef]
  10. Liang, X.; Ma, H.; Cai, R.; Zhao, K.; Zeng, Z.; Li, H.; Yang, C. Feasibility analysis of natural gas storage in the voids of sediment within salt cavern—A case study in China. Energy 2023, 285, 129340. [Google Scholar] [CrossRef]
  11. Wei, X.; Shi, X.; Li, Y.; Liu, H.; Li, P.; Ban, S.; Liang, X.; Zhu, S.; Zhao, K.; Yang, K.; et al. Advances in research on gas storage in sediment void of salt cavern in China. Energy 2023, 284, 129243. [Google Scholar] [CrossRef]
  12. Li, P.; Li, Y.; Shi, X.; Zhao, K.; Liang, X.; Ma, H.; Yang, C.; Liu, K. Compaction and restraining effects of insoluble sediments in underground energy storage salt caverns. Energy 2022, 249, 123752. [Google Scholar] [CrossRef]
  13. Liu, W.; Jiang, D.; Chen, J. Comprehensive feasibility study of two-well-horizontal caverns for natural gas storage in thinly-bedded salt rocks in China. Energy 2018, 143, 1006–1019. [Google Scholar] [CrossRef]
  14. Zheng, Y.; Qiu, X.; Ding, G. Experimental research on using sediment void space in salt cavern gas storage. J. Salt Sci. Chem. Ind. 2019, 48, 14–19+23. [Google Scholar] [CrossRef]
  15. Li, Y.; Shi, X.; Liu, W.; Wang, B.; Ma, X.; Yang, C. Motion of insoluble subsidence during leaching sump for salt cavern storage. Chin. J. Rock Mech. Eng. 2016, 35, 23–31. [Google Scholar] [CrossRef]
  16. Li, J.; Shi, X.; Wang, T.; Yang, C.; Li, Y.; Ma, H.; Ma, X.; Shi, H. A prediction model of the accumulation shape of insoluble sediments during the leaching of salt cavern for gas storage. J. Nat. Gas Sci. Eng. 2016, 33, 792–802. [Google Scholar] [CrossRef]
  17. Li, J.; Shi, X.; Yang, C.; Li, Y.; Wang, T.; Ma, H. Mathematical model of salt cavern leaching for gas storage in high-insoluble salt formations. Sci. Rep. 2018, 8, 372. [Google Scholar] [CrossRef] [PubMed]
  18. Yvan, C.; Nicolas, L. Insoluble deposit in salt cavern–test case. In Proceedings of the Solution Mining Research Institute Fall Meeting, Bad Ischl, Austria, 6–9 October 2002. [Google Scholar]
  19. Zhang, Y.; Lu, J.; Li, J.; Liu, Y.; Yao, E. The Flow Law of Brine and Sediment Particles in Gas-Driven Brine Drainage in the Sediments of Salt Cavern Gas Storage. Sustainability 2023, 15, 12613. [Google Scholar] [CrossRef]
  20. Ren, Z.; Yang, H.; Li, J. Testing and calculation of the pore volume of bottom deposits in the saltrock reservoir. J. Southwest Pet. Univ. (Sci. Technol.) 2018, 40, 142–150. [Google Scholar] [CrossRef]
  21. Ren, Z.; Li, J.; Wang, H. Granularity distribution characteristics of deposits at the bottom of salt rock gas storage based on fractal theory. Oil Gas Storage Transp. 2017, 3, 279–283. [Google Scholar] [CrossRef]
  22. Chen, X.; Zhang, L.; Li, Y.; Ma, H.; Ji, G. Experimental investigation on bulking expansion coefficient of sediment of storage in bedded salt. Min. Res. Dev. 2013, 33, 34–37+42. [Google Scholar] [CrossRef]
  23. Liang, X.; Ma, H.; Li, P. A prediction method of the effective volume in sediment-filled salt cavern. J. Energy Storage 2022, 56, 10602. [Google Scholar] [CrossRef]
  24. Li, P.; Li, Y.; Shi, X.; Ma, H.; Liang, X.; Wei, X.; Yang, C. Pore characteristics and volume capacity evaluation of insoluble sediments for gas storage in multi-interbedded salt formations. Rock Soil Mech. 2022, 43, 76–82. [Google Scholar] [CrossRef]
  25. Li, P.; Li, Y.; Shi, X.; Zhao, K.; Liu, X.; Ma, H.; Yang, C. Prediction method for calculating the porosity of insoluble sediments for salt cavern gas storage applications. Energy 2021, 221, 119815. [Google Scholar] [CrossRef]
  26. He, Q.; Feng, Y.; Yuan, G.; Ban, F.; Guan, Y.; Xu, N. Experimental study of dual-well gas injection and brine discharge in salt cavern sediment space. Gas Sci. Eng. 2023, 117, 205084. [Google Scholar] [CrossRef]
  27. Li, P.; Li, Y.; Shi, X.; Ma, H.; Zhao, K.; Liang, X.; Wei, X.; Yang, C. Pore Structure and Brine Flow Simulation of Salt Cavern Sediments Based on X-ray Computed Tomography. Rock Mech. Rock Eng. 2023, 57, 115–130. [Google Scholar] [CrossRef]
  28. Liu, J.; Qiao, X.; Li, J. A technology for the reconstruction of existing convection connected salt caverns into underground gas storage. Oil Gas Storage Transp. 2019, 38, 349–355. [Google Scholar] [CrossRef]
  29. GB/T 6003.1-2022; Test Sieves—Technical Requirements and Testing—Part 1: Test Sieves of Metal Wire Cloth. Xinxiang Bashan Aviation Materials Co., Ltd.: Xinxiang, China, 2022.
  30. Park, J.; Son, Y.; Noh, S. An Evaluation of the Environmental Safety and Geochemical Characteristics of Coal Combustion Products. KSCE J. Civ. Eng. 2018, 22, 1700–1708. [Google Scholar] [CrossRef]
  31. Wang, L.; Liu, J.; Wang, X.; Teng, Y.; Luo, L.; Jin, Y. Study on Sound Attenuation Characteristic of Salt Cavity Based on In-Situ Acoustic Testing. Energies 2019, 12, 3154. [Google Scholar] [CrossRef]
  32. Wei, X.; Shi, X.; Wei, H.; Ban, S.; Li, Y.; Ma, H.; Li, P.; Yang, C. Dynamic tightness evaluation of salt cavern energy storage. J. Energy Storage 2023, 57, 106313. [Google Scholar] [CrossRef]
  33. Liu, S.; Yao, E.; Luo, Y.; Li, Y.; Zhou, F.; Ran, L.; Chang, Y. Study on Factors Influencing the Shrinkage of Swelled Deposits at the Bottom of Salt Cavern Gas Storage. In Proceedings of the 55th U.S. Rock Mechanics/Geomechanics Symposium, Virtual, 18–25 June 2021. [Google Scholar]
  34. Yuan, G.; Ban, F.; Zhao, Z. Study on collapsing mechanism of interlayer in salt caverns gas storage. Chin. J. Undergr. SpaceEng. 2016, 12, 675–679. [Google Scholar]
  35. Yao, E.; Xu, H.; Zhang, K.; Liu, S.; Sheng, L.; Li, B.; Bai, H.; Zhou, F. Experimental and mechanistic study of mudstone volumetric swelling at the bottom of salt cavern gas storage. Arab. J. Chem. 2022, 15, 104082. [Google Scholar] [CrossRef]
  36. Kuila, U.; Prasad, M. Pore Size Distribution and Ultrasonic Velocities of Compacted Na-montmorillonite Clays. In Proceedings of the 2010 SEG Annual Meeting, Denver, CO, USA, 17–22 October 2010. [Google Scholar]
  37. Zhang, J.; Li, M.; Liu, Z.; Zhou, N. Fractal characteristics of crushed particles of coal gangue under compaction. Powder Technol. 2017, 305, 12–18. [Google Scholar] [CrossRef]
  38. Mondol, N.H.; Bjørlykke, K.; Jahren, J.; Høeg, K. Experimental mechanical compaction of clay mineral aggregates-Changes in physical properties of mudstones during burial. Mar. Pet. Geol. 2007, 24, 289–311. [Google Scholar] [CrossRef]
  39. Prempeh, K.; Chequer, L.; Badalyan, A.; Bedrikovetsky, P. Effects of Kaolinite on Fines Migration and Formation Damage. In Proceedings of the SPE International Conference and Exhibition on Formation Damage Control, Lafayette, LA, USA, 19–21 February 2020. [Google Scholar]
  40. Wanniarachchi, W.A.M.; Ranjith, P.G.; Perera, M.S.A.; Nguyen, J.T.; Rathnaweera, T.D. An Experimental Study to Investigate the Effect of Mineral Composition on Mechanical Properties of Shale Gas Formations. In Proceedings of the 51st U.S. Rock Mechanics/Geomechanics Symposium, San Francisco, CA, USA, 25–28 June 2017. [Google Scholar]
Figure 1. Thickness of mudstone and salt rock in the 19 cavity wells.
Processes 12 00636 g001
Figure 2. IS samples salvaged on-site.
Processes 12 00636 g002
Figure 3. IS particle size screening experiment: (a) 120 mesh; (b) 100 mesh; (c) 80 mesh; (d) 50 mesh; (e) 35 mesh; (f) 20 mesh; (g) 10 mesh; (h) 5 mesh.
Processes 12 00636 g003
Figure 4. Mass and volume proportion of different IS sample. (a) Sample 1; (b) sample 2; (c) sample 3; (d) sample 4.
Processes 12 00636 g004
Figure 5. Experimental device for measuring VVISs. (a) The experimental setup for investigating the effects of particle size and mineral composition on VVISs; (b) the experimental setup for studying the effect of compaction on VVISs.
Processes 12 00636 g005
Figure 6. VVISs in rock particle accumulation with different particle sizes: (a) 1200 mL cumulative volume, (b) 1400 mL cumulative volume, and (c) 1600 mL cumulative volume.
Processes 12 00636 g006aProcesses 12 00636 g006b
Figure 7. VVISs in the accumulation of rock particles with different mineral compositions: (a) 10–20 mesh, (b) 30–50 mesh, (c) 40–80 mesh, and (d) 80–100 mesh.
Processes 12 00636 g007
Figure 8. VVISs under different compaction pressures. (a) Quartz, (b) albite, (c) chlorite, and (d) illite.
Processes 12 00636 g008
Figure 9. Numerical simulation. (a) Mathematical model; (b) flowchart.
Processes 12 00636 g009
Figure 10. Comparison between numerical simulation and empirical value of VVISs.
Processes 12 00636 g010
Table 1. Analysis of rock core lithology.
Well No.LithologyTop Depth
(m)
Whole Rock Analysis (%)
QuartzK-FeldsparAlbiteApatiteCalitePyriteAnhydriteHaliteClays
HDark gray mudstone1110.2413.811.9 17.71.30.9360.3
1119.759.4 2.335.40.954.63.521
ZGray argillaceous gypsum rock11660.7 3.44.2 83.18.6
1173.56.1 1.11.22.30.482.41.54.9
Grey saline mudstone1179.120.56.812.31.412.73.3 10.832.2
Table 2. Accumulation of IS in the cavity wells.
Well NameCavity Formation Rate (%)IS Height (m)IS Proportion (%)
N16835.532
Z26046.840
Y35256.748
X45059.150
PY54267.358
P63979.861
H73698.164
Table 3. The fitting relationship between particle size and VVISs.
Cumulative VolumeFitting FormulaR2
1200 mLVvoid = −10.889N2 + 35.916N + 449.580.9811
1400 mLVvoid = −10.646N2 + 5.8007N + 602.240.9913
1600 mLVvoid = −10.979N2 + 9.6871N + 646.520.9983
Table 4. The fitting relationship between compaction pressure and VVISs.
Mineral CompositionFitting FormulaR2
QuartzVvoid = 79.206P2 − 369.42P + 667.280.9969
AlbiteVvoid = 85.749P2 − 388.84P + 623.120.995
ChloriteVvoid = 108.52P2 − 423.55P + 563.210.9954
IlliteVvoid = 77.375P2 − 336.36P + 485.50.9991
Disclaimer/Publisher’s Note: The statements, opinions and data contained in all publications are solely those of the individual author(s) and contributor(s) and not of MDPI and/or the editor(s). MDPI and/or the editor(s) disclaim responsibility for any injury to people or property resulting from any ideas, methods, instructions or products referred to in the content.

