Abstract
In order to achieve high-performance coatings on the surface of electric submersible pump impellers, it is crucial to optimize the laser cladding process parameters. Using Ansys 2021 R1 commercial software, a numerical simulation of laser cladding Ni60 powder on high nickel cast iron was conducted. The simulation utilized a 3D Gaussian heat source, parametric language, and life–death unit technology to replicate the characteristics of synchronous powder delivery laser cladding. The study focused on analyzing the temperature field cloud map and molten pool size under different laser power and scanning speeds, narrowing down the process parameter window, selecting optimized laser power and scanning speed, and assessing the changes in surface morphology, melting height and width, dilution rate, microhardness, and microstructure of the laser cladding coating. Results indicate that the coating width and thickness increase with higher laser power and lower scanning speeds. The microstructure consists primarily of dendritic, block, short rod, and long strip formations, and exhibits a tightly distributed and uniform grain structure. Furthermore, the microhardness of the coating shows a negative correlation with laser power and scanning speed. The optimal process parameters were determined to be a laser power of 1100 W and a scanning speed of 6 mm/s. A comparison with the simulation confirmed the effectiveness of the simulation in effectively guiding actual production.
1. Introduction
With the continuous increase in China’s oil demand and the development of offshore oil and gas resources, the country has emerged as the second largest crude oil consumer in the world. However, the increasing complexity of exploration and rising development costs have rendered traditional oil well mining technology inadequate to meet the demands of this growth. Consequently, the submersible electric pump, with its advantages of large displacement, high head, and easy installation, has become an attractive alternative. The high nickel austenitic cast iron used in electric submersible pump blade guide wheels is a crucial component in maintaining production increase [1,2]. This material offers notable wear resistance, corrosion resistance, and machinability, making it a popular choice for such applications. However, the operational environment poses a significant challenge. The high-velocity well fluid, which contains various corrosive media such as micro particles and chlorides, flows from the guide wheel into the contact surface of the impeller and guide wheel, exacerbating wear and corrosion [3,4]. As a result, the impeller’s hub and lower skirt often suffer serious failures, greatly limiting the service life of the submersible electric pump. The primary cause of impeller wear failure is the low hardness and inadequate wear resistance of the metal materials used, rendering them unable to meet the impeller’s performance requirements [5]. Consequently, urgent technical advancements are needed to enhance the impeller’s overall quality and prolong the service life of the submersible electric pump.
Various studies by domestic and foreign researchers have extensively investigated methods to enhance the overall performance of cast iron materials and impels. For instance, Xiaoyu Shi et al. [6] sought to augment the wear resistance of gray cast iron guide rail by applying a Fe-Ni-Cr composite coating to the surface of a gray cast iron brake disc. Their study involved an analysis of the coating’s phase composition, microstructure, hardness, and wear resistance. In a similar vein, Arias-González F et al. [7] researched the fiber laser cladding of nickel-based alloys on cast iron and analyzed two different types of cast iron, gray cast iron and ductile iron, and determined the appropriate process parameters for producing nickel-based coatings. Furthermore, Xudong Zhao et al. [8] scrutinized the failure modes of submerged oil-electric pumps and identified that parts wear was largely attributed to the impeller and guide wheel. To address this issue, they employed laser processing technology to create a micro-concave bionic structure on the impeller’s surface, which was then coated with a Ni-SiC nano coating to enhance surface hardness and wear resistance.
To address the aforementioned issues, the implementation of laser surface modification technology was proposed to rectify the worn parts of the impeller. Laser technology has gained widespread applicability in material surface treatment owing to its high energy density, excellent coherence, and robust directivity [9,10]. Laser cladding, a process involving the rapid melting of powder material using a laser beam, results in the quick solidification of the melt pool on the substrate’s surface, forming a coating. This technique is characterized by a large coating temperature gradient, short cooling and heating time, small dilution rate, and minimal heat-affected zone. Furthermore, it has the capability to create a coating with fine grains and high hardness on the substrate’s surface, while establishing a robust metallurgical bond with the substrate [11,12,13,14].
The quality of the cladding layer in the laser cladding process is influenced by several factors such as the choice of cladding powder, cladding process parameters, and the selection of processing equipment. The temperature plays a critical role in determining the quality of the cladding layer. The precise control of the cladding process is essential to achieve high-quality metallurgical bonding, low dilution rate, and minimized occurrence of pores and cracks. Accurately simulating this process is of great significance for obtaining high-quality coatings. Among the various candidate methods, the finite element model is widely utilized as it can offer guidance for selecting laser parameters [15].
This paper aims to optimize the coating process parameters for the surface strengthening of a submersible electric pump impeller. The simulation of the laser cladding temperature field of Ni60 powder was conducted using a 3D Gauss heat source model on the Ansys platform. The study focused on narrowing the process window through a combination of simulation and experimental validation, analyzing the variations in the surface morphology, melting height and width, dilution rate, microhardness, and microstructure of the laser cladding coating, and selecting suitable process parameters.
2. Finite Element Simulation of Temperature Field
2.1. Selection of Heat Source Model
In this paper, the Gaussian body heat source model is selected for numerical simulation of laser cladding, considering its appropriateness for the specific laser selection. It is essential to understand that the choice of heat source model significantly influences the outcomes of numerical simulations of laser cladding. The commonly employed models for numerical simulation of laser cladding encompass the Gaussian surface heat source, Gaussian body heat source, and double ellipsoid heat source. The selection of the Gaussian body heat source is derived from the specific requirements of the laser selection process. Its function is defined as follows:
A represents the absorption rate of the material to the laser, while R stands for the laser radius, P is the laser power, and V0 represents the laser scanning rate.
2.2. Model Establishment
The model established using finite element software (Ansys) is shown in Figure 1. A single-layer, single-channel laser cladding model was established with the model substrate set at 40 × 20 × 10 and the coating at 3.5 × 1 × 40. The laser heat source moved at a constant speed on the substrate, and the powder was fed into the substrate along with the movement of the laser. Subsequently, the coating was formed after the temperature increased and cooling took place.
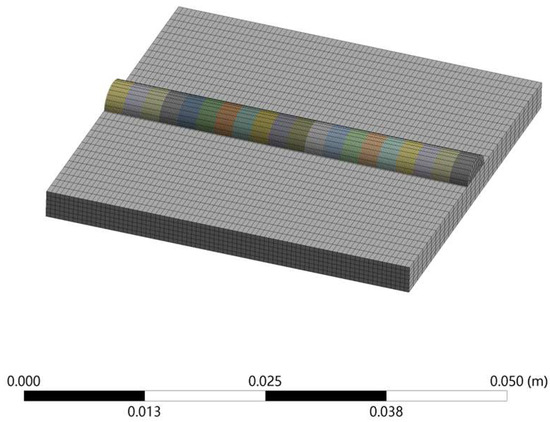
Figure 1.
A 3D model diagram.
In this paper, the coaxial powder feeding method is selected, so the “life and death unit” method is used to simulate the coating molding process; that is, when the laser light source moves to a unit block, the unit block is activated, and the laser light source does not move to the area, the unit block is killed and does not participate in the previous calculation, so as to realize the simulation process of laser cladding with coaxial powder feeding.
2.3. Material Library Establishment
The experiment employs high nickel austenitic cast iron as the substrate, with Ni60 powder selected as the coating material. Unfortunately, neither of these materials’ data are available in the Ansys material library. However, the JMatPro Version 7.0 software can be utilized to accurately calculate the necessary parameter performance for the simulation, based on the material’s chemical composition. This calculation is illustrated in the Figure 2.
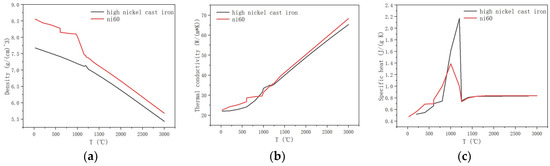
Figure 2.
Various thermophysical parameters of the material: (a) density, (b) thermal conductivity, (c) specific heat.
2.4. Temperature Field Distribution
The figure clearly illustrates that during the simulation of the temperature field, the laser-scanned coating experiences rapid diffusion and conduction, leading to a cooling effect on the surrounding area. Consequently, the laser cladding process exhibits the phenomenon of both rapid cooling and heating. The temperature band at the forefront of the molten pool appears to be dense, whereas the temperature change gradient diminishes towards the rear of the molten pool.
In the initial experiment, the coating process parameters were defined, selecting laser powers of 800, 1200, 1600, and 2000 W, along with scanning speeds of 6, 8, 10, and 12 mm/s. Subsequently, numerical simulations were performed for laser cladding based on these parameters. The analysis of the temperature field distribution, as depicted in Figure 3, revealed that issues arise when the laser power is set at 2000 W, leading to the melting area exceeding the coating width and reaching excessively high temperatures. When using laser powers of 800 W and scanning speeds between 10 mm/s and 12 mm/s, incomplete melting of the coating area may occur, potentially resulting in problems such as coating detachment or inadequate bonding with the substrate. The red area in the figure indicates the melted region of the coating, while the surrounding gradient temperature zone represents the heat-affected area during the cladding process.
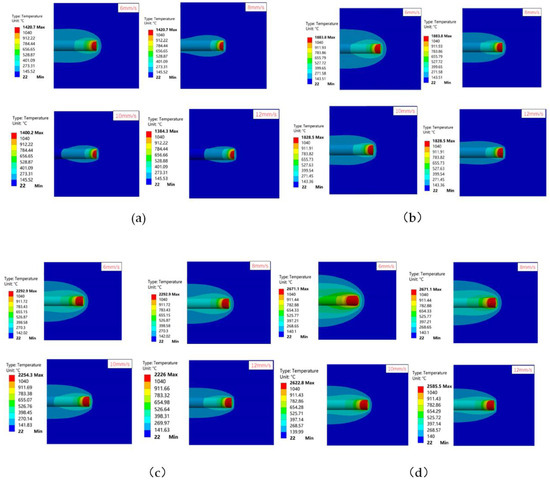
Figure 3.
Temperature cloud map distribution with the same power and different scanning speeds. (a) 800 w (b) 1200 w (c) 1600 w (d) 2000 w.
2.5. Size Analysis of Molten Pool
2.5.1. Weld Pool Size Verification
This study aims to validate the consistency of the molten pool size with the outcomes of the initial experiment. The obtained results from numerical simulation are compared against the measured data from the experiment, and any discrepancies are analyzed. As illustrated in Figure 4, the molten pool size is determined through a measurement method where points are taken at 0.5 mm intervals along the arrow-indicated path to create a displacement distance diagram of the transverse and longitudinal temperature curves of the molten pool. In these graphs, the area above the melting point is considered as indicative of the width and depth of the molten pool.
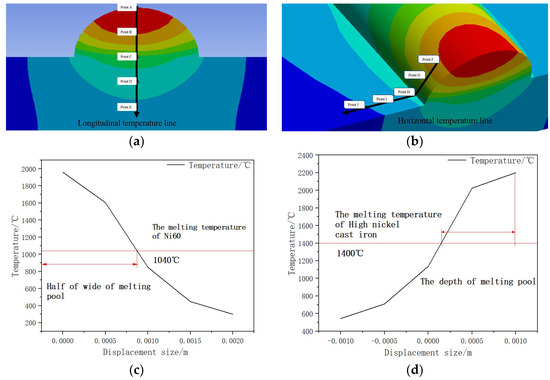
Figure 4.
Schematic diagram of measurement method for molten pool size; (a) longitudinal sampling point; (b) horizontal sampling point; (c) measurement of the width of the melting pool; (d) measurement of the depth of the melting pool.
2.5.2. Different Laser Power Molten Pool Sizes
The laser power significantly influences the rate of heat absorption by the substrate. Lower laser power levels result in an incomplete melting of the coating powder material, causing a reduction in the coating size. Conversely, higher laser power levels enable the coating powder to absorb sufficient heat, thereby increasing both the width and depth of the coating, as illustrated in Figure 5.
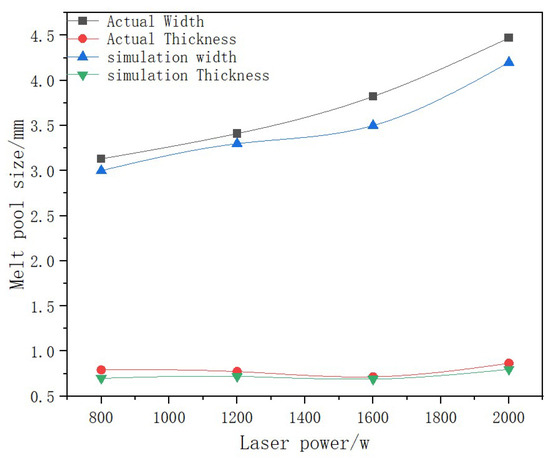
Figure 5.
Size of molten pool with different laser powers.
2.5.3. Different Scanning Speed Molten Pool Sizes
The scanning speed significantly impacts the duration of laser exposure to the substrate. A lower scanning speed results in greater heat absorption by both the substrate and powder per unit time, thereby increasing the size of the melting area in the coating. Conversely, as the scanning speed increases, the heat decreases, consequently reducing the size of the coating, as illustrated in Figure 6.
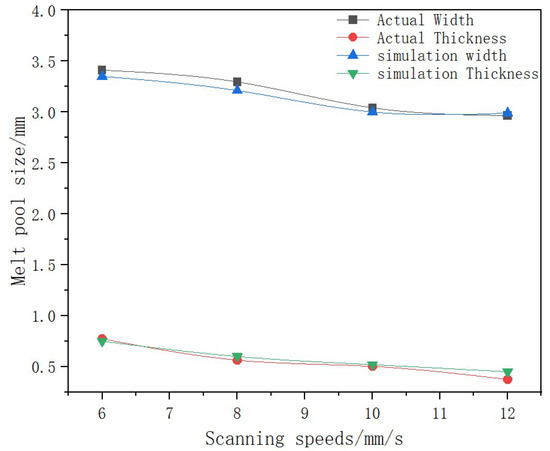
Figure 6.
Size of molten pool with different scanning speed.
2.6. Laser Cladding Quality Verification
In the initial testing phase, it was observed that insufficient laser power resulted in incomplete melting of the cladding powder material, leading to a low powder utilization rate. Conversely, excessive laser power caused the occurrence of melt spattering. Additionally, it was discovered that lower scanning speeds resulted in melting near the coating. On the other hand, higher scanning speeds yielded narrow coating widths and inadequate bonding between the coating and the substrate matrix.
The quality of the laser cladding layer is strongly correlated with both the power density and energy density of the laser beam [16]. Specifically, the power density refers to the laser power per unit area, while the energy density quantifies the amount of energy that the laser beam imparts to the processed material.
Figure 7 illustrates the macroscopic morphology of a single-pass laser cladding coating influenced by laser process parameters. As observed in the figure, granular Ni60 powder is dispersed at the interface between the coating and the substrate. This scattering may arise from the interaction between the powder carrier air and the protective gas during the powder feeding process, leading to disturbances in airflow, particle splattering, and the deposition of some particles onto the contact region between the molten pool, substrate, or fuse surface.
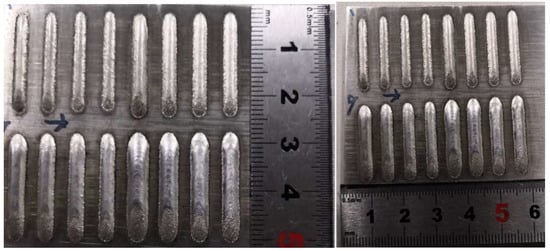
Figure 7.
Macro morphology of single channel laser cladding.
When the laser power is low, the coating surface becomes rough, with a significant presence of fine granular particles. This can be attributed to several factors. Firstly, the constant powder feeding rate and inadequate laser power result in insufficient energy density within the molten pool. Consequently, the cladding powder is not fully melted, causing some of the powder to remain as impurities. Secondly, insufficient melting of the matrix surface further contributes to the poor wettability between the cladding layer and the substrate, leading to a weak bonding strength. Moreover, during the cooling process, the incompletely melted coating material condenses into dispersed droplets due to surface tension, resulting in the formation of cracks and pores within the coating, as depicted in Figure 8.
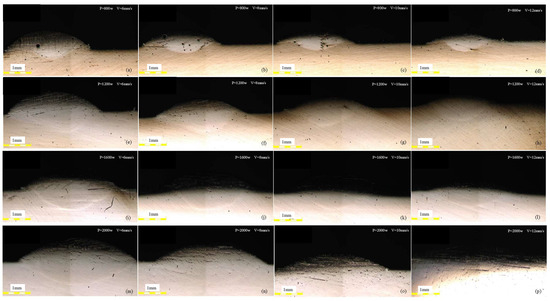
Figure 8.
Cross section morphology of coatings with different laser process parameters. (a–d) P = 800 w, V = 6–12 mm/s. (e–h) P = 1200 w, V = 6–12 mm/s. (i–l) P = 1600 w, V = 6–12 mm/s. (m–p) P = 2000 w, V = 6–12 mm/s.
Only when the laser power reaches a certain value can the coating material be fully melted, obtain a bright surface coating, and make the base material begin to melt, forming a good metallurgical bond with the coating. When the laser power is high, the absorbed energy of the molten pool is too high, and the surface of the coating is ablated and wrinkled.
Based on the aforementioned temperature field and experimental analysis, the process window is constrained, leading to the selection of the second set of process parameters through experimental verification. These parameters comprise a laser power ranging from 900 W to 1200 W and a scanning speed ranging from 2 mm/s to 8 mm/s.
3. Optimization of Experimental Technology Research
3.1. Materials and Methods
The impeller of a submersible electric pump requires specific attributes such as wear resistance, corrosion resistance, and excellent machinability. Currently, high nickel austenitic cast iron [17] is widely employed for this purpose, with nickel content ranging from 13% to 36%. This material offers not only favorable corrosion resistance, non-magnetic properties, controllable thermal expansion, and resistance to oxidation at both low and high temperatures, but also possesses excellent shock absorption, wear resistance, and machinability. Consequently, high-nickel cast iron has been chosen as the base material for this study. The sample dimensions were 70 mm × 50 mm × 10 mm, and its chemical composition is presented in Table 1. Prior to the laser cladding test, the substrate surface underwent polishing and cleaning with acetone.

Table 1.
Chemical composition of high nickel cast iron (wt.%).
Laser cladding powder materials can be categorized into metal, ceramic, and composite materials. Among these, self-fusing alloy powder is extensively studied and commonly applied in metal powder materials [18]. When selecting powder materials, it is crucial for the powder material’s performance to closely match that of the substrate. This ensures a well-bonded coating with the substrate metallurgy. Otherwise, the coating material will generate significant tensile stress due to discrepancies in thermal and physical parameters compared to the metal substrate. If the residual tensile stress surpasses the substrate’s tensile limit, the coating is susceptible to cracking or even failure. Furthermore, the coating’s quality is also influenced by the wettability of the powder material. Enhanced wettability facilitates the production of well-formed coatings.
In this study, Ni60 powder was chosen as the coating material, with particle sizes ranging from 45 to 109 µm. The mass fraction of Ni60 powder consisted of 0.45% C, 2.40% B, 4.00% Si, 10.00% Fe, 12.0% Cr, 0.10% Mn, and the remaining portion being Ni. The morphology of the coating powder is illustrated in Figure 9, revealing that the Ni60 particles possess a spherical shape and exhibit good flow characteristics. Before the commencement of experiments, the Ni60 powder was dried in an oven at 150 °C for 2 h to enhance the powder’s fluidity.
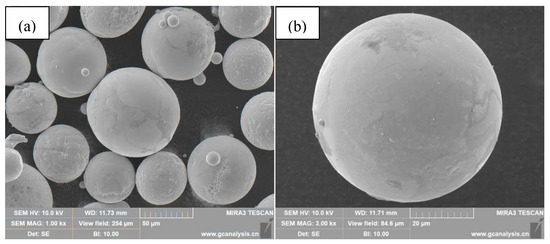
Figure 9.
Ni60 powder morphology: (a) low magnification image of Ni60 powder, (b) high magnification image of Ni60 powder.
Based on the shape, particle size, and process requirements of laser cladding materials, the powder feeding methods can be categorized into the synchronous method and the preset method, as depicted in Figure 10 [19,20]. In the synchronous method, the powder feeding nozzle moves synchronously with the laser beam during the laser cladding process. The powder instantly melts into the molten pool, and the coating solidifies rapidly once the laser beam is withdrawn. Synchronous powder feeding enhances the availability and flexibility of the processing, facilitating the fabrication of complex components. Conversely, the presetting method involves depositing the coating powder material onto the substrate beforehand, followed by scanning and melting the preset powder and substrate using the laser beam. Subsequently, the molten pool solidifies quickly, resulting in the formation of the coating. However, the presetting method exhibits drawbacks such as high dilution and complexity in processing. Consequently, in this study, the synchronous laser cladding processing method was selected.
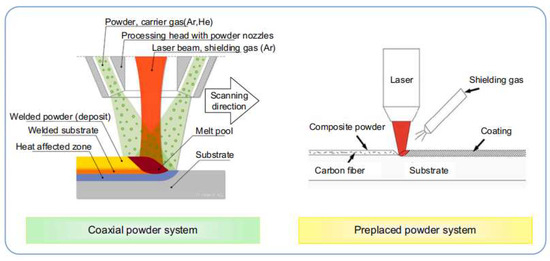
Figure 10.
Schematic diagram of synchronous and pre-set laser cladding [19,20].
Based on the analysis of the initial test outcomes, a second round of single-channel laser cladding was conducted using Ni60. As illustrated in Table 2, the laser process parameters were predetermined as follows: a powder delivery rate of 12 r/min, laser power ranging from 900 to 1200 W, scanning speed varying from 2 to 8 mm/s, a spot diameter of 3 mm, and the utilization of argon gas as the protective medium.
Table 2.
The specific parameters utilized during the laser cladding process.
The laser cladding equipment provided by Jiu Heng Optoelectronics Company (Wenzhou, China) was used for laser cladding test. The MFSC laser transmitter system has a maximum laser power of 6 kW and uses argon as the carrier gas to transfer the powder from the powder feed tube to the nozzle.
The sample was cut into 10 mm × 10 mm × 4 mm squares using a wire cutting machine with molybdenum wire that had a diameter of 0.18 mm. These squares were then polished step by step using SiC sandpaper with grit grades ranging from 400# to 3000#. After polishing, the samples were cleaned using ultrasonic waves with an alcohol solution and subsequently dried. To measure the sample’s geometric features such as coating thickness, coating width, an OLS4100 3D (Tokyo, Japan) laser scanning confocal microscope was used.
Aqueous regia solution (volume ratio, 3HCl:1HNO3) was utilized for conducting metallographic corrosion on the cross-section of the sample. Subsequently, the metallographic corrosion area on the sample section was observed and analyzed using an optical microscope (BX53M OM by Olympus Corporation, Japan).
The microhardness of the polished sample was tested using the HXD-1000TM/LCD (Shanghai, China) microhardness tester. The test was conducted with a loading load of 9.8 N and a holding time of 10 s. Measurements were taken at intervals of 0.2 mm, with each point being measured three times.
3.2. Influence of Laser Power and Scanning Speed on the Macroscopic Morphology of the Coating
During the pre-experiment, it was observed that insufficient laser power leads to incomplete melting of the coating powder material, causing low powder utilization and significant waste. Conversely, excessive laser power results in melt spatter. Similarly, when the scanning speed is too slow, excessive melting near the coating takes place. On the other hand, a scanning speed that is too fast hinders the ideal melting effect between the coating and the substrate, sometimes resulting in poor adhesion.
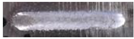
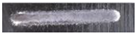
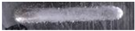
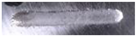
Table 2 illustrates the macroscopic morphology of the single-channel laser cladding process parameters. During the powder feeding process, the airflow turbulence and particles splashing caused by the powder carrier air’s interaction with the protective gas result in some particles landing on the bonding interface between the molten pool and the substrate or in the vicinity of the molten pool’s surface. At a scanning speed of 2 mm/s, the coating exhibits irregularities primarily attributed to the low scanning speed, which leads to an excessive amount of powder per unit time. Consequently, the powder cannot melt completely, resulting in poor quality of the final coating’s formation. High laser power results in excessive energy being absorbed by the molten pool, leading to ablation and wrinkling on the coating’s surface.
The morphology of the cross section of the single-pass laser cladding coating is illustrated in Figure 11. During the laser cladding process, inadequate bonding strength between the coating and the substrate occurs due to the low laser power, resulting in the presence of unfused particles in the molten pool and the formation of defects such as pores and cracks in the coating. Moreover, as the coating melt pool solidifies, the melt that is not completely melted condenses into discontinuous droplets due to surface tension, causing cracks and pores to form in the coating. Increasing the laser power enhances the laser energy density per unit time, resulting in the complete melting of all the coating powder and a portion of the substrate, thus producing a coating with excellent metallurgical bonding.
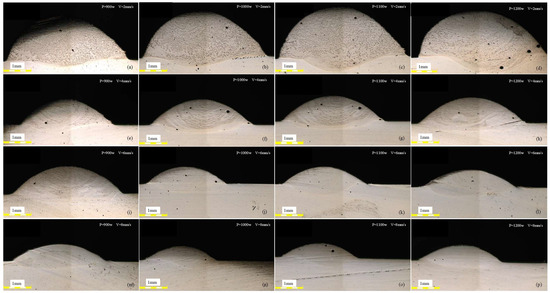
Figure 11.
Cross-sectional shape of a single-pass laser cladding coating. (a–d) P = 900–1200 w, V = 2 mm/s. (e–h) P = 900–1200 w, V = 4 mm/s. (i–l) P = 900–1200 w, V = 6 mm/s. (m–p) P = 900–1200w, V = 8 mm/s.
3.2.1. Coating Width Analysis
Figure 12 depicts the width of the laser cladding coating at different combinations of laser power and scanning speed. It is apparent from the figure that, while the scanning speed remains constant, the coating width exhibits a slight increase as the laser power increases. However, this change is not particularly pronounced since, at this particular stage, the laser power has a minor influence on the coating width. Conversely, when the laser power remains constant, the coating width decreases with an increasing scanning speed. This phenomenon can be attributed to the reduction in the amount of melted powder material per unit time as the scanning speed rises, which subsequently leads to a decrease in the coating width.
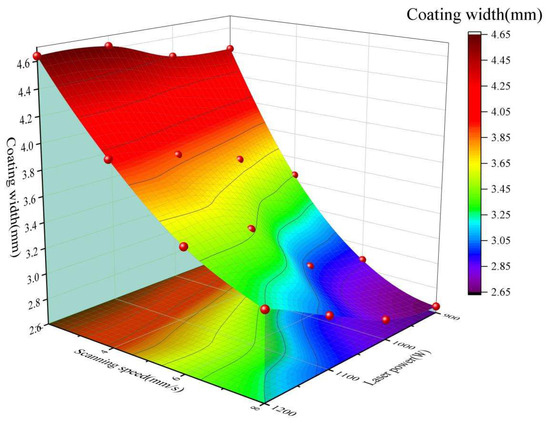
Figure 12.
Width of laser cladding coatings at different laser powers and scanning speeds.
3.2.2. Analysis of Coating Thickness
The variations in the thickness of the laser cladding coating, caused by different laser power and scanning speed, are presented in Figure 13. It is evident from the figure that, with the laser power and powder feeding rate held constant, the coating thickness shows an approximate inverse relationship with the scanning speed. When the scanning speed is below 6 mm/s, there is a significant decrease in the coating thickness as the scanning speed increases. This can be attributed to the decrease in laser energy density and the quantity of molten powder per unit time, resulting in a corresponding reduction in coating thickness. On the other hand, when the scanning speed is fixed, the laser power does not have a significant impact on the coating thickness. This suggests that the laser power is not the primary determinant of coating thickness. Furthermore, at high laser power and low scanning speed, the gravitational effects on the coating powder melt pool become more prominent, limiting the continuous increase in coating thickness as laser power increases and scanning speed decreases.
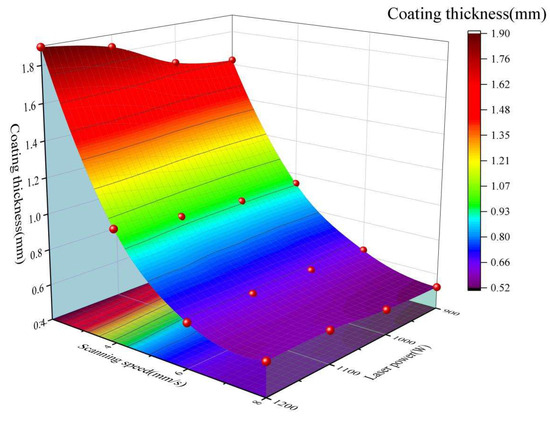
Figure 13.
Thickness of laser cladding coatings at different laser powers and scanning speeds.
The cross-sectional thickness and width of the laser cladding coating under different laser powers and scanning speeds are depicted in Figure 14. The thickness to width ratio of the coating section is a crucial indicator for evaluating the shape of the coating section. As the thickness to width ratio increases, the coating profile more closely resembles a superior arc; conversely, as the ratio decreases, the coating profile becomes more similar to an inferior arc. When the scanning speed remains constant, it can be observed from Figure 14 that the thickness-to-aspect ratio of the coating section shows little variation under different laser power settings. Particularly at a scanning speed of 4 mm/s to 8 mm/s, the ratio remains fairly stable, indicating that the primary factors influencing the shape of the coating section at this time are not the laser power and scanning speed.
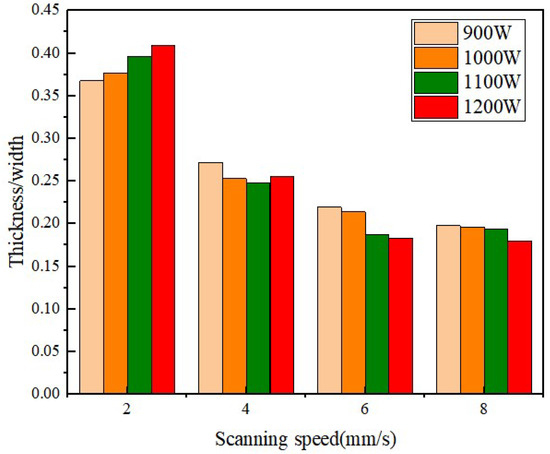
Figure 14.
Thickness to width ratio of coatings at different laser powers and scanning speeds.
3.2.3. Analysis of Coating Dilution Rate
Dilution rate is a critical indicator for evaluating the quality of laser cladding coatings. It quantifies the extent of compositional change resulting from the incorporation of the melted substrate into the coating [21]. By taking into account Figure 15, the coating dilution rate can be calculated using the area of the melted part of the substrate and the cross-sectional area of the cladding layer [22], as demonstrated in Formula (3).
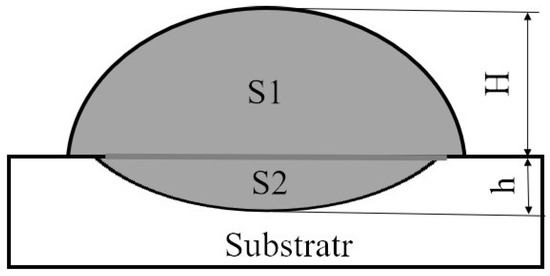
Figure 15.
Cross section of the coating layer.
In general, to simplify the calculation process, the penetration of the substrate and the thickness of the coating can be determined using Formula (4).
Figure 16 displays the dilution rate of the laser cladding coating at varying laser power and scanning speed. As observed from the figure, the dilution rate of each coating remains consistently below 0.35, implying that the laser process parameters set are reasonable. Furthermore, under constant laser power, the dilution rate increases with higher scanning speeds. This can be attributed to the reduction in powder amount during the laser cladding process. Despite this decrease, the input laser energy per unit time remains unchanged, causing an excess of laser energy to be transferred to the substrate. Consequently, more of the substrate melts, leading to an increase in the coating dilution rate.
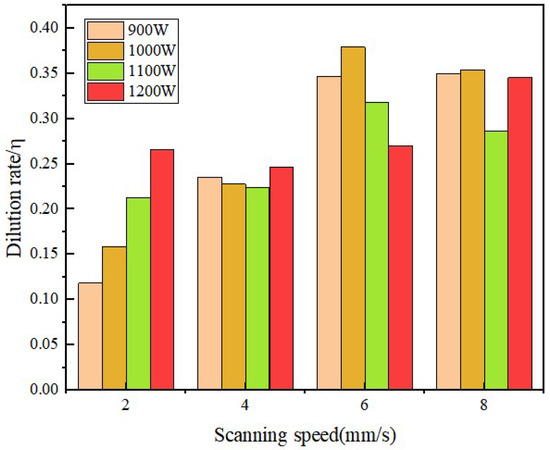
Figure 16.
Dilution rates of laser cladding coatings at different laser powers and scanning speeds.
3.3. Influence of Laser Power and Scanning Speed on the Microstructure of the Coating
The melting and solidification of the laser cladding pool constitute a dynamic process involving two types of solid–liquid boundary surfaces. The first type corresponds to the interface between the molten pool and the partially melted substrate. The second type pertains to suspended impurities with high melting points, where non-uniform crystal nuclei adhere to nucleate, consequently enhancing the nucleation rate of grains and achieving the desired strengthening effect by refining the microstructure [23].
3.3.1. Microstructure Analysis of the Coating under Different Laser Power
Figure 17 illustrates the microstructure of the coating interface under different laser powers when the scanning speed is 6 mm/s. In Figure 17a, at a laser power of 900 W, the coating predominantly consists of dendrites and long strips, with large intercrystalline voids and relatively small grains. This is attributed to the low laser power, resulting in reduced input laser energy per unit time. Consequently, the molten pool exists for a shorter period, hindering sufficient time for nucleation and grain growth. Conversely, in Figure 17b,c, the coating microstructure prepared under laser powers of 1000 W and 1100 W exhibits a predominance of dendrites, short rods, and long strips, with tightly arranged and evenly distributed grain structures. This is primarily due to the increased laser power, resulting in a higher laser energy density and more laser energy input per unit time into the molten pool. This reduced the solidification rate of the molten pool, providing sufficient time for nucleation and growth of the microstructure. However, at excessively high laser powers, the coating structure exhibits coarse and uneven grain boundaries. This is attributed to the elevated coating dilution rate, where the excessive melting of the substrate results in a significant incorporation of substrate elements into the molten pool, thus compromising the performance of the coating.
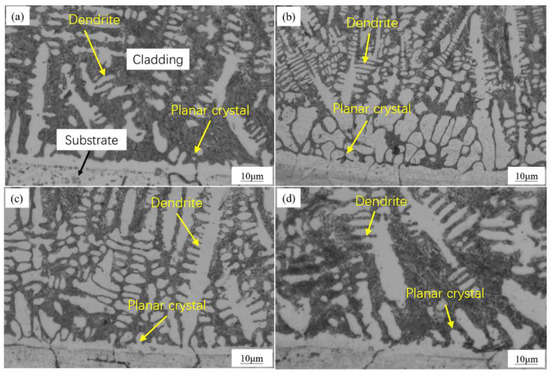
Figure 17.
Microstructure of the coating interface at different laser powers: (a) 900 W, (b) 1000 W, (c) 1100 W, (d) 1200 W.
3.3.2. Microstructure Analysis of the Coating at Different Scanning Speeds
The scanning speed is a critical process parameter in the fabrication of composite coatings through laser cladding, exerting significant influence on the microstructure and properties of the coatings. Figure 18 presents the microstructure of the coating interface at various scanning speeds when the laser power is 1100 W. From Figure 18a, it is evident that at low scanning speeds, the bonding surface between the coating and the substrate is uneven, resulting in poor metallurgical bonding. However, when the scanning speed exceeds 2 mm/s, a white spot line emerges in the interface region, indicating a strong metallurgical bond. Under these conditions, the coating microstructure primarily comprises dendritic and elongated structures, with a gradual decrease in dendritic grains as the scanning speed increases. Analysis demonstrates that the solidification rate of the molten pool escalates with higher scanning speeds, leading to a finer microstructure in the coating.
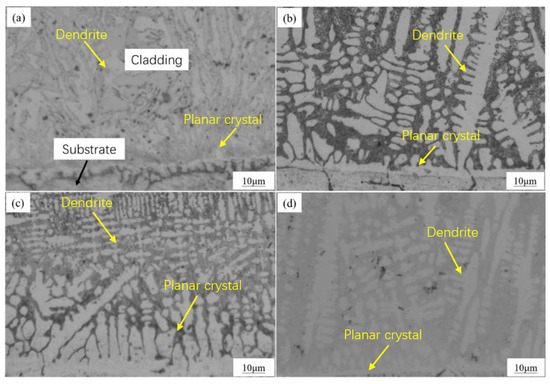
Figure 18.
Microstructure of the coating interface under different scanning speeds: (a) 2 mm/s, (b) 4 mm/s, (c) 6 mm/s, (d) 8 mm/s.
When the scanning speed is increased to 6 mm/s, a significant number of planar crystals are formed in the coating interface region. This is attributed to the fact that the heat dissipation mode in the coating interface region primarily relies on the heat transfer from the substrate. Consequently, the temperature gradient in the interface region is maximized while the solidification rate is minimized, thereby facilitating the formation of planar crystals. Moreover, the protruding part of the growth front of these planar crystals develops into dendrites along the direction of maximum heat dissipation. As a result, the structure of the coating can be controlled by adjusting the scanning speed, thus allowing for the attainment of desired material properties for diverse applications.
3.4. Influence of Laser Power and Scanning Speed on Coating Microhardness
The microhardness of coatings serves as a critical parameter to assess their friction and wear characteristics. The hardness value of a coating is tightly connected with the microstructure, grain size, and lattice distortion that arise during the solidification process of the molten pool. Typically, a smaller grain size corresponds to a higher hardness value. Moreover, the microhardness of the coating is influenced by the residual stress generated during the rapid cooling and solidification stages of the coating preparation process.
3.4.1. Microhardness Analysis of the Coating Surface
The surface hardness values of the laser cladding coating at different laser powers and scanning speeds are depicted in Figure 19. It is evident from the figure that the microhardness of the coating surface progressively decreases with increasing laser power and scanning speed. This phenomenon can be attributed to several factors. Firstly, considering the analysis of dilution rate in Section 3.2.3., it can be observed that the gradual rise in laser power and scanning speed, while the powder feeding rate remains constant, leads to an increase in energy transfer to the substrate per unit time. This, in turn, results in more melting of the substrate, followed by the influx of a greater amount of substrate components into the melt pool, and the convection of the two. Consequently, the microhardness of the coating diminishes. Furthermore, when the scanning speed is held constant, fluctuations in the coating microhardness due to changes in laser power are relatively minimal, suggesting that laser power is not the primary factor affecting the coating microhardness. Similarly, at a laser power of 1100 W, the coating microhardness remains relatively unaffected by changes in the scanning speed, indicating that the scanning speed is not the primary factor influencing the coating microhardness.
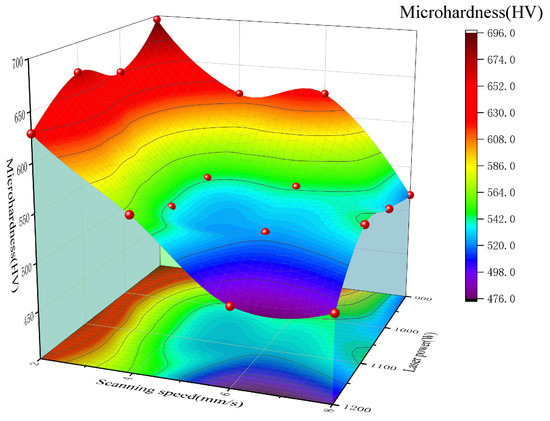
Figure 19.
Surface hardness of coatings at different laser powers and scanning speeds.
3.4.2. Microhardness Analysis of Coating Section
The cross-sectional microhardness of the laser cladding coating under different laser powers is presented in Figure 20 at a scanning speed of 6 mm/s. It is evident from the figure that the trend of microhardness change in the coating section remains consistent. Notably, the hardness values of the 1000 W and 1100 W coatings are closely similar, with relatively minimal fluctuations, thus indicating that the laser power is well-suited at this particular juncture.
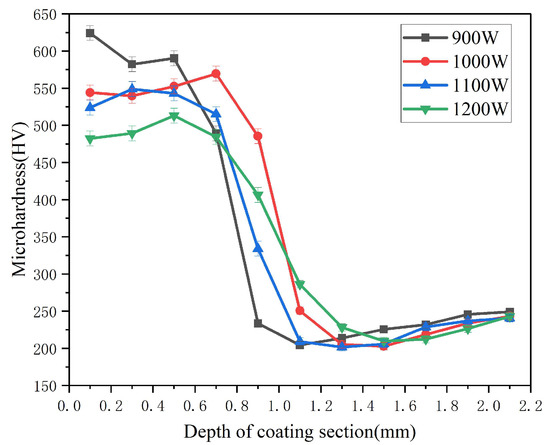
Figure 20.
Cross-sectional microhardness of laser cladding coatings at different laser powers.
3.5. Optimization of Parameters of Sample Cross-Section Melting Pool Comparison
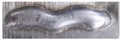
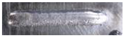
To further validate any discrepancies between the experimental and simulation results, the optimization parameters for a laser cladding experiment were compared. The experiment was performed using a laser power of 1100 W and a scanning speed of 6 mm/s. The obtained cladding cross-section was compared with the simulation results. Figure 21 illustrates that the cross-section morphologies are remarkably alike, thereby verifying the efficacy of the simulation method and its potential to guide actual production.
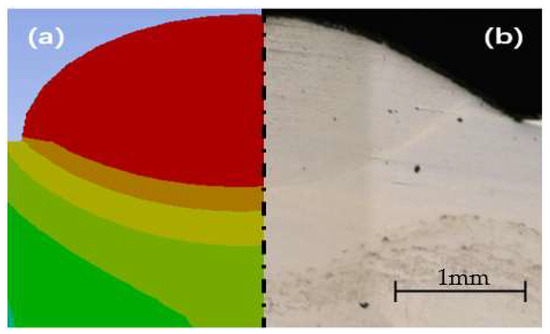
Figure 21.
Comparison of molten pools: (a) simulation (b) experiment.
4. Conclusions
In this study, a numerical simulation of laser cladding was employed to refine the process window and analyze the impact of laser cladding on the morphology, dilution rate, microstructure, and microhardness of Ni60 coatings under various process parameters.
(1) When optimizing the laser power (p = 1100 W) and scanning speed (V = 6 mm/s), the overall coating quality exhibits a favorable combination performance with suitable dilution rate and uniform microstructure. Within these parameters, the molten pool’s maximum depth measures 0.65 mm, and the maximum width is 3.47 mm. Practical verification of the coating cross-section aligns with the numerical simulation results.
(2) Lower laser power hampers the complete melting of the coating powder using the laser beam, resulting in poor metallurgical bonding between the coating and substrate. Increasing the laser power allows for the full melting of the coating powder and a portion of the substrate, resulting in a well-formed metallurgical bonding interface with the substrate. Additionally, the coating’s width and thickness increase with rising laser power and decreasing scanning speed.
(3) As the laser power increases, the energy input per unit time into the molten pool intensifies, leading to an enlargement of the molten pool volume. This allows for sufficient time for the growth of the microstructure, primarily comprising dendritic, block, short rod, and long strip formations. The resulting grain structure is tightly distributed and uniform.
(4) Gradual increments in laser power and scanning speed cause the substrate to absorb more laser energy per unit time. Consequently, an excessive amount of melted substrate elements infiltrates the melt pool of the coating powder material, resulting in co-melting and a decrease in the coating’s microhardness.
(5) The numerical simulation conducted on laser cladding Ni60 powder on a high nickel cast iron substrate demonstrates that simulation is effective in refining the process window and guiding the optimal process parameters for laser cladding experiments. The combination of numerical simulation and experimentation presents an efficient approach for the study of laser cladding and other hot processing procedures.
Author Contributions
Conceptualization, S.C. and C.C.; methodology, A.F., S.C. and C.C.; investigation, A.F. and S.C.; data curation, C.C. and X.S.; writing—original draft preparation, A.F. and S.C.; writing—review and editing, A.F., S.C. and C.C. All authors have read and agreed to the published version of the manuscript.
Funding
This study was supported by the Natural Science Foundation of Zhejiang Province (LY20E050027), the Major Special Project of Wenzhou Science and Technology Innovation and Tackling Industry (ZG2020029), and the Innovation Fund of Wenzhou University Rui’an Graduate College (YC202212003).
Data Availability Statement
Data are contained within the article.
Conflicts of Interest
We declare that we do not have any commercial or associative interest that represents a conflict of interest in connection with the work submitted.
References
- Metwally, I.A.; Gastli, A. Correlation between eddy currents and corrosion in electric submersible pump systems. J. Int. J. Therm. Sci. 2008, 47, 800–810. [Google Scholar] [CrossRef]
- Lyakhomskii, A.; Petrochenkov, A.; Romodin, A.; Perfil’eva, E.; Mishurinskikh, S.; Kokorev, A.; Kokorev, A.; Zuev, S. Assessment of the Harmonics Influence on the Power Consumption of an Electric Submersible Pump Installation. J. Energy 2022, 15, 2409. [Google Scholar] [CrossRef]
- Khalid, Y.A.; Sapuan, S.M. Wear analysis of centrifugal slurry pump impellers. J. Ind. Lubr. Tribol. 2007, 59, 18–28. [Google Scholar] [CrossRef]
- Qiao, L.F.; Mo, L.; Mao, L.J.; Zhu, J.L.; Zeng, L.X. Erosion Wear Characteristics and Failure Mechanism of the Sulzer Oil Pump. J. Appl. Fluid Mech. 2023, 17, 424–441. [Google Scholar] [CrossRef]
- Pujiyulianto, E.; Muhyi, A.; Paundra, F.; Perdana, F.; Yudistira, H.T.; Syaukani, M. Failure analysis of a wear ring impeller. Eng. Fail. Anal. 2022, 138, 106415. [Google Scholar] [CrossRef]
- Shi, X.; Wen, D.; Wang, S.; Wang, G.; Zhang, M. Study on the microstructure and high-temperature friction and wear properties of Fe-Ni-Cr gradient composite coating of laser cladding gray cast iron brake discs. Chin. J. Lasers 2022, 49, 0202017. [Google Scholar] [CrossRef]
- Arias-González, F.; del Val, J.; Comesaña, R.; Penide, J.; Lusquiños, F.; Quintero, F.; Riveiro, A.; Boutinguiza, M.; Pou, J. Fiber laser cladding of nickel-based alloy on cast iron. Appl. Surf. Sci. 2016, 374, 197–205. [Google Scholar] [CrossRef]
- Zhao, X. Study on the Performance of Micro-Pit-Like Bionic Nanocoating Prepared via Jet Electrodeposition on the Surface of the Electric Submersible Pump. Ph.D. Thesis, Northeast Petroleum University, Daqing, China, 2021. [Google Scholar] [CrossRef]
- Leech, P.W. Laser surface melting of a complex high alloy steel. Mater. Des. 2014, 54, 539–543. [Google Scholar] [CrossRef]
- Wang, H. Laser Additive Manufacturing of High-Performance Large Metal Components: Several Material Fundamental Issues. J. Aeronaut. 2014, 35, 2690–2698. [Google Scholar] [CrossRef]
- Wang, S.; Zhu, L.; Fuh, J.Y.H.; Zhang, H.; Yan, W. Multi-physics modeling and Gaussian process regression analysis of cladding track geometry for direct energy deposition. Opt. Lasers Eng. 2020, 127, 105950. [Google Scholar] [CrossRef]
- Zhou, S.; Dai, X.; Zeng, X. Effects of processing parameters on structure of Ni-based WC composite coatings during laser induction hybrid rapid cladding. Appl. Surf. Sci. 2009, 255, 8494–8500. [Google Scholar] [CrossRef]
- Huang, S. Discussion on anti-cracking countermeasures of laser cladding technology. Equip. Manuf. Technol. 2007, 11, 126–127. [Google Scholar] [CrossRef]
- Yi, J.; Guo, S.; Li, Z. Status and Development of Laser Surface Alloying and Laser Cladding in China. Mater. Sci. Eng. 2002, 1, 143–145. [Google Scholar] [CrossRef]
- Yang, S.; Bai, H.; Li, C.; Shu, L.; Zhang, X.; Jia, Z. Numerical Simulation and Multi-Objective Parameter Optimization of Inconel718 Coating Laser Cladding. Coatings 2022, 12, 708. [Google Scholar] [CrossRef]
- Sun, H.; Zhong, M.; Liu, W. Cracking Sensitivity on Laser Cladding Inconel 738 on Directionally Solidified Ni-base Superalloy. J. Aeronaut. Mater. 2005, 25, 26–31. [Google Scholar] [CrossRef]
- Wang, L.; Zhang, Y.; Wang, Q. Application of Reliability Analysis in Shaft Failure Research of Electrical Submersible Pump. Oil Field Equip. 2008, 37, 59–62. [Google Scholar] [CrossRef]
- Farahmand, P.; Liu, S.; Zhang, Z.; Kovacevic, R. Laser cladding assisted by induction heating of Ni–WC composite enhanced by nano-WC and La2O3. Ceram. Int. 2014, 40, 15421–15438. [Google Scholar] [CrossRef]
- Wirth, F.; Wegener, K. A physical modeling and predictive simulation of the laser cladding process. Addit. Manuf. 2018, 22, 307–319. [Google Scholar] [CrossRef]
- Lei, J.; Shi, C.; Zhou, S.; Gu, Z.; Zhang, L.-C. Enhanced corrosion and wear resistance properties of carbon fiber reinforced Ni-based composite coating by laser cladding. Surf. Coat. Technol. 2018, 334, 274–285. [Google Scholar] [CrossRef]
- Xi, W.; Song, B.; Zhao, Y.; Yu, T.; Wang, J. Geometry and dilution rate analysis and prediction of laser cladding. Int. J. Adv. Manuf. Technol. 2019, 103, 4695–4702. [Google Scholar] [CrossRef]
- Liu, J.; Li, J.; Cheng, X.; Wang, H. Effect of dilution and macrosegregation on corrosion resistance of laser clad AerMet100 steel coating on 300M steel substrate. Surf. Coat. Technol. 2017, 325, 352–359. [Google Scholar] [CrossRef]
- Song, B.; Yu, T.; Jiang, X.; Xi, W.; Lin, X. Development mechanism and solidification morphology of molten pool generated by laser cladding. Int. J. Therm. Sci. 2021, 159, 106579. [Google Scholar] [CrossRef]
Disclaimer/Publisher’s Note: The statements, opinions and data contained in all publications are solely those of the individual author(s) and contributor(s) and not of MDPI and/or the editor(s). MDPI and/or the editor(s) disclaim responsibility for any injury to people or property resulting from any ideas, methods, instructions or products referred to in the content. |
© 2024 by the authors. Licensee MDPI, Basel, Switzerland. This article is an open access article distributed under the terms and conditions of the Creative Commons Attribution (CC BY) license (https://creativecommons.org/licenses/by/4.0/).