Article

Mitigation of Renewable Energy Source Production Variability in Residential Stock through Small-Scale Gas–Liquid Energy Storage Technology Application

DIAEE Department of Astronautical, Electrical and Energy Engineering, “Sapienza” University of Rome, Via Eudossiana 18, 00184 Rome, Italy
*
Author to whom correspondence should be addressed.
Processes 2024, 12(4), 655; https://doi.org/10.3390/pr12040655
Submission received: 13 February 2024 / Revised: 6 March 2024 / Accepted: 17 March 2024 / Published: 25 March 2024
(This article belongs to the Special Issue State-of-the-Art Energy Conversion and Storage)

Abstract

:
Despite renewable energy source integration being a well-established requirement in international policies, energy systems still face some unresolved issues, including the intermittence of production. To tackle this problem, a viable solution could comprise the off-peak storage of electricity production excess, to be consumed later during peak-load hours. The transition from the diffuse pattern of centralized generation to the distributed model, involving energy communities, suggests an additional aspect to manage: the spatial constraints of systems for domestic applications. Compressed-air energy storage represents a promising Power-to-Power technology for small-scale energy integration. This study proposes the application of a gas–liquid energy storage system (GLES) in a residential building, using renewable energy excess from a photovoltaic (PV) array. The performance of the proposed system, whose operation involves the compression of the gaseous mass through a piston operated by mineral oil, was evaluated through energy analysis performed simulating the devices and their coupling with the load profiles of the building. The thermodynamic model of storage was validated using data from an experimental campaign on a prototype. A sensitivity study, acting on the features of the system, such as the compression rate and vessel size, allowed us to compare the absorbed PV energy excess, the coverage of the building energy demand during the expansion phase, and the electrical efficiency of a daily cycle. The results obtained, together with the related economic analysis, were used to quantify the market potential of the proposed solution, to be exploited as a mechanical alternative to conventional electric batteries in dwellings.

1. Introduction

A rise in global energy consumption is making the transition to sustainable energy sources more urgent than ever. This urgency is also due to the progressive deterioration in environmental conditions [1]. International energy forecasts estimate that the building sector will consume 40% of global energy by 2050 [2,3]. Buildings use electricity to light, heat, cool, operate equipment, and operate appliances; these uses represent half of the total electricity consumed and some 42% of global CO2 emissions. By pursuing clean energy alternatives, national and local energy policies will move toward intelligent grids and zero-carbon cities [4,5]. As stated in the literature [6,7,8], there are some critical challenges associated with renewable energy because of fluctuating power production and the mismatched supply/demand for electricity. Based on these tasks, the key role of an energy storage system is essentially to meet the energy demand of the building and make the building more energy-independent [9,10,11,12]. Renewable energy can be stored in several ways, including internally, mechanically, or via potential energy [13]. When the demand for electrical power is high, stored energy is converted into electricity and delivered to the network [14].
Among the energy storage systems, compressed-air energy storage (CAES) is becoming more competitive at different project scales due to its sufficient energy capacity, high cycle life, and fast response time [15]. Furthermore, the long lifespan, the reliable performance, and the economic affordability of CAES are the main advantages compared to other methods [16], as well as offering novel ways of addressing the heat management challenge [17,18]. There are four main components of CAES systems: a compressor, turbine, storage (heat and air), and generator motor. CAES systems are classified according to the type of heat utilization and compressed air storage: diabatic CAES, adiabatic CAES, and isothermal CAES [19,20], of which A-CAES is a zero-emission system [21,22,23]. Recently, the combination of the CAES system with a liquid substance (e.g., water, oil, and so on) introduced the gas–liquid energy storage technology. Storing energy via the compression and expansion of air using water as a liquid was developed by Oak Ridge National Laboratory (ORNL) [24]. Unlike other gas compression-based energy storage technologies, the combination of gas and water achieves a higher roundtrip efficiency by replacing inefficient gas compressors and turbines with liquid turbomachines for liquid piston compression and expansion. In other words, the Ground-Level Integrated Diverse Energy Storage (GLIDES) system typically consists of a liquid storage reservoir under atmospheric pressure, a pressure vessel containing a gas (i.e., air, nitrogen, carbon dioxide), a pump/motor, and a hydraulic turbine/generator [25].
Moving to the technical and economic aspects of the GLIDES system, various pressure reservoirs, including steel vessels, carbon fiber vessels, pipe segments, and underground pressure reservoirs, were analyzed [26]. The authors stated that in the grid-scale application of gas–liquid energy storage systems using depleted oil and gas reservoirs and high-pressure pipe segments, the energy storage costs can be as low as USD 35/kWh (a roundtrip efficiency of 80%). However, the disadvantages of underground reservoirs have to be mentioned, such as scalability and limited access to water reservoirs or renewable energy sources (e.g., if wind energy is used for charging) [26]. Another interesting work [27] conducted an experimental evaluation of the performance of the first hybrid compressed gas–hydro energy storage proof-of-concept prototype. Like pumped-storage hydroelectricity, hydraulic turbomachines (pump/turbine) are used to store and recover energy, but pressure vessels are used to create artificial elevations, allowing pressure heads to reach several thousand feet. Based on the validation results, the cycle thermodynamic efficiency is very high, but the system roundtrip efficiency is very dependent on utilizing auxiliary components with high individual efficiencies. The proper sizing of auxiliary components is crucial to avoiding consistent energy losses.
Medium-scale applications of CAES and similar systems are currently under investigation to overcome large vessel volumes [28,29]. An innovative study evaluates the possibility of placing CAES under the condition of a building. The results show that the stresses in the CAES pile wall do not exceed the yield strength of the high-grade steels during pressurization, demonstrating its feasibility. Based on the literature review, the use of a combination of gas and liquid to store energy is rising to face the intermittent availability of renewable energy. The application on a small scale, such as for buildings, is not so common but can represent an attractive path. A possible advantage is the replacement of electrical batteries with gas–liquid energy storage systems. Much effort has been dedicated to reducing the cost of batteries to succeed in the market [9,30,31], but their lifetime and safety are still issues, particularly for lithium-ion batteries [32].
In this framework, the presented work proposes an experimental analysis of a gas–liquid energy storage (GLES) prototype, based on air-compressed and mineral oil. The implemented prototype is an evolution of a study [33] already carried out at the laboratories of the DIAEE Department of the University of Rome of Sapienza. In the previous system, there was a bag of nitrile containing nitrogen, which was likewise compressed through the introduction of mineral oil by a pump–motor system. The main improvement in our study is represented by the presence of the aluminum piston: the separation between oil and gas is achieved by the piston and no longer by the nitrile bag.
Compared to the use of the bag, this new configuration presents the advantage of showing the exchange volume between all the parts (gas, oil, the external environment, and the portion of wall concerned), making it easily predictable and calculable; furthermore, having a separation with a higher compression limit makes it possible to carry out tests with greater final pressures. The validation of the experimental results is also presented. At the end of the study, the energy and environmental analysis of the PV-GLES system and PV-electrochemical batteries is described to underline the potential of GLES, as well as the further implementation required.
The rest of the paper is organized as follows. Section 2 describes in detail the gas–liquid energy storage prototype and measurement setup, including both the thermodynamic model/physics-based simulation model and the application of PV-GLES coupling to a case study (social housing). In Section 3, the results are discussed. Finally, in Section 4 and Section 5, we conclude the paper and present our suggestions.

2. Materials and Methods

To evaluate its employment as an alternative to electrochemical storage, a small-scale prototype of compressed air energy storage based on gas–liquid piston technology was designed, manufactured, and subjected to measurements and tests. The experimental results were used for the validation of a numerical model. The performance of GLES was then evaluated on a daily basis by applying it to a case study building equipped with PV to store the RES excess.

2.1. Gas–Liquid Energy Storage Prototype and Measurement Setup

The prototype, developed at the laboratories of the DIAEE Department of the University of Rome Sapienza (Figure 1), is based on GLES technology (gas–liquid energy storage), and the operation principle is in line with that of other systems that store energy using compressed air.
The vessel is a steel cylinder containing nitrogen, which, at the initial stage, covers the full volume at its disposal. The gas is compressed by an aluminum piston pushed by mineral oil from a reservoir and is made to flow inside the lower part of the cylinder through a pump–motor system. The charging phase continues until the final pressure value is reached, fixed within the limits supported by the cylinder. After a certain time interval, corresponding to the time discrepancy between the availability of the energy source and the demand for energy from the user, the discharge phase begins. The mineral oil flows due to the thrust of the piston, driven by the expansion of the nitrogen previously compressed. In the operating reality, the oil should flow inside a turbine that, in turn, drives an electric generator to produce energy again. The discharge is followed by a second pause phase.
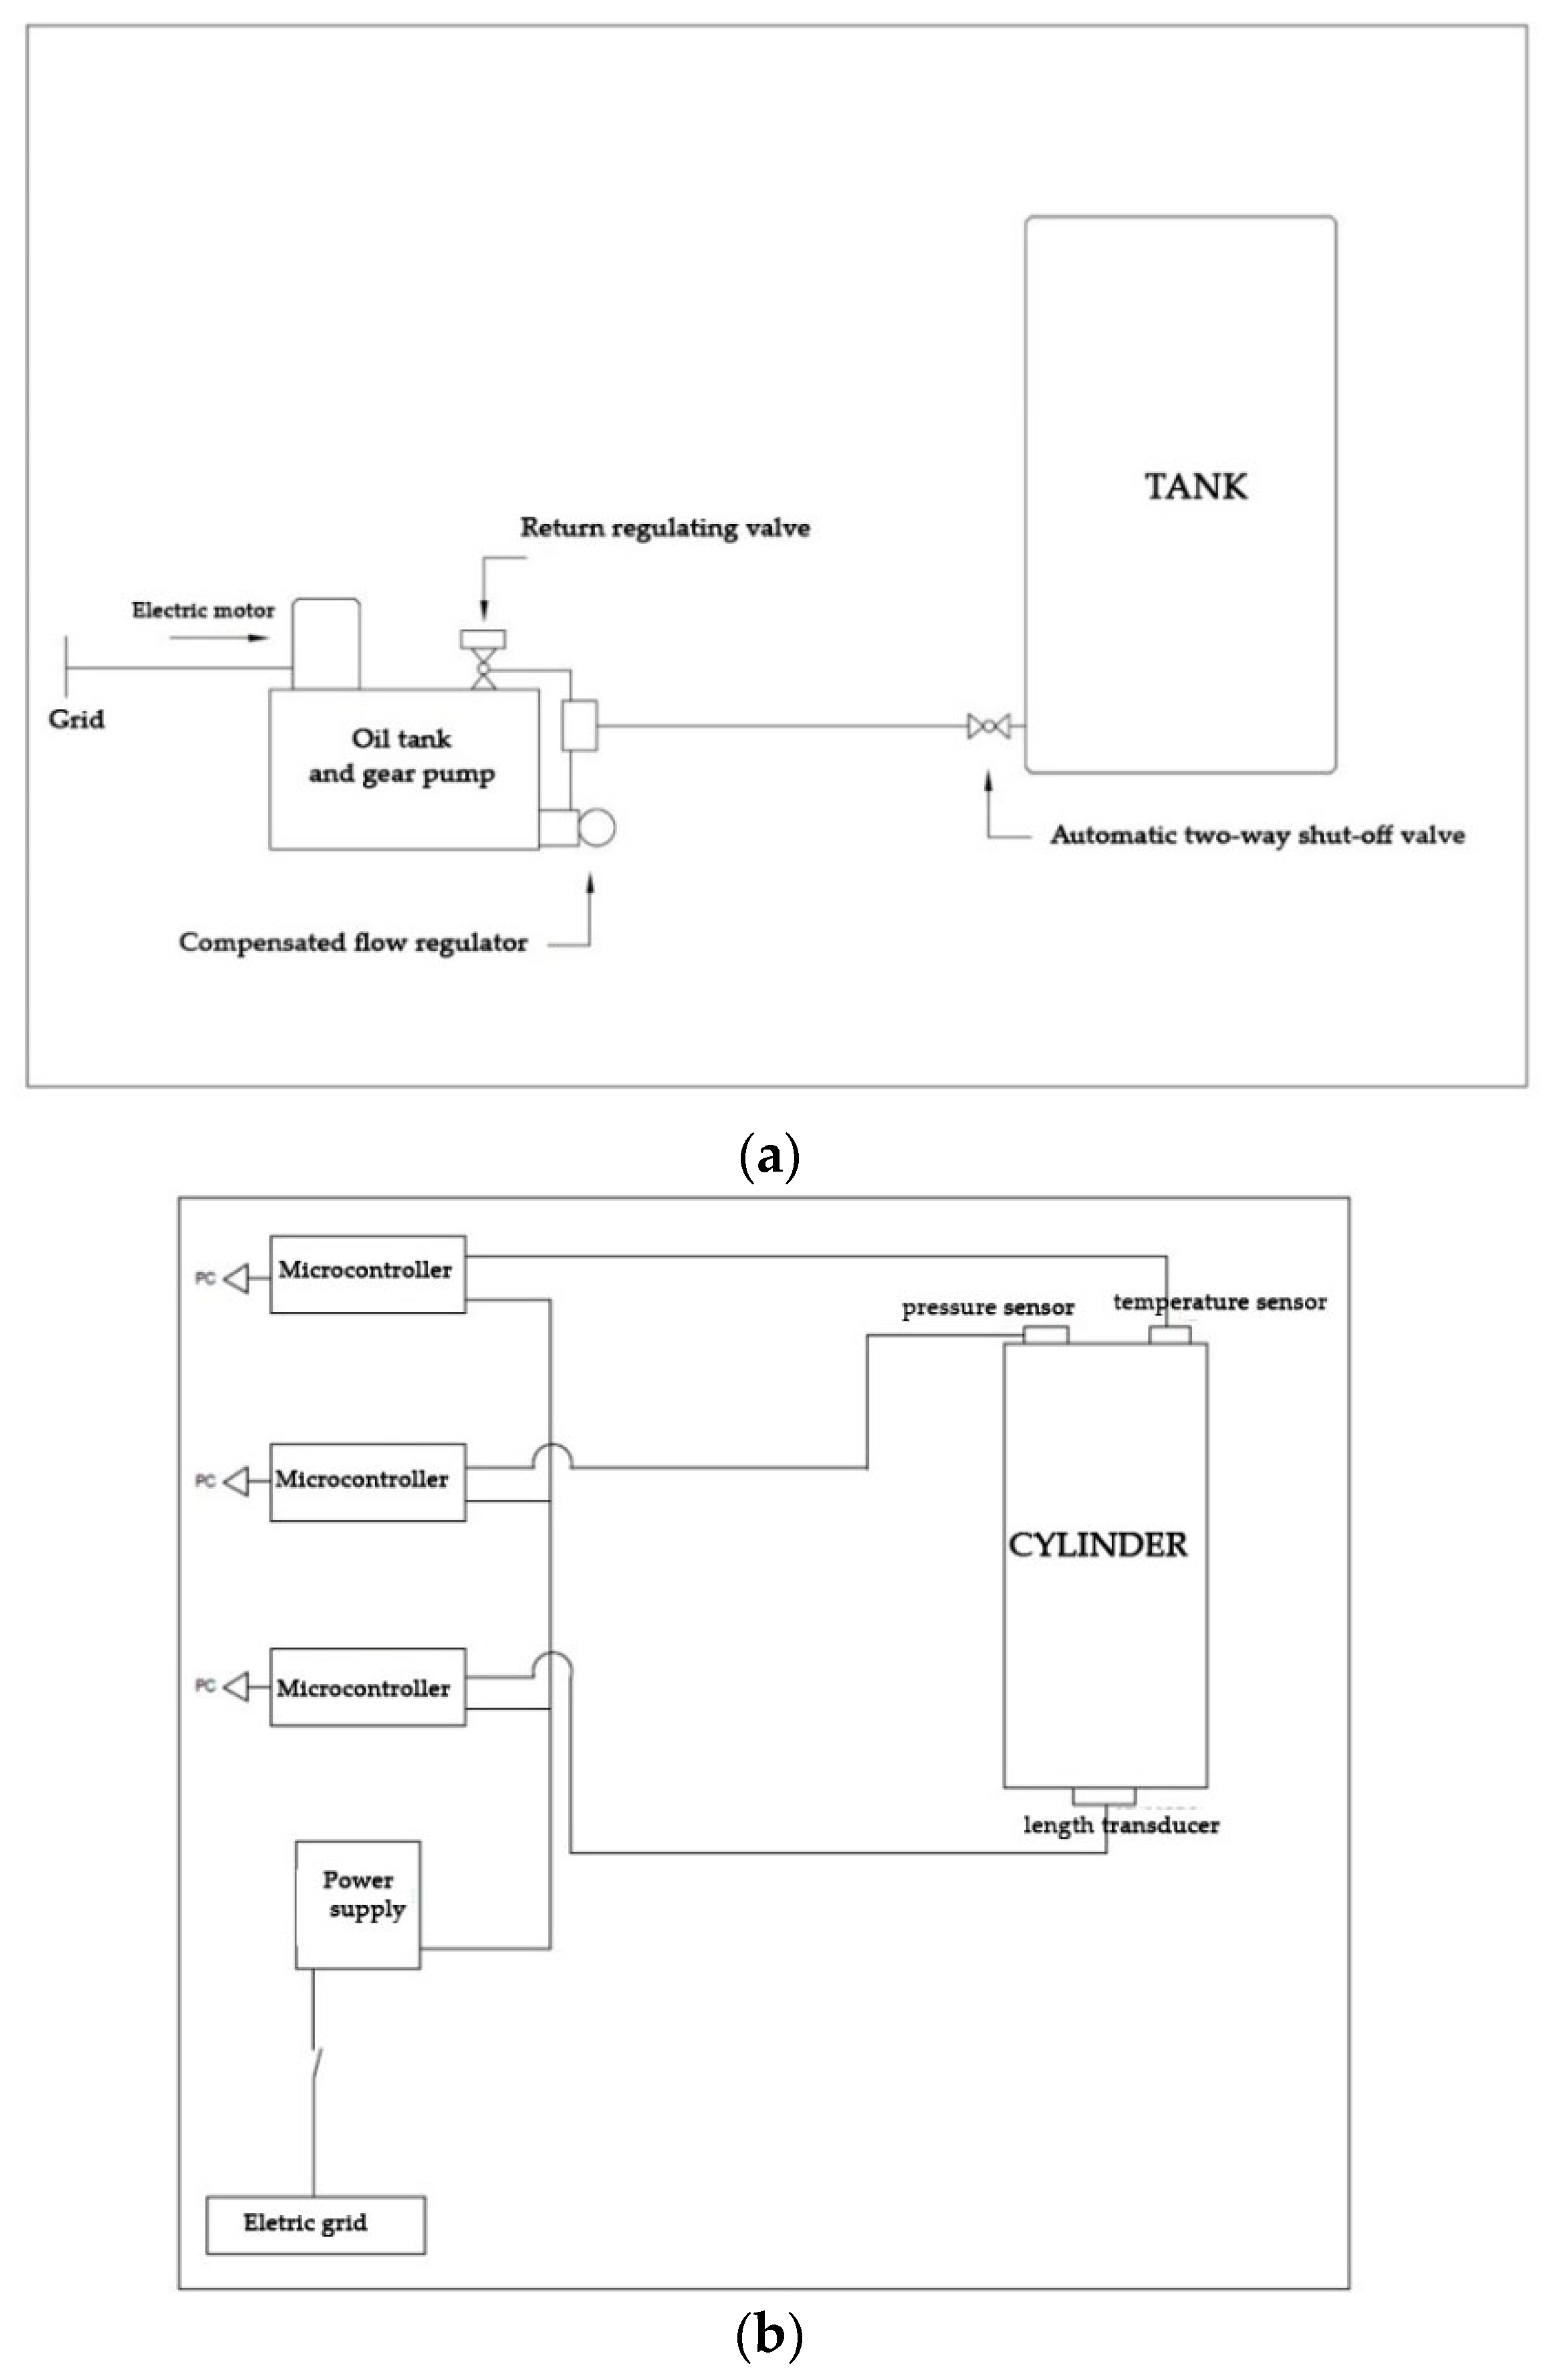
In more detail, the storage method in question is a steel cylinder with a height of 1.067 m and internal diameter of 0.18 m. The aluminum piston inside has a height of 0.134 m and a useful stroke of 0.799 m. On the lower side of the cylinder, there is an opening for the entry and exit of oil, while, at the top, there is another for the nitrogen charge. In the prototype, the oil flow is controlled by the oleo-dynamic circuit shown in the diagram in Figure 2a. A Marzocchi ALP 1D-5 gear pump (Bologna, Italy), with a displacement of 3.5 cm3/revolution and delivering a flow of 5 L/min at a rotation speed of 1500 rev/min, is inserted inside the tank, from which it draws the oil (Eni OSO VG46 hydraulic oil, Rome, Italy), driven by a 0.37 kW SMEM electric motor (Monza, Italy). The selected flow rate is set and kept constant, regardless of load changes, by means of a compensated flow regulator. The inlet and outlet flow of the tank, as well as the post-charge pause phase, are managed by an automatic two-way shut-off valve near the lower part of the cylinder. To release the oil inside the reservoir at the time of discharge, a return regulating valve opens. Turbine and generator elements are not currently present in the prototype. In the discharge phase of the experiments, the pump was moved in the opposite rotation direction, thus producing new electricity.
The cylinder was equipped with temperature probe (K), pressure transducer, and pressure gauge (bar) for gas monitoring, positioned at the top, while, at the bottom, the connection to the length transducer linked to the piston was made, to deduce the volume occupied by the oil (m3) (Figure 2b). A second temperature probe (K) dedicated to oil was inserted at the bottom of the oil reservoir. Each of the sensors was connected to a Pixsys Electronics microcontroller model ATR144 ABC-T (Venice, Italy) equipped with a display for the visualization of the detected data; all four microcontrollers were enclosed in a single case and powered by a Mean Well LRS-100-24 power supply (Breda, The Netherlands) of 100 W-24 V. Measurements were recorded by a computer using a Matlab v. R2021b (https://it.mathworks.com/products/matlab.html, accessed on 12 February 2024) code that uses the Modbus protocol. Details of the sensors are given in Table 1.
During analysis, data on the arrangement behavior, gas temperature, gas pressure, occupied volume of mineral oil and, therefore, the volume available to the gas were monitored. This allowed us to evaluate the efficiency and performance of the system; in detail, at the end of each test, we calculated:
Indicated efficiency: ηin𝑑 = Lexpan/Lcompr;
Total electrical work required: Lelect,in = Lcompr/ηMP;
Total electrical work provided: Lelect,out = Lexpan × ηTG;
Energy density: ED = Lelect,out/Vinitial;
Round trip efficiency: RTE = Lelect,out/Lelect,in.
For both the motor–pump and turbine–generator (hypothetical) groups, efficiency of 85% was assumed. As regards the first group, the efficiency could be increased by up to 90% considering the performance of the hydraulic machines currently suitable for this field. It was chosen to keep to lower values to manage the cost of the device. For the turbine–generator group, the assumed value was in line with commercial products and appropriate for the size of cylinder used.
The procedure we followed to conduct the tests is divided into four phases:
  • Pre-charging phase: the nitrogen pressure is brought to an initial pre-pressurization value of 2.65 bar, acting on the inlet placed on the device head, then the oil is made to flow inside the cylinder until it reaches the desired final pressure value, determined via reference to three pressure ratio (CR) values: 1.5, 2, and 2.5. Each of them is obtained by varying the flow of the inlet oil through a knob present in the compensated flow regulator placed in cascade to the pump.
  • Stabilization pause: after reaching the final pressure, a five-minute break is taken. This time is used to allow the values of the various measured quantities (such as pressure and temperature) to stabilize.
  • Discharge phase: the discharge phase is started by opening the outflow valve. This phase is maintained until the initial value of oil contained inside the cylinder is reached, which is the same as before the charging phase (equal to 0.2 liters).
  • Final Pause: after the discharging phase, a further pause of five minutes is taken to return all the values to the initial levels.
The experimental tests were carried out assuming three values of final storage pressure (4 bar, 5.3 bar, and 6.6 bar) and, for each of them, three different values for the volumetric flow rate of the inlet oil: minimum (1 L/min), medium (1.8 L/min), and maximum (2.6 L/min). The recording of the quantities of interest took place with a sampling interval of 10 s. Two acquisition campaigns were carried out; the system described concerns the configuration used for the second.

2.2. Thermodynamic Model

The main purpose of the numerical model was to be able to carry out parametric analyses of the behavior of the cylinder under examination without having to change the prototype. In this case, the storage model was used to investigate the overall electrical efficiency and the energy produced by the expansion section, considering different nitrogen pressure ranges (/considering the energy absorbed by the compression section).
The model was based on the following preliminary assumptions:
  • Gas behaves like a perfect gas;
  • The temperature of the external environment is constant;
  • The thermophysical properties of the cylinder material are constant over time;
  • The temperature gradient is zero for each element in each direction;
  • Processes occur at a near-steady state.
The thermal exchanges that occur during the operation of the storage system imply that the gas present in the upper part of the cylinder (above the piston) exchanges heat with the outside, above and laterally, through the cylinder walls, and with the cylinder, below; similarly, the oil contained below the piston exchanges heat with the outside, below and laterally, through the walls of the cylinder. Gas and oil interact thermally through the piston. The energy balance reports involving the above heat exchanges are set out below.
The energy variation for the gas over time, in terms of heat, is as follows:
m g a s   c v , g a s   d T g a s d t =   h g a s , o i l A b a s e , a v g , p i s t T g a s T o i l U T , g a s ( 2 π r a v g , T H g a s + A b a s e , a v g , T ) ( T g a s T o u t )   p g a s d V g a s d t  
The last term for the second member represents the compression work for a closed system; this term belongs only to the compression phase because, in the pauses, work is not carried out on the gas, and this does not concern the oil, as it is considered incompressible.
Energy variation for the oil over time, in terms of heat, is as follows:
m o i l   c v , o i l   d T o i l d t =   h g a s , o i l A b a s e , a v g , p i s t T g a s T o i l   U T , o i l [ 2 π r a v g , T ( H t o t H p i s t H g a s ) + A b a s e , a v g , T ] ( T o i l T o u t ) +   m o i l   ˙ c v , o i l   ( T o u t T o i l )
The third term for the second member represents the energy share transferred to the control volume containing the oil, depending on the mass flow of inlet oil; therefore, it is not present in the pause phases.
Energy variation over time, in terms of heat, for the tank part in contact with the gas is as follows:
m T , g a s   c v , T , g a s   d T T , g a s d t = h i n t , g a s ( 2 π r i n t , T H g a s + A b a s e , i n t , T ) ( T g a s T T , g a s )   h o u t ( 2 π r e x t , T H g a s + A b a s e , e x t , T ) ( T T , g a s T o u t )
In the second member, the first term represents the thermal exchange between gas and internal wall of the tank and the second term represents the thermal exchange between the external wall of the tank and the external environment.
Energy variation over time, in terms of heat, for the tank part in contact with the oil is as follows:
m T , o i l   c v , T , o i l   d T T , o i l d t = h i n t , o i l [ 2 π r i n t , T ( H t o t H p i s t H g a s ) + A b a s e , i n t , T ] ( T o i l T T , o i l )   h o u t [ 2 π r e x t , T ( H t o t H p i s t H g a s )   + A b a s e , e x t , T ] ( T T , o i l T o u t )
In the second member, the first term represents the thermal exchange between oil and internal wall of the tank and the second term represents the thermal exchange between the external wall of the tank and the external environment.
Continuity equation for the gas:
d m o i l d t = m ˙ o i l
Continuity equation for the oil:
d V g a s d t = m ˙ o i l ρ o i l
Different heat transfer coefficients appear in the equations. h i n t , g a s , h i i n t , o i l , refer, respectively, to the heat transfer coefficient for adduction between the gas and the inside of the tank and between the oil and the inside of the tank; for their calculation, the Lefevre relationships for a vertical cylinder were used. The h g a s , o i l coefficient is a transmittance due to natural convection on a vertical plane and the heat exchange between oil and nitrogen through the piston. h o u t , on the other hand, considers the heat exchange between the external wall of the tank and the external environment; to evaluate it, it was considered that the system under study placed in a closed environment, where 10 W/m2K represented a realistic value.
The observation of the variables’ evolution was performed by discretizing the balance equations with a time interval of 10 s.
The code calculates compression work (Lcompr) and expansion work (Lexpan), the total electrical work required for the compression phase (Lelect,in), the total electrical work provided by the hypothetical generator, driven by the hypothetical turbine (Lelect,out), energy density (ED) and roundtrip efficiency (RTE).
In addition to the geometry and physical characteristics of the fluids and materials involved that remain constant in the simulations, the variable input quantities are as follows. Their values are obtained from the experimental data from the initial tests (Table 2).

2.3. PV-GLES Coupling for Building Application/Application of PV-GLES Coupling in a Case Study Building

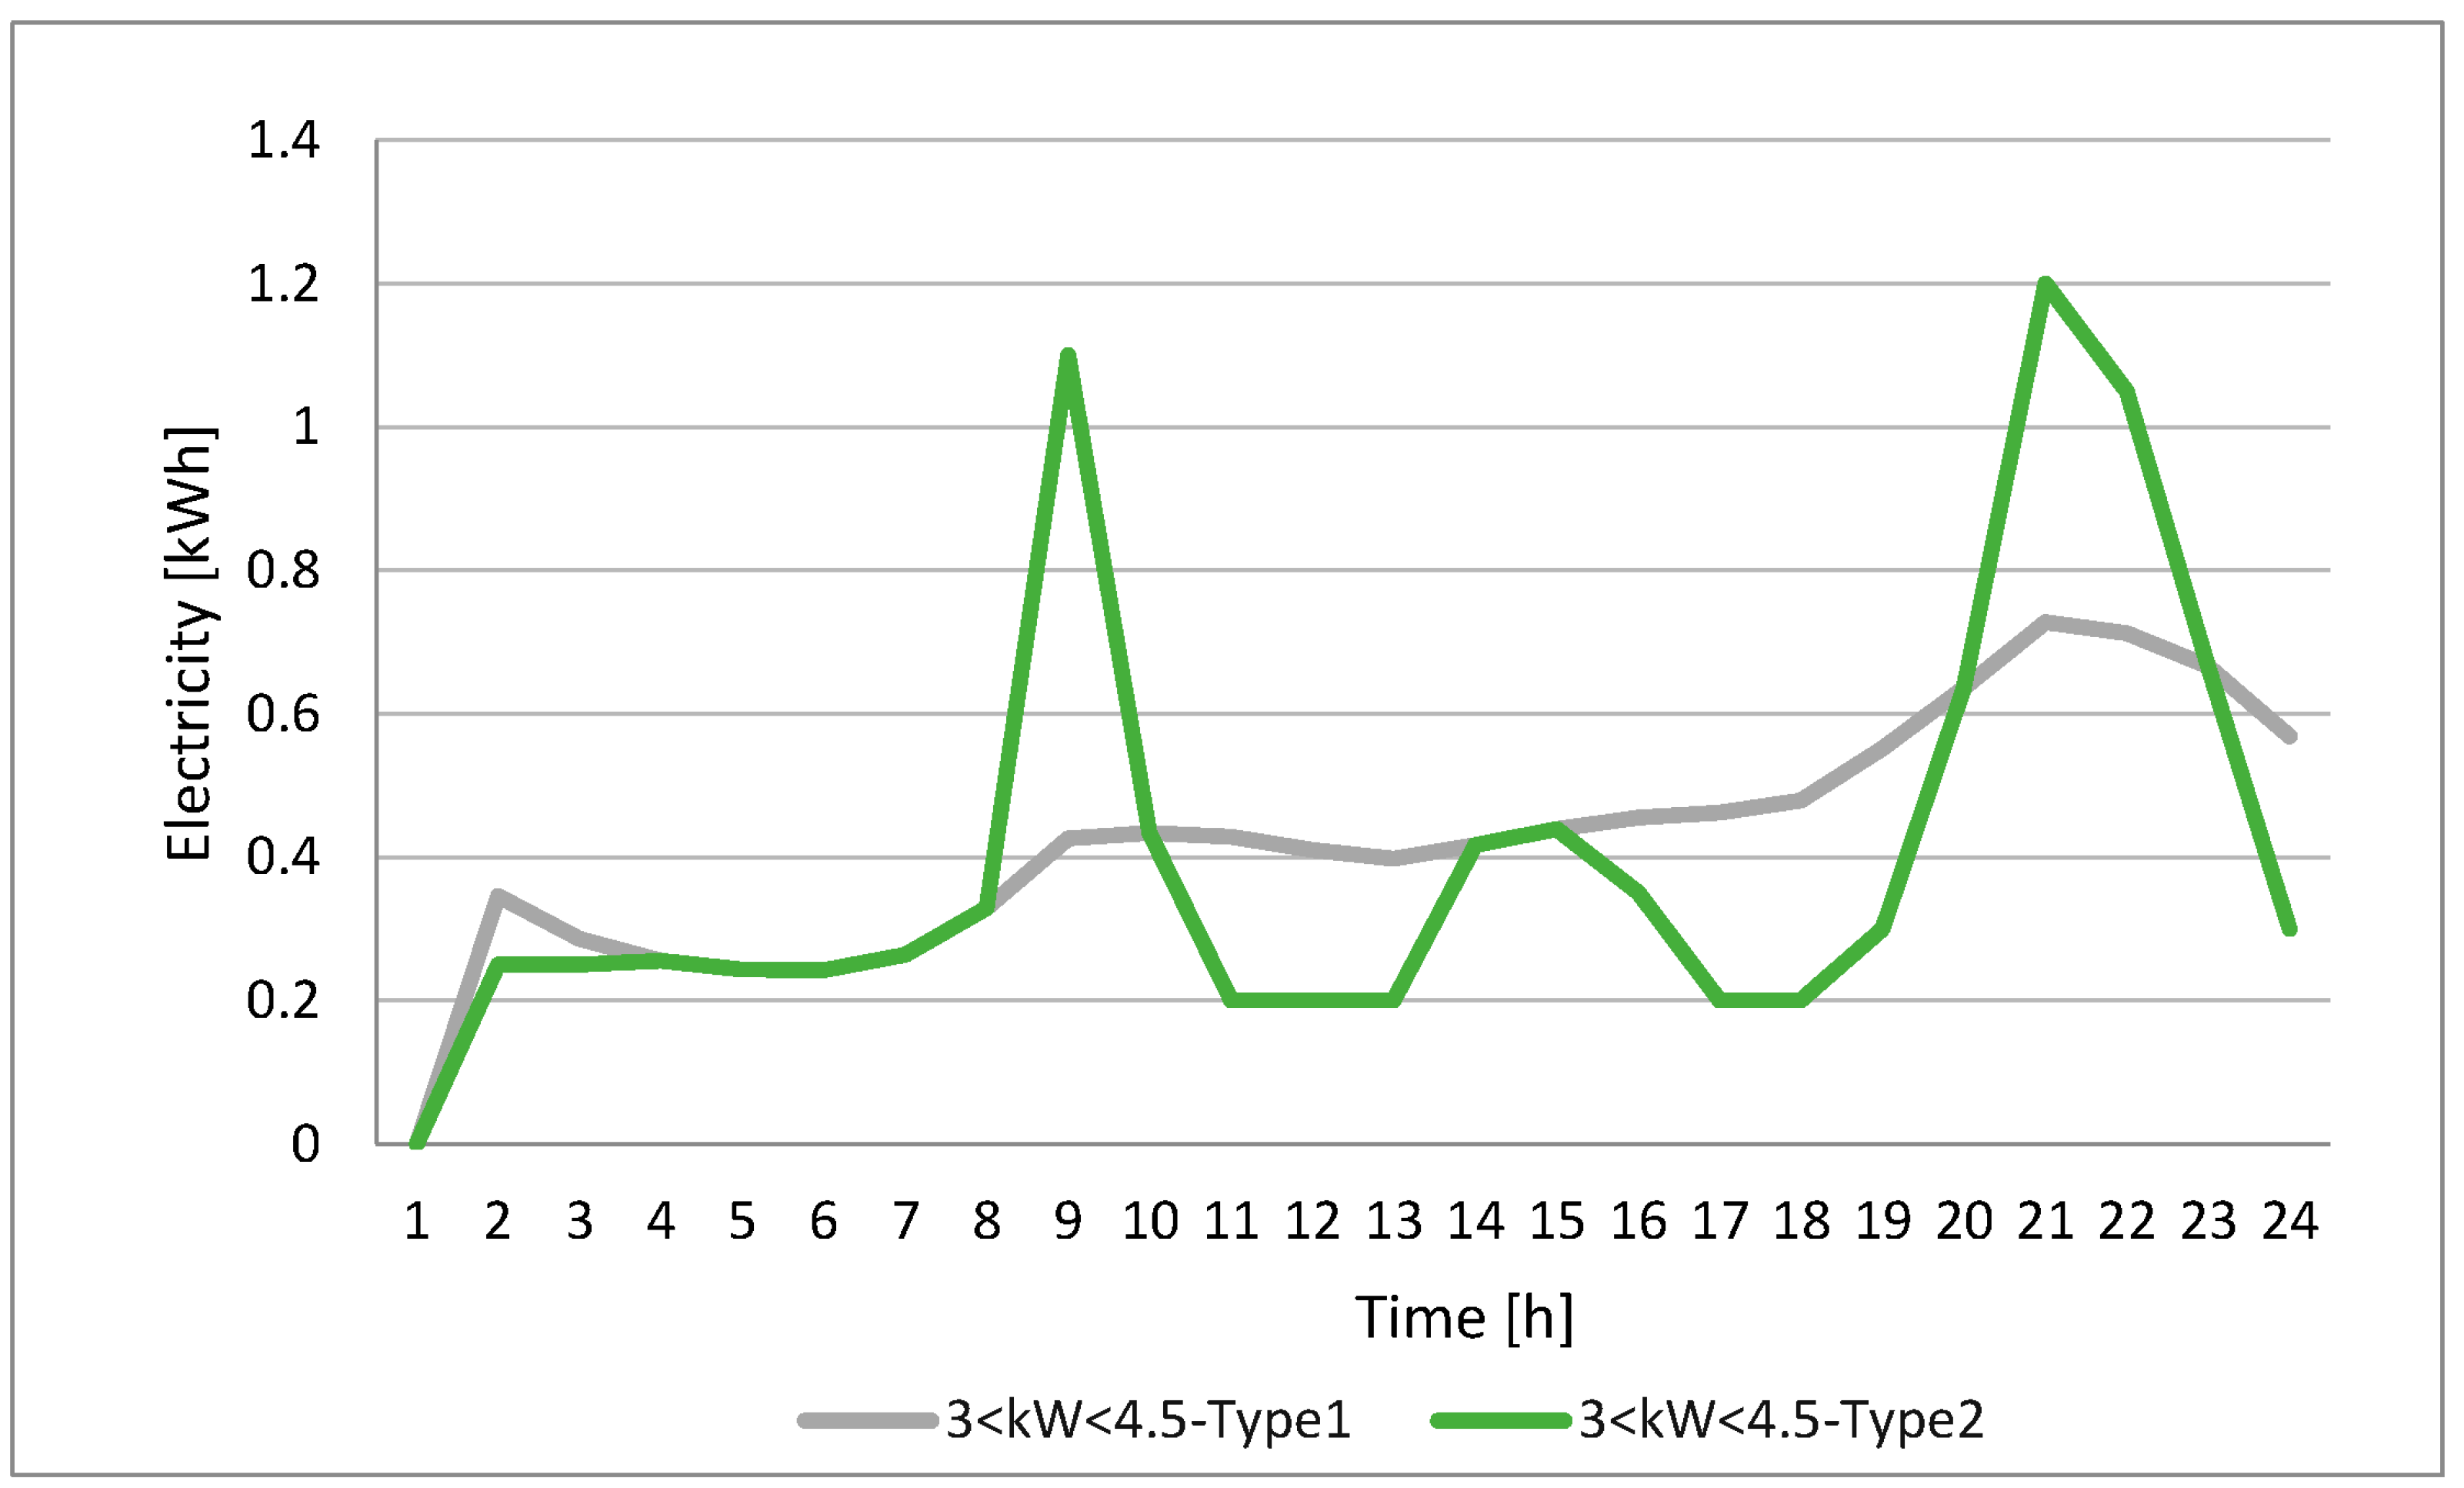
The application of the storage system was planned for a social housing building in Palombara Sabina (Rome, Italy), Central Italy. There are 13 apartments that constitute the building, with areas from 40 to 80 m2. The load profiles of the housing units during a typical weekday of the winter period [34] are those shown in Figure 3. The power class per unit is 3–4.5 kW. The two considered trends relate to two utilization typologies, evaluated in relation to the population actually dwelling in the building: one representative of a family with members who go out to school or work in the morning and come back in the evening (7 apartments), the other tailored to older users who spend much of the day in the house (6 apartments). Type 1 has a total daily requirement of 9.92 kWh, whilst type 2 has a daily requirement of 10.62 kWh. In winter, therefore, the total electrical requirement amounts to 133.19 kWh, of which 85.21 is relative to the 15 h without sun, from 00:00 to 08:00 and from 17:00 to 00:00.
The dimensioning of the photovoltaic system was carried out using the starting point of the needs of the user during the daytime period on a typical winter day (Figure 4), considering, in addition, the energy needed to be stored, for a total of 107.63 kWh.
The storage size is considered based on 70% of the need in hours of darkness, equal to 59.65 kWh.
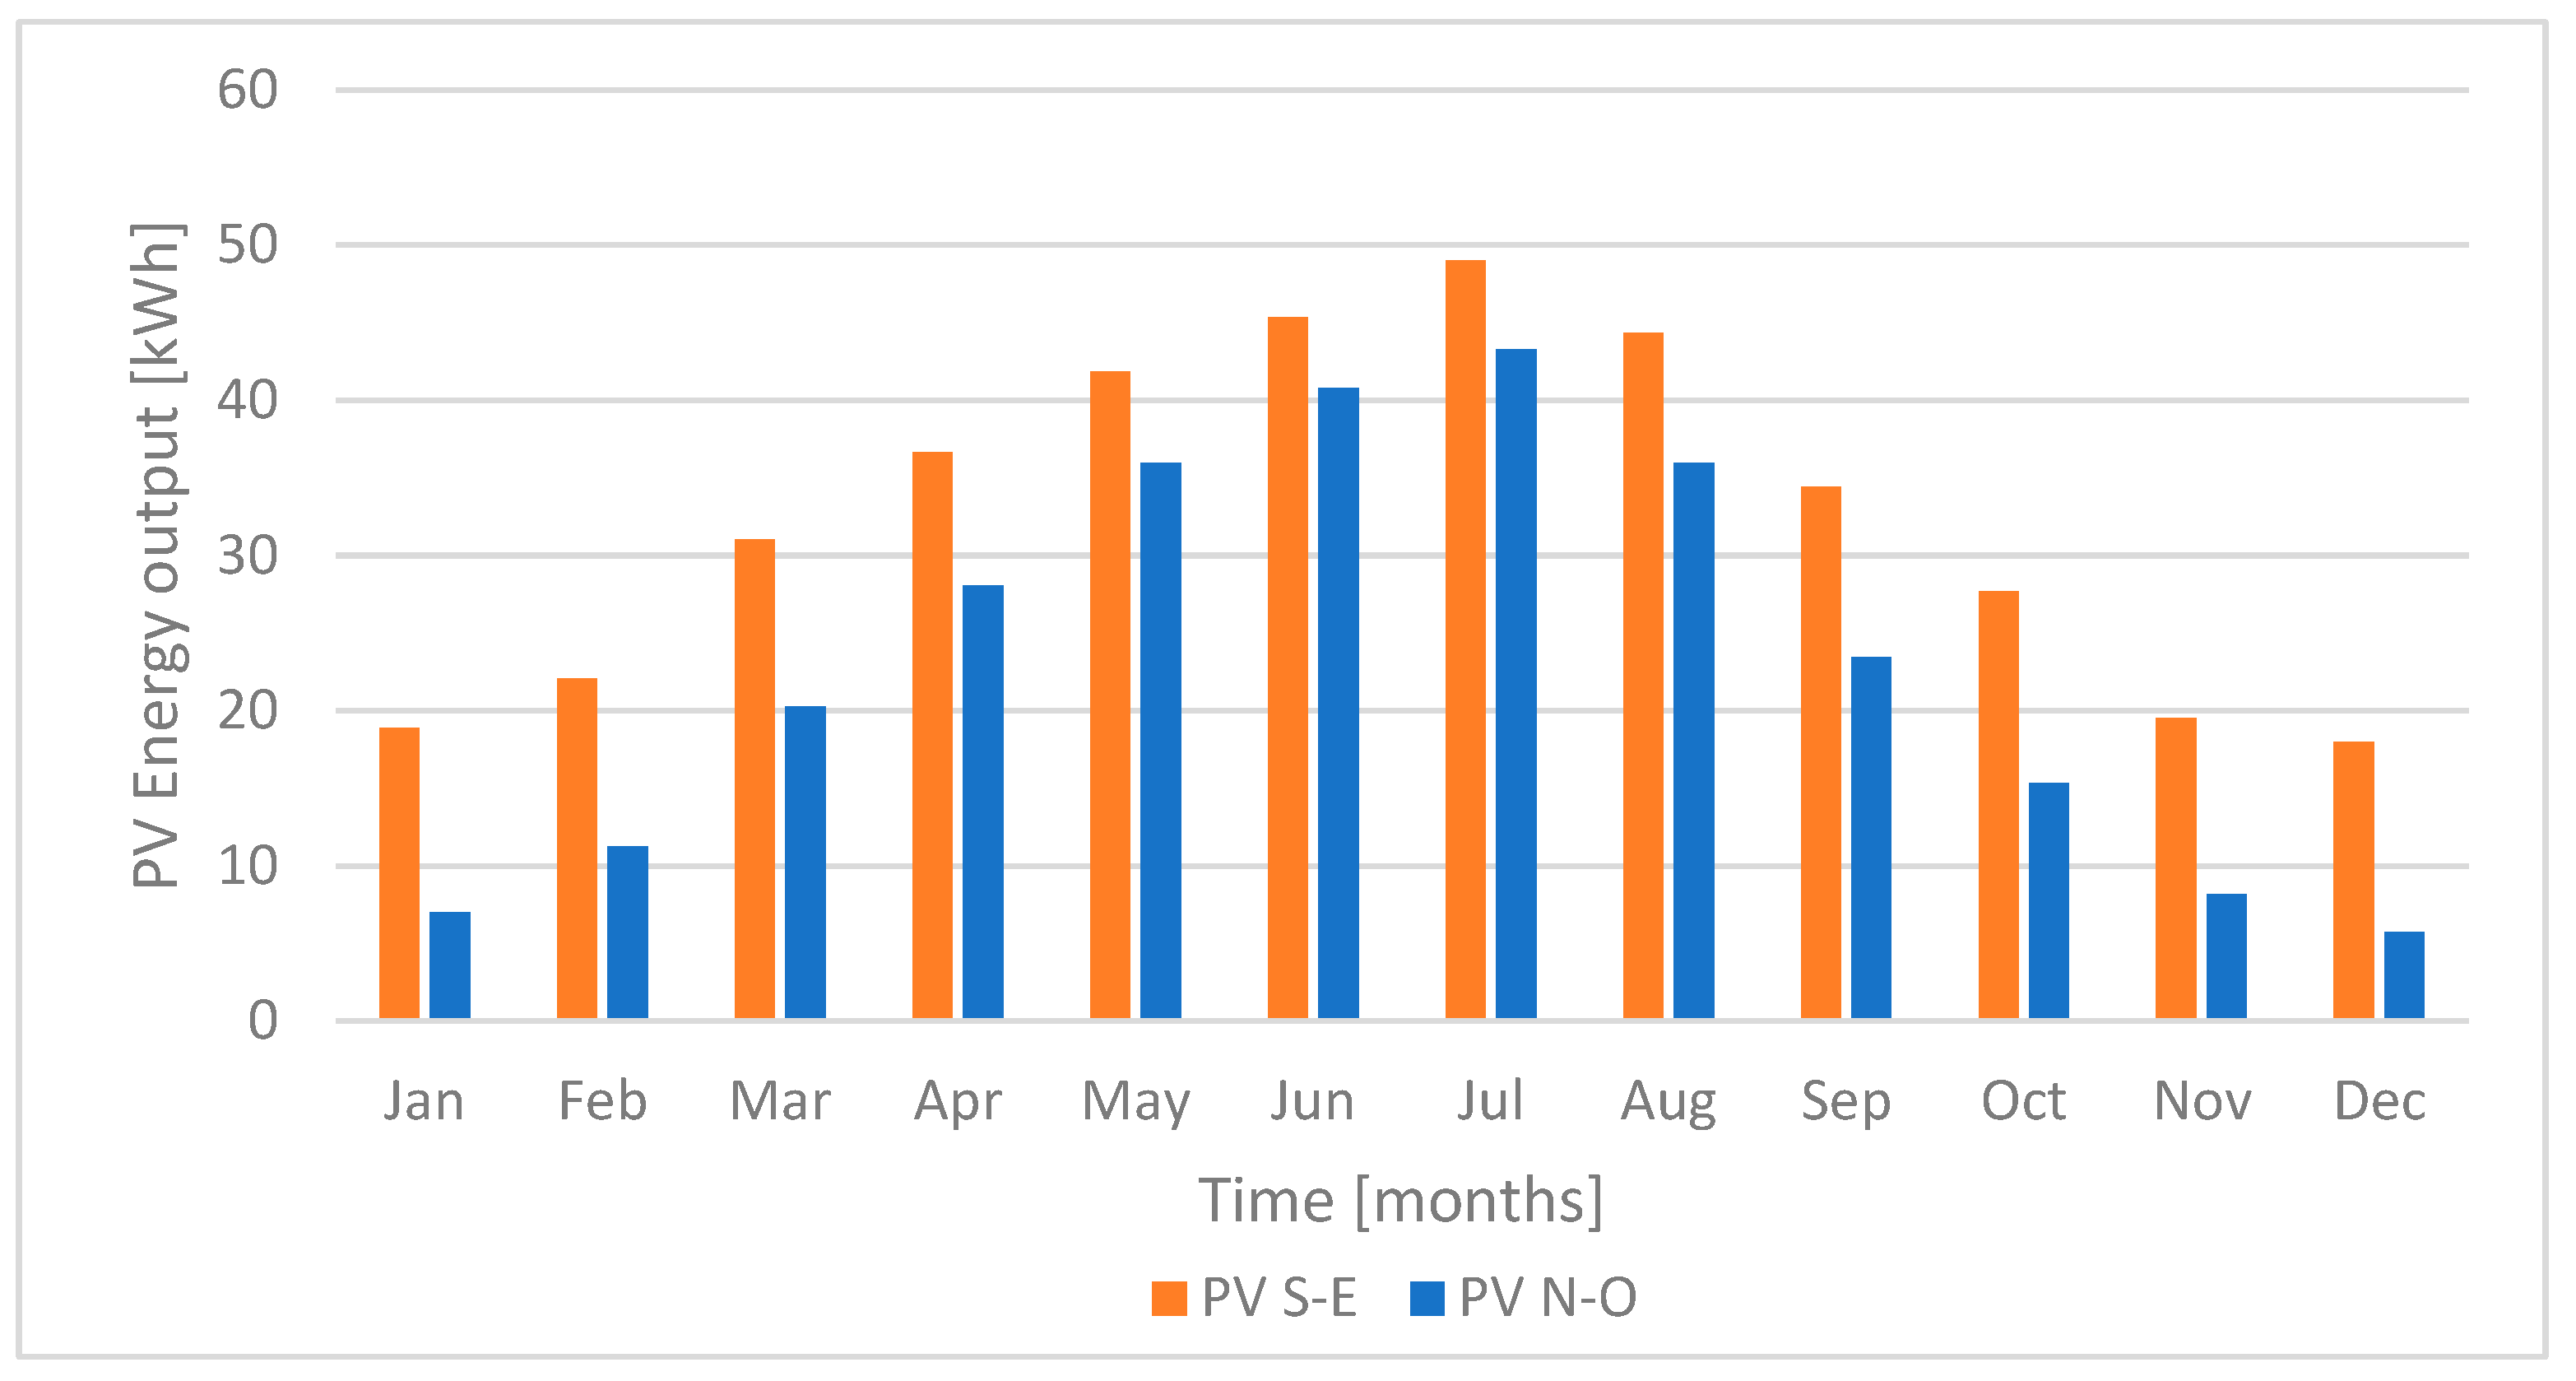
The characteristics of the selected photovoltaic modules, ZNSHINE SOLAR Bifacial Double Glass ZXM6-LDD60-310 (Changzhou, China) [31] in monocrystalline silicon, are 310 Wp (NMOT = 229.7 Wp, STC = 310 W) for an area of 1.66 × 1.00 m2. Considering the application on a duo-pitched roof with S-E and N-O orientation tilted at 25 °C, through PV-GIS tool [9], an average daily producibility in winter of 0.42 kWh/day (0.61 kWh/day S-E, 0.23 kWh/day N-O) was obtained, with a maximum global clear-sky irradiance in Palombara Sabina of 953.11 W/m2 at 11:00.
In Figure 4, the estimated daily production of photovoltaic energy is represented, given by the sum of the photovoltaic systems orientated to the south-east and north-west and the consumption derived from data measured in the years 2018–2022.
Yearly PV module energy production is 388.81 kWh/year if S-E orientated and 275.22 kWh/year if N-W oriented (Figure 5). Since the area available on each pitch is of about 215 m2, arranging them in strings of 5 elements, 135 panels were placed on the S-E pitch, and 120 panels were placed on the N-W pitch, for a total occupied area of 408 m2. The installed power of the plant is equal to 79 kWp.

3. Results

3.1. Experimental Results and Model Validation

During analysis of the system behavior, several quantities were monitored and recorded: gas and oil temperature, gas pressure, the volume occupied by mineral oil, and, thus, the volume available for gas. The trends of the variables of interest were presented in comparison tables for each final pressure value and the minimum flow rates (Table 3). The gas temperature follows the expected cycle: it increases during charging, returns to the initial value during the post-charge phase, decreases during discharge, and finally returns to the starting value during the second pause.
In the case of the set of tests with a final pressure of 4 bar, for all three mineral oil flow rates, a temperature fluctuation of about 2 °C during charging can be observed, while, during discharge, the temperature decrease grows with the increasing flow rate, moving from a fluctuation of 1 °C at minimum flow to about 6 °C at maximum flow. The trend at maximum flow is slightly “lower” compared to that at medium flow because the latter was carried out later; hence, it had a higher oil temperature, which consequently implied an increase in gas temperature, as well. Deepening the oil temperature, in all three cases, there is an increase during the charging phase; the trend in the test at a higher flow, around 21 °C, remains lower than the other two (varying in the range 23.3–24.5 °C) because it was conducted first. Also, the pressure trends throughout the entire operating cycle are in line with the expectation. After charging, in the post-charge pause, we see a decrease in gas pressure inside the cylinder, due to the settling of motions once compression is finished; this is about 2% in all three cases. The volume trends, both for gas and oil, turn up linear during the charging and discharging phases and, at the same time, the slope of the charging line increases as the oil inflow rate rise. The pressure–volume graphs for the gas, from which we extract the data for expansion and compression, are almost perfectly superimposable since the initial and final pressure and volume values are the same (Table 3), and the pressure trends are also identical. Wanting to evaluate the differences in charging and discharging times with the tests from the first experimental campaign, in which the cylinder was positioned horizontally, in all three cases, the duration of the charges is slightly longer compared to the first campaign (by 4.9%, 3.1%, and 7.8%, respectively), while the discharges for 1 L/min and 1.8 L/min are noticeably longer and that for the maximum flow rate, instead, is 6 s slower than the corresponding test of the first campaign. These results could be due to the vertical positioning of the cylinder in the second data acquisition. Indeed, this configuration might make charging slower and more difficult while, at the same time, facilitating the discharge phase by also using gravitational pull. Almost identical RTE and ED values were obtained for all three tests, corresponding to 79.38% and 0.019 kWh/m3 respectively (Table 3).
In the three tests with the intermediate final pressure (5.3 bar), the temperature trends are the same as in the 4-bar tests, but with clearly longer times for both the charging and discharging phases. The thermal fluctuation during the charging phase is slightly greater than in the 4-bar cases (between 2.5 and 3 °C), while those during the discharging phase are more contained compared to the previous three for all flow rates. These fluctuations were more pronounced in the three corresponding tests in the acquisition campaign with the horizontal piston configuration. In this case, too, we see an increase in oil temperature in all tests. The pressure also follows the same trend as the previous cases in all four phases of the cycle. The pressure losses during the pause after charging, with the increasing flow rate, are 2.63%, 2.6%, and 2.8%, respectively; these values are slightly higher than the three cases seen previously. Here too, the volume trends are linear, and the pressure–volume diagrams are superimposable onto each other. Also in this care there is a longer duration of the charging phases compared to the corresponding tests of the first acquisition campaign. In percentage terms, the three charges are higher by 8.6%, 8.7%, and 17%, respectively; the discharging phases, however, are only a few seconds faster. Compared to the 4-bar final pressure cases, the RTE values are only one percentage point lower, while the energy density values are higher, around 0.035 kWh/m3 (Table 3).
In the last series of tests, with the higher compression ratio (6.6 bar), the same trends as in the previous tests were obtained, but clearly with longer charging and discharging times. The thermal fluctuation of the gas during the charging phases for the first two flow rates turns out to be different compared to other tests with a lower compression ratio, while it aligns for the third test, at a higher flow rate. This is because the third test was conducted first, and thus had a lower oil temperature compared to the others. The same applies to the thermal fluctuation during the discharging phase. Pressure’s decreases during the discharging phase are in line with those at a compression ratio of 2: 2.87%, 2.26%, and 2.71%. The volumes maintain their linear trends, both in charging and discharging, and the oil volume at the end of charging remains essentially the same, of 10.7 l, for all three flow rates. Here too, the gas pressure–volume diagrams overlaps. Also in this case, the charging times are longer compared to the corresponding tests for the horizontal storage, increasing by 11.1%, 13.7%, and 36.7%; the discharging phases are the same or, at most, differ by a couple of seconds. The RTE values are one percentage point lower than the tests at a lower compression ratio, but still very similar for all three flow rates and consistent with the three tests in the first series. The same applies to the energy density, which now has a value of around 0.048 kWh/m3 for all three flow rates (Table 3).
In addition the table points out that the oil volume increases as the compression ratio increases, and it is greater for smaller flows.
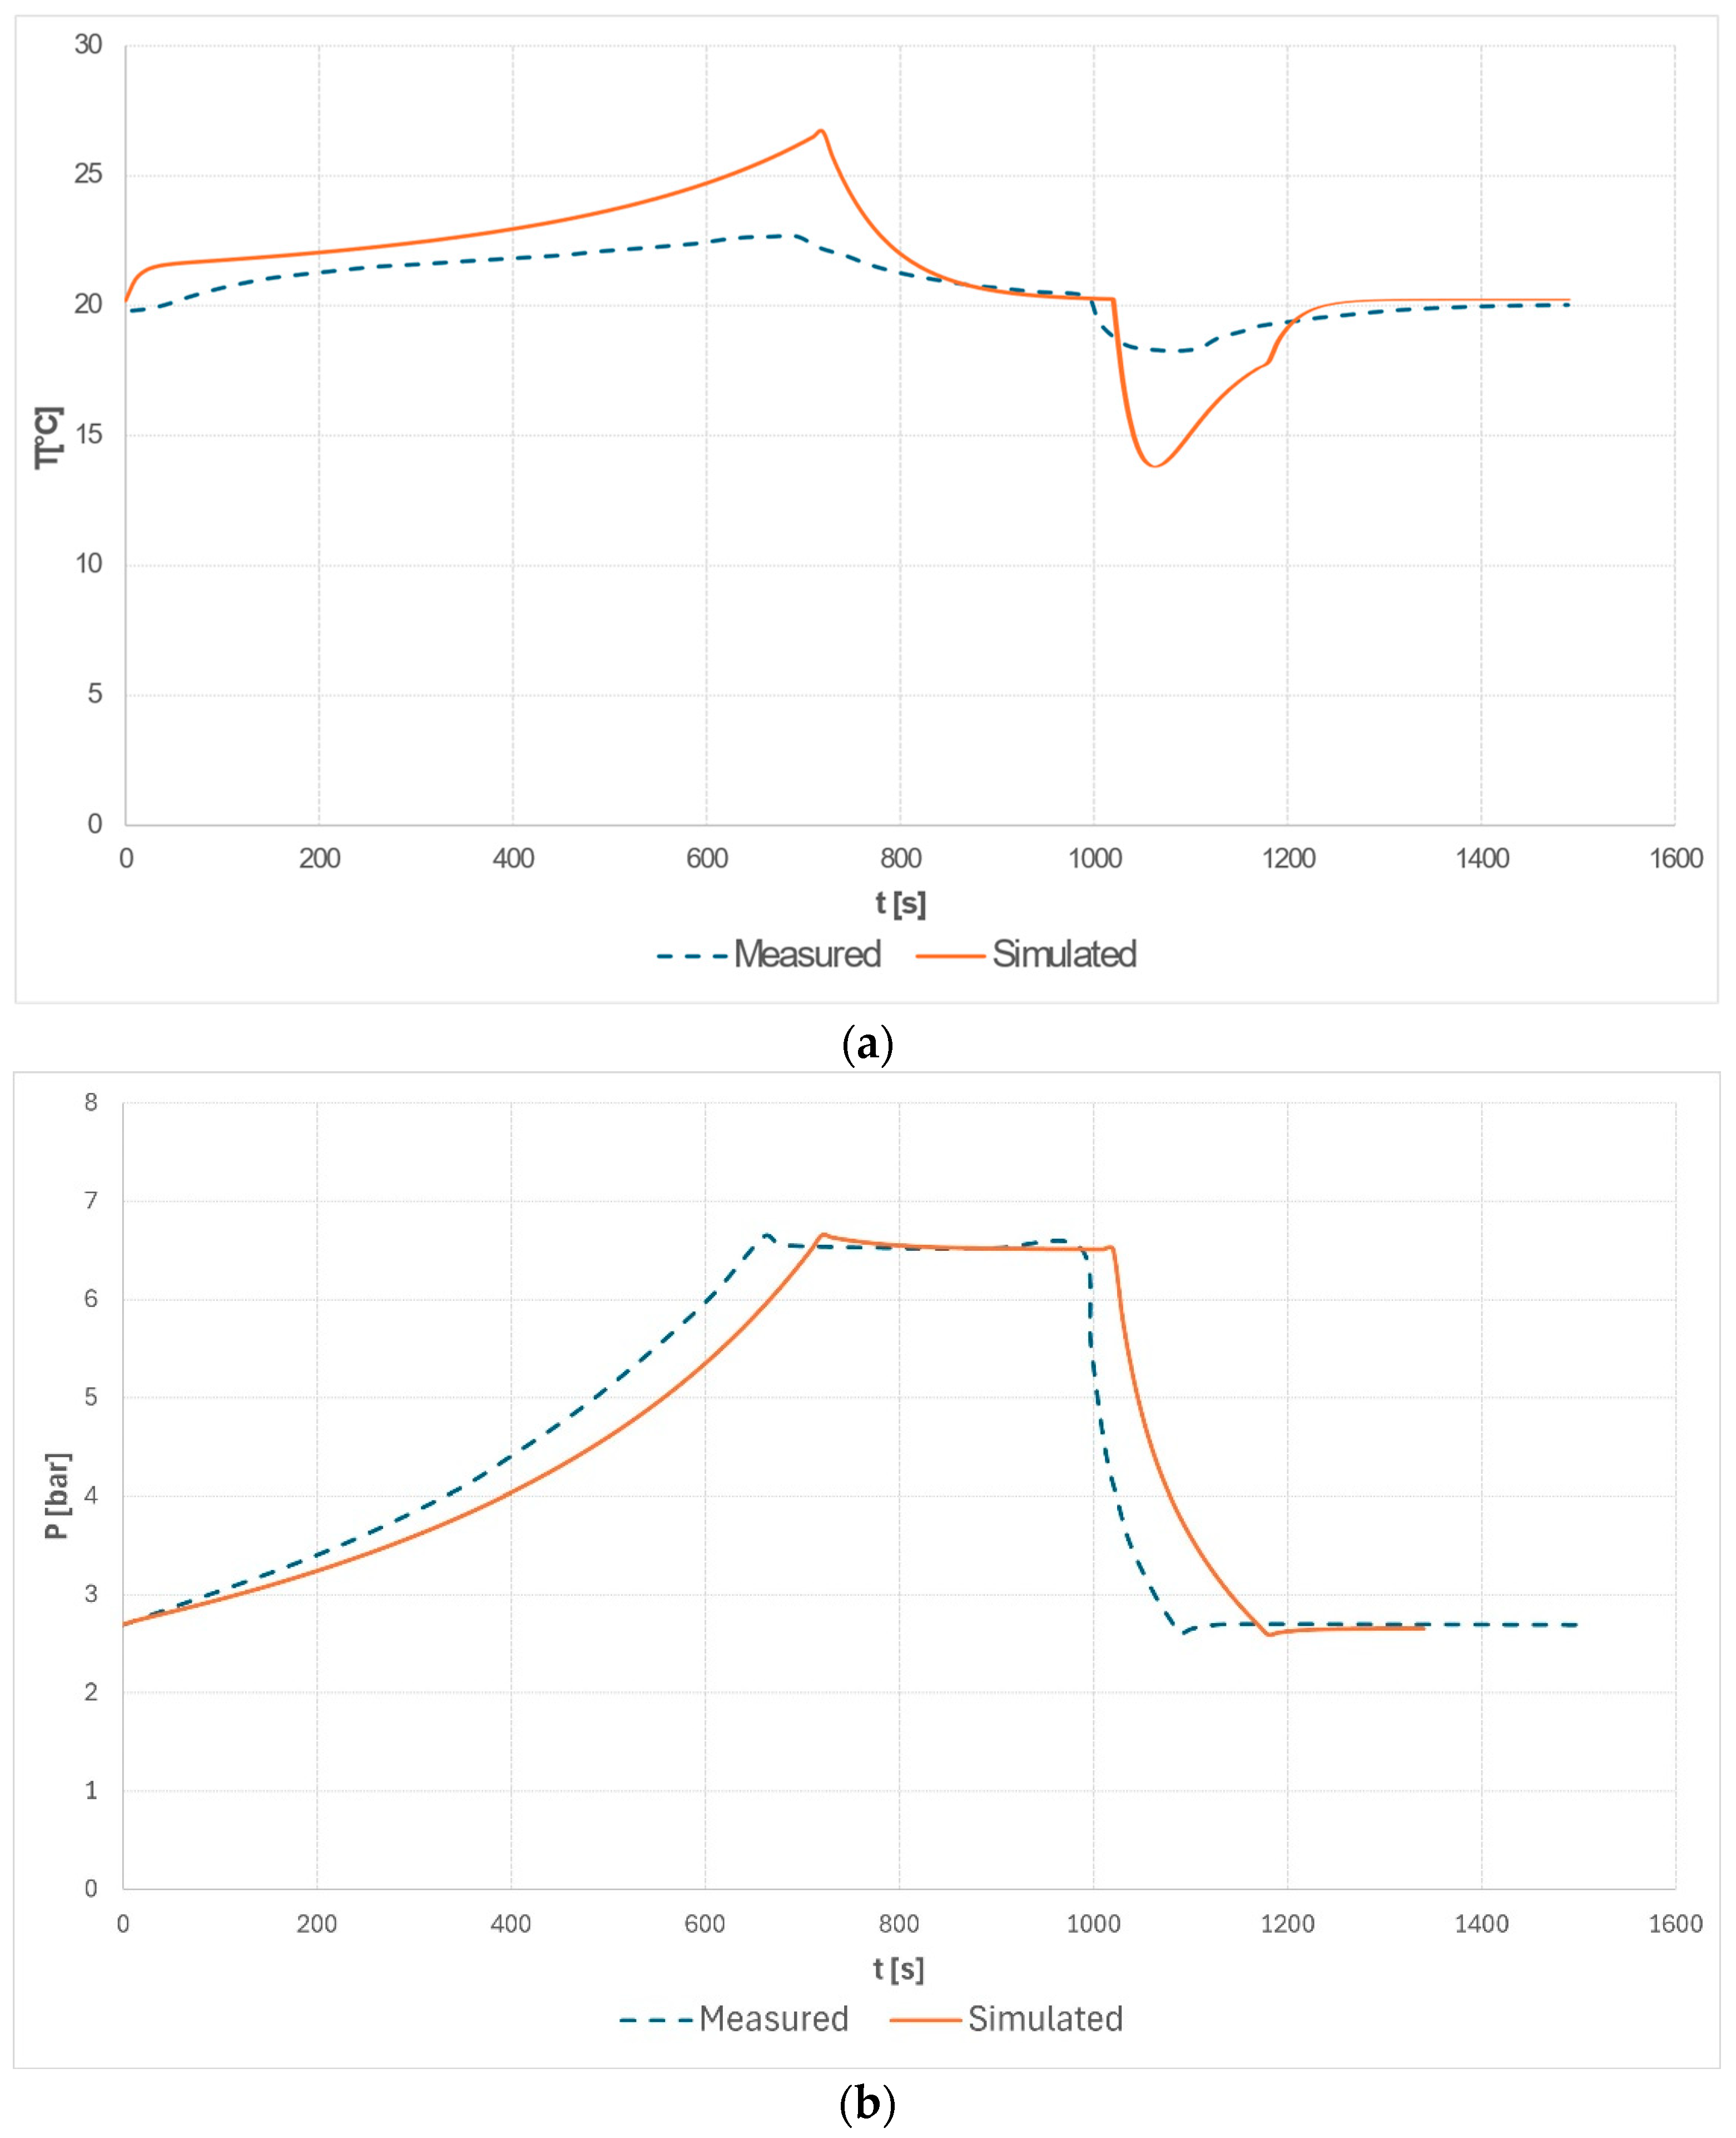
The optimal results (ED = 0.048 kWh/m3), obtained for the minimum mass flow rate, 1 L/min, and maximum outlet pressure of 6.6 bar, corresponding to a compression ratio of 2.5, were used for validation (Figure 6).
Observing the comparison charts, it is noticeable how the simulated temperature trend (Figure 6a) differs from the experimental results, especially during the discharge phase. During charging, the simulated temperature rises faster but settles at values not too far from the real ones, diverging at the end of compression by about 4 °C, which, in Celsius terms, leads to an error of 13%. In both the measurement campaign and the numerical model, within five minutes of post-charge pause, the gas returns to the initial temperature. In the discharge phase, the simulations show a negative difference of about 4.5 °C compared to the experiments.
As for the pressure, however (Figure 6b), we see that the simulated trend through the code is very similar to the experimental one but always shows slightly more contained variations both at the end of charging and at the end of discharging. There is a delay in reaching the peak pressure during charging and in returning to the initial pressure during discharging by the numerical model of about 10 s, related to the chosen temporal discretization step. From Table 4, it is possible to see that there is an underestimation of both the electrical work input and output, with an error of 10% and 13%, respectively. Despite this, the works remain proportional to each other, and this is also confirmed by the results obtained regarding the RTE: in fact, the error between the real trend and the simulated one remains below 2%. Having used the same efficiencies for the pump–motor unit and for the turbine–generator unit, the errors for the hydraulic works of compression L c o m p r , r e a l = 4.47 × 10³; L c o m p r , s i m u l = 4.94 × 10³) and expansion ( L e x p a n , r e a l = 4.19 × 10³; L e x p a n , s i m u l = 4.77 × 10³) are the same as those for the electrical work input and output, respectively, and the error of the indicated efficiencies is in line with that of the RTE.
Regarding energy density, in this case, an underestimation also occurs. In conclusion, having obtained a maximum deviation around 10% for all the parameters examined, the numerical model can be considered validated.

3.2. Thermodynamic Performance

Four operating scenarios were simulated, modifying the pressure ramps within the steel cylinder and the compression ratios. In this case, the storage was hypothesized to have a radius of 0.18 m and a height of 2.5 m.
In the first two cases, the starting point was 70 bar, and a compression ratio of 1.9 (70 bar to 130 bar) was first applied, and then 1.4 (70 bar to 100 bar); an analogous compression ratio to the second test, 1.3, was then applied, but acting in the upper part of the range identified in the first test, setting the max pressure outlet to 130 bar (100 bar to 130 bar). Finally, the compression ratio was maximized to 4, extending the entire range of working pressures, acting both on the minimum pressure inlet and maximum pressure outlet (50 bar to 200 bar). Figure 7 shows the transient gas temperature through the simulations. Regarding the input data, some clarifications are necessary. First, to have comparable tests, all temperatures were set to 28 °C: thus, at the initial instant, the gas, the tank, the oil, and the external environment are all in thermal equilibrium at the same temperature.
As evident from comparing B and C that, for the same pressure increase, the Tmax reached is greater as the compression ratio (p*) increases: from p* 1.3 to 4, the temperature increase rises from 5% to 19%. The concavity assumed by the curves as they approach the Tmax is related to the heat exchange with the external environment. Having attributed a duration (5 min) in all simulations, the post-charge pause occupies the same time range.
As the maximum temperature reached in the charging phase increases, so do the heat losses to the external environment, as evidenced by the temperature decreases in the pause phase, set at 5 min. The simulations starting from the same pressure value (Figure 8) have overlapping curves; starting from a higher pressure (curve B, 100 bar), the simulation reaches maximum temperature faster (20 s) and, conversely, takes 38 s to return to the initial volume.
Table 5 summarizes the energy results for the four GLES simulations. As expected, the greater ED is achieved in the case where the pressure range is wider (Case 4), immediately followed by Case 1: the greater difference between maximum and minimum pressure causes L e x p a n and L c o m p r to be higher than those obtained in other cases. Looking at Case 2 and Case 3 it is possible to see that for similar compression ratios, ED is higher when higher end pressures are reached. The highest RTE is for the lower compression ratio (Case 3, followed by Case 2).
Comparing the results obtained in terms of ED with those of [22] for the same pressure ranges, for Case 1, 2, and 3, Δ1 = 0.5, Δ2 = 0.3, and Δ1 = 0.3 are obtained, respectively, where the highest values belong to the GLES designed in this study. The discrepancies, attributable to the different dimensional ratios of the pressurized vessels (0.25 m3 for the one analyzed here, three elements of 0.5 m3 in [28]) become smaller as the difference between the initial pressure and final pressure decreases.

4. Discussion

The GLES performance was evaluated on a daily basis, considering a typical winter day: peak electrical demand, minimum PV production (350 Wh/m2 day). For the sake of a basic comparison, a storage system sized based on the performance of the best alternative among the four simulated, with an ED of 1.4107 kWh/m3 (see Section 3.2), was compared to a commercial lead-acid battery storage system.
The required storage capacity is met by 50 lead-acid batteries, each with a voltage of 12 V and a capacity of 200 Ah, considering a DOD (depth of discharge) of 50% to ensure a longer lifespan, at the expense of a greater number of units. For these batteries, a system efficiency of 88% was assumed, given by an inverter efficiency of 92%, and battery efficiency of 96%. Considering units of dimensions 0.52 m × 0.24 m × 0.24 m, the total volume reserved for battery storage is 1.49 m3. Given the configuration that ensures the highest work of expansion, equal to 340.5 Wh for compression from 50 to 200 bar, it is possible to estimate a number of gas-liquid storages to meet the domestic need of the case study equal to 175 units. Having sized the devices with a radius of 0.18 m and a height of 2.5 m, the surface area required for their installation is equivalent to 22.70 m2.
The GLES is quite far from parity compared to electrochemical energy storage in terms of energy efficiency, mainly due to the pressure ramps within which it can operate. On the other hand, its operability is not comparable to that of batteries: its lifetime exceeds 20 years, whereas batteries under the previously considered conditions guarantee 4000 charge-discharge cycles, equivalent to a lifespan of 22 years, for a storage system operating on a daily basis, and anyway, for conventional operation with an 80% DOD, the number of charge/discharge cycles would be 2000, corresponding to 7 years of use [32].

5. Conclusions

The study analyzes the behavior of gas within a steel cylinder during the compression and expansion cycles to which it is subjected, to understand the potential of this new storage technology. A crucial aspect is the experimental analysis of a small-scale GLES.
Simulation data are applied to a case study building, which is a social housing building in Palombara Sabina, a town located in Central Italy (42.067″ N, 12.766″ E). Fundamentally, the suggested technology proves superior to a conventional battery in terms of lifespan, although with a lower energy density for an equal amount of satisfied demand.
In detail, the major findings can be summarized as follows.
As regards the numerical model:
  • The simulated temperature trend differences from experimental results should be reduced, particularly during the discharge phase. The charging phase shows a faster temperature rise, settling relatively close to real values but diverging by 13% at the compression end.
  • Smaller variations occur in simulations, with a delay of about 10 s in reaching peak pressure during charging and returning to initial pressure during discharging due to the chosen temporal discretization step.
As regards parametric analysis on pressure ramps and compression ratios, assuming a storage radius of 0.18 m and height of 2.5 m:
  • Higher compression ratios (p*) led to a greater maximum temperature (Tmax) reached by the gas during pressure increase: the Tmax increased by 19% as p* triplicated.
  • Simulations starting from the same pressure exhibited overlapping curves; however, starting from a higher pressure (curve B, 100 bar) meant that the maximum temperature was reached faster (20 s) and it took longer (38 s) to return to the initial volume.
Concerning the GLES building application, considering a typical winter day:
  • The gas–liquid storage units required to meet domestic needs were 175 (energy density (ED) of 1.4107 kWh/m3, volume 0.25 m3), requiring a surface area of 22.70 m2 for installation; the same storage capacity can be met by 50 lead–acid batteries (12 V, 200 Ah, commercial dimensions), for which must be reserved a total volume of 1.49 m3.
  • The lower energy efficiency of the GLES system in comparison to electrochemical energy storage can be attributed to the pressure ramps that it operates within.
The experimental setup can be further implemented by inserting a turbine–generator system to evaluate the real efficiency of the entire system in the field. The technology can be improved starting from simple interventions on auxiliary components. From the experimental results, we observed how the use of low flow rates allowed us to limit the electrical compression work required and avoid the unnecessary overheating of the mineral oil.
An alternative involves the use of another gas instead of nitrogen: for example, carbon dioxide in its saturation conditions (57 bar at 20 °C). During compression in a saturated condition, CO2 tends to transition from gas to liquid phase, thus reducing its volume in the storage tank, allowing for a greater amount of incoming oil, which will then be available during expansion, ensuring greater electrical work. However, this would require operating in gas saturation conditions, and, thus, trying to maintain conditions that are as isothermal as possible.
Finally, the implementation of a thermal recovery system can be considered: for instance, the use of a coil system that wraps around the cylinder in such a way as to exploit the warm and cold thermal flows that occur during the charging and discharging phases. In this way, we introduce our system into a poly-generation discussion, thus combining electrical production with thermal production. Further developments also include the deeper exploration of the economic aspects related to the system and its sustainability.

Author Contributions

Conceptualization, A.V., M.D.M. and C.V.F.; Data curation, A.V., F.N. and C.V.F.; Formal analysis, M.D.M. and L.P.; Investigation, A.V., M.D.M. and C.V.F.; Methodology, A.V. and C.V.F.; Software, F.N. and C.V.F.; Supervision, A.V.; Validation, F.N.; Writing—original draft, A.V., L.P. and C.V.F.; Writing—review and editing, A.V., L.P. and C.V.F. All authors have read and agreed to the published version of the manuscript.

Funding

The work of C.V. Fiorini was funded by the European Union Next Generation EU under the PNRR (National Recovery and Resilience Plan—NEST “Network 4 Energy Sustainable Transition”—PE2 NEST Spoke 8—B53C22004070006), and the work of L. Pompei was funded by the European Union Next Generation EU under the PNRR (National Recovery and Resilience Plan—NEST “Network 4 Energy Sustainable Transition”—PE2 NEST Spoke 4—B53C22004070006).

Data Availability Statement

Data are contained within the article.

Conflicts of Interest

The authors declare no conflicts of interest.

Nomenclature

Abbreviations
GLESGas–liquid energy storage
RESRenewable energy source
CAESCompressed-air energy storage
GLIDESGround-Level Integrated Diverse Energy Storage
ORNLOak Ridge National Laboratory
PVPhotovoltaic array
PV-GISPhotovoltaic array –geographical information system
 
Symbols
m ˙ Mass flow rate [kg/s]
EDEnergy density [kWh/m3]
h Heat transfer coefficient [W/m2 K]
RTERoundtrip efficiency [-]
H Height [m]
LcomprCompression work [J]
Lelect,inTotal electrical work required [J]
Lelect,outTotal electrical work provided [J]
L e x p a n Expansion work [J]
T Temperature [K]
T m a x Maximum temperature [K]
V Volume [m3]
V i n i t i a l Empty storage volume [m3]
c Specific heat capacity [J/kg K]
m Mass [kg]
p Pressure [Pa]
p*Compression ratio [-]
t Time [s]
U Thermal transmittance [W/m2 K]
ηMPMotor–pump efficiency [-]
ηTGTurbine–generator efficiency [-]
ηindIndicated efficiency [-]
 
Subscripts
a v g Average
b a s e Base
e x t External
g a s Gas
i n t Internal
o i l Oil
o u t External environment
p i s t Piston
r e a l Real
t o t Total
s i m u l Simulated
T Tank
v At constant volume

References

  1. Cui, F.; An, D.; Teng, S.; Lin, X.; Li, D.; Xi, H. Cogeneration Systems of Solar Energy Integrated with Compressed Air Energy Storage Systems: A Comparative Study of Various Energy Recovery Strategies. Case Stud. Therm. Eng. 2023, 51, 103521. [Google Scholar] [CrossRef]
  2. Mirnaghi, M.S.; Haghighat, F. Fault Detection and Diagnosis of Large-Scale HVAC Systems in Buildings Using Data-Driven Methods: A Comprehensive Review. Energy Build. 2020, 229, 110492. [Google Scholar] [CrossRef]
  3. Nardecchia, F.; Pompei, L.; Bisegna, F. Environmental Parameters Assessment of a New Diffuser for Air Cooling/Heating System: Measurements and Numerical Validation. Build. Simul. 2022, 15, 1111–1132. [Google Scholar] [CrossRef]
  4. Cuesta-Fernández, I.; Vargas-Salgado, C.; Alfonso-Solar, D.; Gómez-Navarro, T. The Contribution of Metropolitan Areas to Decarbonize the Residential Stock in Mediterranean Cities: A GIS-Based Assessment of Rooftop PV Potential in Valencia, Spain. Sustain. Cities Soc. 2023, 97, 104727. [Google Scholar] [CrossRef]
  5. Chen, L.; Huang, L.; Hua, J.; Chen, Z.; Wei, L.; Osman, A.I.; Fawzy, S.; Rooney, D.W.; Dong, L.; Yap, P.S. Green Construction for Low-Carbon Cities: A Review. Environ. Chem. Lett. 2023, 21, 1627–1657. [Google Scholar] [CrossRef]
  6. Alirahmi, S.M.; Razmi, A.R.; Arabkoohsar, A. Comprehensive Assessment and Multi-Objective Optimization of a Green Concept Based on a Combination of Hydrogen and Compressed Air Energy Storage (CAES) Systems. Renew. Sustain. Energy Rev. 2021, 142, 110850. [Google Scholar] [CrossRef]
  7. Babaei, S.M.; Nabat, M.H.; Lashgari, F.; Pedram, M.Z.; Arabkoohsar, A. Thermodynamic Analysis and Optimization of an Innovative Hybrid Multi-Generating Liquid Air Energy Storage System. J. Energy Storage 2021, 43, 103262. [Google Scholar] [CrossRef]
  8. Pompei, L.; Nardecchia, F.; Miliozzi, A. Current, Projected Performance and Costs of Thermal Energy Storage. Processes 2023, 11, 729. [Google Scholar] [CrossRef]
  9. Li, B.; Liu, Z.; Wu, Y.; Wang, P.; Liu, R.; Zhang, L. Review on Photovoltaic with Battery Energy Storage System for Power Supply to Buildings: Challenges and Opportunities. J. Energy Storage 2023, 61, 106763. [Google Scholar] [CrossRef]
  10. Rekioua, D. Energy Storage Systems for Photovoltaic and Wind Systems: A Review. Energies 2023, 16, 3893. [Google Scholar] [CrossRef]
  11. Zeynalian, M.; Hajialirezaei, A.H.; Razmi, A.R.; Torabi, M. Carbon Dioxide Capture from Compressed Air Energy Storage System. Appl. Therm. Eng. 2020, 178, 115593. [Google Scholar] [CrossRef]
  12. Vallati, A.; Fiorini, C.V.; Lo Basso, G.; Muzi, F.; Oclon, P.; Di Matteo, M. Optimization of a Thermal Storage Tank for a Water Water Heat Pump Solar Assited. In Proceedings of the 2023 8th International Conference on Smart and Sustainable Technologies, SpliTech 2023, Bol, Croatia, 20–23 June 2023; Institute of Electrical and Electronics Engineers Inc.: Piscataway, NJ, USA, 2023. [Google Scholar]
  13. Razmi, A.R.; Hanifi, A.R.; Shahbakhti, M. Design, Thermodynamic, and Economic Analyses of a Green Hydrogen Storage Concept Based on Solid Oxide Electrolyzer/Fuel Cells and Heliostat Solar Field. Renew. Energy 2023, 215, 118996. [Google Scholar] [CrossRef]
  14. Nabat, M.H.; Habibzadeh, M.; Alsagri, A.S.; Arabkoohsar, A. An Investigation and Multi-Criteria Optimization of an Innovative Compressed Air Energy Storage. J. Energy Storage 2024, 76, 109645. [Google Scholar] [CrossRef]
  15. Razmi, A.; Soltani, M.; Torabi, M. Investigation of an Efficient and Environmentally-Friendly CCHP System Based on CAES, ORC and Compression-Absorption Refrigeration Cycle: Energy and Exergy Analysis. Energy Convers. Manag. 2019, 195, 1199–1211. [Google Scholar] [CrossRef]
  16. Adib, M.; Nasiri, F.; Haghighat, F. Integrating Wind Energy and Compressed Air Energy Storage for Remote Communities: A Bi-Level Programming Approach. J. Energy Storage 2023, 72, 108496. [Google Scholar] [CrossRef]
  17. Minutillo, M.; Lubrano Lavadera, A.; Jannelli, E. Assessment of Design and Operating Parameters for a Small Compressed Air Energy Storage System Integrated with a Stand-Alone Renewable Power Plant. J. Energy Storage 2015, 4, 135–144. [Google Scholar] [CrossRef]
  18. Wang, Z.; Ting, D.S.K.; Carriveau, R.; Xiong, W.; Wang, Z. Design and Thermodynamic Analysis of a Multi-Level Underwater Compressed Air Energy Storage System. J. Energy Storage 2016, 5, 203–211. [Google Scholar] [CrossRef]
  19. Facci, A.L.; Sánchez, D.; Jannelli, E.; Ubertini, S. Trigenerative Micro Compressed Air Energy Storage: Concept and Thermodynamic Assessment. Appl. Energy 2015, 158, 243–254. [Google Scholar] [CrossRef]
  20. Heidari, M.; Mortazavi, M.; Rufer, A. Design, Modeling and Experimental Validation of a Novel Finned Reciprocating Compressor for Isothermal Compressed Air Energy Storage Applications. Energy 2017, 140, 1252–1266. [Google Scholar] [CrossRef]
  21. Bazdar, E.; Nasiri, F.; Haghighat, F. An Improved Energy Management Operation Strategy for Integrating Adiabatic Compressed Air Energy Storage with Renewables in Decentralized Applications. Energy Convers. Manag. 2023, 286, 117027. [Google Scholar] [CrossRef]
  22. Budt, M.; Wolf, D.; Span, R.; Yan, J. A Review on Compressed Air Energy Storage: Basic Principles, Past Milestones and Recent Developments. Appl. Energy 2016, 170, 250–268. [Google Scholar] [CrossRef]
  23. Venkataramani, G.; Vijayamithran, P.; Li, Y.; Ding, Y.; Chen, H.; Ramalingam, V. Thermodynamic Analysis on Compressed Air Energy Storage Augmenting Power/Polygeneration for Roundtrip Efficiency Enhancement. Energy 2019, 180, 107–120. [Google Scholar] [CrossRef]
  24. Odukomaiya, A.; Abu-Heiba, A.; Gluesenkamp, K.R.; Abdelaziz, O.; Jackson, R.K.; Daniel, C.; Graham, S.; Momen, A.M. Thermal Analysis of Near-Isothermal Compressed Gas Energy Storage System. Appl. Energy 2016, 179, 948–960. [Google Scholar] [CrossRef]
  25. Mozayeni, H.; Wang, X.; Negnevitsky, M. Thermodynamic and Exergy Analysis of a Combined Pumped Hydro and Compressed Air Energy Storage System. Sustain. Cities Soc. 2019, 48, 101527. [Google Scholar] [CrossRef]
  26. Kassaee, S.; Abu-Heiba, A.; Ally, M.R.; Mench, M.M.; Liu, X.; Odukomaiya, A.; Chen, Y.; King, T.J.; Smith, B.T.; Momen, A.M. PART 1- Techno-Economic Analysis of a Grid Scale Ground-Level Integrated Diverse Energy Storage (GLIDES) Technology. J. Energy Storage 2019, 25, 100792. [Google Scholar] [CrossRef]
  27. Odukomaiya, A.; Abu-Heiba, A.; Graham, S.; Momen, A.M. Experimental and Analytical Evaluation of a Hydro-Pneumatic Compressed-Air Ground-Level Integrated Diverse Energy Storage (GLIDES) System. Appl. Energy 2018, 221, 75–85. [Google Scholar] [CrossRef]
  28. Ko, J.; Kim, S.; Kim, S.; Seo, H. Utilizing Building Foundations as Micro-Scale Compressed Air Energy Storage Vessel: Numerical Study for Mechanical Feasibility. J. Energy Storage 2020, 28, 101225. [Google Scholar] [CrossRef]
  29. Patil, V.C.; Ro, P.I. Modeling of Liquid-Piston Based Design for Isothermal Ocean Compressed Air Energy Storage System. J. Energy Storage 2020, 31, 101449. [Google Scholar] [CrossRef]
  30. Chatzivasileiadi, A.; Ampatzi, E.; Knight, I. Characteristics of Electrical Energy Storage Technologies and Their Applications in Buildings. Renew. Sustain. Energy Rev. 2013, 25, 814–830. [Google Scholar] [CrossRef]
  31. Mahlia, T.M.I.; Saktisahdan, T.J.; Jannifar, A.; Hasan, M.H.; Matseelar, H.S.C. A Review of Available Methods and Development on Energy Storage; Technology Update. Renew. Sustain. Energy Rev. 2014, 33, 532–545. [Google Scholar] [CrossRef]
  32. Lisbona, D.; Snee, T. A Review of Hazards Associated with Primary Lithium and Lithium-Ion Batteries. Process Saf. Environ. Prot. 2011, 89, 434–442. [Google Scholar] [CrossRef]
  33. Vallati, A.; de Lieto Vollaro, R.; Oclon, P.; Taler, J. Experimental and Analytical Evaluation of a Gas-Liquid Energy Storage (GLES) Prototype. Energy 2021, 224, 120061. [Google Scholar] [CrossRef]
  34. Castellani, B.; Morini, E.; Nastasi, B.; Nicolini, A.; Rossi, F. Small-Scale Compressed Air Energy Storage Application for Renewable Energy Integration in a Listed Building. Energies 2018, 11, 1921. [Google Scholar] [CrossRef]
Figure 1. GLES prototype layout: (a) charge phase; (b) discharge phase. P = Pump, M = Motor, T = Turbine, G = Generator.
Processes 12 00655 g001
Figure 2. GLES system schemes: (a) hydraulic circuit; (b) sensors and electric circuit of the cylinder.
Processes 12 00655 g002
Figure 3. Daily electricity profiles of the two types of apartment present in the case study building.
Processes 12 00655 g003
Figure 4. Daily electricity profiles: overall consumption and PV production.
Processes 12 00655 g004
Figure 5. PV-GIS results of average monthly electricity production for a single collector.
Processes 12 00655 g005
Figure 6. Gas profiles during GLES simulations for comparison with experimental results: Pmin = 2.6 bar, Pmax = 6.6 bar. (a) Temperature; (b) pressure.
Processes 12 00655 g006
Figure 7. Gas temperature profiles during GLES simulations: (Case 1) Pmin = 70, Pmax = 130; (Case 2) Pmin = 100, Pmax = 130; (Case 3) Pmin = 70, Pmax = 100; (Case 4) Pmin = 50, Pmax = 200.
Processes 12 00655 g007
Figure 8. Gas pressure profiles during GLES simulations: (Case 1) Pmin = 70 bar, Pmax = 130 bar; (Case 2) Pmin = 100 bar, Pmax = 130 bar; (Case 3) Pmin = 70 bar, Pmax = 100 bar; (Case 4) Pmin = 50 bar, Pmax = 200 bar.
Processes 12 00655 g008
Table 1. Summary of instrumentation and controls for data acquisition.
MeasurementProbeMeasuring RangeAccuracy
Gas temperatureIFM TT1250 Pt1000 class A RTD Thermometer (Monza, Italy)−40 °C–>150 °C±(0.15 K + 0.002|𝑇|)
Gas temperatureIFM TP9237 amplifier
for temperature probes (Monza, Italy)
−50 °C–>300 °C±0.4%
Gas pressureFox TR41/M3 Pressure transducer (Milan, Italy)0–10 bar<1% of full scale
Gas pressureAFRISO RF63GlyD701 Pressure gauge (Güglingen, Germany)0–>16 barAccuracy class 1.6
Gas volume (through length)Siko SGH10 length transducer (Buchenbach, Germany)4–20 mA
Oil temperatureIFM TT1250 Pt1000 class A RTD Thermometer (Monza, Italy)−40 °C–>150 °C±(0.15 K + 0.002|𝑇|)
Table 2. Input for the numerical model based on experimental tests.
Parameter
Oil mass.moil
Gas massmgas
Inlet flow oil m ˙ in, oil
Discharge oil flow rate m ˙ out, oil
PressurePgas
Outdoor temperatureTout
Gas temperatureTgas
Oil temperatureToil
Tank temperature in contact with gasTgas, tank
Tank temperature in contact with oilToil, tank
Table 3. Outline of the experimental campaigns for the flow rate of 1 L/min.
ParameterFinal Pressure 4 BarFinal Pressure 5.3 BarFinal Pressure 6.6 Bar
Charge
Phase
Discharge
Phase
Charge PhaseDischarge PhaseCharge PhaseDischarge Phase
Time (s)326.256524.883.4664100.4
Initial pressure (bar)2.703.922.695.172.76.43
Final pressure (bar)4.002.615.312.616.622.61
Initial temperature (K)293.35293.65293.25293.65292.95293.55
Final temperature (K)295.15292.65295.65291.95295.85291.45
Initial volume (L)0.15.40.18.60.110.7
Final volume (L)5.40.18.60.110.70.1
Oil flow rate (L/min)15.315.315.3
RTE79.38%68.71%67.80%
ED0.019 kWh/m30.035 kWh/m30.048 kWh/m3
Table 4. Measured and simulated results comparison.
Pmin
[bar]
Pmax
[bar]
L elect,in
[J]
L elect,out
[J]
RTE
[kWh/m3]
ED
[kWh/m3]
Measured701305.81 × 1034.05 × 1030.69740.0547
Simulated5263.843569.360.67800.0480
Table 5. Summary of the tests carried out.
IDPmin
[Bar]
Pmax
[Bar]
Lelect,in
[J]
Lelect,in_kWh
[kWh]
Lelect,out
[J]
Lelect,out_kWh
[kWh]
RTE
[kWh/m3]
ED
[kWh/m3]
Case 1701301.11 × 1060.30887.56 × 1050.21030.68080.8712
Case 2701006.16 × 1050.17134.30 × 1050.11950.69720.495
Case 31001306.18 × 1050.17184.40 × 1050.12240.7120.507
Case 4502001.88 × 1060.52371.22 × 1060.34050.65011.4107
Disclaimer/Publisher’s Note: The statements, opinions and data contained in all publications are solely those of the individual author(s) and contributor(s) and not of MDPI and/or the editor(s). MDPI and/or the editor(s) disclaim responsibility for any injury to people or property resulting from any ideas, methods, instructions or products referred to in the content.