Abstract
Comprehending the water absorption process inherent to coal, including the associated spatial distribution patterns of water, proves indispensable in the design and evaluation of coal pillar dams in underground water reservoirs. To better understand this process, a series of NMR (nuclear magnetic resonance) tests were carried out on cylindrically shaped coal samples immersed in water for varying durations, with the upper and lower surfaces of the samples sealed. A method involving image digital processing and finite element simulation was used to quantitatively characterise the water absorption process, as well as the spatial distribution of water in the samples. The results showed that NMR imaging colour brightness differences were positively correlated with water content and that the wetted ring gradually increased in width as the water immersion time increased. The expectation and sum of squared deviations of the pixel greyscale values of the NMR images, which were used to characterise the water saturation and spatial distribution of the coal samples, represented positive and negative exponential functions of the water immersion time, respectively. This indicated that the water saturation gradually increased and became more uniformly distributed. Furthermore, based on the set threshold value of the target variable rate of change, the limiting expectation of the pixel greyscale values was obtained, and the limiting water absorption time of the coal sample was predicted. The water diffusion equation was then used to characterise the water absorption process of the coal samples, and a water diffusion model was developed to accurately obtain the wet ring boundary data. A reasonable value of the diffusion coefficient was determined by comparing and correcting the results of the numerical simulation and physical experiments with full consideration of the non-homogeneity of the numerical model. This water diffusion model can better characterise the water transport phenomena in the macroscopic barrier zone of coal pillar dams. Finally, the application prospects in terms of practical engineering were investigated.
1. Introduction
The destruction of groundwater resources through coal mining is a key problem that must be solved to ensure green energy development and ecological civilisation in mining areas in China [1]. In 2022, coal, an important component of global primary energy, still accounted for 56.2% of energy consumption in China [2]. The current scale and intensity of coal mining far exceed the environmental carrying capacity of mining areas. This is especially true in the ecologically fragile areas of western China, such as Shanxi, Shaanxi, Inner Mongolia, Xinjiang, and Ningxia, whose raw coal production accounts for 83.05% of the total national output [3], although their water resources account for less than 9.6% of the total [4]. Large-scale, high-intensity underground coal mining inevitably destroys the overburden structure of a coal seam roof and forms hydraulic fissures in aquifers, prompting large quantities of groundwater to collapse into mined spaces, such as overburden fissures and goafs [5]. This further leads to a decline in groundwater levels and ecological and environmental problems such as land salinisation and desertification.
Underground water reservoir technology [6] in coal mines involves the construction of robust concrete walls that interconnect with boundary coal pillars. An ingenious design creates a confined space within the goaf area, serving as a reservoir to store, transport, and ultimately reclaim the collapsed underground water. This innovative approach is an exceptionally effective means of addressing the myriad challenges that typically accompany underground coal mining operations. Compared with water conservation mining techniques such as backfill mining [7], height-limited mining [8], and room and pillar mining [9], which aim to protect the key layer of the water barrier, underground reservoir technology is more suitable for western China’s ecologically fragile mining areas, which have geological endowment characteristics such as a shallow burial depth and thick coal seam [10]. However, usage of this technology also creates greater safety hazards. The coal pillar dam body, which originates from a boundary coal pillar, is a key structure in the underground reservoir rock body of coal mines. It undergoes prolonged exposure to the erosive effects of the water stored within it, and this persistent erosion significantly alters the mechanical properties and stability of the area, particularly in terms of long-term water saturation and spatial distribution changes within the coal pillar dam body.
First proposed in the 1950s, water–rock (coal) interactions [11] involve complex physical, chemical, and mechanical effects and represent a challenging problem in rock mechanics and engineering research. The influence of water on the mechanical characteristics of both coal and rock materials is readily apparent [12], at times exerting a more pronounced impact than purely mechanical factors [13]. Water weakens coal rock by up to 90% [14]. As the water content of coal rock increases, its mechanical parameters, such as tensile strength [15], shear strength [16], compressive strength [17], modulus of elasticity [18], rigidity [19], brittleness, and the likelihood of rock bursts [20], decrease, while plasticity and softening increase [21]. To better characterise this, Tang et al. [22] revised the Moore–Coulomb strength criterion based on water content via variable angle shear tests on water-bearing coal samples. Zhao et al. [23] proposed a verified and reasonable compression–shear crack fracture criterion based on the Drucker–Prager criterion by considering the effect of water on the crack stress intensity factor, providing a theoretical reference for water–rock (coal) interactions.
The content and spatial distribution of water in coal rocks in water-rich environments are heterogeneous [24], which can lead to differences in their mechanical properties and damage patterns [25]. To address this problem, Zhou et al. [26] proposed a method for the accurate preparation of rock specimens with different water contents. Furthermore, Yao et al. [27] developed an intelligent, non-destructive water immersion device and proposed a method for determining the water contents of coal rock specimens based on immersion time. This method has since spurred numerous additional studies investigating the weakening of mechanical properties in water-bearing coal rocks. However, a precise and quantitative characterisation of the spatial distribution of water during coal rock absorption remains a formidable obstacle, and the lack of this knowledge significantly impedes further exploration of the mechanisms governing water–rock (coal) interactions.
Low-field nuclear magnetic resonance (NMR) techniques offer a viable solution for analysing the pore and fluid distribution characteristics of porous media materials [28]. These techniques measure the relaxation times (surface, free, and diffusive relaxation) of hydrogen-containing fluids such as water [29] and can be applied to substances like oil and gas. Moreover, these techniques boast rapidity, non-destructiveness, precision, and the ability to analyse fine-grained materials [30]. Saturated coal rocks contain three types of water: bound (76%), capillary (14%), and bulk water (10%) [31]. Yao et al. [32] calibrated the correspondence between the distribution of pore space and water types at various levels in coal, and Norinaga et al. [33] quantitatively analysed the different types of water in coal. Sun et al. [34] assessed the wettability of coal using low-field NMR data, and He et al. [35] proposed a method for constructing capillary pressure curves for rocks based on T2 distribution characteristics. Furthermore, the fluid transport patterns in coal rocks and the adsorption and desorption characteristics of coal rock materials for fluids have been studied using NMR. Wang et al. [36] investigated the evolution mechanism of permeability throughout the stress–strain phase based on NMR results and analysed the stress damage and its effect on permeability. Wang et al. [37] investigated the migration and diffusion characteristics of water within different ranks of coal samples using NMR techniques. The large-scale application of nuclear magnetic resonance technology has effectively facilitated the study of fluid transport patterns in coal rock materials.
Focusing on the spatial distribution characteristics and seepage evolution of coal is essential in designing coal pillar dams and assessing their stability. Prior research has mostly focused on the changes in the overall water content state of coal rocks and its impact on physical properties but has not considered the process of water absorption or the spatial distribution of water in coal rocks. Therefore, in this study, standard cylindrical coal samples with blocked upper and lower surfaces were immersed in water for different durations and scanned using an NMR system to obtain their radial images. A wet ring forms in the NMR images that reflect the water absorption process of the coal samples. The expectation and sum of squared deviations of the image pixel greyscale values were selected as characteristic parameters to quantitatively characterise and predict both the spatial distribution of water and the water absorption processes in these samples. The diffusion equation was then used to accurately characterise the transport of water from the peripheral surface to the centre, and a water diffusion model was developed to determine a reasonable diffusion coefficient value through simulation analysis. Finally, the prospects for applying the water diffusion model to specific engineering practices were considered. In this study, the application of the water diffusion characterisation method and associated water diffusion model allows for a thorough characterisation of the water transport process within the macroscopic “watertight zone” of the coal pillar dam. This approach considerably extends the study’s time scale and enhances result accuracy. Furthermore, it provides valuable guidance for decision-making in water resource protection planning for mining operations, with the potential to generate substantial economic, social, and ecological benefits.
2. Materials and Methods
2.1. Coal Sample Selection
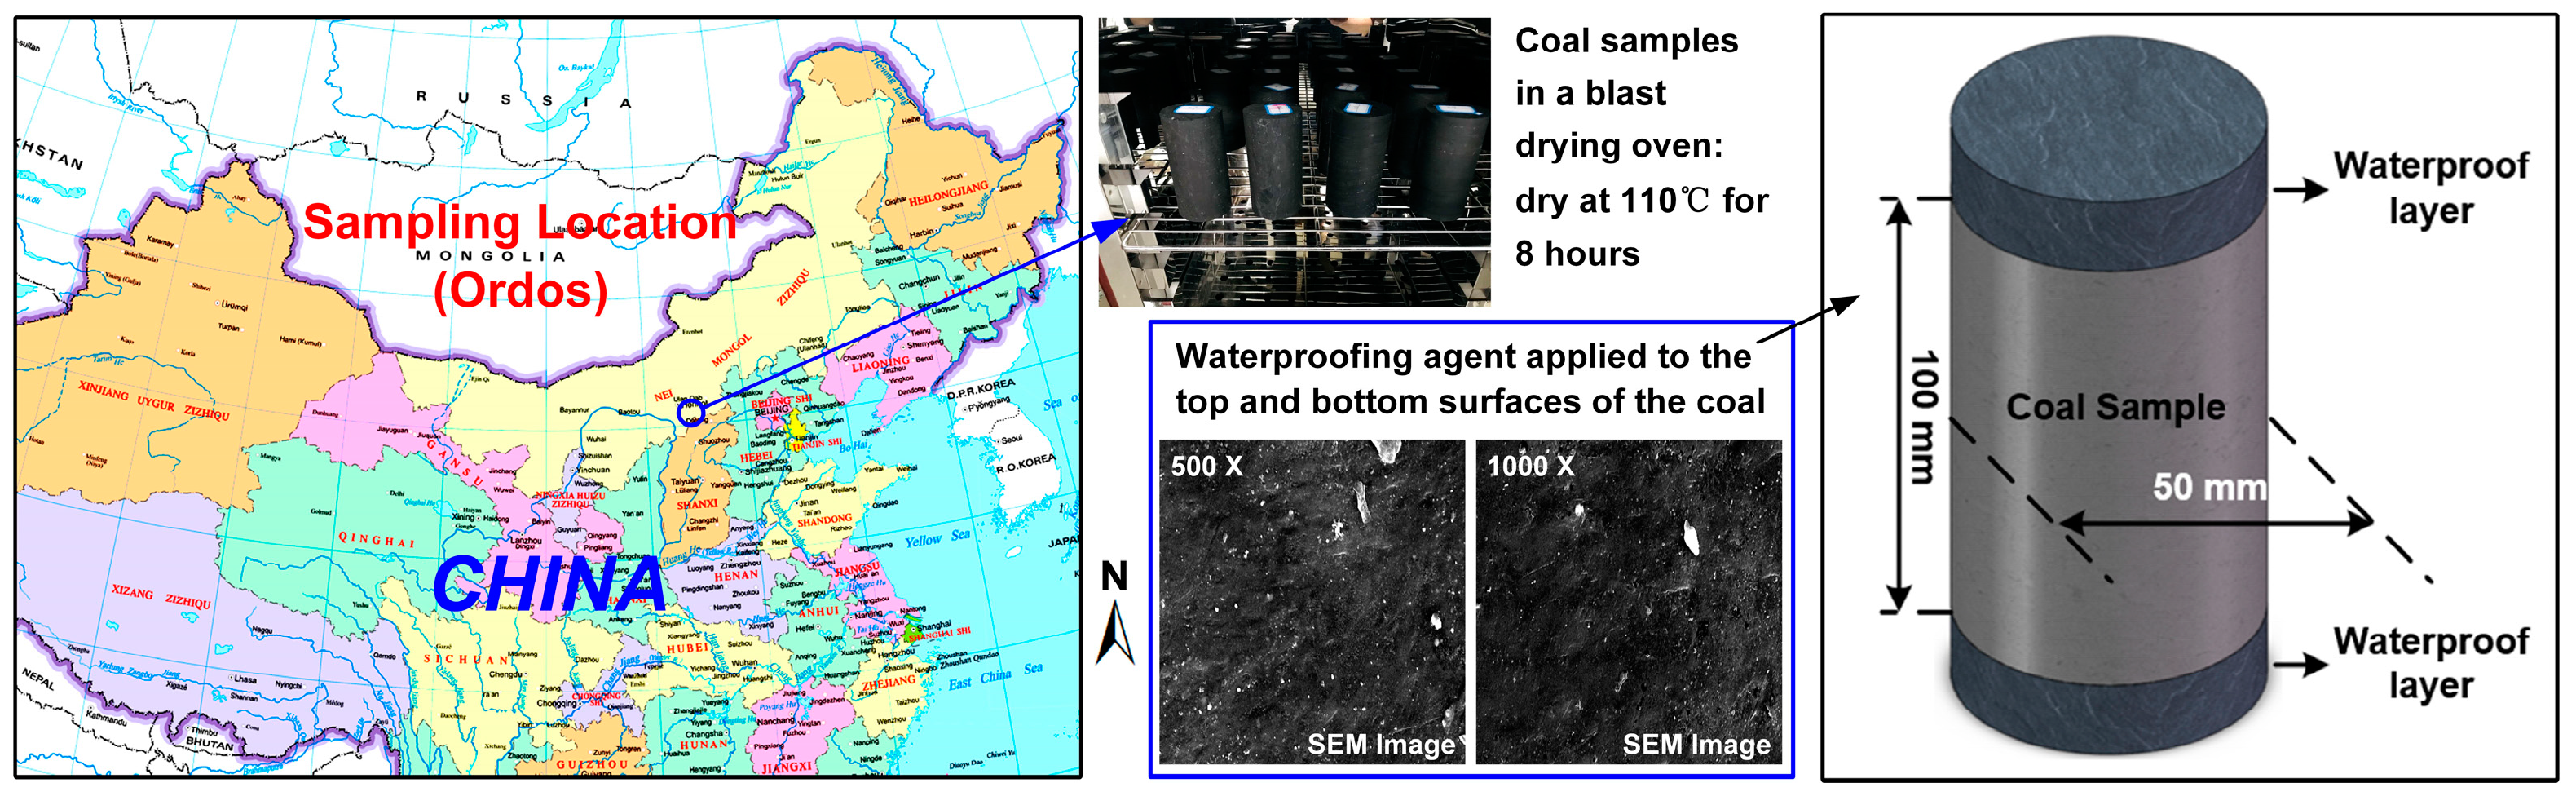
The coal samples used in this study were obtained from the Chahasu Coal Mine in the Shendong Mining District, Ordos, China, as shown in Figure 1. The 3-1 coal seam is the main mining seam of the Chahasu coal mine. Part of the coal body in this mine has been used as a dam and partial storage structure for the underground water reservoir. The type of coal chosen was bituminous coal, with a depth of burial of 340 m. Following the requirements of the International Society of Rock Mechanics, the raw coal was machined into standard cylindrical specimens of Φ 50 × 100 mm under the premise of maintaining integrity, with the non-parallelism not exceeding 0.05 mm at both ends and the axial deviation not exceeding 0.25°. Notably, none of the coal samples selected for the experiments exhibited significant fissures. An X-ray diffraction test of a coal sample showed that it was mainly composed of quartz, sodium feldspar, calcite, kaolinite, and chlorite. Chlorite, when exposed to water, is known to enhance the adsorbed water film, leading to an expansion in the volume of coal samples. In contrast, silicate minerals like calcite exhibit strong water absorption properties and plasticity, thereby influencing water absorption characteristics [38]. Environmental scanning electron microscopy complemented this analysis by illustrating the microscopic components of the coal samples, which contained significant proportions of vitrinite. The microstructure was microgravel, and the surface was relatively uniform and dense [39]. The porosity and dry density of the coal sample were 9–11% and 1380 kg/m3, respectively.
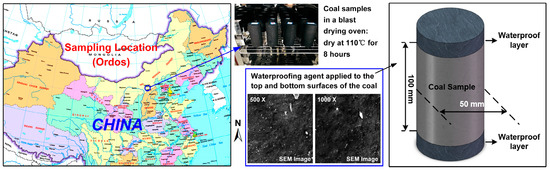
Figure 1.
Coal sample location and preparation. SEM, scanning electron microscopy.
2.2. Experimental Equipment
A low-temperature and high-pressure nuclear magnetic resonance system (MacroMR12-150H-I, Suzhou Newmark Analytical Instruments Co., Ltd., Suzhou, China) was used to test the spatial distribution characteristics of water in the coal samples (Figure 2). The system consists of a controller, spectrometer system, RF unit, and gradient unit with a magnetic field strength of 0.5 T ± 0.08, resonance frequency of 21.3 MHz, RF pulse of 2–49.9 MHz, and RF accuracy of 0.01 Hz. The basic principle behind the use of NMR in this study is to characterise the properties of hydrogen-containing fluids in coal rocks by monitoring the relaxation behaviour of the nuclear spin of 1 H as it interacts with external magnetic and radiofrequency fields, as previously described [40,41]. In this study, the spatial distribution characteristics of water in coal samples were analysed by magnetic resonance imaging (MRI) using Carr–Purcel–Meiboom–Gill (CPMG) test sequences.
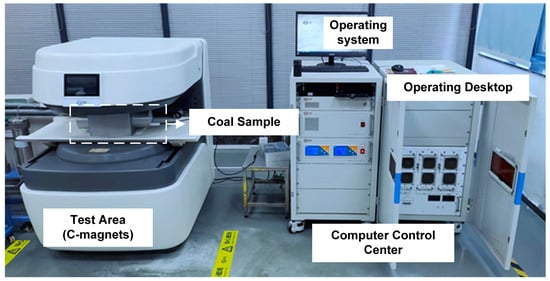
Figure 2.
Coal sample location and preparation.
2.3. Experimental Procedure
- (1)
- Sample selection: Sample cylinders with small errors and no evident surface defects were selected.
- (2)
- Sample drying: To avoid errors in the experimental results caused by the water content of the coal samples, the samples were dried using a blast-drying box (101-2, Shanghai Instrument Factory, Shanghai, China). The drying temperature was set at 105 °C, and a sample was weighed hourly. When the mass change of the coal sample after two cycles was less than 0.01 g, it was considered completely dry.
- (3)
- Surface treatment: Waterproof material (as shown in Figure 1) was sprayed on the top and bottom surfaces of the dried coal samples to block holes, cracks, and other water seepage channels, to ensure that the water absorption process occurred mainly on its circumferential surface.
- (4)
- Water immersion test: The coal samples were placed in distilled water and completely submerged. The samples were taken out every 5 min, and the surface water was dried. After weighing each sample with a balance, the NMR test was prepared.
- (5)
- NMR test: The radial water distribution state of the coal samples was tested using one-dimensional nuclear magnetic resonance imaging (MRI). Following the test, the coal samples were placed in distilled water.
- (6)
- Steps 4–5 were repeated until the coal samples were completely saturated, and the experiment ended.
3. Results
3.1. Water Spatial Distribution Characteristics
Characterisation of the spatial distribution of water is the basis for studying the water diffusion and migration processes in coal samples. Based on the principle of energy attenuation, a nuclear magnetic resonance (NMR) system can excite electromagnetic waves by applying a gradient magnetic field and using a gradient pulse sequence to locate the hydrogen-containing fluid inside the medium, which is the magnetic resonance imaging technique (MRI). This technology can form a cross-sectional view of a coal sample in a specific layer, generating an NMR image that can be directly observed after uniform mapping and pseudo-mining processing. In this study, MRI technology was used to scan the coal samples along the radial direction, allowing for an intuitive understanding of the spatial distribution characteristics of water within the samples. The final images were obtained by superimposing all the slice images of a particular coal sample. The intensity of a pixel colour in the images corresponds to the water content.
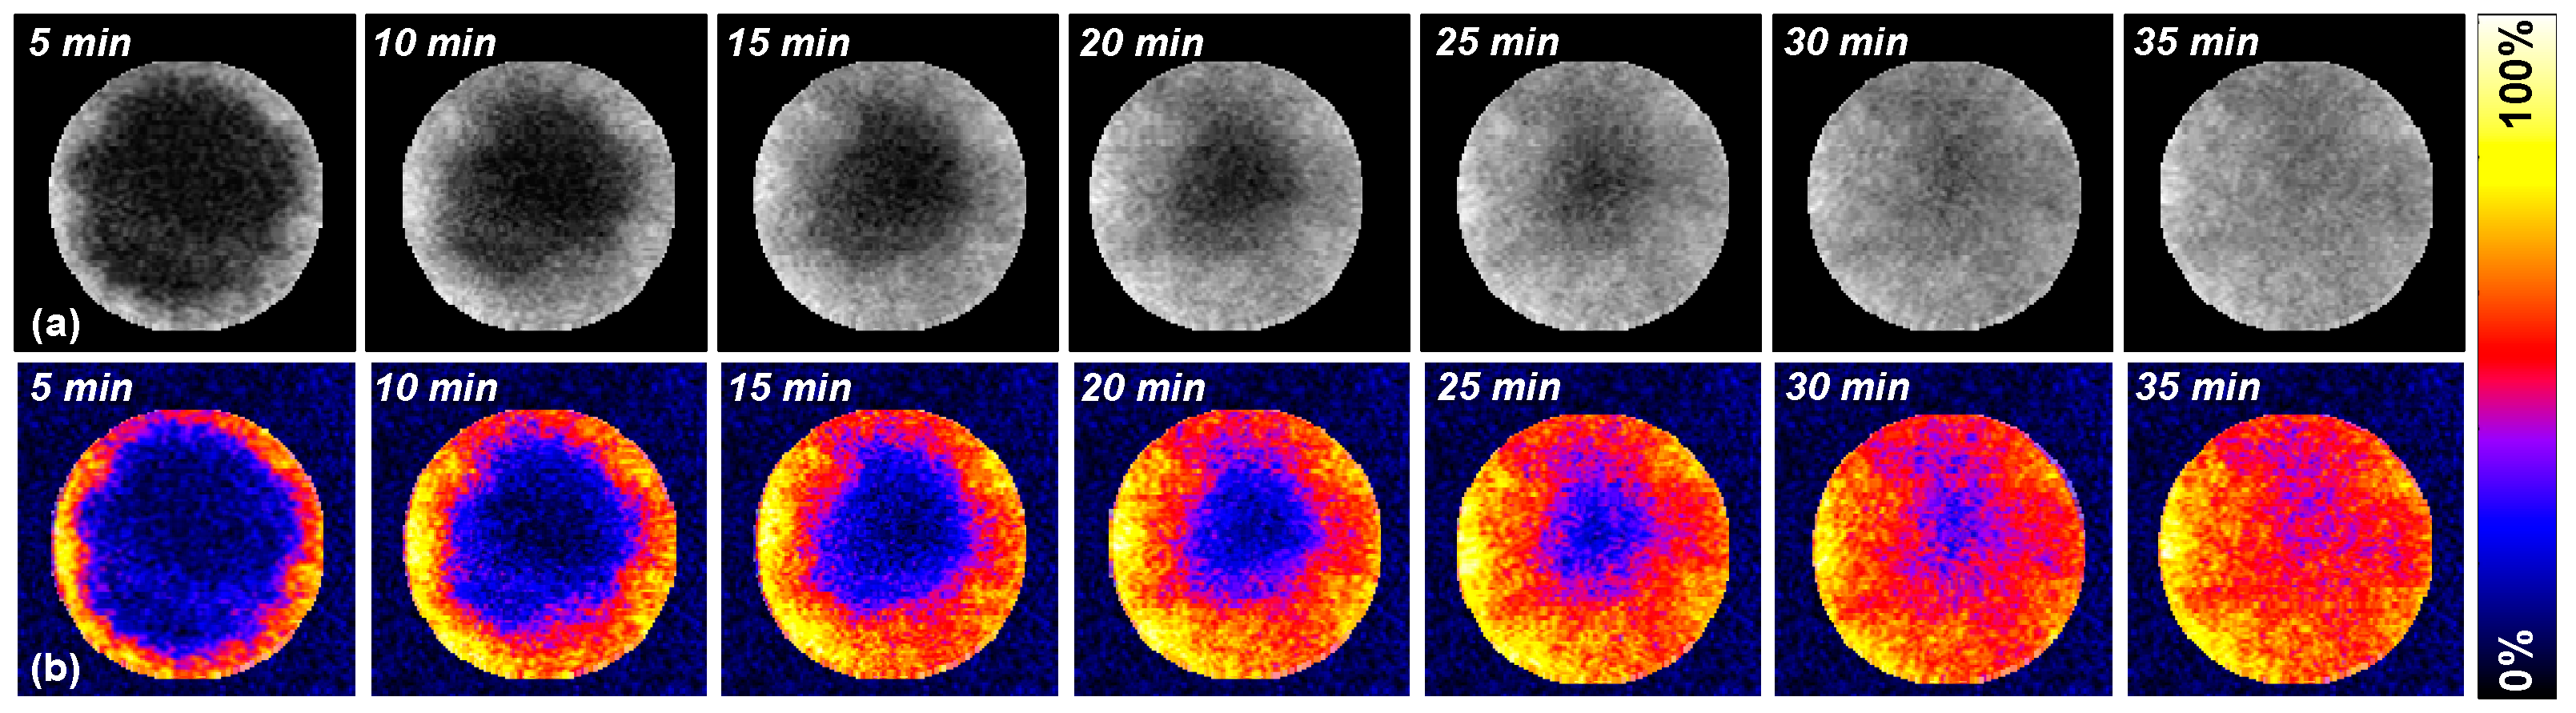
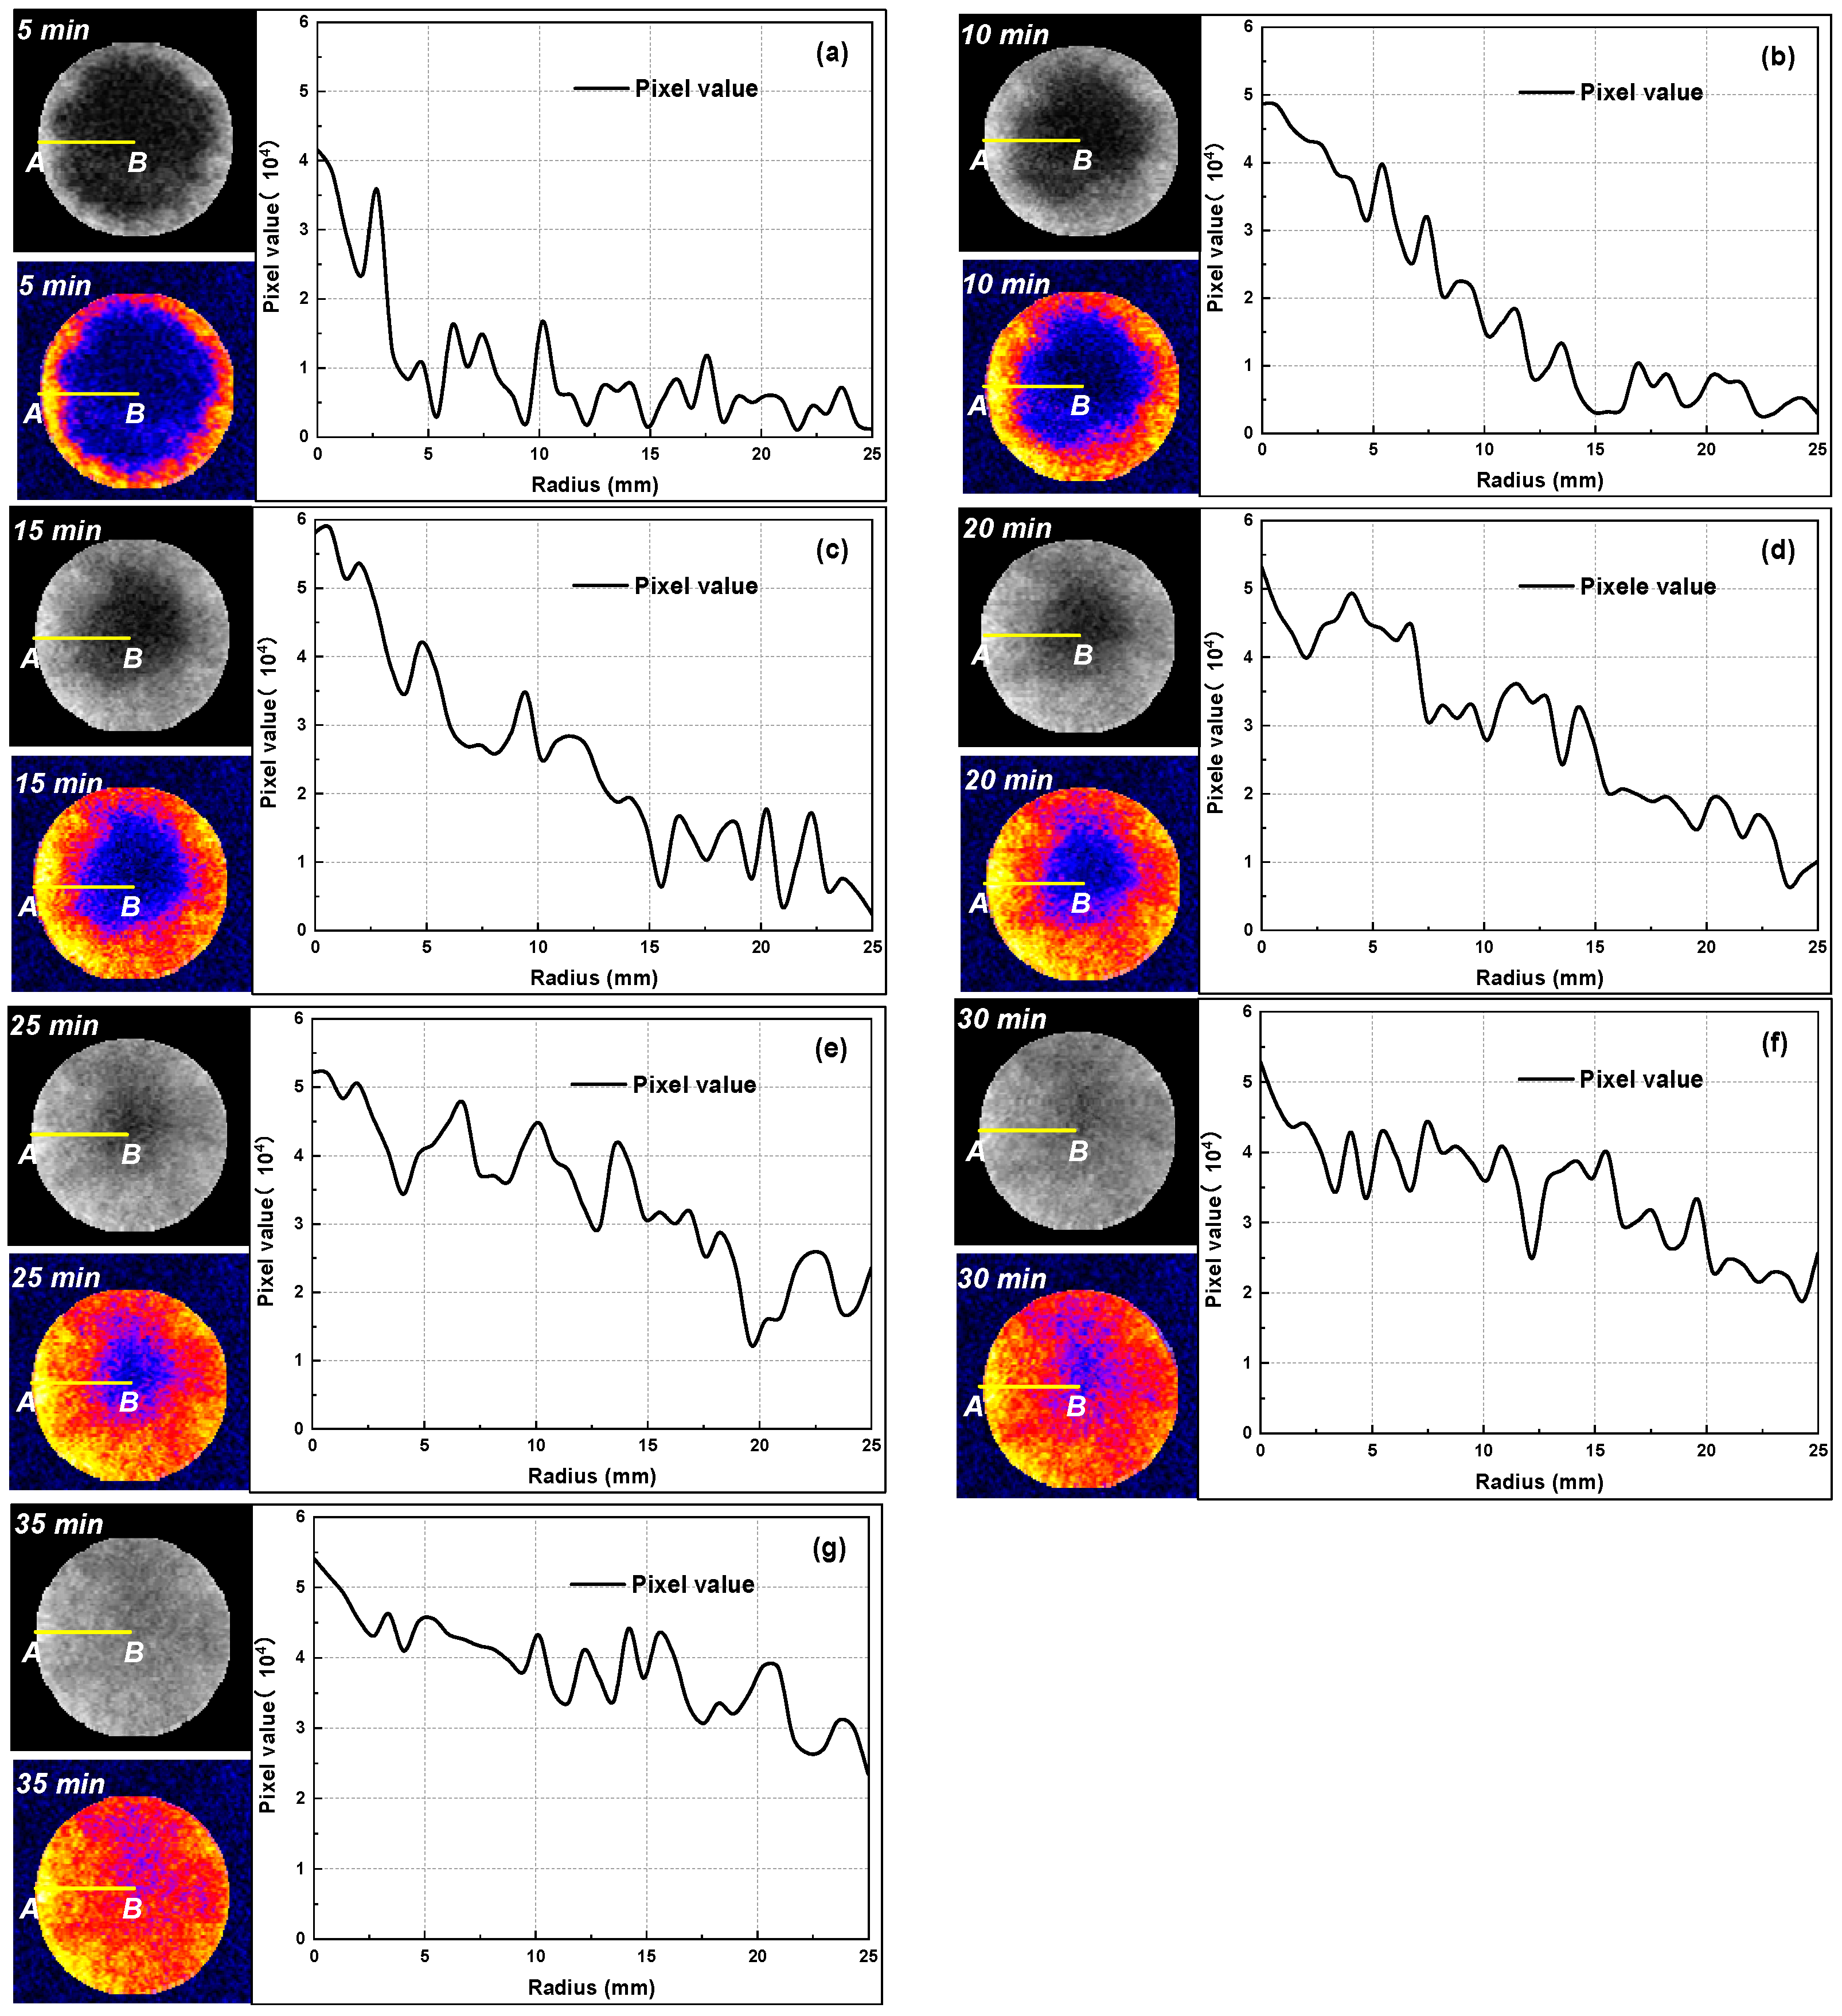
The spatial distribution of water within a coal sample at different immersion durations is shown in Figure 3. The brighter the colour, the greater the intensity of water (1H) contained within the coal sample. As shown in the figure, after 5 min of immersion, the highlighted pixels appear mainly at the boundary as the water only spreads on the surface, forming a fine wet ring. The interior of the sample, however, remains dry, mainly appearing as the background colour (blue-black). As the immersion time increased (t = 10–30 min), the water diffused further into the sample, the width of the wet ring gradually increased, and the highlighted pixels in some areas near the boundary began to accumulate and gradually connect. At t = 35 min, the highlighted pixels cover almost the entire image, and the coal sample initially appears in an incomplete near-saturated state. The spatial distribution of water within the coal sample is not uniform during the diffusion and transport of water. We considered how to quantitatively characterise the water distribution and determine the degree of water saturation of the coal samples.
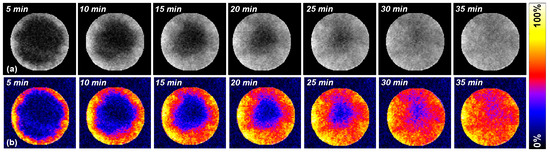
Figure 3.
Radial NMR images of coal samples at different immersion times. Intensity of pixel colour corresponds to water content. (a) Original image/uniform mapping, (b) pseudo-mining.
To solve this problem, NMR images were read to encode and identify pixel greyscale values, and statistical analysis was performed, allowing one to effectively distinguish between the wet ring regions of the image. The distribution of the pixel greyscale values along the radius AB for the images of the coal samples with different immersion times is shown in Figure 4. The pixel greyscale values show a fluctuating distribution with increasing distance and a large drop or decreasing trend near the wet ring boundary. As the immersion time increased, the coal samples tended to saturate, at which point the pixel greyscale values were generally at high levels, and the distribution gradually homogenised.
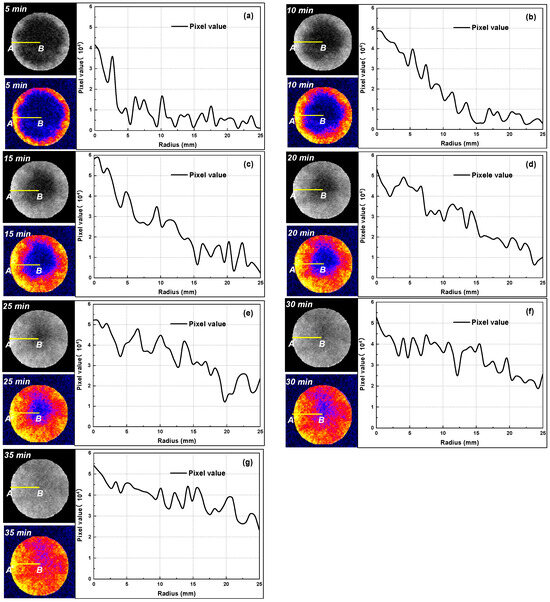
Figure 4.
Pixel representations of water absorption degrees of coal samples at different immersion times. (a) t = 5 min; (b) t = 10 min; (c) t = 15 min; (d) t = 20 min; (e) t = 25 min; (f) t = 30 min; (g) t = 35 min.
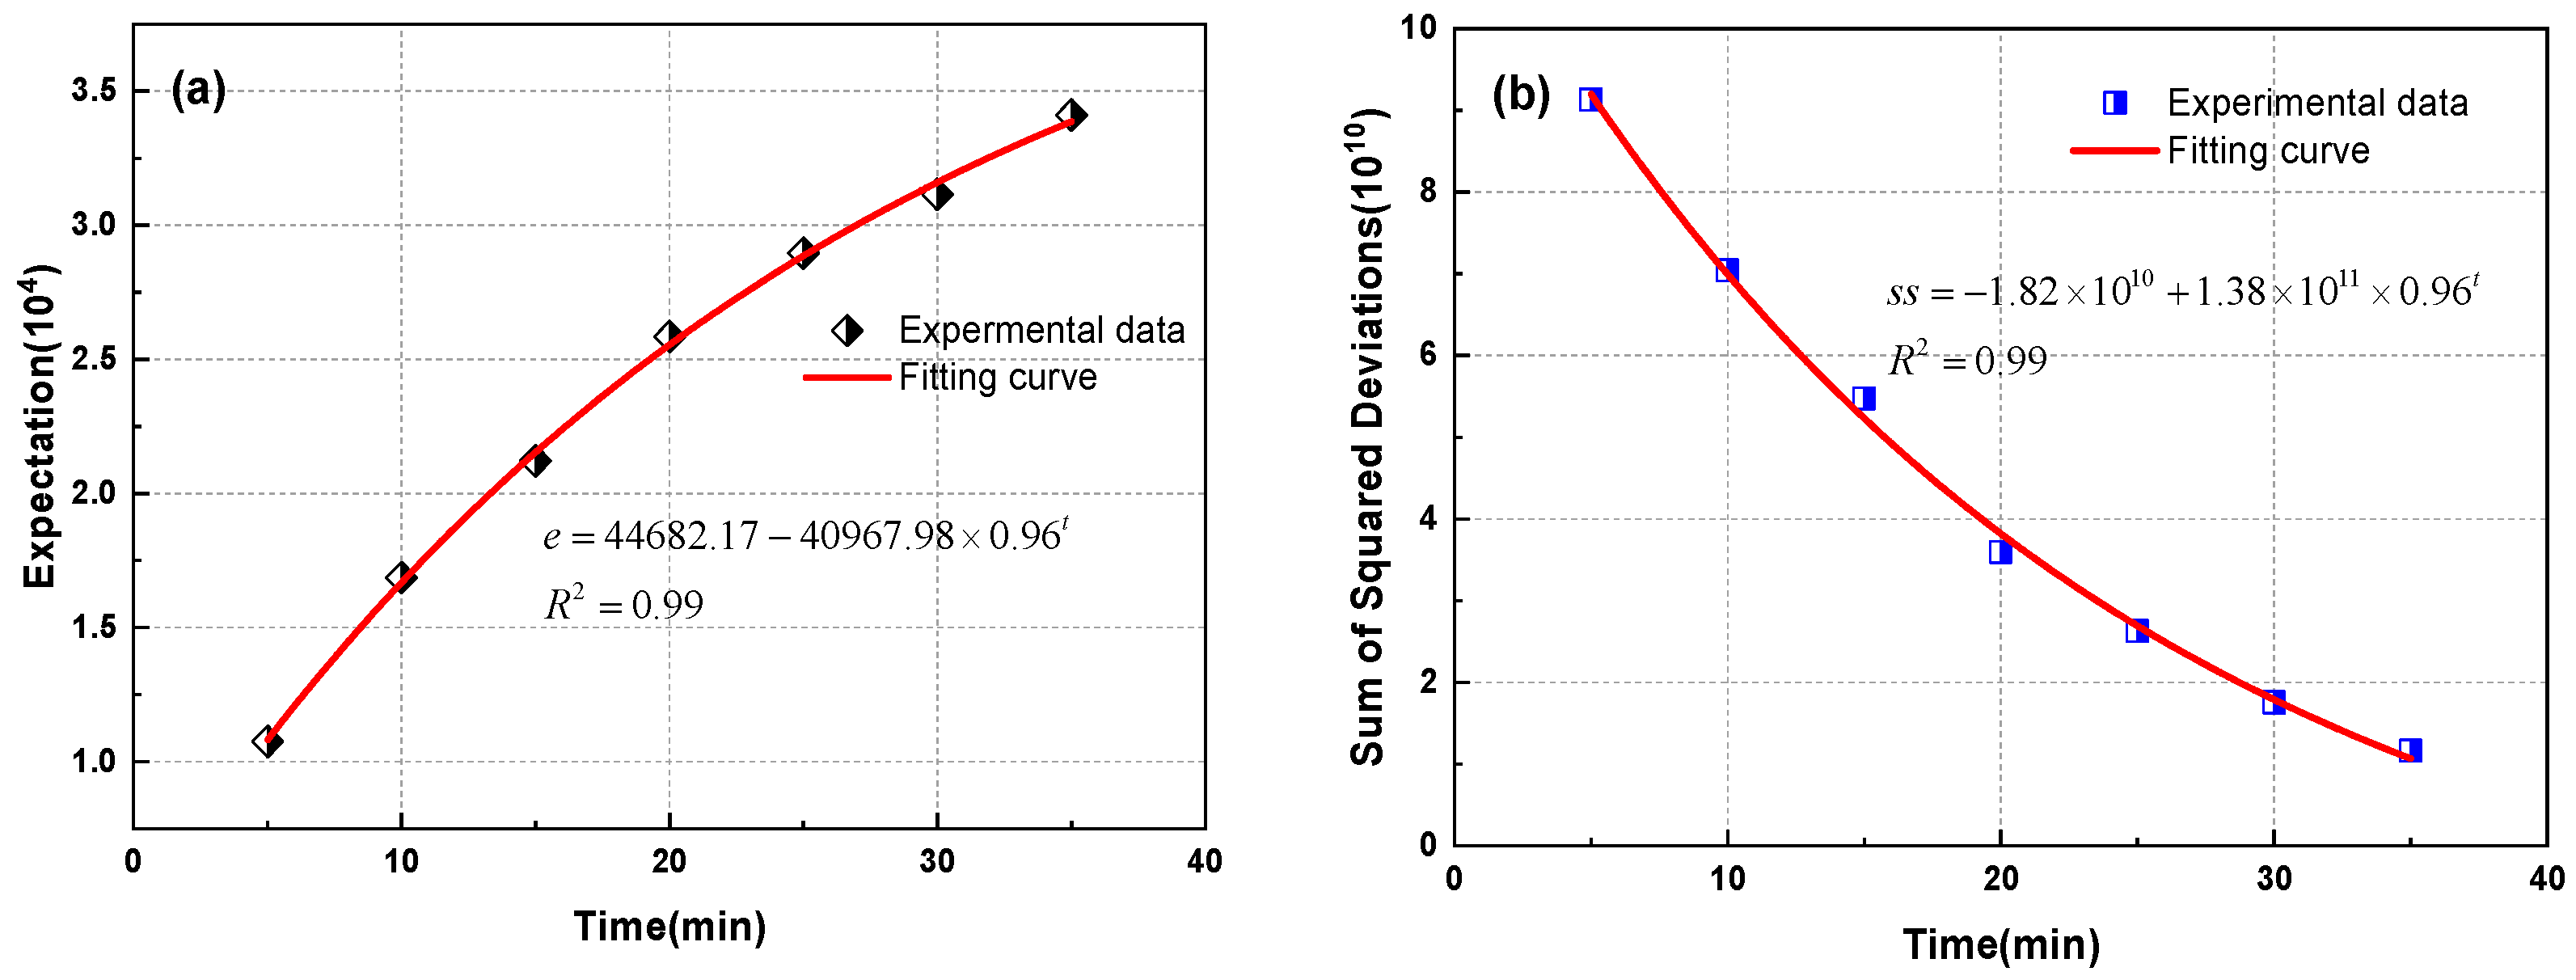
In order to quantitatively characterise this process, the pixel values in each image were counted, and the pixel expectation values were calculated (as shown in Figure 5a) based on the method shown in Equation (1). An expected value is a common concept in probability theory and statistics, which can reflect the distribution characteristics of data. As the water immersion time increases, we observe that the expected values of the image pixel greyscale values also rise. This indicates an increase in the overall brightness of the image, signifying a corresponding increase in the water content or water saturation of the sample. However, it is worth noting that the growth rate of the pixel greyscale values gradually diminishes over time, eventually approaching zero. The equation for fitting the pixel value expectation to the immersion time conformed to an exponential function, as shown in Equation (2). Taking the derivative of Equation (2) yields Equation (3), which captures the change in the growth rate of the expectation. When the growth rate k is less than 0.01‰, the expected value has stopped increasing [42]; the limit of the expected value is 44,682.17, which effectively characterises the range of pixel greyscale values when the coal sample is saturated. The sum of the squared deviations of the pixel values relative to this limit was calculated accordingly, as shown in Figure 5b. The reasons for choosing the parameter sum of squared deviations for the analysis are explained in Section 4, and the calculation method is shown in Equation (4). As shown in Figure 5b, the sum of the squares of the deviations gradually decreases as the immersion time increases, and the concentration of the pixel greyscale value distribution increases, indicating that the spatial distribution of water in the coal samples gradually becomes homogeneous. The fitted equation for the sum of the squares of the deviations versus the immersion time conforms to an exponential function (Equation (5)), with the rate of change k decreasing and then converging to zero. When the sum of the squares of the deviations is less than 0.01‰, the sample is saturated with water, which is uniformly distributed. The ultimate soak time was 49.63 min, and longer immersion times did not significantly affect the water content or spatial distribution of the coal samples. This demonstrates that NMR images and pixel analysis methods can be used to quantitatively characterise and predict the spatial distribution of water and water absorption processes in coal samples.
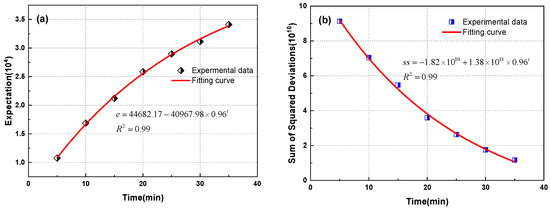
Figure 5.
Expectation (a) and sum of squared deviations (b) of coal samples.
The variable e represents the expected pixel greyscale values, ss corresponds to the sum of the squared deviations, t is the immersion time (min), R2 is the correlation coefficient of the fit, xi is the pixel value, n is the number of pixel values, pi is the probability of the occurrence of xi, and el is the limit of the expected value of the pixel values.
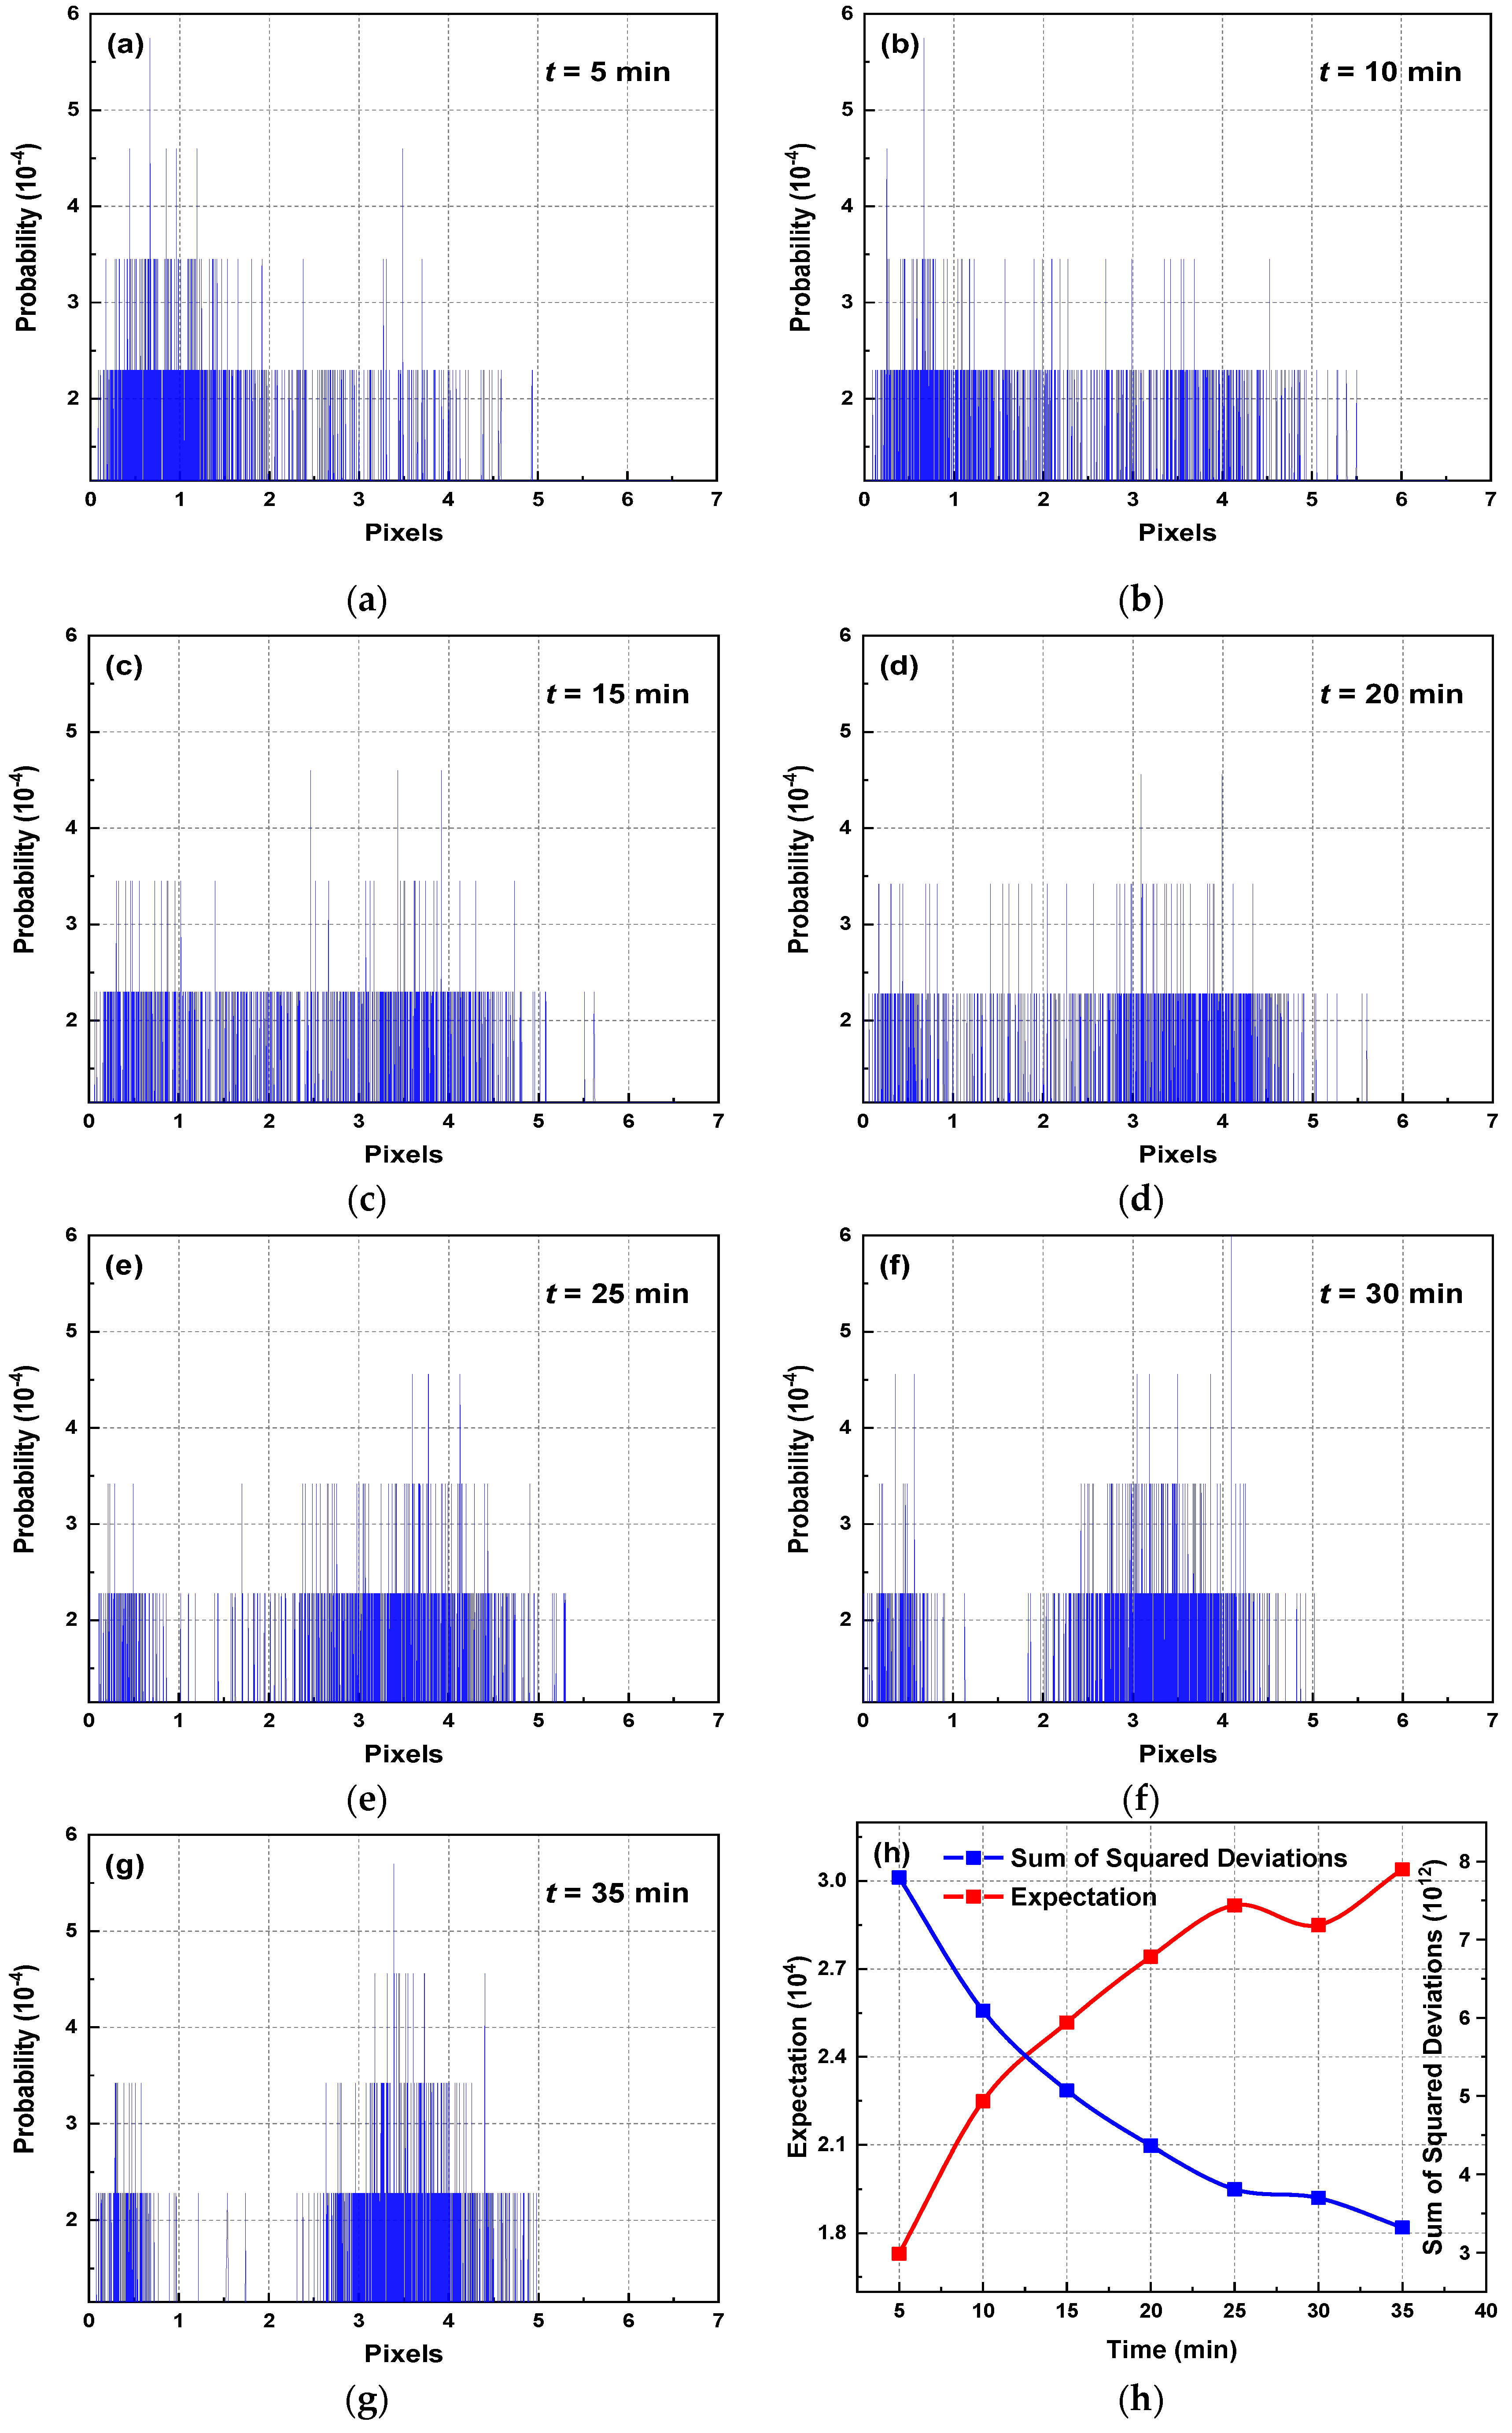
The pixel probability density distributions are shown in Figure 6. Significant differences exist in the distribution of pixel greyscale values in the NMR images of coal samples at different immersion times. When t = 5–15 min, water forms a narrow wet ring only at the outer boundary of the coal samples, and the pixel greyscale values are more densely distributed in the lower part of the range (0–3 × 10⁴) (Figure 6a–c). As the immersion time increases, the dense area of the distribution shifts to the higher part of the range (3–5 × 10⁴), and the probability (≥4.56 × 10⁻⁴) of being at these higher levels occurs more frequently (Figure 6f,g). Concurrently, the expected and deviation sum of squares of the pixel greyscale values in the effective region showed overall increasing and decreasing trends, respectively (Figure 6h); this indicated that the overall spatial distribution of water in the coal samples gradually homogenised, in addition to the increase in water saturation per unit area with increasing soaking time, thus further verifying the conclusion above.
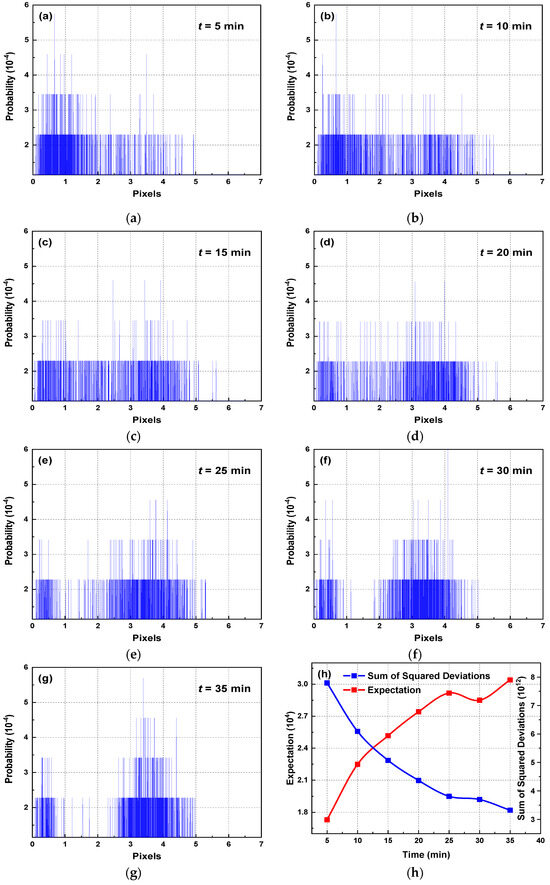
Figure 6.
Pixel probability density distributions (a–g) and associated parameters (h) of all of the NMR images of the coal samples.
3.2. Water Diffusion Characterisation Model
Fick’s law is used to describe the relationship between the mass transfer fluxes and concentration gradients in the diffusion of substances. Based on Fick’s second law (Equation (6)), the water diffusion equation can be used to characterise the transport of water from the peripheral surface of a cylindrical coal sample to the centre, which can be expressed as follows:
where C is the volume concentration of water (kg/m3), is the concentration gradient (kg/m2), t is the immersion time (s), D is the diffusion coefficient (m2/s), φ is the porosity of the coal sample (%), and I is the source/sink term (1/s). This method has been shown to be both rational and effective [23]. Considering that the water in this study was free to diffuse, I was set to zero. A finite element numerical simulation model of the coal sample based on Equation (7) was developed, as shown in Figure 7a. Specifically, Equation (7) was represented in the PDE module by customising the partial differential equation (Equation (8)), i.e., by setting u = C, c = D, da = φ, α = 0, i = 0, ea = 0, ε = 0, and γ = 0. The model was 50 mm in diameter, and the mesh was extremely fine-grained, containing 25,970 triangular cells. The blue circle on the outside of the model was set as the Dirichlet boundary of Equation (7) (i.e., C = 1), which represents the constant concentration conditions of the liquid environment to which the coal sample is exposed. As a natural rock, coal has a complex and irregular internal structure. To describe the non-homogeneity of the coal sample, the Weber distribution was used to define the porosity and diffusion coefficients of the individual units using the probability density function shown in Equation (9):
where ea is the mass coefficient, u is the main variable, c is the diffusion coefficient, da is the damping coefficient, α is the conservative flux convection coefficient, γ is the conservative flux source, ζ is the convection coefficient, and υ is the absorption coefficient.
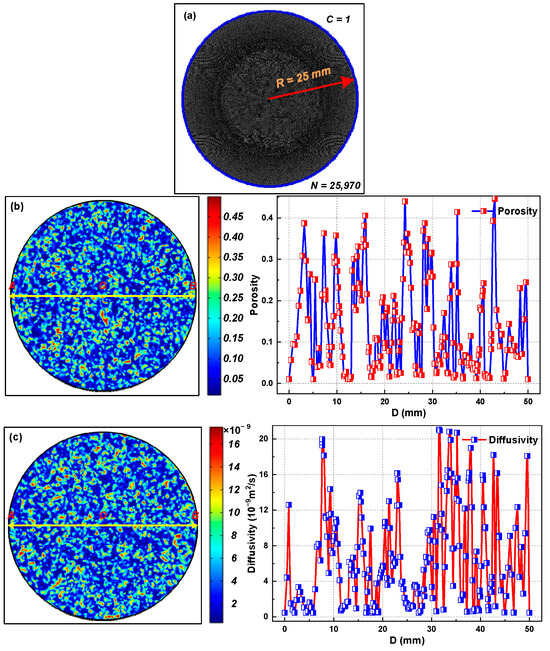
Figure 7.
Finite element model construction and nonuniform treatment of physical properties. Note: In (b,c), the left side depicts the distribution of porosity/diffusion coefficients across the entire coal sample, while the right side shows this distribution across the diameter AB of the sample. The colour bands indicate the porosity/diffusion coefficient values, with brighter colours denoting higher values. (a) Finite element model and boundary conditions; (b) porosity distribution; (c) distribution of diffusivity.
Here, n is the target variable representing the porosity or diffusion coefficient and is the corresponding mean value; and β is the shape factor of the Weber distribution function, representing the degree of concentration of the distribution of the target variable n. Specifically, the larger β is, the more concentrated the distribution around the mean value . Additionally, the generation of unacceptable values was avoided by setting a range () for all random variable values. At this point, the porosity and diffusion coefficients of the model can be considered nonuniform; their distributions are shown in Figure 7b,c. The other material parameters of the model are listed in Table 1. This method of characterising the heterogeneity of coal has been verified across multiple studies [43,44,45].

Table 1.
Finite element simulation parameters of the water diffusion process.
3.3. Water Diffusion Coefficient Determination
The method and parameters in Section 2.2 and Table 1 were used to simulate the diffusion of water in the coal samples. The evolution of the concentration over time is shown in Figure 8. The coloured bar located in the bottom-right corner of the graph serves as an indicator of the concentration range (ranging from 0 to 1) within the coal sample. The brightness of the colour correlates with higher concentrations. It is evident that as the immersion time progresses, the width of the circle within the highlighted area increases and gradually converges towards the centre. This trend closely aligns with the physical experimental observations and results, as depicted in Figure 3. It effectively illustrates the process of water diffusion into the interior of the coal sample. Moreover, this method enables us to obtain more precise data regarding the boundaries of the wet ring. As mentioned previously, β is the shape factor of the Weber distribution function and represents the degree of concentration of the distribution of the target variable n (here, the diffusion coefficient D and porosity φ). In this simulation, we set two shape factors β of 0.5 and 2500 for comparison (Figure 8a,b). The concentration boundaries shown in Figure 8a exhibit a nonsymmetric distribution owing to the nonuniformity of the parameter distribution, which reflects the non-homogeneity of the coal sample. In contrast, the simulation results at β = 2500 (Figure 8b) provide a more regular concentration boundary. However, the simulation results at β = 2500 are excessively idealised. Moreover, the model loses the non-homogeneity of the coal and can only be treated as a special case of a non-homogeneous model. Therefore, in the subsequent study, we considered the non-homogeneity of the model and used 0.5 as the assignment of the shape factor β.
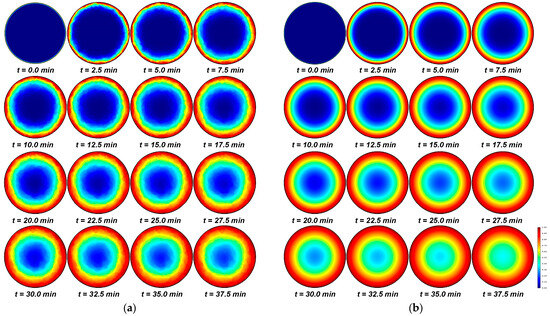
Figure 8.
Numerical simulation results of water diffusion process: (a) β = 0.5, (b) β = 2500.
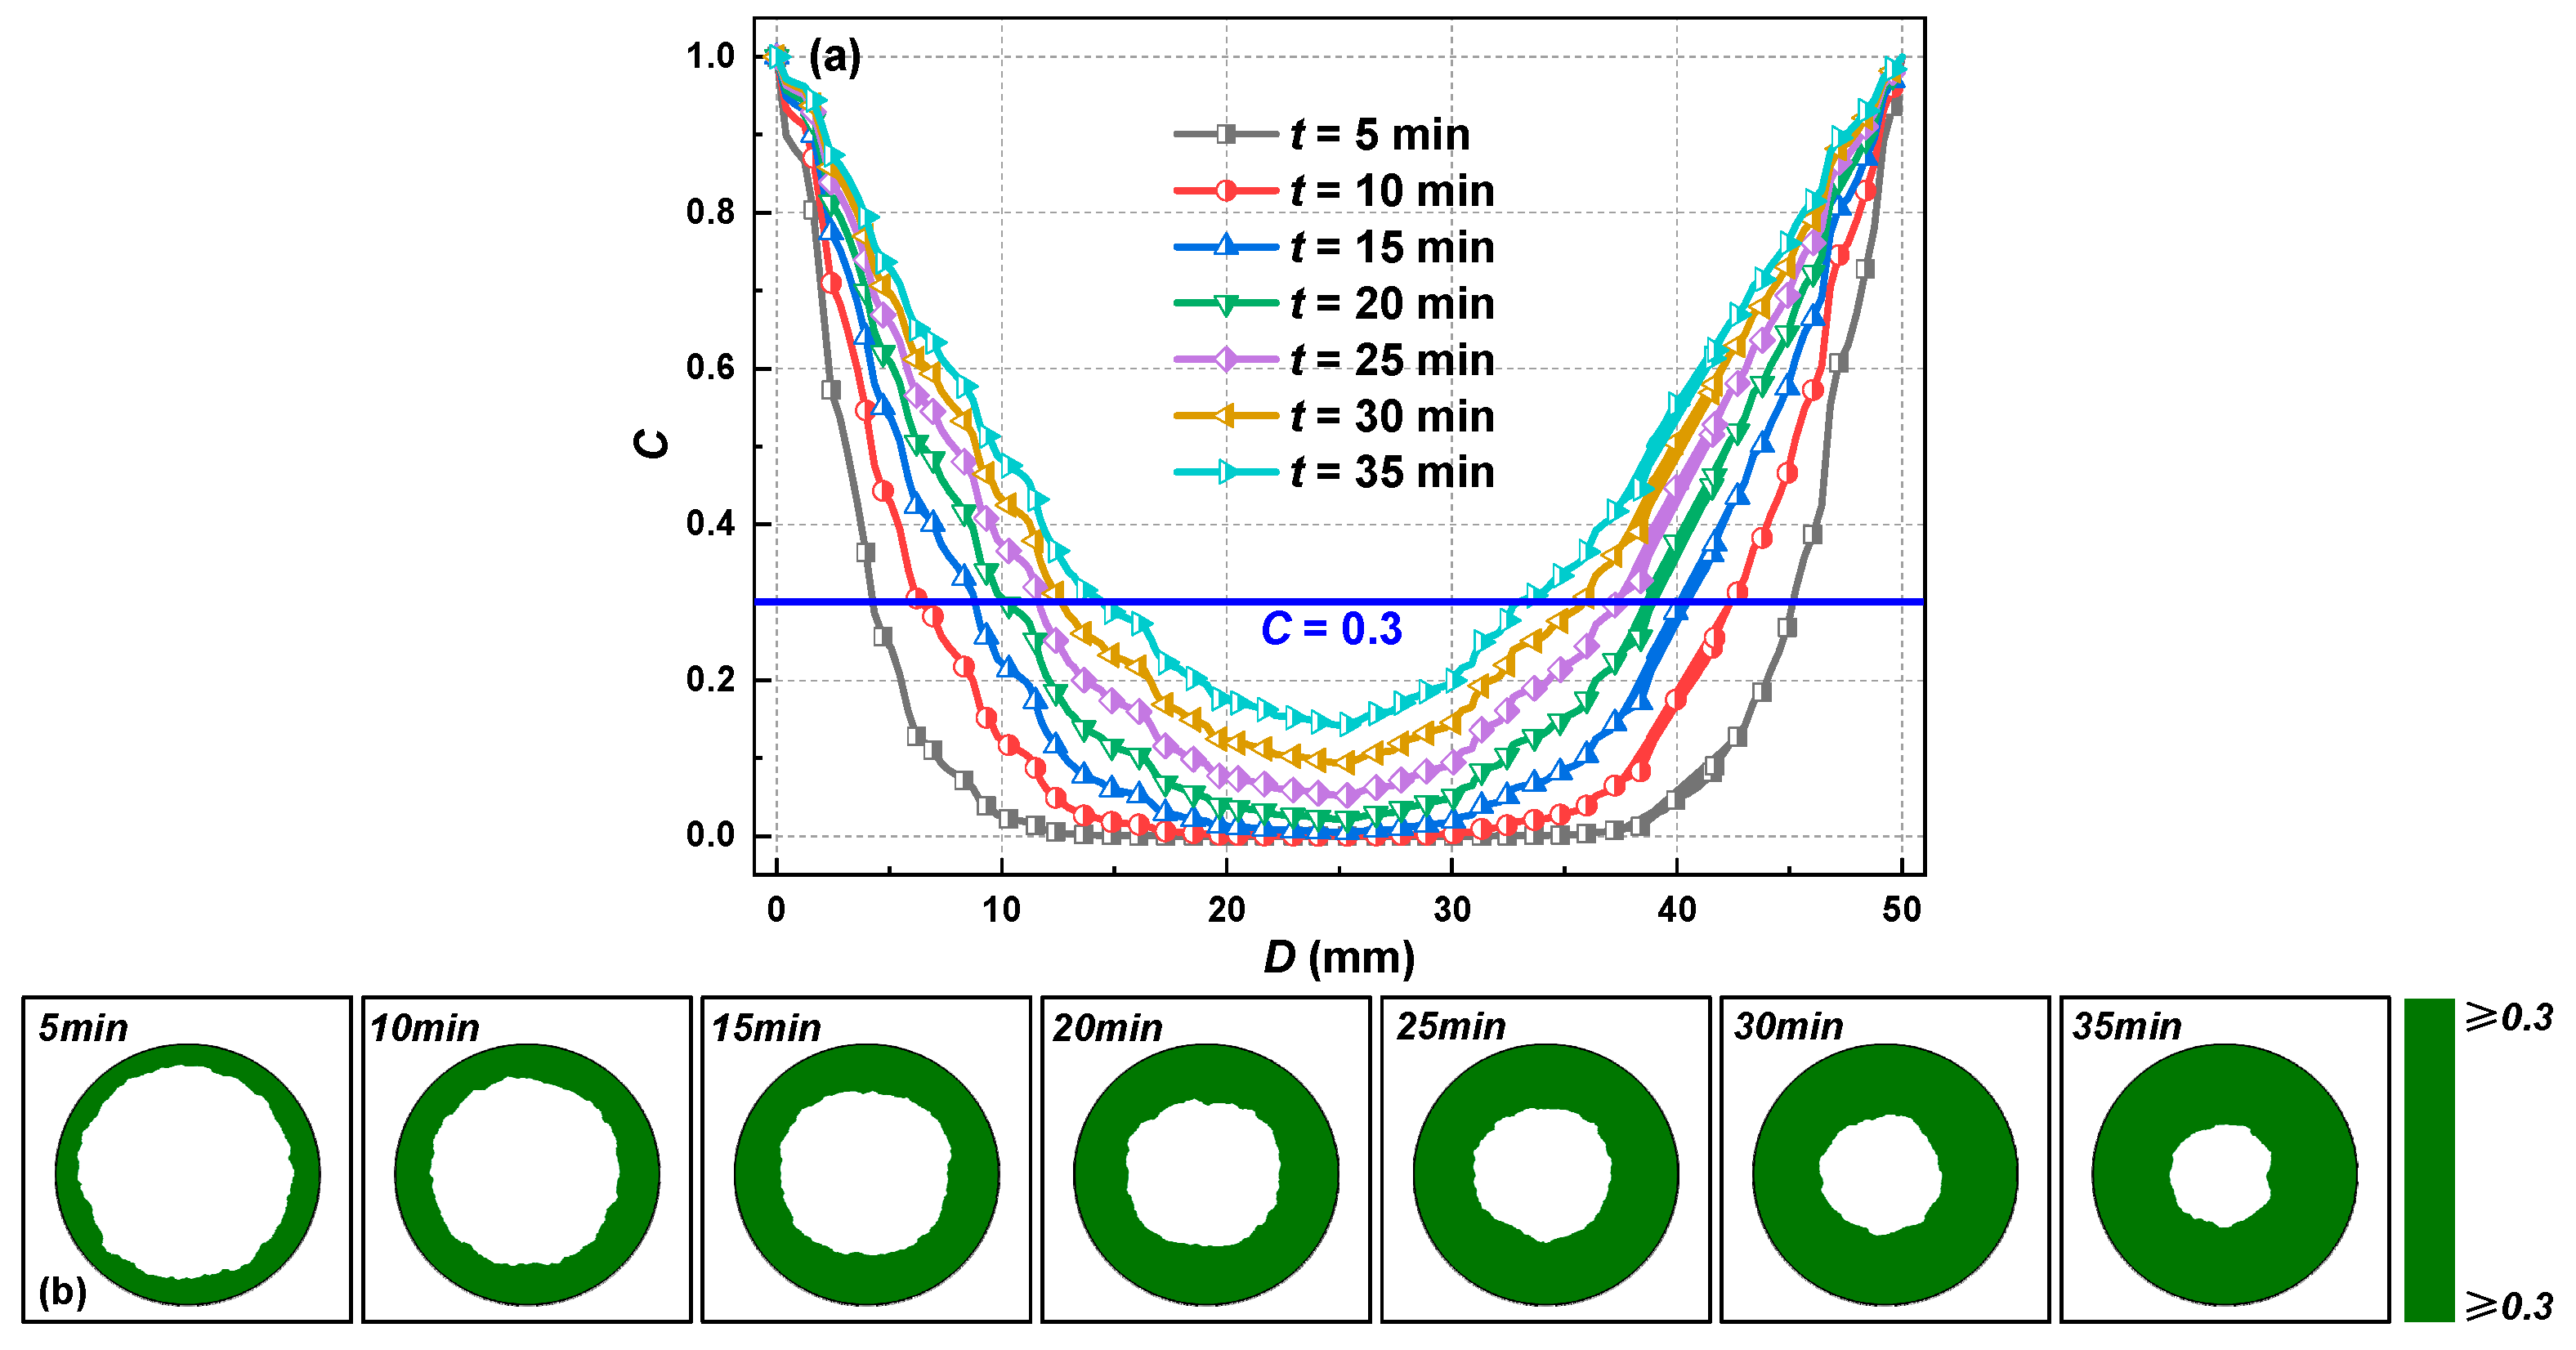
The variation in concentration along the diameter of the sample at different immersion times is shown in Figure 9a. Assuming that the sample was water-bearing when the concentration reached 0.3, it was possible to quantitatively characterise the water diffusion process within the sample. Using C = 0.3 as the concentration boundary, the cross-sectional water distribution of the coal sample was plotted (as shown in Figure 9b). The green area denotes the water content area of the coal sample, and the boundary between the green and white areas is the inner boundary of the wet ring of the coal sample; based on this boundary, the widths of the wet ring of the coal samples were determined to be 4.55 mm, 7.76 mm, 9.26 mm, 11.38 mm, 12.97 mm, and 15.89 mm when the water immersion time t was 5, 10, 15, 20, 25, 30, and 35 min, respectively. With increasing immersion time, the width of the rings gradually increases, extending toward the centre and aligning with the experimental observations illustrated in Figure 10. Meanwhile, the testing accuracy of the width of the wet ring is 0.01 mm, with a testing error of no more than 0.1 mm (i.e., 0.2%). This demonstrates that the model in Section 2.2 and the parameters in Table 1 can effectively describe the diffusion of water in the coal samples.
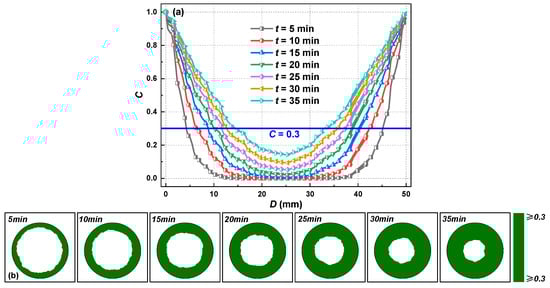
Figure 9.
Numerical simulation results: (a) concentration, (b) wetted ring. Note: the green colour in (b) indicates regions within the coal sample where C ≥ 0.3.
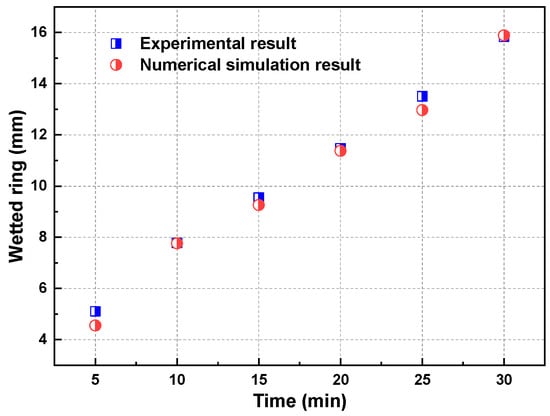
Figure 10.
Comparison of experimental results with numerical simulation results.
The thermal movements of fluid molecules cause the diffusive movement of the fluid, and the diffusion coefficient is the main physical parameter characterising the diffusion capacity of the fluid. Therefore, the accurate determination of the water diffusion coefficient of a coal sample is vital in ensuring a complete description of the water absorption process. To solve this problem, t = 20 min was chosen as the characteristic time point to analyse the water distribution at different diffusion coefficients, as shown in Figure 11. There are obvious differences in the degree of water absorption with different diffusion coefficients; the larger the diffusion coefficient, the larger the width of the wet ring, and the more concentrated the water-bearing region of the coal sample is towards the centre. The width of the wet rings of the coal samples was measured for different diffusion coefficients and analysed for comparison, as shown in Figure 12. The red dashed line in the graph shows the simulated wet ring width of the coal sample after 20 min of immersion. When D0 ≥ 12.0 × 10⁹ m2/s, the wet ring width reaches 25 mm after 20 min of immersion, which is 100% of the cross-sectional area of the coal sample; when D0 ≤ 0.45 × 10⁹ m2/s, the wet ring width does not exceed 5 mm after 20 min of immersion. A refined comparative analysis was performed after determining the upper and lower boundaries of the diffusion coefficients. The wet ring width is clearly most in accordance with the experimental observations when D0 = 4.5 × 10⁹ m2/s. Therefore, D0 = 4.5 × 10⁹ m2/s is a reasonable diffusion coefficient for this coal sample.
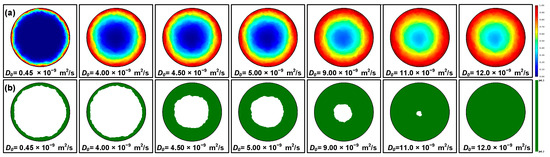
Figure 11.
Simulation results of the (a) concentration and (b) wet ring at different diffusion coefficients. Note: The coloured bands in (a) represent the value of the porosity/diffusion coefficient, with brighter colours representing higher porosity/diffusion coefficients. The green colour in (b) indicates regions within the coal sample where C ≥ 0.3.
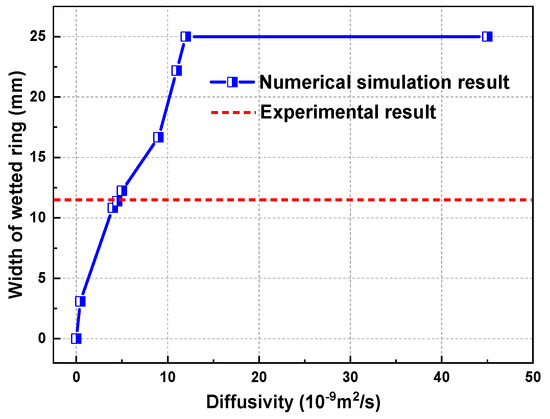
Figure 12.
The widths of the wetted rings of coal samples at different diffusivities (t = 20 min).
3.4. Engineering Applications
As previously mentioned, this study was conducted within the engineering context of assessing the stability of coal pillar dams in underground reservoirs within coal mines. These coal pillar dams, initially formed as boundary coal pillars left after coal extraction, endure a multitude of challenges. They are not only exposed to long-term erosion and water infiltration but are also subjected to complex loads resulting from the movement and breakage of the roof and the presence of unique geological structures, such as faults during the coal mining process. According to the “Limit Equilibrium Theory” [46] in mining rock mechanics, after the coal pillar dam is left in place, the support pressure above it gradually increases as the distance from the working face increases, and then it gradually decreases after the peak until it returns to the original rock stress level (γH), as shown in Figure 13. The coal pillar dam passes through the broken zone (A), plastic zone (B), resilient zone (C), and primary rock stress zone (D), where the broken and plastic zones are collectively referred to as the limit equilibrium zone. As the distance from the working face decreases, a notable increase in the degree of fragmentation is observed in the coal pillar dam. This fragmentation corresponds to a heightened level of pore development within the dam. In particular, within the broken zone (denoted as “A”), the coal exhibits extensive macroscopic fractures, facilitating the direct flow of water into and through the coal.
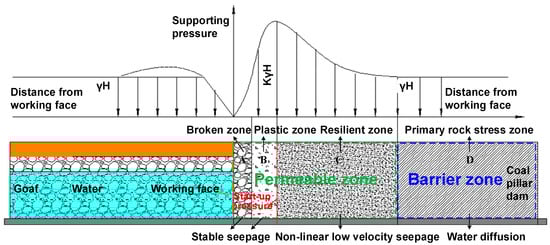
Figure 13.
Application of water diffusion model in engineering practice.
Currently, the exploration of the permeability properties of coal rock bodies is mainly performed by testing coal rock samples in the laboratory. During permeability testing, fluids are driven under pressure to select the path of least resistance and most permeability from the intersecting pore structures, to evaluate their speed in reaching the end of the sample. In other paths where the resistance along the path is higher than that described above, the fluids reach the end of the sample with relative lags depending on the route taken. Only a limited number of infiltration paths contribute to the test results for the infiltration flow. Flows that do not reach the end of the sample within the test time are not counted, and these paths can be considered “impermeable” [47]. Similarly, when solving engineering problems, fluid paths that are not critical to the project at the time of interest can be considered “impermeable”, even if they are detected. Further, when the porosity of the coal body is much lower than that required to study the problem, it is macroscopically “impermeable”.
Combined with the analysis above, there is significant macroscopic damage to the coal pillar dam within the limit equilibrium zone (Figure 13), and water can pass smoothly under more relaxed conditions, a process that can be calculated using the steady seepage theory. In contrast, the coal body is relatively intact within the resilient zone (C), and the degree of pore fracture development is significantly reduced compared to the ultimate equilibrium zone, where fluids need a certain driving pressure (i.e., starting pressure) to pass through, which can be calculated using low-velocity non-linear seepage theory. Therefore, the above-mentioned limit equilibrium area can be considered a “permeable zone” at a macro level. As the distance from the working face continues to increase, the support pressure gradually decreases to the original rock stress level (γH). Consequently, the coal pillar dam evolves, becoming more compact, robust, and intact, accompanied by a gradual increase in initial pressure. When the initial pressure surpasses the actual water pressure within the reservoir, it hinders the widespread flow of fluids through the coal body. In macroscopic studies, this region is often designated as the “barrier zone” or safety zone. However, it is essential to acknowledge the inherent limitations of this approach, as the conclusions drawn from it may potentially misguide decision-making during the construction of underground reservoirs in coal mines. In reality, water continues to percolate through the coal in this area, albeit at a much slower rate than typically considered in macroscopic analyses. When the time scale of the study is scaled up (e.g., over decades), cumulative effects and relative errors become even more pronounced. Clearly, the characteristics of water seepage within the coal mass in the “barrier zone” cannot be adequately investigated using macroscopic seepage theory alone. The present study offers an effective solution to this challenge. The application of the water diffusion characterisation method and the water diffusion model in our research has enabled us to quantify the infiltration characteristics throughout the entire coal pillar dam area, encompassing both the “permeable zone” and the “barrier zone” within the coal mine underground reservoir project. This has significantly improved the time scale and accuracy of the study. Furthermore, based on these findings, a technical system for the long-term stability assessment and prediction of coal pillar dams can be established. This system allows for the assessment of the service life of underground water reservoirs in coal mines, enhances the safety of workers, influences decision-making regarding water resource protection in mines, and may yield substantial economic, social, and ecological benefits.
It is worth noting that the coal samples in this study were immersed directly in water, an immersion environment somewhat different from reality, which caused the rapid diffusion rate seen in this experiment. In specific engineering applications, the liquid environment or boundary conditions at the front end of the “barrier zone” of a coal pillar dam can be adjusted according to the actual water content at the end of the “permeable zone” of the coal pillar dam to obtain a more scientific and accurate prediction of the diffusion area.
4. Discussion
In this study (Section 3.1), the uniformity of the distribution of the pixel greyscale values was used to determine the internal water distribution characteristics of the coal samples and predict the subsequent water absorption process, as shown in Figure 5b and Equations (3)–(5). In general, variance plays an important role in measuring the degree of uniformity (or dispersion) of the data distribution, but it was not an ideal choice in this study. When the variance was used as a characteristic parameter to assess the uniformity of the distribution of pixel greyscale values (as shown in Figure 14a), there was a decrease at both the beginning and end of the curve. For example, the variance at t = 5 min was significantly smaller than that at t = 10–25 min, implying that the water distribution of the samples was more uniform or closer to saturation overall at the beginning of the immersion than in the middle of the immersion, which is inconsistent with the actual situation (Figure 3). This is because variance is a statistic used to measure the distance between individual values and their mean (expectation), and it concerns the distribution of each group of data against its respective expected value. In this study, the expected pixel greyscale values of the NMR images of the coal samples at different immersion times exhibited marked differences and a clear upward trend, as illustrated in Figure 5a. Nevertheless, it became evident that the variances derived from these values proved inadequate for precisely characterising the internal water distribution and overall extent of water absorption within the coal samples.
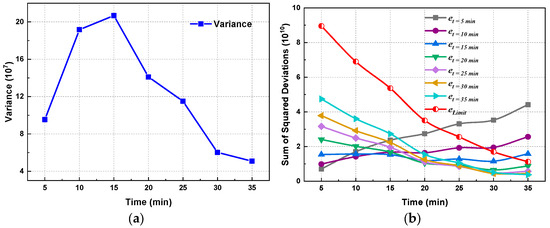
Figure 14.
Atypical variance (a) and the sum of squared deviations (b) of pixel greyscale values.
Instead, the sum of squared deviations was used; it assesses the degree of dispersion of individual values in a set of data relative to a specific reference value, which is most appropriate for this study. The setting of the reference value is a matter of reflection. Figure 14b shows the distribution of the sum of squared deviations when this reference value is set to the expected greyscale value of the image pixels for different immersion times. The curves of the sum of squared deviations show different, or even opposite, trends (as et = 5 min and et = 10 min) when the expected value for a specific immersion time (t = 5~35 min) is used as a reference value, and when the expected value differs excessively from the pixel greyscale value of the coal sample in its water-filled state. Therefore, as described in Section 3.1, we calculated the limiting expectation value of the image pixel greyscale value (44,334.4) based on the fitted curve of the expectation value of the pixel greyscale value (k < 0.01‰). The trend in the distribution of the sum of squared deviations when using this limit expectation as a reference value (Figure 14b) is clearly a more scientific, valid, and reasonable predictor of the water absorption process in the coal samples.
5. Conclusions
The main conclusions from this study are as follows:
- (1)
- Differences in the colour brightness of the radial MRI images of the coal samples were used to quantify the degree of water content. As the immersion time (t) increased, the width of the wet ring formed in the highlighted area of the image gradually increased, which quantitatively characterised the water absorption process of the coal sample. The expected value (e) and the sum of squared deviations (ss) of the pixel greyscale values were chosen to characterise the water saturation and spatial distribution of the coal samples. As the immersion time t of the coal samples increased, the expected value of the pixel greyscale values e increased, while the sum of squared deviations of those pixel values ss decreased; these values represented a positive and negative exponential function of t, respectively, indicating that the water saturation of the coal samples gradually increased and was more evenly distributed. The target variable stopped changing when the rate of change k < 0.01%, which provided a limit expectation value of 44,682.17 for the pixel greyscale value of the NMR image of the coal sample and predicted a limit absorption time of 49.63 h.
- (2)
- The Weber distribution function was used for the nonuniform assignment of physical properties (porosity φ and diffusion coefficient D) to the numerical model, and the water absorption process of the coal sample was characterised as a water diffusion process. The numerical simulation results were in accordance with the physical experimental results, and the water diffusion equation effectively reproduced the water absorption process of the coal sample, making it easier to obtain accurate wet ring boundary image data. A higher shape factor (e.g., β = 2500) provided a more regular boundary for the coal sample concentration; however, the simulation results were excessively idealistic and should only be used as a special case in a non-homogeneous model. Considering the non-homogeneity of the numerical model (β = 0.5), a reasonable diffusion coefficient value of 4.5 × 10⁻⁹ m2/s for the coal sample was determined based on the comparison and correction of the simulation and physical experimental results.
- (3)
- When the porosity of the coal body was much lower than that required for the problem of concern, it was considered macroscopically “impermeable”. Depending on the distribution of support pressure and the degree of fragmentation of the coal body, the coal pillar dam could be divided into a macroscopic “permeable zone” and a “barrier zone”. The water diffusion model in this study can reasonably explain and characterise the water transport process within the macroscopic “barrier zone” of a coal pillar dam and can be combined with other macroscopic percolation theories used in the macroscopic “permeable zone” to provide a quantitative evaluation of the water transport and permeability characteristics of a coal pillar dam at all stages. This enhancement greatly extends the time scope and bolsters the accuracy of the outcomes of this study. Moreover, it offers valuable insights to inform decision-making regarding mine water resource protection planning, potentially yielding substantial economic, social, and ecological advantages. Moving forward, the primary research focus will be on amalgamating the findings from this paper to further refine and establish a comprehensive technology system for the stability assessment of coal pillar dams.
Water–rock interactions entail complex reactions across physical, chemical, and mechanical dimensions, influenced by an array of diverse factors. In this study, the utilisation of purified water to investigate the water transport process in coal samples meets general criteria but ignores certain specific scenarios. For instance, mine water exhibits acidic or alkaline characteristics due to complex chemical reactions with crushed coal and rock. Therefore, subsequent research should build upon this study to further investigate the impact of acidity and alkalinity on water transport patterns in coal samples. Furthermore, to unveil the full-stage water transport mechanisms in coal pillar dams, establishing the relationship between concentration and water content as presented in this study represents a critical direction for future research.
Author Contributions
Conceptualisation, L.Y. and H.X.; data curation, L.Y. and H.X.; formal analysis, L.Y. and X.L.; investigation, Z.C. and H.X.; methodology, L.Y. and Z.C.; supervision, L.Y. and X.L.; validation, X.L.; writing—original draft, L.Y.; writing—review and editing, X.L. All authors have read and agreed to the published version of the manuscript.
Funding
This research received no external funding.
Data Availability Statement
The raw data supporting the conclusions of this article will be made available by the authors on request.
Conflicts of Interest
The authors declare no conflicts of interest.
References
- Gu, D.Z.; Li, J.F.; Cao, Z.G.; Wu, B.Y.; Jiang, B.B.; Yang, Y.; Yang, J.; Chen, Y.P. Technology and engineering development strategy of water protection and utilization of coal mine in China. J. China Coal Soc. 2021, 46, 3079–3089. (In Chinese) [Google Scholar]
- National Bureau of Statistics of the People’s Republic of China. Statistical Bulletin on National Economic and Social Development of the People’s Republic of China, 2022. China Stat. 2023, 3, 12–29. [Google Scholar]
- National Bureau of Statistics of the People’s Republic of China. Energy Production in December 2022. 2023. Available online: http://www.stats.gov.cn/sj/zxfb/202302/t20230203_1901714.html (accessed on 17 January 2023).
- National Bureau of Statistics of the People’s Republic of China. China Statistical Yearbook 2022; China Statistics Press: Beijing, China, 2023.
- Cao, J.; Huang, Q.X.; Guo, L.F. Subsidence prediction of overburden strata and ground surface in shallow coal seam mining. Sci. Rep. 2021, 11, 18972. [Google Scholar] [CrossRef] [PubMed]
- Gu, D.Z. Theory framework and technological system of coal mine underground reservoir. J. China Coal Soc. 2015, 40, 239–246. (In Chinese) [Google Scholar]
- Sheshpari, M. A review of underground mine backfilling methods with emphasis on cemented paste backfill. Electron. J. Geotech. Eng. 2015, 20, 5183–5208. [Google Scholar]
- Xu, Y.J.; Ma, L.Q.; Naseer, M.K. Prediction and maintenance of water resources carrying capacity in mining area—A case study in the yu-shen mining area. Sustainability 2020, 12, 7782. [Google Scholar] [CrossRef]
- Hummel, M.; Hummelova, H.; Koudelkova, J.; Cerna, K. Mining of protection pillars without subsidence. J. Min. Sci. 2015, 51, 335–341. [Google Scholar] [CrossRef]
- Huang, Q.X.; Zhou, J.L.; Cao, J. Key stratum structure and support working resistance of longwall face with large mining height in the shallow coal seams, China. Adv. Civ. Eng. 2020, 2020, 8834403. [Google Scholar] [CrossRef]
- Cedric, C.; Andrea, D.; Annette, D. Element and isotope mobility during water–rock interaction processes. Phys. Chem. Earth 2005, 30, 993–996. [Google Scholar]
- Liu, Y.B.; Yin, G.Z.; Zhang, D.M.; Huang, G.; Liu, P.; Liu, C.; Zhao, H.G.; Yu, B.C. Mechanical properties and failure behavior of dry and water-saturated anisotropic coal under true-triaxial loading conditions. Rock Mech. Rock Eng. 2019, 53, 4799–4818. [Google Scholar] [CrossRef]
- Kang, H.P. Water damage to rocks. Hydrogeol. Eng. Geol. 1994, 3, 39–41. [Google Scholar]
- Hawkins, A.B.; McConnell, B.J. Sensitivity of sandstone strength and deformability to changes in moisture content. Q. J. Eng. Geol. Hydrogeol. 1991, 24, 123–134. [Google Scholar] [CrossRef]
- Shen, R.X.; Li, H.R.; Wang, E.Y.; Li, D.X.; Hou, Z.H.; Zhang, X.; Han, X. Mechanical behavior and AE and EMR characteristics of natural and saturated coal samples in the indirect tensile process. J. Geophys. Eng. 2019, 16, 753–763. [Google Scholar] [CrossRef]
- Zhang, C.; Bai, Q.S.; Han, P.H.; Wang, L.; Wang, X.J.; Wang, F.T. Strength weakening and its micromechanism in water–rock interaction, a short review in laboratory tests. Int. J. Coal Sci. Technol. 2023, 10, 10. [Google Scholar] [CrossRef]
- Zhou, K.Y.; Dou, L.M.; Song, S.K.; Ma, X.T.; Chen, B.G. Experimental Study on the Mechanical Behavior of Coal Samples during Water Saturation. ACS Omega 2021, 49, 33822–33836. [Google Scholar] [CrossRef] [PubMed]
- Ai, T.; Wu, S.Y.; Zhang, R.; Gao, M.Z.; Zhou, J.F.; Xie, J.; Ren, L.; Zhang, Z.P. Changes in the structure and mechanical properties of a typical coal induced by water immersion. Int. J. Rock Mech. Min. Sci. 2021, 138, 104597. [Google Scholar] [CrossRef]
- Cai, X.; Zhou, Z.L.; Liu, K.W.; Du, X.M.; Zang, H.Z. Water-weakening effects on the mechanical behavior of different rock types: Phenomena and mechanisms. Appl. Sci. 2019, 9, 4450. [Google Scholar] [CrossRef]
- Chen, G.Q.; Li, T.B.; Wang, W.; Zhu, Z.F.; Chen, Z.Q.; Tang, O.L. Weakening effects of the presence of water on the brittleness of hard sandstone. Bull. Eng. Geol. Environ. 2019, 78, 1471–1483. [Google Scholar] [CrossRef]
- Noël, C.; Baud, P.; Violay, M. Effect of water on sandstone’s fracture toughness and frictional parameters: Brittle strength constraints. Int. J. Rock Mech. Min. Sci. 2021, 147, 104916. [Google Scholar] [CrossRef]
- Tang, C.J.; Yao, Q.L.; Li, Z.Y.; Zhang, Y.; Ju, M.H. Experimental study of shear failure and crack propagation in water-bearing coal samples. Energy Sci. Eng. 2019, 7, 2193–2204. [Google Scholar] [CrossRef]
- Zhao, Y.L.; Wang, Y.X.; Tang, L.M. The compressive-shear fracture strength of rock containing water based on Druker-Prager failure criterion. Arab. J. Geosci. 2019, 12, 452. [Google Scholar] [CrossRef]
- Liu, H.L.; Zhu, W.C.; Yu, Y.J.; Xu, T.; Li, R.F.; Liu, X.G. Effect of water imbibition on uniaxial compression strength of sandstone. Int. J. Rock Mech. Min. Sci. 2020, 127, 104200. [Google Scholar] [CrossRef]
- Chen, P.Z.; Tang, S.B.; Liang, X.; Zhang, Y.J.; Tang, C.N. The influence of immersed water level on the short- and long-term mechanical behavior of sandstone. Int. J. Rock Mech. Min. Sci. 2021, 138, 104631. [Google Scholar] [CrossRef]
- Zhou, Y.X.; Xia, K.; Li, X.B.; Li, H.B.; Ma, G.W.; Zhao, J.; Zhou, Z.L.; Dai, F. Suggested methods for determining the dynamic strength parameters and mode-I fracture toughness of rock materials. Int. J. Rock Mech. Min. Sci. 2012, 49, 105–112. [Google Scholar] [CrossRef]
- Yao, Q.L.; Tang, C.J.; Xia, Z.; Liu, X.L.; Zhu, L.; Chong, Z.H.; Hui, X.D. Mechanisms of failure in coal samples from underground water reservoir. Eng. Geol. 2020, 267, 105494. [Google Scholar] [CrossRef]
- Guo, J.C.; Zhou, H.Y.; Zeng, J.; Wang, K.J.; Lai, J.; Liu, Y.X. Advances in low-field nuclear magnetic resonance (NMR) technologies applied for characterization of pore space inside rocks: A critical review. Pet. Sci. 2020, 17, 1281–1297. [Google Scholar] [CrossRef]
- Yao, Y.B.; Liu, D.M.; Liu, J.G.; Xie, S.B. Assessing the water migration and permeability of large intact bituminous and anthracite coals using nmr relaxation spectrometry. Transp. Porous. Med. 2015, 107, 527–542. [Google Scholar] [CrossRef]
- Zhao, Y.X.; Sun, Y.F.; Liu, S.M.; Wang, K.; Jiang, Y.D. Pore structure characterization of coal by NMR cryoporometry. Fuel 2017, 190, 359–369. [Google Scholar] [CrossRef]
- Jia, H.H.; Ding, S.; Wang, Y.; Zi, F.; Sun, Q.; Yang, G.S. An NMR-based investigation of pore water freezing process in sandstone. Cold Reg. Sci. Technol. 2019, 168, 102893. [Google Scholar] [CrossRef]
- Yao, Y.B.; Liu, J.G.; Liu, D.M.; Wu, J.G. A Method for Measuring the Moisture Content of Coal in Different States. CN 201210395274, 3 February 2016. [Google Scholar]
- Norinaga, K.; Kumagai, H.; Hayashi, J.; Chiba, T. Classification of water sorbed in coal on the basis of congelation characteristics. Energy Fuels 1998, 12, 574–579. [Google Scholar] [CrossRef]
- Sun, X.X.; Yao, Y.B.; Chen, J.Y.; Xie, S.B.; Li, C.C. Determination of coal wettability by using low-field nuclear magnetic resonance. Geoscience 2015, 29, 190–197. [Google Scholar]
- He, Y.D.; Mao, Z.Q.; Xiao, L.Z.; Zhang, Y.Z. A new method to obtain capillary pressure curve using NMR T2 distribution. J. Jilin Univ. 2005, 35, 177–181. [Google Scholar]
- Wang, C.L.; Zhao, Y.; Li, N.; Bi, J. Permeability evolution of coal subjected to triaxial compression based on in-situ nuclear magnetic resonance. Int. J. Rock Mech. Min. Sci. 2022, 159, 105213. [Google Scholar] [CrossRef]
- Wang, N.; Du, Y.; Fu, C.Q.; Ma, X.; Zhang, X.; Wang, J.Y. Experimental Study on Spontaneous Imbibition of Coal Samples of Different Ranks Based on the NMR Relaxation Spectrum. ACS Omega 2023, 8, 33526–33542. [Google Scholar] [CrossRef] [PubMed]
- Chen, N. Study on Damage Characteristics of Coal Pillar Dam Body of Groundwater Reservoir under Dynamic and Static Load. Master’s Thesis, China University of Mining and Technology, Xuzhou, China, 2020. [Google Scholar]
- Cai, S.Y. Microstructure of coal outburst was studied by scanning electron microscopy. Coal Eng. 1986, 1986, 25–35. [Google Scholar]
- Liu, W.; Wang, G.; Han, D.Y.; Xu, H.; Chu, X. Accurate characterization of coal pore and fissure structure based on CT 3D reconstruction and NMR. J. Nat. Gas Sci. Eng. 2021, 96, 104242. [Google Scholar] [CrossRef]
- Zhao, Y.; Lin, B.Q.; Liu, T.; Zheng, Y.; Sun, Y.; Zhang, G.; Li, Q. Multifractal analysis of coal pore structure based on NMR experiment: A new method for predicting T2 cutoff value. Fuel 2021, 283, 119338. [Google Scholar] [CrossRef]
- Yu, L.Q.; Yao, Q.L.; Chong, Z.H.; Li, Y.H.; Xu, Q.; Liu, Z.C. Experimental study on the moisture migration and triaxial mechanical damage mechanisms of water-bearing coal samples. Int. J. Rock Mech. Min. Sci. 2022, 160, 105263. [Google Scholar] [CrossRef]
- Zhu, W.C.; Tang, C.A. Micromechanical model for simulating the fracture process of rock. Rock Mech. Rock Eng. 2004, 37, 25–56. [Google Scholar] [CrossRef]
- Luo, H.Y. Study on Migration Characteristics of the Leaked Hydrogen Sulfide from Cracked Oil/Gas Wells Penetrating Longwalling Mining Areas and Its Control by Injecting Lye. Master’s Thesis, China University of Mining and Technology, Xuzhou, China, 2023. [Google Scholar]
- Liang, Y.W. Permeability Evolution of Damaged Coal and Spatio-Temporal Migration Characteristics of Leaked Methane from Abandoned Wells in Co-Mining of Coal, Oil and Gas. Master’s Thesis, China University of Mining and Technology, Xuzhou, China, 2022. [Google Scholar]
- Qian, M.G.; Shi, P.W.; Xu, J.L. Mine Pressure and Rock Control; China University of Mining and Technology Press: Xuzhou, China, 2003. [Google Scholar]
- Yan, H.Y. Characteristics of “Load-Bearing and Per-Meable” Area of Coal Pillar Dam in Under-Ground Reservoir of Coal Mine. Master’s Thesis, China University of Mining and Technology, Xuzhou, China, 2021. [Google Scholar]


Disclaimer/Publisher’s Note: The statements, opinions and data contained in all publications are solely those of the individual author(s) and contributor(s) and not of MDPI and/or the editor(s). MDPI and/or the editor(s) disclaim responsibility for any injury to people or property resulting from any ideas, methods, instructions or products referred to in the content. |
© 2024 by the authors. Licensee MDPI, Basel, Switzerland. This article is an open access article distributed under the terms and conditions of the Creative Commons Attribution (CC BY) license (https://creativecommons.org/licenses/by/4.0/).