Abstract
Chemical sequestration is one important manner of CCUS. The injection of CO2 into an oil reservoir can not only sequestrate CO2 but also raise the oil recovery factor. The performance of chemical sequestration of CO2 depends on the interaction between CO2 solution and reservoir rock. In this paper, we have conducted three different scales of experiments, e.g., microscopic scale, core scale, and time scale, to fully investigate the interaction and resultant variation to mineral content, microscopic structure, porosity, and permeability under reservoir conditions (i.e., reservoir temperature of 90 °C) in Jimusar shale oil formation. The microscopic-scale experiment applied SEM and hyperspectral scanning to obtain microscopic pore throat structure and element distribution before and after soaking the rock in CO2 solution. The core-scale experiment employed XRD to evaluate mineral content variation caused by CO2 solution. Core flooding experiments were conducted to evaluate porosity and permeability variation caused by the dissolution of CO2 solution into the core samples. The third type of experiment was employed to investigate the effect of time sequence on the dissolution, in which the time ranged from 1 day to 14 days continuously. The experimental results indicate that, under Jimsar reservoir conditions, CO2 solution exhibits a relatively robust dissolution capability, causing significant alterations to the properties of the core samples. Specifically, the CO2 solution effectively dissolves carbonate upon contact. Calcite is the primary target for dissolution, followed by dolomite. In the presence of sufficient CO2, complete dissolution of all carbonates is achievable. On a microscopic scale, dissolution primarily occurs in the calcium-rich areas, leaving other regions unaffected. The typical pore size resulting from CO2 solution-induced dissolution ranges from several to dozens of micrometers. This dissolution process significantly enhances both porosity and permeability. For Jimsar shale core samples, porosity experienced an increase of over 20%, and permeability nearly doubled. Under Jimsar reservoir conditions at 90 °C, CO2 solution can consume all carbonates present in core samples within 8 days. The increase in porosity and permeability is rapid during the initial days and stabilizes around the 6th day. These research findings establish a theoretical foundation for CO2 chemical sequestration.
1. Introduction
Since the Industrial Revolution, the burning and use of large amounts of organic fossil fuels has caused a continuous increase in CO2 concentration in the atmosphere, triggering a series of serious ecological and environmental problems such as global warming and frequent extreme weather [1]. How to achieve CO2 emission reduction, capture, storage, and utilization has become the current focus of attention around the world. In order to cope with the challenges brought by global climate change and environmental pollution and achieve sustainable economic development, our country has proposed a major strategic decision of “carbon peaking and carbon neutrality”. At the same time, our country is facing the increasingly severe complex situation of expanding energy resource consumption demand and insufficient supply of conventional energy resources. Unconventional oil and gas resources such as shale oil have huge reserves as follow-up energy resources, with a technically recoverable volume of 13.18 billion tons [2]. They are becoming the main development module to ensure a strong supply of energy in our country in the future [3,4,5].
Scholars have conducted extensive experimental research on the interaction between CO2 and reservoir rocks and crude oil [6,7,8]. The research can be broadly categorized into four types, as follows. Simulation of reservoir conditions: Studies the interaction between CO2 and reservoir rocks under simulated reservoir conditions. This type of research primarily uses X-ray diffraction and scanning electron microscopy to test changes in the mineral composition of reservoir rocks. Some studies also investigate changes in reservoir properties such as porosity and permeability. CO2 interaction with reservoir crude oil: Focuses on experiments using slim tubes to study the phase behavior of CO2 and subsurface crude oil. The aim is to explore the mechanism of enhanced oil recovery under reservoir temperature and pressure conditions. CO2-induced fracture initiation and propagation: Investigates the impact of CO2 on fracture initiation and propagation. Large-scale outcrop studies are conducted to examine the fracture initiation pressure and expansion morphology under different displacement and injection methods. These research endeavors contribute to a better understanding of the complex interactions between CO2, reservoir rocks, and crude oil under various geological conditions. The techniques employed include X-ray diffraction, scanning electron microscopy, and experiments with slim tubes and large-scale outcrops.
The permeability properties of shale oil reservoirs are very poor, requiring large-scale hydraulic fracturing to achieve economic development. Currently, hydraulic fracturing of shale oil reservoirs mainly uses conventional water-based fracturing fluids [9,10,11]. However, due to the high horizontal stress difference in the reservoir, it is difficult to form complex fractures during fracturing construction, and the scope of stimulation is limited. Supercritical CO2 fracturing fluid has the physical properties of ultra-low viscosity and high permeability, making it easier to penetrate and open weak surfaces such as natural fractures [12,13,14]. Even in shale oil reservoirs with high levels of stress difference, supercritical CO2 fracturing can form a fracture system with a certain degree of complexity. In addition, CO2 injected into shale reservoirs can quickly replenish reservoir energy, and after being dissolved in crude oil, it can reduce crude oil viscosity, reduce seepage resistance, and improve oil washing efficiency; some CO2 will also be retained for a long time due to pore adsorption, chemical conversion, etc., to achieve storage [15,16]. Injecting CO2 into the reservoir in this way to achieve increased production and carbon sequestration can be a win–win situation [17,18,19,20].
In the 1950s, field experiments related to the miscibility of CO2 and crude oil were carried out in the Permian Basin of the United States. CO2, one of the products generated after the combustion of crude oil, was injected into the reservoir from the wellhead to improve oil recovery [21,22,23,24]. CO2 will be in a supercritical state under the conditions of high temperature and high pressure in the formation, as its density is similar to that of a liquid, and its viscosity is similar to that of a gas. Previous research results show that there are miscible conditions between crude oil and CO2 [25,26]. When the miscibility pressure between the two is reached, CO2 can better replace the crude oil in the pores, reduce the seepage resistance, and achieve a good production increase effect; CO2 front energy storage can effectively reduce fracture initiation pressure, increase fracture complexity, and improve artificial seepage fluid conductivity; and CO2 forms a weakly acidic solution when dissolved in formation water, which can cause physical and chemical interactions with reservoir rocks and dissolve some mineral components [25,26,27]. On the one hand, the porosity and permeability of the affected reservoir will increase exponentially; on the other hand, the clay mineral particles may fall off and migrate after carbonate precipitation and dissolution, resulting in pore throat blockage, porosity, and permeability appears to be reduced [28,29,30].
To clarify the interaction law of CO2 and shale reservoir, the Jimsar shale reservoir in Xinjiang oilfield is taken as the research object to carry out experiments. Mechanism analysis of the Jimsar shale reservoir in Xinjiang oilfield and CO2 is carried out by experimental tests including a mineral composition test, a CO2 dissolve mineral test, a CO2 influence core porosity, and a permeability test. The dissolution of rock and the change in pore throat size were studied by XRD and SEM. Research results provide a basis for theoretical understanding and are intended to be beneficial to the reservoir development in the research area. The novelty of this study mainly focuses on a comprehensive experimental method to investigate the interaction between CO2 and reservoir rock. In this study, we have conducted three different scales of experiments, e.g., microscopic scale, core scale, and time scale, to fully investigate the interaction and resultant variation to mineral content, microscopic structure, porosity, and permeability under reservoir conditions (i.e., reservoir temperature of 90 °C) in the Jimusar shale oil formation.
2. Materials and Methods
2.1. Experimental Material
The shale samples used in the experiment were taken from 4 layers with different depths near the lower sweet spot of the Ji-33 well area in the northern slope of the Jimsar Depression in the eastern uplift of the Junggar Basin in Xinjiang, with core depths of 3829~3830.72 m, 3830.72~3832.5 m, 3832~3834, and 3837~3844 m, numbered DL1, DL2, DL3, and DL4, respectively. The mineral composition is mainly quartz, plagioclase, calcite, and dolomite, with a high carbonate content and a small amount of clay. Some sections contain siderite and glauberite. The formation water used in the experiment is oil well produced water, CaCl2 type, and the main ions are K+ and Na+, Ca2+, Cl−, and HCO3−. CO2 gas (purity 99.9%) was used in the experiment. The carbon tetrachloride (purity 99.5%) and absolute ethanol (purity 99.8%) were used to wash the oil. Although the four groups of core samples come from different depths, there is little difference. The four groups of core samples are located in the same strata and therefore have very similar mineral composition and mechanical properties.
2.2. Experimental Apparatus
The experimental apparatus mainly includes:
- (1)
- Corrosion-resistant high-temperature high-pressure reaction vessel (constructed from Hastelloy alloy, inner chamber diameter of 5 cm, depth of 8 cm, volume of 157 cm3, sealed with a fluororubber ring, and maximum working pressure 50 MPa).
- (2)
- D2 phaser diffractometer (with a 2θ rotation angle range of −110° to 168°, readable minimum step size better than 0.002°, angle reproducibility better than 0.002°, capable of conventional and small-angle measurements, and equipped with a scintillation counter and array detector).
- (3)
- Quanta200F field emission environmental Scanning Electron Microscope (resolution 1.2 nm, magnification 25~200 K, featuring high vacuum, low vacuum, and environmental scanning modes).
- (4)
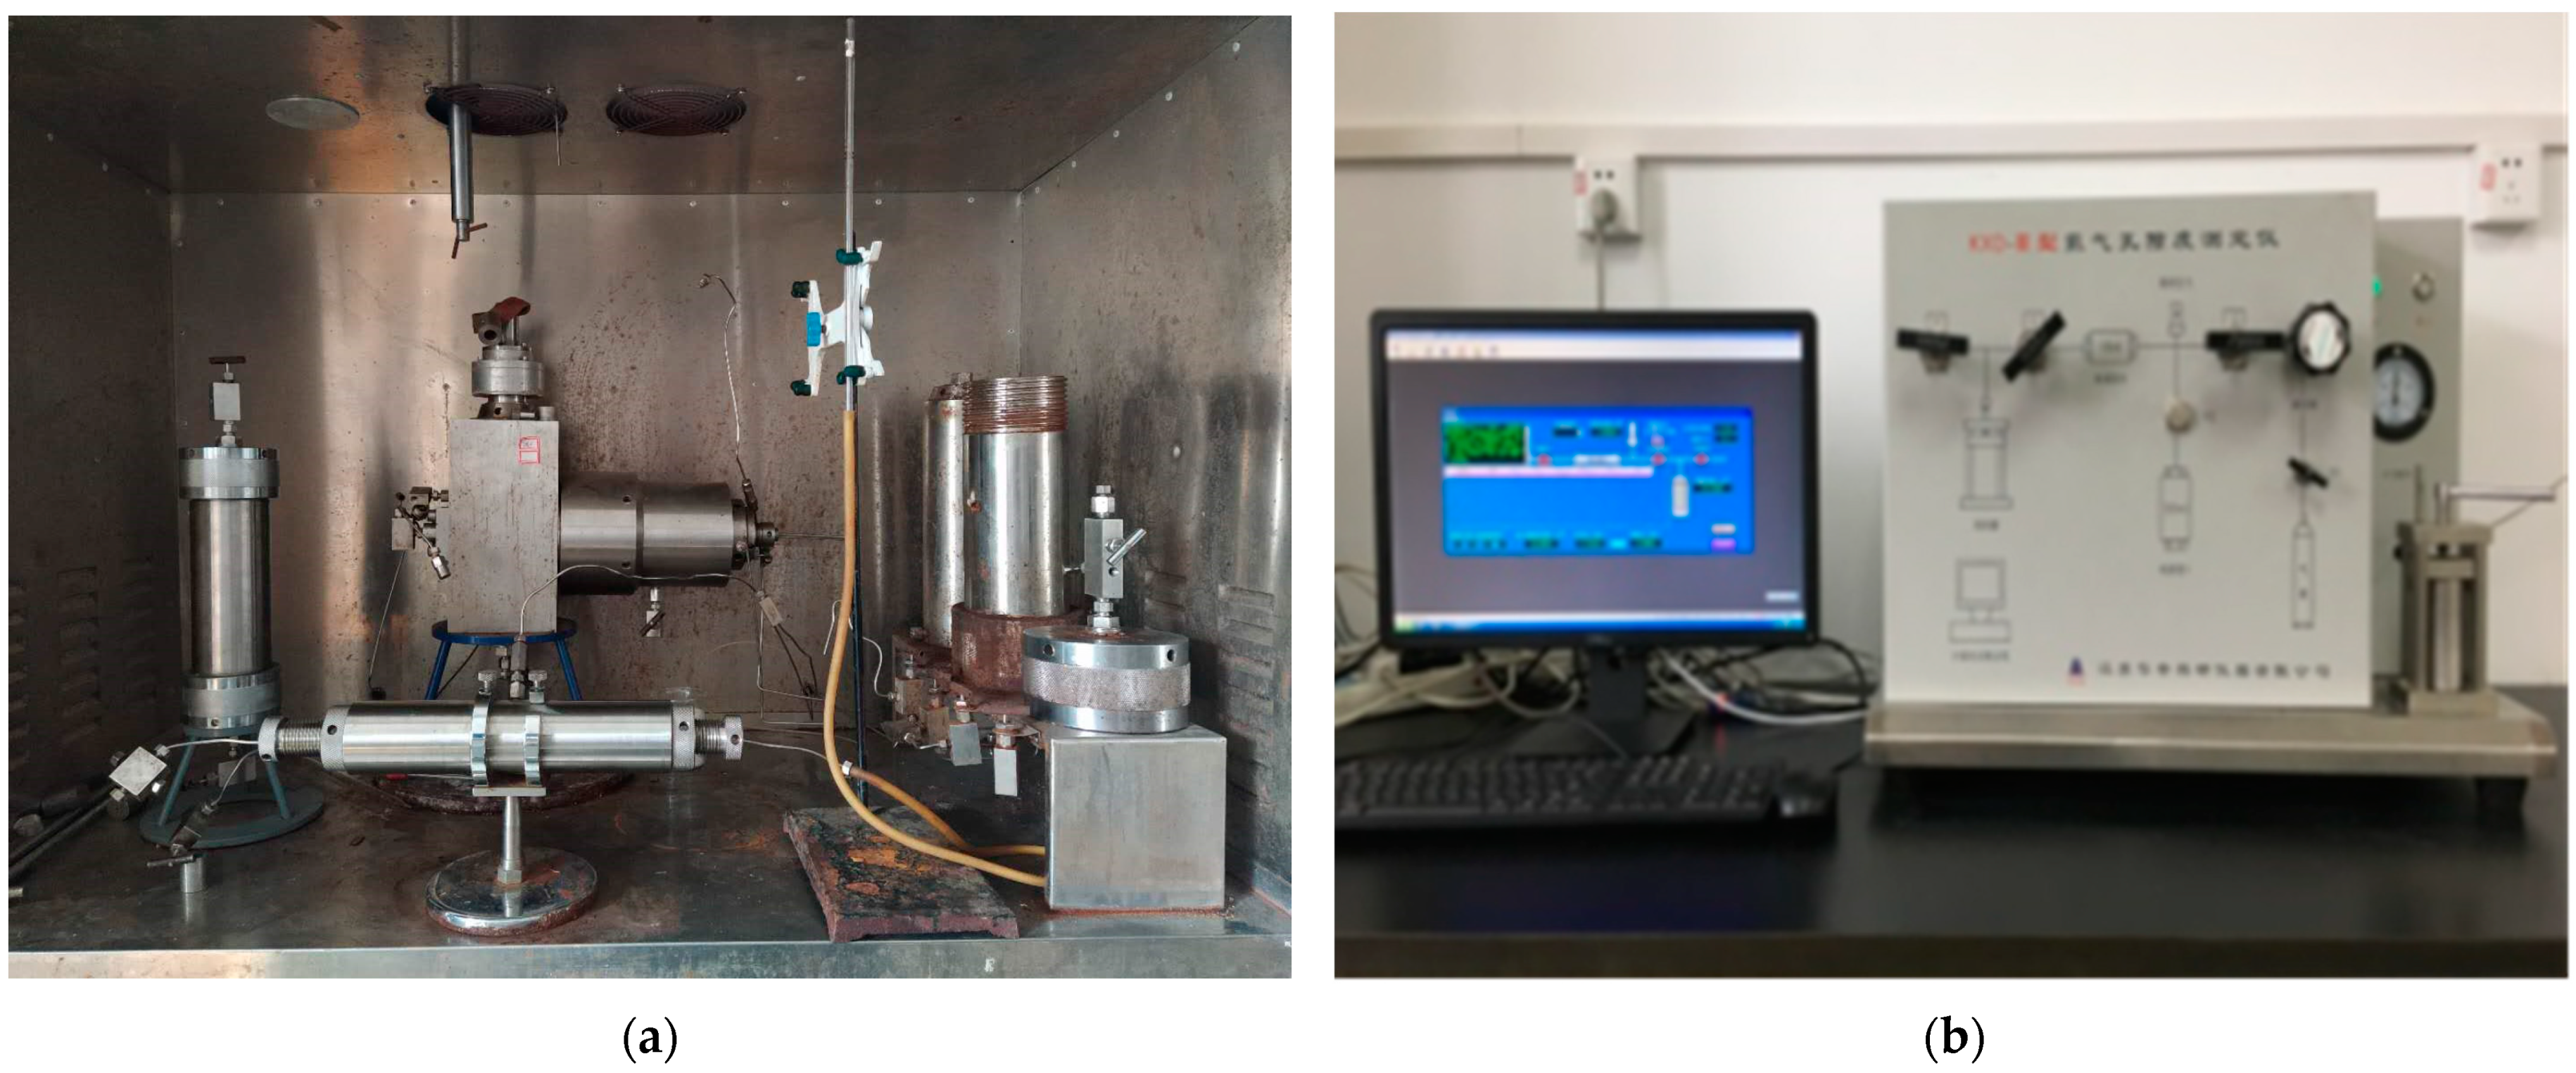
- Pulse decay method gas permeability measurement instrument (utilizing pressure pulse decay method to measure the Kozeny permeability of core samples, measuring range 0.00001~10 mD, short measurement stabilization time, and fast speed), as shown in Figure 1a.
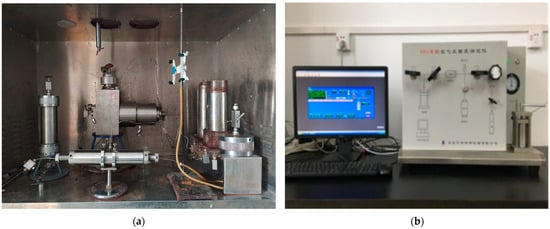 Figure 1. The experimental apparatus for measuring core porosity and permeability. (a) Permeability measurement instrument; (b) helium porosity measurement instrument.
 - (5)
- ML-J-2N fully automatic helium porosity meter (measurement accuracy 0.1%, measurement pressure 0.7 MPa), as shown in Figure 1b.
2.3. Experimental Methodology
In order to study the interaction and changes of mineral content, microstructure, porosity, and permeability under the Jimusar shale oil reservoir conditions, this paper designed experiments. The experiments comprised three aspects. One aspect was the microscopic experiment. We used SEM and hyperspectral scanning to obtain microscopic pore throat structure and element distribution before and after soaking the rock in CO2 solution. The secondary aspect was a core-scale experiment. We used XRD to evaluate mineral content variation caused by CO2 solution. Core flooding experiments were conducted to evaluate porosity and permeability variation caused by the dissolution of CO2 solution to the core samples. The third aspect experiments were conducted to investigate the effect of time sequence on the dissolution, in which the time ranged from 1 day to 14 days continuously.
2.3.1. Rock Sample Pretreatment
The selected rock samples were processed using a DY-4B efficient oil washing instrument. The oil washing solution comprised a mixed solution of carbon tetrachloride and anhydrous ethanol in a 1:1 ratio. After oil washing under a pressure of 0.5 MPa and a temperature of 90 °C for 7 days, the clarity of the organic solvent in the rock basket was observed. If it did not clarify, the oil washing process was continued until the organic solvent remained clear. The actual oil washing time was 11 days.
Following the oil washing treatment, the rock cores were cut and leveled. Standard rock cores with a diameter of 2.5 cm and a length of 5 cm were cut, along with several shale thin sections with a diameter of 2.5 cm and a thickness of 0.5 cm. The remaining rock fragments or shale slices soaked after cutting were ground into coarse and fine rock powder with a particle size of 300 mesh. All processed shale samples were sealed in polyethylene bags to prevent oxidation from prolonged exposure to air.
2.3.2. Whole Rock and Clay Mineral Analysis Experiment
In this experiment, the clay minerals and common non-clay minerals in sedimentary rocks were analyzed by X-ray diffraction. Whole Rock Analysis Experiment: The rock samples were finely ground to a particle size of above 300 mesh to prepare whole rock slices. The prepared samples were placed into the X-ray diffractometer after being leveled with a special scraper. The experiment used a 0.6 mm slit for incident radiation and an 8 mm slit for the detector. Scanning parameters included a step time of 0.5 s, a single step angle of 0.02°, and a total angle range of 204.5° to 50°. After scanning, XRD quantitative analysis method was employed to analyze the experimental results.
Clay Mineral Analysis Experiment: Approximately 3 g of finely ground rock powder with a particle size of 300 mesh was placed in a 200 mL beaker. After adding 100 mL of distilled water and stirring for dissolution, the clay particles were dispersed thoroughly using an ultrasonic oscillator. After standing for 4 h, about 50 mL of the upper clay liquid was extracted with a syringe and centrifuged at a speed of 3000 r/min for 30 min. The resulting clay particles were smeared onto a glass slide and dried naturally to create a uniform and smooth clay-oriented slide. This slide was then placed in the X-ray diffractometer with a 0.2 mm incident slit, a 3 mm detector slit, a scanning angle range of 2 Theta 3.5–15°, a step size of 0.02°, and a step time of 0.4 s for measurement and result storage. The measured clay-oriented slide was placed in a drying chamber with saturated ethylene glycol, heated and dried for 2.5 h, and then measured again in the X-ray diffractometer (settings unchanged) to record and store the experimental results. Subsequently, the clay-oriented slide was placed in a muffle furnace, heated to 500 °C for 2.5 h, taken out, and measured again in the X-ray diffractometer (settings unchanged). The three sets of measurement results were processed using analysis software to obtain the composition and mass percentage of clay minerals.
2.3.3. Electron Microscopy Scanning Experiment
The changes of pore throat structure in rock samples were obtained by scanning electron microscopy. Fresh surfaces were processed from cleaned rock slices to serve as observation surfaces. These surfaces were affixed to sample mounts with conductive adhesive and left to air-dry naturally. Finally, a gold coating was applied using a vacuum sputter coater to ensure good conductivity of the samples. For core samples subjected to immersion experiments (contamination experiments), efforts were made to preserve the original morphology as much as possible. This was carried out to provide visual data on the mineral types, sizes, and occurrences of fillings within the pores.
2.3.4. Core Porosity and Permeability Test Experiment
The changes of porosity and permeability parameters were obtained by rock core analysis method. Prior to the experiment, the standard core specimen was dried in an oven at 105 °C for 24 h, and the initial porosity and Kozeny–Carman permeability were measured. After the measurements, the core specimen was placed in a corrosion-resistant, high-temperature, and high-pressure reaction kettle. An amount of 80 mL of formation water was added, and the reaction kettle was sealed. The inflation constant temperature device was connected to the reaction kettle, and the temperature was raised to 90 °C for 2 h. Subsequently, preheated CO2 at 90 °C was injected into the reaction kettle through the intermediate container to achieve an overall pressure of 43 MPa for the water and gas mixture in the reaction kettle. After the target reaction time under this temperature and pressure condition, the core was taken out, dried for 24 h, and then the porosity and Kozeny–Carman permeability after the immersion effect were measured. This process was repeated until reaching the final experimental design target reaction time or when the porosity and Kozeny–Carman permeability values no longer increased. The immersion times for individual standard core specimens were not continuous but effectively and accurately reflected the changes in porosity and Kozeny–Carman permeability of a single standard core specimen with the increasing immersion time.
After the measurement was completed, we used the formula to calculate the permeability of different rock cores. The specific calculation formula was as follows:
In the formula, K—gas permeability, 10−3 um2; A—cross-sectional area of the rock sample, cm2; L—length of the rock sample, cm; P1, P2—atmospheric pressure at the inlet and outlet of the rock core, 0.1 MPa; μ—gas viscosity, mPa.s; and Q0—flow rate under atmospheric pressure, cm3/s.
After the oil washing was completed, crude oil is no longer present in the pores and fractures of the rock core and the saturation method can be used to measure porosity. Firstly, we weighed the dried core after washing the oil and placed the dried core into the core gripper. We added distilled water to the intermediate container and used a high-pressure pump to pressurize the intermediate container, which allowed it to hold pressure and penetrate the core gripper, and achieved the goal of saturating the core. After the saturation of the core was completed, we weighed it again to obtain the weight difference before and after saturation, and the porosity of the core after oil washing was calculated.
3. Experimental Results and Analysis
3.1. Mineral Composition Analysis
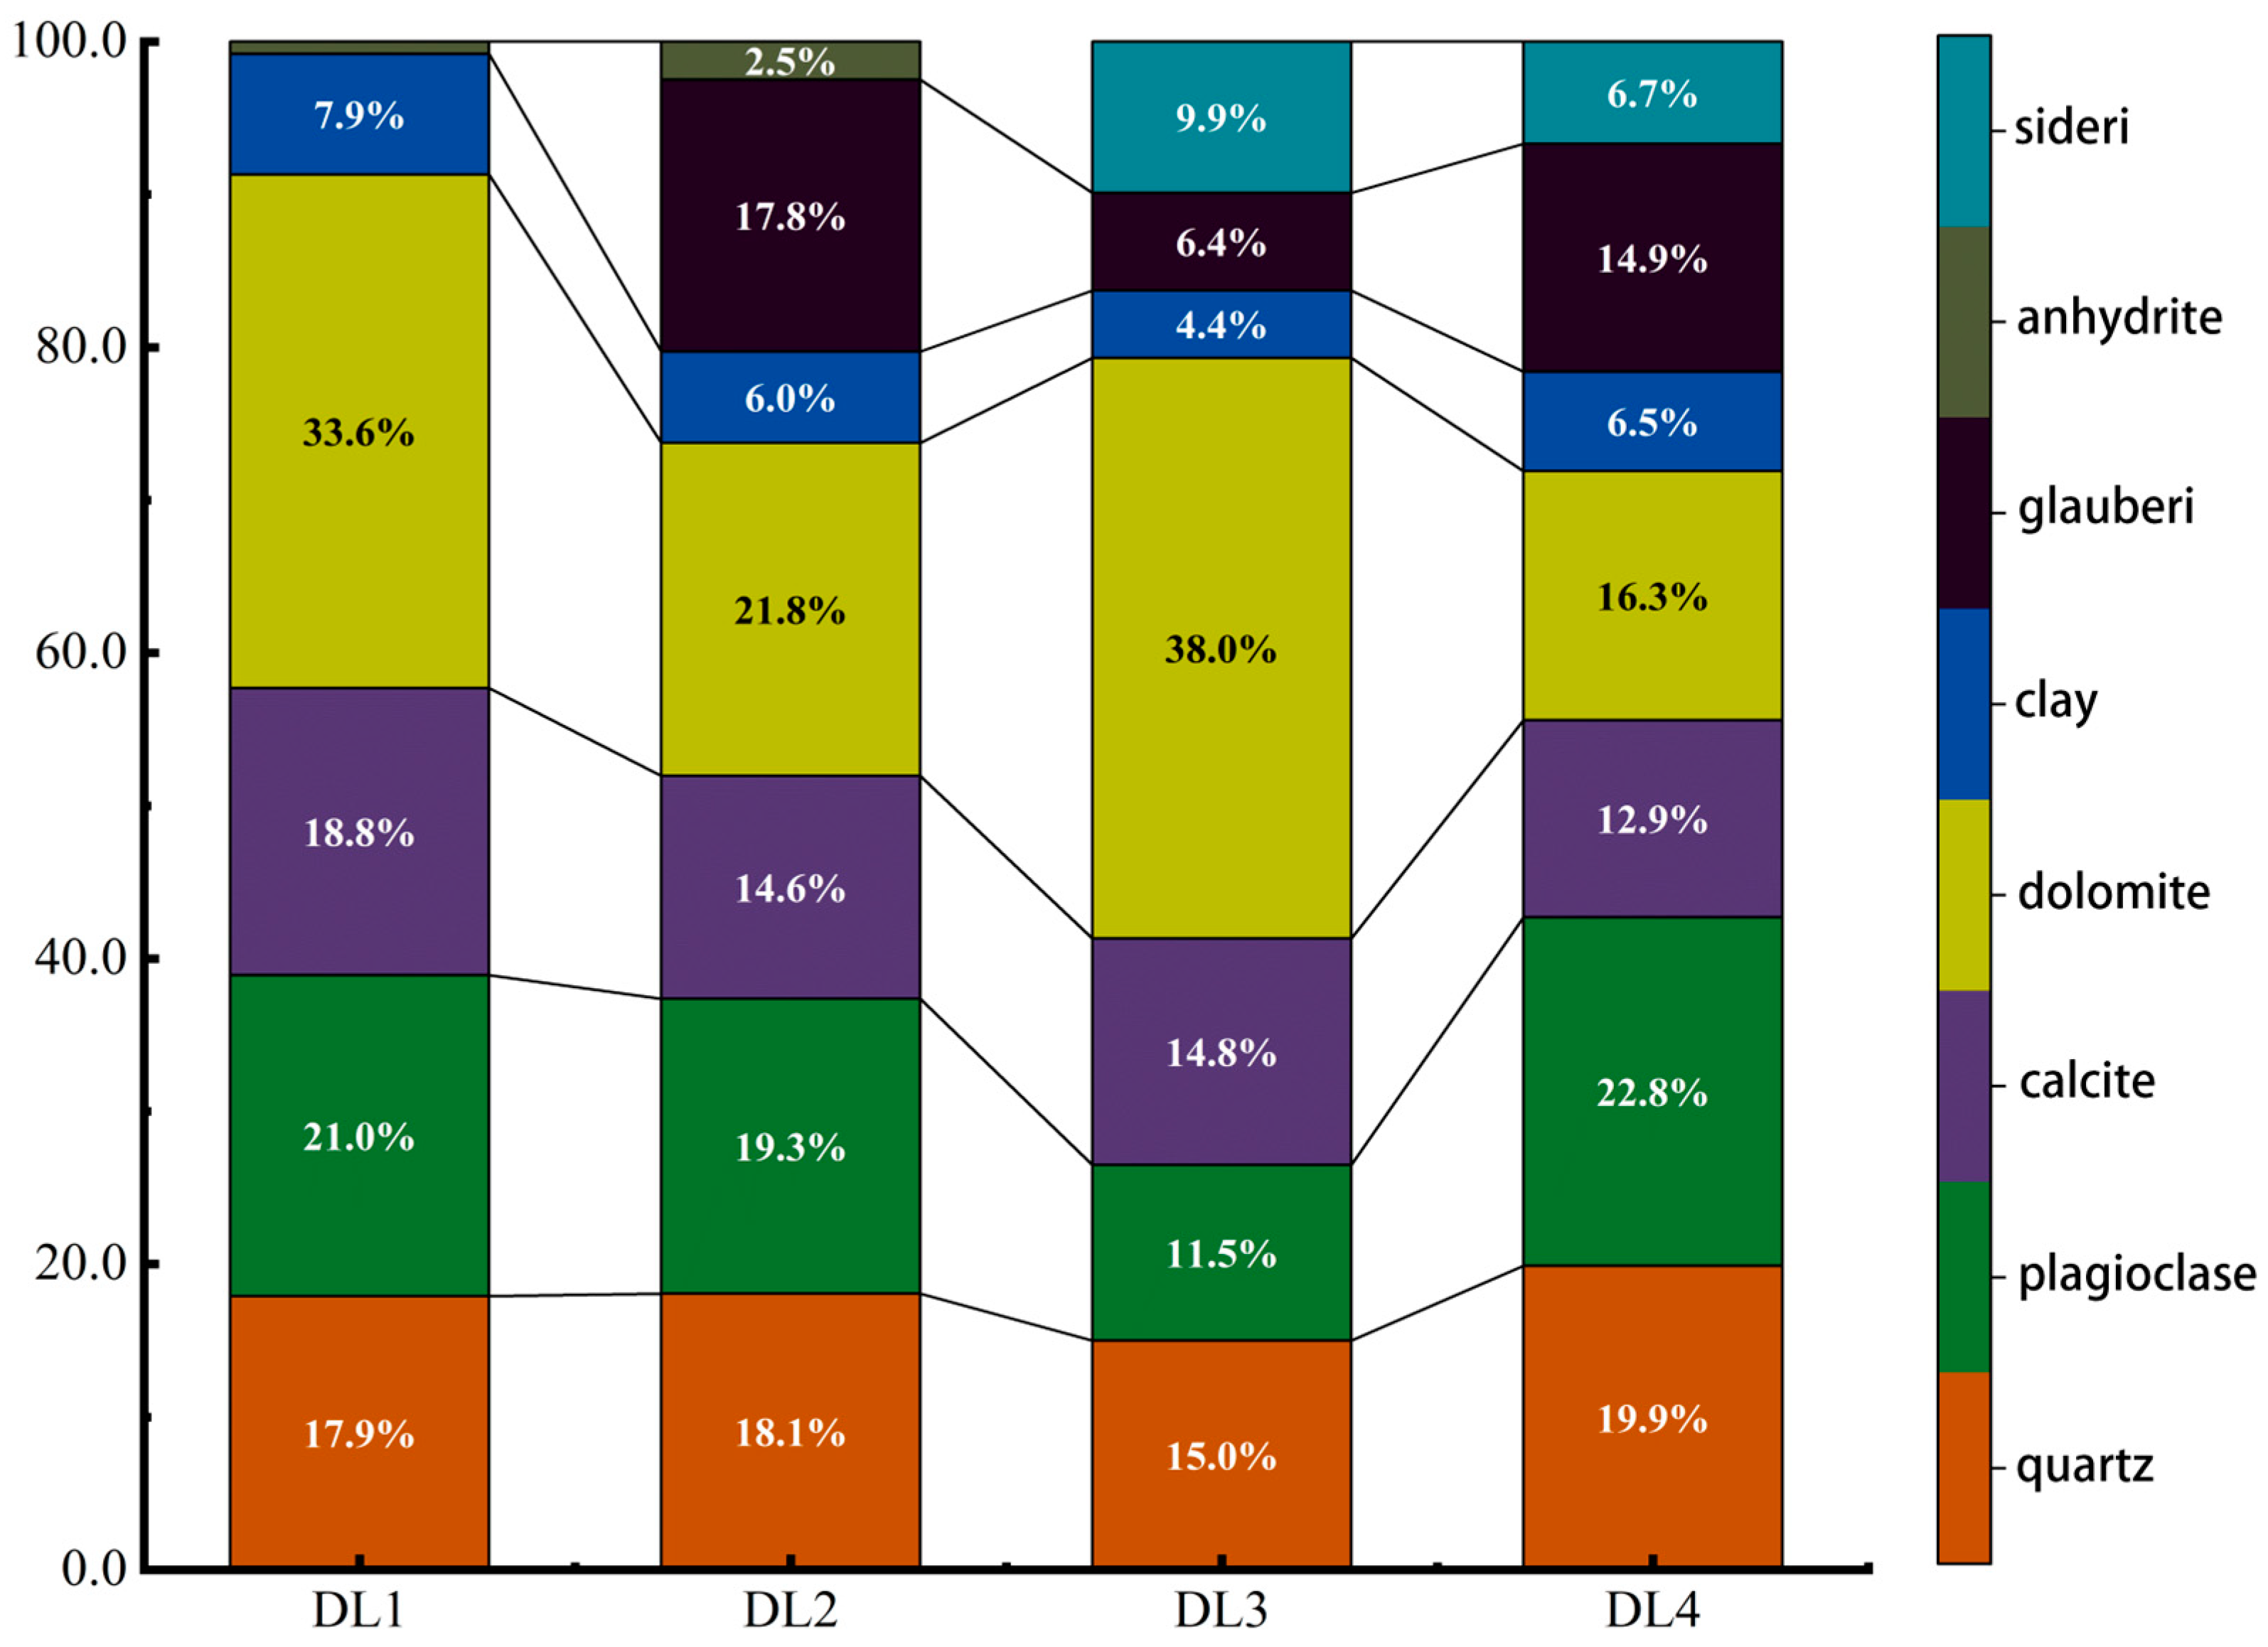
Before the start of the experiment, a whole-rock analysis of shale samples from the four layers DL1, DL2, DL3, and DL4 was conducted to form a basic understanding of the mineral composition (mass composition ratio) of each layer and provide information for subsequent experimental plan design in accordance with Figure 2. The rock samples of each section were tested 4 times, and after the test was completed, the results of the 4 similar times were averaged. The test results show that the four sections all contain four main components: quartz, plagioclase, calcite, and dolomite. Among them, the content of shale carbonate rock (calcite + dolomite) in the DL1 and DL3 sections reaches more than 50%, and the content of DL2 and DL3 is more than 50%. The shale carbonate content in the DL4 section is slightly lower, 36.4% and 29.2%, respectively; each section contains about 5% clay minerals. In addition, the shale in the three depth sections DL2, DL3 and DL4. All contain a certain amount of glauberite, with contents of 18%, 6.4%, and 14.9%, respectively. The shale in the DL3 and DL4 depth sections also contains 9.9% and 6.7% siderite.

Figure 2.
The proportion of mineral composition and mass fraction of each layer rock sample.
After having a basic understanding of the mineral composition of shale rock samples from the four layers DL1, DL2, DL3, and DL4, nine rock slices from each of the DL1 and DL2 layers were taken to conduct CO2-related immersion experiments. Under the same conditions of 90 °C and 43 MPa as the formation temperature and pressure, 6 of the 9 rock slices in each section were soaked in CO2 aqueous solution for 3 days and 7 days, respectively, and 3 were soaked in pure CO2 for 7 days. After completing the soaking process, the rock slices were crushed for rock analysis purposes. Similarly, each rock group was tested and the results were averaged.
Comparing the whole rock analysis results before and after immersion, the mineral composition of the rock slices after soaking in CO2 aqueous solution showed a decrease in the calcite and dolomite content compared with before soaking, while other mineral compositions increased, and the calcite content dropped more than dolomite, indicating that the CO2 aqueous solution is acidic under high-temperature and high-pressure conditions and can complete the dissolution of carbonate rocks, as well as preferentially dissolving the calcite component. The content of carbonate rocks soaked for 7 days is lower than that soaked for 3 days, and the calcite content will not continue after it drops to a certain proportion decrease, indicating that the CO2 aqueous solution takes a certain amount of time to dissolve carbonate rocks under high-temperature and high-pressure conditions, it can only complete a certain degree of dissolution, and it cannot completely dissolve the carbonate rock components in the shale composition. When the mineral composition after the calcite component is dissolved to a certain proportion, dolomite begins to be more dissolved; for the same soaking time, the carbonate rock content of the rock slices in the DL1 section decreases more than that in the DL2 section, indicating that the CO2 aqueous solution reacts to carbonic acid under high temperature and pressure. The dissolution result of salt rock is also related to the abundance of carbonate rock in the initial rock sample. The higher the content of carbonate rock, the easier it is to dissolve, and the final amount of dissolution is greater; the mineral composition after pure CO2 immersion is almost the same as before immersion. There is no change, indicating that pure CO2 has almost no acidity under high temperatures and high pressure and cannot complete the dissolution of carbonate rocks.
Although the initial clay mineral content in the shale rock samples of the DL1 and DL2 sections was low and significantly improved after immersion in CO2 aqueous solution, in order to further clarify whether immersion in CO2 aqueous solution caused the dissolution of clay minerals, the samples before and after immersion were analyzed using the clay mineral composition analysis experiment. The analysis results show that the relative content of chlorite in the soaked clay minerals has significantly decreased. Therefore, it is inferred that the CO2 aqueous solution can cause the dissolution of the chlorite component in the clay minerals. However, due to the low clay mineral content in the sample, the amount of green mudstone dissolution was too small, so the clay mineral content after soaking increased in the whole-rock analysis, while the relative content of chlorite in the clay mineral composition decreased.
3.2. Pore Throat Microstructure Experiment
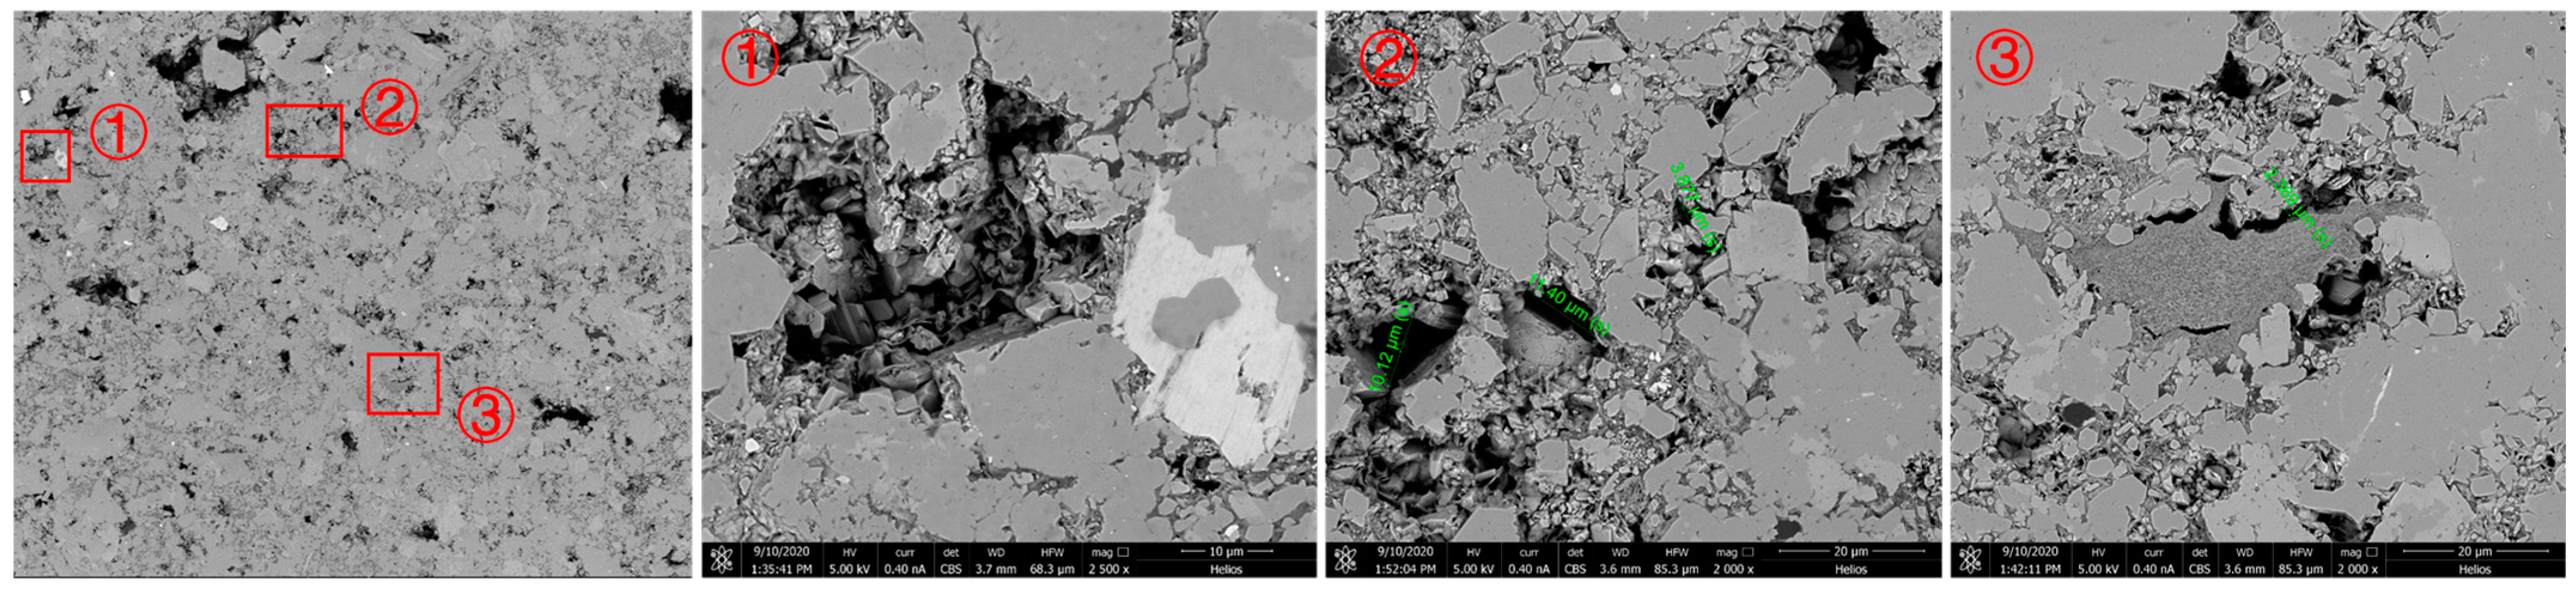
After realizing that CO2 aqueous solution can dissolve the carbonate rock components in the shale samples of the DL1 and DL2 sections, we continued to design a comparative experiment on the pore throat microstructure of the rock slices before and after immersion to observe whether there was any damage to the pore throat structure of the shale after immersion. The microscopic pore throat structure of rock samples before and after dissolution can be seen in Figure 3 and Figure 4, respectively. Expansion has an impact. Three rock slices from the DL1 section were selected for the experiment. One piece was soaked in pure CO2 for 7 days, and the other two pieces were soaked in CO2 aqueous solution for 3 days and 7 days, respectively. The experimental temperature and pressure were consistent with the previous ones.
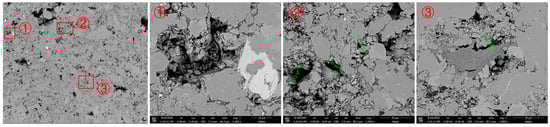
Figure 3.
Microscopic pore throat structure of rock sample before dissolution.
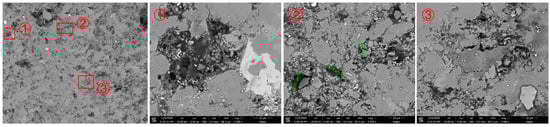
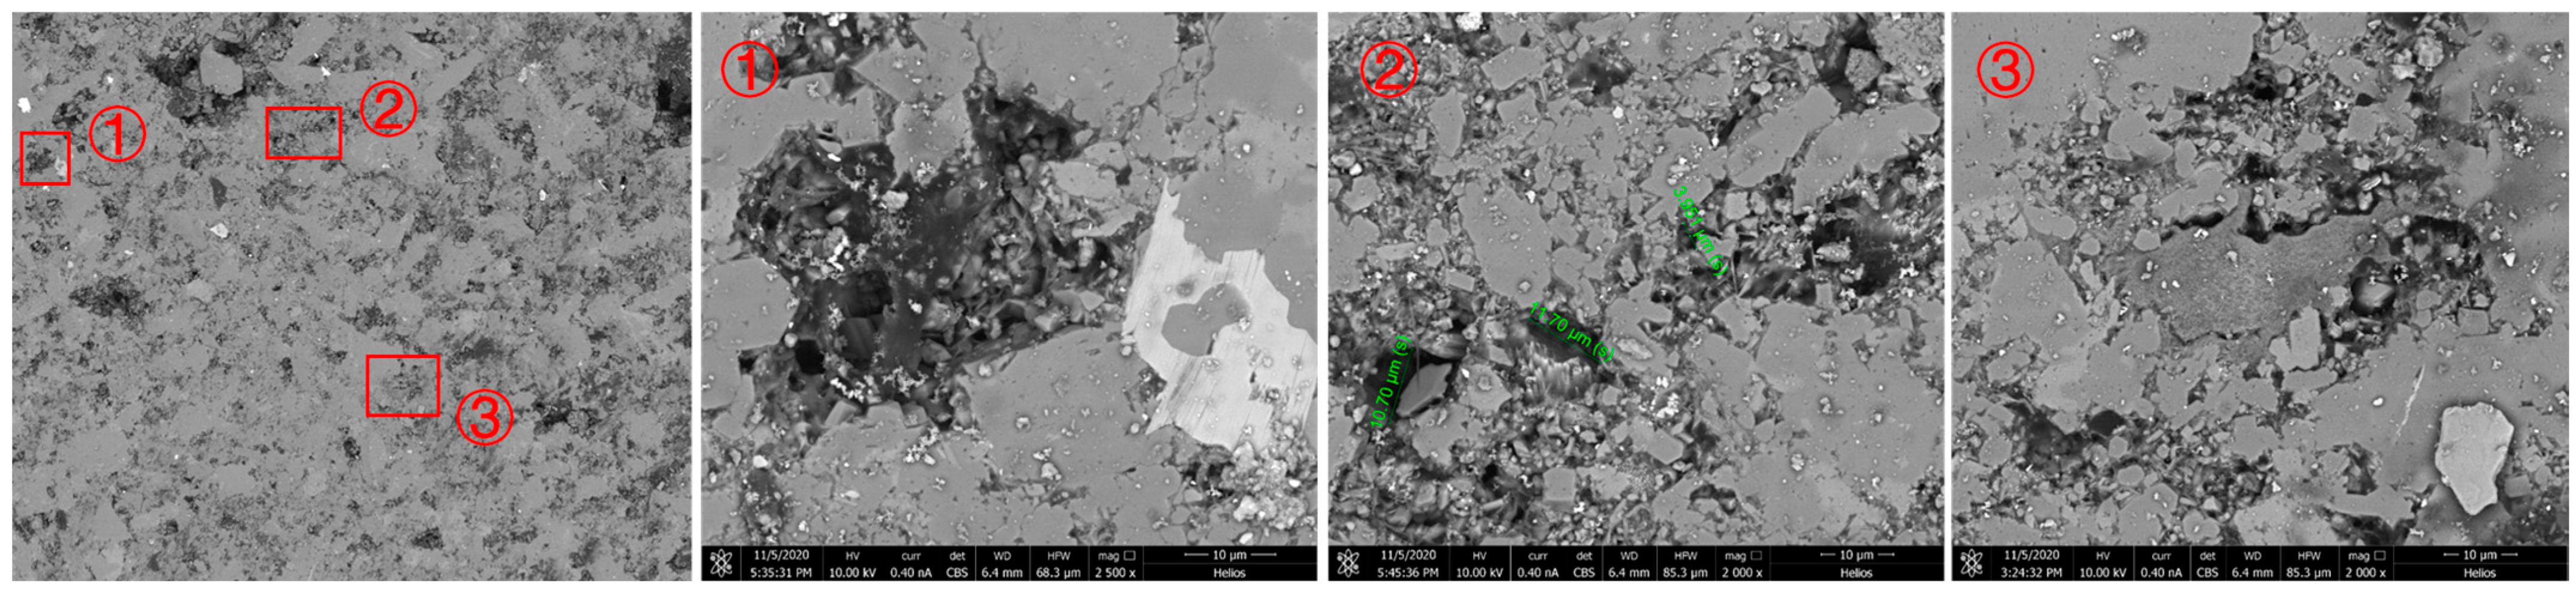
Figure 4.
Microstructure of pore throat after dissolution of rock sample.
After immersing in pure CO2 for 7 days, three locations were selected for enlarged observation and comparison. Field of view ① is a pore. After immersion, the shape of the pore and the surrounding rock remained basically unchanged, but black matter appeared inside the pore, which is guessed to be unwashed inside the rock sample. Crude oil is brought to the surface of rock slices under the strong extraction of supercritical CO2; view area ② is an area with a relatively complex pore distribution. The pore sizes before and after immersion were measured, respectively. Before immersion, they were 10.12 μm, 11.40 μm, and 3.877 μm, and, after immersion, it was 10.70 μm, 11.70 μm, and 3.951 μm, indicating that pure CO2 immersion has almost no effect on pore throat size; the center of the viewport ③ is clay mineral. After pure CO2 immersion for 7 days, no significant changes occurred in the morphology of clay minerals and surrounding rocks, indicating that pure CO2 has no dissolving effect on clay minerals.
After soaking in CO2 aqueous solution for 3 days, it has a certain impact on the original pore throat shape and pore size, and the surface morphology changes significantly, as shown in the red box in Figure 3. Energy spectroscopy was used to test the mineral composition of two locations with different crystal forms before dissolution. As shown in Figure 4, they were quartz and dolomite, respectively. Combined with the results after dissolution, it showed that dolomite was mainly dissolved. After the extensive dissolution of dolomite, the internal covered minerals were exposed, or new holes were formed. We also selected several typical areas to enlarge and observe, as shown in the picture. The mineral composition around the holes contains carbonate rocks or the holes exist on carbonate rocks. After soaking, the dolomite was dissolved, and the original two small holes became one large hole. When the pore throat size is enlarged, the seepage capacity will be improved. As can be seen from the red box in the figure, it is observed that the original pores are filled. This blocking phenomenon will lead to a decrease in pore permeability. However, only this blocking phenomenon was found in the field of view of all experimental observations, so it is believed that although there is indeed a negative impact caused by mineral dissolution, its degree of impact is significantly weaker than the porosity and permeability increase effect caused by dissolving carbonate rocks.
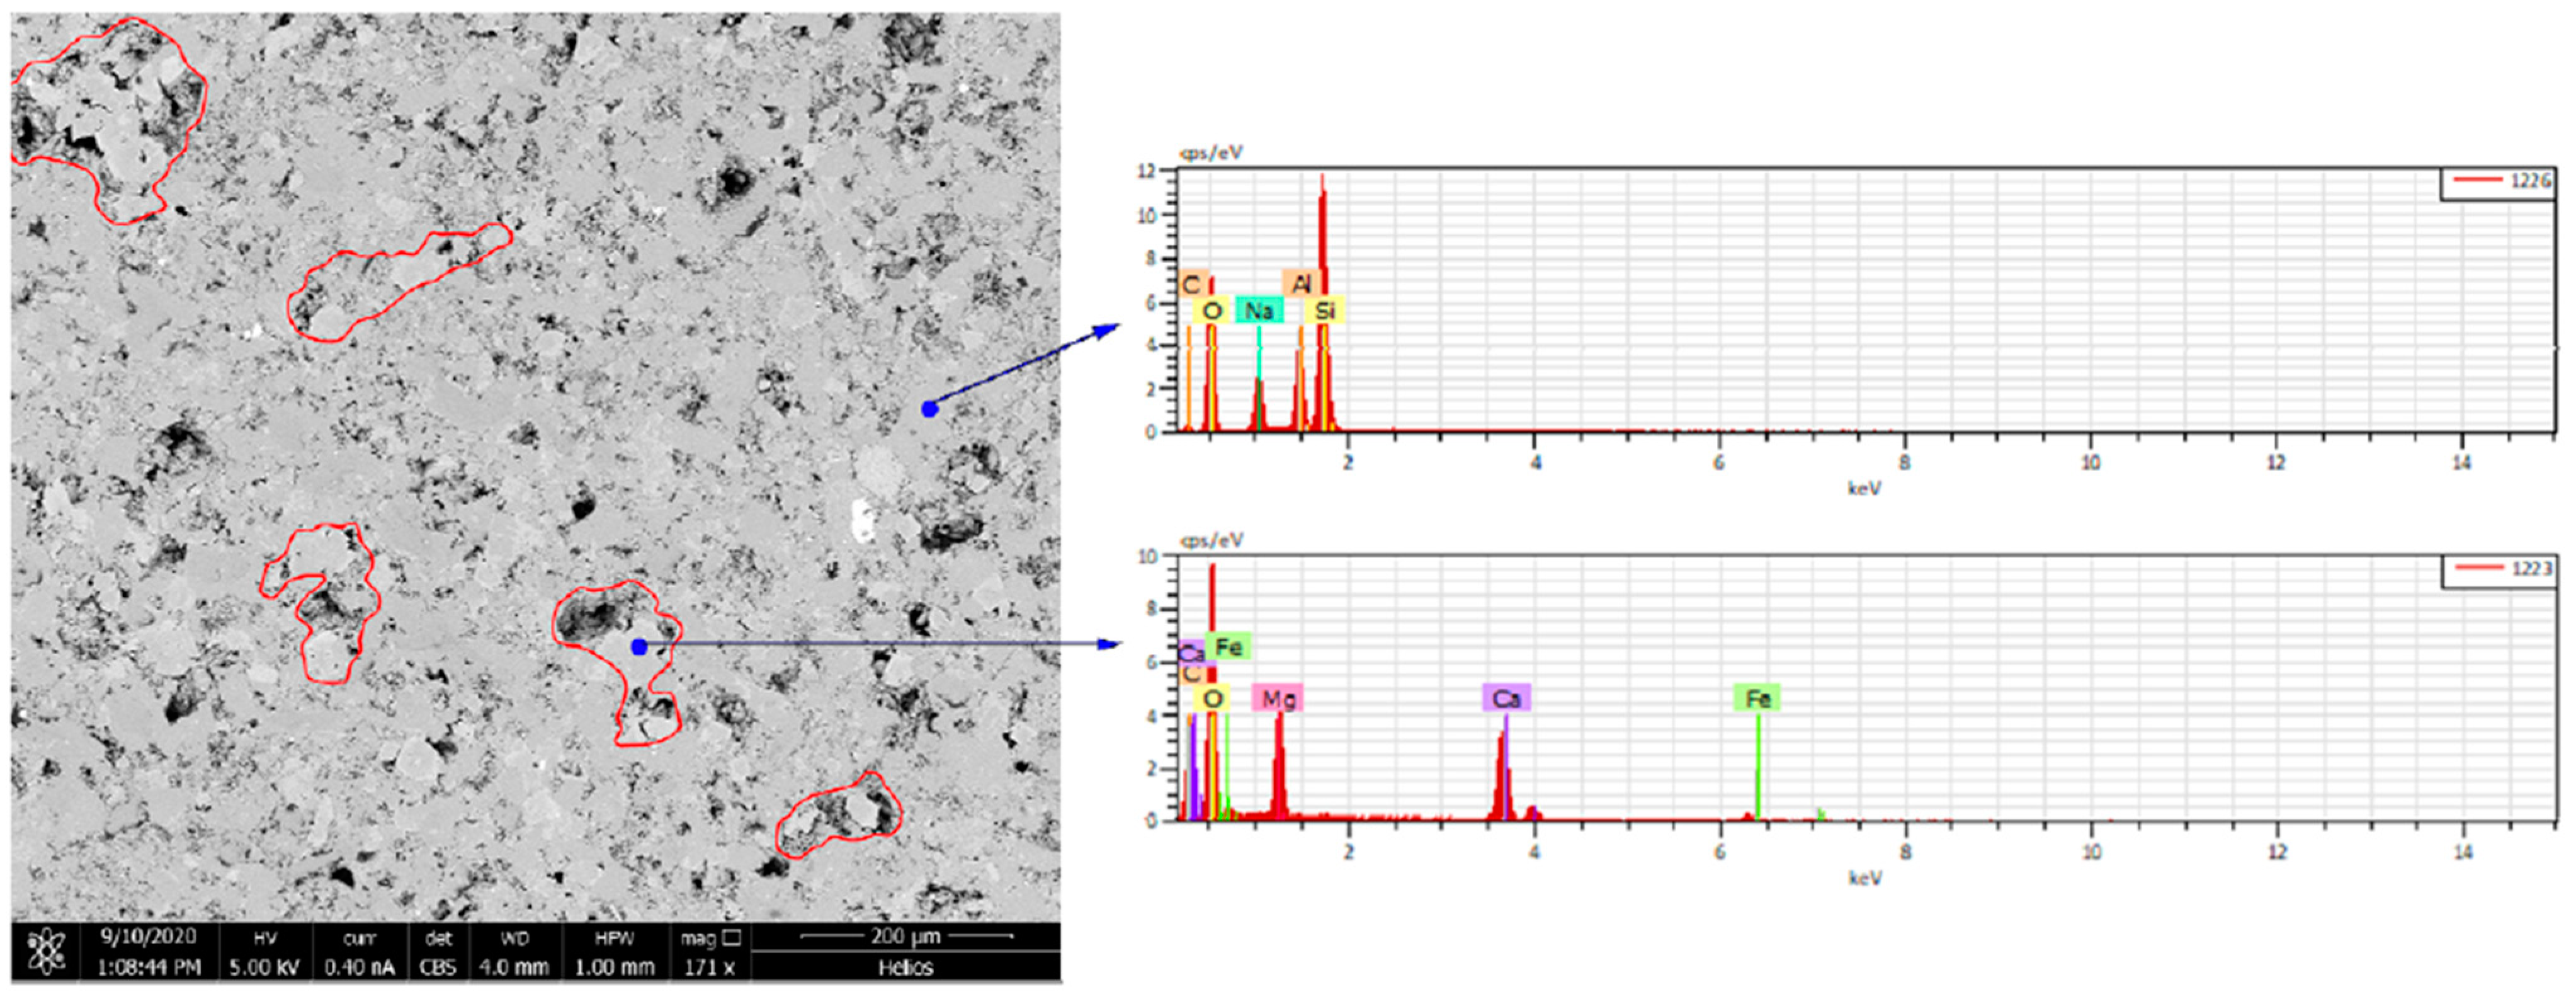
Similar to the No. 2 rock slice soaked for 3 days, soaking in CO2 aqueous solution has a certain impact on the original pore throat shape and pore size, and the surface morphology has changed significantly, as shown in the red box in the figure, minerals (mainly dolomite) were severely corroded. After the extensive dissolution of dolomite, the internal covered minerals were exposed, or new holes were formed. The enlarged picture of the area on the right after dissolution is shown in the figure. From the picture, it can be observed that after the original dolomite was dissolved, two different crystal forms appeared. For new minerals, we conducted mineral analysis using energy spectroscopy at two locations, as shown in Figure 5. It can be seen that one of them contained silicon and the other did not, indicating that the two minerals were SiO2 and carbonate rock. Soaking in CO2 aqueous solution has only a slight impact on the original pore throat size because the mineral composition around the holes is not carbonate rock (dolomite or calcite). The size of the four pores in the field of view was calibrated. Before immersion, they were 4.322 μm, 21.65 μm, 22.38 μm, and 2.780 μm, respectively. After immersion, they were 4.874 μm, 22.14 μm, 22.66 μm, and 3.119 μm, respectively. The average increase was only 0.5 μm. Clay minerals were located in the center of the field of view. After being soaked in CO2 aqueous solution for 7 days, the morphology of the clay minerals and surrounding rocks changed. It showed that the CO2 aqueous solution has no dissolving effect on the clay in the Jimusar reservoir.
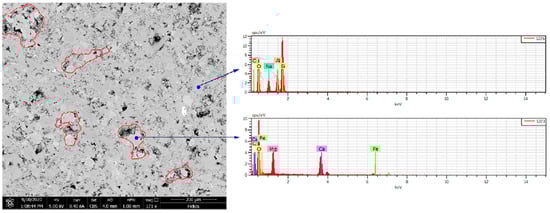
Figure 5.
Two energy spectra of different minerals.
3.3. Porosity and Permeability Enhancement Experiment
After CO2 is injected into the reservoir under formation temperature and pressure conditions, the initial physical–chemical stability of the reservoir fluid and rock will be destroyed and may trigger chemical reactions. Mineral particles and rock cements (such as carbonate rocks, feldspars, and clay minerals) will be corroded. This may lead to two completely different results: on the one hand, mineral dissolution caused by physical and chemical reactions can expand the pore radius to increase reservoir porosity and permeability, improve reservoir physical properties, reduce crude oil flow resistance, and reduce restraint. Water saturation, etc., will help increase the oil recovery rate and even increase the ultimate recovery rate of the reservoir. On the other hand, if there is a reaction to generate new or dissolved and exfoliated clay mineral particles, it may block the pore throats and reduce the permeability, which will be detrimental to the reservoir and adversely affect the physical properties of the layer. To this end, experiments were designed to improve porosity and permeability by immersing shale standard cores in different depth sections.
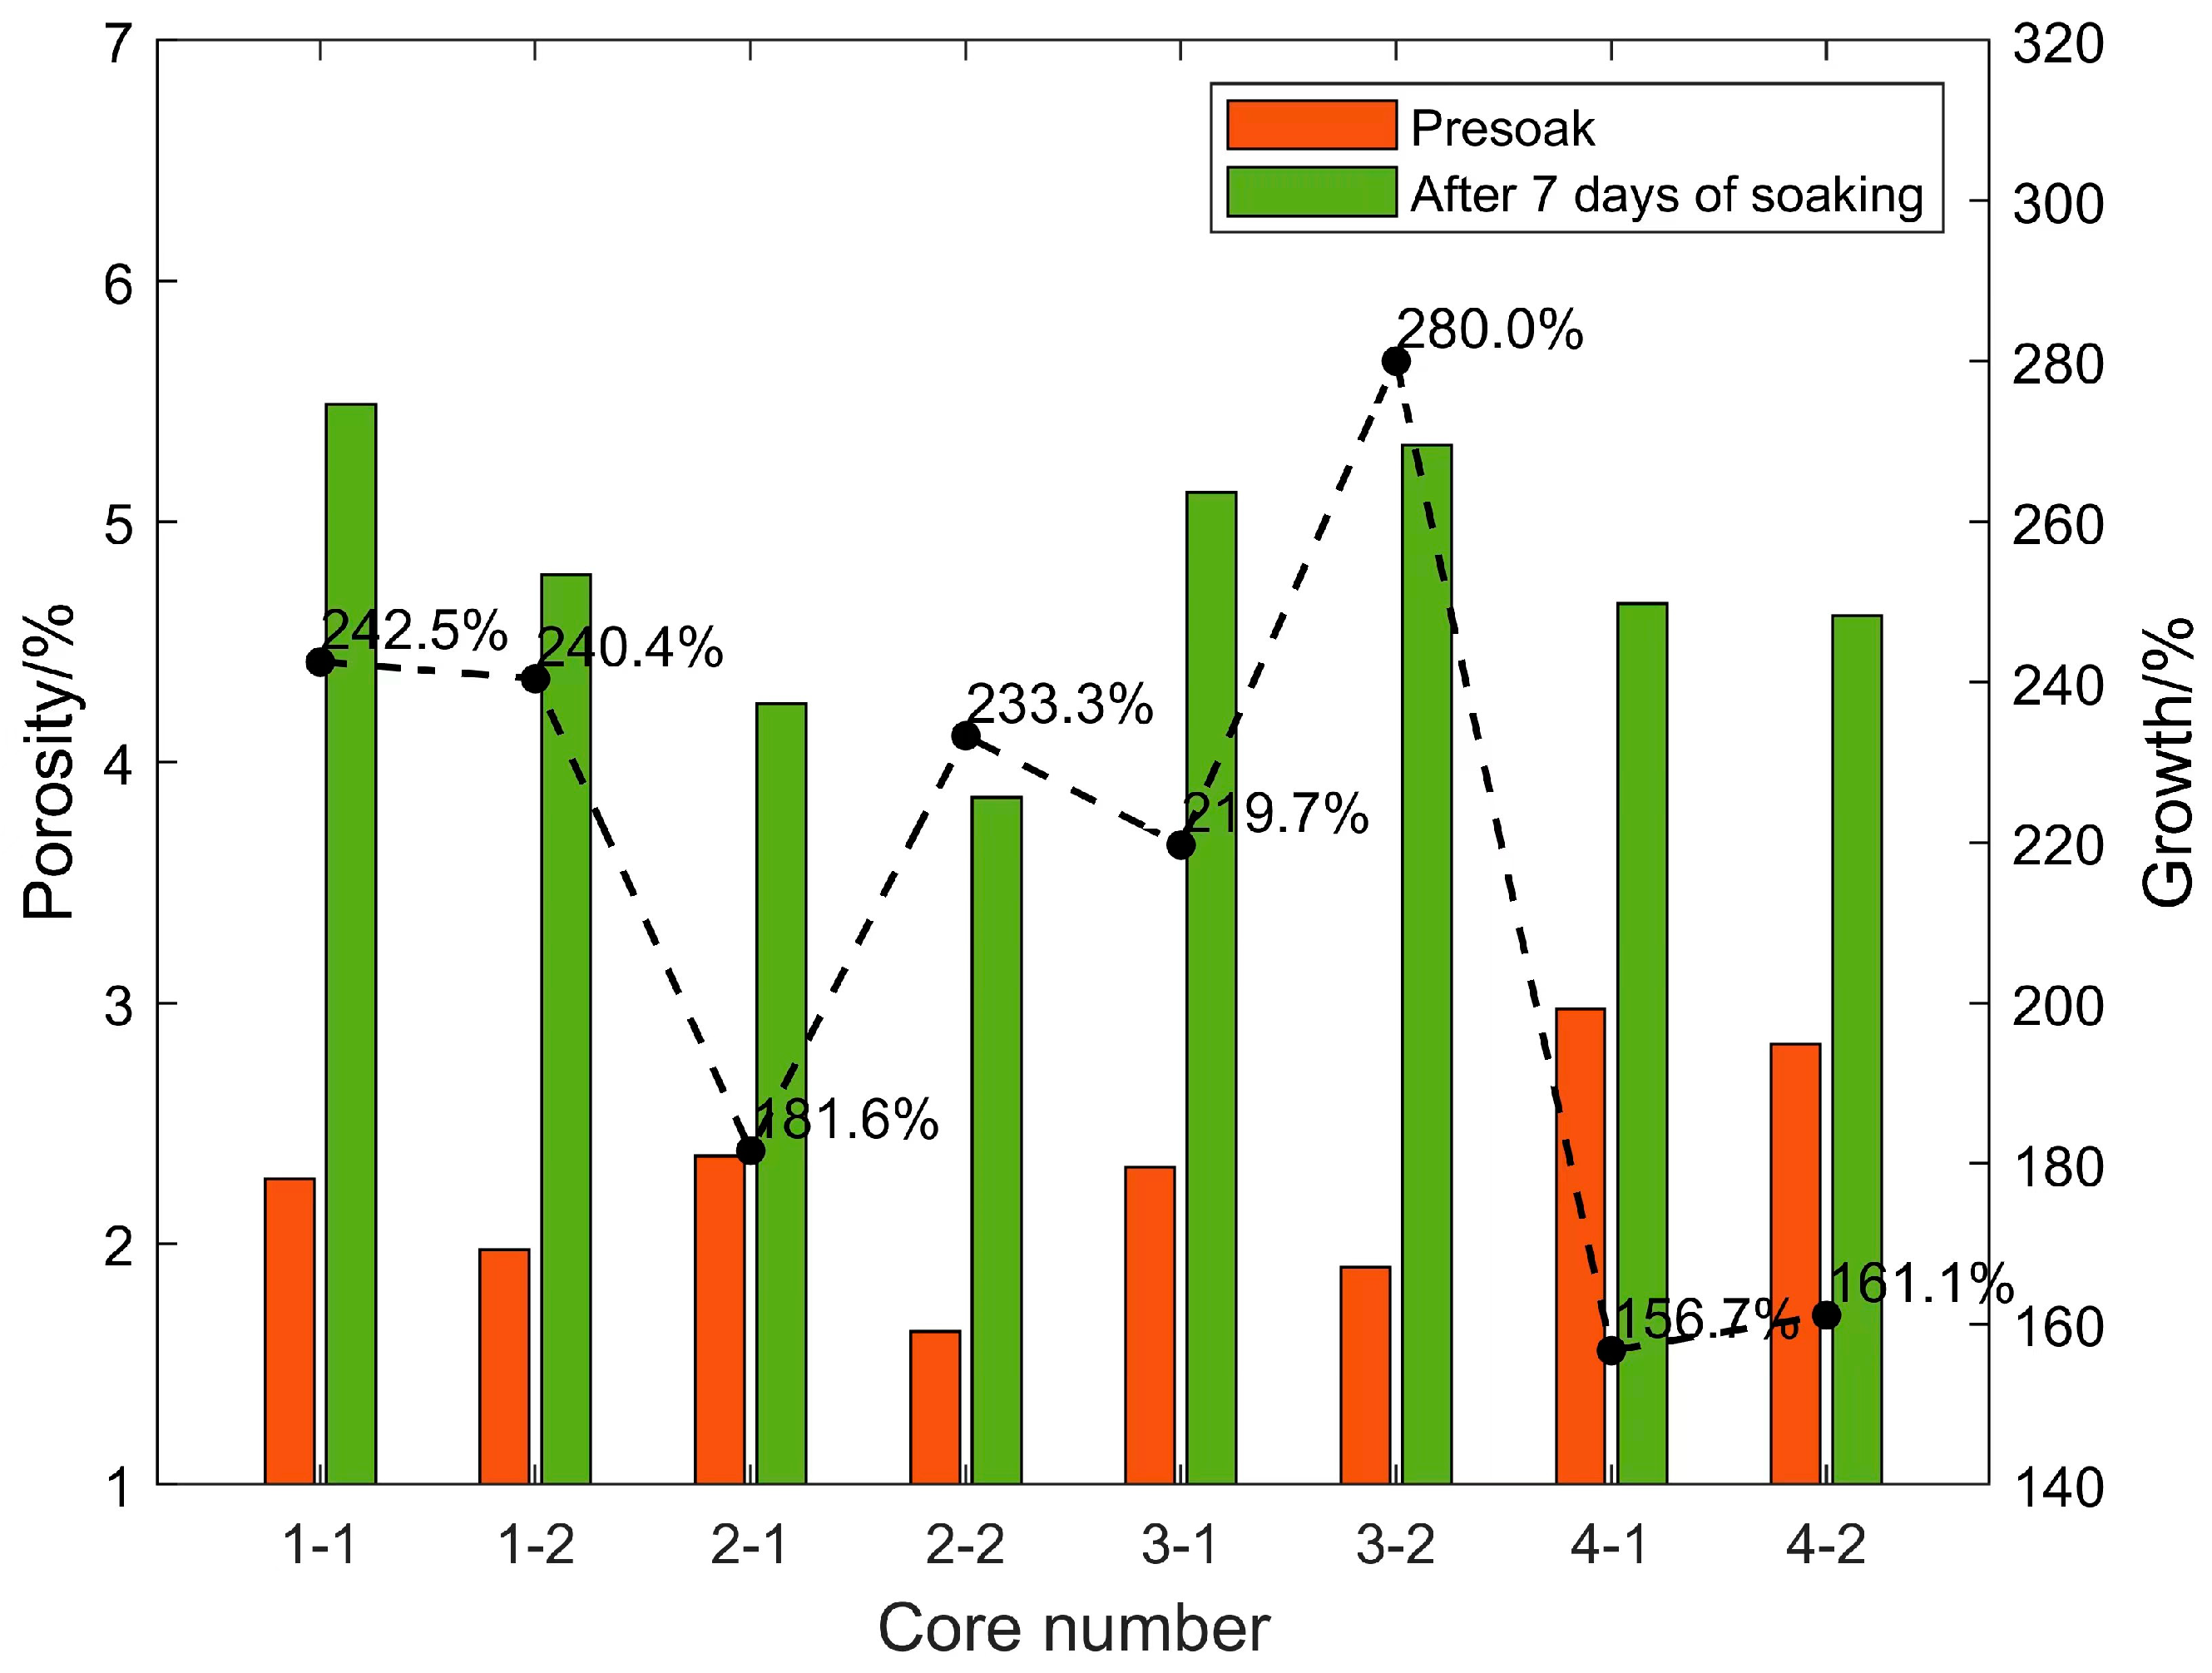
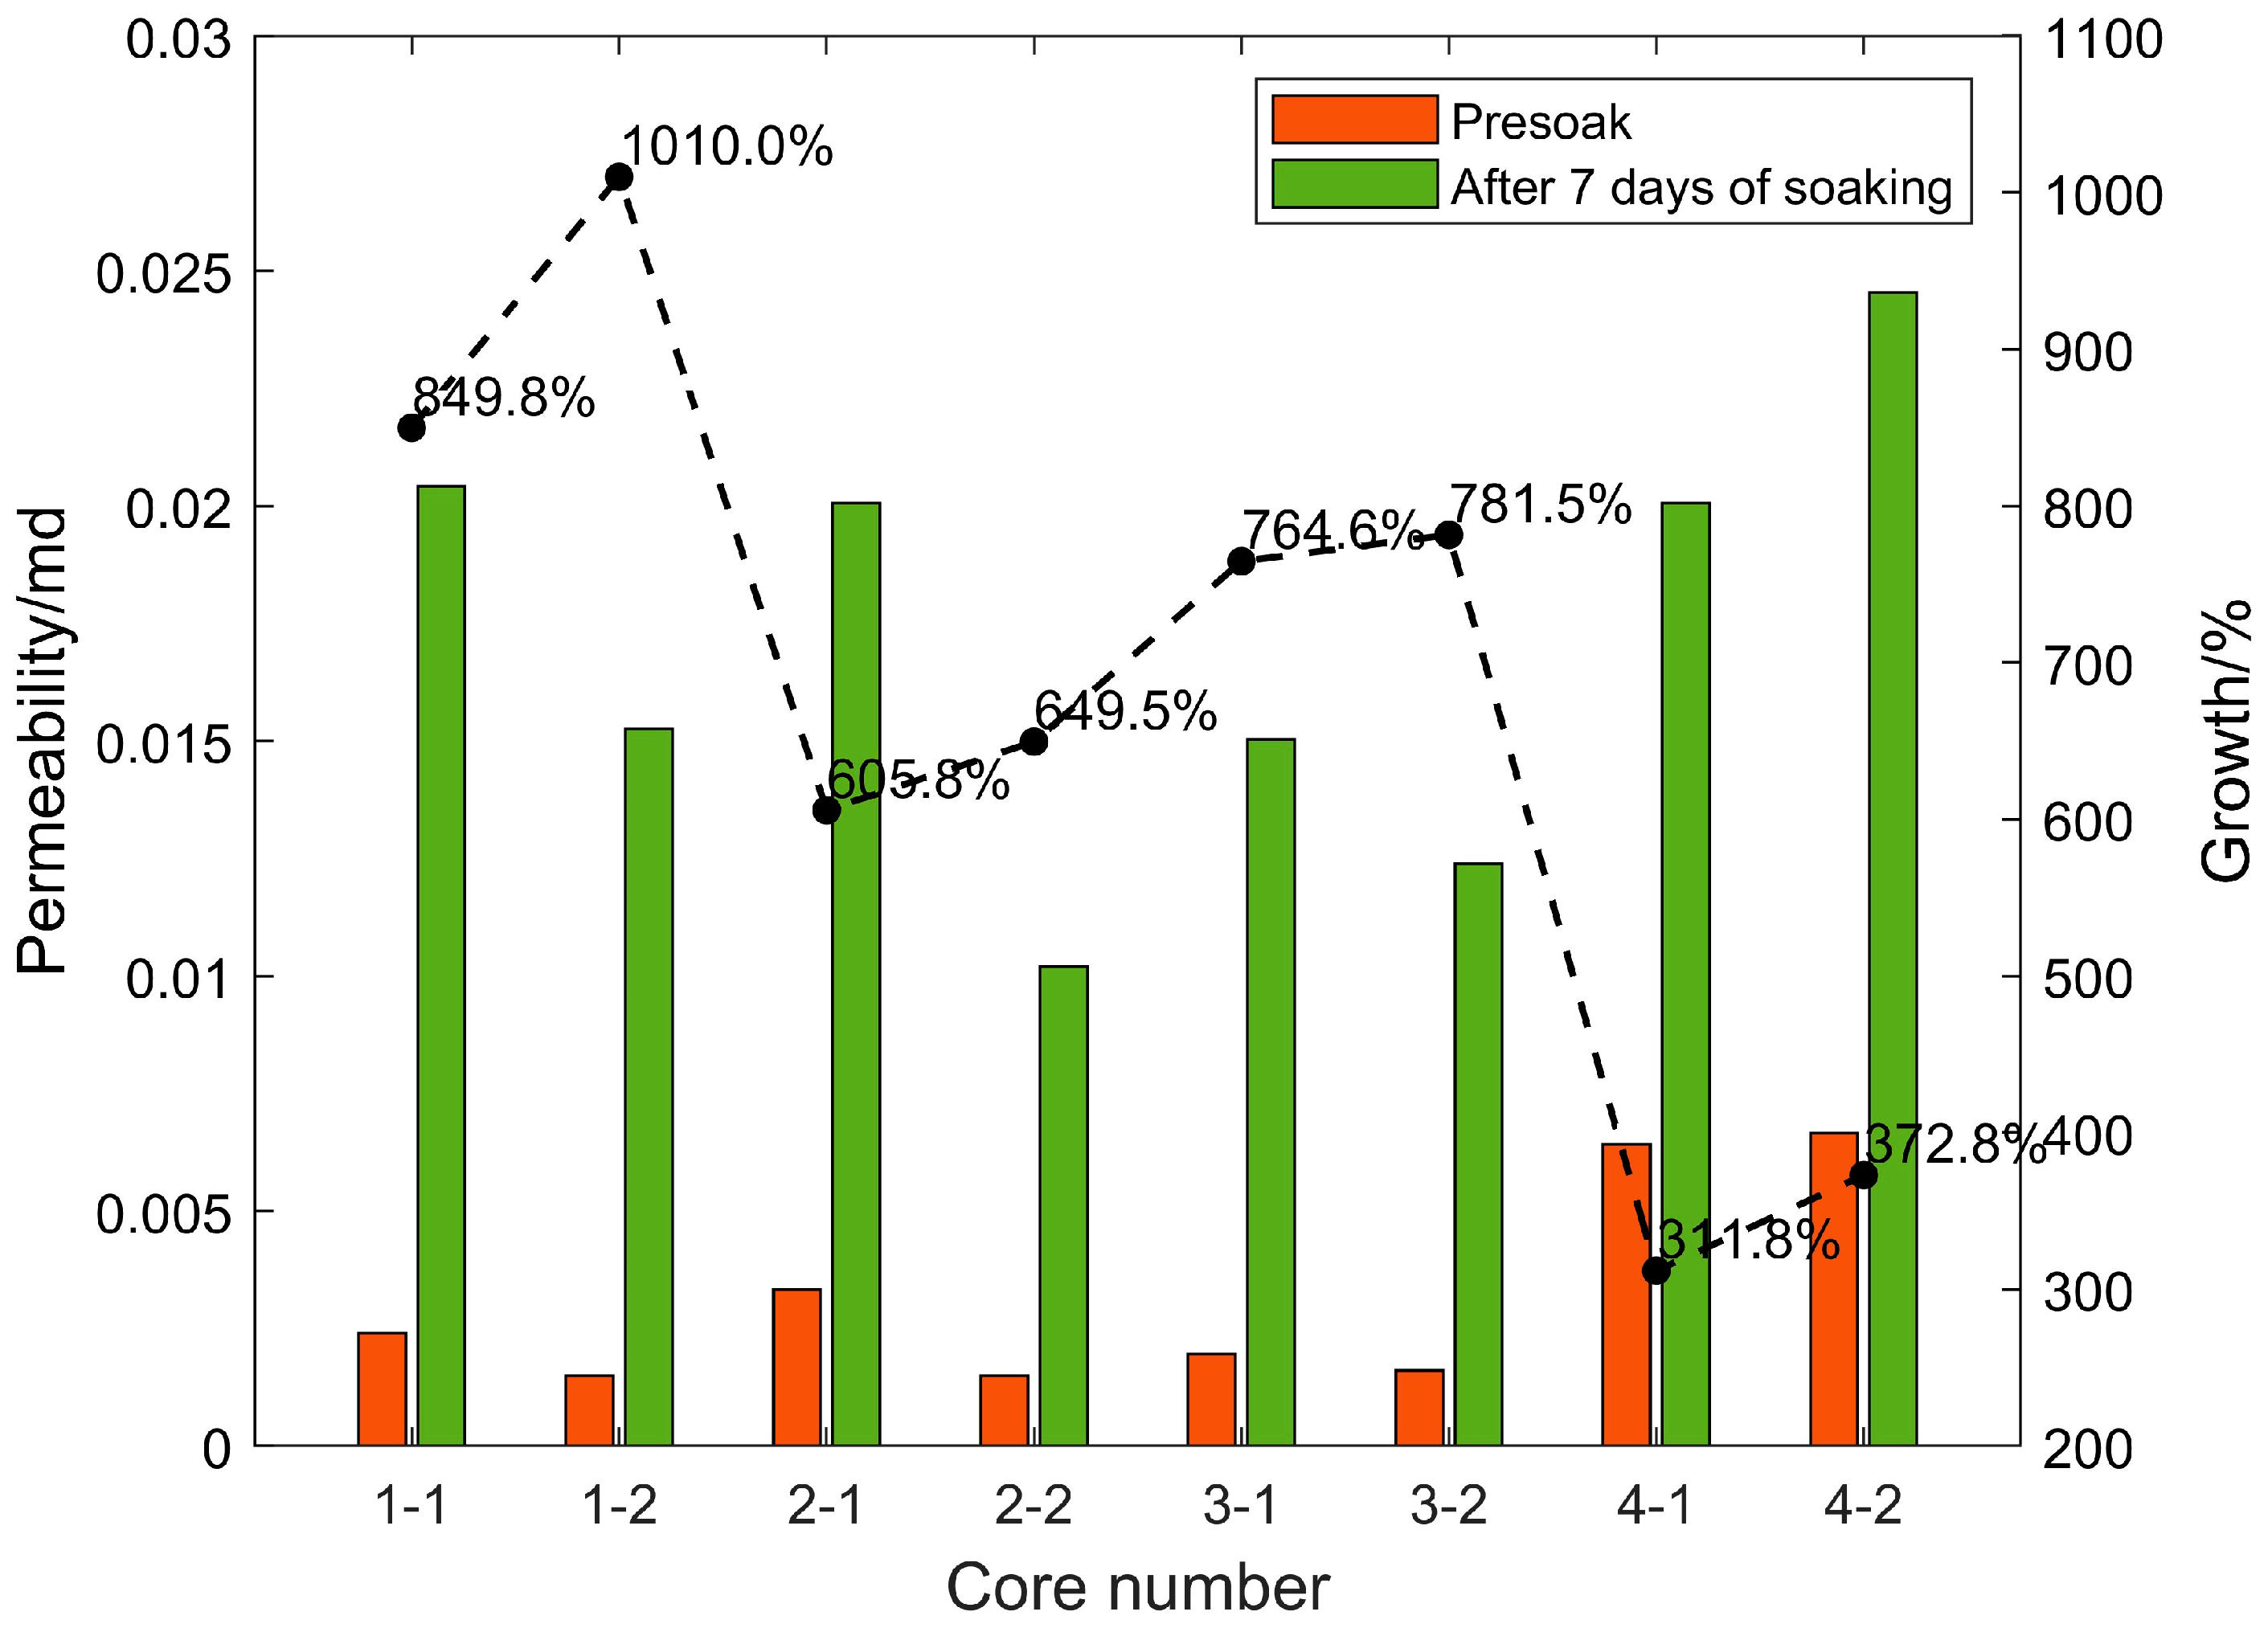
After the shale standard cores in the four sections were continuously immersed in carbon dioxide aqueous solution for 7 days under the formation temperature and pressure conditions, the porosity and permeability increased significantly. The changes in rock porosity and permeability before and after 7 days of soaking are shown in Figure 6 and Figure 7, respectively. This is due to the dissolution of weak cements and some acid-resistant materials under high temperatures and pressure. Minerals expand the pore throat space and form high-permeability channels, and the positive effect is far greater than the negative side (dissolution products block pore throats); after soaking for the same time, the porosity and permeability of each section of the core increase by different times. The porosity and permeability of the cores in the same section are increased by similar factors. Based on the previous mineral composition analysis results of each section, the porosity and permeability of the cores with high carbonate content (calcite and dolomite) are significantly higher than those with low carbon content. The core of the salt content section proves that under high-temperature and high-pressure conditions, CO2 aqueous solution mainly relies on dissolving carbonate rock to increase porosity and permeability. Under experimental conditions, the final porosity and permeability multiple of the core that can be increased is related to the carbonate rock content of the core.
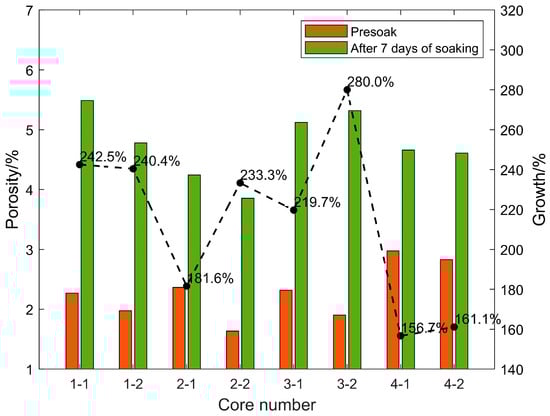
Figure 6.
Changes of rock porosity before and after 7 days of soaking.
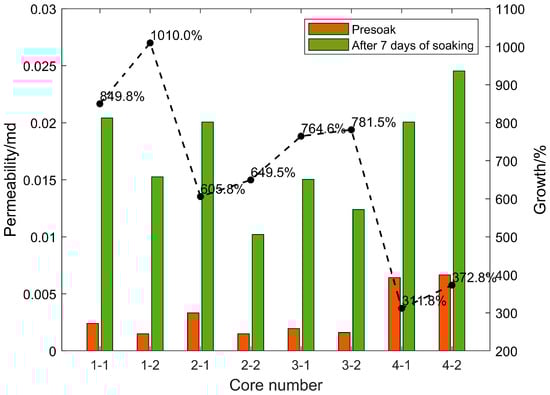
Figure 7.
Changes of rock permeability before and after 7 days of soaking.
Experiments on eight cores in four layers soaked for different times found that although the porosity increased rapidly in the early stage, the permeability did not increase rapidly. However, when the porosity increase rate decreased in the middle stage, the permeability increased the fastest. The reason should be that, although the CO2 aqueous solution quickly dissolved a large amount of carbonate rock in the early stage under high-temperature and high-pressure conditions to increase the pore throat space, it did not effectively connect to form a seepage channel in the length direction of the core, so the permeability in the measurement direction could not be rapidly increased. In the middle stage of the reaction, although the dissolution rate decreases, the dissolved pore throat space begins to communicate with seepage, and the permeability increases the fastest.
Core 3–4 has natural fractures of about 1/2 length parallel to the length of the core, so its initial porosity and permeability are relatively large. However, because the conductivity of the fractures is approximately infinite, although the contact area of the CO2 aqueous solution near the fractures is larger, the amount of dissolution is greater, but there is almost no increase in permeability along the length of the core in the fractured part. Effective dissolution is only in the non-fractured part, and the permeability increase factor is not very high. In actual reservoirs, due to the existence of natural fractures, CO2 solution can flow better under high temperatures and pressure to dissolve the reservoir space and improve the porosity and permeability of the reservoir, which has a positive significance.
4. Conclusions
- (1)
- Under Jimsar reservoir conditions, CO2 solution has a relatively strong dissolution capability and generates appreciable variation in the properties of the core samples.
- (2)
- The CO2 solution could dissolve the carbonates when interacting with the reservoir rock. The CO2 solution dissolved the calcite, followed by the dissolution of dolomite. Carbonate contents could be potentially dissolved by sufficient CO2.
- (3)
- From a microscopic perspective, the place of calcium was dissolved and other places were kept unchanged. The typical pore size resulting from the dissolution by CO2 solution ranges from several to dozens of micrometers. Due to rock dissolution, porosity and permeability apparently increased.
- (4)
- For Jimsar shale core samples, the porosity increased by over 20%, and permeability increased approximately twice. Under the Jimsar reservoir condition of 90 °C, the CO2 solution could consume all the carbonates of core samples within 8 days. Porosity and permeability increased fast in the first few days, then leveled off at about 6 days.
Author Contributions
Conceptualization, X.M.; Formal Analysis, H.H. and F.L.; Investigation, H.H., X.L. and M.J.; Methodology, H.H., X.M. and M.J.; Writing—Original Draft, H.H.; Writing—Review and Editing, H.H., Y.L. and J.M. All authors have read and agreed to the published version of the manuscript.
Funding
This research received no external funding.
Data Availability Statement
Data are contained within the article.
Acknowledgments
The authors would like to thank the anonymous reviewers for their valuable comments.
Conflicts of Interest
Authors Haibo He, Fan Lei, Xinqiu Liu, Ming Jiang were employed by the company Tuha Oil Field. The remaining authors declare that the research was conducted in the absence of any commercial or financial relationships that could be construed as a potential conflict of interest.
References
- IEA. Energy Technology Perspectives 2020; IEA: Paris, France, 2020. [Google Scholar]
- Global CCS Institute. Global Status of CCS Report 2020; Global CCS Institute: Melbourne, Australia, 2020; pp. 16–23. [Google Scholar]
- Chinese Academy of Environmental Planning; Chinese Academy of Sciences. Institute of Rock and Soil Mechanics, the Administrative Center for China’s Agenda 21. Annual Report on Chinese Carbon Dioxide Capture, Utilization and Storage (CCUS): Chinese CCUS Pathway Study; Chinese Academy of Environmental Planning: Beijing, China, 2021; pp. 6–8. [Google Scholar]
- Dai, H.; Su, Y.; Liu, J.; Gu, D.; Kuang, L.; Zou, C. Thinking of China’s energy development strategy under carbon neutrality goal. Plant Protein Sci. Technol. Forum 2022, 41, 1–8. [Google Scholar]
- Li, S.; Zhang, S.; Xing, H.; Zou, Y. CO2–brine–rock interactions altering the mineralogical, physical, and mechanical properties of carbonate-rich shale oil reservoirs. Energy 2022, 256, 124608. [Google Scholar] [CrossRef]
- Dahi-Taleghani, A.; Olson, J.E. Numerical modeling of multi-stranded hydraulic fracture propagation: Accounting for the interaction between induced and natural fractures. SPE J. 2011, 16, 575–581. [Google Scholar] [CrossRef]
- Olson, J.E. Multi-Fracture Propagation Modeling: Applications to Hydraulic Fracturing in Shales and Tight Gas Sands. In Proceedings of the 42th US Rock Mechanics Symposium (USRMS), San Francisco, CA, USA, 29 June–2 July 2008. [Google Scholar]
- Zhao, X.P.; Young, R.P. Numerical Simulation of Seismicity Induced by Hydraulic Fracturing in Naturally Fractured Reservoirs. In SPE Annual Technical Conference and Exhibition? SPE: New Orleans, LA, USA, 2009. [Google Scholar] [CrossRef]
- Ben, Y.X.; Xue, J.; Miao, Q.H.; Wang, Y. Coupling Fluid Flow with Discontinuous Deformation Analysis. In Proceedings of the 10th International Conference on Advances in Discontinuous Numerical Methods and Applications in Geomechanics and Geoengineering (ICADD), Honolulu, HI, USA, 6–8 December 2011. [Google Scholar]
- Zou, Y.S. Investigation into the Mechanism of Fracture-Network Fracturing in Shale Gas Reservoirs. Ph.D. Thesis, China University of Petroleum (Beijing), Beijing, China, 2014. [Google Scholar]
- Li, L.D.; Zhang, S.C. Mechanism of hydraulic fracture propagation in fracture-cavity carbonate reservoirs. Acta Pet. Sin. 2009, 30, 570. [Google Scholar] [CrossRef]
- Cheng, L.; Luo, Z.; Yu, Y. Study on the interaction mechanism between hydraulic fracture and natural karst cave with the extended finite element method. Eng. Fract. Mech. 2019, 222, 106680. [Google Scholar] [CrossRef]
- Wang, Y.; Li, X.; Zhao, B. 3D numerical simulation of pulsed fracture in complex fracture-cavitied reservoir. Comput. Geotech. 2020, 125, 103665. [Google Scholar] [CrossRef]
- Liu, Z.; Lu, Q.; Sun, Y. Investigation of the Influence of Natural Cavities on Hydraulic Fracturing Using Phase Field Method. Arab. J. Sci. Eng. 2019, 44, 10481–10501. [Google Scholar] [CrossRef]
- Yu, Z.; Liu, L.; Yang, S.; Li, S.; Yang, Y. An experimental study of CO2–brine–rock interaction at in situ pressure–temperature reservoir conditions. Chem. Geol. 2012, 326, 88–101. [Google Scholar] [CrossRef]
- Luo, Z.; Zhang, N.; Zhao, L.; Zeng, J.; Liu, P.; Li, N. Interaction of a hydraulic fracture with a hole in poroelasticity medium based on extended finite element method. Eng. Anal. Bound. Elem. 2020, 115, 108–119. [Google Scholar] [CrossRef]
- Li, Y.; Mou, J.; Zhang, S.; Ma, X.; Xiao, C.; Fang, H. Numerical Investigation of Interaction Mechanism between Hydraulic Fracture and Natural Karst Cave Based on Seepage-Stress-Damage Coupled Model. Energies 2022, 15, 5425. [Google Scholar] [CrossRef]
- Tang, C. Numerical simulation of progressive rock failure and associated seismicity. Int. J. Rock Mech. Min. Sci. 1997, 34, 249–261. [Google Scholar] [CrossRef]
- Wang, Y.; Li, X.; Tang, C.A. Effect of injection rate on hydraulic fracturing in naturally fractured shale formations: A numerical study. Environ. Earth Sci. 2016, 75, 935. [Google Scholar] [CrossRef]
- Wang, Y.; Li, X.; Hu, R. Numerical Evaluation and Optimization of Multiple Hydraulically Fractured Parameters Using a Flow-Stress-Damage Coupled Approach. Energies 2016, 9, 325. [Google Scholar] [CrossRef]
- Wang, Y.; Li, X.; Zhang, B. Numerical Modeling of Variable Fluid Injection-Rate Modes on Fracturing Network Evolution in Naturally Fractured Formations. Energies 2016, 9, 414. [Google Scholar] [CrossRef]
- He, Q.; Suorineni, F.T.; Ma, T.; Oh, J. Effect of discontinuity stress shadows on hydraulic fracture Re-orientation. Int. J. Rock Mech. Min. Sci. 2017, 91, 179–194. [Google Scholar] [CrossRef]
- Li, L. The behaviour of fracture growth in sedimentary rocks: A numerical study based on hydraulic fracturing processes. Energies 2016, 9, 169. [Google Scholar] [CrossRef]
- Li, Z. Numerical investigation on the propagation behavior of hydraulic fractures in shale reservoir based on the DIP technique. J. Petrol. Sci. Eng. 2017, 154, 302–314. [Google Scholar] [CrossRef]
- Gaus, I. Role and impact of CO2–rock interactions during CO2 storage in sedimentary rocks. Int. J. Greenh. Gas Control 2010, 4, 73–89. [Google Scholar] [CrossRef]
- Alam, M.M.; Hjuler, M.L.; Christensen, H.F.; Fabricius, I.L. Petrophysical and rock-mechanics effects of CO2 injection for enhanced oil recovery: Experimental study on chalk from South Arne field, North Sea. J. Pet. Sci. Eng. 2014, 122, 468–487. [Google Scholar] [CrossRef]
- Eshraghi, S.E.; Rasaei, M.R.; Zendehboudi, S. Optimization of miscible CO2-EOR and storage using heuristic methods combined with capacitance/resistance and Gentil fractional flow models. J. Nat. Gas Sci. Eng. 2016, 32, 304–318. [Google Scholar] [CrossRef]
- Zou, Y.; Li, S.; Ma, X.; Zhang, S.; Li, N.; Chen, M. Effects of CO2–brine–rock interaction on porosity/permeability and mechanical properties during supercritical-CO2 fracturing in shale reservoirs. J. Nat. Gas Sci. Eng. 2018, 49, 157–168. [Google Scholar] [CrossRef]
- Liu, F.; Lu, P.; Griffith, C.; Hedges, S.W.; Soong, Y.; Hellevang, H.; Zhu, C. CO2–brine–caprock interaction: Reactivity experiments on Eau Claire shale and a review of relevant literature. Int. J. Greenh. Gas Control 2012, 7, 153–167. [Google Scholar] [CrossRef]
- Zendehboudi, S.; Khan, A.; Carlisle, S.; Leonenko, Y. Ex situ dissolution of CO2: A new engineering methodology based on mass-transfer perspective for enhancement of CO2 sequestration. Energy Fuels 2011, 25, 3323–3333. [Google Scholar] [CrossRef]
Disclaimer/Publisher’s Note: The statements, opinions and data contained in all publications are solely those of the individual author(s) and contributor(s) and not of MDPI and/or the editor(s). MDPI and/or the editor(s) disclaim responsibility for any injury to people or property resulting from any ideas, methods, instructions or products referred to in the content. |
© 2024 by the authors. Licensee MDPI, Basel, Switzerland. This article is an open access article distributed under the terms and conditions of the Creative Commons Attribution (CC BY) license (https://creativecommons.org/licenses/by/4.0/).