

On Designing a New Control Chart Using the Generalized Conway–Maxwell–Poisson Distribution to Monitor Count Data

 , ,
, ,
Abstract
:1. Introduction
2. Materials and Methods
2.1. Generalized Conway-Maxwell-Poisson Distribution
2.2. Proposed G-Chart to Monitor Count Data
3. Findings and Discussion
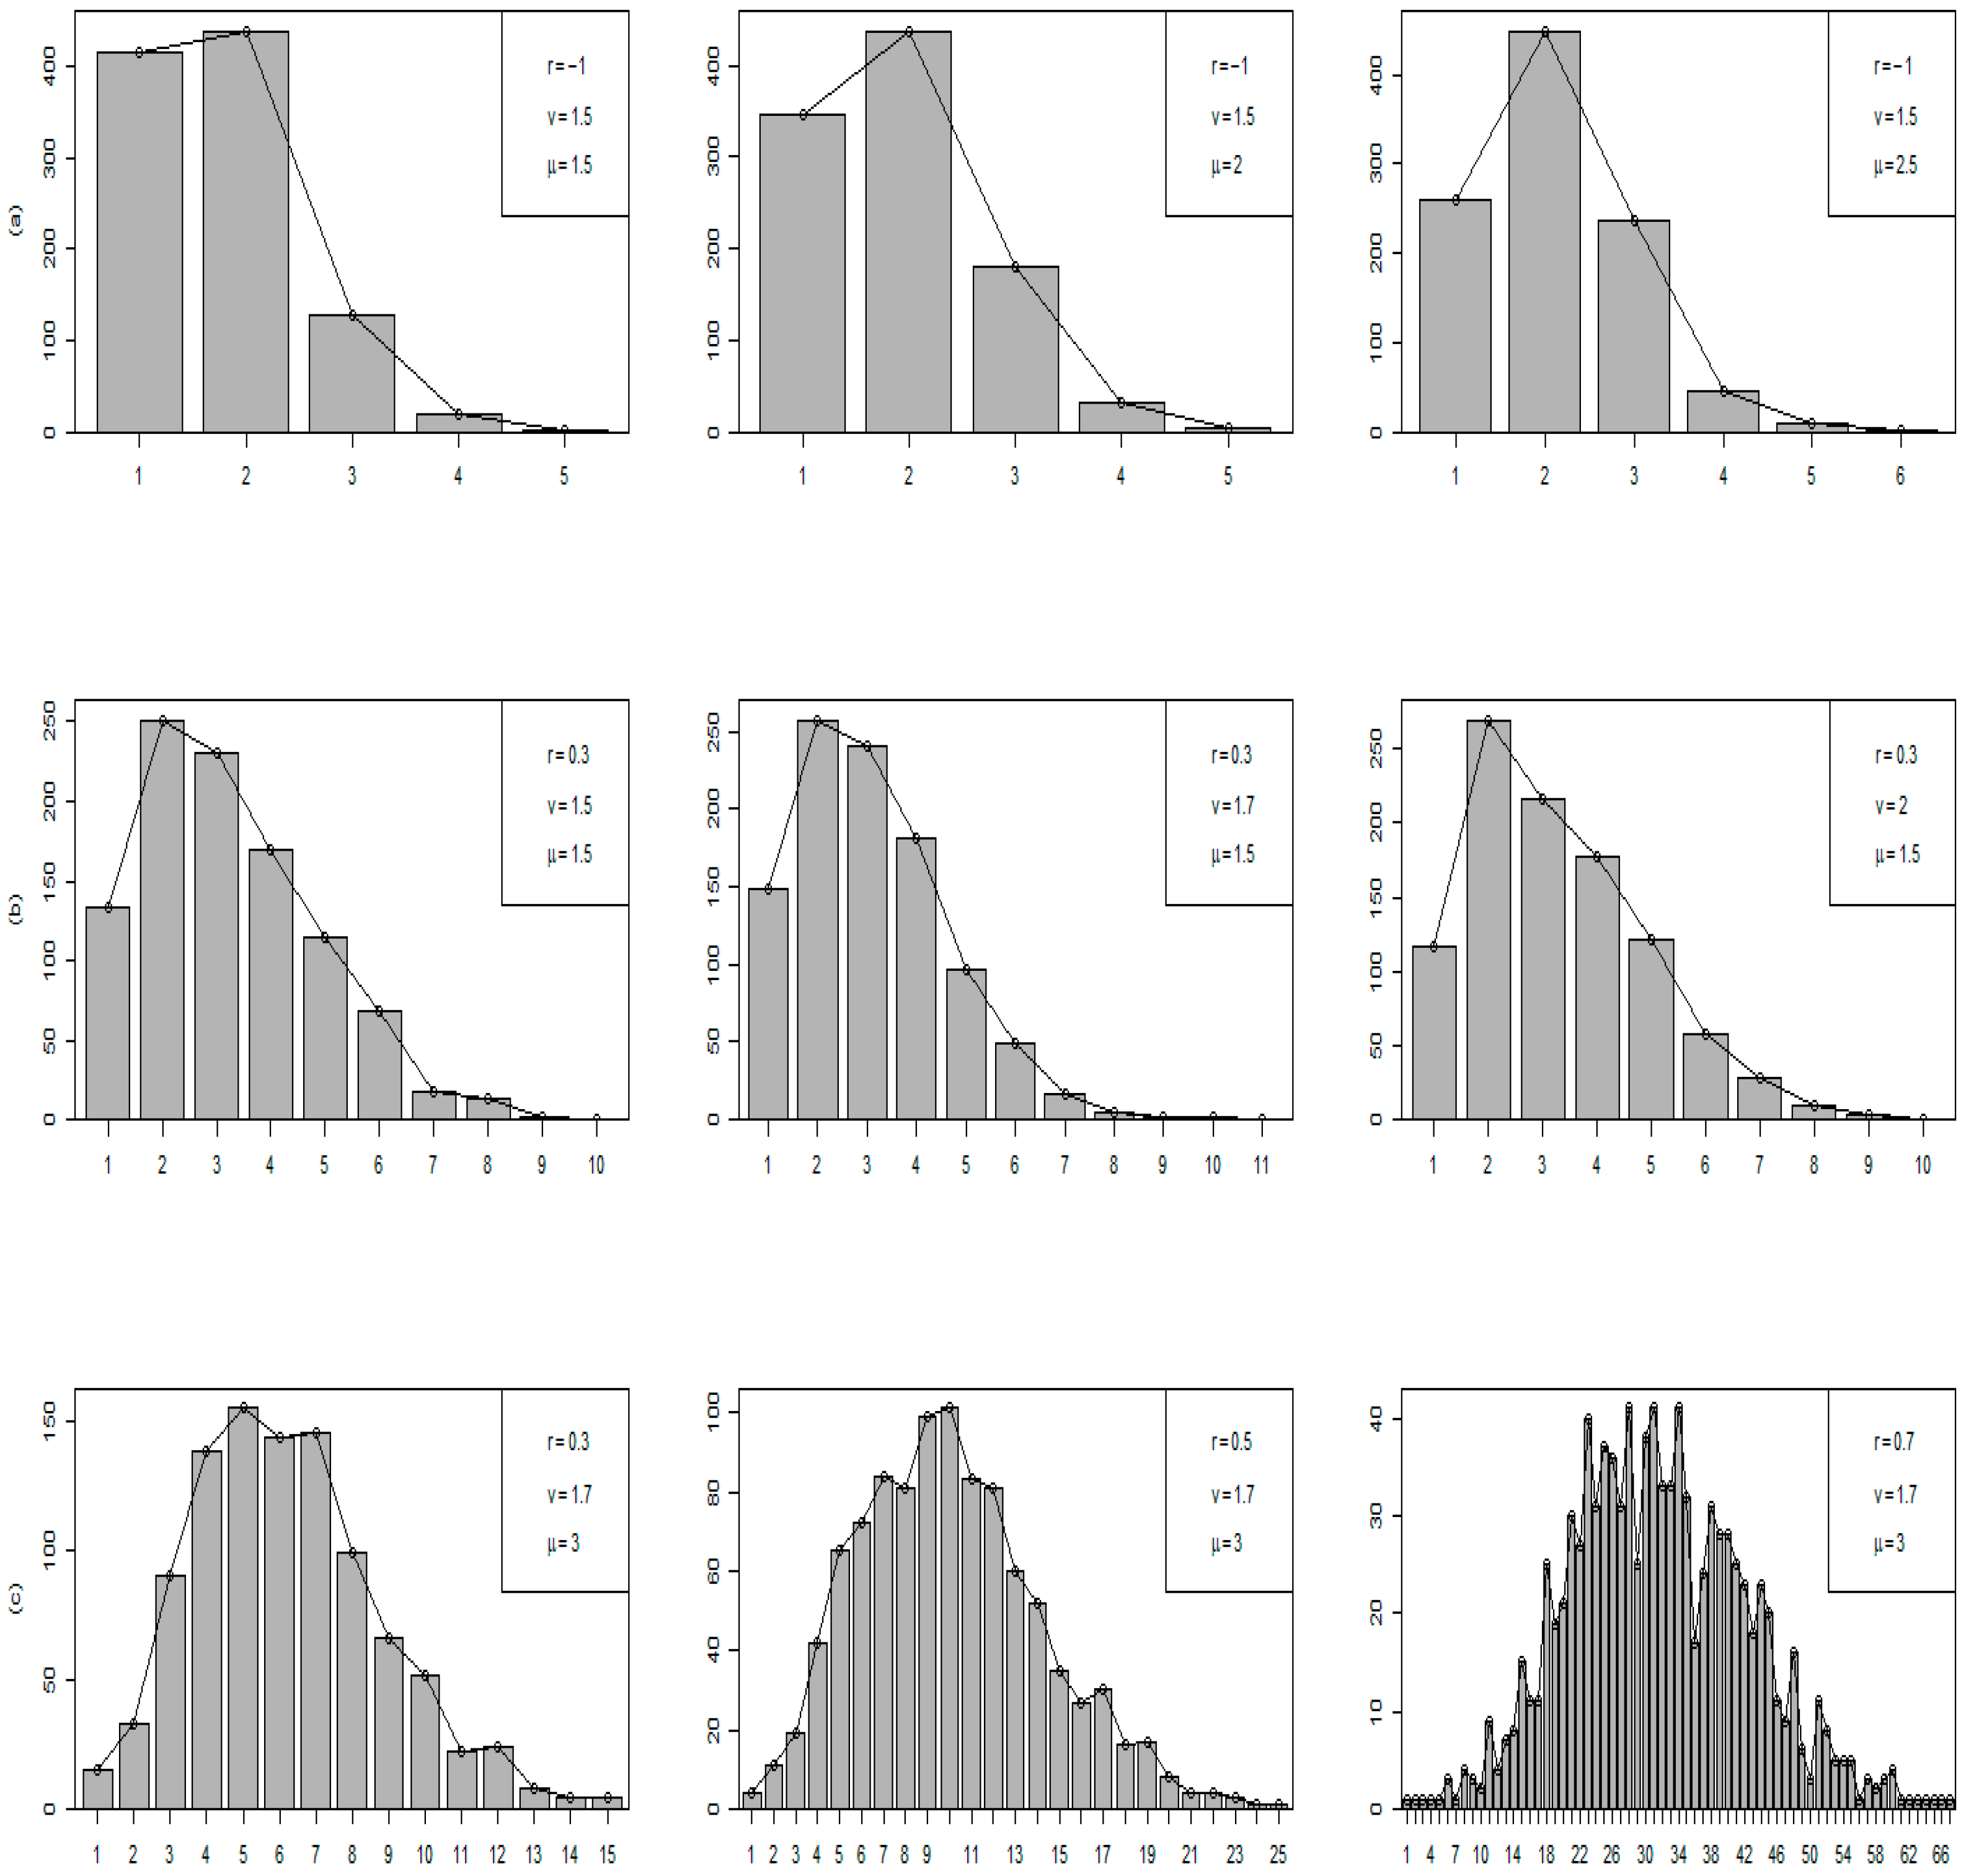
3.1. UD and OD Cases Considering Tail Behavior
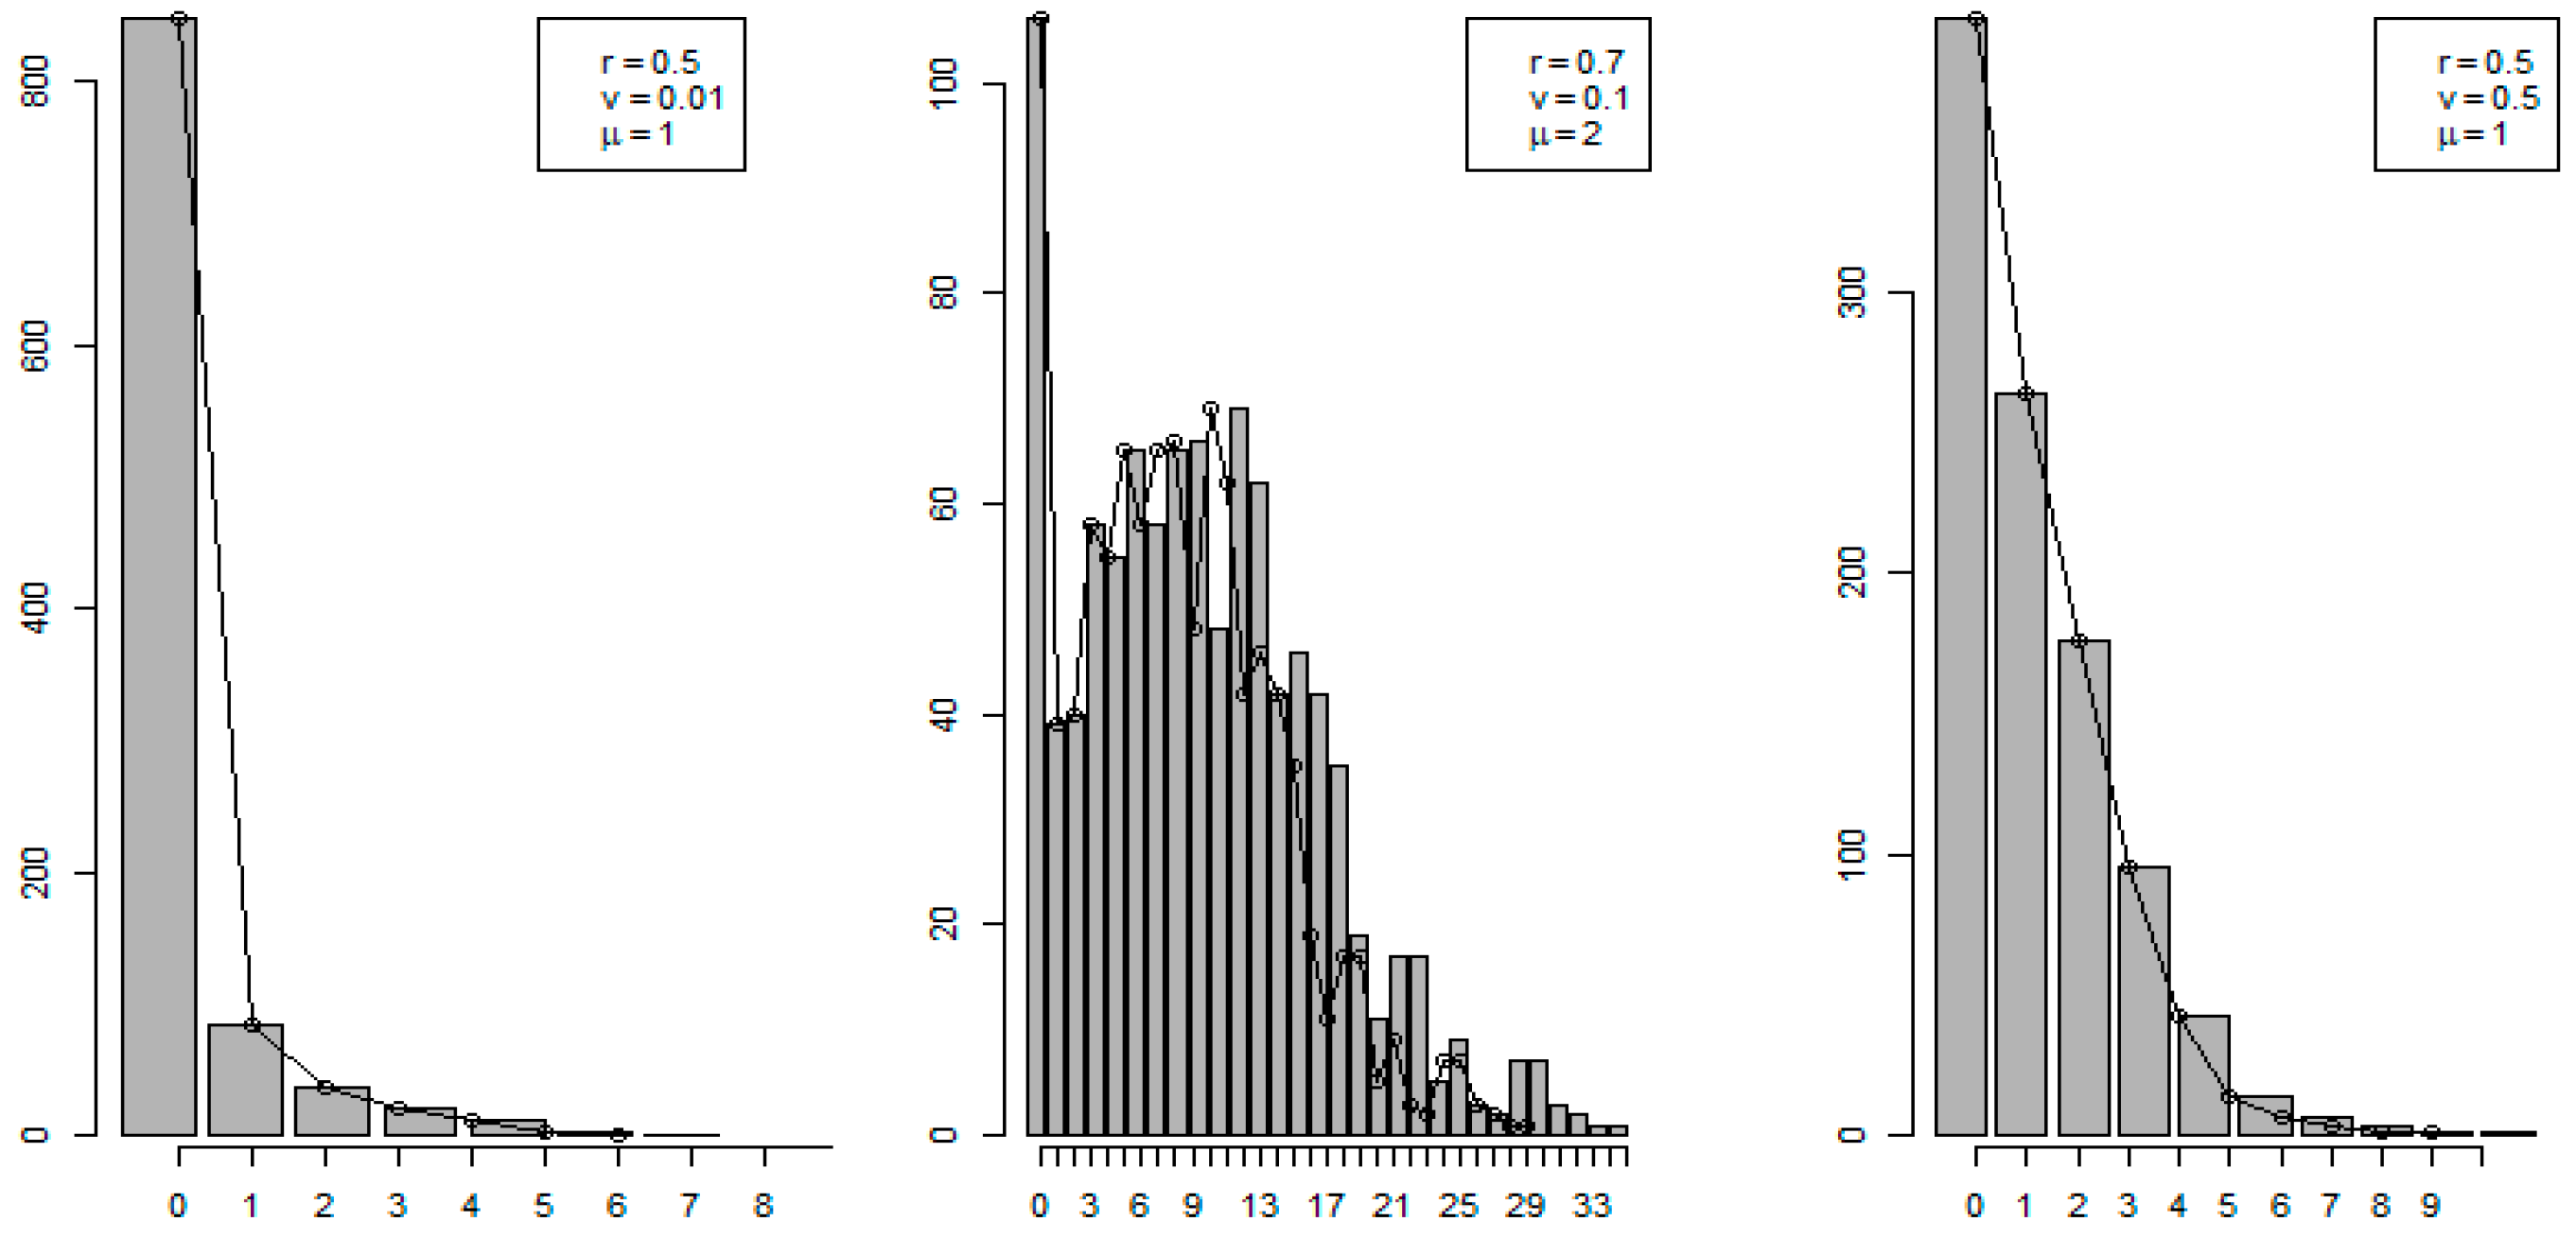
3.2. Zero-Inflation Case
4. Illustrative Examples
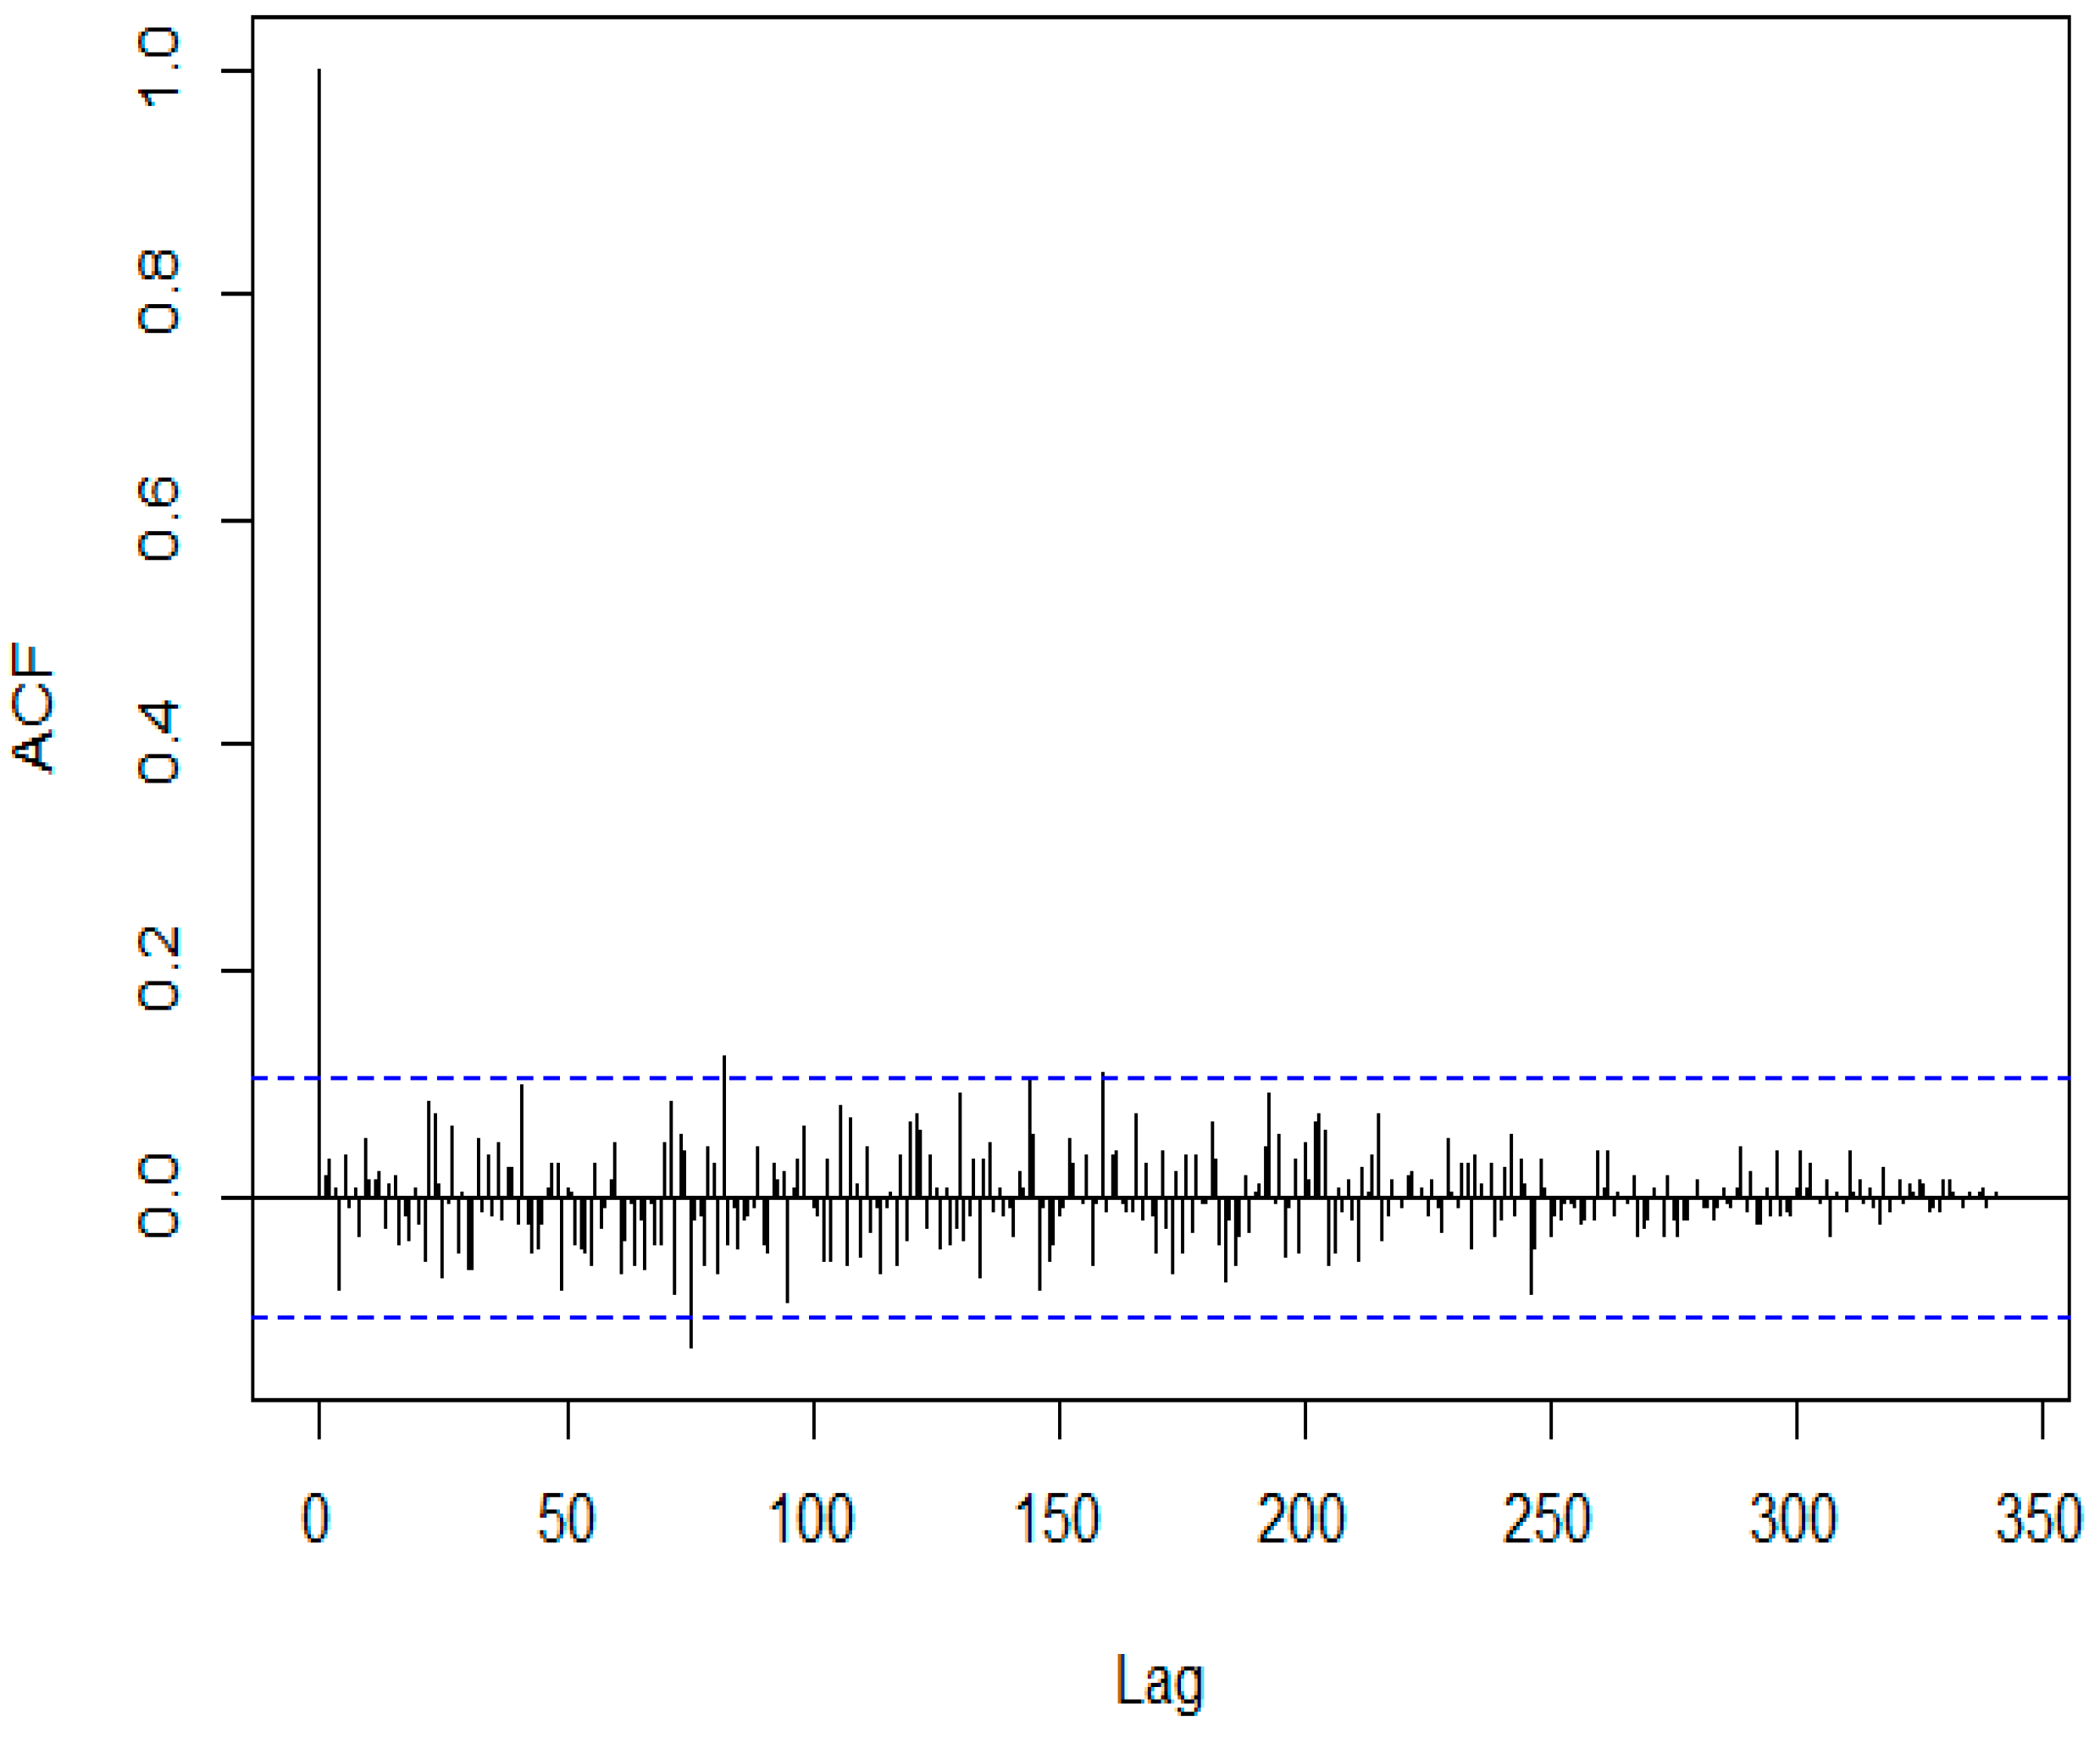
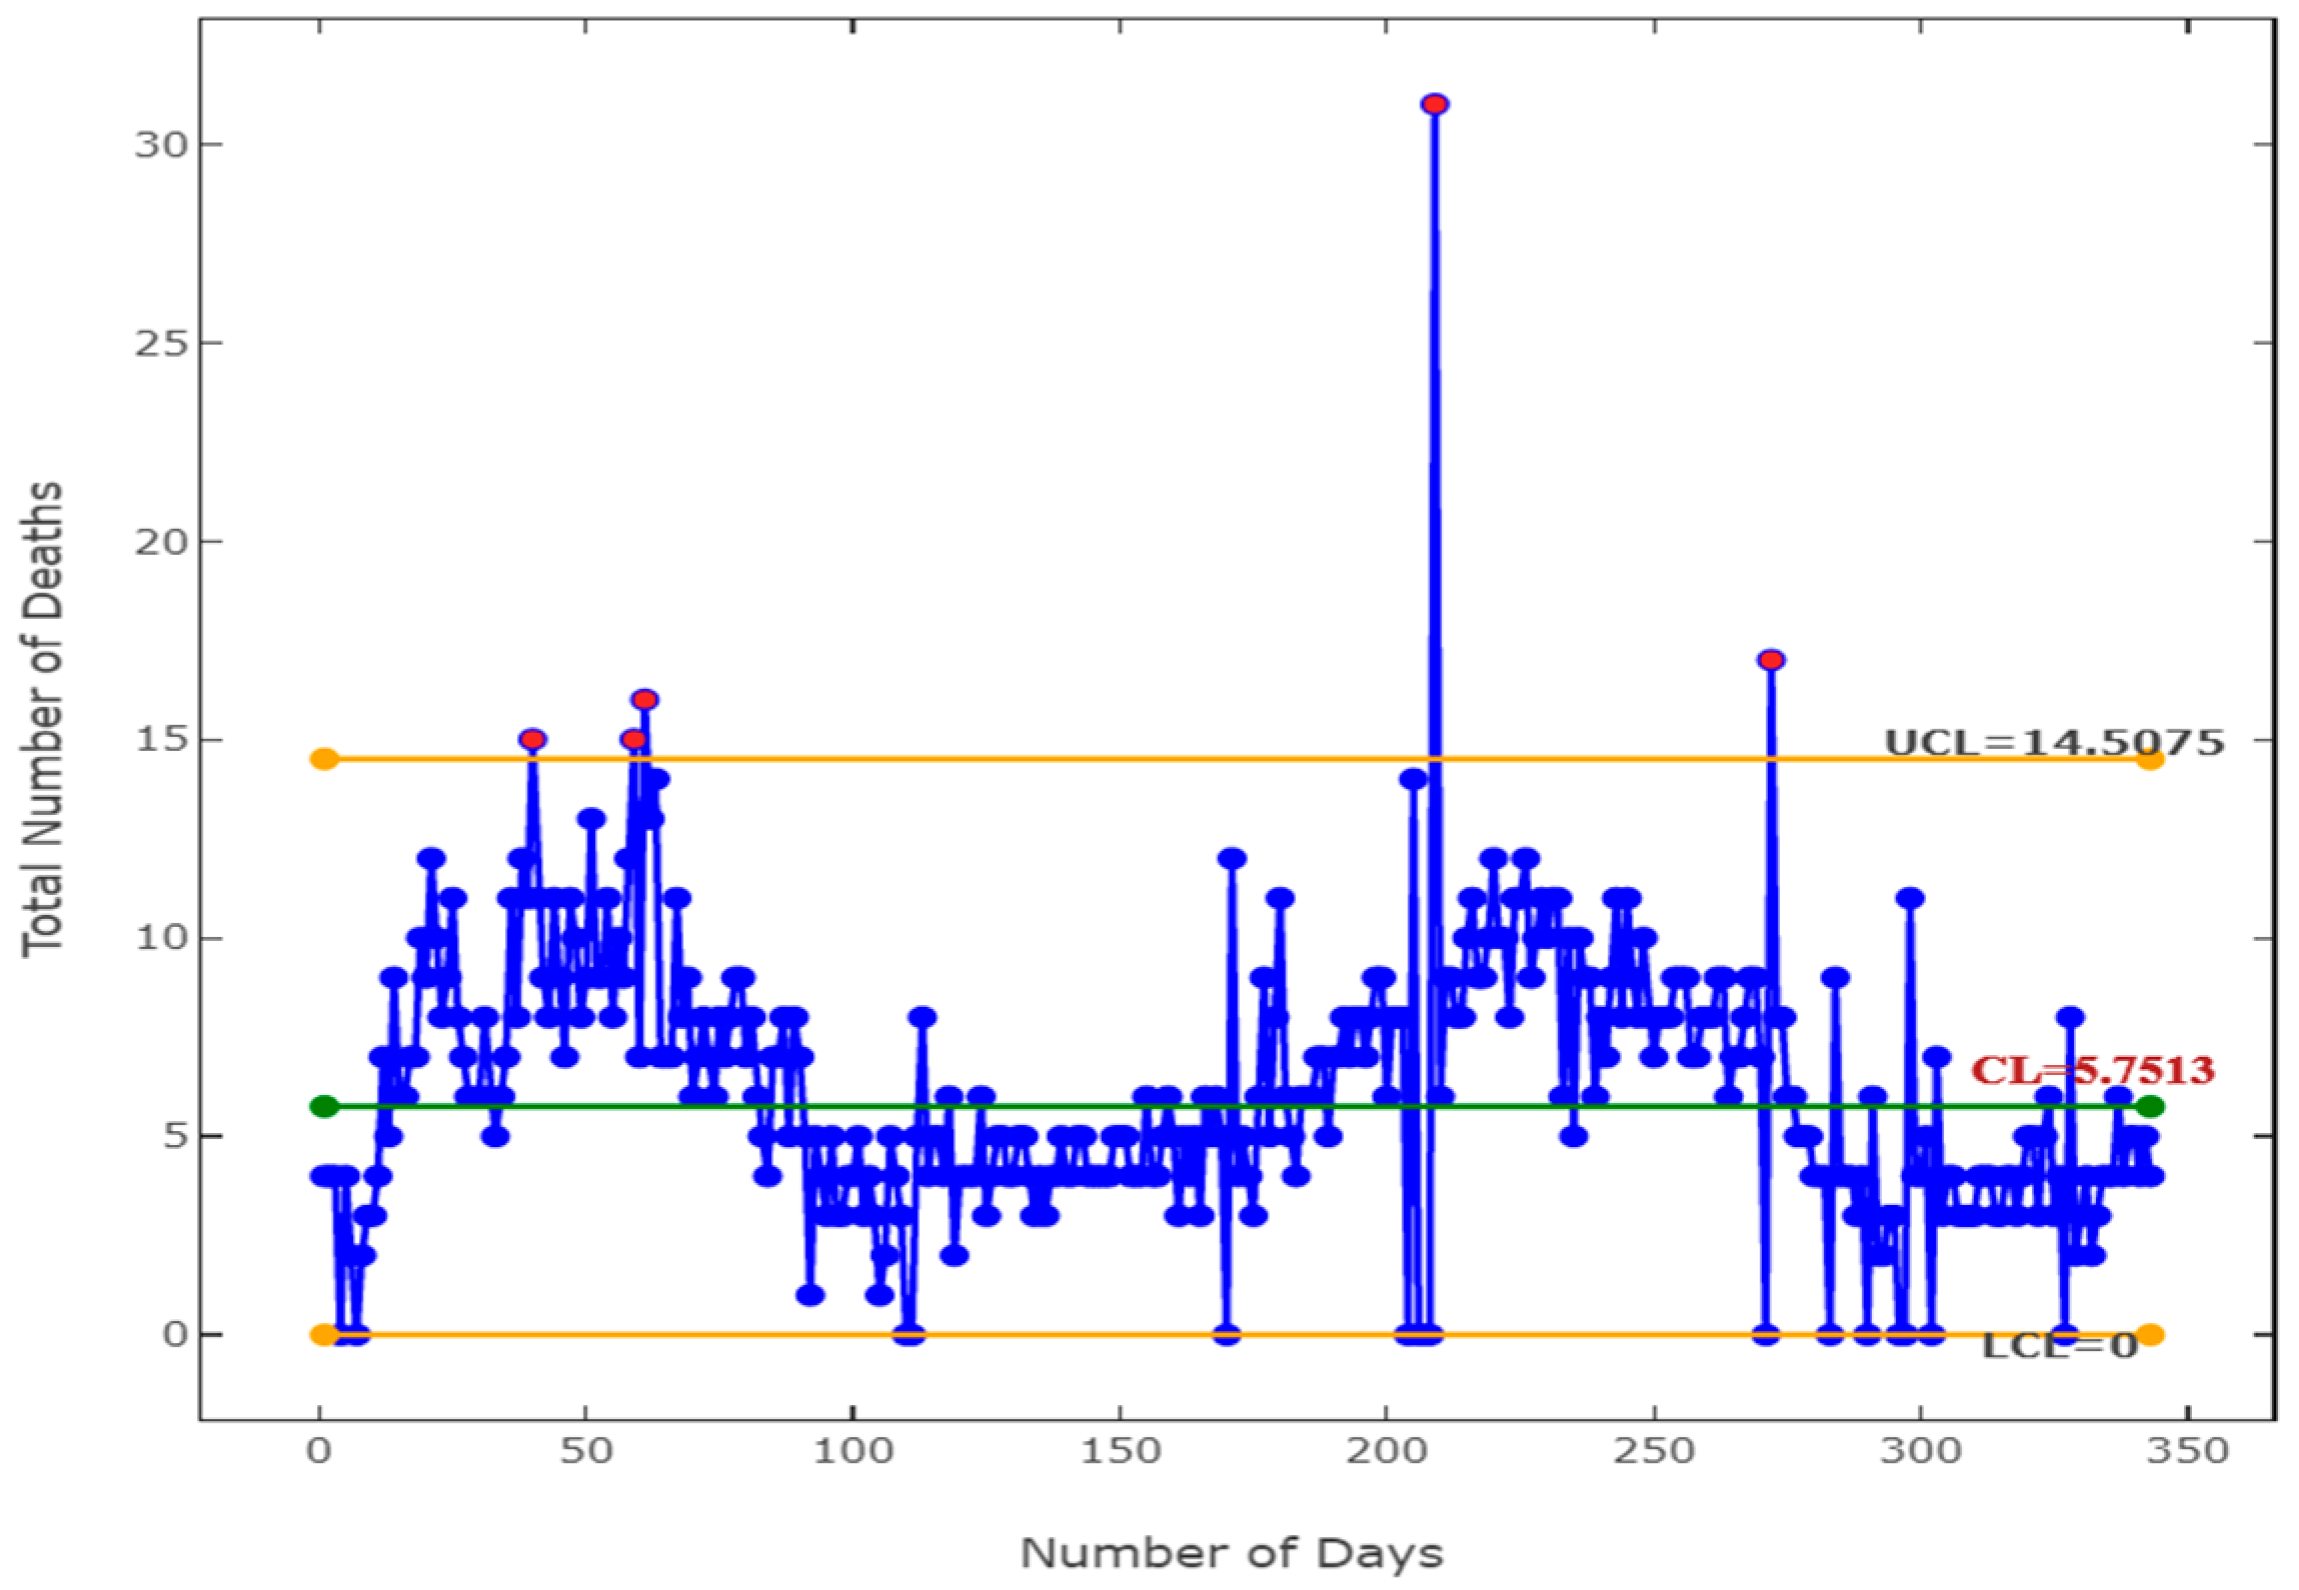
4.1. OD-LT Count Data: Early Detection in COVID-19 Mortality Cases
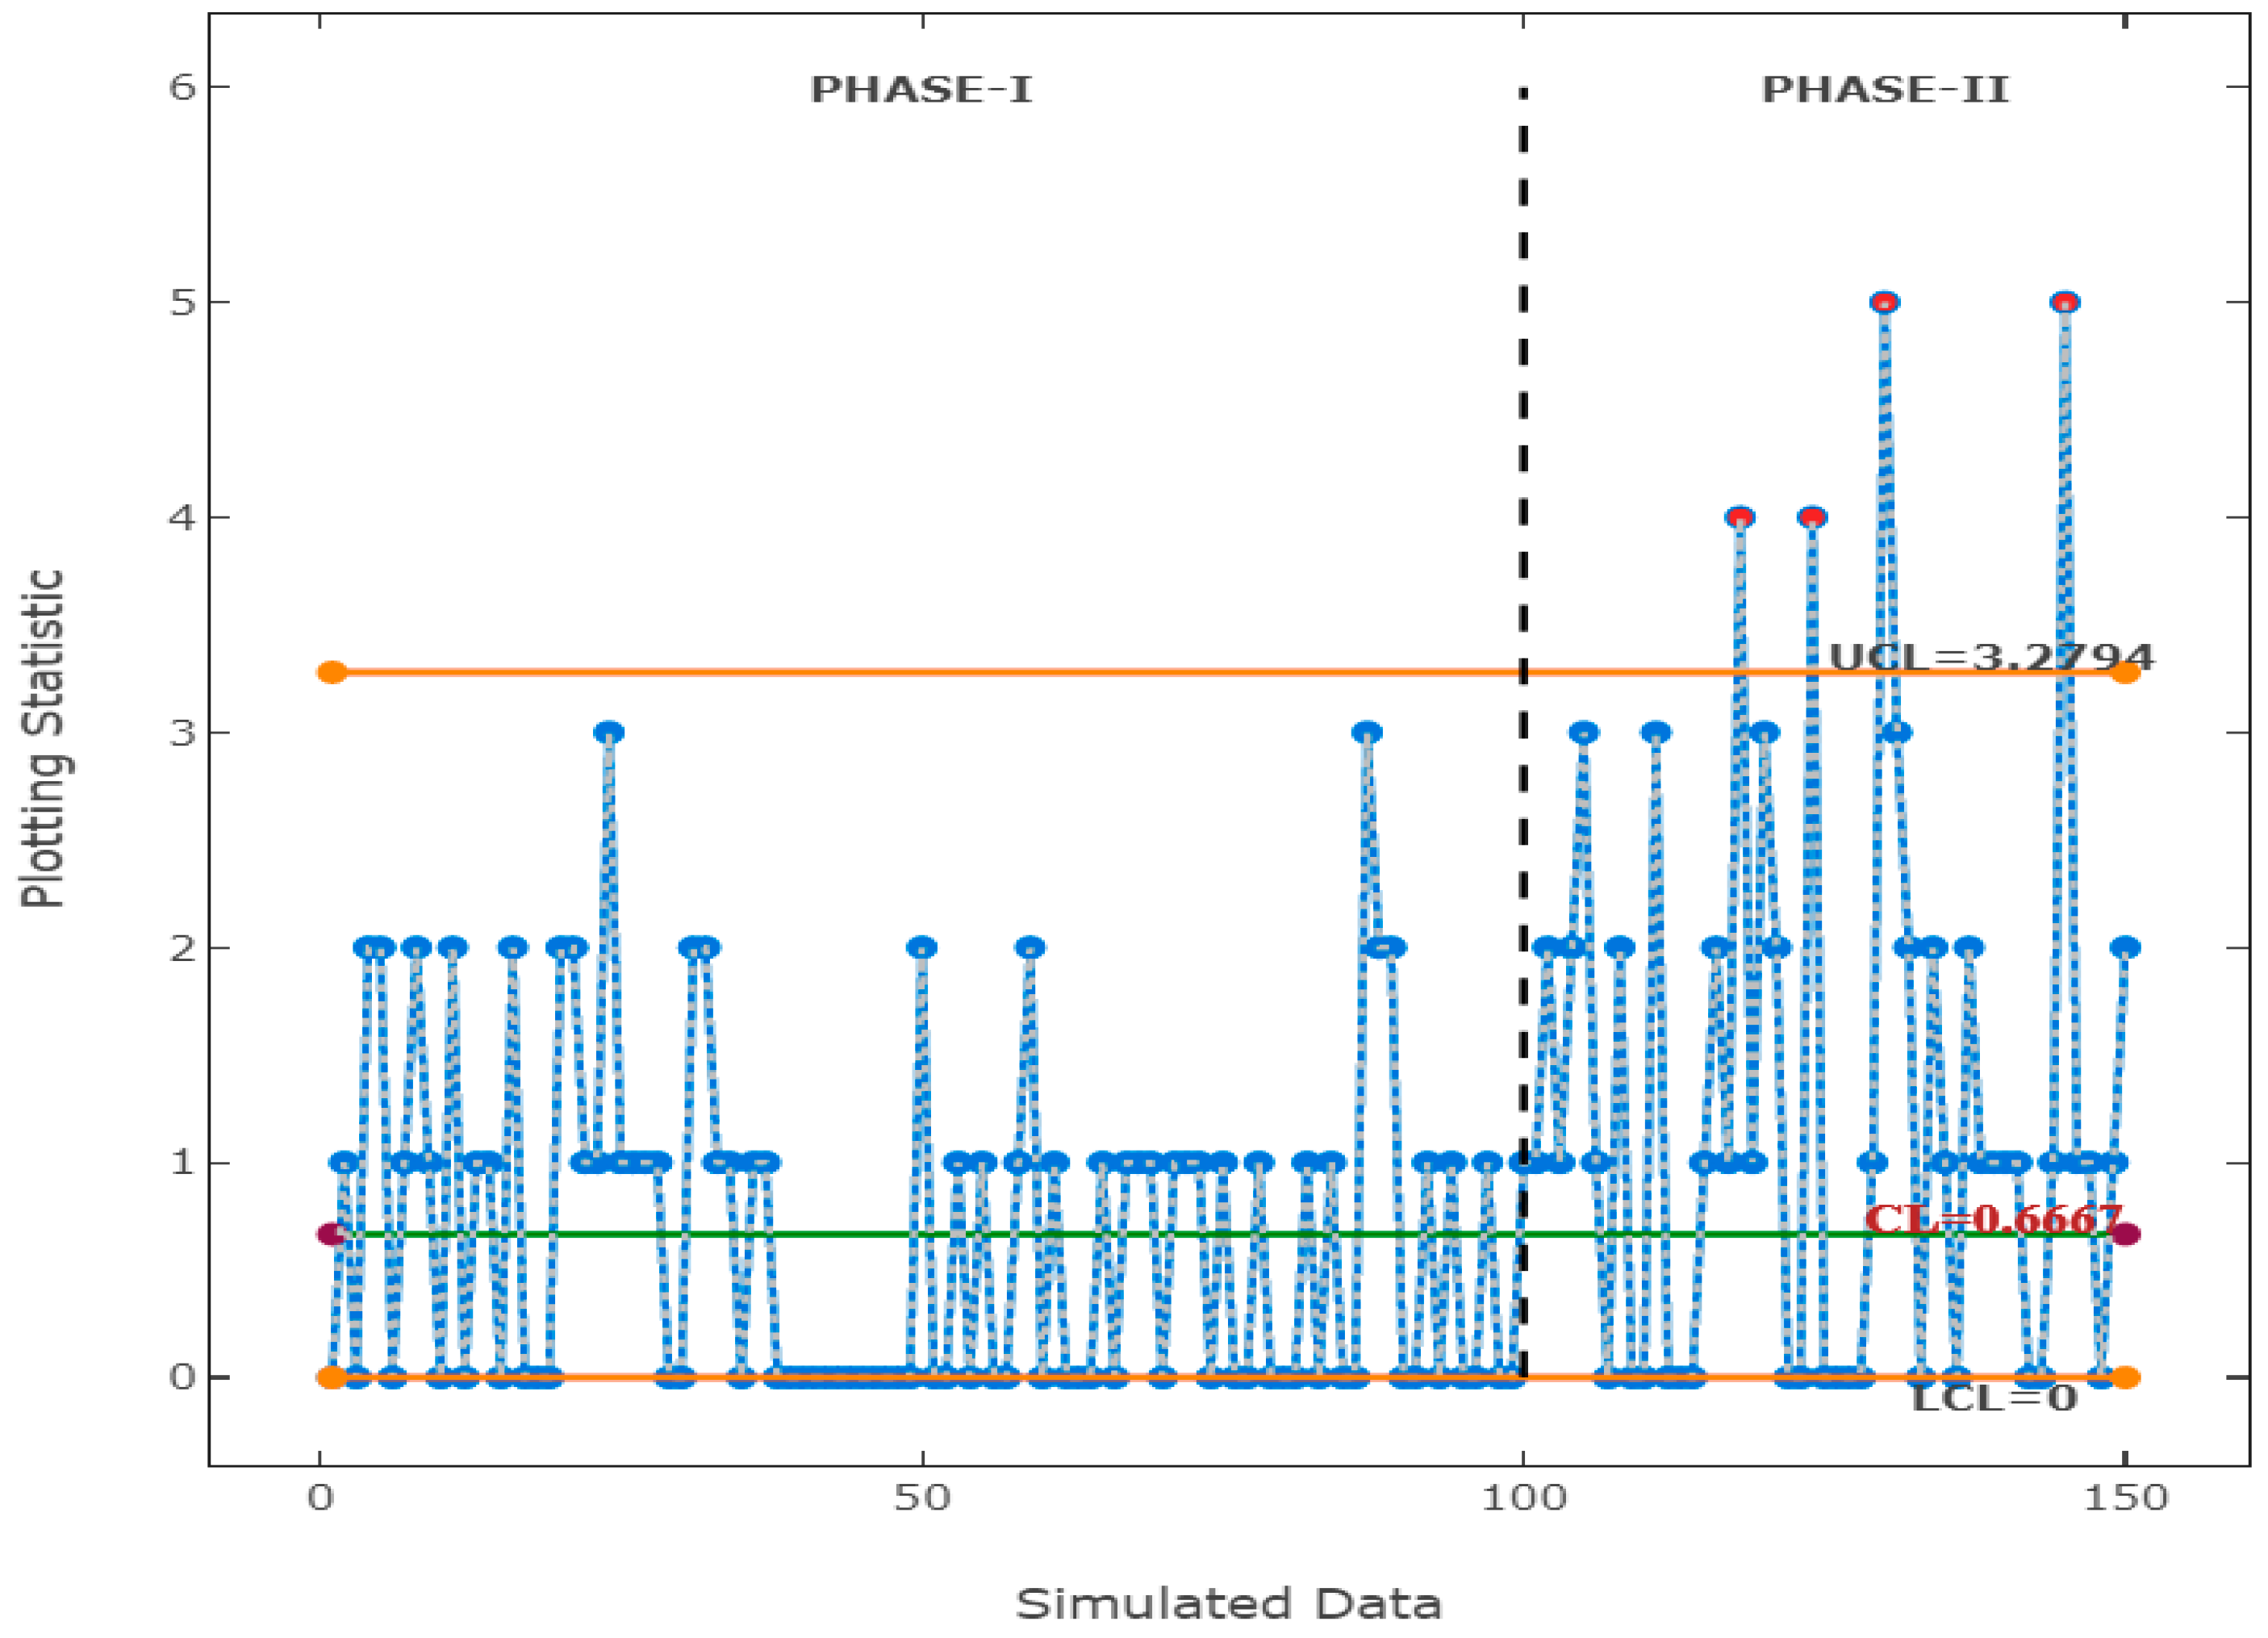
4.2. UD-ST Count Data: A Simulated Data
4.3. ZI Count Data: Monitoring Number of Defective LEDs
5. Conclusive Remarks
Author Contributions
Funding
Data Availability Statement
Conflicts of Interest
References
- Spiegelhalter, D.J. Handling over-dispersion of performance indicators. Qual. Saf. Health Care 2005, 14, 347–351. [Google Scholar] [CrossRef]
- Mohammed, M.A.; Laney, D. Overdispersion in health care performance data: Laney’s approach. Qual. Saf. Health Care 2006, 15, 383–384. [Google Scholar] [CrossRef] [PubMed]
- Albers, W. Control charts for health care monitoring under overdispersion. Metrika 2011, 74, 67–83. [Google Scholar] [CrossRef]
- Famoye, F. Statistical control charts for shifted generalized poisson distribution. J. Ital. Stat. Soc. 1994, 3, 339–354. [Google Scholar] [CrossRef]
- Fang, Y. c-charts, X-charts, and the Katz family of distributions. J. Qual. Technol. 2003, 35, 104–114. [Google Scholar] [CrossRef]
- He, B.; Xie, M.; Goh, T.N.; Tsui, K.L. On Control Charts Based on the Generalized Poisson Model. Qual. Technol. Quant. Manag. 2006, 3, 383–400. [Google Scholar] [CrossRef]
- Xie, M.; He, B.; Goh, T.N. Zero-inflated poisson model in statistical process control. Comput. Stat. Data Anal. 2001, 38, 191–201. [Google Scholar] [CrossRef]
- Chen, N.; Zhou, S.; Chang, T.S.; Huang, H. Attribute control charts using generalized zero-inflated poisson distribution. Qual. Reliab. Eng. Int. 2008, 24, 793–806. [Google Scholar] [CrossRef]
- Sellers, K.F. A generalized statistical control chart for over- or under-dispersed data. Qual. Reliab. Eng. Int. 2012, 28, 59–65. [Google Scholar] [CrossRef]
- Saghir, A.; Lin, Z.; Abbasi, S.A.; Ahmad, S. The use of probability limits of COM-poisson charts and their applications. Qual. Reliab. Eng. Int. 2013, 29, 759–770. [Google Scholar] [CrossRef]
- Saghir, A.; Lin, Z. Cumulative sum charts for monitoring the COM-Poisson processes. Comput. Ind. Eng. 2014, 68, 65–77. [Google Scholar] [CrossRef]
- Alevizakos, V.; Koukouvinos, C. A progressive mean control chart for COM-Poisson distribution. Commun. Stat. Part B Simul. Comput. 2020, 51, 849–867. [Google Scholar] [CrossRef]
- Chen, J.-H. A Double Generally Weighted Moving Average Chart for Monitoring the COM-Poisson Processes. Symmetry 2020, 12, 1014. [Google Scholar] [CrossRef]
- Aslam, M.; Ahmad, L.; Jun, C.H.; Arif, O.H. A Control Chart for COM–Poisson Distribution Using Multiple Dependent State Sampling. Qual. Reliab. Eng. Int. 2016, 32, 2803–2812. [Google Scholar] [CrossRef]
- Aslam, M.; Al-Marshadi, A.H. Design of a Control Chart Based on COM-Poisson Distribution for the Uncertainty Environment. Complexity 2019, 2019, 8178067. [Google Scholar] [CrossRef]
- Adeoti, O.A.; Malela-Majika, J.C.; Shongwe, S.C.; Aslam, M. A homogeneously weighted moving average control chart for Conway–Maxwell Poisson distribution. J. Appl. Stat. 2022, 49, 3090–3119. [Google Scholar] [CrossRef] [PubMed]
- Rao, G.S.; Aslam, M.; Rasheed, U.; Jun, C.-H. Mixed EWMA–CUSUM chart for COM-Poisson distribution. J. Stat. Manag. Syst. 2020, 23, 511–527. [Google Scholar] [CrossRef]
- Rakitzis, A.C.; Maravelakis, P.E.; Castagliola, P. CUSUM Control Charts for the Monitoring of Zero-inflated Binomial Processes. Qual. Reliab. Eng. Int. 2016, 32, 465–483. [Google Scholar] [CrossRef]
- Ho, L.L.; Andrade, B.; Bourguignon, M.; Fernandes, F.H. Monitoring count data with Shewhart control charts based on the Touchard model. Qual. Reliab. Eng. Int. 2021, 37, 1875–1893. [Google Scholar] [CrossRef]
- Bourguignon, M.; Medeiros, R.M.R.; Fernandes, F.H.; Lee Ho, L. Simple and useful statistical control charts for monitoring count data. Qual. Reliab. Eng. Int. 2021, 37, 541–566. [Google Scholar] [CrossRef]
- Boaventura, L.L.; Ferreira, P.H.; Fiaccone, R.L. New statistical process control charts for overdispersed count data based on the Bell distribution. An. Acad. Bras. Ciências 2023, 95, e20200246. [Google Scholar] [CrossRef]
- Raza, M.A.; Aslam, M. Design of control charts for multivariate Poisson distribution using generalized multiple dependent state sampling. Qual. Technol. Quant. Manag. 2019, 16, 629–650. [Google Scholar] [CrossRef]
- Aslam, M.; Saghir, A.; Ahmad, L.; Jun, C.H.; Hussain, J. A control chart for COM-Poisson distribution using a modified EWMA statistic. J. Stat. Comput. Simul. 2017, 87, 3491–3502. [Google Scholar] [CrossRef]
- Urbieta, P.; Lee, H.O.L.; Alencar, A. CUSUM and EWMA Control Charts for Negative Binomial Distribution. Qual. Reliab. Eng. Int. 2017, 33, 793–801. [Google Scholar] [CrossRef]
- Alevizakos, V.; Koukouvinos, C. Monitoring of zero-inflated binomial processes with a DEWMA control chart. J. Appl. Stat. 2021, 48, 1319–1338. [Google Scholar] [CrossRef] [PubMed]
- Mustafa, F.; Sherwani, R.A.K.; Raza, M.A. A new exponentially weighted moving average control chart to monitor count data with applications in healthcare and manufacturing. J. Stat. Comput. Simul. 2023, 93, 3308–3328. [Google Scholar] [CrossRef]
- Mustafa, F.; Sherwani, R.A.K.; Raza, M.A. On designing a cumulative sum control chart using generalized Conway-Maxwell-Poisson distribution for monitoring the count data. Eur. J. Ind. Eng. 2024, 18, 637–668. [Google Scholar] [CrossRef]
- Imoto, T. A generalized Conway-Maxwell-Poisson distribution which includes the negative binomial distribution. Appl. Math. Comput. 2014, 247, 824–834. [Google Scholar] [CrossRef]
- Saghir, A.; Lin, Z. A flexible and generalized exponentially weighted moving average control chart for count data. Qual. Reliab. Eng. Int. 2014, 30, 1427–1443. [Google Scholar] [CrossRef]
- Sellers, K.F.; Shmueli, G. A flexible regression model for count data. Ann. Appl. Stat. 2010, 4, 943–961. [Google Scholar] [CrossRef]
- Montgomery, D.C. Introduction to Statistical Quality Control; Wiley: Hoboken, NJ, USA, 2013. [Google Scholar]
- Mustafa, F.; Khan Sherwani, R.A.; Raza, M.A. A progressive mean control chart for dispersed count data considering tail behavior. Qual. Technol. Quant. Manag. 2023, 1–20. [Google Scholar] [CrossRef]
- Campbell, H. The consequences of checking for zero-inflation and overdispersion in the analysis of count data. Methods Ecol. Evol. 2021, 12, 665–680. [Google Scholar] [CrossRef]
- Woodall, W.H. The use of control charts in health-care and public-health surveillance. J. Qual. Technol. 2006, 38, 89–104. [Google Scholar] [CrossRef]
- He, S.; Huang, W.; Woodall, W.H. CUSUM charts for monitoring a zero-inflated poisson process. Qual. Reliab. Eng. Int. 2012, 28, 181–192. [Google Scholar] [CrossRef]
- Alevizakos, V.; Koukouvinos, C. Monitoring of zero-inflated Poisson processes with EWMA and DEWMA control charts. Qual. Reliab. Eng. Int. 2020, 36, 88–111. [Google Scholar] [CrossRef]
- Van den Broek, J. A score test for zero inflation in a Poisson distribution. Biometrics 1995, 51, 738–743. [Google Scholar] [CrossRef]


| G-Chart | |
|---|---|
| LCL | |
| CL | |
| UCL |
| 3 | 15 | 50 | 100 | 300 | 1000 | |||
|---|---|---|---|---|---|---|---|---|
| −0.5 | 1.5 | 1 | 3.510 | 3.156 | 3.120 | 3.200 | 3.440 | 4.005 |
| −0.5 | 3 | 2 | 3.256 | 3.693 | 4.46 | 5.261 | 7.073 | 10.69 |
| −1.5 | 1.5 | 1 | 2.800 | 2.861 | 3.063 | 3.144 | 3.303 | 3.967 |
| −1 | 2 | 2 | 3.401 | 3.371 | 3.521 | 4.002 | 4.903 | 6.751 |
| 0.3 | 2 | 2.5 | 3.010 | 2.95 | 3.050 | 3.100 | 3.302 | 3.708 |
| 0.3 | 1.5 | 1 | 3.245 | 3.124 | 3.248 | 3.551 | 4.090 | 5.250 |
| 0.5 | 1.5 | 1 | 3.366 | 3.468 | 4.099 | 4.667 | 6.100 | 8.550 |
| 0.5 | 2 | 2 | 2.965 | 3.067 | 3.251 | 3.553 | 4.105 | 5.202 |
| 0.7 | 2 | 2 | 3.101 | 3.053 | 3.180 | 3.342 | 3.796 | 4.622 |
| ARL1 | ||||||||||||
|---|---|---|---|---|---|---|---|---|---|---|---|---|
| 3 | 15 | 50 | 100 | 300 | 1000 | |||||||
| G-Chart | Q-Chart | G-Chart | Q-Chart | G-Chart | Q-Chart | G-Chart | Q-Chart | G-Chart | Q-Chart | G-Chart | Q-Chart | |
| −0.5 | 3350.1 | 9599.01 | 9990.12 | 6.45 | 25.9 | 1.08 | 4.1 | 1 | 1 | 1 | 1 | 1 |
| −0.3 | 1001.6 | 6186.23 | 6468 | 48.74 | 423 | 4.01 | 91.3 | 1.72 | 11.1 | 1.20 | 1.8 | 1 |
| −0.2 | 731.7 | 3000.10 | 3008.7 | 136.36 | 1620 | 13.91 | 617.2 | 5.58 | 184.0 | 1.98 | 59.4 | 1 |
| −0.1 | 481.3 | 1250.18 | 1209.8 | 344.84 | 1389.6 | 61.99 | 1853.2 | 35.76 | 4481.8 | 9.72 | 8021.7 | 2.17 |
| 0.1 | 213.3 | 374.25 | 219.4 | 256.01 | 101.12 | 601.89 | 64.7 | 2201.89 | 23.5 | 6789.1 | 5.9 | 9999 |
| 0.2 | 156.2 | 236.12 | 96.5 | 105.34 | 39.7 | 180.33 | 19.1 | 267.23 | 4.7 | 520.13 | 1.3 | 1717.35 |
| 0.3 | 117.3 | 162.83 | 47 | 54.84 | 18 | 46.55 | 7.6 | 41.23 | 1.9 | 29.13 | 1.0 | 5.12 |
| 0.5 | 71.8 | 84.55 | 11.1 | 17.68 | 5.5 | 9.67 | 2.3 | 5 | 1.01 | 1.56 | 1 | 1.01 |
| ARL1 | ||||||||||||
|---|---|---|---|---|---|---|---|---|---|---|---|---|
| 3 | 15 | 50 | 100 | 300 | 1000 | |||||||
| G-Chart | Q-Chart | G-Chart 3.46 | Q-Chart | G-Chart | Q-Chart | G-Chart | Q-Chart | G-Chart | Q-Chart | G-Chart | Q-Chart | |
| −0.5 | 9900.12 | 9653.2 | 1.71 | 22.84 | 1 | 2.01 | 1 | 1.01 | 1 | 1 | 1 | 1 |
| −0.3 | 6998.37 | 5023.21 | 7.64 | 193.08 | 1.4 | 9 | 1.03 | 3.69 | 1 | 1.01 | 1 | 1 |
| −0.2 | 4134.81 | 2468.23 | 22.24 | 758.31 | 3.65 | 39.23 | 1.6 | 11.23 | 1.01 | 2 | 1 | 1.01 |
| −0.1 | 1256.88 | 1052.71 | 84.79 | 1065.23 | 22.13 | 314.23 | 10.75 | 123.23 | 2.25 | 29.1 | 1.01 | 6.23 |
| 0.1 | 155.13 | 220.41 | 98.23 | 88.43 | 37.11 | 35.36 | 19.89 | 20.87 | 5 | 6.23 | 2 | 3.23 |
| 0.2 | 68.55 | 112.44 | 32.63 | 27.32 | 8.77 | 6.76 | 3.91 | 4.81 | 1.01 | 1.99 | 1 | 1.01 |
| 0.3 | 33.15 | 59.69 | 10.55 | 12.1 | 3 | 3.12 | 1.09 | 1.52 | 1 | 1.01 | 1 | 1 |
| 0.5 | 10.34 | 23.23 | 2.41 | 4.12 | 1.07 | 1.19 | 1 | 1 | 1 | 1 | 1 | 1 |
| G-Chart | ZIPC-Chart | ZINBC-Chart | ZICOMPC-Chart | |
|---|---|---|---|---|
, | ||||
| 0.1 | 3.21 | 50.99 | 4.95 | 144.66 |
| 0.3 | 1.36 | 5.45 | 2.17 | 56.90 |
| 0.5 | 1 | 2.03 | 1.55 | 25.37 |
| 0.7 | 1 | 1.08 | 1.01 | 14.35 |
| 1 | 1 | 1 | 1 | 7.24 |
| G-Chart | ZIPC-Chart | ZINBC-Chart | ZICOMPC-Chart | |
|---|---|---|---|---|
, | 0.35, | |||
| 0.1 | 23.33 | 24.21 | 29.63 | 194.56 |
| 0.3 | 1.75 | 2.81 | 2.01 | 64.91 |
| 0.5 | 1.01 | 1.84 | 1.71 | 26.99 |
| 0.7 | 1 | 1.09 | 1.03 | 13.50 |
| 1 | 1 | 1 | 1 | 6.34 |
| 3,4,4,4,0,4,2,0,2,3,3,4,7,5,9,6,6,7,7,10,9,12,10,8,9,11,8,7,6,6,6,8,6,5,6,7,11,8,12,11,15,11,9,8,11,9,7,11,10,8,9,13,9,9,11,8,10,9,12,15,7,16,13,14,7,7,7,11,8,9,6,7,8,7,6,8,7,8,9,9,7,8,6,5,4,7,7,8,5,8,7,5,1,5,4,3,5,3,3,4,4,5,3,4,3,1,2,5,4,3,0,0,5,8,4,5,5,4,6,2,4,4,4,4,6,3,4,5,5,4,4,5,5,4,3,4,3,4,4,5,4,4,5,5,4,4,4,4,4,5,5,5,4,4,4,6,4,4,5,6,5,3,5,4,5,3,6,5,6,5,0,12,4,5,4,3,6,9,5,8,11,6,5,4,6,6,6,7,7,5,7,7,8,7,8,8,7,8,9,9,6,8,8,8,0,14,0,0,0,31,6,9,9,8,8,10,11,9,9,10,12,10,10,8,11,11,12,9,10,11,10,11,11,6,10,5,10,9,9,6,8,7,9,11,8,11,9,8,10,8,7,8,8,8,9,9,9,7,7,8,8,9,9,6,7,7,8,9,9,7,0,17,8,8,6,6,5,5,5,4,4,4,0,9,4,4,4,3,4,0,6,2,2,3,3,0,0,11,4,4,5,0,7,3,4,4,3,3,3,3,4,4,4,3,3,4,4,3,4,5,5,3,5,6,3,4,0,8,2,3,4,2,3,4,4,4,6,4,5,5,4,5,4 |
| Parameters | Criterion | ||||||
|---|---|---|---|---|---|---|---|
| Distribution(s) | -LL | AIC | BIC | ||||
| GCOMP | 2.7363 | 0.3895 | 1.3528 | 495.43 | −880.979 | 1767.959 | 1779.472 |
| COMP | 2.4636 | 0.5156 | 566.65 | −885.979 | 1774.189 | 1781.865 | |
| Phase-I Data | Phase-II Data |
|---|---|
| 0,1,0,2,2,0,1,2,1,0,2,0,1,1,0,2,0,0,0,2,2,1,1,3,1,1,1,1,0,0,2,2,1,1,0,1,1,0,0,0,0,0,0,0,0,0,0,0,0,2,0,0,1,0,1,0,0,1,2,0,1,0,0,0,1,0,1,1,1,0,1,1,1,0,1,0,0,1, 0,0,0,1,0,1,0,0,3,2,2,0,0,1,0,1,0,0,1,0,0,1 | 1,0,1,0,0,1,2,0,1,0,0,0,1,0,1,1,1,0,1,2,1,2,3,1,0,2,0,0,3,0,0,0,1,2,1,4,1,3,2,0,0,4,0,0,0,0,1,5,3,2,0,2,1,0,2,1,1,1,1,0,0,1,5,1,1,0,1,2 |
| Phase-I Data | Phase-II Data |
|---|---|
| 0,0,19,0,0,0,0,5,0,0,0,6,0,2,0,0,0,0,0,0,0,0,0,0,0,0,0,0,0,12,0,9,0,0,0,8,0,0,0,16,0,0,0,6,3,0,0,0,0,0,0,0,0,2,0,0,0,7,0,0,0,0,0,0,0,0,0,0,0,0,0,0,0,0,0,0,0,0,0,0,8,0,0,0,18,9,0,0,0,0,2,0,0,0,0,0,0,0,0,0 | 0,0,0,19,0,0,0,0,5,0,0,6,0,2,0,0,0,0,0,0,0,0,0,0,0,0,0,0,0,12,0,10,0,0,0,8,0,0,0,0,0,16,0,6,3,0,0,0,0,0,0,0,0,0,0,0,0,0,0,5,0,2,0,8,4,0,0,0,0,0,0,0,0,0,0,1,4,0,0,6,0,2,0,9,0,0,0,0,0,0,0,0,5,0,0,0,0,4,0,0 |
Disclaimer/Publisher’s Note: The statements, opinions and data contained in all publications are solely those of the individual author(s) and contributor(s) and not of MDPI and/or the editor(s). MDPI and/or the editor(s) disclaim responsibility for any injury to people or property resulting from any ideas, methods, instructions or products referred to in the content. |
© 2024 by the authors. Licensee MDPI, Basel, Switzerland. This article is an open access article distributed under the terms and conditions of the Creative Commons Attribution (CC BY) license (https://creativecommons.org/licenses/by/4.0/).
Share and Cite
Mustafa, F.; Sherwani, R.A.K.; Raza, M.A.; Darwish, J.A. On Designing a New Control Chart Using the Generalized Conway–Maxwell–Poisson Distribution to Monitor Count Data. Processes 2024, 12, 688. https://doi.org/10.3390/pr12040688
Mustafa F, Sherwani RAK, Raza MA, Darwish JA. On Designing a New Control Chart Using the Generalized Conway–Maxwell–Poisson Distribution to Monitor Count Data. Processes. 2024; 12(4):688. https://doi.org/10.3390/pr12040688
Chicago/Turabian StyleMustafa, Fakhar, Rehan Ahmad Khan Sherwani, Muhammad Ali Raza, and Jumanah Ahmed Darwish. 2024. "On Designing a New Control Chart Using the Generalized Conway–Maxwell–Poisson Distribution to Monitor Count Data" Processes 12, no. 4: 688. https://doi.org/10.3390/pr12040688