Article

A Smart Manufacturing Process for Textile Industry Automation under Uncertainties

1
Department of Mathematics, Lovely Professional University, Phagwara 144411, Punjab, India
2
Department of Industrial & Data Engineering, Hongik University, Wausan-ro 94, Mapo-Gu, Seoul 04066, Republic of Korea
3
Department of Robotics and Control Engineering, School of Electronics and Electrical Engineering, Lovely Professional University, Phagwara 144411, Punjab, India
*
Author to whom correspondence should be addressed.
Processes 2024, 12(4), 778; https://doi.org/10.3390/pr12040778
Submission received: 19 March 2024 / Revised: 9 April 2024 / Accepted: 10 April 2024 / Published: 12 April 2024
(This article belongs to the Section Manufacturing Processes and Systems)

Abstract

:
Most textile manufacturing companies in the world heavily rely on manual labor, particularly in the fabric inspection section, especially for cotton fabric. Establishing smart manufacturing systems like industrial automation in the textile industry for cotton fabric inspection is important for error-free inspection. The proposed make-to-order (MTO) inventory model focuses on the strategic development of a supply chain network under fuzzy uncertainty. The distinctiveness of this research lies in integrating a methodology that involves human and machine interaction, along with allocating resources to investment in smart manufacturing. This article presents a case study of the Jagatjit Cotton Textiles (JCT) manufacturing company in Punjab, India, as an example to validate the model and check the performance of SMT in the fabric inspection process in cotton TC mills. This paper contributes by developing four distinct textile supply chain models with industrial automation under triangular and trapezoidal fuzzy demand. A numerical analysis is conducted to verify the effectiveness of installing automated fabric inspection machines in the cotton plant. This article proposes an iterative solution algorithm (KDPMG) to obtain the global optimum for the proposed model. A comparative study of the proposed algorithm, KDPMG, and the genetic algorithm (GA) is presented in this study to verify the credibility of the obtained results. It is observed that KDPMG provides more appropriate solutions to the problem compared to the GA. Moreover, the computational time of KDPMG is significantly less than that of the GA. The rigorous analysis reveals that maximum profit can be achieved under trapezoidal fuzzy demand with fully automated fabric inspection technology. Using a triangular fuzzy demand pattern, the model with fully automated smart manufacturing achieves an 8.62% higher profit compared to a traditional system. Similarly, in the case of a trapezoidal fuzzy demand pattern, the adoption of automation in cotton plants can achieve an 8.69% higher profit. Hence, the implementation of smart manufacturing systems in the mending section of the cotton textile industry proves to be more profitable compared to the traditional inspection process.

1. Introduction

The textile and clothing (TC) manufacturing sector is one of the earliest enterprises, predating the first industrial revolution, and it has enthusiastically embraced computerization. The fourth industrial revolution (I4.0) has empowered the sector to refine its old production procedures and decision-making processes to produce premium-quality textile products at reduced rates tailored to the fluctuating needs of customers [1]. With the assistance of industrial automated policies and AI-driven smart manufacturing technology (SMT), a TC manufacturing company can attain a creative judgment regarding cost management, market potential, uncertainties, and high-quality customer experiences [2,3,4]. These industries have also improved the customization and standardization of their products, along with their supply chain network, and enhanced their financial success [5]. As the SCM network deals with the management of the manufacturing process at all levels from raw material arrangement to the final output of the required product, the SCM network of a TC company likewise includes three levels: the production of fibers and yarns, chemical processing, and cloth making (see Figure 1 [3,6]). In this complex production process, there is always a critical point where defective items are likely to occur with a strong probability [7]. Pushing these items to further production levels leads to the inadequate allocation of time, resources, and financial assets [8]. Advancements in this network compel companies to restructure and upgrade their SCM networks using SMTs for greater profitability.
In addition, within the domain of TC manufacturing corporations worldwide, the quality of fabric has a huge influence on the profitability of the company, which cannot be overlooked because of the fierce rivalry in the global market. Almost all TC manufacturing companies rely on human-driven, semi-automated inspection processes to assess the quality of fabric. Despite their innumerable drawbacks, such as being tedious, slow, involving complex reviews, and incurring high labor costs, most TC companies, especially cotton TC companies, use manual assessment procedures for product assessment [9]. To ensure that the product meets pre-planned criteria, careful observation of the product assessment procedure using SMT is imperative in this sector [10]. Furthermore, applications of I4.0 offer a variety of computerized visual assessment options that support innovative smart SCM networks and efficient manufacturing procedures for TC companies [11]. This idea serves as the motivation for this work. The prime focus of this study is on the quality control segment of TC manufacturing industries, where the texture and quality of the fabric are analyzed. Assistance via fully automated inspection technology in product scrutiny can provide a cyber-physical platform to enhance the industry’s competitiveness in the market.
The textile and clothing (TC) manufacturing sector is widely recognized as a crucial industry for income generation on a global scale. The reputation and profitability of this sector heavily rely on the quality of the fabric produced [12]. Various TC companies have established specific protocols for examining and rejecting fabric items based on the size and quantity of defects found in a single batch. Instances where fabric fails quality assessments result in its classification as waste or discarded material. Within this sector, a significant challenge lies in the wastage of defective fabric during the semi-automated inspection process, primarily due to the employment of unreliable and unskilled workers [13]. This practice leads to the disposal of 15–20% of cotton fabric, adversely impacting the overall profitability of companies. An analysis of the literature, as well as investigations at the JCT mills, reveals a higher incidence of defects and need for repairs in cotton fabric compared to taffeta fabric [10,14,15,16,17]. Furthermore, the quality of fabric directly influences demand trends. Previous studies have often assumed fixed demand, which may not reflect the actual dynamics of the market. To address this, a more practical approach involving flexible demand patterns and improved quality control measures is necessary to enhance profitability within the TC industry [18,19,20].
The following research questions below may arise according to the nature of the problem:
Q1:
Are conventional manual fabric inspection machines suitable for the worldwide textile manufacturing industry in the current scenario?
Ans:
The textile manufacturing industry uses human-driven, semi-automatic machines for fabric inspection to identify and mark defects. This classical technique has many drawbacks, such as unreliable results because of poor training and coaching, inappropriate tools, fatigue, and many more. This study aims to reduce these drawbacks by implementing new innovative technologies for smart manufacturing systems.
Q2:
Is it profitable to install smart fabric inspection technology in mending sections in the textile manufacturing industry?
Ans:
Only human-based semi-automatic fabric inspection machines can identify significant defects due to factors like fatigue, lack of training, etc. Adopting smart machines may contribute to a significant reduction in defects, which can help achieve the profitability targets for the industry.
Q3:
How would adopting an automation policy be beneficial for cotton TC mills?
Ans:
Currently, cotton TC mills use fully human-based, semi-automated inspection methods. Our study suggests incorporating smart manufacturing technology, like installing a fully AI-based smart inspection machine. This strategy would initiate industry automation or human–machine interaction. An automation policy would be helpful for the industry to properly utilize labor and decrease the number of defects. 
TC manufacturing companies heavily rely on human-driven fabric inspection with simple machines for cotton textiles, as the occurrence of defects is higher in cotton fabric compared to man-made polyester/taffeta fabric. This results in increased labor costs, higher raw materials and shipping costs, small profit margins, and significant wastage of fabric, money, and resources for the company. The key to improving textile profits is to adopt SMT to increase production speeds and save labor costs, consequently establishing a whole mature production chain (Figure 1). There are several articles available in the literature that discuss recent developments in fabric inspection processes using image processing in the textile industry sector [10,14,21,22,23]. The novelty of this article is to analyze the profitability of the textile industry through the implementation of a fully automated AI inspection machine using an existing four-point grading system within the mending section, particularly under uncertain demand scenarios. Furthermore, according to a NASSCOM Report (2022) (https://community.nasscom.in/index.php/communities/tech-good/ai-fashion-industry-latest-introduction-fashion-technology (accessed on 10 March 2024)), “AI adoption in the Indian textile industry is still in its early stages, with only 20% of companies having implemented some form of AI solution”. Also, the McKinsey report (2023) (https://www.mckinsey.com/industries/retail/our-insights/how-indias-ascent-could-change-the-fashion-industry (accessed on 10 March 2024)) says “While India has a large textile industry, its adoption of advanced technologies like AI for automation remains lower compared to other major textile producers”. Thus, it is evident that fully automated AI inspection for quality control is rarely used in TC industry sectors. We consider the example of the JCT Textile Mill in Punjab, India. Essentially, the implementation of a fully automatic camera visual fabric inspection process, using Models YL-01 and YL-2021AI, is proposed for installation in the cotton fabric manufacturing plant. This proposal would shift a significant amount of labor to the taffeta plant (Figure 1). This human–machine interaction strategy would replace the fully manual inspection policy with an automation policy. This study aims to identify the benefits of installing smart automated inspection machines and adopting industrial automation in the textile manufacturing sector. Moreover, profitability is analyzed under uncertain demand scenarios when significant demand data are unavailable. We consider both triangular and trapezoidal demand patterns and their effects on total supply chain profit. In this study, we propose an algorithm (KDPMG) aimed at achieving the best possible outcome for the unified profit function. The validity of the obtained profitability is assessed through comparison with results generated by the genetic algorithm (GA).
This manuscript presents an improved two-echelon supply chain model with two distinct demand patterns. The remaining sections of this manuscript are meticulously structured to provide a comprehensive overview of this research. Section 2 provides a detailed overview of the related literature. A description of the research method, problem statement, related notations, and presuppositions are presented in Section 3. After that, Section 4 explains the mathematical formulation and its solution methodology. Section 5 elaborates on the solution algorithms for the optimization techniques: the KDPMG algorithm and the GA. A case study of a textile mill, JCT Ltd., is described in Section 6 to show the validity of this research. Section 7 presents the numerical simulations, a comparison of the two optimization algorithms, a discussion of the results with graphical representations, and a sensitivity analysis. The managerial insights are presented in Section 8 and the conclusions and future directions are presented in Section 9.

2. Related Works

This section provides a discussion of the literature related to the world’s textile industries, automation policies, fabric inspection procedures, and demand uncertainties as four aspects of this novel SCM network for the TC industry.

2.1. Textile Industries across the Globe

The global textile industry includes around 150 countries that provide fabric-based products globally. The textile industry plays a prominent role in the employment and financial growth of a country. The economic state of a country heavily relies on this sector, which accounts for 27% of foreign exchange earnings, 14% of industrial production, 3% of the country’s GDP, and employs 21% of the workforce (IBEF, 2021) (https://www.ibef.org/research/case-study/growth-and-expansion-of-india-s-edtech-industry (accessed on 12 March 2024)). The prime focus of textile companies is how to maintain their position in these voracious markets, both internationally and domestically [24]. Over the past decade, this sector has flourished financially and socially, despite facing a highly competitive market. In contrast, the COVID-19 pandemic has had a significant impact on the overall growth of this sector, bringing the TC industries into a credit squeeze and resulting in considerable problems, such as setbacks in progress, difficulties in international trading, idleness, and shortages. The estimates for export, trading, and import range from 5.5 to 20%, 13.7 to 20%, and 17.3 to 25%, respectively [25]. These obstacles and estimations significantly affect the economic state of the supply chain networks of TC companies [26]. In addition to this, India holds a preeminent position in the global supply of cotton fiber and fabric [27]. The Indian TC sector is ranked sixth globally and has all the manufacturing capabilities to handle all phases of production from the spinning of cotton yarn to finished apparel. India is the second-largest producer of cotton yarn and fabric, with a value of INR 10,850 crore in this sector (IWW report, 2021) (https://reports.fashionforgood.com/report/sorting-for-circularity-india-wealth-in-waste/chapterdetail?reportid=813&chapter=2 (accessed on 14 March 2024)).
The Industry 4.0 approach has had a great impact on manufacturing activities, fabric inspection, and managerial decisions in TC industries [1]. Sharma and Singh demonstrated the role of the LSS 4.0 strategy (a fusion of Industry 4.0 and Lean Six Sigma) in the Indian fabric sector for achieving high-quality results [28]. Rathore proposed the hybridization of sustainable practices and applications of Industry 4.0 for the textile sector, aiming to improve its sustainability records worldwide [12]. Shaneeb and Sumathy used the value-added intellectual capital coefficient (VAICTM) model to examine the profitability and productivity of the top 81 textile companies in India [29]. However, Darji and Dhaiya scrutinized the impact of inefficient modern technology on the financial status of textile companies in Haryana. They suggested that private companies need more upgrading in the production process by adopting innovative modern technology and increasing capital investment than public companies [30].

2.2. Automation Policies in Fabric Inspection Processes

The fabric inspection process helps evaluate the quality of the fabric in terms of color, weight, printing, measurements, and density (https://www.eurofins.com/assurance/consumer-products/resources/articles/7-things-you-need-to-know-about-fabric-inspection/ (accessed on 14 March 2024)). According to reports, there are two methods used to inspect a fabric: manual and automatic visual inspection. In the manual method, humans inspect fabric manually on a wooden table with two lamps. This classical technique has many drawbacks, such as unreliable results because of poor training and coaching, inappropriate tools, fatigue, and more [1,9]. Human vision can only detect 70% of defects present in the material. Nonetheless, most TC companies use this method to ensure a defined standard of processed and unprocessed fabric to maintain their reputation and satisfy their customers [7]. Rather than trusting the classical technique, a company should consider switching to an automatic visual inspection method. This innovative technique can enhance the productivity and profitability of cotton TC mills by reducing the number of defects in one production cycle [15]. Several researchers have implemented this technique using different criteria such as development, surface, print, and color, which enables the company to ensure quality control, recognize any imperfections, and meet the required product standards [31].
Many researchers have suggested that by combining convolutional neural networks (CNNs) and computerized visual inspection techniques, one can accurately identify and locate distinct types of fabric defects, such as solid wovens, holes, knots, slubs, stains, and more. Several methods, including detection, hierarchical, and classification approaches, have been employed, achieving accuracy rates of 95%, 88%, and 97%, respectively, in defect detection. Thakur et al. utilized the YOLOv3 architecture, whereas Lu et al. used a CNN for fabric defect detection [10,21]. In contrast, Dlamini et al. employed YOLOv4 for the same task, yielding an accuracy rate of 95.3 percent [14]. Moreover, Talu et al. tested the CNN model using a defective patch capture (DPC) algorithm during an experiment on a loom. The test was able to attain 100% detection accuracy [22]. Kahraman et al. suggested the utilization of capsule networks with TILDA datasets instead of CNNs for defect detection, achieving a success rate of 98.7% across diverse situations [23]. Pourkaramdel et al. introduced a rotation-invariant method to detect flaws in fabric items. The method showed the ability to identify flaws with a 97.66% success rate [13]. Furthermore, Fouda and Yasser proposed an algorithm to find defects using the imaging technique. This algorithm reduced the defect rate by 97.5% [16]. Rasheed et al. introduced histogram, morphology, learning, segmentation, texture, and frequency domain methods to detect the flaws in fabric [32]. Halil et al. employed the ResNet-50 architecture to effectively control and categorize fabric defects [17].

2.3. Demand Variability in Manufacturing Industries

A supply chain framework is considered to be the most effective remedy for the manufacturing sector when dealing with uncertain scenarios related to demand, cost, and the production process, especially in times of economic crisis [33]. Fathollahi et al. proposed a multi-echelon closed-loop supply chain (CLSC) network for the use of multiple types of products in the tire industry. The proposed design is multi-faceted, encompassing dual channels, multi-products, multi-periods, and multi-echelons. A fuzzy technique named the Jimenez method is used to handle vague situations inherent in the model [20]. Lagzaie and Hamzehee used a combination of the TH and Jimenez methods to manage uncertainties in the green CLSC model [34]. Xu et al. addressed the issues of uncertain demand and carbon tax in the two-echelon CLSC network. Although the solution procedure has four stages, it proved to be the best solution for an advanced sustainable SCM network [19]. Similarly, Abdi et al. used the same framework but extended it to include multiple products, periods, and echelons, solving it using a meta-heuristic method [35]. Komatina et al. considered the SCM framework of a firm named Serbian Automotive. They used a type-2 fuzzy set to address the issue of cost imprecision [36].

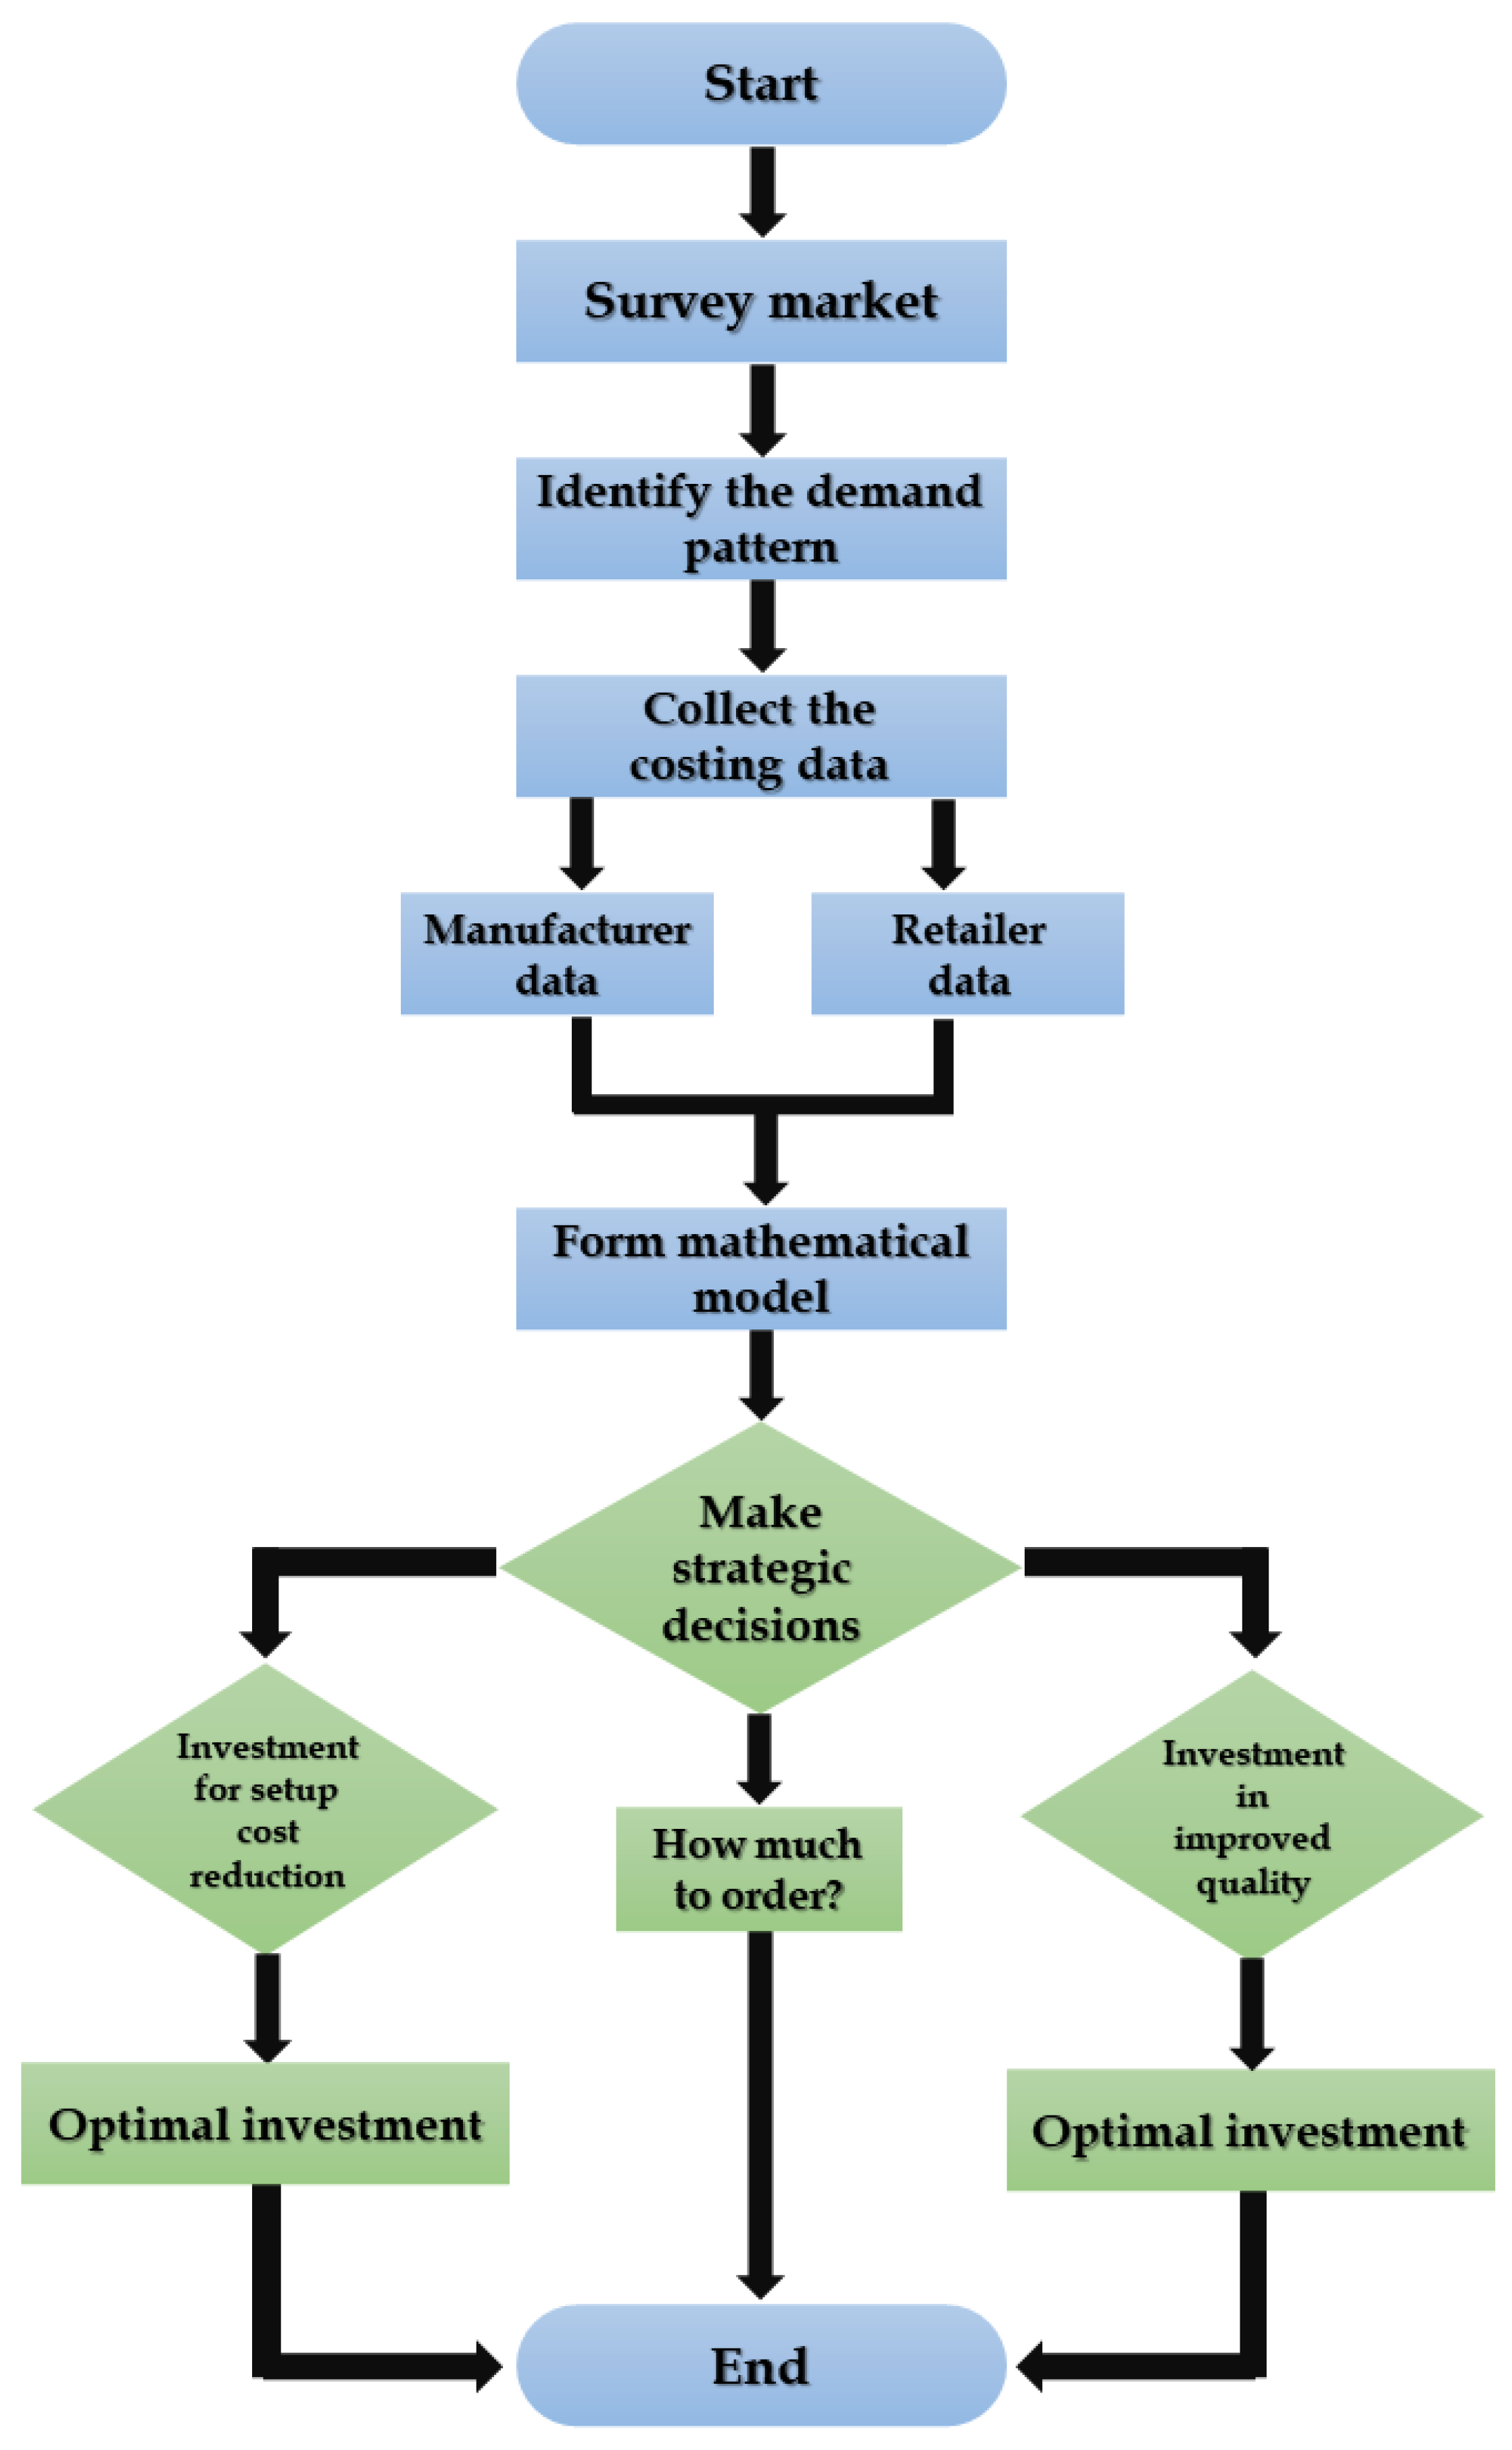
2.4. Research Methodology

The flowchart in Figure 2 depicts a decision-making procedure for a business functioning within a seemingly exigent market. The principal objective lies in the formulation of a mathematical model that serves to optimize the operational facets, investment decisions, and overall strategic outlook of the business entity. The steps of the methodology are outlined below.
  • Market survey: The initial step involves gathering market intelligence. This includes understanding customer needs, preferences, and buying patterns.
  • Identify the demand pattern: Market research data are analyzed to discern demand trends. This might include identifying seasonality in demand, market growth or decline, and other patterns impacting demand.
  • Collect the costing data from the retailer and manufacturer: To obtain a complete financial picture, costs are collected from both the retailer (who sells to end customers) and the manufacturer (who produces the goods). This includes production, materials, labor, and overhead expenses.
  • Develop a mathematical model with a suitable demand pattern: With an understanding of demand and costs, a mathematical model is developed to forecast future behavior.
  • Make strategic decisions: This is the core decision-making step based on the model’s insights. Key questions addressed include the following:
    • How much to order?
      The model helps determine the best quantity for production or purchase to balance meeting demand and avoiding excess inventory.
    • What is the optimal investment for quality improvement?
      Deciding the investment amount in product/service quality is considered; the model likely links this to projected sales and customer satisfaction.
    • What is the optimal investment for setup cost reduction?
      The model assists in figuring out if investments to lower setup costs (like equipment changeovers) for production runs would be a worthwhile financial decision.

3. Problem Description and Assumptions

3.1. Problem Description

The problem can be described as follows:
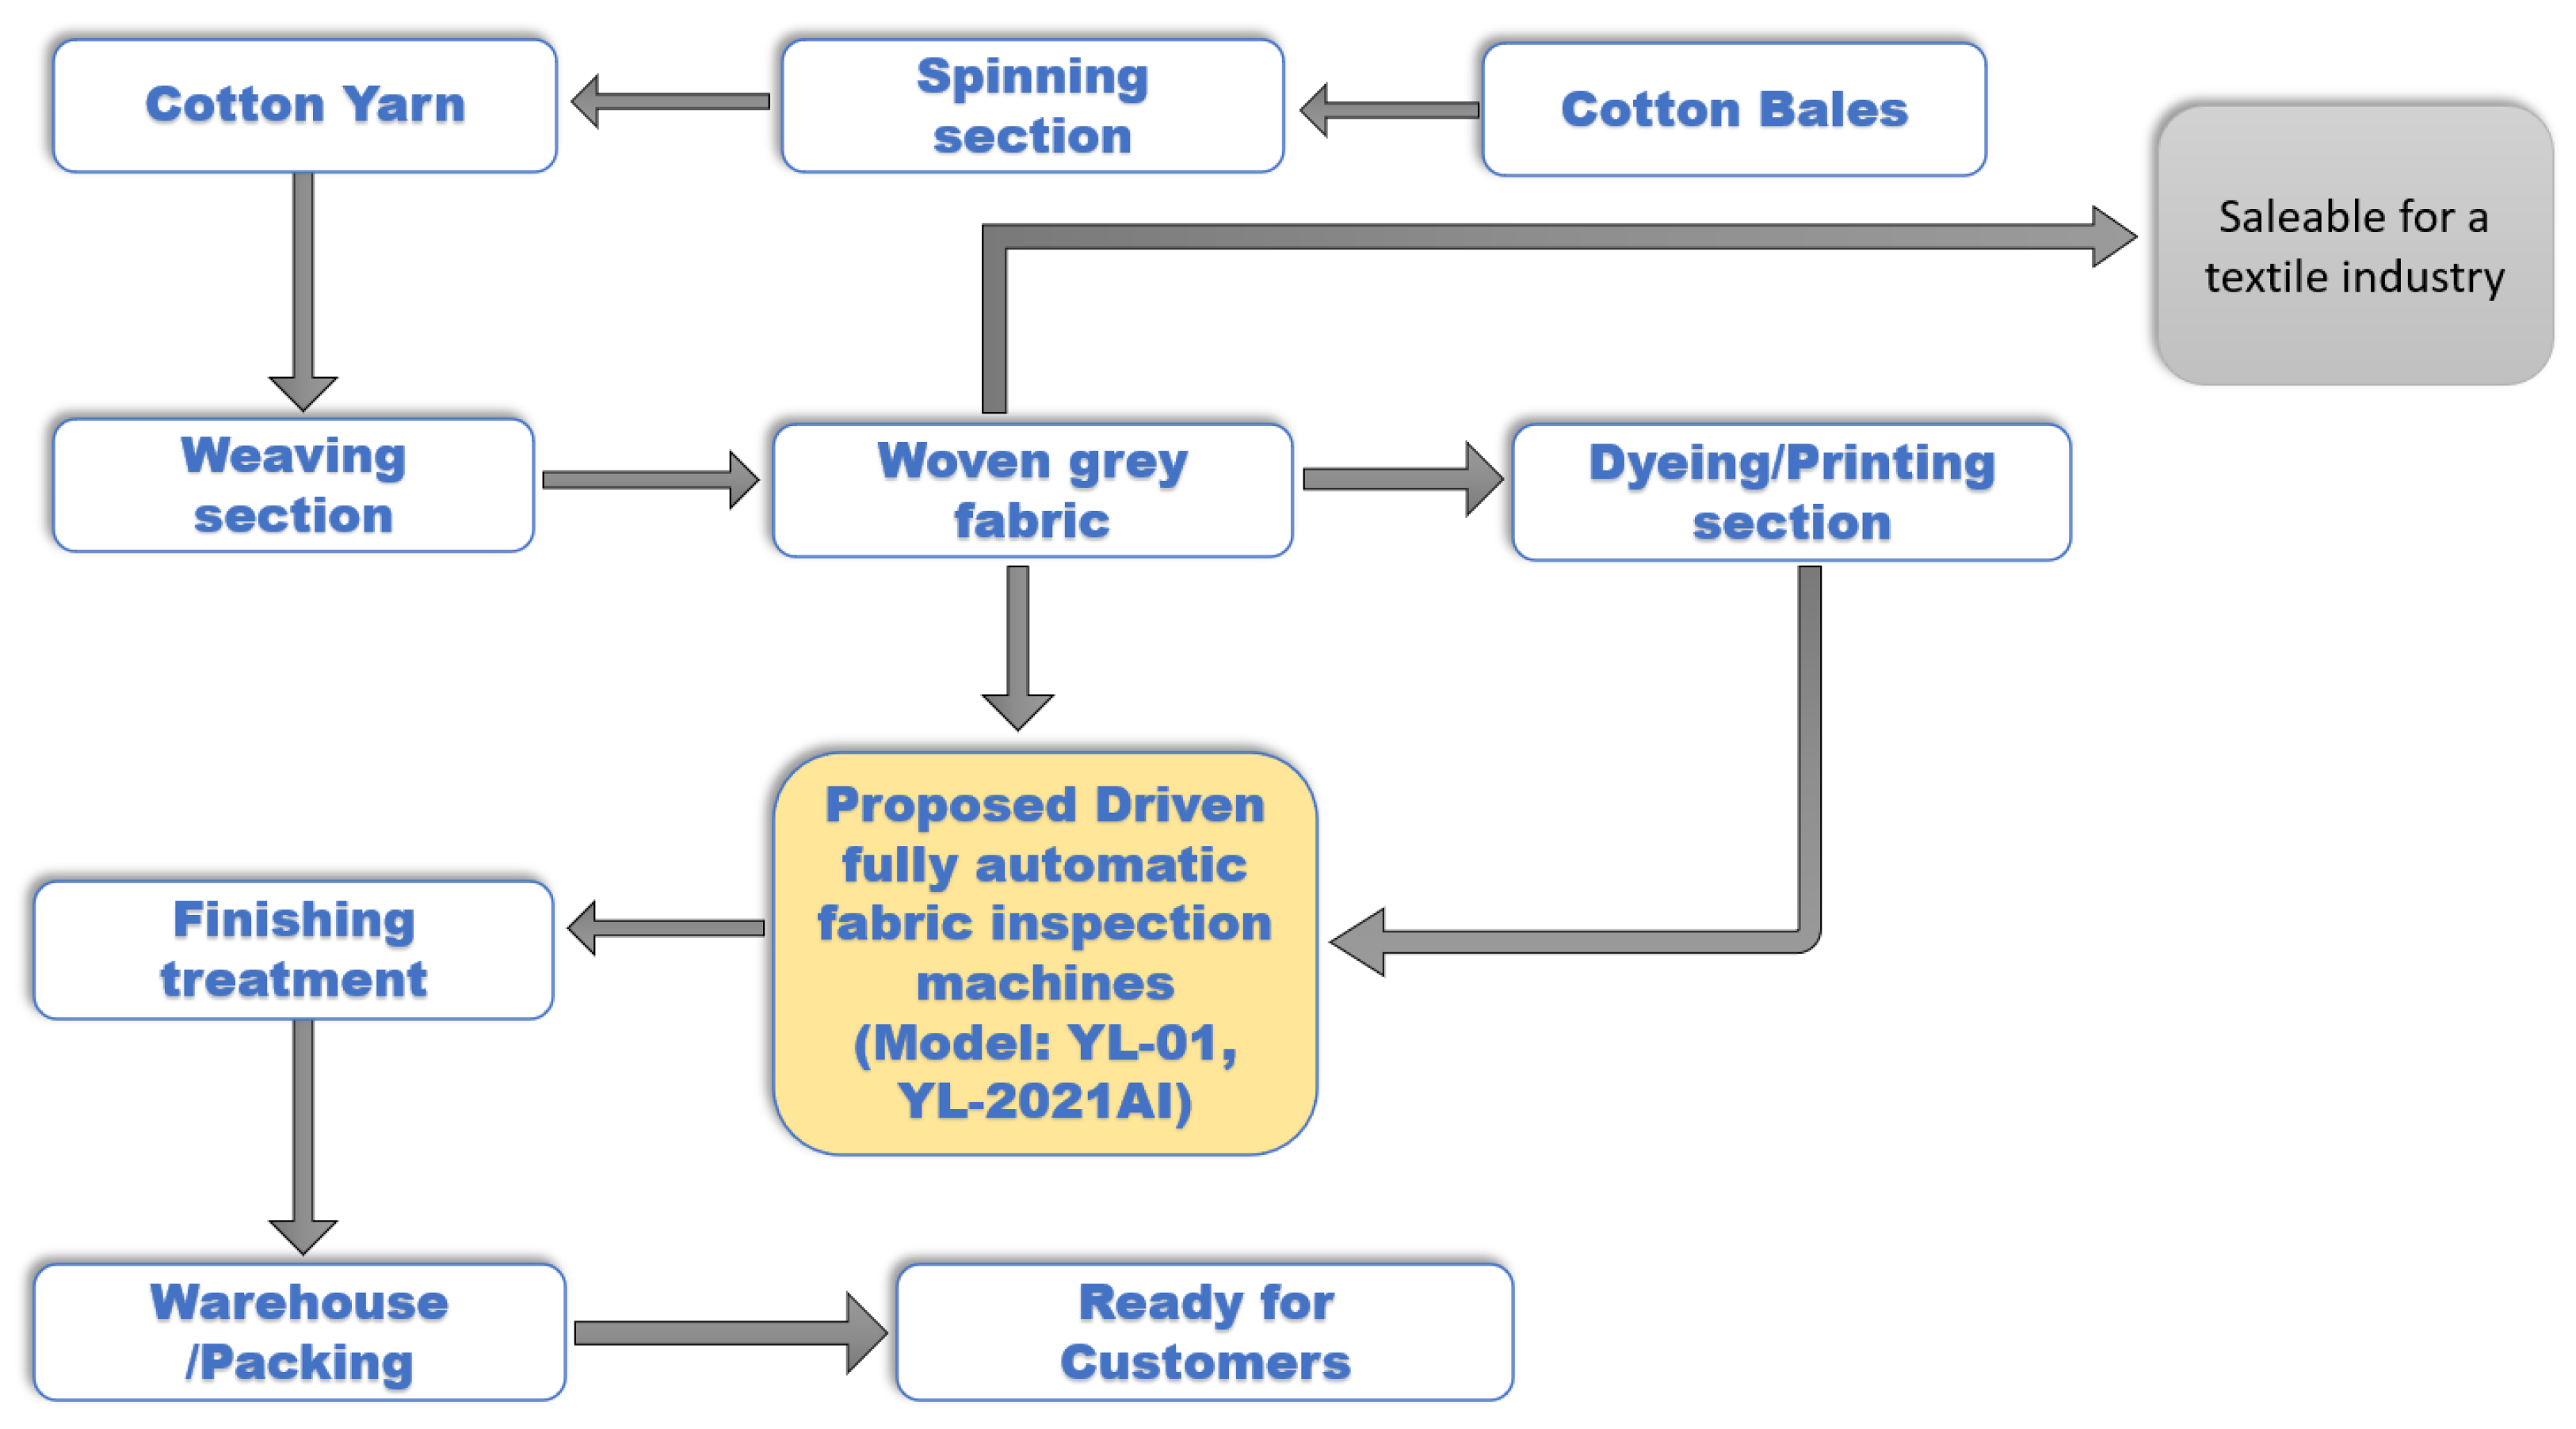
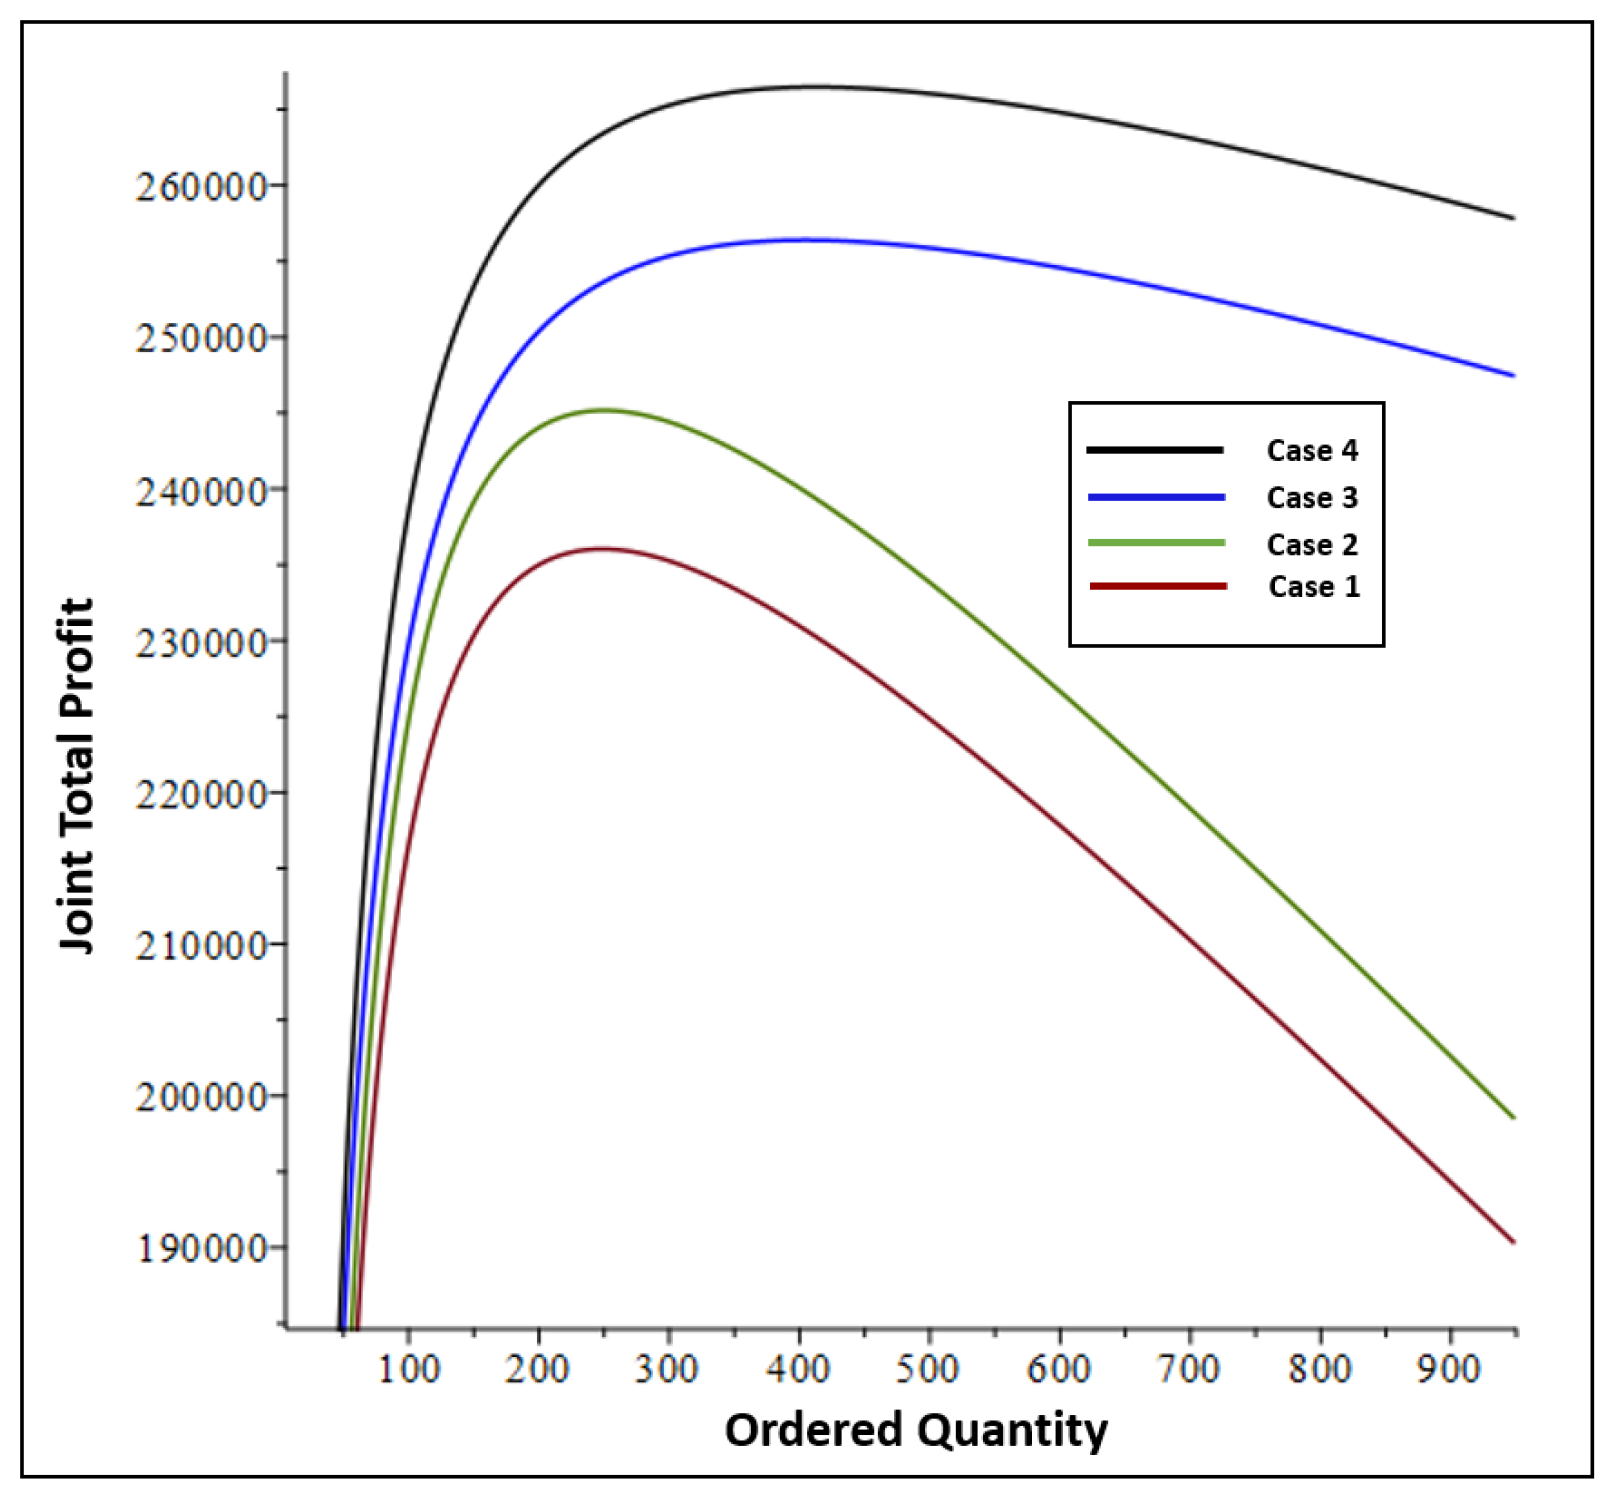
  • The proposed model addresses problems related to fabric defect detection in the cotton mending section of TC mills. In addition, this study examines the impact of adopting SMT in that section. To assess the profitability of the supply chain and the impact of SMT on it, we develop four mathematical models, as shown in Table 1.
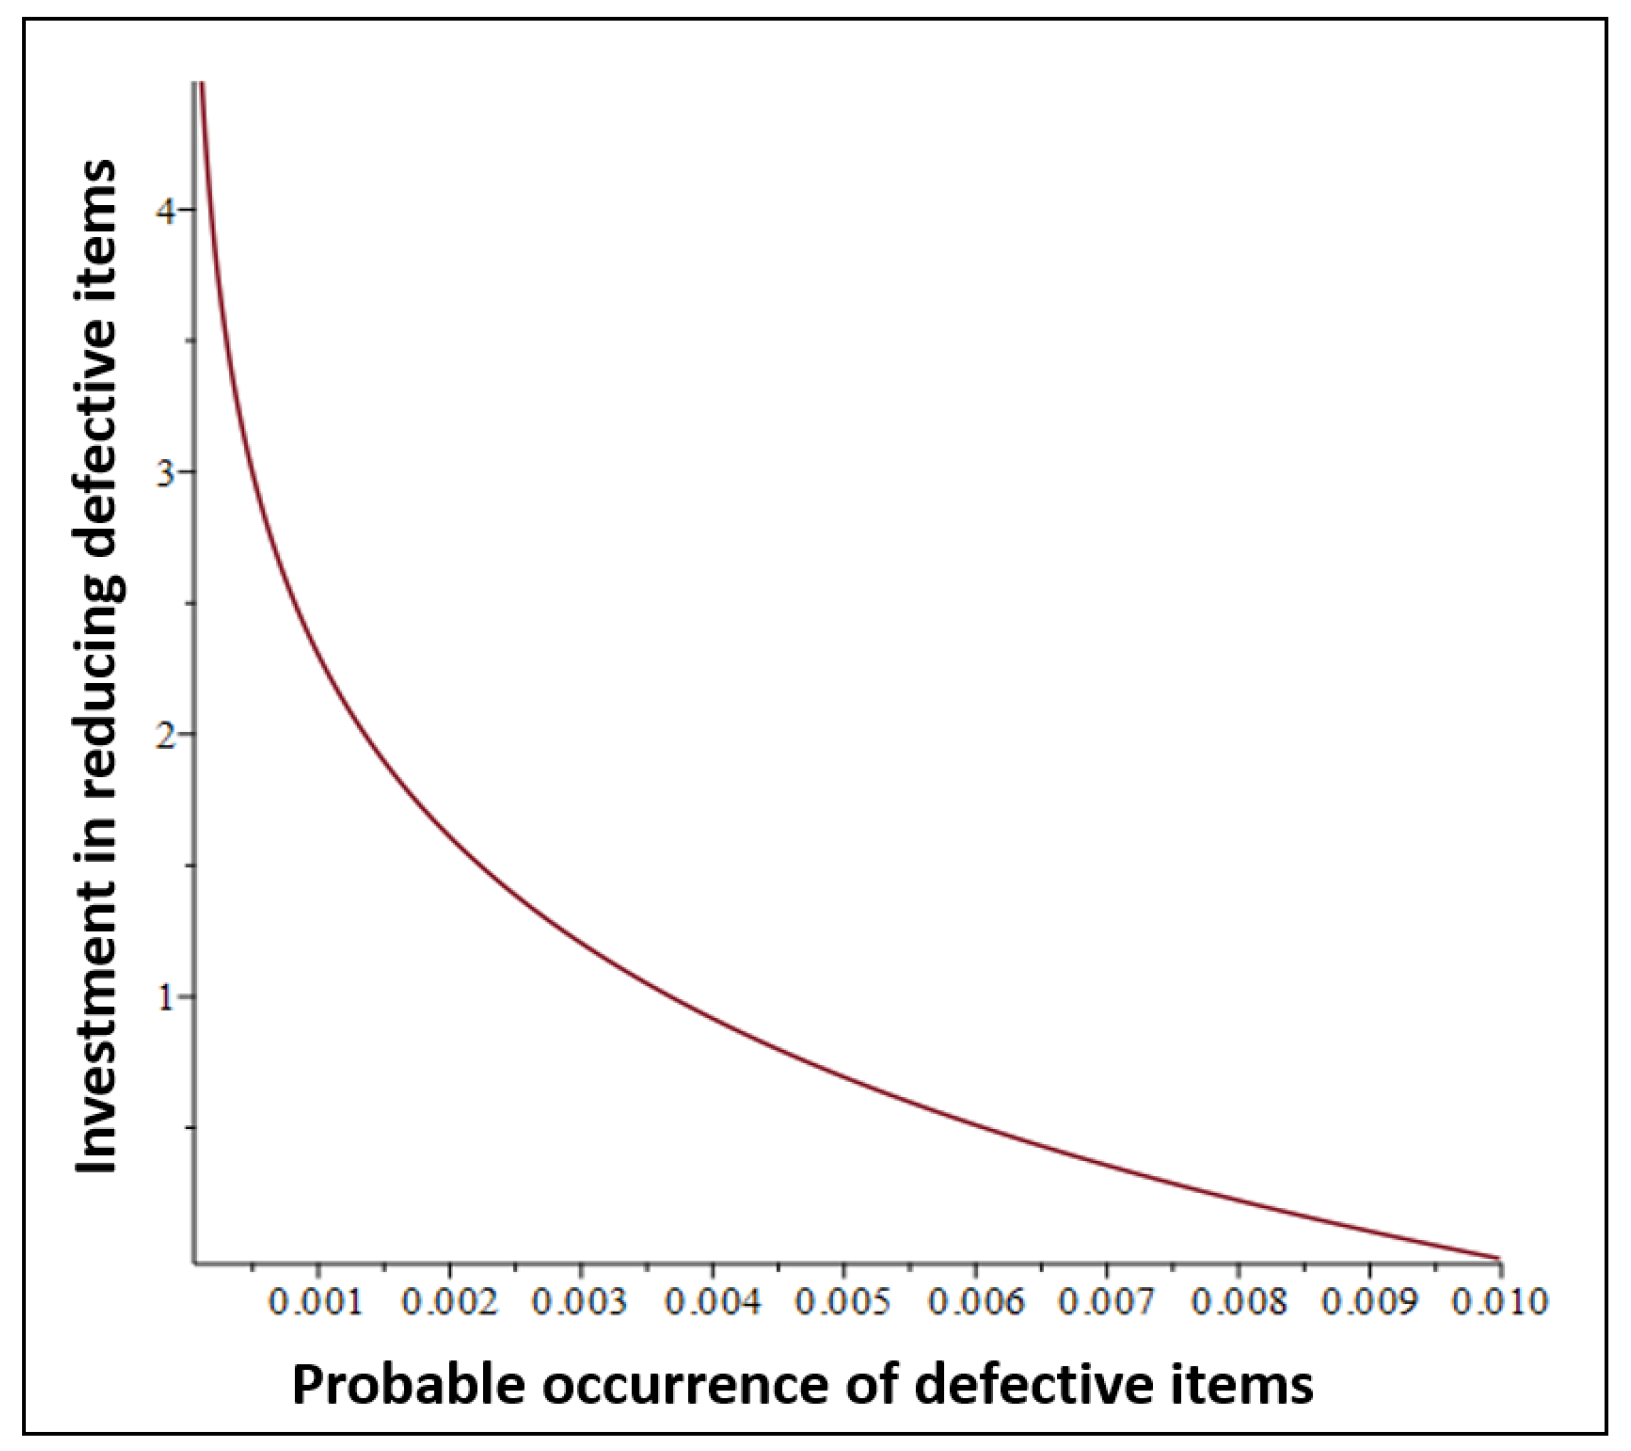
  • Two decision variables—the order quantity ( Q ) and the occurrence of defective fabric ( ψ ) —are considered in this study. Based on these two variables, we aim to maximize profit. In an integrated inventory model, the order quantity is the main strategic decision made by the decision maker. The optimal order quantity reflects the decision about how much to order to satisfy customer demand in an inventory cycle. The decision variable ψ is used to improve product quality by handling the risk of the “out-of-control” probability of defective items.
  • A capital investment is made to reduce the “out-of-control” probability of defective items in the manufacturing process. This investment upgrades the classical mending section via the installation of fully automatic and smart fabric inspection machines in the cotton section to improve the quality of the fabric.
  • To address uncertain conditions in the supply chain network related to demand, two separate fuzzy numbers are used, namely the TFN and TrFN.

3.2. Assumptions

The following prerequisites are present for the mathematical formulation:
  • A TE centralized SCM framework is established for the textile sector, featuring manufacturers and purchasers.
  • The cotton manufacturing plant uses a make-to-order (MTO) policy for producing goods.
  • AI-driven smart manufacturing machines are exclusively available to the cotton mill and are positioned in the fabric inspection area.
  • The taffeta segment employs the human–machine inspection method.
  • After the SMT-based inspection machine’s installation, fewer workers were responsible for the cotton inspection area compared to the taffeta area.
  • Neither the manufacturer nor the purchaser anticipates any shortages.

4. Theoretical Formulation of the Proposed Model

This section explains the formulation of the unified profit function, which comprises various costs in the core SC system of the textile manufacturer and the retailer. The quality of the cotton fabric is inversely proportional to the probability of an out-of-control situation ψ in the manufacturing process, while improved quality increases the cotton TC mill’s contribution to the market economy. Excessive production causes the manufacturing process to shift from an “in-control” to an “out-of-control” state, resulting in a high occurrence of defective products and a remarkable impact on both product quality and the system. Therefore, the mill needs to concentrate on the manufacturing procedure to effectively manage the production of defective products and the system’s performance [3,18]. Hence, the focus of this study is on reducing the possibility of the system becoming out of control throughout the manufacturing process, as quality improvement also influences demand. Additionally, this model contains inherent uncertain demand. So, the demand function is represented in TFN and TrFN forms, denoted by A = ( a 1 , a 2 , a 3 ) and B = ( b 1 , b 2 , b 3 , b 4 ) , respectively (see Appendix A.1 and Appendix A.2). The basic model is a make-to-order inventory model inspired by [7,37]. To produce the ordered quantity Q in one production cycle, the pace of manufacturing those fabric items must be greater than the demand, that is, P > D .

4.1. The Cost Associated with the Retailer of the Fabric Item

The following profit function delineates the cost associated with the retailer purchasing fabric products. Hence, the total profit gained by the retailer for the fabric items described by Equation (1) is represented as follows:
P r = Revenue of retailer Ordering cost of retailer Holding cost of retailer
P r ( Q ) = R D O D Q H r P r Q 2

4.2. The Cost Associated with the Cotton TC Mill to Manufacture Fabric Items

The following profit function delineates the cost associated with the cotton TC mill to manufacture cotton textile items. Hence, the total profit gained by the cotton TC mill to manufacture the fabric items described by Equation (2) is represented as follows:
P m = Revenue of cotton TC mill Setup cost of cotton TC mill Holding cost of cotton TC mill Rework cost in mending section Labour cost in mending section
P m ( Q ) = P r D D S Q 1 D P H m P m Q 2 w D Q ψ 0 2 n 1 L c D Q

4.3. Core Unified Total Profit of SC System of Fabric Manufacturing in the Cotton TC Mill

The unified total profit achieved by both the cotton TC mill and the retailer for the TE centralized SC network is described by Equation (3) and is represented as follows:
J T P = Total profit of cotton TC mill ( P m ) + Total profit of retailer ( P r )
J T P ( Q ) = P r D D S Q 1 D P H m P m Q 2 w D Q ψ 0 2 n 1 L c D Q + R D O D Q H r P r Q 2

4.4. Additional Expenditure Required to Improve the Core SC System of the Cotton TC Mill

The capital investment and other additional charges required to upgrade the core SC system of the cotton TC mill are represented by Equation (4). Capital is invested in the installation of smart fabric inspection technology in the mending section of the cotton plant to improve the quality control segment. This investment also entails a slight change in the rework and labor costs of the mending section of the cotton TC mill to inspect the defect in fabric items. The required additional charges are outlined below:
A C = Rework cost with smart technology + Labour cost with smart technology + Capital investment to enhance the quality of fabric with smart inspection machines
A C = w D Q ψ 2 + n 2 L c D Q + f β l n ψ 0 ψ
with respect to two constraints for  n 1 > n 2 and 0 < ψ ψ 0 , where f β l n ψ 0 ψ is a logarithmic capital investment in the installation of the fully automatic camera visual fabric inspection process for Models YL-01 and YL-2021AI in the mending section. Essentially, in this article, the product quality is represented by the “out-of-control” probability ( ψ ), which is a decision variable controlled and reduced by a capital investment. When the system goes from an “in-control” to an “out-of-control” state, it produces defective products, thus reducing product quality. Hence, there is an inversely proportional relation between the quality and “out-of-control” probability. Here, f represents the annual fractional cost of the capital investment to reduce the number of defective items occurring in the mending section, and  β is the reduction in the probability of defective items per dollar with an increase in capital investment cost. Additionally, f is given by 1 ξ ; here, ξ indicates the decrease in value of ψ expressed in dollars when the capital investment increases.

4.5. SMT-Based Modern Unified Total Profit Function of the Cotton TC Mill and the Retailer

The modern unified total profit achieved by both the cotton TC mill and the retailer after the installation of smart technology to manufacture fabric items for the unified TE centralized SC network is described by Equation (5) and is represented as follows:
J T P S M T = Revenue of the cotton TC mill Setup cost of cotton TC mill Holding cost of cotton TC mill Additional expenditure required to improve the core SC system of the cotton TC mill + Total profit of retailer   ( P r )
J T P S M T ( Q , ψ ) = P r D D S Q 1 D P H m P m Q 2 w D Q ψ 2 n 2 L c D Q f β l n ψ 0 ψ + R D O D Q H r P r Q 2
subject to constraints for  n 1 > n 2 and 0 < ψ ψ 0 .

4.6. Use of Fuzzy Technique in a Unified Crisp Model

This specific model consists of an inherent uncertain annual demand for a particular fabric item within the complex supply chain network of the cotton TC mill. Within this particular segment, the fuzzification process is executed, which essentially involves the transformation of precise inputs into a language that the system can effectively comprehend, specifically in terms of degrees of membership within fuzzy sets. Consequently, the demand function is conceptualized in the form of two distinct fuzzy numbers—the TFN and TrFN (refer to Appendix A.1 and Appendix A.2)—in order to effectively address uncertain demand owing to the adaptable membership functions that they offer. According to insights gleaned from prior literature, these numerical entities are commonly utilized to navigate through the uncertainties associated with the demand function. In this context, the demand function is fuzzified; the symbol D ˜ is utilized to represent the uncertain demand function. Hence, the integrated model is mathematically articulated through Equation (6), as detailed below:
J T P S M T ( Q , ψ ) = P r D ˜ D ˜ S Q 1 D ˜ P H m P m Q 2 w D ˜ Q ψ 2 n 2 L c D ˜ Q f β l n ψ 0 ψ + R D ˜ O D ˜ Q H r P r Q 2
subject to constraints for  n 1 > n 2 and 0 < ψ ψ 0 .

4.7. Defuzzification of Unified Fuzzy Model

In the pursuit of maximizing the profit functions and identifying the optimal values for the decision variables Q and ψ , the defuzzification process is initiated to handle the fuzzy demand function in its two distinctive forms, the TFN and TrFN (refer to Appendix A.1 and Appendix A.2). This procedural step concerns the transformation of the fuzzy demand function into a definitive output that can be seamlessly utilized in practical contexts. It effectively deduces the most probable value based on the fuzzy output. Furthermore, the academic literature also encompasses various methodologies for transforming fuzzy numbers into crisp values. The methodology adopted within this research is commonly known as the signed-distance method, also referred to as the SDM technique (refer to Appendix A.3 for further details). In this context, A 1 signifies the crisp value associated with the triangular fuzzy demand function, whereas B 1 represents the crisp value linked with the trapezoidal fuzzy demand function. The defuzzification process essentially converts the outcome of the fuzzy reasoning back into a crisp output that can be readily utilized in practical scenarios, ultimately deducing the most plausible value based on the fuzzy outcome.

4.8. Crispification of Case 1

In Case 1, the core unified total profit (Equation (3)) is considered, in which the demand function is considered in triangular fuzzy form. The function is further crispified using the SDM technique (see Appendix A.3). The crisp model is described by Equation (7) below:
J T P 1 ( Q ) = P r A 1 A 1 S Q 1 A 1 P H m P m Q 2 w A 1 Q ψ 0 2 n 1 L c A 1 Q + R A 1 O A 1 Q H r P r Q 2

4.9. Crispification of Case 2

In Case 2, the core unified total profit (Equation (3)) is considered, in which the demand function is considered in trapezoidal fuzzy form. The function is further crispified using the SDM technique (see Appendix A.3). The crisp model is described by Equation (8) below:
J T P 2 ( Q ) = P r B 1 B 1 S Q 1 B 1 P H m P m Q 2 w B 1 Q ψ 0 2 n 1 L c B 1 Q + R B 1 O B 1 Q H r P r Q 2

4.10. Crispification of Case 3

In Case 3, the modern unified total profit (Equation (5)) is considered, in which the demand function is considered in triangular fuzzy form. The function is further crispified using the SDM technique (see Appendix A.3). The crisp model is described by Equation (9) below:
J T P 3 S M T ( Q , ψ ) = P r A 1 A 1 S Q 1 A 1 P H m P m Q 2 w A 1 Q ψ 2 n 2 L c A 1 Q f β l n ψ 0 ψ + R A 1 O A 1 Q H r P r Q 2
subject to constraints for  n 1 > n 2 and 0 < ψ ψ 0 .

4.11. Crispification of Case 4

In Case 4, the modern unified total profit (Equation (5)) is considered, in which the demand function is considered in trapezoidal fuzzy form. The function is further crispified using the SDM technique (see Appendix A.3). The crisp model is described by Equation (10) below:
J T P 4 S M T ( Q , ψ ) = P r B 1 B 1 S Q 1 B 1 P H m P m Q 2 w B 1 Q ψ 2 n 2 L c B 1 Q f β l n ψ 0 ψ + R B 1 O B 1 Q H r P r Q 2
subject to constraints for  n 1 > n 2 and 0 < ψ ψ 0 .
Now, to obtain the maximum profit value of this current problem based on two decision variables, Q and ψ , the unified profit functions mentioned in Equations (7)–(10) need the calculation of partial derivatives for these two decision variables. Further, to obtain a favorable optimal value for these variables, the equations obtained from the first-order partial derivatives must be set equal to zero. Therefore, we have
Q 1 = 2 P A 1 ( S + n 1 L c + O ) ( P A 1 ) P m H m + P w A 1 ψ 0 + P H r P r 1 2
Q 2 = 2 P B 1 ( S + n 1 L c + O ) ( P B 1 ) P m H m + P w B 1 ψ 0 + P H r P r 1 2
We have assumed Q 1 and Q 2 to represent the favorable optimal values of the decision variable Q, obtained from Cases 1 and 2, respectively.
Q 3 = 2 P A 1 ( S + n 2 L c + O ) ( P A 1 ) P m H m + P w A 1 ψ + P H r P r 1 2
for n 1 > n 2 and 0 < ψ ψ 0 .
Q 4 = 2 P B 1 ( S + n 2 L c + O ) ( P B 1 ) P m H m + P w B 1 ψ + P H r P r 1 2
for n 1 > n 2 and 0 < ψ ψ 0 .
ψ 1 = 2 f β w A 1 Q
ψ 2 = 2 f β w B 1 Q
We have assumed Q 3 , ψ 1 , and Q 4 , ψ 2 to represent the favorable optimal values of the decision variables Q and ψ , obtained from Cases 3 and 4, respectively. Now, to make a precise connection between these decision variables and the unified profit functions, the Hessian matrix needs to be calculated. The negative definiteness of this matrix defines the concavity of these functions, which shows that the SC network of the cotton TC mill generates maximum profit by manufacturing fabric items. The validity of the desired results of the Hessian matrix is verified in Appendix C.1, Appendix C.2, Appendix C.3 and Appendix C.4 for four different cases: Case 1, Case 2, Case 3, and Case 4.

5. Solution Approaches

This section discusses the two different solution algorithms—the KDPMG algorithm and the genetic algorithm (GA)—employed to obtain the optimal numerical solutions to the nonlinear TE centralized SC problems mentioned in Equations (7)–(10). We compare our proposed algorithm (KDPMG) with the GA. The reason for choosing these algorithms is to maximize the unified total profit of the problems. A numerical solution to acquire the optimal values of the decision variables is necessary to prove the validation of the model. The different steps of these algorithms are described below.

5.1. Proposed KDPMG Algorithm

The proposed solution algorithm (KDPMG) uses an iterative technique to find the optimal solutions to the problems. This algorithm uses the gradient-supplied values of the decision variables. Cases 3 and 4 have two decision variables; thus, differentiation is employed with respect to both variables, and the numerical iteration method is utilized to generate iterative solutions. The algorithm only stops when it satisfies the provided tolerance criteria. This algorithm is implemented in MATLAB R2016a. The steps outlined below define the proposed algorithm (Algorithm 1).
Algorithm 1: Solution algorithm to obtain optimal results for Cases 1, 2, 3, and 4.
Step 1: Set all parameter values, and put i = 1 .
Step 2: Obtain Q 1 ( i ) from (11) and Q 2 ( i ) from (12).
Step 2: Obtain Q 3 ( i ) from (13) and Q 4 ( i ) from (14).
Step 3: Obtain ψ 1 ( i ) from (15) and ψ 2 ( i ) from (16).
Step 4: Set i = i + 1 and repeat Step 2 until | Q 1 ( i ) Q 1 ( i 1 ) | > 0.00001
Step 5: Set i = i + 1 and repeat Step 3 until | Q 2 ( i ) Q 2 ( i 1 ) | > 0.00001 ,
   and  | ψ 1 ( i ) ψ 1 ( i 1 ) | > 0.00001 .
Step 6: Obtain J T P 1 from (7) and J T P 2 from (8).
Step 7: Obtain J T P 3 S M T from (9) and J T P 4 S M T from (10).

5.2. Genetic Algorithm

Genetic algorithms rank high among evolutionary algorithms due to the extensive range of applications they encompass [38]. A significant number of renowned optimization problems have been subjected to experimentation with genetic algorithms. Furthermore, genetic algorithms operate on a population level, and a multitude of contemporary evolutionary algorithms draw direct or indirect inspiration from genetic algorithms or exhibit notable resemblances. The core of the genetic algorithm (GA) involves transforming an optimization function into arrays of bits or character strings for the purpose of representing chromosomes. These strings are then manipulated using genetic operators, and selection is based on their fitness level. The objective is to identify a satisfactory (potentially optimal) solution to the given problem. Algorithm 2 generally uses the operations described below.
  • Initialization: The commencement of the process is marked by the establishment of an initial population comprising individuals that represent potential solutions to the problem under optimization.
  • Selection: This phase involves identifying individuals from the existing population based on their fitness levels for the purpose of reproduction. Fitness reflects the efficacy of an individual in problem-solving and is commonly assessed using a fitness or objective function.
  • Crossover: The crossover stage entails the exchange of genetic material between selected pairs of individuals to produce novel offspring, simulating the natural processes of reproduction and genetic recombination.
  • Mutation: Random alterations are introduced to the genetic information of offspring to preserve genetic variability within the population and prevent premature convergence of the algorithm toward sub-optimal solutions.
  • Evaluation: Following crossover and mutation, the fitness of the newly created offspring is evaluated using the fitness function.
  • Replacement: Finally, a fresh cohort of individuals is formed by selecting the most robust individuals from the current population along with the newly generated offspring. This strategy ensures the progression of the population toward superior solutions across successive generations.
Algorithm 2: Solution algorithm to obtain optimal results for Cases 1, 2, 3, and 4.
Step 1: Define the maximum generation (N) and the objective Functions (7)–(10).
Step 2: Initialize the crossover and mutation probability (denoted as P c r and P m u ).
Step 3: Repeat the following steps until t < N .
Step 4: Generate the new population with the help of crossover and mutation.
Step 4.1: Generate the new population for Q 1 and Q 2 (for Cases 1 and 2).
Step 4.2: Generate the new population for Q 3 , Q 3 , ψ 1 , and  ψ 2 (for Cases 3 and 4).
Step 5: Use crossover operation with probability P c r and mutation operation with probability P m u .
Step 6: Accept the new solutions if their fitness improves.
Step 7: Select the current best solutions for the next generation update.
Step 8: t = t + 1 .
Theorem 1.
The value of the unified total profit function for SMT is always greater than or equal to the value of the unified total profit function without SMT for all real non-negative parametric values, and 0 < ψ 0 ψ < 1 .
Proof of Theorem 1.
Refer to Appendix B. □
Lemma 1.
The unified total profit function for Case 1 always attains its global maximum at the optimal positive value of the decision variable Q, denoted as Q 1 .
Proof of Lemma 1.
Refer to Appendix C.1. □
Lemma 2.
The unified total profit function for Case 2 always attains its global maximum at the optimal positive value of the decision variable Q, denoted as Q 2 .
Proof of Lemma 2.
Refer to Appendix C.2. □
Lemma 3.
The unified total profit function for Case 3 always attains its global maximum at the optimal positive values of the decision variables Q and ψ, denoted as Q 3 and ψ 1 , under the condition
2 A 1 f β ( S + n 2 L c + O ) Q 3 ψ 2 > ( w A 1 4 ) 2
.
Proof of Lemma 3.
Refer to Appendix C.3. □
Lemma 4.
The unified total profit function for Case 4 always attains its global maximum at the optimal positive values of the decision variables Q and ψ, denoted as Q 4 and ψ 4 , under the condition
2 B 1 f β ( S + n 2 L c + O ) Q 3 ψ 2 > ( w B 1 4 ) 2
.
Proof of Lemma 4.
Refer to Appendix C.4. □

6. A Case Study of JCT Limited, Phagwara

With a total of 95,040 textile production mills, Punjab holds the top position in India for manufacturing yarn and fabric of mixed types. The huge textile sector in this state provides employment to approximately 800,000 people and, in return, produces a considerable amount, nearly 23%, of gross profit. The TC sector of this region of northern India contributes around 38% of the total export of fabric and yarn (Indiangov, 2022) (http://indianculture.gov.in/node/2761353 (accessed on 14 March 2024)). In the years 2021–2022, the state had an outward trade of nearly 920 million m2 and 315 million m2 of cotton yarn and fabric, respectively; however, 190 million m2 of mixed yarn and fabric were exported to renowned clothing manufacturers such as GAP, ZARA, H&M, Reebok, Decathlon, Puma, and more in countries such as the US, UK, Brazil, France, Germany, etc. The documented value of this export is around INR 15,500 crore. The JCT textile mill is considered one of the prominent textile mills in Punjab, mainly producing cotton, synthetic, and mixed types of fabric and yarns (InvestPunjab, 2022) (http://investpunjab.gov.in (accessed on 15 March 2024)). JCT Textile Unit has two separate fabric production plants: a cotton plant that produces cotton fabric and a taffeta plant that produces synthetic fabric. The working structures of these two plants differ. The cotton plant uses conventional techniques during the manufacturing of fabric, with higher manpower usage, whereas the taffeta plant uses semi-automatic machinery and modern techniques of production. This mill can produce around 5.5 million meters of any type of fabric at a time. With a manpower of 4700, this mill has expertise in spinning, weaving, and treating the fabric, attracting attention from all over the globe because of the premium quality of all types of fabric (JCTprofile) (https://www.jct.co.in/ (accessed on 15 March 2024)). The spinning, weaving, and testing of sample fabrics and the treatment sections of the mill are equipped with advanced technology.

Domestic System of Quality Evaluation for Fabric

Quality control of fabric is a crucial task for a textile firm, as it has a direct influence on the reputation and revenue of the mill. In the taffeta section of the JCT mill, human-based, semi-automated fabric inspection machines are used to inspect the quality of the fabric. Each machine requires one worker at a time. Taffeta fabric has fewer defects compared to cotton fabric. The section where defects in the fabric are detected to the maximum extent is known as the mending section, which uses a four-point American grading system to grade fabric (https://www.inspec-bv.com/marketing/fabric-quality-inspection-introduction-4-point-system (accessed on 15 March 2024)). The range of points from 1 to 4 varies based on the size and type of defect per 100 square yards. Premium, second, and lowest quality fabrics earn 40–50, 40–79, and 80 points, respectively, for every 100 square yards. Furthermore, the segregation of the fabric is based on the length of the roll: full, short, and local roll lengths range from 74 to 160 m, 37 to 73 m, and less than 37 m. Each of the gray and processed fabric rolls must pass through the mending section. In the cotton section, the mending section uses classing techniques to inspect the fabric rolls. A wooden table illuminated with at least two fluorescent bulbs emitting white light is placed, where two inspectors carry out the inspection process carefully and examine the fabric. The frame is placed at an angle ranging from 45 to 60 degrees at a distance of 3 feet from the naked eye. Tools such as a cutter, plucker, thread, and needle are used to eliminate defects like slubs, knots, flies, etc. A total of 30 inspection setups, with an 8-hour working period per worker, inspect approximately 5000 m of fabric in 24 h. Nonetheless, in a single lot, 15–20% of cotton-made fabric is regarded as defective. This results in the wastage of resources and time at the mill. Thus, this article suggests upgrading this section by installing smart technologies such as the fully automatic camera visual fabric inspection machines of Models YL-01 and YL-2021AI to reduce the number of defects and generate more revenue.

7. Results Analysis and Discussion

7.1. Numerical Simulations

This section presents information about the numerical experiments, data for the parametric values, and the software used to find the optimal solution to the problem. The proposed model used the make-to-order policy in the TE centralized supply chain network of the cotton TC mill for the fabrication and inspection of textile products. The numerical experiments were conducted to determine the impact of capital investment in upgrading a classical fabric inspection technique to a modern smart fabric inspection technique in the mending section of the cotton TC mill. We used MATLAB 2016a with an Intel Core i3-8145U CPU for the solution algorithm and its analysis, and MAPLE 22 software for the graphical representations of the outcomes. The parametric values of the model were obtained from the JCT mill’s contact person via phone, a questionnaire, and email. The data accuracy and reliability were verified through the JCT profile (https://www.jct.co.in/ (accessed on 15 March 2024)), reports and documents (JCT Annual Report, 2023) (https://trendlyne.com/fundamentals/documents-annual-reports/2052/JCTLTD/jct-ltd/ (accessed on 12 March 2024)), and other industrial resources (InvestPunjab, 2022) (http://investpunjab.gov.in (accessed on 14 March 2024)).

7.2. Input Parameters for Numerical Experiments

This section outlines the parameter values used for the mathematical formulation. We set a 1 = 750 units/year, a 2 = 1000 units/year, a 3 = 1250 units/year, b 1 = 750 units/year, b 2 = 1000 units/year, b 3 = 1150 units/year, b 4 = 1250 units/year, H m = USD 0.3 /unit/year, P m = USD 50/unit/year, H r = USD 0.5 /unit/year, P r = USD 90/unit/year, R = USD 190/unit/year, P = 5000 units/year, L c = 16 units/year, w = USD 12/unit/year, O = USD 1500/order, S = USD 3000/setup, n 1 = 60 workers/shift, n 2 = 12 workers/shift, f = 0.7 , β = 100 , and ψ 0 = 0.01 as parametric values to attain feasible outcomes of the decision variables.
The tables below showcase the final and optimized outcomes of the decision variables, along with the maximum values of the unified total profit function for the four distinct cases despite having uncertainty in demand.

7.3. Comparison of KDPMG and GA

The KDPMG algorithm is based on the classical optimization approach, in which the values of the decision variables are obtained using a differentiation process, and the optimal solution is checked using a Hessian matrix. However, the GA is an evolutionary algorithm that does not guarantee the global optimal solution. Table 2 presents a comparison of the final values of the unified total profit function using the two different solution algorithms. From the table, it can be seen that the optimal profit values for Cases 1 and 2, obtained by the GA, are USD 236,035.127 and USD 245,167.130, respectively, which are almost similar to the results obtained by the KDPMG algorithm. However, the KDPMG algorithm provides better optimal results for the unified profit function compared to the GA for Cases 3 and 4. Hence, our proposed algorithm provides more appropriate results and fulfills the main objective of the framework presented in this article. Moreover, for both algorithms, we used MATLAB 2016a with an Intel Core i3-8145U CPU. The computational times for Cases 1, 2, 3, and 4 decreased by 97 % , 98 % , 97 % , and 96 % , respectively, when using the KDPMG algorithm. Thus, in terms of CPU time, our algorithm achieves better performance than the GA, as shown in Table 2.

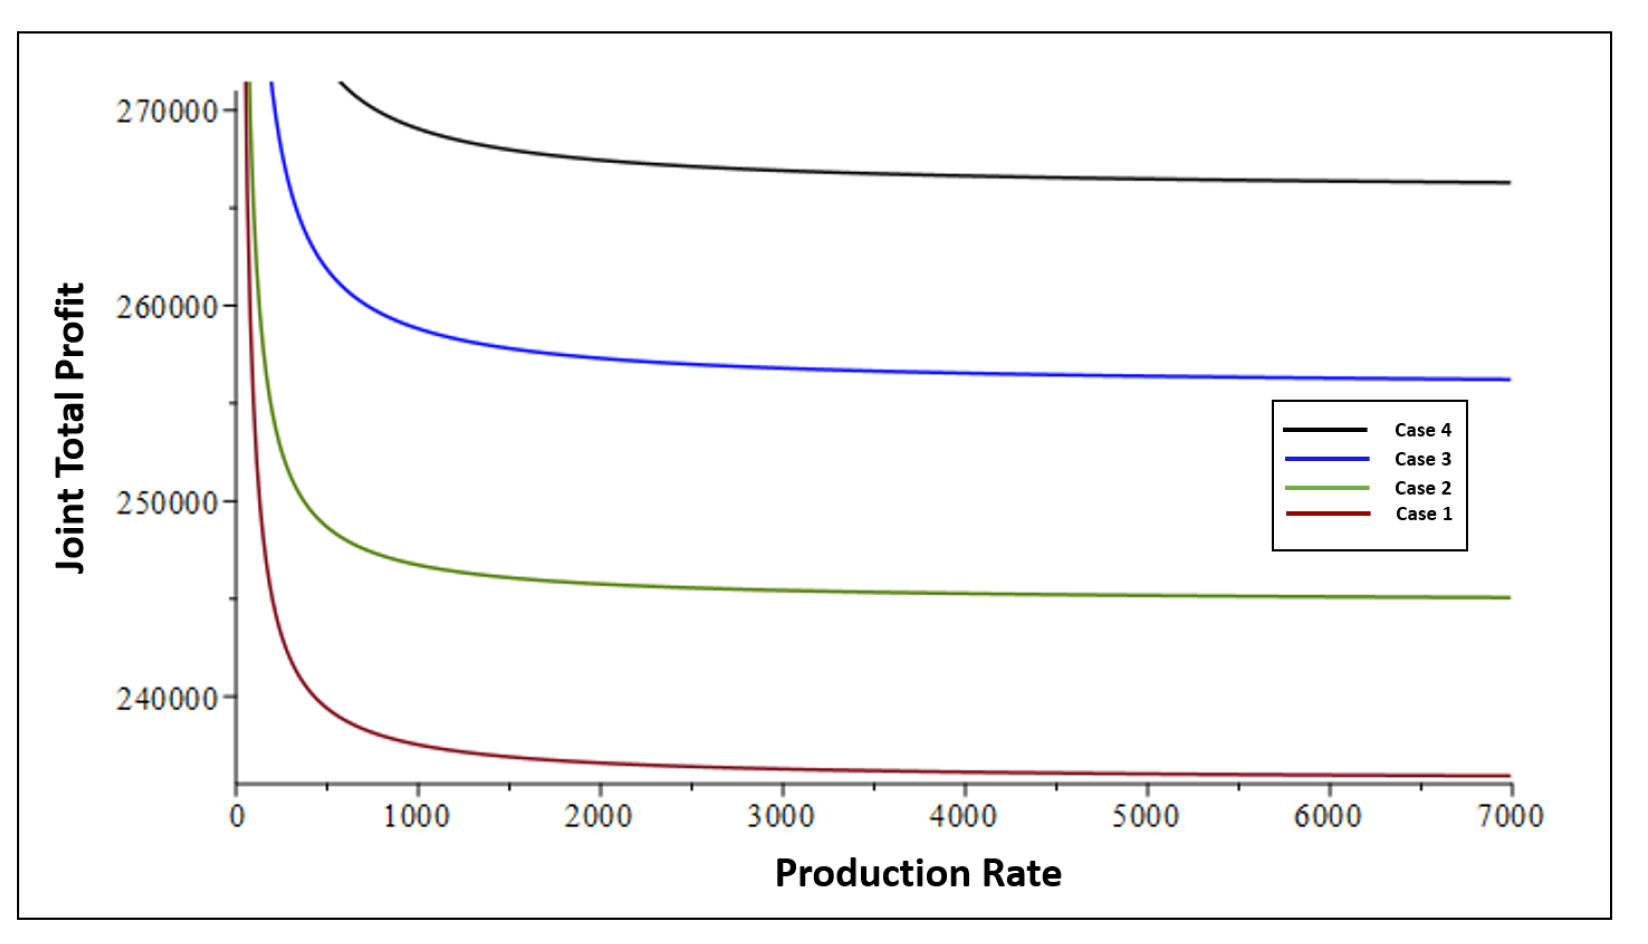
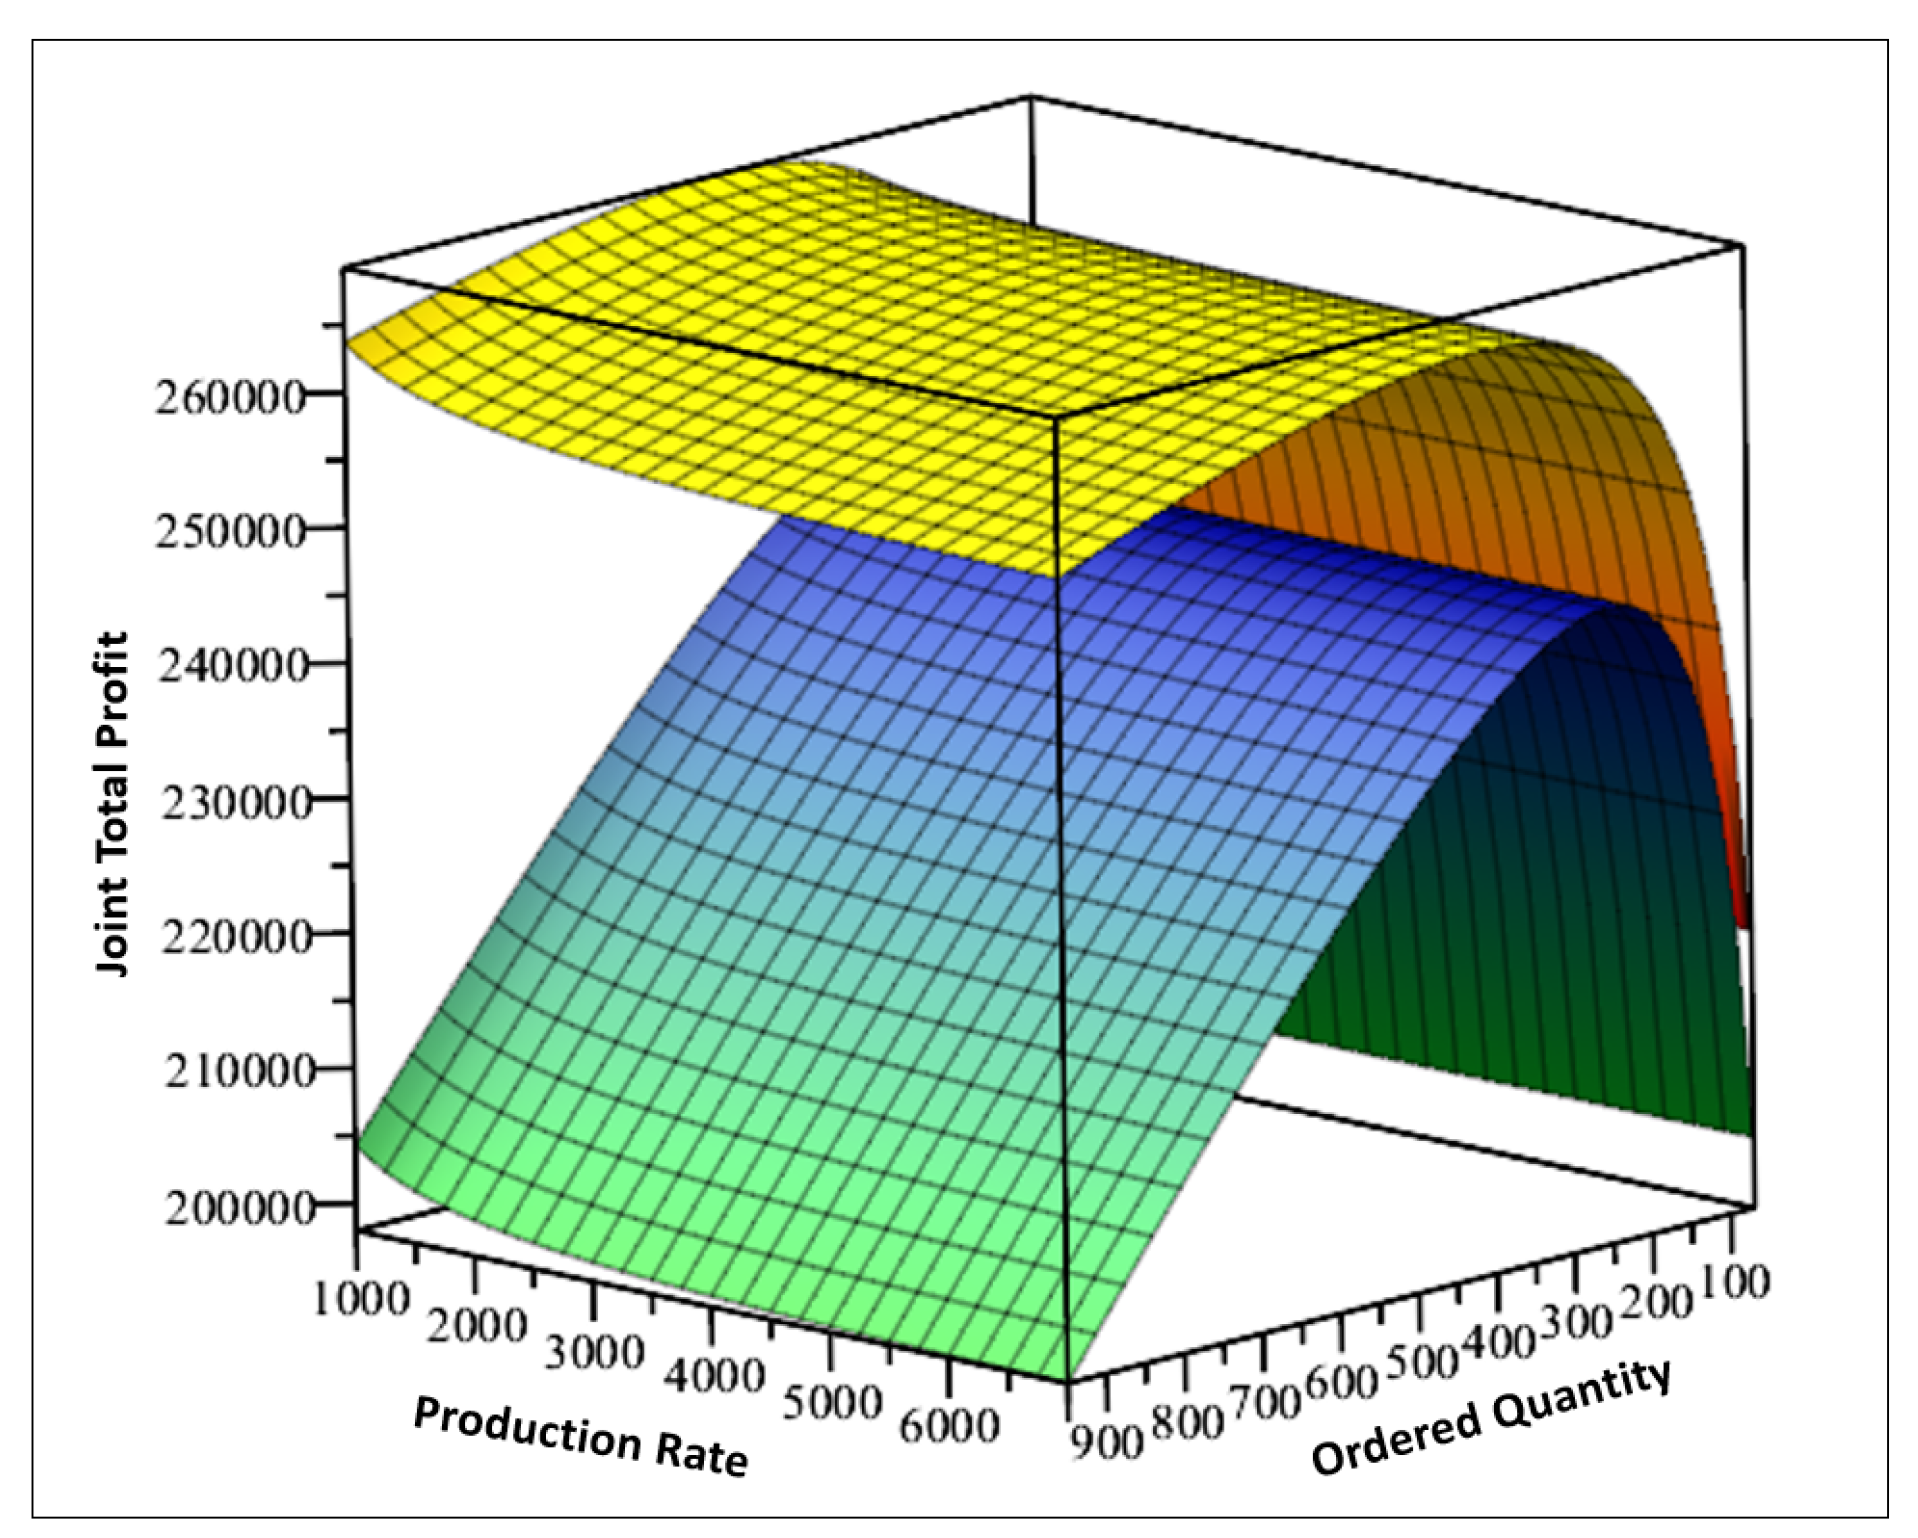
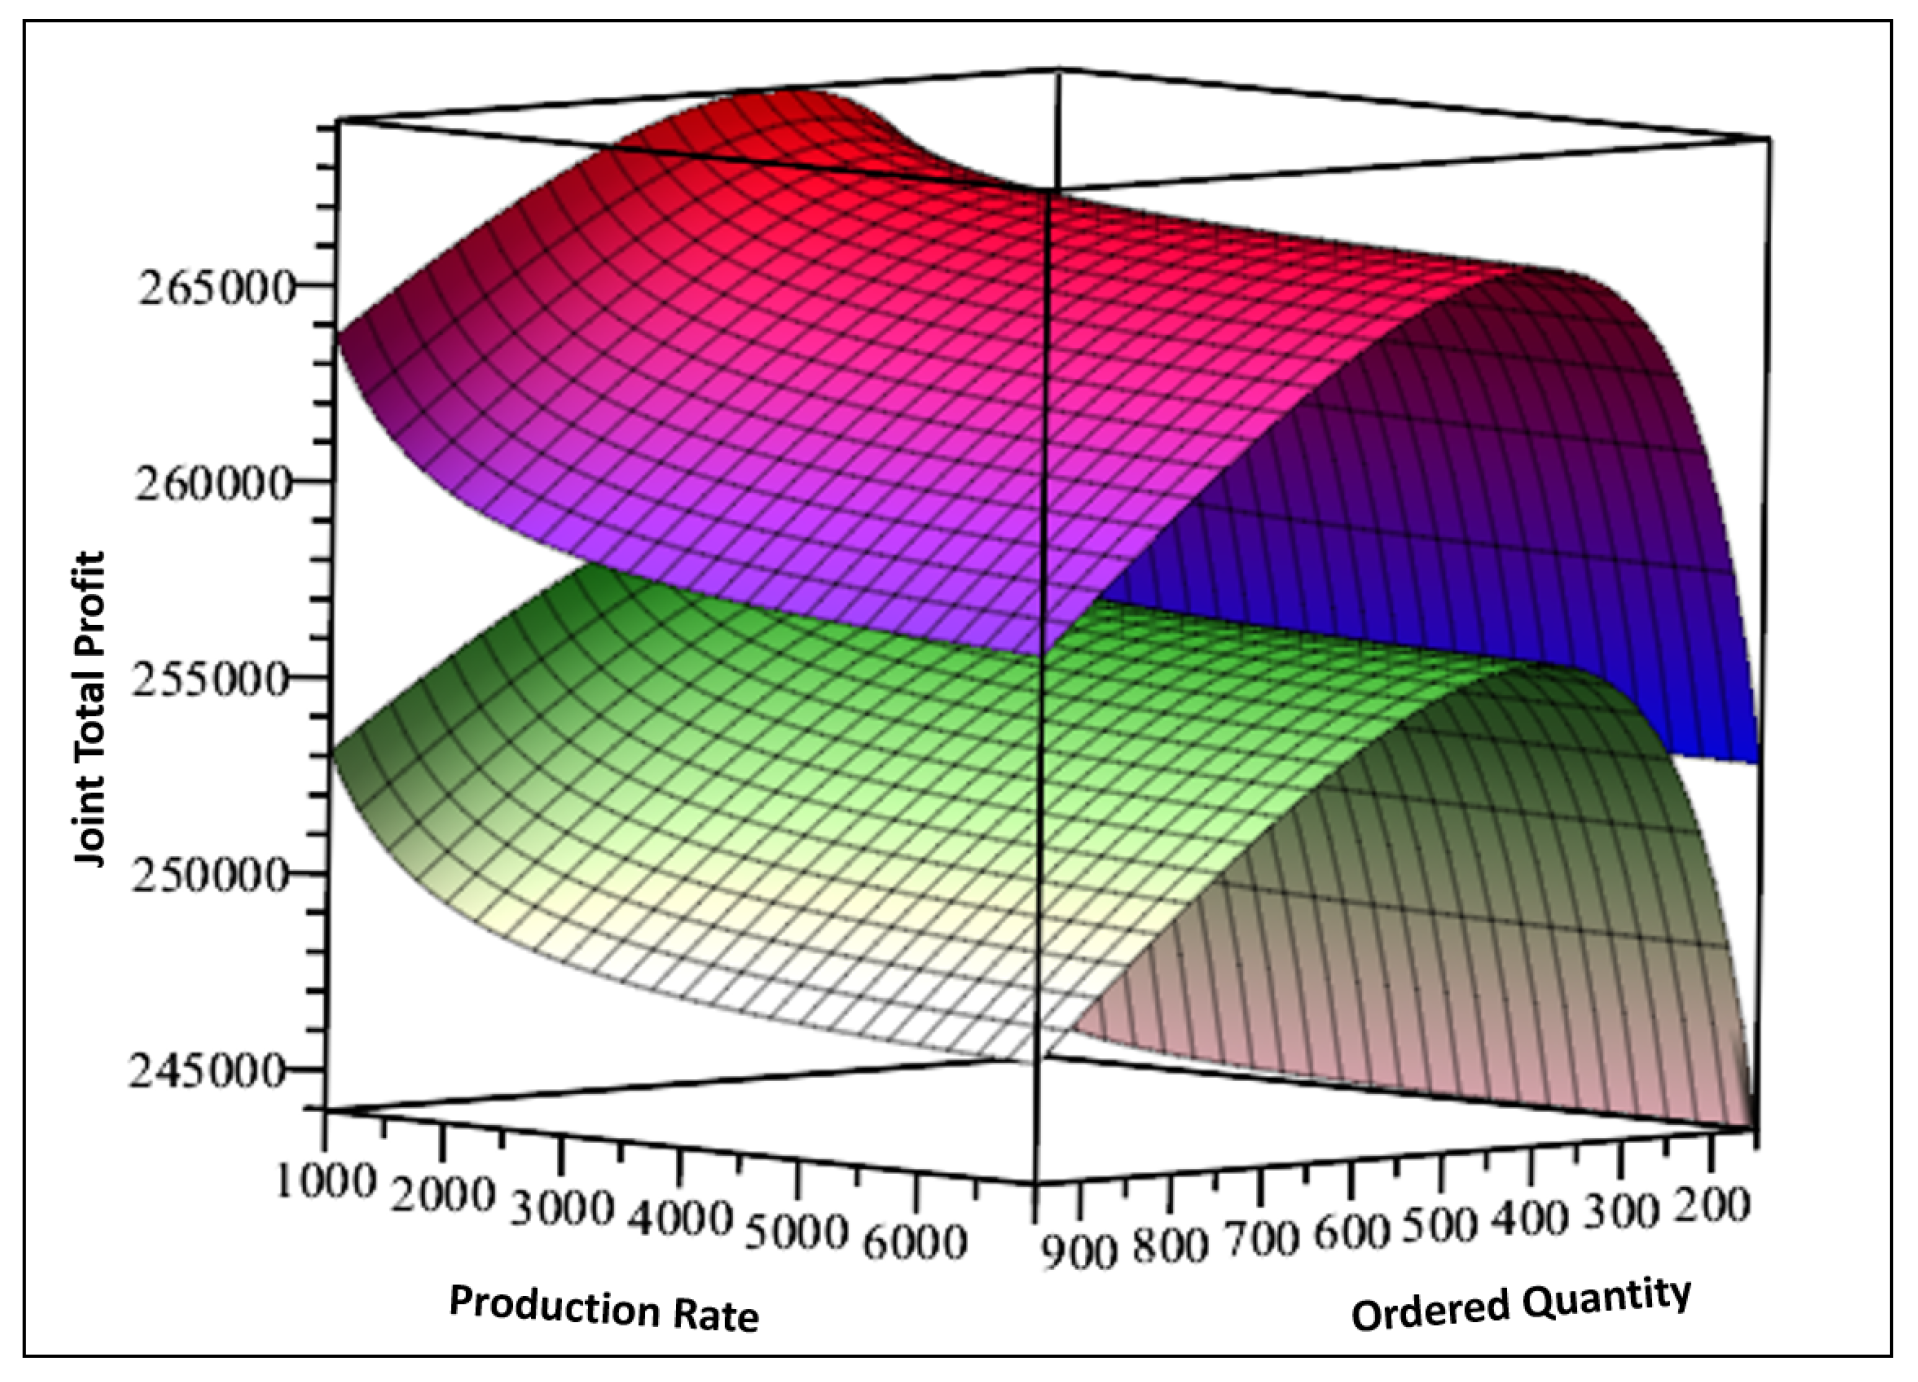
7.4. Results Discussion with Graphic Presentations

Table 2 and Table 3 present a detailed analysis of the unified profit function derived from the two optimization algorithms—the KDPMG and genetic algorithms—for the four cases specified in Table 1. This article presents a groundbreaking framework of an uncertain TE centralized supply chain network, which means the cotton TC mill has a monopoly market for fabric items. By implementing a make-to-order policy with a single seller and a single buyer, the mill can improve its current supply chain framework. Two types of fuzzy numbers are used in this work to deal with uncertain demand scenarios, and capital investment for a fully automatic fabric inspection machine is made to enhance the growth of the mill as well as the retailer. The main objective of this research is to assess the impact of SMT on system performance and the unified profit function value. Hence, the model is segregated into four unique scenarios (refer to Table 1). Table 3 shows that the best result after investing money is to use TFN demand for the ordered quantity Q, the probability of defective fabric items ψ , and the total profit. These numbers are 404.522 units/year, 2.9 × 10 5 , and USD 256 , 392.849 , respectively. When TrFN demand is used, these numbers change slightly to 412.466 units/year, 2.7 × 10 5 , and USD 266 , 482.519 , respectively. Hence, it is evident from Table 3 that the mill achieves higher profit using the framework outlined in Case 4 compared to Cases 1, 2, and 3. In simple terms, the choice of the trapezoidal fuzzy demand function yields better results than the triangular fuzzy demand function. So, it is worth mentioning that the choice of a fuzzy number to handle uncertain scenarios can have a drastic impact on the overall outcome of the framework. Furthermore, the capital investment in smart fabric inspection technology for the mending section to reduce fabric defect detection proves advantageous compared to classical techniques used in the mending section.
Additionally, Table 4 presents a comparison between Cases 3 and 4 in terms of percentage change in the values of the decision variables and unified total profit. The graphical representations below depict the nature of the unified total profit function concerning other aspects of the model.
Figure 3 depicts the relationship between the unified profit function and the production rate of the cotton TC mill for fabric item production. It can be observed that initially, the production process generates higher profit; however, as the production rate increases, the profit starts to decrease. A steep decline can be observed for Case 1 compared to the other cases. Case 4 results in a slight decrease in profit with an increment in the production rate. Moreover, the integration of smart fabric inspection technology improves the productivity of the mill, resulting in higher profits of USD 266,482.519 and USD 256,392.849 for the trapezoidal and triangular fuzzy demand functions, respectively.
Figure 4 shows the relationship between the unified total profit and the ordered quantity Q. It is clear that the profit value surges when the ordered quantity ranges from approximately 50 to 200 units per year for Cases 1 and 2, and then declines rapidly, whereas this decrease is very slight for Cases 3 and 4. Moreover, when the ordered quantity ranges from 50 to 450 units per year, the profit increases. The mathematical function of the ordered quantity and joint total profit takes the form of a quadratic concave function. Thus, it has one optimal value at the maximum point and then the function slopes downward. This shows that the framework of Cases 3 and 4 can handle approximately double the ordered quantities compared to Cases 1 and 2.
An analysis of Figure 5 suggests that with capital investment in smart fabric inspection machines for the mending section, the probable occurrence of defective fabric items decreases. This is a logarithmic capital investment that gradually declines as the production process increases, resulting in a lower probability of fabric defects occurring.
Figure 6 reveals the change in the unified total profit due to variations in the ordered quantity and production rate. The figure also shows the difference in total profit before and after the installation of SMT in the fabric inspection section of the cotton TC mill. The blue/green plot represents the variation in the classical unified total profit function with respect to the production rate and ordered quantity, whereas the red/yellow plot represents the variation in the modern unified total profit function with respect to the production rate and ordered quantity. The profit generated using the traditional framework is significantly lower than that generated using the modern framework. Both profit functions in this proposed model are quadratic concave in nature; thus, the optimal order quantity in the classical and modern frameworks is nearly 250 and 400 units per year, respectively. Here, SMT acts as an aid for the mill as the ordered quantity increases along with the production rate. The revenue from the classical framework is just USD 205,000; however, from the modern framework, the revenue exceeds USD 265,000. The mill’s profit will start to decline after this number of units.
On the other hand, Figure 7 illustrates the changes in the modern unified total profit function, ordered quantity, and production rate due to the choice of different fuzzy demand functions. The blue/red plot represents the variation due to the trapezoidal fuzzy demand function, whereas the green/pink plot represents the variation due to the triangular fuzzy demand function. The TrFN demand function generates more profit compared to the TFN demand function. When the number of ordered quantities of fabric items is less than 400 units/year, the revenue of the cotton TC mill surges for both the demand and supply functions. However, a significant difference in the peak value of generated profit can be observed, with USD 266,482.519 and USD 256,392.849 for the trapezoidal and triangular fuzzy demand functions. This peak value is considered optimal for the quadratic concave function and yields the maximum revenue for the company. Beyond this range, both frameworks experience a slight decline in overall revenue.
The results demonstrate a relationship between the production rate and profit, with the profit of the supply chain initially increasing and then decreasing as production rises. This phenomenon is well established in economics and business management and is often referred to as the law of diminishing returns. It suggests that as production increases, the additional output gained from each unit of the additional input (e.g., labor, materials) eventually decreases. This leads to a decline in marginal profit, meaning that the profit earned per unit produced starts to fall. The merger of smart technology and classical manual inspection increases the profitability of the system. Traditionally, fabric cutting and inspection were carried out manually, often leading to human error and wasted material. Automated fabric inspection machines use computer-numeric-controlled tools to precisely inspect fabric defects. This minimizes waste and ensures consistent quality, leading to significant cost savings (https://dineshexports.com/category/clothing/ (accessed on 10 March 2024)).
The numerical results of the four cases suggest that when market demand follows trapezoidal fuzzy uncertainty, industries would benefit from the maximum profit if they implemented smart manufacturing technology. The graphical representations clearly show that companies should be very careful in predicting market demand uncertainty. In the case of a lack of demand data, fuzzy uncertainty can be very fruitful for analysts. The investment could be harmful and less profitable for industries under fuzzy triangular demand uncertainty.

7.5. Sensitivity Analysis

This section discusses a sensitivity analysis of the unified modern total profit function with capital investment in SMT technology in the SC system of the TC mill. Here, the impact of all cost parameters, including ordering, inventory holding, rework, setup, and labor costs, on the overall profit is examined. Two different types of fuzzy demand functions are considered. The parameters related to cost have been adjusted by −50%, −25%, +25%, and +50% while keeping others fixed.
Figure 8 and Figure 9 depict graphical representations of the sensitivity analysis of the profit function concerning the two distinct demand functions. The following observations can be made:
  • Figure 8 and Figure 9 demonstrate that a variation of ±25% in the holding cost for a retailer results in fluctuations of approximately ±0.90% and ±0.88% in the overall revenue profit for Cases 3 and 4, respectively.
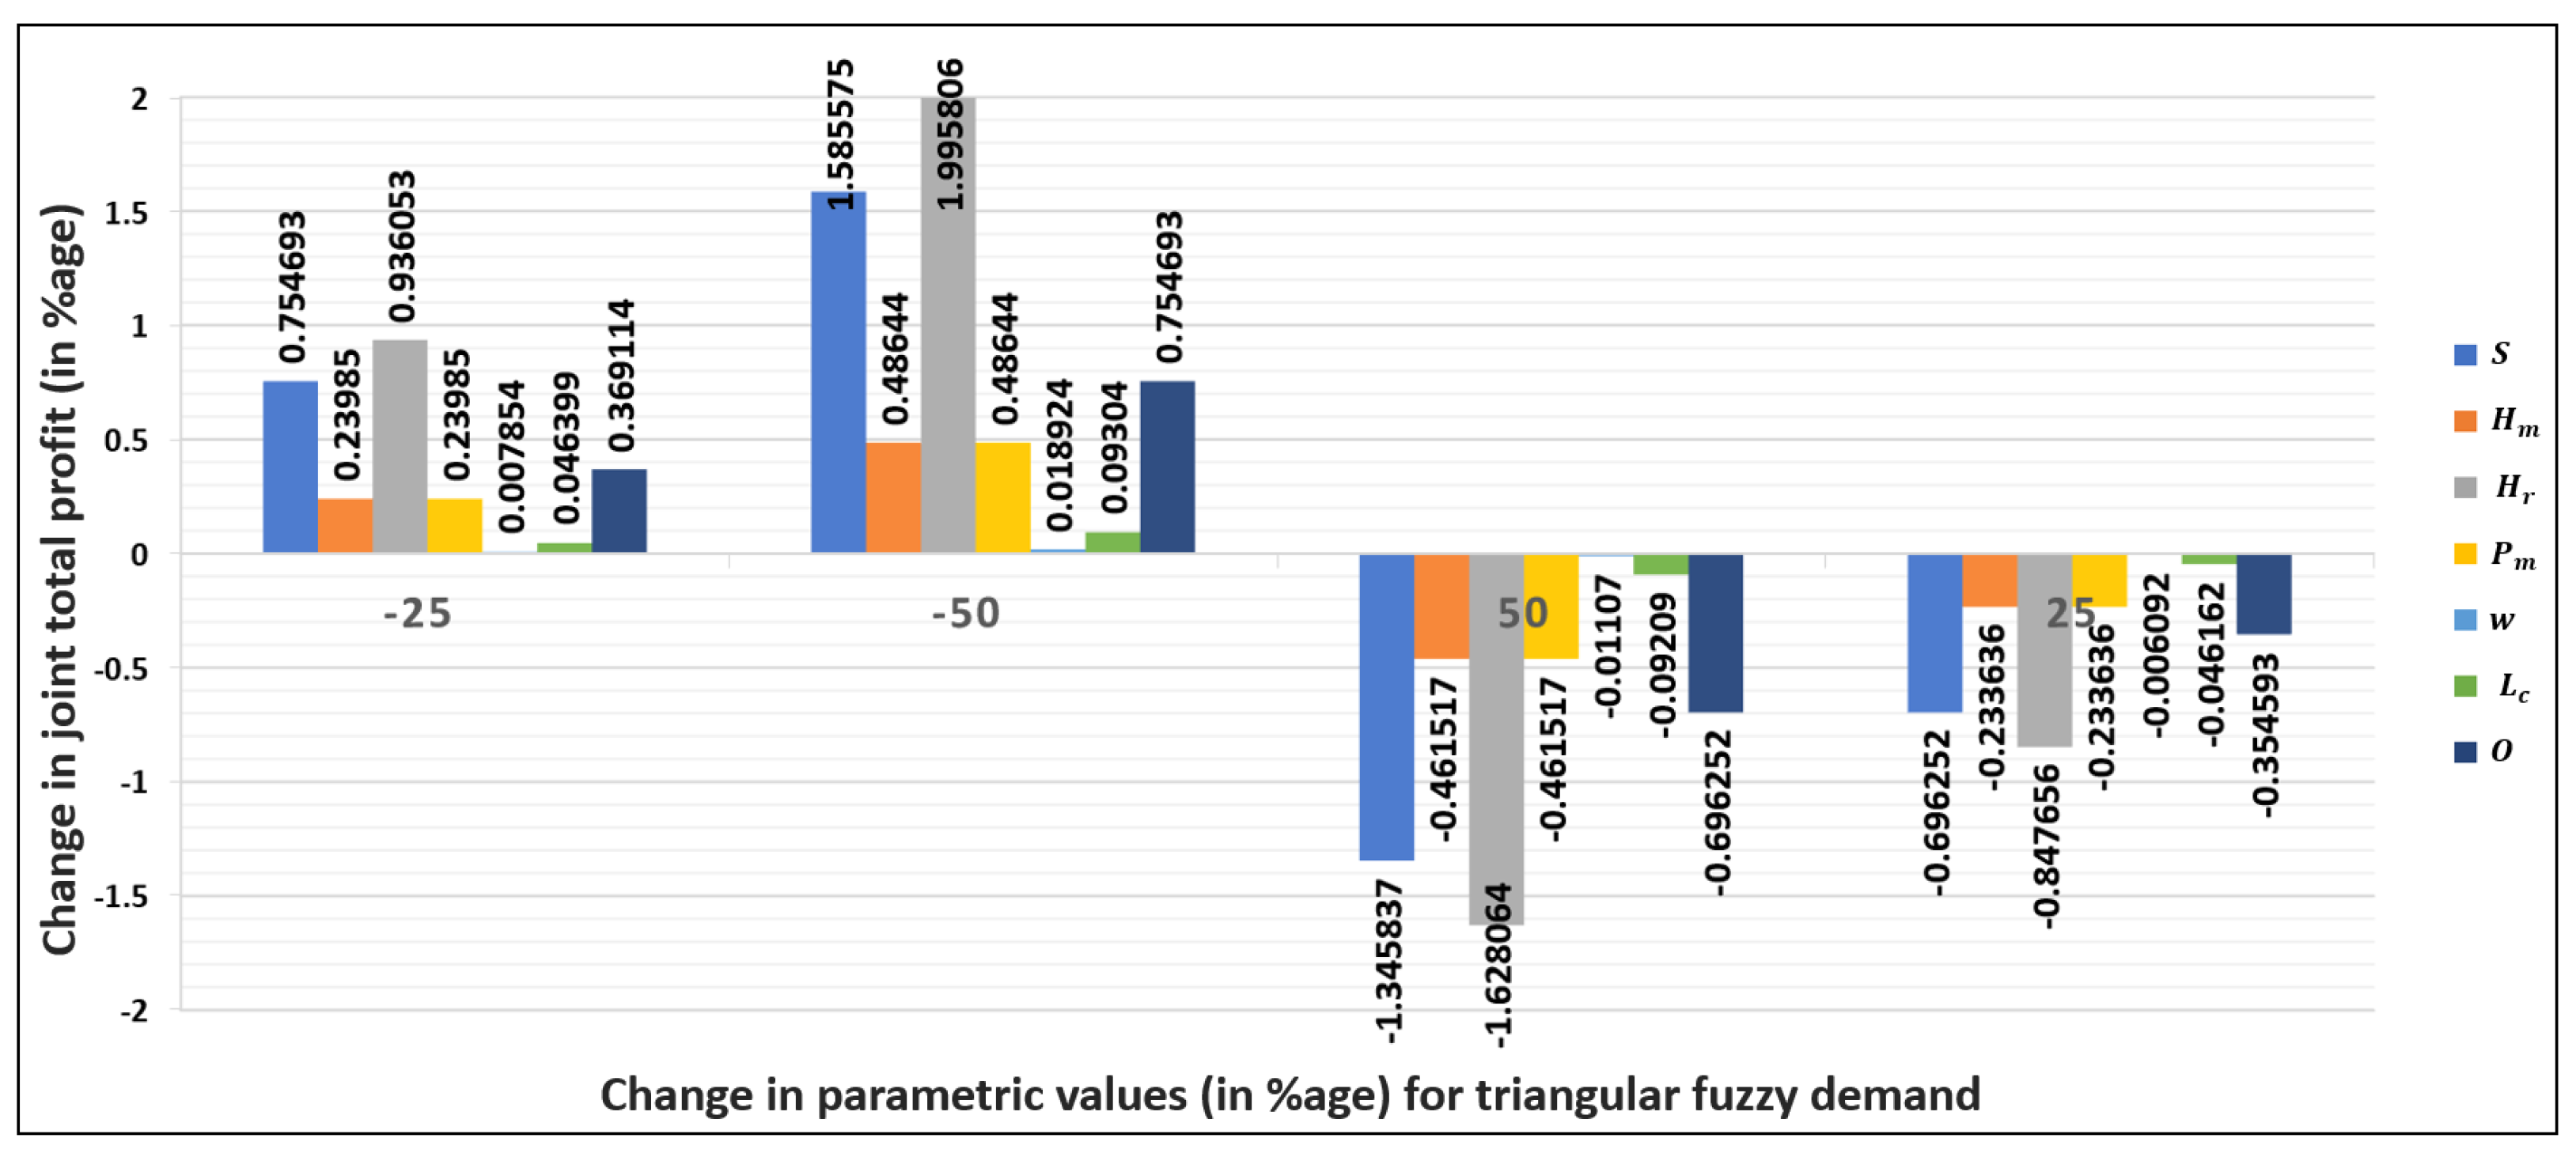
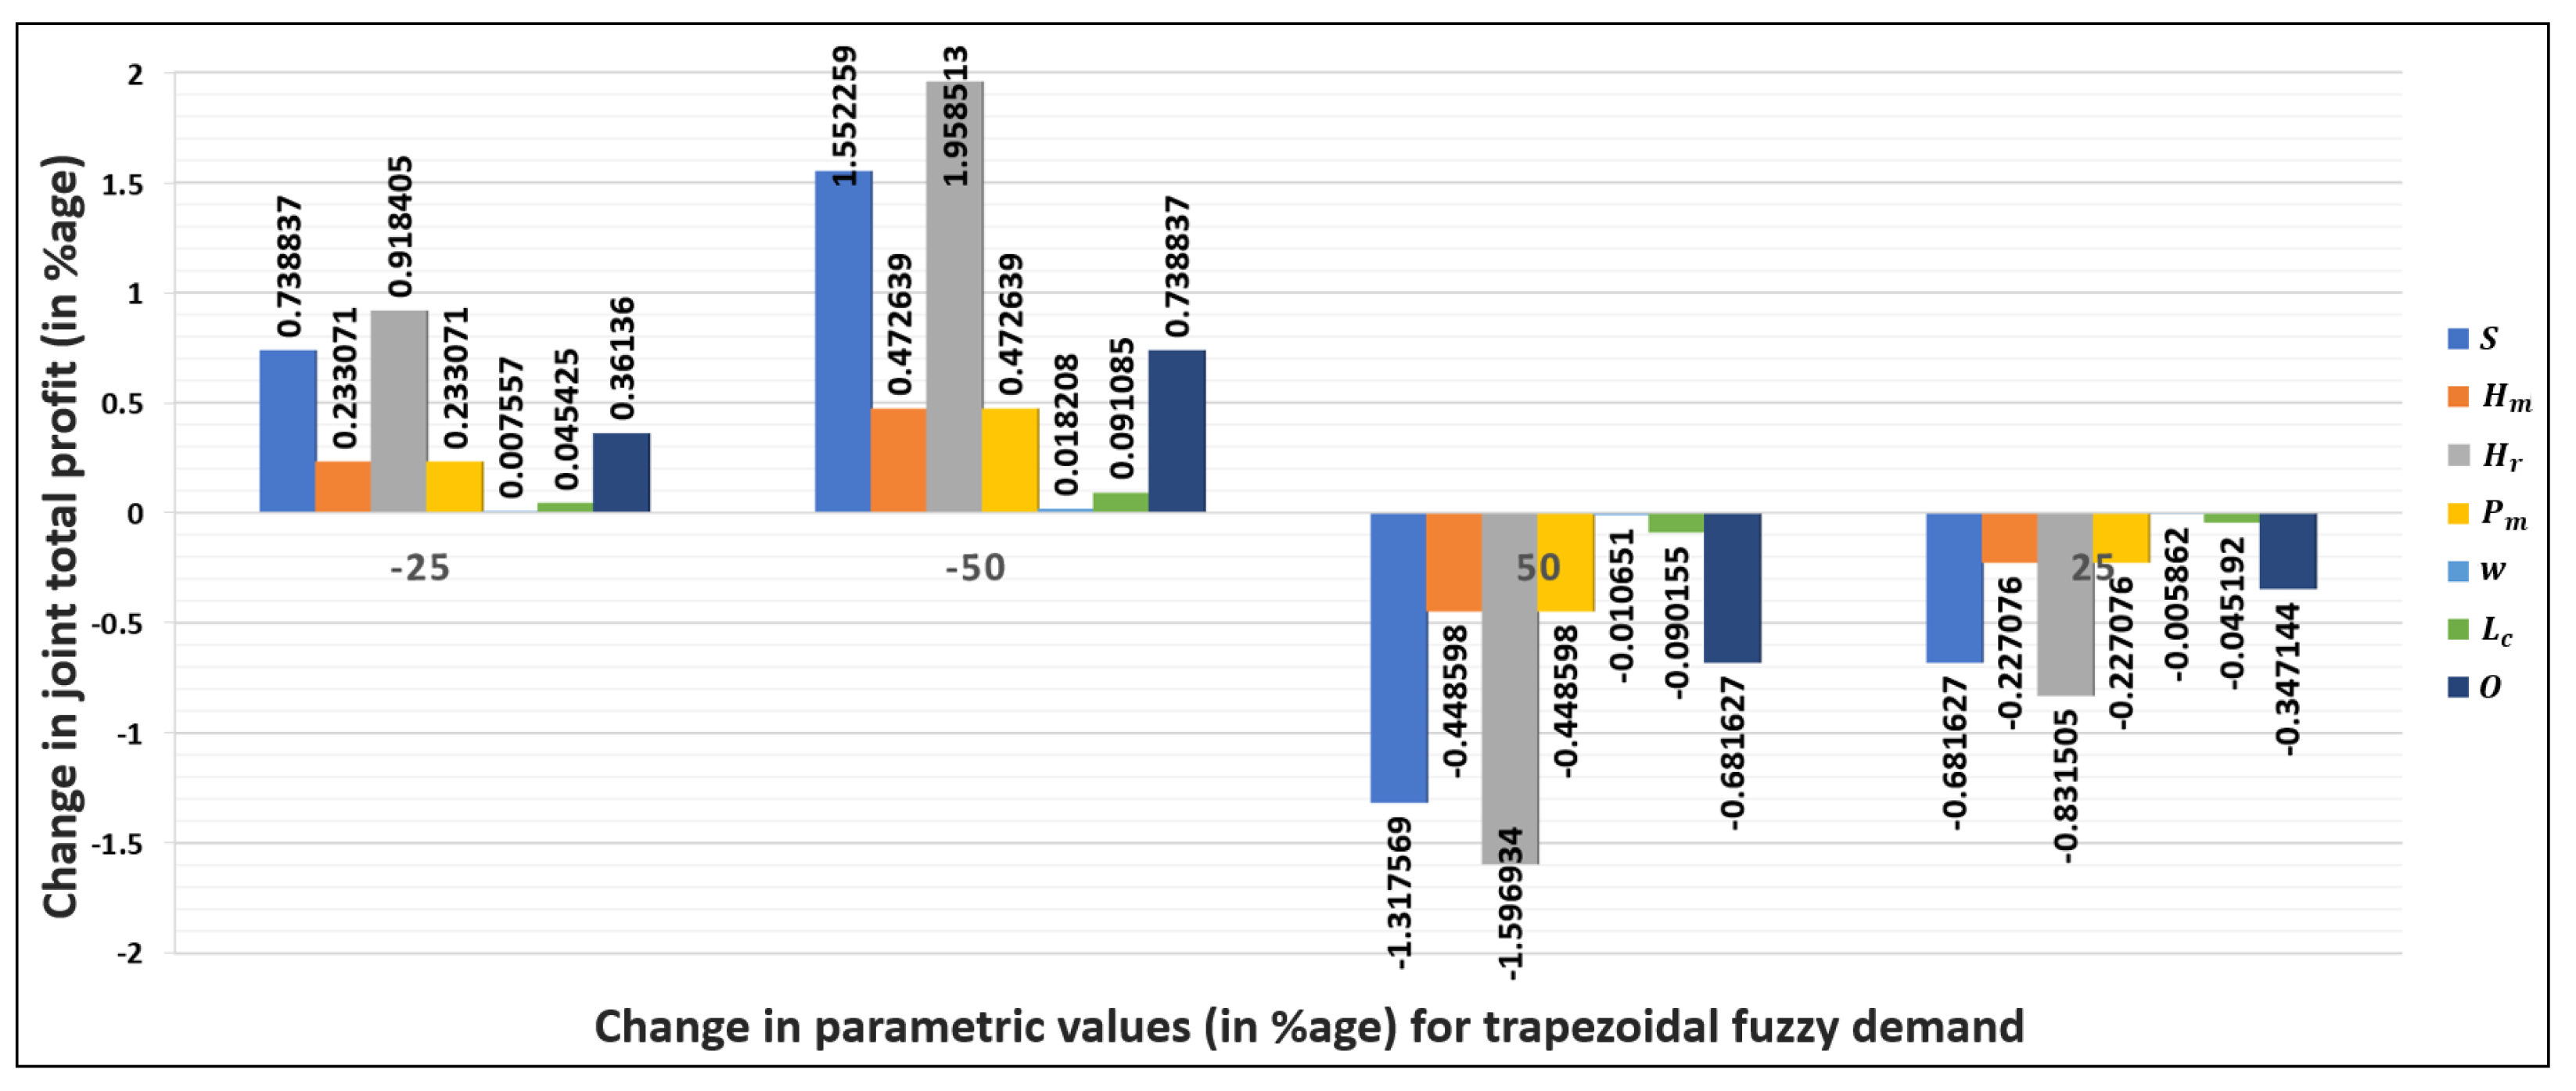
  • However, a change of 50% for Case 3 results in variations of 1.62% and 1.92%. In contrast, variations of −1.59% and 1.95% are observed in total profit by making a change of ±50% in the holding cost.
  • A thorough analysis of these figures reveals that the holding costs of cotton TC mills and retailers are more sensitive compared to other costs such as production, labor, and ordering costs.
  • For reference, in both scenarios, a change of ±25% in all these costs results in variations of 0.23%, 0.05%, and 0.35% in total profit, respectively, while a change of ±50% in all these costs results in variations of 0.4%, 0.09%, and 0.7% in total profit, respectively.
  • Figure 8 and Figure 9 depict the influence of the cost parameters related to the mending section of the mill, which has a great influence on the overall profit function. In both demand functions, changes of ±50% and ±25% in the mending section’s cost vary the total profit by 0.01% and 0.007%, respectively.

8. Managerial Insights

The main goal of every business is to maximize their overall profit by satisfying the needs of their customers and having a high reputation in both global and local markets. This study also focuses on the concept of increasing profit, which is why it examines the TE centralized supply chain network of a textile manufacturing company. The main focus of this study is on upgrading the conventional fabric inspection setup and supply chain network of the cotton segment of the mill by using industrial automation policies and smart manufacturing technology. By keeping the manager’s perspective in mind, this framework utilizes a make-to-order policy, which will assist mill managers in making feasible decisions related to the production of optimally ordered quality with a lower number of defective items. The findings obtained using our proposed framework, which benefits from smart fabric inspection technology, will undoubtedly accelerate the mill’s growth both domestically and abroad. This modern concept can reduce the wastage of defective fabric items, ultimately reducing the wastage of resources and time. This outcome is realized because of the conditions mentioned in Theorem 1 and a few lemmas, such as Lemmas 1–4. Theorem 1 states that managers can easily decide to make a logarithmic capital investment in smart fabric inspection technology to upgrade the conventional mending setup. Moreover, in real-life scenarios, uncertainty in demand exists. We have also considered this problem in our proposed framework and found that the use of the trapezoidal fuzzy demand function, instead of the triangular demand function, yields far better results in every aspect.

9. Conclusions

The concluding remarks of this study can be summarized as follows:
  • It is evident from Table 3 that the cotton textile manufacturing plant achieves higher profit using the framework outlined in Case 4 compared to Cases 1, 2, and 3. In simple terms, the choice of the trapezoidal fuzzy demand function with the KDPMG algorithm yields better results than the triangular fuzzy demand function. Moreover, the CPU time for the KDPMG algorithm is significantly shorter than that for the GA, as shown in Table 2.
  • Using a triangular fuzzy demand pattern, the model with SMT achieves 8.62% higher profit than without SMT adoption. Similarly, in a trapezoidal fuzzy demand pattern, SMT adoption in cotton plants can achieve an 8.69% higher profit. However, the comparison between Cases 2 and 4 reveals that the trapezoidal fuzzy demand pattern generates 3.94% more profit than the triangular fuzzy demand pattern.
  • The probability of the occurrence of defective items is reduced by 6.9% in the case of the trapezoidal demand function compared to the triangular fuzzy demand function. So, it is worth mentioning that the choice of the fuzzy number to deal with uncertain scenarios can have a drastic impact on the overall outcome of the framework. Furthermore, capital investment in smart fabric inspection technology for the mending section to reduce fabric defect detection has undoubtedly proven to be advantageous in contrast to classical techniques.

10. Future Scope

The future directions of this study can be summarized as follows:
  • In this study, it is important to acknowledge certain aspects that were not taken into account. In reality, supply chain systems comprise a multitude of different parties, each playing a significant role in the overall functioning of the system. It would be beneficial to expand this study by incorporating a multi-echelon and multi-retailer-seller approach, thus capturing a broader view of supply chain dynamics. By doing so, the model presented in this study would undoubtedly gain a greater level of sophistication and relevance.
  • In this article, we primarily focus on the implementation of SMT in the fabric inspection section of the textile industry. This problem can be extended by implementing SMT in other sections of textile manufacturing plants, such as fabric manufacturing, packaging, and others. If each module of the supply chain adopts SMT, the profitability of the industry will increase and it will be able to compete in a tech-savvy era.
  • The emergence of the I4.0 era has opened up a plethora of opportunities and created a seamless connection between the manufacturing industry and advanced technologies. As a result, it becomes imperative for future research endeavors to explore the implementation of optimal production delivery strategies, as this would undoubtedly prove to be a fascinating and crucial area of investigation based on the proposed model’s findings.

Author Contributions

Conceptualization, G.K., P.P. and A.M.; methodology, G.K. and A.M.; software, G.K. and A.M.; validation, G.K., P.P., B.K.D., S.G. and A.M.; formal analysis, P.P., B.K.D. and S.G.; investigation, A.M. and P.P.; resources, G.K. and A.M.; data curation, A.M. and G.K.; writing—original draft preparation, G.K.; writing—review and editing, G.K., B.K.D., P.P. and A.M.; visualization, A.M. and G.K.; supervision, A.M. and P.P. All authors have read and agreed to the published version of the manuscript.

Funding

This research received no external funding.

Data Availability Statement

Data are contained within the article.

Conflicts of Interest

The authors declare no conflict of interest.

Abbreviations

The following abbreviations were used in this study:
Abbreviations
TETwo-echelon
SCSupply chain
MTOMake-to-order
JCTJagatjit Cotton Textiles
TFNTriangular fuzzy number
TrFNTrapezoidal fuzzy number
SDMSigned-distance method
SMTSmart manufacturing technology
I4.0Fourth Industrial Revolution
AIArtificial Intelligence
TCTextile and clothing
Decision Variables
QOrdered quantity of fabric items (units/year)
ψ Probability of defective fabric items occurring
Parameters
DDemand for fabric items (units/year)
OOrdering cost of fabric items (USD/order)
H m Cost of holding a fabric item by the mill (USD/unit/year)
H r Cost of holding a fabric item by the retailer (USD/unit/year)
P m Cost of producing a fabric item by the mill (USD/unit/year)
P r Cost of purchasing a fabric item by the retailer (USD/units/year)
PManufacturing pace of producing fabric items in the mill (units/year)
ψ 0 Initial probability of defective fabric items occurring
RMarket price of fabric items (USD/unit/year)
SSetup cost of the cotton TC mill per order
n 1 Manpower working in the classical mending section of the mill, ( n 1 Z + )
n 2 Manpower working in the smart mending section of the mill, ( n 2 Z + )
L c Labor cost of manpower
wMending cost per production cycle

Appendix A

This section gives a detailed view of the fuzzy demand functions utilized in this study. Two patterns of fuzzy demand functions are utilized: triangular and trapezoidal. This section elucidates the definitions of the triangular fuzzy number and trapezoidal fuzzy number, along with the SDM technique used for defuzzification.

Appendix A.1. Triangular Fuzzy Number

A triangular fuzzy number is represented as A = ( a 1 , a 2 , a 3 ) using three distinct points. The expression of its membership function is
μ ( A ) ( x ) = 0 , x < a 1 x a 1 a 2 a 1 , a 1 x a 2 a 3 x a 3 a 2 , a 2 x a 3 0 , x > a 3 ; otherwise

Appendix A.2. Trapezoidal Fuzzy Number

A trapezoidal fuzzy number is represented as B = ( b 1 , b 2 , b 3 , b 4 ) . The expression of its membership function is
μ ( B ) ( x ) = 0 , x < b 1 x b 1 b 2 b 1 , b 1 x b 2 1 , b 2 x b 3 b 4 x b 4 b 3 , b 3 x b 4 0 , x > a 4 ; otherwise

Appendix A.3

To obtain an optimal solution for the decision variables for this unified model, the fuzzy demand function has to be defuzzified to convert it into a crisp form and apply the solution algorithm. The demand function, represented in both TFN and TrFN forms, is further defuzzified using the signed-distance method (SDM).

Defuzzification of Triangular and Trapezoidal Fuzzy Demand Functions Using SDM

The fuzzy demand functions of the triangular fuzzy form (see Appendix A.1) and trapezoidal fuzzy form (see Appendix A.2) are converted into a crisp demand function using the defuzzification process known as the SDM. The crisp forms of these fuzzy numbers are calculated below:
d ( A , 0 ) = 1 2 0 1 [ A l ( α ) , A r ( α ) ] d α .
Here, [ A l ( α ) , A r ( α ) ] is the α -level cut of A. So, by employing the SDM method, we can ensure an accurate and precise demand D as follows:
SDM   of   TFN   as   A 1 :   = 1 4 ( a 1 + 2 a 2 + a 3 )
However,
d ( B , 0 ) = 1 2 0 1 [ B l ( α ) , B r ( α ) ] d α .
Here, [ B l ( α ) , B r ( α ) ] is the α -level cut of B. So, by employing the SDM method, we can ensure an accurate and precise value of demand D as follows:
SDM   of   TFN   as   B 1 :   = 1 4 ( b 1 + b 2 + b 3 + b 4 )

Appendix B. Proof of Theorem 1

To show that J T P S M T ( Q , ψ ) J T P ( Q ) , we need to prove that
w D Q ψ 2 + n 2 L c D Q w D Q ψ 0 2 + n 1 L c D Q
which always holds true since ψ 0 ψ & n 1 n 2 (according to the presuppositions of the model).

Appendix C

Appendix C.1. Calculation of Lemma 1

This section outlines the calculation of the rate of change of the unified profit concerning the ordered quantity Q for Case 1. The second-order derivatives of Equation (7) with respect to Q are
d 2 J T P 1 d Q 2 = 2 A 1 S Q 3 2 n 1 L c A 1 Q 3 2 O A 1 Q 3 < 0
The second derivative is negative, which shows that the unified profit function of Case 1 attains its global maximum. As a result, the cotton TC mill can attain the highest financial gain using the TE centralized SCM network without SMT when the demand is in the form of a TFN.

Appendix C.2. Calculation of Lemma 2

This section delineates the calculation of the rate of change of the unified profit concerning the ordered quantity Q for Case 2. The second-order derivatives of Equation (8) with respect to Q are
d 2 J T P 2 d Q 2 = 2 B 1 S Q 3 2 n 1 L c B 1 Q 3 2 O B 1 Q 3 < 0
The second derivative is negative, which shows that the unified profit function of Case 2 attains its global maximum. As a result, the cotton TC mill can attain the highest financial gain using the TE centralized SCM network without SMT when the demand is in the form of a TrFN.

Appendix C.3. Calculation of Lemma 3

This section outlines the calculation of the rate of change of the unified profit concerning the ordered quantity Q and ψ for Case 3. The second-order derivatives of Equation (9) with respect to Q and ψ , and the formation and calculation of the Hessian matrix considering these second-order partial derivatives, are outlined below:
M J T P 3 S M T = | 2 J T P 3 S M T Q 2 2 J T P 3 S M T Q ψ 2 J T P 3 S M T ψ Q 2 J T P 3 S M T ψ 2 |
For the Hessian matrix M J T P 3 S M T , the second-order partial derivatives are calculated in the following manner:
2 J T P 3 S M T Q 2 = 2 A 1 S Q 3 2 n 2 L c A 1 Q 3 2 O A 1 Q 3
2 J T P 3 S M T ψ Q = 2 J T P 3 S M T Q ψ = w A 1 2 , 2 J T P 3 S M T ψ 2 = f β ψ 2
The determinant of a principal minor of the order 1 × 1 of the Hessian matrix | M J T P 3 S M T | is
| M J T P 3 S M T | 1 × 1 = 2 J T P 3 S M T Q 2 ( Q 3 , ψ 1 ) = 2 A 1 S Q 3 2 n 2 L c A 1 Q 3 2 O A 1 Q 3 < 0
The determinant of a principal minor of the order 2 × 2 of the Hessian matrix | M J T P 3 S M T | is
| M J T P 3 S M T | 2 × 2 = 2 J T P 3 S M T Q 2 2 J T P 3 S M T Q ψ 2 J T P 3 S M T ψ Q 2 J T P 3 S M T ψ 2 ( Q 3 , ψ 1 )
= 2 A 1 f β ( S + n 2 L c + O ) Q 3 ψ 2 > ( w A 1 4 ) 2
It can be observed from the above calculation that the principal minors 1 × 1 and 2 × 2 of the Hessian matrix M J T P 3 S M T have negative and positive values, respectively. Hence, the matrix is negative definite, which infers that the unified total profit function is concave and attains its maximum value for decision variables Q 3 and ψ 1 for Case 3. As a result, the cotton TC mill can attain the highest financial gain using the TE centralized SCM network with SMT when the demand is in the form of a TFN.

Appendix C.4. Calculation of Lemma 4

This section outlines the calculation of the rate of change of the unified profit concerning the ordered quantity Q and ψ for Case 4. The second-order derivatives of Equation (10) with respect to Q and ψ , and the formation and calculation of the Hessian matrix considering these second-order partial derivatives, are outlined below:
M J T P 4 S M T = | 2 J T P 4 S M T Q 2 2 J T P 4 S M T Q ψ 2 J T P 4 S M T ψ Q 2 J T P 4 S M T ψ 2 |
For the Hessian matrix M J T P 4 S M T , the second-order partial derivatives are calculated in the following manner:
2 J T P 4 S M T Q 2 = 2 B 1 S Q 3 2 n 2 L c B 1 Q 3 2 O B 1 Q 3
2 J T P 4 S M T ψ Q = 2 J T P 4 S M T Q ψ = w B 1 2 , 2 J T P 4 S M T ψ 2 = f β ψ 2
The determinant of a principal minor of the order 1 × 1 of the Hessian matrix | M J T P 4 S M T | is
| M J T P 4 S M T | 1 × 1 = 2 J T P 4 S M T Q 2 ( Q 4 , ψ 2 ) = 2 B 1 S Q 3 2 n 2 L c B 1 Q 3 2 O B 1 Q 3 < 0
The determinant of a principal minor of the order 2 × 2 of the Hessian matrix | M J T P 4 S M T | is
| M J T P 4 S M T | 2 × 2 = 2 J T P 4 S M T Q 2 2 J T P 4 S M T Q ψ 2 J T P 4 S M T ψ Q 2 J T P 4 S M T ψ 2 ( Q 4 , ψ 2 )
= 2 B 1 f β ( S + n 2 L c + O ) Q 3 ψ 2 > ( w B 1 4 ) 2 0
It can be observed from the above calculation that the principal minors 1 × 1 and 2 × 2 of the Hessian matrix M J T P 4 S M T have negative and positive values, respectively. Hence, the matrix is negative definite, which infers that the unified total profit function is concave and attains its maximum value for decision variables Q 3 and ψ 1 for Case 4. As a result, the cotton TC mill can attain the highest financial gain using the TE centralized SCM network with SMT when the demand is in the form of a TrFN.

References

  1. Arora, S.; Majumdar, A. Machine learning and soft computing applications in textile and clothing supply chain: Bibliometric and network analyses to delineate future research agenda. Expert Syst. Appl. 2022, 200, 117000. [Google Scholar] [CrossRef]
  2. Riahi, Y.; Saikouk, T.; Gunasekaran, A.; Badraoui, I. Artificial intelligence applications in supply chain: A descriptive bibliometric analysis and future research directions. Expert Syst. Appl. 2021, 173, 114702. [Google Scholar] [CrossRef]
  3. Dey, B.K.; Sarkar, B.; Seok, H. Cost-effective smart autonomation policy for a hybrid manufacturing-remanufacturing. Comput. Ind. Eng. 2021, 162, 107758. [Google Scholar] [CrossRef]
  4. Sarkar, B.; Mridha, B.; Pareek, S. A sustainable smart multi-type biofuel manufacturing with the optimum energy utilization under flexible production. J. Clean. Prod. 2022, 332, 129869. [Google Scholar] [CrossRef]
  5. Nouinou, H.; Asadollahi-Yazdi, E.; Baret, I.; Nguyen, N.Q.; Terzi, M.; Ouazene, Y.; Yalaoui, F.; Kelly, R. Decision-making in the context of Industry 4.0: Evidence from the textile and clothing industry. J. Clean. Prod. 2023, 391, 136184. [Google Scholar] [CrossRef]
  6. Majumdar, A.; Ali, S.M.; Agrawal, R.; Srivastava, S. A triple helix framework for strategy development in circular textile and clothing supply chain: An Indian perspective. J. Clean. Prod. 2022, 367, 132954. [Google Scholar] [CrossRef]
  7. Sarkar, B.; Dey, B.K.; Sarkar, M.; Kim, S.J. A smart production system with an autonomation technology and dual channel retailing. Comput. Ind. Eng. 2022, 173, 108607. [Google Scholar] [CrossRef]
  8. Dey, B.K.; Seok, H. Intelligent inventory management with autonomation and service strategy. J. Intell. Manuf. 2022, 35, 307–330. [Google Scholar] [CrossRef] [PubMed]
  9. Rožanec, J.M.; Zajec, P.; Trajkova, E.; Šircelj, B.; Brecelj, B.; Novalija, I.; Dam, P.; Fortuna, B.; Mladenić, D. Towards a Comprehensive Visual Quality Inspection for Industry 4.0. IFAC-PapersOnLine 2022, 55, 690–695. [Google Scholar] [CrossRef]
  10. Thakur, R.; Panghal, D.; Jana, P.; Rajan; Prasad, A. Automated fabric inspection through convolutional neural network: An approach. Neural Comput. Appl. 2023, 35, 3805–3823. [Google Scholar] [CrossRef]
  11. Dey, B.K.; Pareek, S.; Tayyab, M.; Sarkar, B. Autonomation policy to control work-in-process inventory in a smart production system. Int. J. Prod. Res. 2021, 59, 1258–1280. [Google Scholar] [CrossRef]
  12. Rathore, B. Textile Industry 4.0 Transformation for Sustainable Development: Prediction in Manufacturing & Proposed Hybrid Sustainable Practices. Eduzone Int. Peer Rev. Multidiscip. J. 2022, 11, 223–241. [Google Scholar]
  13. Pourkaramdel, Z.; Fekri-Ershad, S.; Nanni, L. Fabric defect detection based on completed local quartet patterns and majority decision algorithm. Expert Syst. Appl. 2022, 198, 116827. [Google Scholar] [CrossRef]
  14. Dlamini, S.; Kao, C.-Y.; Su, S.-L.; Jeffrey Kuo, C.-F. Development of a real-time machine vision system for functional textile fabric defect detection using a deep YOLOv4 model. Text. Res. J. 2022, 92, 675–690. [Google Scholar] [CrossRef]
  15. Mahmood, T.; Ashraf, R.; Faisal, C.N. An efficient scheme for the detection of defective parts in fabric images using image processing. J. Text. Inst. 2022, 114, 1041–1049. [Google Scholar] [CrossRef]
  16. Fouda, Y.M. Integral images-based approach for fabric defect detection. Opt. Laser Technol. 2022, 147, 107608. [Google Scholar] [CrossRef]
  17. Çelik, H.İ.; Dülger, L.C.; Öztaş, B.; Kertmen, M.; Gültekin, E. A Novel Industrial Application of CNN Approach: Real Time Fabric Inspection and Defect Classification on Circular Knitting Machine. Text. Appar. 2022, 32, 344–352. [Google Scholar] [CrossRef]
  18. Majumder, A.; Guchhait, R.; Sarkar, B. Manufacturing quality improvement and setup cost reduction in a vendor-buyer supply chain model. Eur. J. Ind. Eng. 2017, 11, 588–612. [Google Scholar] [CrossRef]
  19. Xu, Z.; Pokharel, S.; Elomri, A. An eco-friendly closed-loop supply chain facing demand and carbon price uncertainty. Ann. Oper. Res. 2023, 320, 1041–1067. [Google Scholar] [CrossRef]
  20. Fathollahi-Fard, A.M.; Dulebenets, M.A.; Hajiaghaei–Keshteli, M.; Tavakkoli-Moghaddam, R.; Safaeian, M.; Mirzahosseinian, H. Two hybrid meta-heuristic algorithms for a dual-channel closed-loop supply chain network design problem in the tire industry under uncertainty. Adv. Eng. Inform. 2021, 50, 101418. [Google Scholar] [CrossRef]
  21. Lu, Z.; Zhang, Y.; Xu, H.; Chen, H. Fabric defect detection via a spatial cloze strategy. Text. Res. J. 2023, 93, 1612–1627. [Google Scholar] [CrossRef]
  22. Talu, M.F.; Hanbay, K.; Varjovi, M.H. CNN-based fabric defect detection system on loom fabric inspection. Text. Appar. 2022, 32, 208–219. [Google Scholar] [CrossRef]
  23. Kahraman, Y.; Durmuşoğlu, A. Classification of defective fabrics using capsule networks. Appl. Sci. 2022, 12, 5285. [Google Scholar] [CrossRef]
  24. Tayyab, M.; Jemai, J.; Lim, H.; Sarkar, B. A sustainable development framework for a cleaner multi-item multi-stage textile production system with a process improvement initiative. J. Clean. Prod. 2020, 246, 119055. [Google Scholar] [CrossRef]
  25. Sahoo, P.; Ashwani. COVID-19 and Indian economy: Impact on growth, manufacturing, trade and MSME sector. Glob. Bus. Rev. 2020, 21, 1159–1183. [Google Scholar] [CrossRef]
  26. Vishwakarma, A.; Dangayach, G.S.; Meena, M.L.; Gupta, S. Analysing barriers of sustainable supply chain in apparel & textile sector: A hybrid ISM-MICMAC and DEMATEL approach. Clean. Logist. Supply Chain 2022, 5, 100073. [Google Scholar]
  27. Chourasiya, R.; Pandey, S.; Malviya, R.K. Developing a framework to analyse the effect of sustainable manufacturing adoption in Indian textile industries. Clean. Logist. Supply Chain 2022, 4, 100045. [Google Scholar] [CrossRef]
  28. Sharma, A.; Singh, B.J. Understanding LSS 4.0 through golden circle model and reviewing its scope in Indian textile industry. Int. J. Six Sigma Compet. Advant. 2022, 14, 120–137. [Google Scholar] [CrossRef]
  29. Shaneeb, P.; Sumathy, M. Impact of intellectual capital on financial performance in Indian textile industries. Acad. Account. Financ. Stud. J. 2021, 25, 1–14. [Google Scholar]
  30. Darji, I.S.; Dahiya, S. Financial performance of the textile industry in India: The case of Haryana. Res. J. Text. Appar. 2023, 27, 36–53. [Google Scholar] [CrossRef]
  31. Alruwais, N.; Alabdulkreem, E.; Mahmood, K.; Marzouk, R.; Assiri, M.; Abdelmageed, A.A.; Abdelbagi, S.; Drar, S. Hybrid mutation moth flame optimization with deep learning-based smart fabric defect detection. Comput. Electr. Eng. 2023, 108, 108706. [Google Scholar] [CrossRef]
  32. Rasheed, A.; Zafar, B.; Rasheed, A.; Ali, N.; Sajid, M.; Dar, S.H.; Habib, U.; Shehryar, T.; Mahmood, M.T. Fabric defect detection using computer vision techniques: A comprehensive review. Math. Probl. Eng. 2020, 2020, 8189403. [Google Scholar] [CrossRef]
  33. Sarkar, B.; Sarkar, M.; Ganguly, B.; Cárdenas-Barrón, L.E. Combined effects of carbon emission and production quality improvement for fixed lifetime products in a sustainable supply chain management. Int. J. Prod. Econ. 2021, 231, 107867. [Google Scholar] [CrossRef]
  34. Lagzaie, L.; Hamzehee, A. Providing a Multiproduct and Multiperiodic Model for Closed-Loop Green Supply Chain under Conditions of Uncertainty Based on a Fuzzy Approach for Solving Problem of Business Market. Complexity 2022, 11, 2780073. [Google Scholar] [CrossRef]
  35. Abdi, A.; Fathollahi-Fard, A.M.; Hajiaghaei-Keshteli, M. A set of calibrated metaheuristics to address a closed-loop supply chain network design problem under uncertainty. Int. J. Syst. Sci. Oper. Logist. 2021, 8, 23–40. [Google Scholar] [CrossRef]
  36. Komatina, N.; Tadic, D.; Duric, G.; Aleksić, A. Determination of manufacturing process failures priority under type 2 fuzzy environment: Application of genetic algorithm and Variable neighborhood search. Proc. Inst. Mech. Eng. Part E J. Process. Mech. Eng. 2023. [Google Scholar] [CrossRef]
  37. Chauhan, R.; Majumder, A.; Kumar, V. The impact of adopting customization policy and sustainability for improving consumer service in a dual-channel retailing. J. Retail. Consum. Serv. 2023, 75, 103504. [Google Scholar] [CrossRef]
  38. Yang, X. Nature-Inspired Optimization Algorithms, 2nd ed.; Elsevier: London, UK, 2021; Volume 6, pp. 91–100. ISBN 978-012-416-743-8. [Google Scholar]
Figure 1. Graphical representation of the smart manufacturing supply chain of a cotton plant.
Processes 12 00778 g001
Figure 2. Flowchart of the method.
Processes 12 00778 g002
Figure 3. Variation in the unified total profit function with respect to the production rate.
Processes 12 00778 g003
Figure 4. Variation in the unified total profit with respect to the ordered quantity.
Processes 12 00778 g004
Figure 5. Variation in investment to reduce defective items with respect to the probability of defective items occurring.
Processes 12 00778 g005
Figure 6. Variations in the classical and modern unified total profit functions with respect to the production rate and ordered quantity.
Processes 12 00778 g006
Figure 7. Variations in the modern unified total profit function with respect to the production rate and ordered quantity for different fuzzy demand functions.
Processes 12 00778 g007
Figure 8. All cost factors related to profit for TFN demand function.
Processes 12 00778 g008
Figure 9. All cost factors related to profit for TrFN demand function.
Processes 12 00778 g009
Table 1. Differences between the models.
ModelDescription
Case 1SC without SMT with TFN
Case 2SC without SMT with TrFN
Case 3SC with SMT with TFN
Case 4SC with SMT with TrFN
Table 2. Comparison of unified total profit function using two different solution algorithms.
ModelUnified Total ProfitCPU Time (In Seconds)
KDPMG Algorithm GA KDPMG Algorithm GA
Case 1236,035.924236,035.1270.0180.67
Case 2245,167.565245,167.1300.0020.14
Case 3256,392.849256,375.6340.0060.29
Case 4266,482.519266,239.8010.0080.22
Table 3. Final values of decision variables and unified total profit function.
Q ψ Unified Total Profit
Case 1248.385-236,035.924
Case 2249.92-245,167.565
Case 3404.522 2.9 × 10 5 256,392.849
Case 4412.4662.7 × 10−5266,482.519
Table 4. Comparison of changes in the values of the decision variables of the model using TrFN demand versus TFN demand.
With SMT TechnologyQ ψ Unified Total Profit
TrFN demand↑ *↓ *
% change1.96−6.93.94
* ↑ and ↓ represent the increasing and decreasing trends, respectively.
Disclaimer/Publisher’s Note: The statements, opinions and data contained in all publications are solely those of the individual author(s) and contributor(s) and not of MDPI and/or the editor(s). MDPI and/or the editor(s) disclaim responsibility for any injury to people or property resulting from any ideas, methods, instructions or products referred to in the content.

