
Application of Intercriteria and Regression Analyses and Artificial Neural Network to Investigate the Relation of Crude Oil Assay Data to Oil Compatibility

 ,
,  , , , ,
  ,
, 
Abstract
:1. Introduction
2. Materials and Methods
2.1. Analytical Procedures for Crude Oil Assay
2.2. Compatibility Indexes and Models for Crude Oil Colloidal Stability Prediction
2.2.1. Compatibility Model of Nemana et al.
- KCO—characterization factor of crude oil;
- KH—characterization factor of n-heptane = 12.72 [66];
- KT—characterization factor of toluene = 10.15 [66].
- Meabp—mean average boiling point, °R.
- Kch—characterization factor of the blend petroleum/n-heptane at the point of initial sludge settling.
- Sp critical max—maximum value of the critical solvent power of the petroleums that are part of the mixture.
2.2.2. Modified Compatibility Model of Nemana et al.
- -
- Characterization factor was estimated using the evaporation temperature of 50% of crude oil from TBP distillation—T50%;
- -
- xco—weight part of crude oil in the blend petroleum/n-heptane;
- xH—weight part of n-heptane in blend petroleum/n-heptane at the initial sediment precipitation point.
2.2.3. Colloidal Instability Index
2.2.4. Oil Compatibility Model
- Vi—volume of i crude oil in the blend, mL;
- SBNi—solubility number of i crude oil in the blend.
2.3. Intercriteria Analysis
3. Results and Discussion
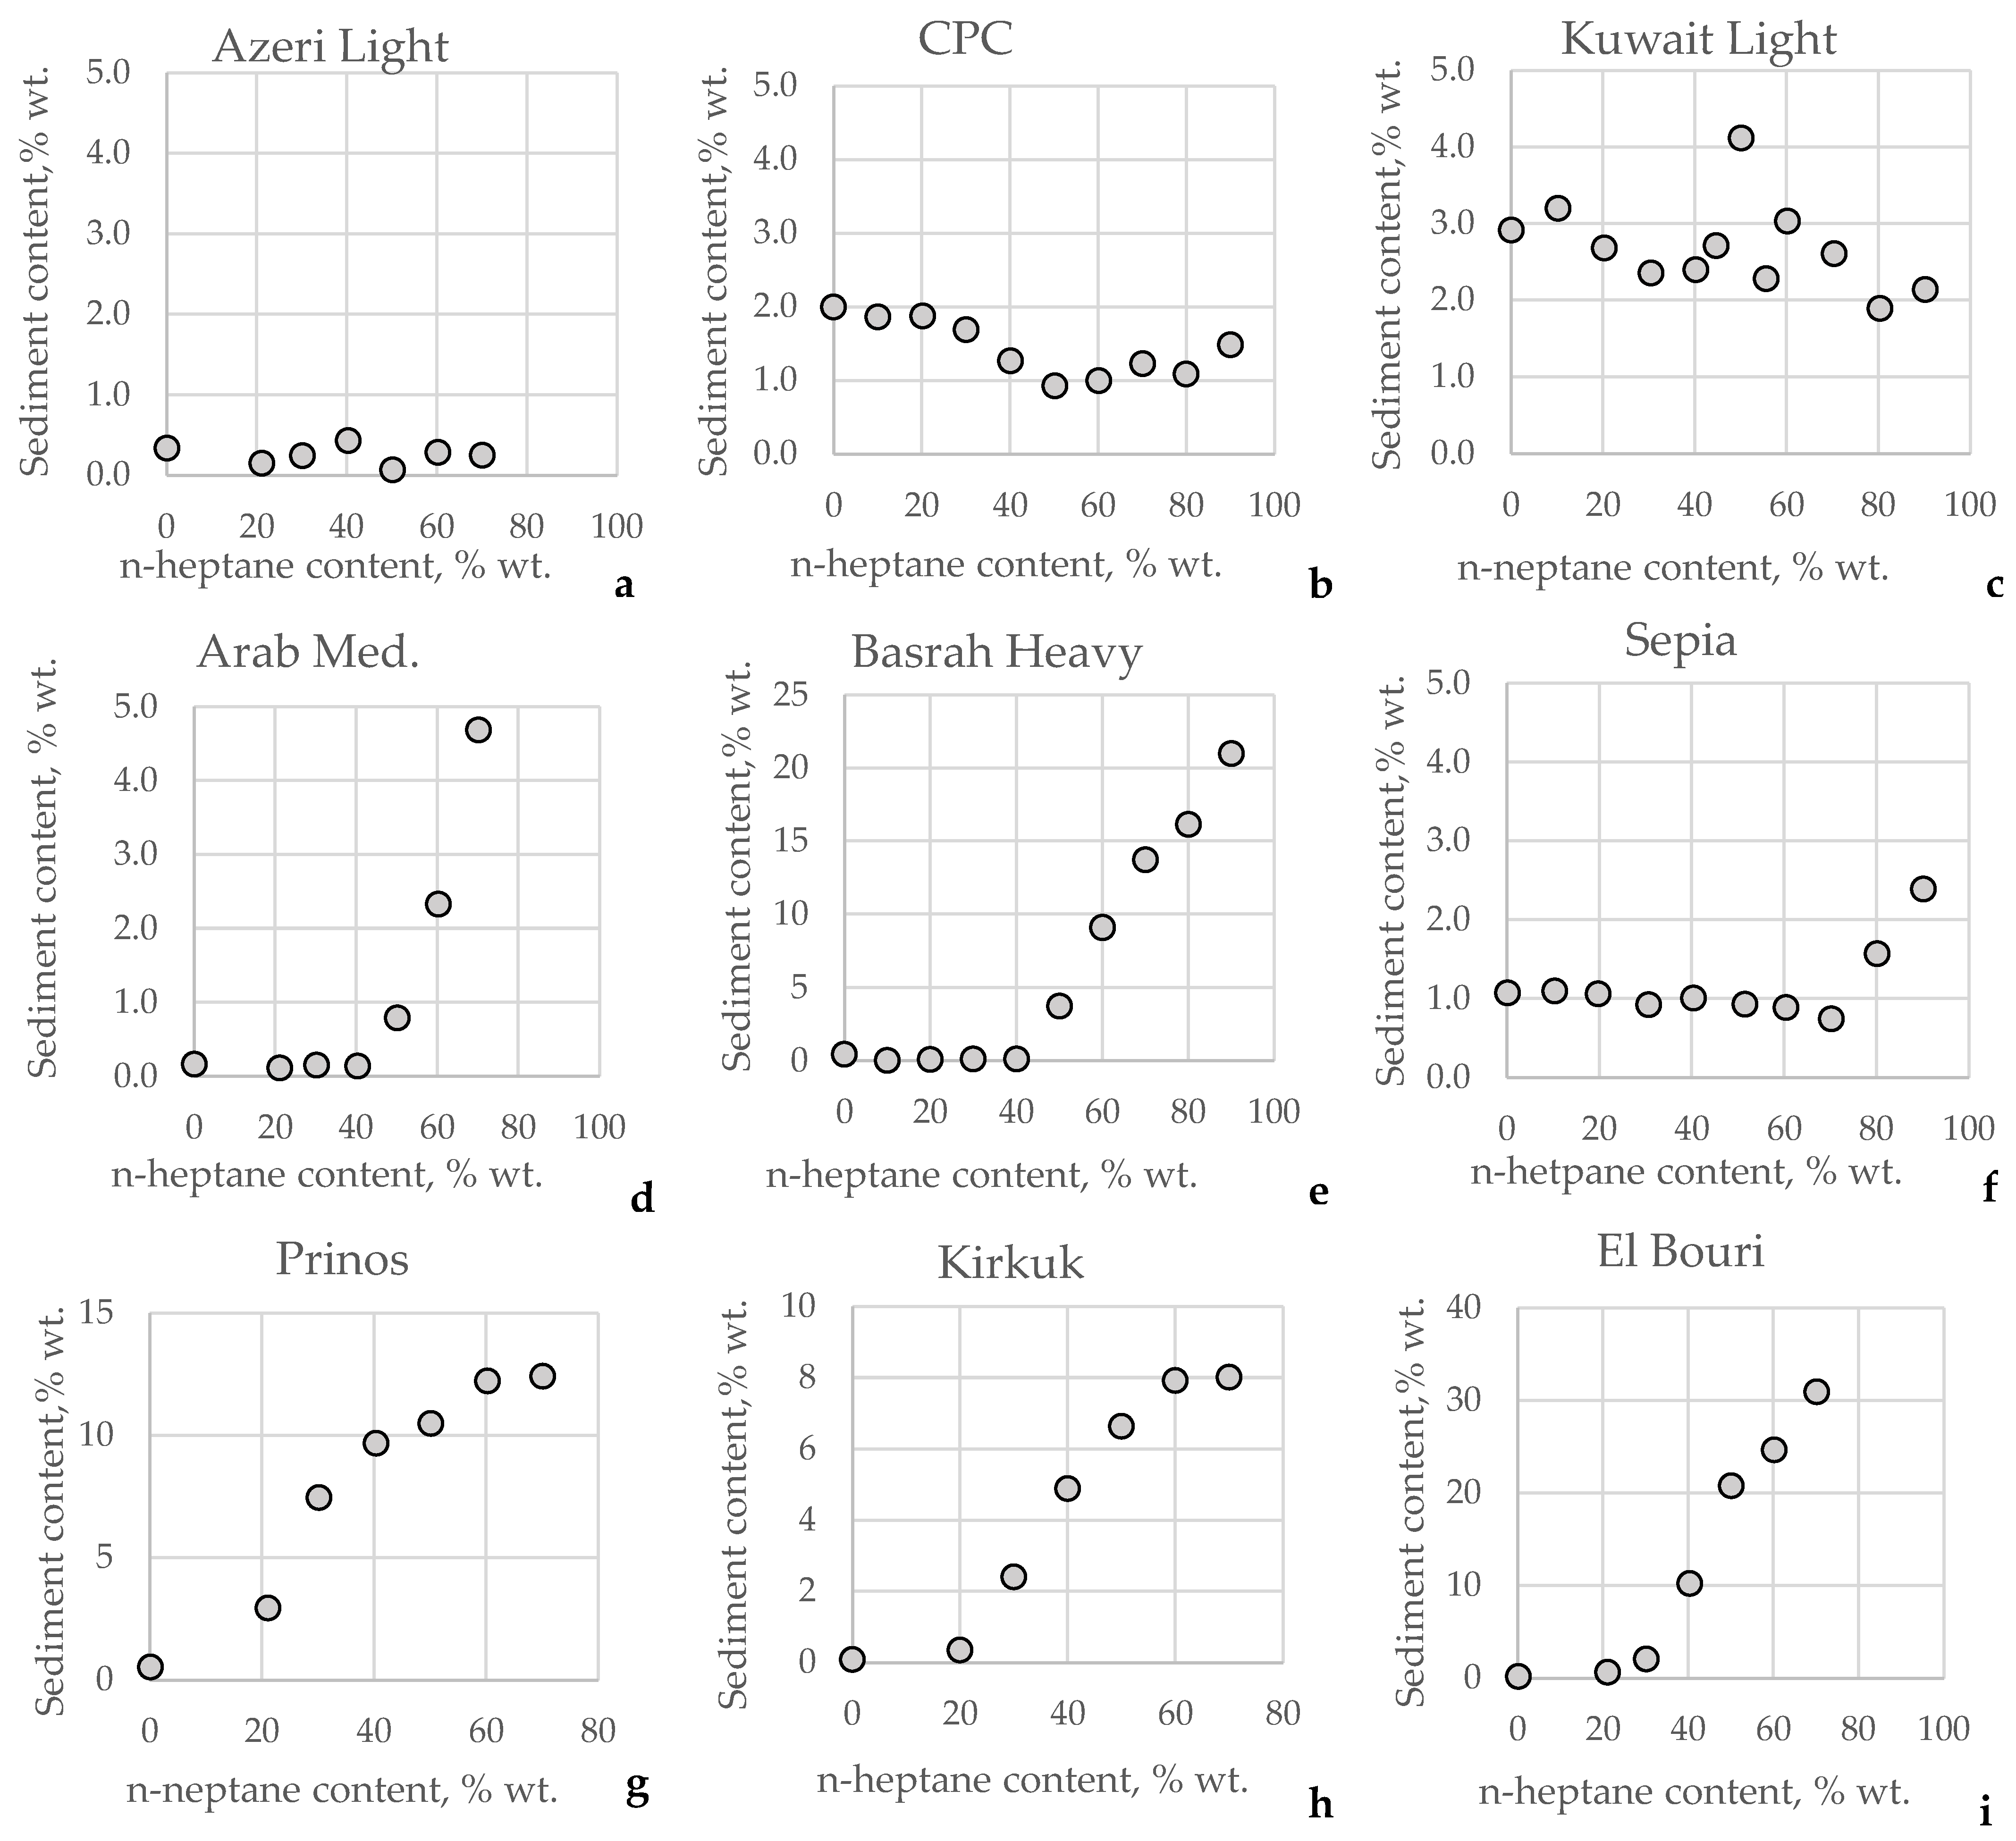
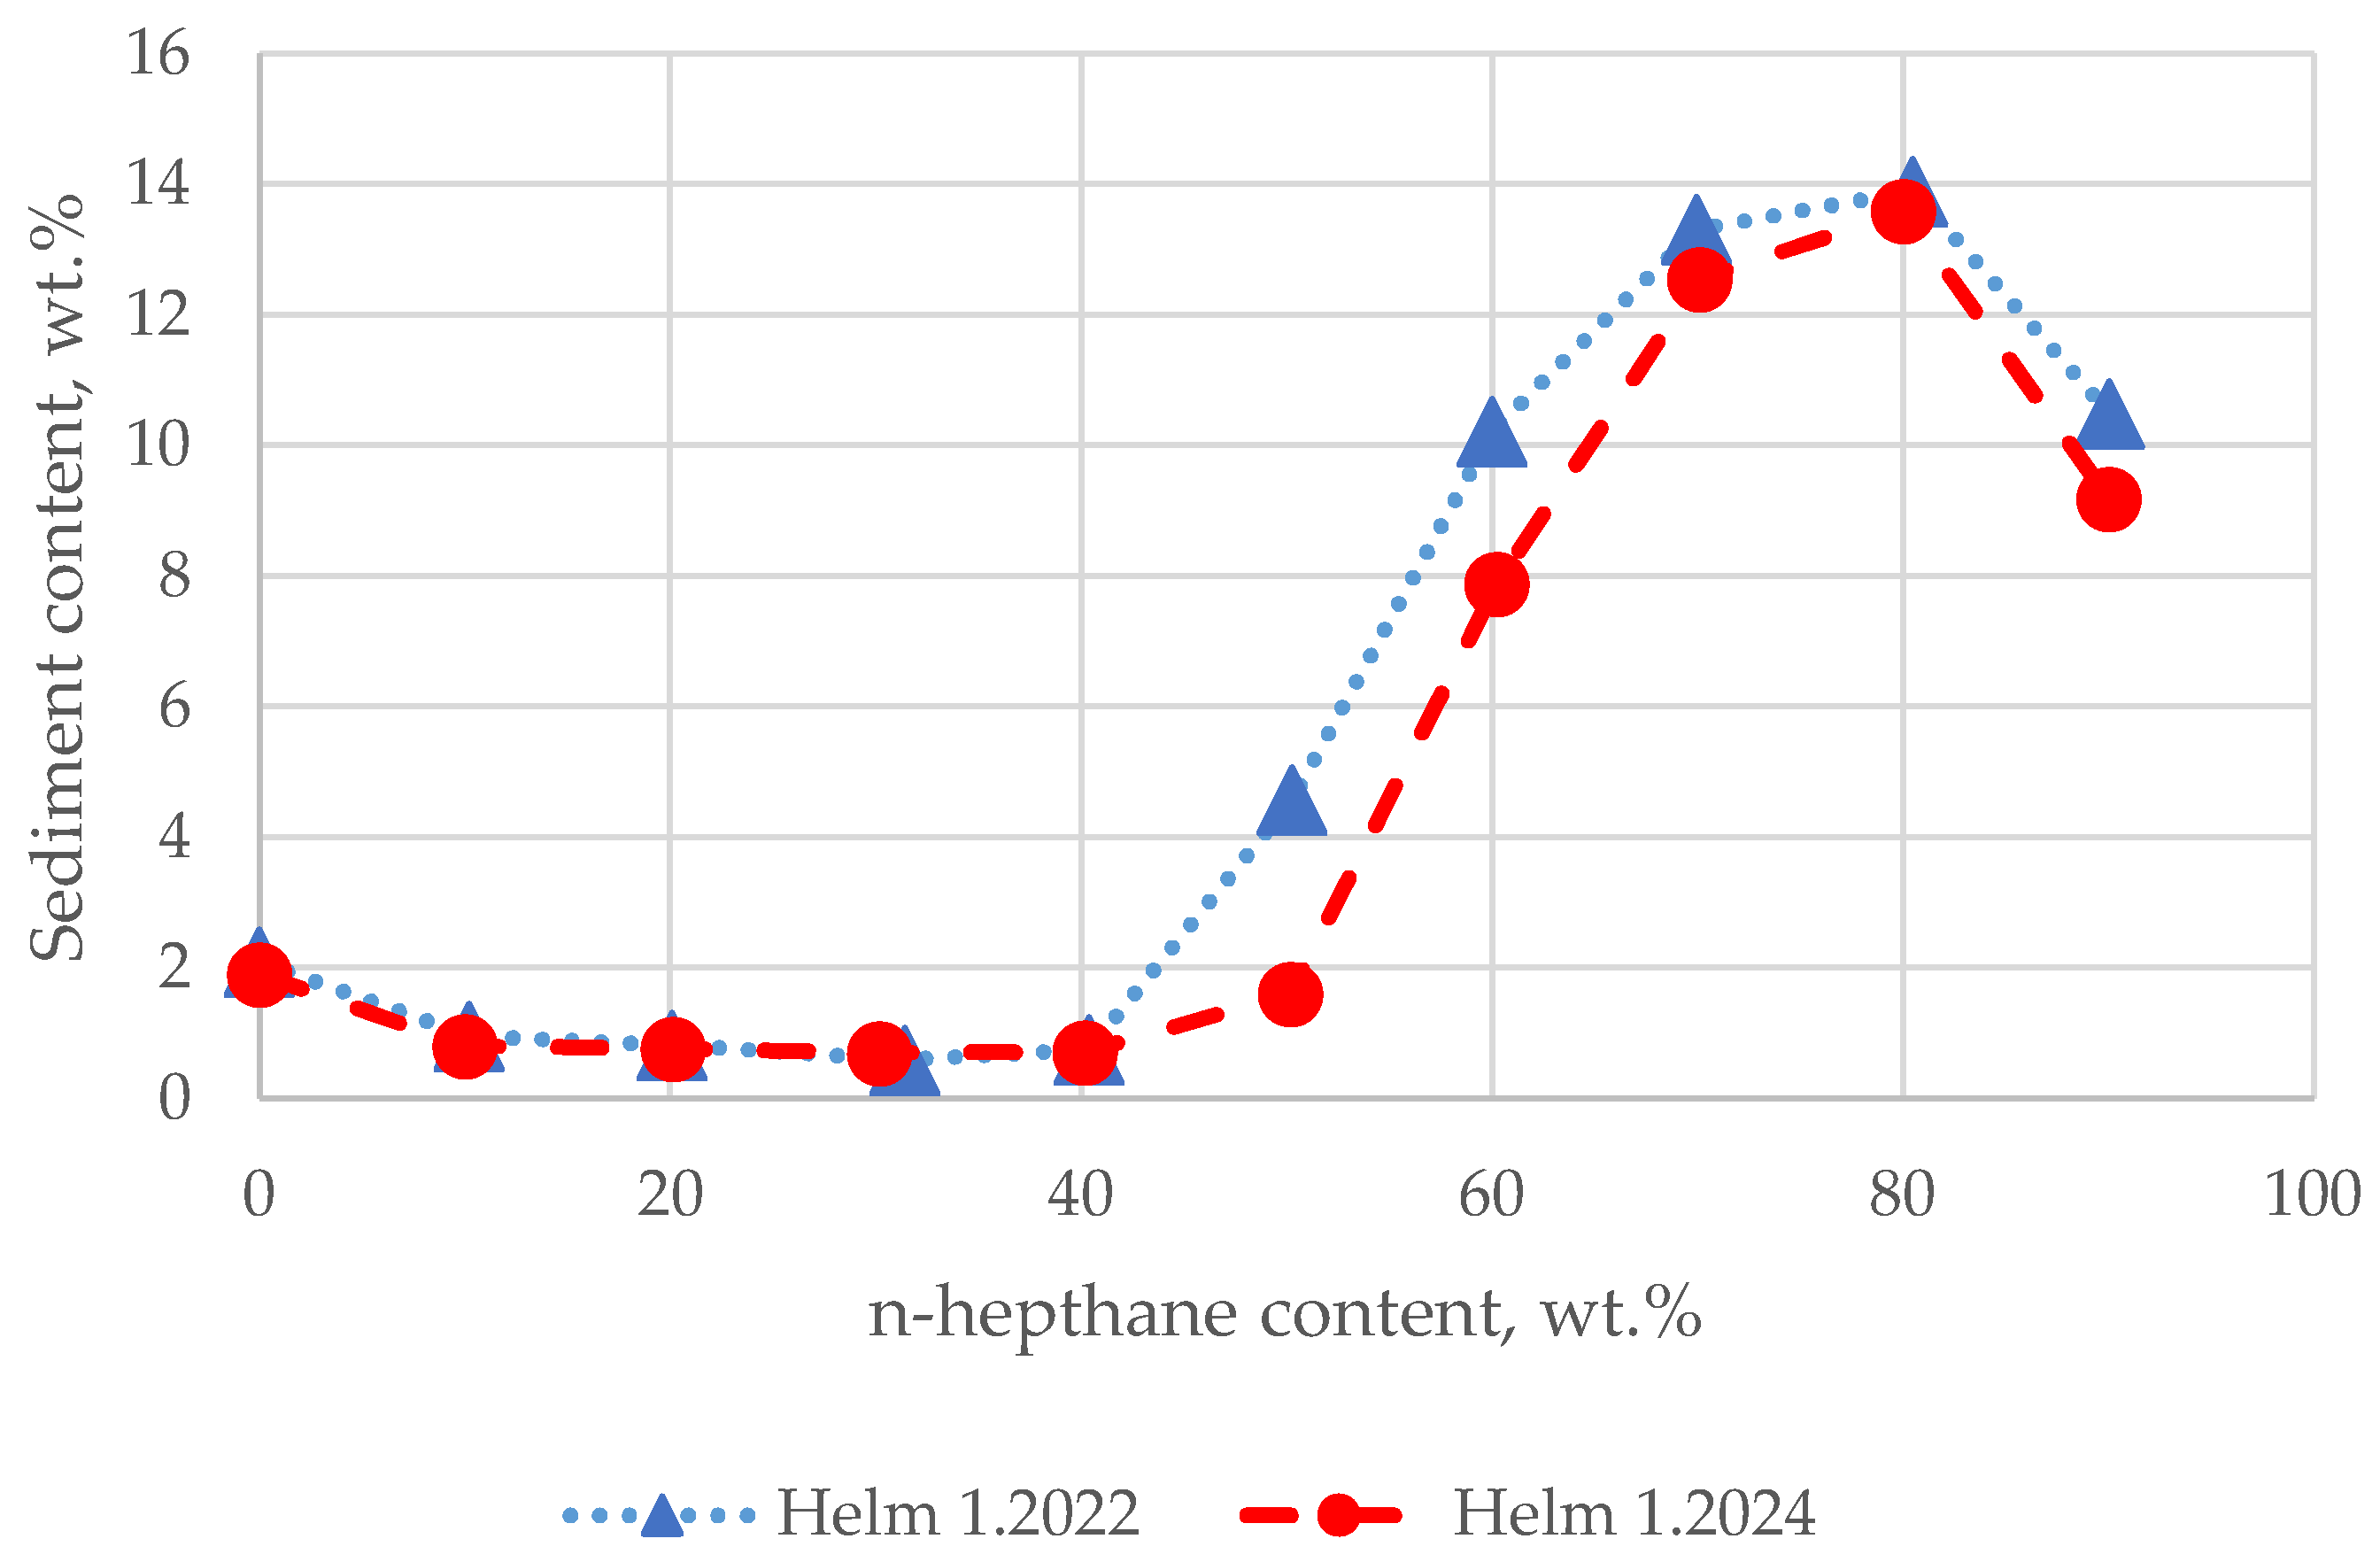
3.1. Heptane Dilution Test Results
3.2. Crude Oil Properties and Compatibility Index Relations
- COD15 = density of crude oil at 15 °C, g/cm3;
- VRD15 = density of vacuum residue fraction of crude oil at 15 °C, g/cm3;
- T50 = true boiling point temperature at 50% evaporation of crude oil. °C.
4. Conclusions
- The determination of the Sp critical by the original method of Nemana calculating the Kw-characterization factor by using the distillation characteristics of the mixture crude oil–n-heptane at the onset of asphaltene precipitation may report inconsistent results. Thus, the modification of Nemana’s method is proposed that calculates the Kw-characterization of the blend crude oil–n-heptane at the onset of asphaltene flocculation as a sum of the crude oil Kw factor multiplied by its weight part at the point of asphaltene onset precipitation, and the Kw factor of n-heptane multiplied by its weight part in the admixture.
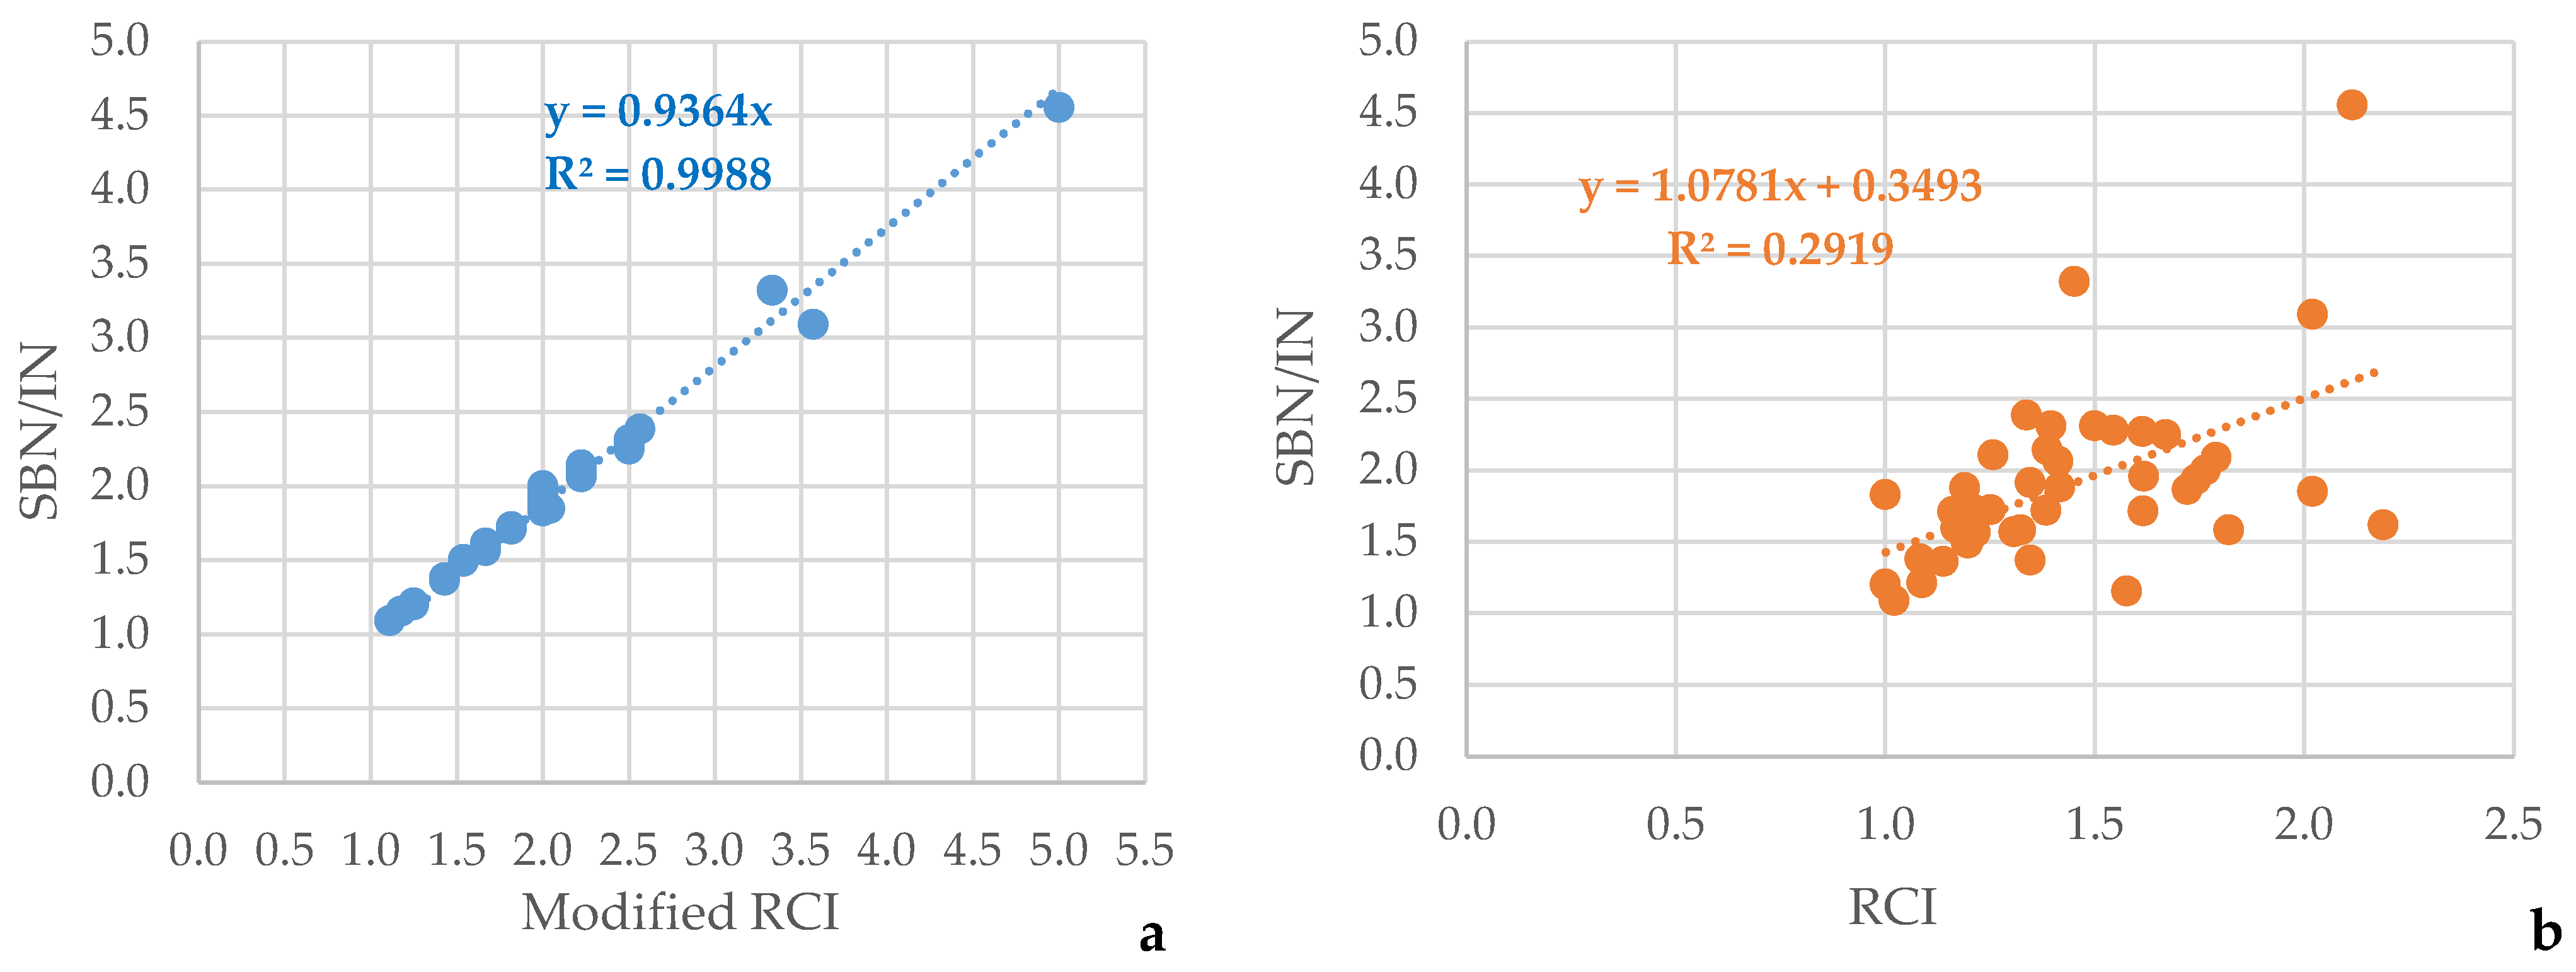
- The ratio strongly correlates with the modified relative stability index with a squared correlation coefficient of R2 = 0.9873, while with the original RCI of Nemana, it does not correlate well (R2 = 0.2919).
- By employing intercriteria analysis, it was found that the crude oil characteristics involved in a crude assay do not exhibit any statistically meaningful relation to the compatibility indices determined by using the n-heptane dilution test. The Kw-factor of the vacuum residue fraction of the crude oils that is determined on the basis of the density and high-temperature simulated distillation of the vacuum residue demonstrates a negative consonance (μ = 0.24; υ = 0.74) with the insolubility number, which is very close to the threshold of ICrA defined for statistically meaningful negative consonance (μ = 0.25; υ = 0.75). This finding is in line with our earlier research, indicating that the higher the aromaticity of the vacuum residue, the higher the insolubility number of its asphaltene fraction [12].
- By using regression analysis of the data generated in this work, a correlation was developed that shows that the Sp critical increases with the enhancement of the vacuum residue fraction’s density, crude oil density augmentation, and crude oil T50% reduction. This correlation confirms the earlier statement that the higher the vacuum residue aromaticity (density, Conradson carbon content), the lower its asphaltene fraction solubility.
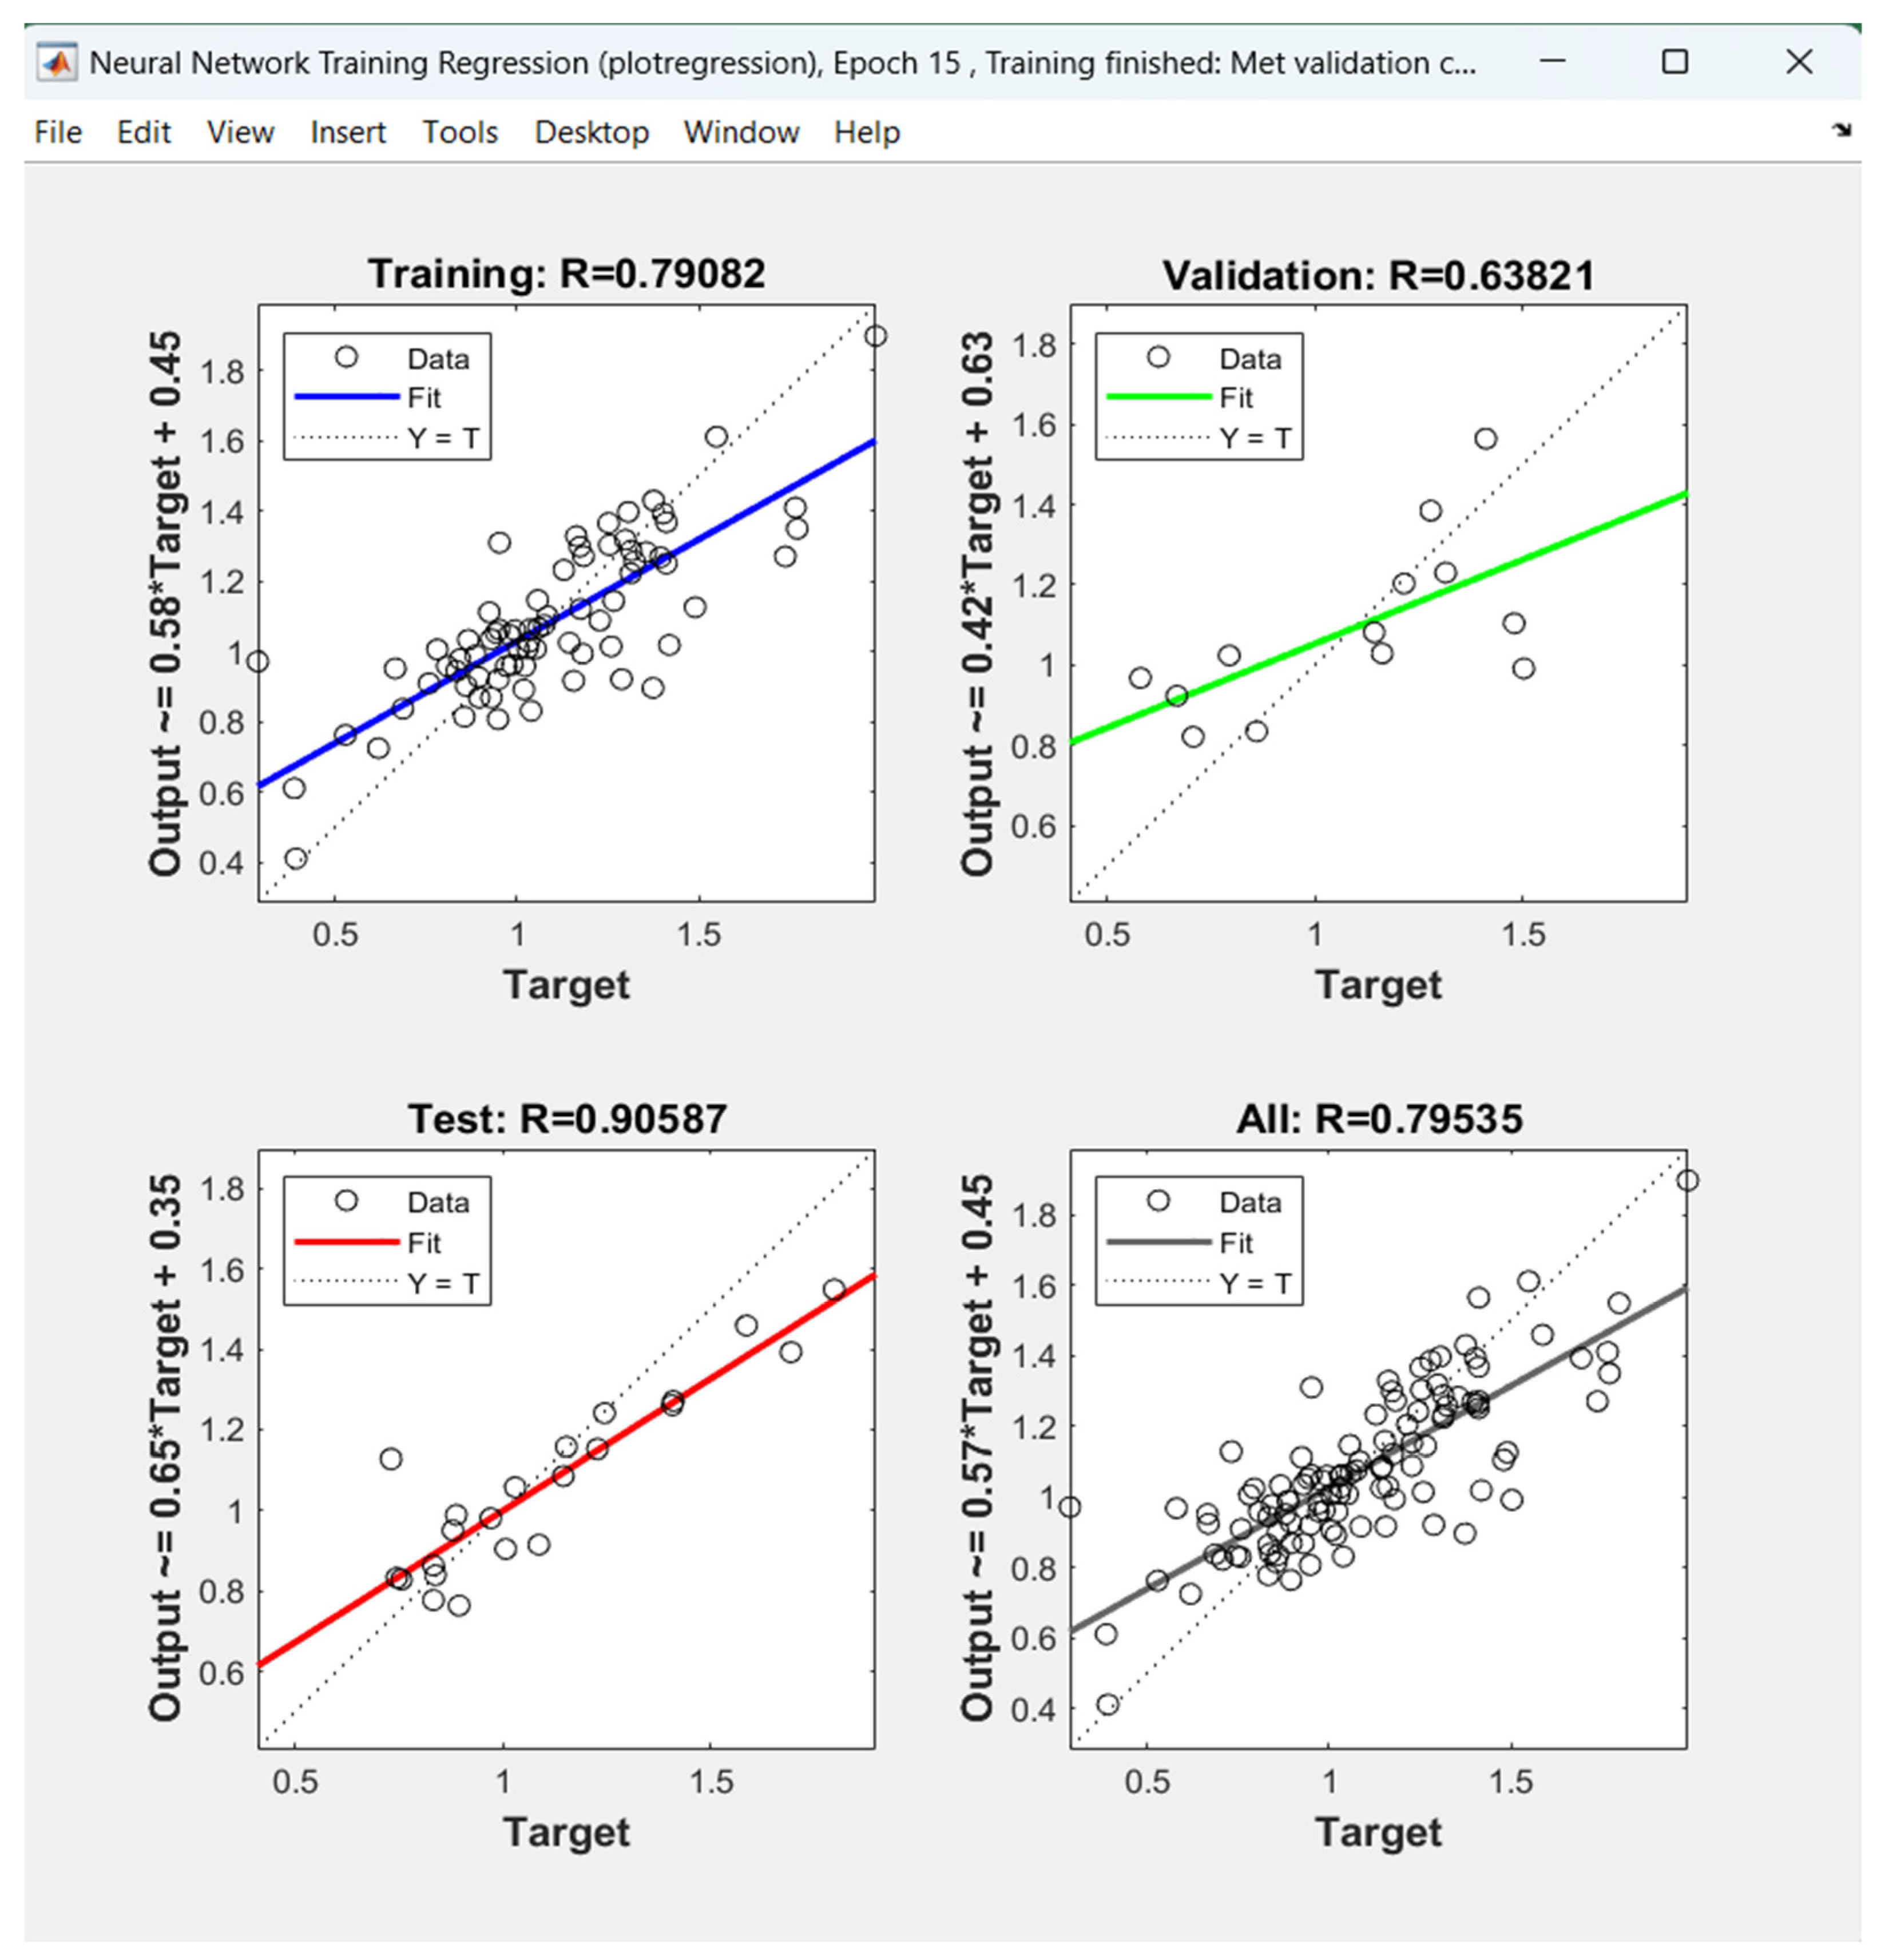
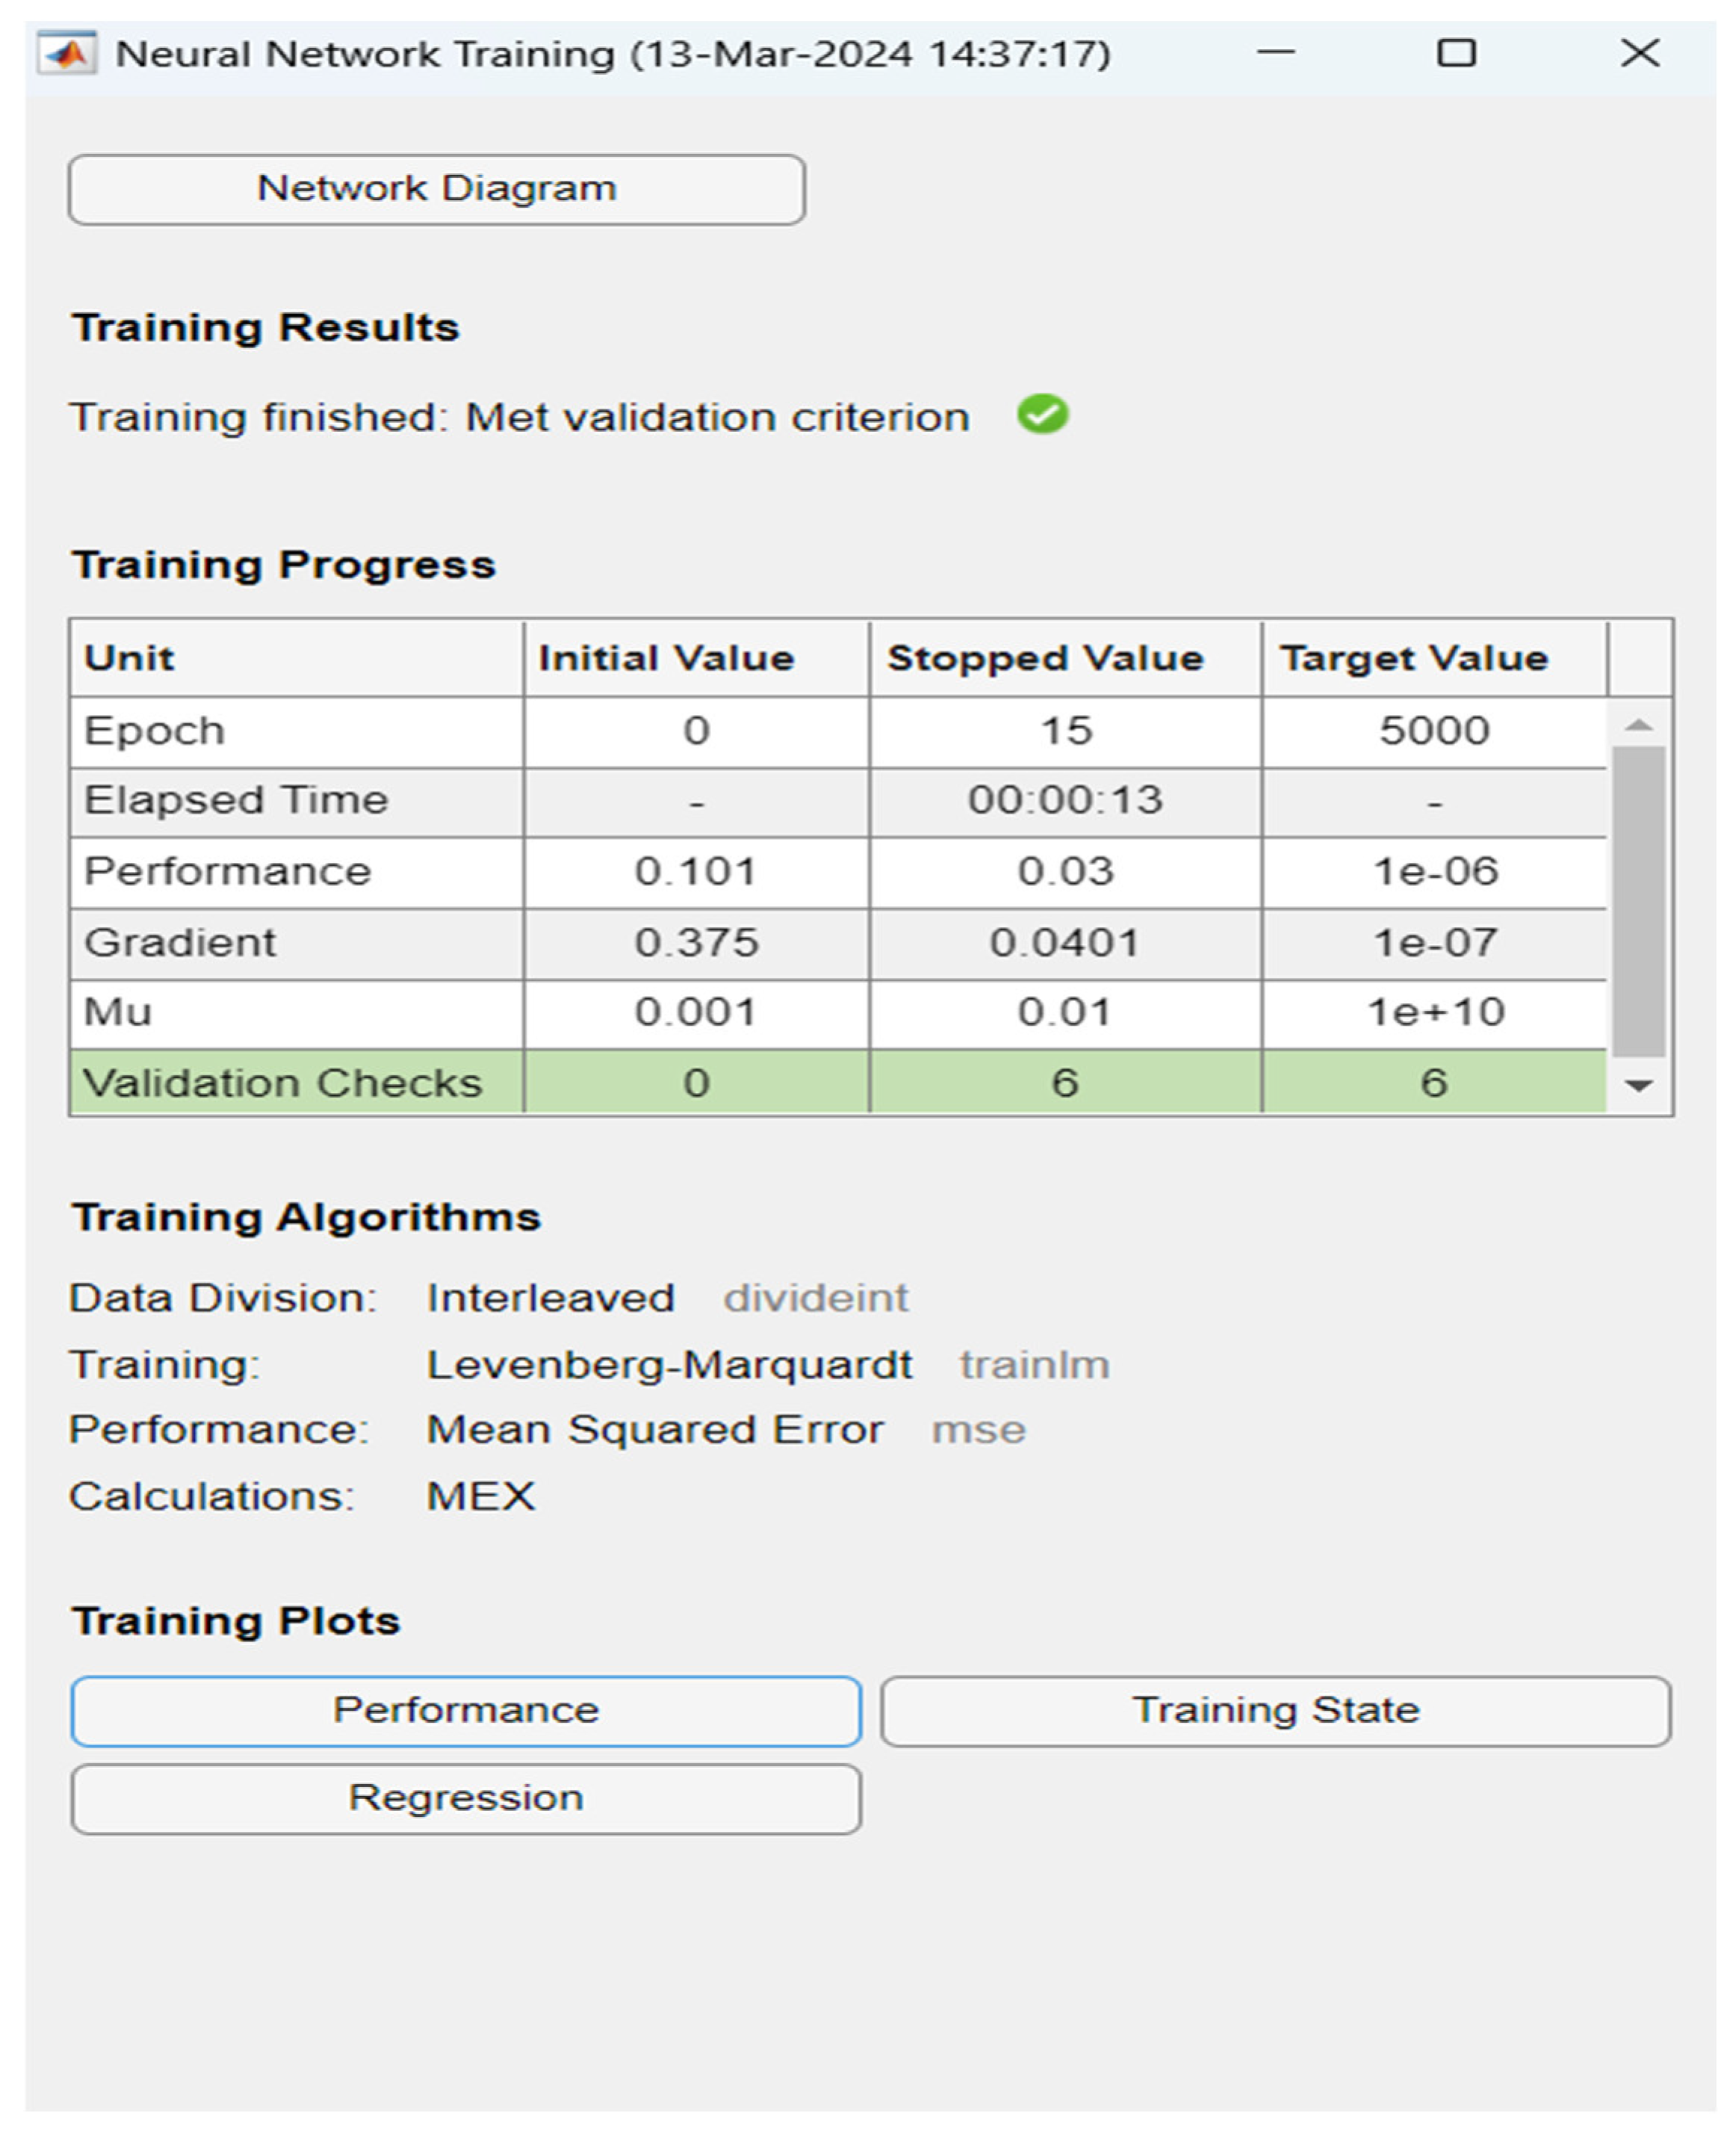
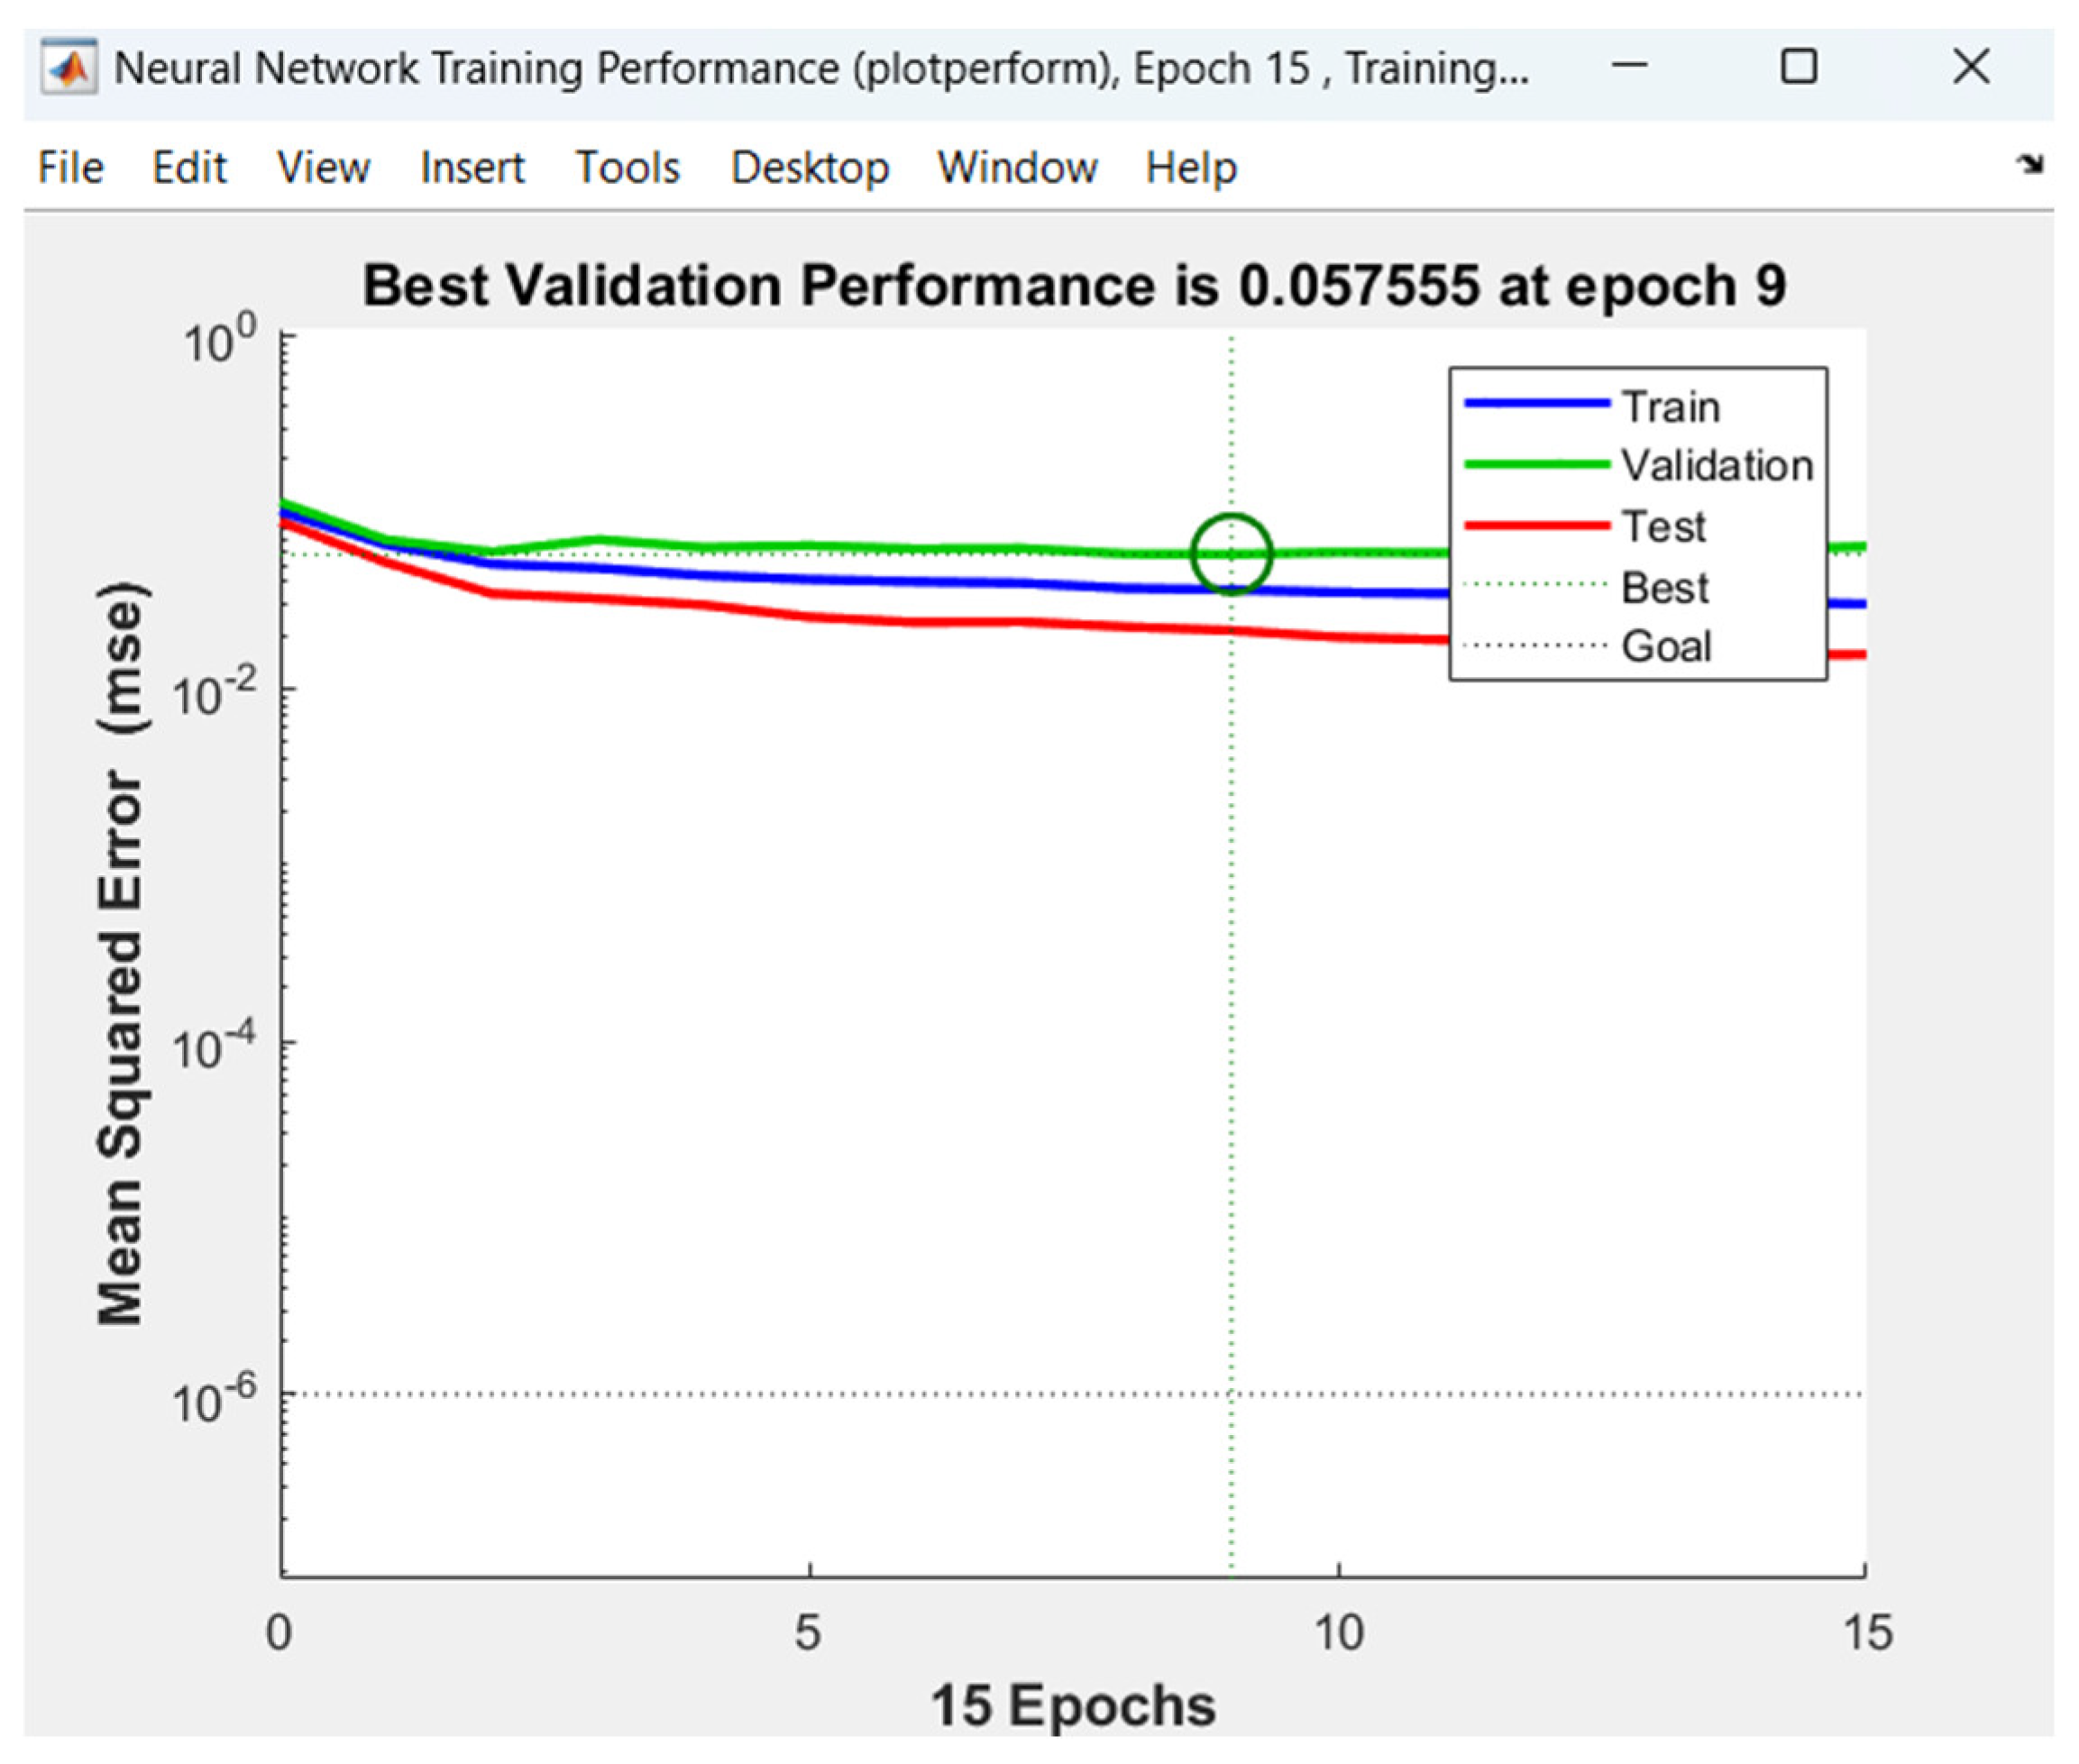
- Artificial neural network modeling was also applied in this work. The ANN model of the Sp critical, however, in contrast to the reports in other studies modeling other petroleum properties by ANN, did not show a better prediction ability than that of the regression model.
- The ICrA evaluation of the petroleum properties and those of the products obtained by vacuum residue hydrocracking, whose conversion is thermal, showed a clear similarity between both, which supports the perception that the petroleum was formed by thermal cracking in the Earth’s bowels.
- A future study directed toward searching for the link between kerogen type and maturity of a crude oil may improve the accuracy of the prediction of oil compatibility indices.
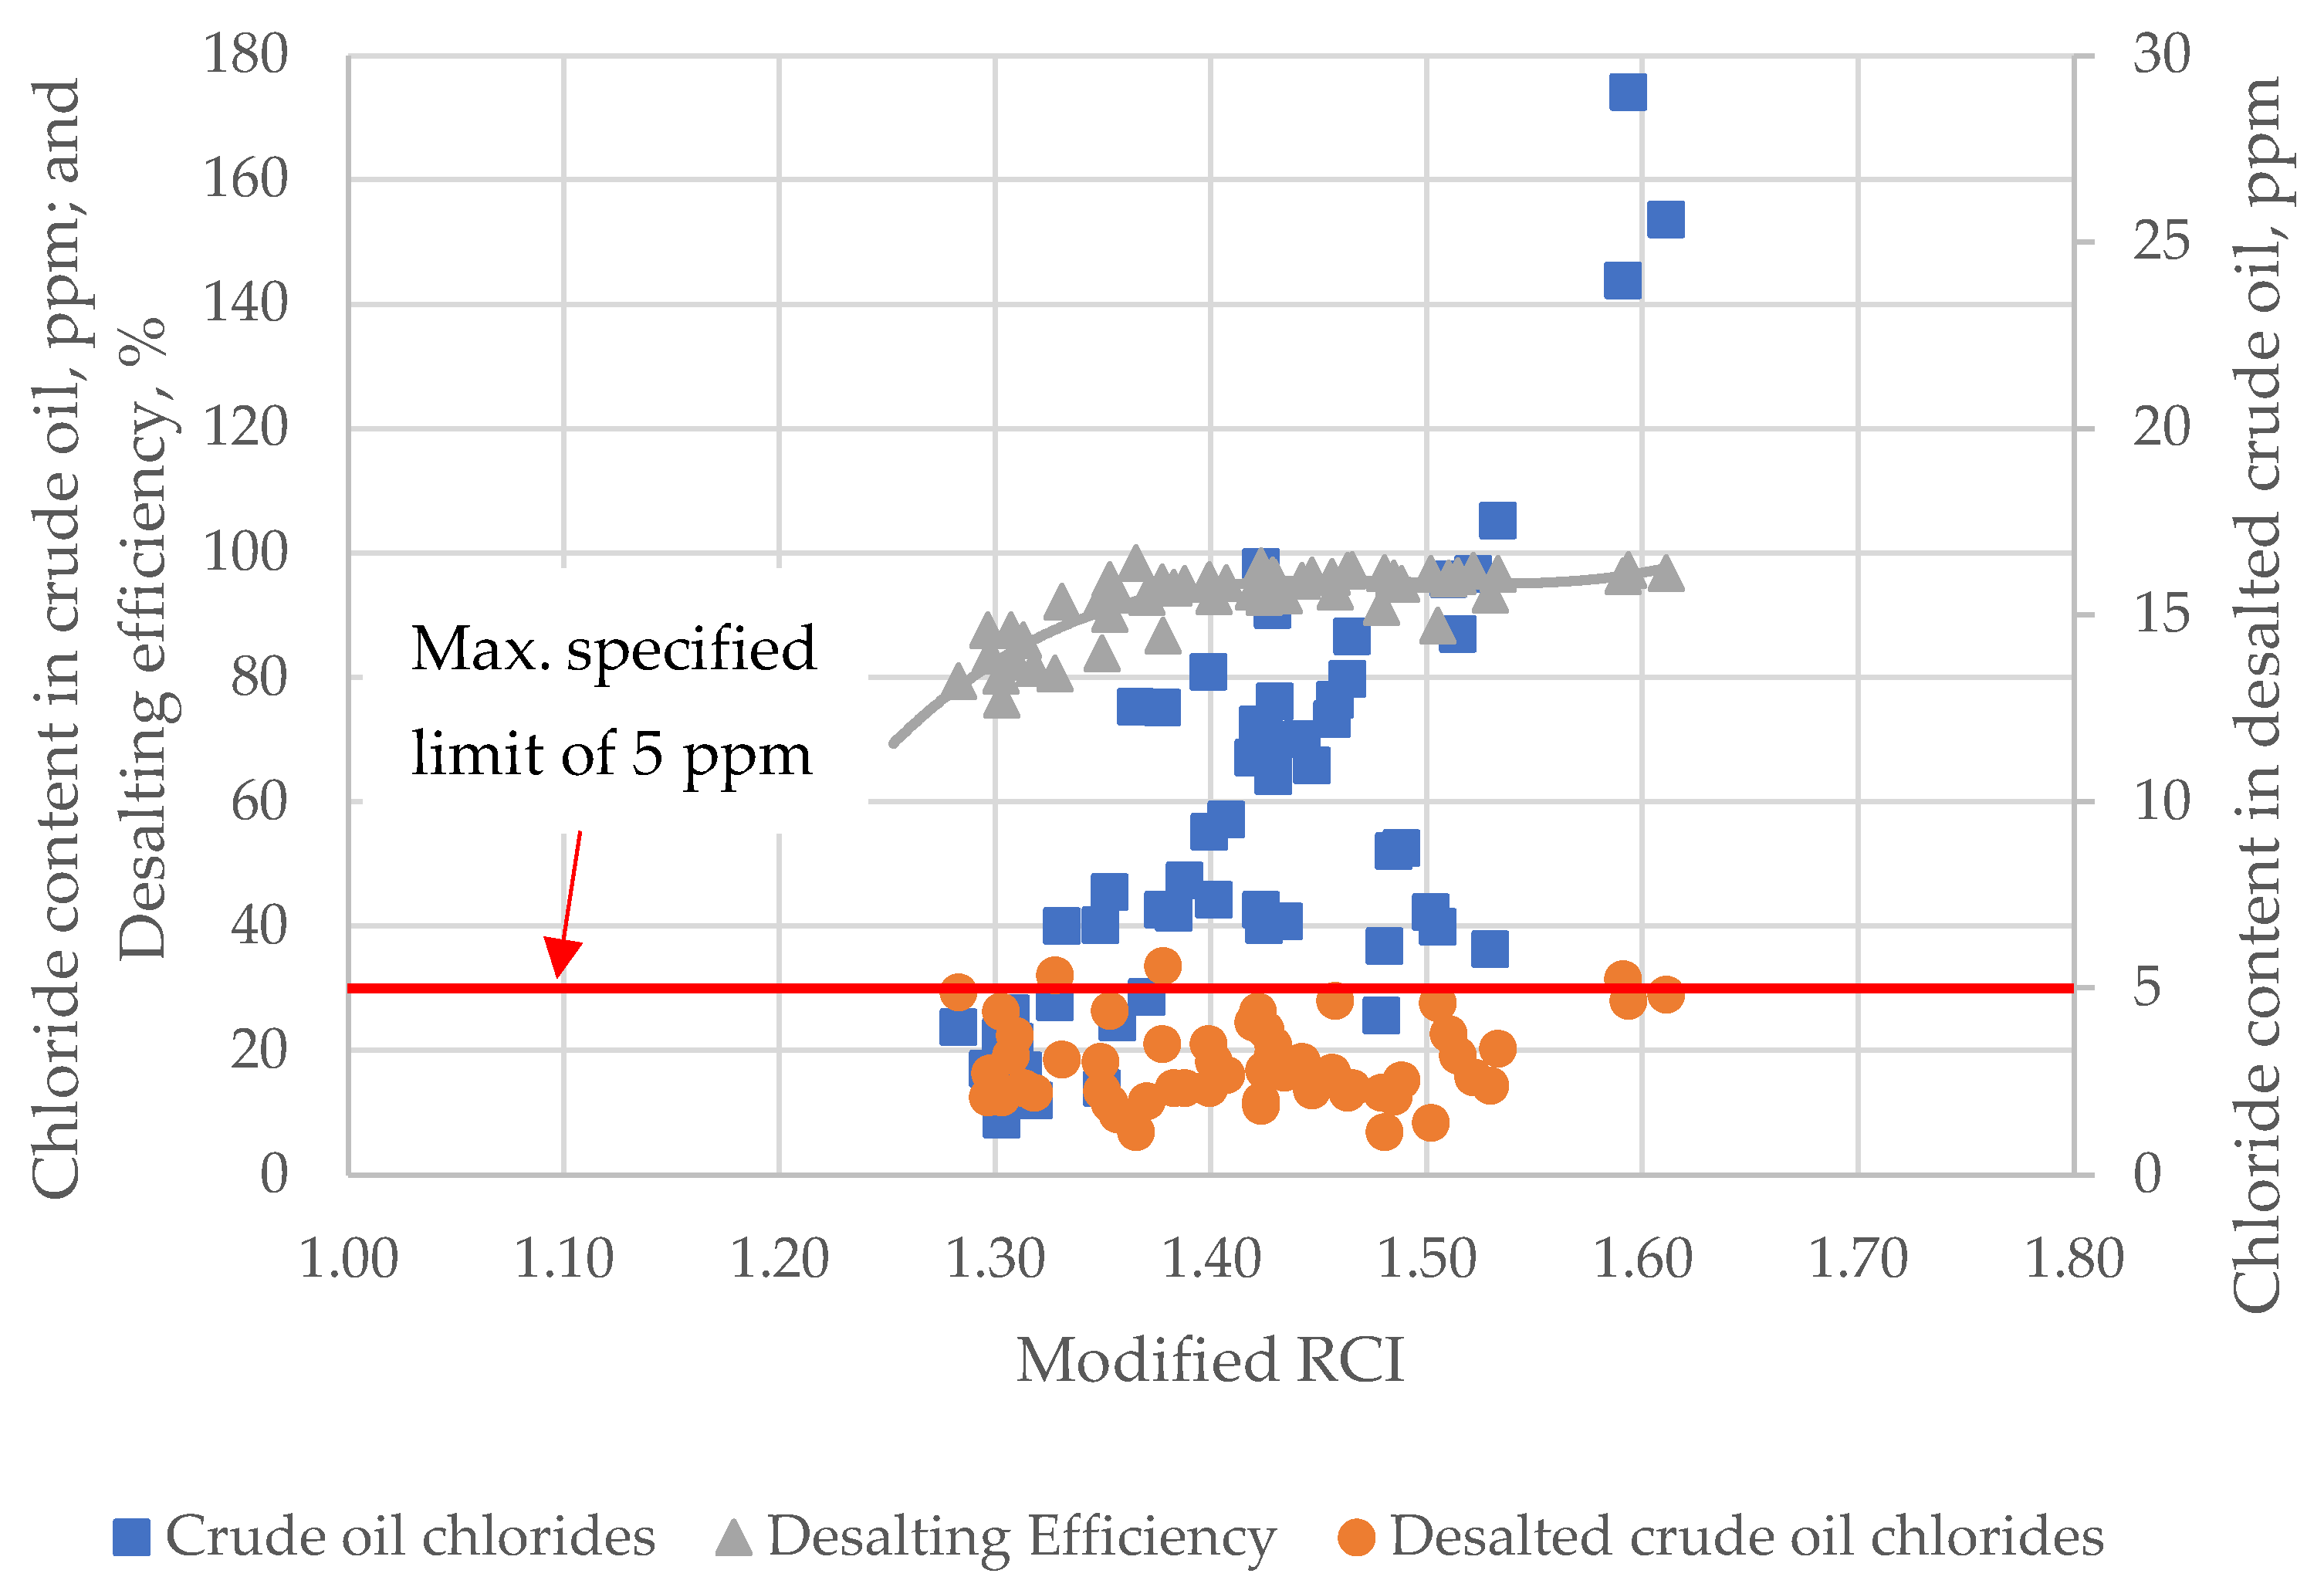
- It was found that the efficiency of crude oil desalting starts to decline when the modified RCI drops below 1.4, confirming Wiehe’s conclusion that the ratio , or its equivalent modified RCI, should be kept no lower than 1.4 to avoid any fouling or other incompatibility issues [4].
Supplementary Materials
Author Contributions
Funding
Data Availability Statement
Conflicts of Interest
Nomenclature
| A | Aromatics content |
| ANN | Artificial neural network |
| AR | Atmospheric residue |
| Aro | Aromatics |
| Asph | Asphaltenes |
| C5-asp | Content of asphaltenes insoluble in n-pentane, wt.% |
| C7-asp | Content of asphaltenes insoluble in n-heptane, wt.% |
| CII | Colloidal instability index |
| CII (C5) | Colloidal instability index based on C5 asphaltene content |
| CII (C7) | Colloidal instability index based on C7 asphaltene content |
| CO | Crude oil |
| CSI | Colloidal stability index |
| D15 | Density at 15 °C, g/cm3 |
| DBASE | Density based asphaltene stability envelope |
| HD | Heptane dilution |
| HTSD | High-temperature simulant distillation |
| IBP | Initial boiling point |
| ICrA | Intercriteria analysis |
| IN | Insolubility index |
| JM | Jamaluddin method |
| Kco | Characterization factor of crude oil |
| Khp | Characterization factor of n-heptane |
| Kt | Characterization factor of toluene |
| Kw | Watson characterization factor |
| MJM | Modified Jamaluddin method |
| ND | Not determined |
| P | Heithaus parameter |
| PTB | Pounds of salt per thousand barrels of oil |
| QQA | Qualitative–quantitative analysis |
| RCI | Relative compatibility index |
| Res | Resins |
| SARA | Saturates, aromatics, resins, asphaltenes |
| Sat | Saturates |
| SBN | Solubility blending number |
| SCP | Stability cross plot |
| SG | Specific gravity |
| SI | Stability index |
| SN | Separability number |
| SP | Stankiewicz plot |
| Sp | Solvent power |
| Sp blend | Solvent power of petroleum blend |
| Sp critical | Critical solvent power |
| T10 | Boiling point of evaporate at 10%, °C |
| T30 | Boiling point of evaporate at 30%, °C |
| T50 | Boiling point of evaporate at 50%, °C |
| T50 | Boiling point of evaporate at 50%, °C |
| T70 | Boiling point of evaporate at 70%, °C |
| T90 | Boiling point of evaporate at 90%, °C |
| TBP | True boiling point |
| TBP yield (>540 °C) | Yield of TBP fraction >540 °C, wt.%; |
| TBP yield (110–180 °C) | Yield of TBP fraction 110–180 °C, wt.% |
| TBP yield (180–240 °C) | Yield of TBP fraction 180–240 °C, wt.%; |
| TBP yield (360–540 °C) | Yield of TBP fraction 360–540 °C, wt.%; |
| TBP yield (IBP–110 °C) | Yield of TBP fraction IBP–110 °C, wt.%; |
| TBP yield (IBP–360 °C) | Yield of TBP fraction IBP–360 °C, wt.%; |
| TE | Toluene equivalence |
| WDCO | Western Desert crude oil |
| δCO | Solubility parameter values of crude oil |
| μ | Positive consonance |
| υ | Negative consonance |
| Χi | Weight fraction of i component |
References
- Wiehe, I.A.; Kennedy, R.J. Oil compatibility model and crude oil incompatibility. Energy Fuels 2000, 14, 56–59. [Google Scholar] [CrossRef]
- Wiehe, I.A.; Kennedy, R. Application of the oil compatibility model to refinery streams. Energy Fuels 2000, 14, 60–63. [Google Scholar] [CrossRef]
- Wiehe, I.A. Process Chemistry of Petroleum Macromolecules, 1st ed.; Taylor & Francis Group, CRC Press: Boca Raton, FL, USA, 2008. [Google Scholar]
- Wiehe, I.A.; Kennedy, R.; Dickakian, G. Fouling of nearly incompatible oils. Energy Fuels 2001, 15, 1057–1058. [Google Scholar] [CrossRef]
- Wiehe, I.A. Asphaltene solubility and fluid compatibility. Energy Fuels 2012, 26, 4004–4016. [Google Scholar] [CrossRef]
- Wiehe, I.A. Self-incompatible crude oils and converted petroleum resids. J. Dispers. Sci. Technol. 2004, 25, 333–339. [Google Scholar] [CrossRef]
- ASTM D7112; Standard Test Method for Determining Stability and Compatibility of Heavy Fuel Oils and Crude Oils by Heavy Fuel Oil Stability Analyzer (Optical Detection). ASTM International: West Conshohocken, PA, USA, 2019; Volume 05.03.
- ASTM D7157-22e1; Standard Test Method for Determination of Intrinsic Stability of Asphaltene-Containing Residues, Heavy Fuel Oils, and Crude Oils (n-Heptane Phase Separation; Optical Detection). ASTM International: West Conshohocken, PA, USA, 2022; Volume 05.03.
- ASTM D7061-19e1; Standard Test Method for Measuring n-Heptane Induced Phase Separation of Asphaltene-Containing Heavy Fuel Oils as Separability Number by an Optical Scanning Device. ASTM International: West Conshohocken, PA, USA, 2019; Volume 05.03.
- Van den Berg, F.G.A. History and Review of Dual Solvent Titration Methods. Energy Fuels 2022, 36, 8639–8648. [Google Scholar] [CrossRef]
- Mitkova, M.; Stratiev, D.; Shishkova, I.; Dobrev, D. Thermal and Thermo-Catalytic Processes for Heavy Oil Conversion; Professor Marin Drinov Publishing House of Bulgarian Academy of Sciences: Veliko Tarnovo, Bulgaria, 2017; Volume 13. [Google Scholar]
- Stratiev, D.; Shishkova, I.; Nedelchev, A.; Kirilov, K.; Nikolaychuk, E.; Ivanov, A.; Sharafutdinov, I.; Veli, A.; Mitkova, M.; Tsaneva, T.; et al. Investigation of relationships between petroleum properties and their impact on crude oil compatibility. Energy Fuels 2015, 29, 7836–7854. [Google Scholar] [CrossRef]
- Rogel, E.; Hench, K.; Miao, T.; Lee, E.; Dickakian, G. Evaluation of the compatibility of crude oil blends and its impact on fouling. Energy Fuels 2018, 32, 9233–9242. [Google Scholar] [CrossRef]
- Xiong, R.; Guo, J.; Kiyingi, W.; Feng, H.; Sun, T.; Yang, X.; Li, Q. Method for judging the stability of asphaltenes in crude oil. ACS Omega 2020, 5, 21420–21427. [Google Scholar] [CrossRef]
- Alimohammadi, S.; Zendehboudi, S.; James, L. A Comprehensive review of asphaltene deposition in petroleum reservoirs: Theory, challenges, and tips. Fuel 2019, 252, 753–791. [Google Scholar] [CrossRef]
- Izadpanahi, A.; Azin, R.; Osfouri, S.; Malakooti, R. Modeling of asphaltene precipitation in a light oil reservoir with high producing GOR: Case study. Adv. Nano. Energy 2019, 3, 270–279. [Google Scholar]
- Savage, G.; Sawhney, K. Light tight oil crude unit fouling root causes and troubleshooting. PTQ Shale 2015, 2015, 19–22. [Google Scholar]
- Ashoori, S.; Sharifi, M.; Masoumi, M.; Mohammad Salehi, M. The relationship between SARA fractions and crude oil stability. Egypt. J. Pet. 2017, 26, 209–213. [Google Scholar] [CrossRef]
- Sulaimon, A.A.; De Castro, J.K.M.; Vatsa, S. New correlations and deposition envelopes for predicting asphaltene stability in crude oils. J. Pet. Sci. Eng. 2020, 190, 106782. [Google Scholar] [CrossRef]
- Hascakir, B. A New approach to determine asphaltenes stability. In Proceedings of the SPE Annual Technical Conference and Exhibition, San Antonio, TX, USA, 9–10 October 2017. [Google Scholar]
- Kumar, R.; Voolapalli, R.K.; Upadhyayula, S. Prediction of crude oil blends compatibility and blend optimization for increasing heavy oil processing. Fuel Process. Technol. 2018, 177, 309–327. [Google Scholar] [CrossRef]
- Likhatsky, V.V.; Syunyaev, R.Z. New colloidal stability index for crude oils based on polarity of crude oil components. Energy Fuels 2010, 24, 6483–6488. [Google Scholar] [CrossRef]
- Jamaluddin, A.K.M.; Nazarko, T.W.; Sills, S.; Fuhr, B.J. Deasphalted Oil: A natural asphaltene solvent. SPE Prod. Facil. 1996, 11, 161–165. [Google Scholar] [CrossRef]
- Stankiewicz, A.; Flannery, M.D.; Fuex, N.A.; Broze, J.G.; Coach, J.L.; Dubey, S.T.; Leitko, A.D.; Nimmons, J.F.; Iyer, S.D.; Ratulowski, J. Prediction of asphaltene deposition risk in E&P operations. In Proceedings of the International Conference on Petroleum Phase Behavior and Fouling, New Orleans, LA, USA, 10–14 March 2002; pp. 410–416. [Google Scholar]
- Gaona, J.A.S.; Manrique, J.P.B.; Majé, Y.M. Stability prediction for asphaltenes using SARA analysis for pure petroleum. Ing. Y Reg. 2010, 7, 103–110. [Google Scholar]
- Guzmán, R.; Ancheyta, J.; Trejo, F.; Rodríguez, S. Methods for determining asphaltene stability in crude oils. Fuel 2017, 188, 530–543. [Google Scholar] [CrossRef]
- Rathore, V.; Brahma, R.; Thorat, T.S.; Rao, P.V.C.; Choudary, N.V. Assessment of crude oil blends. PTQ 2011, Q4, 1–6. [Google Scholar]
- Mahmoud, M.B.; Aboujadeed, A.A. Compatibility assessment of crude oil blends using different methods. Chem. Eng. Trans. 2017, 57, 1705–1710. [Google Scholar]
- Anderson, R.P.; Reynolds, J.W. Methods for Assessing the Stability and Compatibility of Residual Fuel Oils; National Institute for Petroleum and Energy Research, Bartlesville: Bartlesville, OK, USA, 1989. [Google Scholar]
- Moura, L.G.M.; Santos, M.F.P.; Zilio, E.L.; Rolemberg, M.P.; Ramos, A.C.S. Evaluation of indices and of models applied to the prediction of the stability of crude oils. J. Pet. Sci. Eng. 2010, 74, 77–87. [Google Scholar] [CrossRef]
- Kass, M.D.; Armstrong, B.L.; Kaul, B.C.; Connatser, R.M.; Lewis, S.; Keiser, J.R.; Jun, J.; Warrington, G.; Sulejmanovic, D. Stability, combustion, and compatibility of high-viscosity heavy fuel oil blends with a fast pyrolysis bio-oil. Energy Fuels 2020, 34, 8403–8413. [Google Scholar] [CrossRef]
- Vráblík, A.; Schlehöfer, D.; Dlasková Jaklová, K.; Hidalgo Herrador, J.M.; Černý, R. Comparative study of light cycle oil and naphthalene as an adequate additive to improve the stability of marine fuels. ACS Omega 2022, 7, 2127–2136. [Google Scholar] [CrossRef]
- Vráblík, A.; Hidalgo-Herrador, J.M.; Černý, R. RGB Histograms as a reliable tool for the evaluation of fuel oils stability. Fuel 2018, 216, 16–22. [Google Scholar] [CrossRef]
- Ancheyta, J. Relative compatibility index for evaluation of the compatibility of crude oil blends. Geoenergy Sci. Eng. 2023, 230, 212246. [Google Scholar] [CrossRef]
- Yadykova, A.Y.; Ilyin, S.O. Compatibility and rheology of bio-oil blends with light and heavy crude oils. Fuel 2022, 314, 122761. [Google Scholar] [CrossRef]
- Odhiambo, J.O.; HaiJun, W.; Munyalo, J.M.; Fengguang, J. The use of separability number and SARA fractionation in studying asphaltenes stability in residual fuel oil. In Proceedings of the Sustainable Research and Innovation (SRI) Conference, Nairobi, Kenya, 6 May 2015; pp. 281–287. [Google Scholar]
- Son, J.-M.; Kim, N.-K.; Shin, J.; Yang, Y.; Kim, Y.-W. Dispersing properties of heavy crude oil according to dispersant structures. J. Korean Soc. Tribol. Lubr. Eng. 2015, 31, 251–257. [Google Scholar]
- Saboor, A.; Yousaf, N.; Haneef, J.; Ali, S.I.; Lalji, S.M. Performance of asphaltene stability predicting models in field environment and development of new stability predicting model (ANJIS). J. Pet. Explor. Prod. Technol. 2022, 12, 1423–1436. [Google Scholar] [CrossRef]
- Jamaluddin, A.K.M.; Creek, J.; Kabir, C.S.; McFadden, J.D.; D’Cruz, D.; Manakalathil, J.; Joshi, N.; Ross, B. Laboratory techniques to measure thermodynamic asphaltene instability. J. Can. Pet. Technol. 2002, 41, 44–52. [Google Scholar] [CrossRef]
- Akbarzadeh, K.; Hammami, A.; Kharrat, A.; Zhang, D. Asphaltenes—Problematic but rich in potential. Oilfield Rev. 2007, 19, 22–43. [Google Scholar]
- Pereira, V.J.; Setaro, L.L.O.; Costa, G.M.N.; Vieira De Melo, S.A.B. Evaluation and improvement of screening methods applied to asphaltene precipitation. Energy Fuels 2017, 31, 3380–3391. [Google Scholar] [CrossRef]
- Rogel, E.; Ovalles, C.; Vien, J.; Moir, M. Asphaltene solubility properties by the in-line filtration method. Energy Fuels 2015, 29, 6363–6369. [Google Scholar] [CrossRef]
- Castillo, M.A.; Rueda-Chacón, H.; Agudelo, J.L.; Molina, V.D. Prediction of the stability and compatibility of colombian heavy crude oils by 1D low field nuclear magnetic resonance relaxometry and chemometric methods. Fuel 2021, 298, 120721. [Google Scholar] [CrossRef]
- Castillo, M.A.; Páez, A.A.; Rueda-Chacón, H.; Agudelo, J.L.; Molina, V.D. Prediction of the insolubility number and the solubility blending number of colombian heavy crude oils by 1H nuclear magnetic resonance and partial least squares. Energy Fuels 2019, 34, 1592–1600. [Google Scholar] [CrossRef]
- Escobedo, J.; Mansoori, G.A. Viscometric determination of the onset of asphaltene flocculation: A novel method. SPE Prod. Fac. 1995, 10, 115–118. [Google Scholar] [CrossRef]
- Adeyanju, O.A.; Adeosun, T.A.; Obisanya, A.A. Experimental study of viscosity as a criterion for determination of onset of asphaltene flocculation in Nigeria’s crude. Pet. Coal. 2015, 57, 601–608. [Google Scholar]
- Fakher, S.; Yousef, A.; Al-Sakkaf, A.; Eldaka, S. Asphaltene onset pressure measurement and calculation techniques: A review. Petroleum 2023. [Google Scholar] [CrossRef]
- Soleymanzadeh, A.; Yousefi, M.; ·Kord, S.; Mohammadzadeh, O. A review on methods of determining onset of asphaltene precipitation. J. Pet. Explor. 2018, 9, 1375–1396. [Google Scholar] [CrossRef]
- Ali, S.I.; Lalji, S.M.; Haneef, J.; Ahsan, U.; Tariq, S.M.; Tirmizi, S.T.; Shamim, R. Critical analysis of different techniques used to screen asphaltene stability in crude oils. Fuel 2021, 299, 120874. [Google Scholar] [CrossRef]
- Van den Berg, F.; Kapusta, S.; Ooms, A.; Smith, A. Fouling and compatibility of crudes as basis for a new crude selection strategy. Pet. Sci. Technol. 2003, 21, 557–568. [Google Scholar] [CrossRef]
- Wiehe, I.A.; Kennedy, R.J. Process for Blending Potentially Incompatible Petroleum Oils. ExxonMobil Technology and Engineering Co. U.S. Patent US5871634A, 16 February 1999. [Google Scholar]
- Rahimi, P.; Alem, T. Crude oil compatibility and diluent evaluation for pipelining. In Proceedings of the Crude Oil Quality Association Meeting, New Orleans, LA, USA, 9 February 2010. [Google Scholar]
- Evdokimov, I. The importance of asphaltene content in petroleum III-new criteria for prediction of incompatibility in crude oil blends. Pet. Sci. Technol. 2010, 28, 1351–1357. [Google Scholar] [CrossRef]
- Rogel, E.; Hench, K.; Cibotti, F.; Forbes, E.; Jackowski, L. Investigation on crude oil fouling behavior. Energy Fuels 2022, 36, 818–825. [Google Scholar] [CrossRef]
- Jiguang, L.; Huandi, H.; Haiping, S. A new insight into compatibility changing rules for inferior vacuum residue’s thermal cracking and hydrocracking process. J. Anal. Appl. Pyrolysis 2022, 167, 105632. [Google Scholar] [CrossRef]
- Dickakian, G.B. Blending of Hydrocarbon Liquids. U.S. Patent 4853337, 1 August 1989. [Google Scholar]
- Ho, T.C. A study of crude oil fouling propensity. Int. J. Heat. Mass. Transf. 2016, 95, 62–68. [Google Scholar] [CrossRef]
- Sultanbekov, R.R.; Schipachev, A.M. Manifestation of incompatibility of marine residual fuels: A method for determining compatibility, studying composition of fuels and sediment. J. Min. Inst. 2022, 257, 843–852. [Google Scholar] [CrossRef]
- Sultanbekov, R.; Islamov, S.; Mardashov, D.; Beloglazov, I.; Hemmingsen, T.; Pérez, D.E.; López-Gutiérrez, J.-S.; Negro, V.; Graça Neves, M. Research of the influence of marine residual fuel composition on sedimentation due to incompatibility. J. Mar. Sci. Eng. 2021, 9, 1067–1081. [Google Scholar] [CrossRef]
- Fakher, S.; Ahdaya, M.; Elturki, M.; Imqam, A. Critical review of asphaltene properties and factors impacting its stability in crude oil. J. Pet. Explor. 2019, 10, 1183–1200. [Google Scholar] [CrossRef]
- Hernández, E.A.; Lira-Galeana, C.; Ancheyta, J. Analysis of asphaltene precipitation models from solubility and thermodynamic-colloidal theories. Processes 2023, 11, 765–788. [Google Scholar] [CrossRef]
- Bambinek, K.; Przyjazny, A.; Boczkaj, G. Compatibility of crude oil blends─processing issues related to asphaltene precipitation, methods of instability prediction—A review. Ind. Eng. Chem. Res. 2023, 62, 2–15. [Google Scholar] [CrossRef]
- Patil, P.D.; Kozminski, M.; Peterson, J.; Kumar, S. Fouling diagnosis of pennsylvania grade crude blended with opportunity crude oils in a refinery crude unit’s hot heat exchanger train. Ind. Eng. Chem. Res. 2019, 58, 17918–17927. [Google Scholar] [CrossRef]
- Rogel, E.; Hench, K.; Hajdu, P.; Ingham, H. The role of compatibility in determining the blending and processing of crude oils. In Chemistry Solutions to Challenges in the Petroleum Industry; ACS Symposium Series; American Chemical Society: Washington, DC, USA, 2019; Volume 1320, pp. 201–222. [Google Scholar]
- Shishkova, I.K.; Stratiev, D.S.; Tavlieva, M.P.; Dinkov, R.K.; Yordanov, D.; Sotirov, S.; Sotirova, E.; Atanassova, V.; Ribagin, S.; Atanassov, K.; et al. Evaluation of the different compatibility indices to model and predict oil colloidal stability and its relation to crude oil desalting. Resources 2021, 10, 75–95. [Google Scholar] [CrossRef]
- Nemana, S.; Kimbrell, R.M.; Zaluzec, E. Predictive Crude Oil Compatibility Model. U.S. Patent 7618822B2, 30 October 2007. [Google Scholar]
- Ali, S.I.; Lalji, S.M.; Awan, Z.; Qasim, M.; Alshahrani, T.; Khan, F.; Ullah, S.; Ashraf, A. Prediction of asphaltene stability in crude oils using machine learning algorithms. Chemom. Intell. Lab. Syst. 2023, 235, 104784. [Google Scholar] [CrossRef]
- Malkin, A.; Rodionova, G.; Simon, S.; Ilyin, S.O.; Arinina, M.P.; Kulichikhin, V.G.; Sjöblom, J. Some Compositional Viscosity Correlations for Crude Oils from Russia and Norway. Energy Fuels 2016, 30, 9322–9328. [Google Scholar] [CrossRef]
- Jia, B.; Xian, C.; Jia, W.; Su, J. Improved Petrophysical Property Evaluation of Shaly Sand Reservoirs Using Modified Grey Wolf Intelligence Algorithm. Comput. Geosci. 2023, 27, 537–549. [Google Scholar] [CrossRef]
- Jia, B.; Xian, C.; Tsau, J.-S.; Zuo, X.; Jia, W. tatus and Outlook of Oil Field Chemistry-Assisted Analysis during the Energy Transition Period. Energy Fuels 2022, 36, 12917–12945. [Google Scholar] [CrossRef]
- ASTM D4052-22; Standard Test Method for Density, Relative Density, and Api Gravity of Liquids by Digital Density Meter. ASTM International: West Conshohocken, PA, USA, 2022; Volume 05.01.
- ASTM D4294; Standard Test Method for Sulfur in Petroleum and Petroleum Products by Energy Dispersive X-ray Fluorescence Spectrometry. ASTM International: West Conshohocken, PA, USA, 2021; Volume 05.02.
- Stratiev, D.; Shishkova, I.; Dinkov, R.; Dobrev, D.; Argirov, G.; Yordanov, D. The Synergy between Ebullated Bed Vacuum Residue Hydrocracking and Fluid Catalytic Cracking Processes in Modern Refining—Commercial Experience; Professor Marin Drinov Publishing House of Bulgarian Academy of Sciences: Sofia, Bulgaria, 2022. [Google Scholar]
- IP 501/05; Determination of Aluminium, Silicon, Vanadium, Nickel, Iron, Sodium, Calcium, Zinc and Phosphorus in Residual Fuel Oil by Ashing, Fusion and Inductively Coupled Plasma Emission Spectrometry. Energy Institute: London, UK, 2019.
- ASTM D2892; Standart Test Method for Distillation of Crude Petroleum (15-Theoretical Plate Column). ASTM International: West Conshohocken, PA, USA, 2020; Volume 05.01.
- ASTM D5236-18A; Standard Test Method for Distillation of Heavy Hydrocarbon Mixtures (Vacuum Potstill Method). ASTM International: West Conshohocken, PA, USA, 2018; Volume 05.02.
- ASTM D7169-20e1; Standard Test Method for Boiling Point Distribution of Samples with Residues such as Crude Oils and Atmospheric and Vacuum Residues by High Temperature Gas Chromatography. ASTM International: West Conshohocken, PA, USA, 2020; Volume 05.03.
- He, P.; Ghoniem, A.F. A group contribution pseudocomponent method for phase equilibrium modeling of mixtures of petroleum fluids and a solvent. Ind. Eng. Chem. Res. 2015, 54, 8809–8820. [Google Scholar] [CrossRef]
- Vakili-Nezhaad, G.R.; Modarress, H. A New Characterization Factor for Hydrocarbons and Petroleum Fluids Fractions. Oil Gas. Sci. Technol. Rev. IFP 2002, 57, 149–154. [Google Scholar]
- Whitson, C. Characterizing hydrocarbon plus fractions. Soc. Pet. Eng. J. 1983, 23, 683–694. [Google Scholar] [CrossRef]
- Watson, K.; Nelson, E. Improved methods for approximating critical and thermal properties of petroleum fractions. Ind. Eng. Chem. 1933, 25, 880–887. [Google Scholar] [CrossRef]
- Gharagheizi, F.; Fazeli, A. Prediction of the watson characterization factor of hydrocarbon components from molecular properties. QSAR Comb. Sci. 2008, 27, 758–767. [Google Scholar] [CrossRef]
- Mohammadi, A.; Omidkhah, M.; Karimzadeh, R.; Haghtalab, A. Structural modeling of petroleum fractions based on mixture viscosity and Watson K factor. Korean J. Chem. Eng. 2013, 30, 465–473. [Google Scholar] [CrossRef]
- Correra, S.; Merlini, M.; Di Lullo, A.; Merino-Garcia, D. Estimation of the solvent power of crude oil from density and viscosity measurements. Ind. Eng. Chem. Res. 2005, 44, 9307–9315. [Google Scholar] [CrossRef]
- Atanassov, K.; Mavrov, D.; Atanassova, V. InterCriteria decision making: A new approach for multicriteria decision making, based on index matrices and intuitionistic fuzzy sets. Issues Intuitionistic Fuzzy Sets Gen. Nets 2014, 11, 1–8. [Google Scholar]
- Atanassov, K.; Marinov, P.; Atanassova, V. InterCriteria analysis with interval-valued intuitionistic fuzzy evaluations. In Flexible Query Answering Systems; Lecture Notes in Computer Science; Cuzzocrea, A., Greco, S., Larsen, H., Saccà, D., Andreasen, T., Christiansen, H., Eds.; Springer: Berlin/Heidelberg, Germany, 2019; Volume 11529, pp. 329–338. [Google Scholar]
- Atanassov, K.; Atanassova, V.; Gluhchev, G. InterCriteria analysis: Ideas and problems. Notes Intuitionistic Fuzzy Sets 2015, 21, 81–88. [Google Scholar]
- Stratiev, D.; Shishkova, I.; Dinkov, R.; Kolev, I.; Argirov, G.; Ivanov, V.; Ribagin, S.; Atanassova, V.; Atanassov, K.; Stratiev, D.D.; et al. Intercriteria analysis to diagnose the reasons for increased fouling in a commercial ebullated bed vacuum residue hydrocracker. ACS Omega 2022, 7, 30462–30476. [Google Scholar] [CrossRef] [PubMed]
- Qi, Y.; Cai, C.F.; Sun, P.; Wang, D.W.; Zhu, H.J. Crude oil cracking in deep reservoirs: A review of the controlling factors and estimation methods. Pet. Sci. 2023, 20, 1978–1997. [Google Scholar] [CrossRef]
- Viswanathan, B.P. Energy Sources: Fundamentals of Chemical Conversion Processes and Applications; Elsevier: Amsterdam, The Netherlands, 2017; pp. 29–57. [Google Scholar]
- Vandenbroucke, M.; Largeau, C. Kerogen origin, evolution and structure. Org. Geochem. 2007, 38, 719–833. [Google Scholar] [CrossRef]
- Behar, F.; Vandenbroucke, M.; Tang, Y.; Marquis, F.; Espitalie, J. Thermal cracking of kerogen in open and closed systems: Determination of kinetic parameters and stoichiometric coefficients for oil and gas generation. Org. Geochem. 1997, 26, 321–339. [Google Scholar] [CrossRef]
- Donadelli, J.A.; Pineda, J.; Comerio, M.; Smal, C.; Erra, G.; Acost, R.H.; Delfa, G.M. Natural and laboratory-induced maturation of kerogen from the Vaca Muerta Formation: A comparison study. Org. Geochem. 2023, 185, 104690. [Google Scholar] [CrossRef]
- Gama, J.; Schwark, L. Assessment of kerogen types and source rock potential of lower jurassic successions in the Mandawa basin, SE Tanzania. Mar. Pet. Geol. 2023, 157, 106505. [Google Scholar] [CrossRef]
- Salter, T.L.; Watson, J.S.; Sephton, M.A. Effects of minerals (phyllosilicates and iron oxides) on the responses of aliphatic hydrocarbon containing kerogens (type I and type II) to analytical pyrolysis. J. Anal. Appl. Pyrolysis 2023, 170, 105900. [Google Scholar] [CrossRef]
- Liu, B.; Mohammadi, M.-R.; Ma, Z.; Bai, L.; Wang, L.; Wen, Z.; Liu, Y.; Morta, H.B.; Hemmati-Sarapardeh, A.; Ostadhassan, M. Experimental investigation and intelligent modeling of pore structure changes in type III kerogen-rich shale artificially matured by hydrous and anhydrous pyrolysis. Energy 2023, 282, 128799. [Google Scholar] [CrossRef]
- Safaei-Farouji, M.; Liu, B.; Gentzis, T.; Wen, Z.; Ma, Z.; Bai, L.; Ostadhassan, M. Geochemical evolution of kerogen type III during hydrous pyrolysis: A case study from the damoguaihe formation, Hailar basin, China. Geoenergy Sci. Eng. 2023, 228, 211947. [Google Scholar] [CrossRef]
- Li, X.; Xie, H.; Birdwell, J.E.; McGovern, G.P.; Horita, J. Intramolecular carbon isotope geochemistry of butane isomers from laboratory maturation and Monte-Carlo simulations of kerogen types I, II, and III. Geochim. Cosmochim. Acta 2023, 360, 57–67. [Google Scholar] [CrossRef]
- Lu, C.; Xiao, X.; Gai, H.; Feng, Y.; Li, G.; Meng, G.; Gao, P. Nanopore structure characteristics and evolution of type III kerogen in marine-continental transitional shales from the Qinshui basin, Northern China. Geoenergy Sci. Eng. 2023, 221, 211413. [Google Scholar] [CrossRef]
- Hui, S.S.; Pang, X.Q.; Jiang, F.J.; Wang, C.X.; Mei, S.X.; Hu, T.; Pang, H.; Li, M.; Zhou, X.L.; Shi, K.Y. Quantitative effect of kerogen type on the hydrocarbon generation potential of paleogene lacustrine source rocks, Liaohe Western Depression, China. Pet. Sci. 2024, 21, 14–30. [Google Scholar] [CrossRef]
- Liang, T.; Zhan, Z.W.; Zou, Y.R.; Lin, X.H.; Shan, Y.; Peng, P. Research on type I kerogen Molecular simulation and docking between kerogen and saturated hydrocarbon molecule during oil generation. Chem. Geol. 2023, 617, 121263. [Google Scholar] [CrossRef]
- Zheng, X.; Sanei, H.; Schovsbo, N.H.; Luo, Q.; Wu, J.; Zhong, N.; Galloway, J.M.; Goodarzi, F. Role of zooclasts in the kerogen type and hydrocarbon potential of the lower paleozoic alum shale. Int. J. Coal. Geol. 2021, 248, 103865. [Google Scholar] [CrossRef]
- Stratiev, D.; Dinkov, R.; Shishkova, I.; Yordanov, D. Can we manage the process of asphaltene precipitation during the production of IMO 2020 Fuel Oil? Erdoel Erdgas Kohle 2020, 12, 32–39. [Google Scholar]
- Lehne, E.; Dieckmann, V. Bulk kinetic parameters and structural moieties of asphaltenes and kerogens from a sulphur-rich source rock sequence and related petroleums. Org. Geochem. 2007, 38, 1657–1679. [Google Scholar] [CrossRef]
- Dhulesia, H. New correlations predict FCC feed characterizing parameters. Oil Gas. J. 1986, 84, 51–54. [Google Scholar]
- Bahonar, E.; Chahardowli, M.; Ghalenoei, Y.; Simjoo, M. New correlations to predict oil viscosity using data mining techniques. J. Pet. Sci. Eng. 2022, 208, 109736. [Google Scholar] [CrossRef]
- Hadavimoghaddam, F.; Ostadhassan, M.; Heidaryan, E.; Sadri, M.A.; Chapanova, I.; Popov, E.; Cheremisin, A.; Rafieepour, S. Prediction of dead oil viscosity: Machine learning vs. classical correlations. Energies 2021, 14, 930–946. [Google Scholar] [CrossRef]
- Stratiev, D.; Shishkova, I.; Dinkov, R.; Nenov, S.; Sotirov, S.; Sotirova, E.; Kolev, I.; Ivanov, V.; Ribagin, S.; Atanassov, K.; et al. Prediction of petroleum viscosity from molecular weight and density. Fuel 2023, 331, 125679. [Google Scholar] [CrossRef]
- Stratiev, D.; Sotirov, S.; Sotirova, E.; Nenov, S.; Dinkov, R.; Shishkova, I.; Kolev, I.V.; Yordanov, D.; Vasilev, S.; Atanassov, K.; et al. Prediction of molecular weight of petroleum fluids by empirical correlations and artificial neuron networks. Processes 2023, 11, 426. [Google Scholar] [CrossRef]
- Palichev, G.N.; Stratiev, D.; Sotirov, S.; Sotirova, E.; Nenov, S.; Shishkova, I.; Dinkov, R.; Atanassov, K.; Ribagin, S.; Stratiev, D.D.; et al. Prediction of refractive index of petroleum fluids by empirical correlations and ANN. Processes 2023, 11, 2328. [Google Scholar] [CrossRef]
- Stratiev, D.; Nenov, S.; Shishkova, I.; Sotirov, S.; Sotirova, E.; Dinkov, R.; Yordanov, D.; Pilev, D.; Atanassov, K.; Vasilev, S. Prediction of viscosity of blends of heavy oils with diluents by empirical correlations and artificial neural network. Ind. Eng. Chem. Res. 2023, 62, 21449–21463. [Google Scholar] [CrossRef]
- Braimah, M.N. Application of artificial neural network (ANN) in the optimization of crude oil refinery process: New Port-Harcourt Refinery. J. Energy Res. Rev. 2020, 5, 26–38. [Google Scholar] [CrossRef]
- Ore, O.T.; Adebiyi, F.M. Pyrolysis of Oil Sand Bitumen Using a Fixed-Bed Reactor: Process Modeling and Compositional Analysis. Ind. Eng. Chem. Res. 2024, 62, 14151–14166. [Google Scholar] [CrossRef]
- Lighter Crude Slate Restricts European Refiners. Available online: https://www.argusmedia.com/en/news-and-insights/latest-market-news/2478828-lighter-crude-slate-restricts-european-refiners (accessed on 15 March 2024).
- Ranaee, E.; Ghorbani, H.; Keshavarzian, S.; Abarghoei, P.G.; Riva, M.; Fabio Inzoli, F.; Guadagnini, A. Analysis of the performance of a crude-oil desalting system based on historical data. Fuel 2021, 291, 120046. [Google Scholar] [CrossRef]
- Pereira, J.; Velasquez, I.; Blanco, R.; Sanchez, M.; Pernalete, C.; Canelón, C. Chapter 4. Crude Oil Desalting Process. Available online: https://cdn.intechopen.com/pdfs/48963.pdf (accessed on 18 March 2024).
- Treese, S.A.; Pujado, P.R.; Jones, D.S.J. Handbook of Petroleum Processing, 2nd ed.; Springer: Cham, Switzerland, 2015. [Google Scholar]
- Abdel-AalMohammed, H.K.; Alsahlawi, A. Petroleum Economics and Engineering, 3rd ed.; Taylor & Francis Group: Abingdon, UK, 2014. [Google Scholar]
- Kaiser, M.J.; De Klerk, A.; Gary, J.H.; Handwerk, G.E. Petroleum Refining. Technology, Economics, and Markets, 6th ed.; CRC Press: Boca Raton, FL, USA, 2020. [Google Scholar]


| No | Crude Oil Sample Name | D15, g/cm3 | Kin. Viscosity at 40 °C, mm2/s | Sulphur, wt.% | T50% (TBP), °C | Saturates, wt.% | Aromatics, wt.% | Resins, wt.% | C7-asp., wt.% | C5-asp., wt.% |
|---|---|---|---|---|---|---|---|---|---|---|
| 1 | Albanian | 1.0014 | 2090 | 5.64 | 442 | 24.5 | 56.3 | 6.6 | 12.6 | 19.2 |
| 2 | Arabian Light | 0.8581 | 6.3 | 1.89 | 353 | 61.5 | 35.1 | 2 | 1.4 | 3.4 |
| 3 | Arab. Med.–1 | 0.868 | 9.8 | 2.4 | 366 | 57.1 | 39.5 | 2.1 | 1.3 | 3.4 |
| 4 | Arab. Med.–2 | 0.8703 | 2.45 | 372 | ||||||
| 5 | Arab Heavy | 0.8916 | 17.3 | 2.967 | 408 | 52.1 | 40.7 | 2.8 | 4.4 | 7.3 |
| 6 | Aseng | 0.8741 | 8.6 | 0.258 | 358 | 56.5 | 41.6 | 1.8 | 0.1 | 1.9 |
| 7 | Azery Light | 0.8483 | 4.5 | 0.2 | 323 | 64.6 | 34.7 | 0.66 | 0.04 | 0.13 |
| 8 | Basrah Light–1 | 0.884 | 10.9 | 3.31 | 390 | 55.3 | 39.5 | 2.5 | 2.7 | 5.1 |
| 9 | Basrah Light–2 | 0.8772 | 2.94 | 385 | ||||||
| 10 | Basrah Med.–1 | 0.8876 | 12.5 | 3.36 | 400 | 52.5 | 38.9 | 6 | 2.6 | 3.4 |
| 11 | Basrah Med.–2 | 0.8836 | 3.1 | 389 | ||||||
| 12 | Basrah Heavy | 0.9133 | 24.6 | 4.08 | 433 | 47.5 | 43.7 | 3.2 | 5.6 | 8.8 |
| 13 | Boscan | 0.9953 | 14953 | 4.77 | 558 | 24.3 | 59.6 | 4.6 | 11.5 | 16.1 |
| 14 | Buzachi | 0.9065 | 84.2 | 1.571 | 450 | 47 | 50.2 | 1.9 | 0.9 | 2.9 |
| 15 | Cheleken | 0.8469 | 12.1 | 0.4 | 345 | 65 | 32.8 | 1.8 | 0.4 | 2.2 |
| 16 | CPC–1 | 0.7954 | 1.8 | 0.55 | 237 | 82.7 | 15.3 | 1.96 | 0.04 | 0.14 |
| 17 | CPC–2 | 0.7993 | 0.53 | 238 | ||||||
| 18 | CPC–3 | 0.801 | 0.56 | 238 | ||||||
| 19 | El Bouri | 0.8913 | 20.9 | 1.72 | 403 | 51.5 | 43 | 2.5 | 3 | 5.5 |
| 20 | El Sharara | 0.814 | 2.7 | 0.08 | 253 | 76.1 | 22 | 1.8 | 0.11 | 0.5 |
| 21 | Forties | 0.817 | 4.4 | 0.679 | 264 | 75.1 | 23 | 1.7 | 0.2 | 0.5 |
| 22 | Helm_1.2022 | 0.935 | 92.4 | 1.71 | 448 | 39.6 | 54.1 | 2.6 | 3.7 | 6.3 |
| 23 | Helm_1.2024 | 0.9348 | 1.63 | 455 | 39.6 | 53.2 | 2.9 | 4.3 | 7.1 | |
| 24 | Johan Sverdrup | 0.8867 | 12.2 | 0.82 | 390 | 52.7 | 43 | 2.3 | 2 | 4.2 |
| 25 | Kazakh | 0.8777 | 6.5 | 0.4 | 426 | 61.5 | 36.2 | 1.8 | 0.5 | 2.3 |
| 26 | Kirkuk | 0.8538 | 6.4 | 2.26 | 332 | 56.8 | 38.7 | 2.3 | 2.2 | 4.5 |
| 27 | Kirkuk AR | 0.9586 | 316 | 2.98 | 531 | 33.8 | 54.6 | 4.7 | 6.9 | 11.6 |
| 28 | Kumkol | 0.8209 | 4.3 | 0.22 | 324 | |||||
| 29 | Kuwait Export | 0.8729 | 12.2 | 2.69 | 390 | 55.9 | 39 | 2.4 | 2.7 | 5.1 |
| 30 | Kuwait Light | 0.8313 | 2.4 | 1.049 | 289 | 70.2 | 27.2 | 1.6 | 1 | 1.6 |
| 31 | Okwuibome | 0.8676 | 7.2 | 0.202 | 309 | 58.5 | 39.6 | 1.85 | 0.05 | 0.15 |
| 32 | Oryx | 0.9156 | 123.2 | 4.209 | 448 | 44.6 | 42.9 | 3.9 | 8.6 | 12.5 |
| 33 | Prinos | 0.875 | 5.5 | 3.71 | 345 | 56.2 | 37.5 | 2.7 | 3.6 | 6.3 |
| 34 | Ras Gharib | 0.9256 | 95 | 3.44 | 486 | 41.9 | 48.6 | 3.3 | 6.2 | 9.5 |
| 35 | REBCO–1 | 0.874 | 12.6 | 1.44 | 386 | 55.6 | 40.5 | 2.2 | 1.7 | 3.8 |
| 36 | REBCO–2 | 0.8755 | 1.49 | 390 | ||||||
| 37 | Rhemoura | 0.8648 | 7.5 | 0.75 | 342 | 59.3 | 35.8 | 2.3 | 2.6 | 4.9 |
| 38 | Sepia | 0.8883 | 25.9 | 0.41 | 430 | 52.3 | 44.6 | 2 | 1.1 | 3.1 |
| 39 | Sib. Light | 0.8538 | 6.2 | 0.57 | 348 | 62.7 | 34.4 | 2 | 0.9 | 2.9 |
| 40 | SGC | 0.8827 | 27.6 | 2.26 | 406 | 53.8 | 40.6 | 2.5 | 3.1 | 5.6 |
| 41 | Tartaruga | 0.893 | 17.1 | 0.73 | 415 | 50.4 | 45.9 | 2.1 | 1.6 | 3.7 |
| 42 | Tempa Rossa | 0.9401 | 62 | 5.35 | 455 | 38.3 | 49.1 | 3.9 | 8.7 | 12.6 |
| 43 | Vald’Agri | 0.8323 | 3.2 | 1.96 | 280 | 69.8 | 26.6 | 2.8 | 0.8 | 3.6 |
| 44 | Varandey | 0.8503 | 6.1 | 0.625 | 336 | 64 | 32.8 | 2 | 1.2 | 3.2 |
| 45 | Western Desert | 0.8208 | 2.16 | 0.26 | 266 | 73.7 | 22.5 | 3.1 | 0.7 | 1.3 |
| 46 | Es Sider | 0.8382 | 4.85 | 0.415 | 321 | 67.9 | 28.5 | 3.1 | 0.5 | 3.6 |
| 47 | Payra Gold | 0.8849 | 14 | 0.685 | 380 | 53.3 | 41.9 | 4.6 | 0.2 | 1.8 |
| 48 | KEBCO | 0.8741 | 10.8 | 1.7 | 373 | 56.5 | 39 | 1.7 | 2.8 | 4.5 |
| Min | 0.7954 | 1.8 | 0.08 | 237 | 24.3 | 15.3 | 0.66 | 0.04 | 0.13 | |
| Max | 1.0014 | 14,953 | 5.64 | 558 | 82.7 | 59.6 | 6.6 | 12.6 | 19.2 |
| No | Crude Oil Name | Sp | Sp cr. | RCI | Kw | Kw Blend | Sp (Mod.) | Sp cr. (Mod) | RCI (Modified) | n-Heptane Content in the Blend with the Crude Oil, wt.% (at Onset of Asphaltene Precipitation) | SBN/IN | SBN | IN | δCO | CII(C7) | CII(C5) |
|---|---|---|---|---|---|---|---|---|---|---|---|---|---|---|---|---|
| 1 | Albanian | 93.5 | 53 | 1.8 | 10.85 | 11.82 | 74.7 | 37.3 | 2 | 50 | 2 | 137 | 69 | 19.5 | 0.59 | 0.78 |
| 2 | Arabian Light | 35.6 | 27.2 | 1.3 | 12.11 | 12.38 | 26.1 | 15.6 | 1.7 | 40 | 1.6 | 80 | 51 | 17.7 | 1.70 | 1.85 |
| 3 | Arab. Med.–1 | 43.1 | 37.1 | 1.2 | 12.06 | 12.39 | 28.1 | 15.5 | 1.8 | 45 | 1.7 | 84 | 49 | 17.8 | 1.40 | 1.53 |
| 4 | Arab. Med.–2 | 49.6 | 35.1 | 1.4 | 12.07 | 12.47 | 27.8 | 12.5 | 2.2 | 55 | 2.1 | 85 | 41 | 17.8 | ||
| 5 | Arab Heavy | 59.9 | 33.5 | 1.8 | 11.99 | 12.43 | 30.7 | 13.8 | 2.2 | 55 | 2.1 | 94 | 45 | 18.1 | 1.30 | 1.46 |
| 6 | Aseng | 43.3 | 26.8 | 1.6 | 11.93 | 12.31 | 33.3 | 18.3 | 1.8 | 45 | 1.7 | 86 | 50 | 17.9 | 1.30 | 1.40 |
| 7 | Azery Light | 43.3 | 1.2 | 12.06 | 12.35 | 28.3 | 1.6 | 76 | 48 | 17.5 | 1.83 | 1.84 | ||||
| 8 | Basrah Light–1 | 51.9 | 36.7 | 1.4 | 11.99 | 12.39 | 30.9 | 15.4 | 2 | 50 | 1.9 | 91 | 48 | 18 | 1.38 | 1.53 |
| 9 | Basrah Light–2 | 50.8 | 42.7 | 1.2 | 12.05 | 12.42 | 28.6 | 14.3 | 2 | 50 | 1.9 | 88 | 47 | 17.9 | ||
| 10 | Basrah Med.–1 | 37.2 | 29.7 | 1.3 | 12 | 12.36 | 30.4 | 16.7 | 1.8 | 45 | 1.7 | 92 | 53 | 18.1 | 1.23 | 1.27 |
| 11 | Basrah Med.–2 | 50.8 | 42 | 1.2 | 11.99 | 12.35 | 31 | 17.1 | 1.8 | 45 | 1.7 | 90 | 52 | 18 | ||
| 12 | Basrah Heavy | 63.7 | 47.4 | 1.3 | 11.85 | 12.32 | 36.3 | 18.1 | 2 | 50 | 1.9 | 102 | 54 | 18.4 | 1.13 | 1.29 |
| 13 | Boscan | 69.5 | 47.9 | 1.5 | 11.48 | 12.4 | 50.5 | 15.1 | 3.3 | 70 | 3.3 | 135 | 41 | 19.4 | 0.56 | 0.68 |
| 14 | Buzachi | 45 | 35.8 | 1.3 | 12.04 | 12.45 | 29.1 | 13.1 | 2.2 | 55 | 2.1 | 100 | 47 | 18.3 | 0.92 | 1.00 |
| 15 | Cheleken | 36.8 | 22.8 | 1.6 | 12.22 | 12.56 | 21.8 | 8.7 | 2.5 | 60 | 2.3 | 75 | 33 | 17.5 | 1.89 | 2.05 |
| 16 | CPC–1 | 22.1 | 1 | 12.21 | 12.33 | 22.3 | 1.2 | 53 | 44 | 16.8 | 4.79 | 4.83 | ||||
| 17 | CPC–2 | 35.6 | 1.2 | 12.16 | 12.16 | 24.4 | 1 | 55 | 55 | 16.9 | ||||||
| 18 | CPC–3 | 29.9 | 1 | 12.13 | 12.13 | 25.3 | 1 | 55 | 55 | 16.9 | ||||||
| 19 | El Bouri | 42.8 | 39.5 | 1.1 | 11.97 | 12.21 | 31.7 | 22.2 | 1.4 | 30 | 1.4 | 94 | 68 | 18.1 | 1.20 | 1.33 |
| 20 | El Sharara | 28 | 13.9 | 2 | 12.05 | 12.58 | 28.5 | 8 | 3.6 | 72 | 3.1 | 61 | 20 | 17.1 | 3.20 | 3.27 |
| 21 | Forties | 37.8 | 18.7 | 2 | 12.09 | 12.45 | 27 | 13.2 | 2 | 51 | 1.9 | 62 | 34 | 17.1 | 3.05 | 3.10 |
| 22 | Helm_1.2022 | 52.6 | 30.2 | 1.7 | 11.65 | 12.22 | 43.8 | 21.9 | 2 | 50 | 1.9 | 111 | 57 | 18.6 | 0.76 | 0.85 |
| 23 | Helm_1.2024 | 59.5 | 43 | 1.4 | 11.7 | 12.3 | 42.2 | 19 | 2.2 | 55 | 2.1 | 111 | 52 | 18.6 | 0.78 | 0.88 |
| 24 | Johan Sverdrup | 45.8 | 34.3 | 1.3 | 11.95 | 12.46 | 32.3 | 12.6 | 2.6 | 61 | 2.4 | 92 | 38 | 18 | 1.21 | 1.32 |
| 25 | Kazakh | 29.5 | 16.2 | 1.8 | 12.29 | 12.49 | 19.3 | 11.6 | 1.7 | 40 | 1.6 | 88 | 55 | 17.9 | 1.63 | 1.76 |
| 26 | Kirkuk | 45 | 41.5 | 1.1 | 12.04 | 12.19 | 28.8 | 23 | 1.3 | 20 | 1.2 | 78 | 64 | 17.6 | 1.44 | 1.58 |
| 27 | Kirkuk AR | 55 | 34.1 | 1.6 | 11.79 | 12.29 | 38.5 | 19.3 | 2 | 50 | 2 | 121 | 62 | 18.9 | 0.69 | 0.83 |
| 28 | Kumkol | 38.1 | 37.4 | 1 | 12.47 | 12.5 | 12.5 | 11.2 | 1.1 | 10 | 1.1 | 64 | 59 | 17.2 | ||
| 29 | Kuwait Export | 55.2 | 41.8 | 1.3 | 12.14 | 12.4 | 25.1 | 15.1 | 1.7 | 40 | 1.6 | 86 | 54 | 17.9 | 1.42 | 1.56 |
| 30 | Kuwait Light | 37.7 | 1 | 12.07 | 12.43 | 27.8 | 1.8 | 68 | 37 | 17.3 | 2.47 | 2.55 | ||||
| 31 | Okwuibome | 48.4 | 28.1 | 1.7 | 11.7 | 12.24 | 42.1 | 21 | 2 | 50 | 1.9 | 84 | 45 | 17.8 | 1.41 | 1.42 |
| 32 | Oryx | 59.7 | 49.9 | 1.2 | 11.9 | 12.21 | 34.2 | 22.2 | 1.5 | 35 | 1.5 | 103 | 69 | 18.4 | 1.14 | 1.33 |
| 33 | Prinos | 60.2 | 38.2 | 1.6 | 11.83 | 11.98 | 36.9 | 31.3 | 1.2 | 15 | 1.2 | 87 | 75 | 17.9 | 1.49 | 1.67 |
| 34 | Ras Gharib | 47 | 21.5 | 2.2 | 11.98 | 12.3 | 31.2 | 18.7 | 1.7 | 40 | 1.6 | 107 | 66 | 18.5 | 0.93 | 1.06 |
| 35 | REBCO–1 | 47.8 | 31.9 | 1.5 | 12.1 | 12.51 | 26.5 | 10.6 | 2.5 | 60 | 2.3 | 86 | 37 | 17.9 | 1.34 | 1.46 |
| 36 | REBCO–2 | 44 | 31.5 | 1.4 | 12.1 | 12.51 | 26.5 | 10.6 | 2.5 | 60 | 2.3 | 87 | 38 | 17.9 | ||
| 37 | Rhemoura | 51.9 | 38.6 | 1.3 | 11.95 | 12.2 | 32.3 | 22.6 | 1.4 | 30 | 1.4 | 83 | 60 | 17.8 | 1.62 | 1.79 |
| 38 | Sepia | 43.4 | 20.5 | 2.1 | 12.17 | 12.67 | 24.1 | 4.8 | 5 | 80 | 4.6 | 92 | 20 | 18.1 | 1.15 | 1.24 |
| 39 | Sib. Light | 41.9 | 27.1 | 1.5 | 12.14 | 12.53 | 25 | 10 | 2.5 | 60 | 2.3 | 78 | 34 | 17.6 | 1.75 | 1.91 |
| 40 | SGC | 52 | 37.6 | 1.4 | 12.1 | 12.41 | 26.6 | 14.6 | 1.8 | 45 | 1.7 | 90 | 52 | 18 | 1.32 | 1.46 |
| 41 | Tartaruga | 47.6 | 40.7 | 1.2 | 12.02 | 12.33 | 29.8 | 17.9 | 1.7 | 40 | 1.6 | 94 | 59 | 18.1 | 1.08 | 1.18 |
| 42 | Tempa Rossa | 71.1 | 59.6 | 1.2 | 11.63 | 12.04 | 44.7 | 29.1 | 1.5 | 35 | 1.5 | 113 | 75 | 18.7 | 0.89 | 1.04 |
| 43 | Vald’Agri | 42.6 | 25.5 | 1.7 | 11.99 | 12.47 | 30.9 | 12.4 | 2.5 | 60 | 2.2 | 69 | 31 | 17.3 | 2.40 | 2.76 |
| 44 | Varandey | 39.4 | 34.6 | 1.1 | 12.12 | 12.32 | 25.9 | 18.1 | 1.4 | 30 | 1.4 | 76 | 56 | 17.6 | 1.87 | 2.05 |
| 45 | Western Desert | 32.5 | 1 | 12.05 | 12.2 | 28.6 | 1.2 | 64 | 53 | 17.2 | 2.91 | 3.00 | ||||
| 46 | Es Sider | 36.3 | 31 | 1.2 | 12.21 | 12.44 | 22.2 | 13.3 | 1.7 | 40 | 1.6 | 71 | 46 | 17.4 | 2.16 | 2.51 |
| 47 | Payra Gold | 11.94 | 12.7 | 32.8 | 3.3 | 10 | 90 | 9 | 91 | 10 | 18 | 1.15 | 1.23 | |||
| 48 | KEBCO | 12.04 | 12.42 | 28.9 | 14.4 | 2 | 50 | 1.9 | 86 | 46 | 17.9 | 1.46 | 1.56 | |||
| min | 22.1 | 13.9 | 1 | 0.8 | 237 | 10.9 | 11.8 | 12.5 | 3.3 | 1 | 0 | 1 | 53 | 0.56 | 0.68 | |
| max | 93.5 | 59.6 | 2.2 | 1 | 558 | 12.5 | 12.7 | 74.7 | 37.3 | 10 | 90 | 9 | 137.4 | 4.79 | 4.83 |
| μ | Sp | Sp cr. | RCI | Kw | Kw Blend | Sp (Mod.) | Sp cr. (Mod) | RCI (Mod.) | n-Heptane | SBN/IN | SBN | IN | δCO | CII(C7) | CII(C5) |
|---|---|---|---|---|---|---|---|---|---|---|---|---|---|---|---|
| Sp | 1.00 | 0.78 | 0.43 | 0.22 | 0.29 | 0.75 | 0.68 | 0.42 | 0.42 | 0.44 | 0.75 | 0.65 | 0.73 | 0.24 | 0.27 |
| Sp cr. | 0.78 | 1.00 | 0.23 | 0.31 | 0.27 | 0.67 | 0.72 | 0.33 | 0.33 | 0.35 | 0.69 | 0.72 | 0.67 | 0.30 | 0.33 |
| RCI | 0.43 | 0.23 | 1.00 | 0.44 | 0.58 | 0.45 | 0.32 | 0.61 | 0.62 | 0.62 | 0.43 | 0.30 | 0.42 | 0.48 | 0.46 |
| Kw | 0.22 | 0.31 | 0.44 | 1.00 | 0.74 | 0.02 | 0.23 | 0.46 | 0.47 | 0.47 | 0.24 | 0.33 | 0.23 | 0.71 | 0.71 |
| Kw blend | 0.29 | 0.27 | 0.58 | 0.74 | 1.00 | 0.23 | 0.01 | 0.71 | 0.72 | 0.72 | 0.33 | 0.13 | 0.32 | 0.63 | 0.63 |
| Sp (mod.) | 0.75 | 0.67 | 0.45 | 0.02 | 0.23 | 1.00 | 0.74 | 0.43 | 0.43 | 0.45 | 0.71 | 0.63 | 0.69 | 0.25 | 0.26 |
| Sp cr. (mod) | 0.68 | 0.72 | 0.32 | 0.23 | 0.01 | 0.74 | 1.00 | 0.19 | 0.19 | 0.21 | 0.64 | 0.84 | 0.62 | 0.34 | 0.35 |
| RCI (mod.) | 0.42 | 0.33 | 0.61 | 0.46 | 0.71 | 0.43 | 0.19 | 1.00 | 0.99 | 0.97 | 0.45 | 0.13 | 0.44 | 0.42 | 0.41 |
| n-Heptane | 0.42 | 0.33 | 0.62 | 0.47 | 0.72 | 0.43 | 0.19 | 0.99 | 1.00 | 0.97 | 0.45 | 0.13 | 0.44 | 0.43 | 0.42 |
| SBN/IN | 0.44 | 0.35 | 0.62 | 0.47 | 0.72 | 0.45 | 0.21 | 0.97 | 0.97 | 1.00 | 0.48 | 0.15 | 0.47 | 0.41 | 0.41 |
| SBN | 0.75 | 0.69 | 0.43 | 0.24 | 0.33 | 0.71 | 0.64 | 0.45 | 0.45 | 0.48 | 1.00 | 0.66 | 0.96 | 0.06 | 0.08 |
| IN | 0.65 | 0.72 | 0.30 | 0.33 | 0.13 | 0.63 | 0.84 | 0.13 | 0.13 | 0.15 | 0.66 | 1.00 | 0.63 | 0.34 | 0.36 |
| δCO | 0.73 | 0.67 | 0.42 | 0.23 | 0.32 | 0.69 | 0.62 | 0.44 | 0.44 | 0.47 | 0.96 | 0.63 | 1.00 | 0.04 | 0.06 |
| CII(C7) | 0.24 | 0.30 | 0.48 | 0.71 | 0.63 | 0.25 | 0.34 | 0.42 | 0.43 | 0.41 | 0.06 | 0.34 | 0.04 | 1.00 | 0.96 |
| CII(C5) | 0.27 | 0.33 | 0.46 | 0.71 | 0.63 | 0.26 | 0.35 | 0.41 | 0.42 | 0.41 | 0.08 | 0.36 | 0.06 | 0.96 | 1.00 |
| υ | Sp | Sp cr. | RCI | Kw | Kw Blend | Sp (Mod.) | Sp cr. (Mod) | RCI (Mod.) | n-Heptane | SBN/IN | SBN | IN | δCO | CII(C7) | CII(C5) |
|---|---|---|---|---|---|---|---|---|---|---|---|---|---|---|---|
| Sp | 0.00 | 0.20 | 0.47 | 0.75 | 0.68 | 0.22 | 0.29 | 0.48 | 0.49 | 0.48 | 0.22 | 0.33 | 0.20 | 0.72 | 0.70 |
| Sp cr. | 0.20 | 0.00 | 0.68 | 0.67 | 0.71 | 0.30 | 0.27 | 0.58 | 0.59 | 0.58 | 0.29 | 0.26 | 0.27 | 0.68 | 0.65 |
| RCI | 0.47 | 0.68 | 0.00 | 0.46 | 0.32 | 0.44 | 0.58 | 0.23 | 0.23 | 0.24 | 0.46 | 0.61 | 0.45 | 0.42 | 0.43 |
| Kw | 0.75 | 0.67 | 0.46 | 0.00 | 0.23 | 0.97 | 0.74 | 0.43 | 0.43 | 0.45 | 0.71 | 0.63 | 0.69 | 0.25 | 0.26 |
| Kw blend | 0.68 | 0.71 | 0.32 | 0.23 | 0.00 | 0.73 | 0.99 | 0.19 | 0.19 | 0.20 | 0.64 | 0.85 | 0.62 | 0.34 | 0.35 |
| Sp (mod.) | 0.22 | 0.30 | 0.44 | 0.97 | 0.73 | 0.00 | 0.23 | 0.46 | 0.47 | 0.46 | 0.24 | 0.34 | 0.23 | 0.71 | 0.71 |
| Sp cr. (mod) | 0.29 | 0.27 | 0.58 | 0.74 | 0.99 | 0.23 | 0.00 | 0.71 | 0.72 | 0.71 | 0.33 | 0.13 | 0.31 | 0.63 | 0.63 |
| RCI (mod.) | 0.48 | 0.58 | 0.23 | 0.43 | 0.19 | 0.46 | 0.71 | 0.00 | 0.00 | 0.00 | 0.44 | 0.77 | 0.42 | 0.48 | 0.49 |
| n-Heptane | 0.49 | 0.59 | 0.23 | 0.43 | 0.19 | 0.47 | 0.72 | 0.00 | 0.00 | 0.01 | 0.45 | 0.78 | 0.43 | 0.48 | 0.49 |
| SBN/IN | 0.48 | 0.58 | 0.24 | 0.45 | 0.20 | 0.46 | 0.71 | 0.00 | 0.01 | 0.00 | 0.43 | 0.77 | 0.41 | 0.50 | 0.51 |
| SBN | 0.22 | 0.29 | 0.46 | 0.71 | 0.64 | 0.24 | 0.33 | 0.44 | 0.45 | 0.43 | 0.00 | 0.31 | 0.00 | 0.91 | 0.88 |
| IN | 0.33 | 0.26 | 0.61 | 0.63 | 0.85 | 0.34 | 0.13 | 0.77 | 0.78 | 0.77 | 0.31 | 0.00 | 0.30 | 0.63 | 0.61 |
| δCO | 0.20 | 0.27 | 0.45 | 0.69 | 0.62 | 0.23 | 0.31 | 0.42 | 0.43 | 0.41 | 0.00 | 0.30 | 0.00 | 0.89 | 0.87 |
| CII(C7) | 0.72 | 0.68 | 0.42 | 0.25 | 0.34 | 0.71 | 0.63 | 0.48 | 0.48 | 0.50 | 0.91 | 0.63 | 0.89 | 0.00 | 0.02 |
| CII(C5) | 0.70 | 0.65 | 0.43 | 0.26 | 0.35 | 0.71 | 0.63 | 0.49 | 0.49 | 0.51 | 0.88 | 0.61 | 0.87 | 0.02 | 0.00 |
| TBP Wide Fraction Yields | IBP-110 °C, wt.% | 110–180 °C, wt.% | 180–240 °C, wt.% | 240–360 °C, wt.% | 360–540 °C, wt.% | >540 °C, wt.% |
|---|---|---|---|---|---|---|
| Min | 1.2 | 1.9 | 2.5 | 12.8 | 18.5 | 5.2 |
| Max | 18.1 | 20.2 | 13.9 | 34.9 | 40.6 | 50.2 |
| μ | IBP-110 °C, wt.% | 110–180 °C, wt.% | 180–240 °C, wt.% | 240–360 °C, wt.% | 360–540 °C, wt.% | >540 °C, wt.% | SP | SP cr (Modified) | RCI (Modified) |
|---|---|---|---|---|---|---|---|---|---|
| IBP-110 °C, wt.% | 1.00 | 0.85 | 0.77 | 0.66 | 0.24 | 0.20 | 0.32 | 0.47 | 0.34 |
| 110–180 °C, wt.% | 0.85 | 1.00 | 0.84 | 0.73 | 0.23 | 0.17 | 0.33 | 0.49 | 0.33 |
| 180–240 °C, wt.% | 0.77 | 0.84 | 1.00 | 0.80 | 0.32 | 0.12 | 0.35 | 0.48 | 0.38 |
| 240–360 °C, wt.% | 0.66 | 0.73 | 0.80 | 1.00 | 0.42 | 0.13 | 0.36 | 0.45 | 0.43 |
| 360–540 °C, wt.% | 0.24 | 0.23 | 0.32 | 0.42 | 1.00 | 0.60 | 0.53 | 0.44 | 0.56 |
| >540 °C, wt.% | 0.20 | 0.17 | 0.12 | 0.13 | 0.60 | 1.00 | 0.66 | 0.53 | 0.55 |
| SP | 0.32 | 0.33 | 0.35 | 0.36 | 0.53 | 0.66 | 1.00 | 0.68 | 0.48 |
| SP cr (modified) | 0.47 | 0.49 | 0.48 | 0.45 | 0.44 | 0.53 | 0.68 | 1.00 | 0.18 |
| RCI (modified) | 0.34 | 0.33 | 0.38 | 0.43 | 0.56 | 0.55 | 0.48 | 0.18 | 1.00 |
| Ν | IBP-110 °C, wt.% | 110–180 °C, wt.% | 180–240 °C, wt.% | 240–360 °C, wt.% | 360–540 °C, wt.% | >540 °C, wt.% | SP | SP cr (Modified) | RCI (Modified) |
|---|---|---|---|---|---|---|---|---|---|
| IBP-110 °C, wt.% | 0.00 | 0.12 | 0.21 | 0.31 | 0.73 | 0.77 | 0.65 | 0.50 | 0.58 |
| 110–180 °C, wt.% | 0.12 | 0.00 | 0.14 | 0.24 | 0.74 | 0.81 | 0.64 | 0.48 | 0.59 |
| 180–240 °C, wt.% | 0.21 | 0.14 | 0.00 | 0.17 | 0.65 | 0.85 | 0.61 | 0.49 | 0.53 |
| 240–360 °C, wt.% | 0.31 | 0.24 | 0.17 | 0.00 | 0.54 | 0.84 | 0.59 | 0.52 | 0.48 |
| 360–540 °C, wt.% | 0.73 | 0.74 | 0.65 | 0.54 | 0.00 | 0.38 | 0.42 | 0.53 | 0.36 |
| >540 °C, wt.% | 0.77 | 0.81 | 0.85 | 0.84 | 0.38 | 0.00 | 0.31 | 0.45 | 0.38 |
| SP | 0.65 | 0.64 | 0.61 | 0.59 | 0.42 | 0.31 | 0.00 | 0.28 | 0.43 |
| SP cr (modified) | 0.50 | 0.48 | 0.49 | 0.52 | 0.53 | 0.45 | 0.28 | 0.00 | 0.74 |
| RCI (modified) | 0.58 | 0.59 | 0.53 | 0.48 | 0.36 | 0.38 | 0.43 | 0.74 | 0.00 |
| Range | SG | Sat | Aro | Res | n-C7 asp. | n-C5 asp. | Tb | T10 | T30 | T50 | T70 | T90 | Kw | Sp Critical |
|---|---|---|---|---|---|---|---|---|---|---|---|---|---|---|
| min | 0.773 | 6.0 | 7.1 | 1.4 | 0.0 | 1.8 | 196 | 98 | 174 | 187 | 193 | 245 | 10.6 | 3.3 |
| max | 1.111 | 91.1 | 69.2 | 11.1 | 36.6 | 47.7 | 659 | 429 | 639 | 667 | 700 | 984 | 12.6 | 62.9 |
Disclaimer/Publisher’s Note: The statements, opinions and data contained in all publications are solely those of the individual author(s) and contributor(s) and not of MDPI and/or the editor(s). MDPI and/or the editor(s) disclaim responsibility for any injury to people or property resulting from any ideas, methods, instructions or products referred to in the content. |
© 2024 by the authors. Licensee MDPI, Basel, Switzerland. This article is an open access article distributed under the terms and conditions of the Creative Commons Attribution (CC BY) license (https://creativecommons.org/licenses/by/4.0/).
Share and Cite
Shiskova, I.; Stratiev, D.; Tavlieva, M.; Nedelchev, A.; Dinkov, R.; Kolev, I.; van den Berg, F.; Ribagin, S.; Sotirov, S.; Nikolova, R.; et al. Application of Intercriteria and Regression Analyses and Artificial Neural Network to Investigate the Relation of Crude Oil Assay Data to Oil Compatibility. Processes 2024, 12, 780. https://doi.org/10.3390/pr12040780
Shiskova I, Stratiev D, Tavlieva M, Nedelchev A, Dinkov R, Kolev I, van den Berg F, Ribagin S, Sotirov S, Nikolova R, et al. Application of Intercriteria and Regression Analyses and Artificial Neural Network to Investigate the Relation of Crude Oil Assay Data to Oil Compatibility. Processes. 2024; 12(4):780. https://doi.org/10.3390/pr12040780
Chicago/Turabian StyleShiskova, Ivelina, Dicho Stratiev, Mariana Tavlieva, Angel Nedelchev, Rosen Dinkov, Iliyan Kolev, Frans van den Berg, Simeon Ribagin, Sotir Sotirov, Radoslava Nikolova, and et al. 2024. "Application of Intercriteria and Regression Analyses and Artificial Neural Network to Investigate the Relation of Crude Oil Assay Data to Oil Compatibility" Processes 12, no. 4: 780. https://doi.org/10.3390/pr12040780
APA StyleShiskova, I., Stratiev, D., Tavlieva, M., Nedelchev, A., Dinkov, R., Kolev, I., van den Berg, F., Ribagin, S., Sotirov, S., Nikolova, R., Veli, A., Georgiev, G., & Atanassov, K. (2024). Application of Intercriteria and Regression Analyses and Artificial Neural Network to Investigate the Relation of Crude Oil Assay Data to Oil Compatibility. Processes, 12(4), 780. https://doi.org/10.3390/pr12040780