Article

Study on the Mechanism of Wellbore Blockage and Scaling Trend Prediction of Keshen Block

1
Unconventional Petroleum Research Institute, China University of Petroleum (Beijing), Beijing 102249, China
2
Tarim Oilfield Company ta Southwest Exploration and Development Company, Kashgar 844000, China
3
China Oilfield Services Limited, Tianjin 300457, China
*
Author to whom correspondence should be addressed.
Processes 2024, 12(4), 782; https://doi.org/10.3390/pr12040782
Submission received: 4 March 2024 / Revised: 8 April 2024 / Accepted: 10 April 2024 / Published: 13 April 2024
(This article belongs to the Section Chemical Processes and Systems)

Abstract

:
Located in the Kuqa foreland basin, Tarim Basin, the Xinkeshen gas field is a rare ultra-deep and ultra-high-pressure fractured tight sandstone gas reservoir. During the development process, the fluid in the well migrates from the bottom hole to the ground. Due to the huge temperature drop and pressure drop in the wellbore, salting-out and scale-out occur in the well to destroy the oil and gas flow channel, resulting in a decrease in gas production in the well and seriously affecting the normal production of the oil field. Aiming at the problem of wellbore scaling and blockage in the Keshen gas field, this paper takes the wellbore of the Keshen block as the research object. After analyzing the composition of produced water and scale in the wellbore, the solution of ‘fixing scale, clarifying mechanism, early prediction, and fine treatment’ is formulated, and the analysis and evaluation technology of the scale formation process and the prediction model of the gas well model are formed. The wellbore blockage in Keshen block is composed of iron oxide, calcium carbonate crystal, calcite crystal, and wellbore steel falling off due to electrochemical corrosion. It is indicated that the scale attached to the steel sheet causes electrochemical corrosion of the steel sheet, resulting in ‘hydrogen embrittlement’, resulting in the bubbling and falling off of the wellbore steel. Through simulation, it is found that the amount of fouling increases with the increase in wellbore depth, and the amount of fouling is 1.97 kg/d at 6800 m, which is in good agreement with the actual situation. Based on the temperature and pressure curves in the wellbore, the simulation results show that the corrosion rate reaches the highest value of 6.37 mm/yr at the depth of 3400 m. Because of the above problems, a polyaspartic acid scale inhibitor with a scale inhibition rate of 98.9% for wells in Keshen block was synthesized. It has important guidance and reference significance for the accurate treatment of scaling problems in the Keshen gas well.

1. Introduction

The Keshen gas field is a rare ultra-deep, ultra-high-pressure fractured dense sandstone gas reservoir [1], and the development of fractures in the reservoir is an important factor in maintaining high production rates in the Keshen gas field [2,3,4,5]. When the formation water is transported along the fractures to the rock matrix, the flow rate of the formation water decreases and the formation water is retained in the fractures of the matrix as stagnant water [6,7]. Stagnant water has good dissolution properties during transport in the rock matrix, and complex water–rock reactions are constantly occurring in contact with the surrounding rock [8]. As the sandstone formation loosens, the cohesion within the rock body is weakened by the water generated by the bed water and side water, resulting in enhanced in situ sand production [9] and promoting scaling and blockage in the wellbore. In the Keshen gas field [10], as the stagnant water travels from the pores in the rock to the wellbore, the tiny sand particles it carries attach to the wellbore tubing, providing a nucleus for the ionic precipitation in the formation water to heterogeneously nucleate [11,12]. In addition, due to the large temperature and pressure gradients in the stagnant water from the reservoir to the wellbore, the HCO3 in the stagnant water will convert to CO32− and generate CaCO3 precipitation, which can lead to further scaling in the wellbore [13,14]. At the same time, the inorganic salt scale and stagnant water can also form a concentrated potential with the wellbore steel, and wellbore corrosion can occur [15].
Previous studies of scaling corrosion have been derived from field observations and indoor physical simulation experiments [16,17,18,19,20]. M. Zahedzadeh [16] sampled and analyzed produced water from an oil field in Iran every three months to track changes in its composition. Vazirian [12] found that the rate of steel surface fouling was mainly controlled by the ‘deposition process’ rather than the ‘adhesion process’. However, due to the complexity of field conditions and the long lead time of the experiments, there are certain lags and limitations in the physical simulations. Numerical simulation methods are widely used as an effective technique for reservoir condition evaluation and prediction. With the combination of field data and indoor physical simulation experiments and the reasonable setting of simulation parameters, the problems of variable conditions and large time scales can be better overcome to compensate for the shortcomings of field observations and indoor experiments and to predict the future conditions of the production site. The main methods commonly used in oil and gas fields to solve wellbore scale plugging include physical and chemical methods. The working conditions influencing the physical methods have complex maintenance procedures, and high costs, and do not completely solve the scale plugging problem. Liu [21] synthesized a polyaspartic acid (PASP) scale inhibitor using maleic anhydride and ammonium carbonate as raw materials and demonstrated that 5 mg/L PASP inhibited calcium carbonate and calcium sulfate by 95% and 90%, respectively. Polyaspartic acid is green, non-polluting, does not contaminate water, and is biodegradable. At the same time, PASP also has an anti-corrosive effect. Cui [22] found that the electrochemical impedance spectrum increased with increasing PASP concentration, with the highest inhibition rate of 80.33% at 108 °C [23].
During the transport of scale from the bottom of the well to the surface, the scale produced at depth must be in the innermost core of the scale. In this paper, we targeted the Keshen well and carried out layer-by-layer dissection of the wellbore blockage to obtain information on the composition of each layer in the transport from the bottom of the well to the surface, to infer the formation process of scale. In addition, high-temperature and high-pressure physical simulation experiments were carried out on Keshen block bore steel (N80) to reveal the blocking mechanism of Keshen block by comparing the microscopic morphology and ion concentration changes of the solution at different reaction times, combined with the results of scale profiling. Based on the above data, a wellbore scaling and corrosion rate prediction model was established to predict the location of wellbore scaling, the amount of scaling, and the corrosion rate, to guide the oilfield to carry out accurate protection of the wellbore. Finally, a green and runny poly aspartic acid (PASP)-based scale inhibitor was synthesized, and its scale inhibition performance was evaluated to provide the oilfield with wellbore agents to solve wellbore blockage.

2. Experimental Materials and Methods

2.1. Materials

Sodium chloride, magnesium chloride, potassium chloride, calcium chloride anhydrous, barium chloride anhydrous, strontium chloride hexahydrate, potassium sulfate, sodium bicarbonate, ammonium carbonate, maleic anhydride, N, N-dimethylformamide, potassium hydroxide, sodium hydroxide, potassium persulphate, calcium-carboxylic acid indicator, disodium EDTA standard titration solution (0.01 M), sodium borate tetradecahydrate, bromomethyl green, methyl red, and carbon dioxide (Beijing Jinggao Ltd., Beijing, China).

2.2. Experimental Apparatus

B11-600 thermostatic oven (Tianjin Zhonghuan Experimental Electric Furnace Co., Ltd., Tianjin, China), Quanta 200F field emission environmental scanning electron microscope (Thermo Fisher Scientific, Waltham, MA, USA), ICP-OES inductively coupled plasma emission spectrometer (Thermo Fisher Scientific), analytical balance (Xiang Yi Balance Factory, Xiangtan, China).

2.3. Experimental Method to Simulate the Mechanism

Based on a clear wellbore scale, high temperature and high-pressure physical simulation experiments were conducted on the N80 steel sheet to investigate the relationship between surface fouling and corrosion of the N80 steel sheet, and the experimental steps were as follows.
(1)
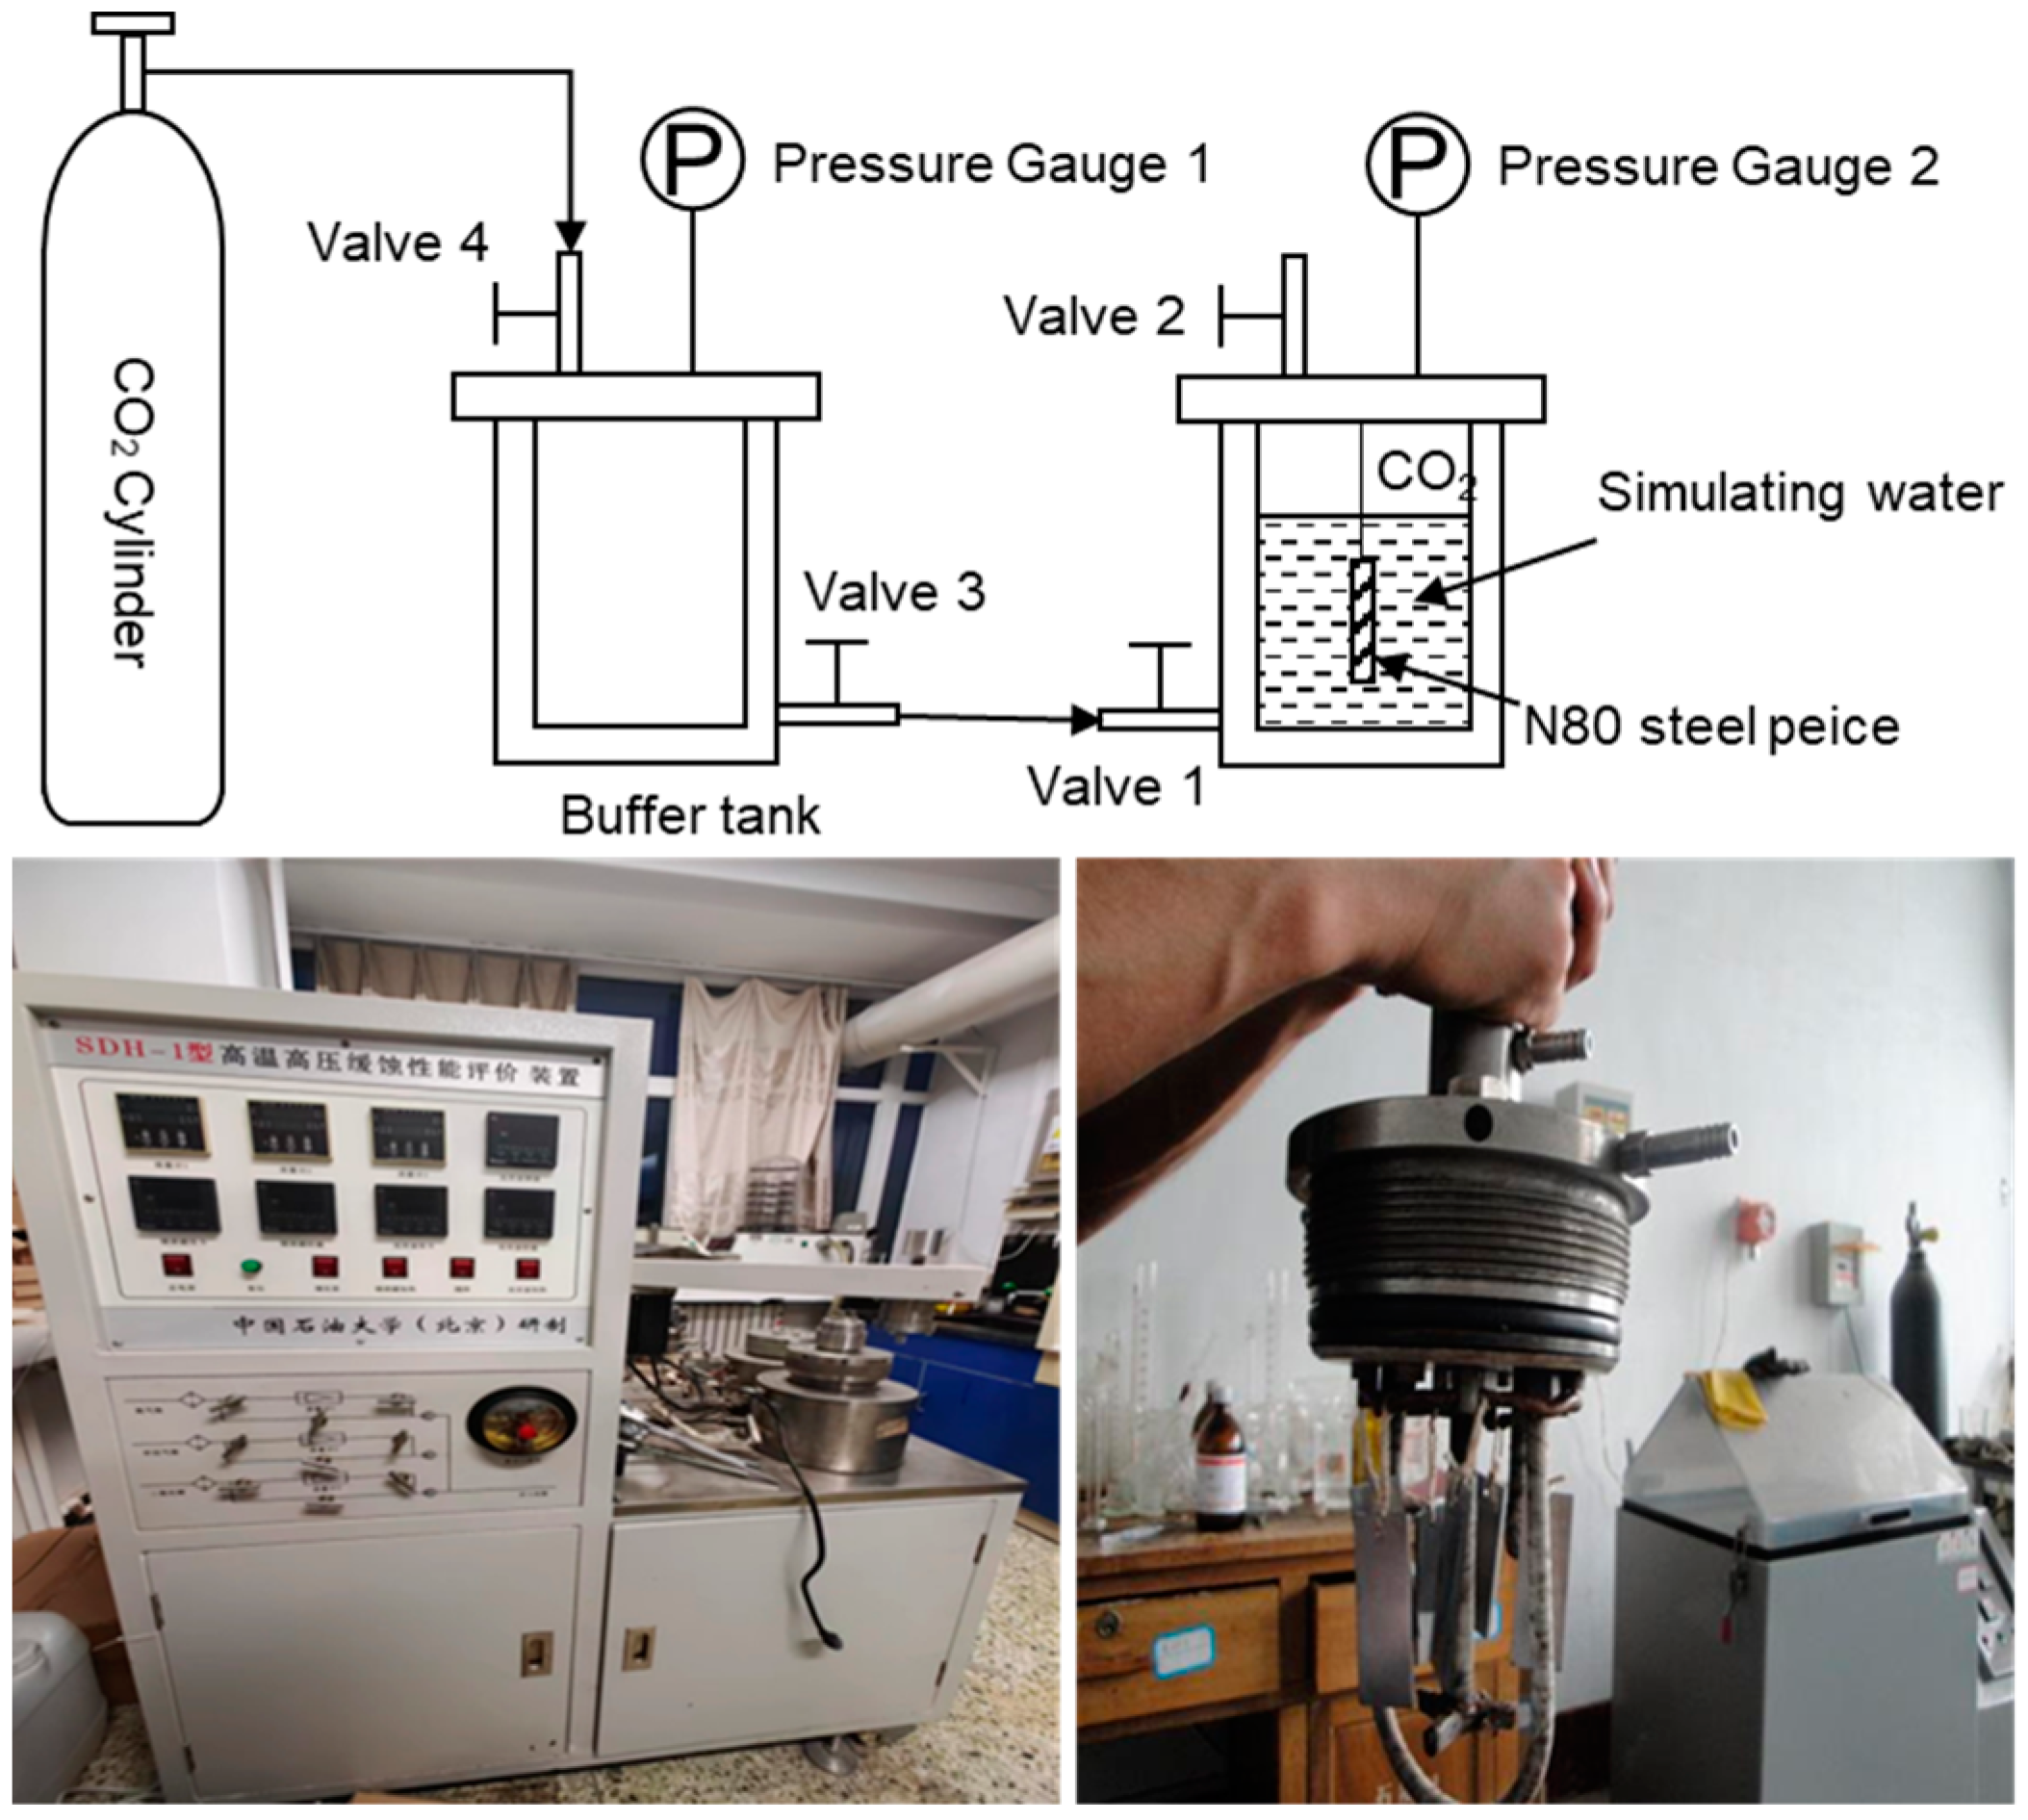
We chose grams of deep block bore from the same N80 steel sheet as for hanging experiments; the experimental device is shown in Figure 1. The N80 steel sheet elemental composition is shown in Table 1. The steel piece was immersed in petroleum ether for 3 h to dissolve the grease protecting the surface of the N80 steel sheet. After drying the surface with filter paper, the N80 steel piece was washed with anhydrous ethanol to remove the grease and water stains adhering to the surface of the piece. We weighed the test piece with an electronic balance of one-thousandth accuracy and record as m0.
(2)
The ionic concentration of the simulated water is shown in Table 2. We placed the dried N80 steel sheet into the reaction kettle and added 50 mL of simulated water to the kettle. We placed the treated N80 steel sheet into the experimental reactor, added 50 mL of simulated water, and screwed it down. We opened reactor valve 2, valve 3, and valve 4, opened the CO2 gas cylinder (pay attention to the buffer tank pressure), slowly opened valve 1, and passed in the CO2 gas. After the air in the reactor had been exhausted, we closed valve 2 of the reactor and continued to pass in CO2 gas from valve 1. When the pressure in the reactor reached the experimental pressure, we closed valve 2 and finished pressurizing the reactor. The pressurized reactor was placed in a thermostat for one week, two weeks, four weeks, and eight weeks. After completion of the reaction, the N80 steel sheet was removed, cleaned and dried, and weighed, and recorded as m1, m2, m3, and m4.
(3)
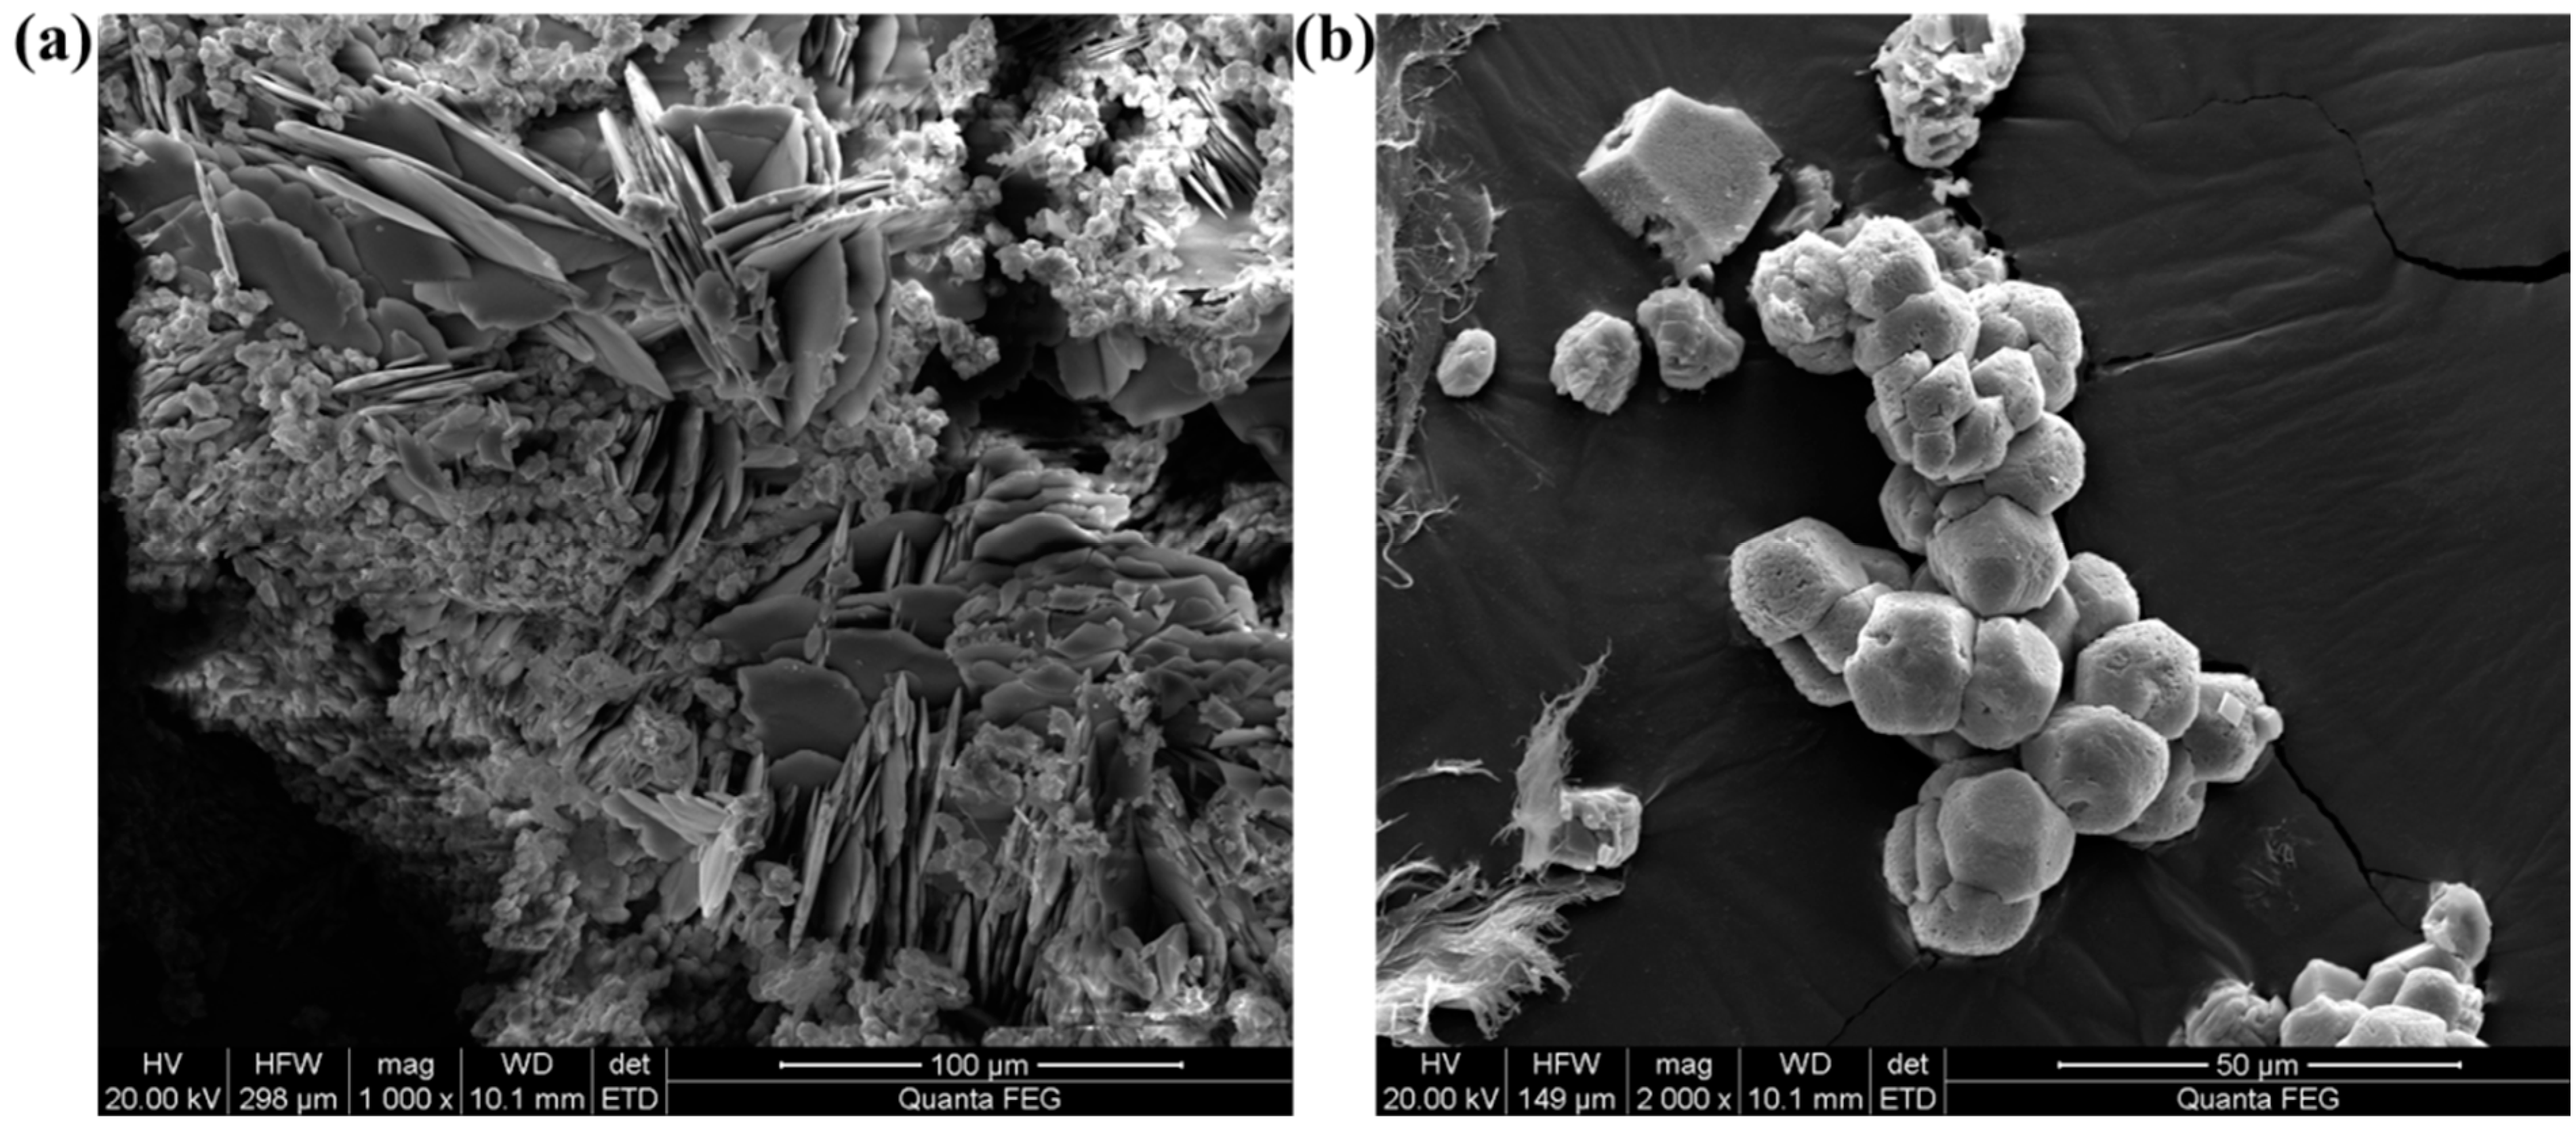
We performed a surface micromorphology analysis of the dried N80 steel sheet using SEM and ion concentration analysis of the reaction solution using ion chromatography.

2.4. Wellbore Fouling and Corrosion Trend Predictions

The Keshen block is complex and the numerical simulation method is a good remedy to the difficulty of simulating the scaling and corrosion in the various sections of the well due to the physical simulation experiments. ScaleChem stores the Ksp of all the solids used in the chemical model. The predictive simulation inputs the data provided by the Keshen site, such as the composition of the produced water in the well (Table 2) and the temperature and pressure profile in the wellbore (Table 3), and combines the results of the analysis of the scale samples in the wellbore to determine the composition of the scale in the wellbore. The results of the analysis of the scale samples in the wellbore are combined to determine the composition of the scale material in the wellbore and hence the prediction of in-well scaling. The fouling trend is defined as the ratio of the activity product (Q) of the equilibrium equation to the solubility product (Ksp) of the same equation. When the Q/Ksp ratio is greater than 1, there is a tendency for precipitation to form. When the ratio is less than 1, there is little tendency for precipitation to form.
OLI-Corrosion Analyzer software (https://www.olisystems.com/software/oli-studio/oli-studio-corrosion-analyzer/, accessed on 23 May 2021) was selected for the prediction of wellbore corrosion patterns. N80 steel (refer to Table 1 for the elemental composition of N80) was selected as the wellbore material for the Keshen block. The simulations were further investigated to predict the corrosion rate of steel in the wellbore at different depths by combining factors such as flow rate, well depth (temperature and pressure), pH, and partial pressure of CO2 in natural gas.

2.5. Synthesis and Testing of Scale Inhibitors

The experiment was carried out using maleic anhydride and ammonium carbonate as raw materials. In total, 23.1 g of ammonium carbonate was first added to a three-necked round-bottom flask, which was firstly heated to decompose the ammonium carbonate to produce an ammonia source, after which 19.6 g of maleic anhydride and N, N-dimethylformamide (DMF) were added and poured into the three-necked round-bottom flask. After heating to 220 °C and stirring for 5 h, the reaction solution was poured into a beaker and approximately 300 mL of anhydrous ethanol was added, at which point the solution became cloudy. The solution with anhydrous ethanol was poured into a centrifuge tube and centrifuged at 6000 r/min. After 5 min, the tube was removed, the top layer of liquid was poured off, and the precipitate formed at the bottom of the tube was poly succinimide (PSI). Separately we weighed 0.50 g of polysuccinimide (PSI) and 1.38 g of G reagent. We added 0.50 g of poly succinimide and 1.38 g of G reagent to a three-necked round-bottom flask containing 40 mL of ionized water and heat in a water bath at 60 °C for 14 h to obtain the G-PASP scale inhibitor.

2.6. Scale Inhibitor Scale Inhibition Performance Test

The scale inhibition performance of the scale inhibitor was tested according to GB/T 16632-2019 [24]. In total, 25 mL grams of well block formation water and scale inhibitor G-PASP were mixed uniformly and sealed in clean ampoules and reacted in a water bath at 80 °C for 6–14 h. At the end of the reaction, the resulting mixture was collected and cooled to room temperature. The concentration of Ca2+ in the solution was measured using the ethylenediaminetetraacetic acid (EDTA) titration method.

3. Results and Discussion

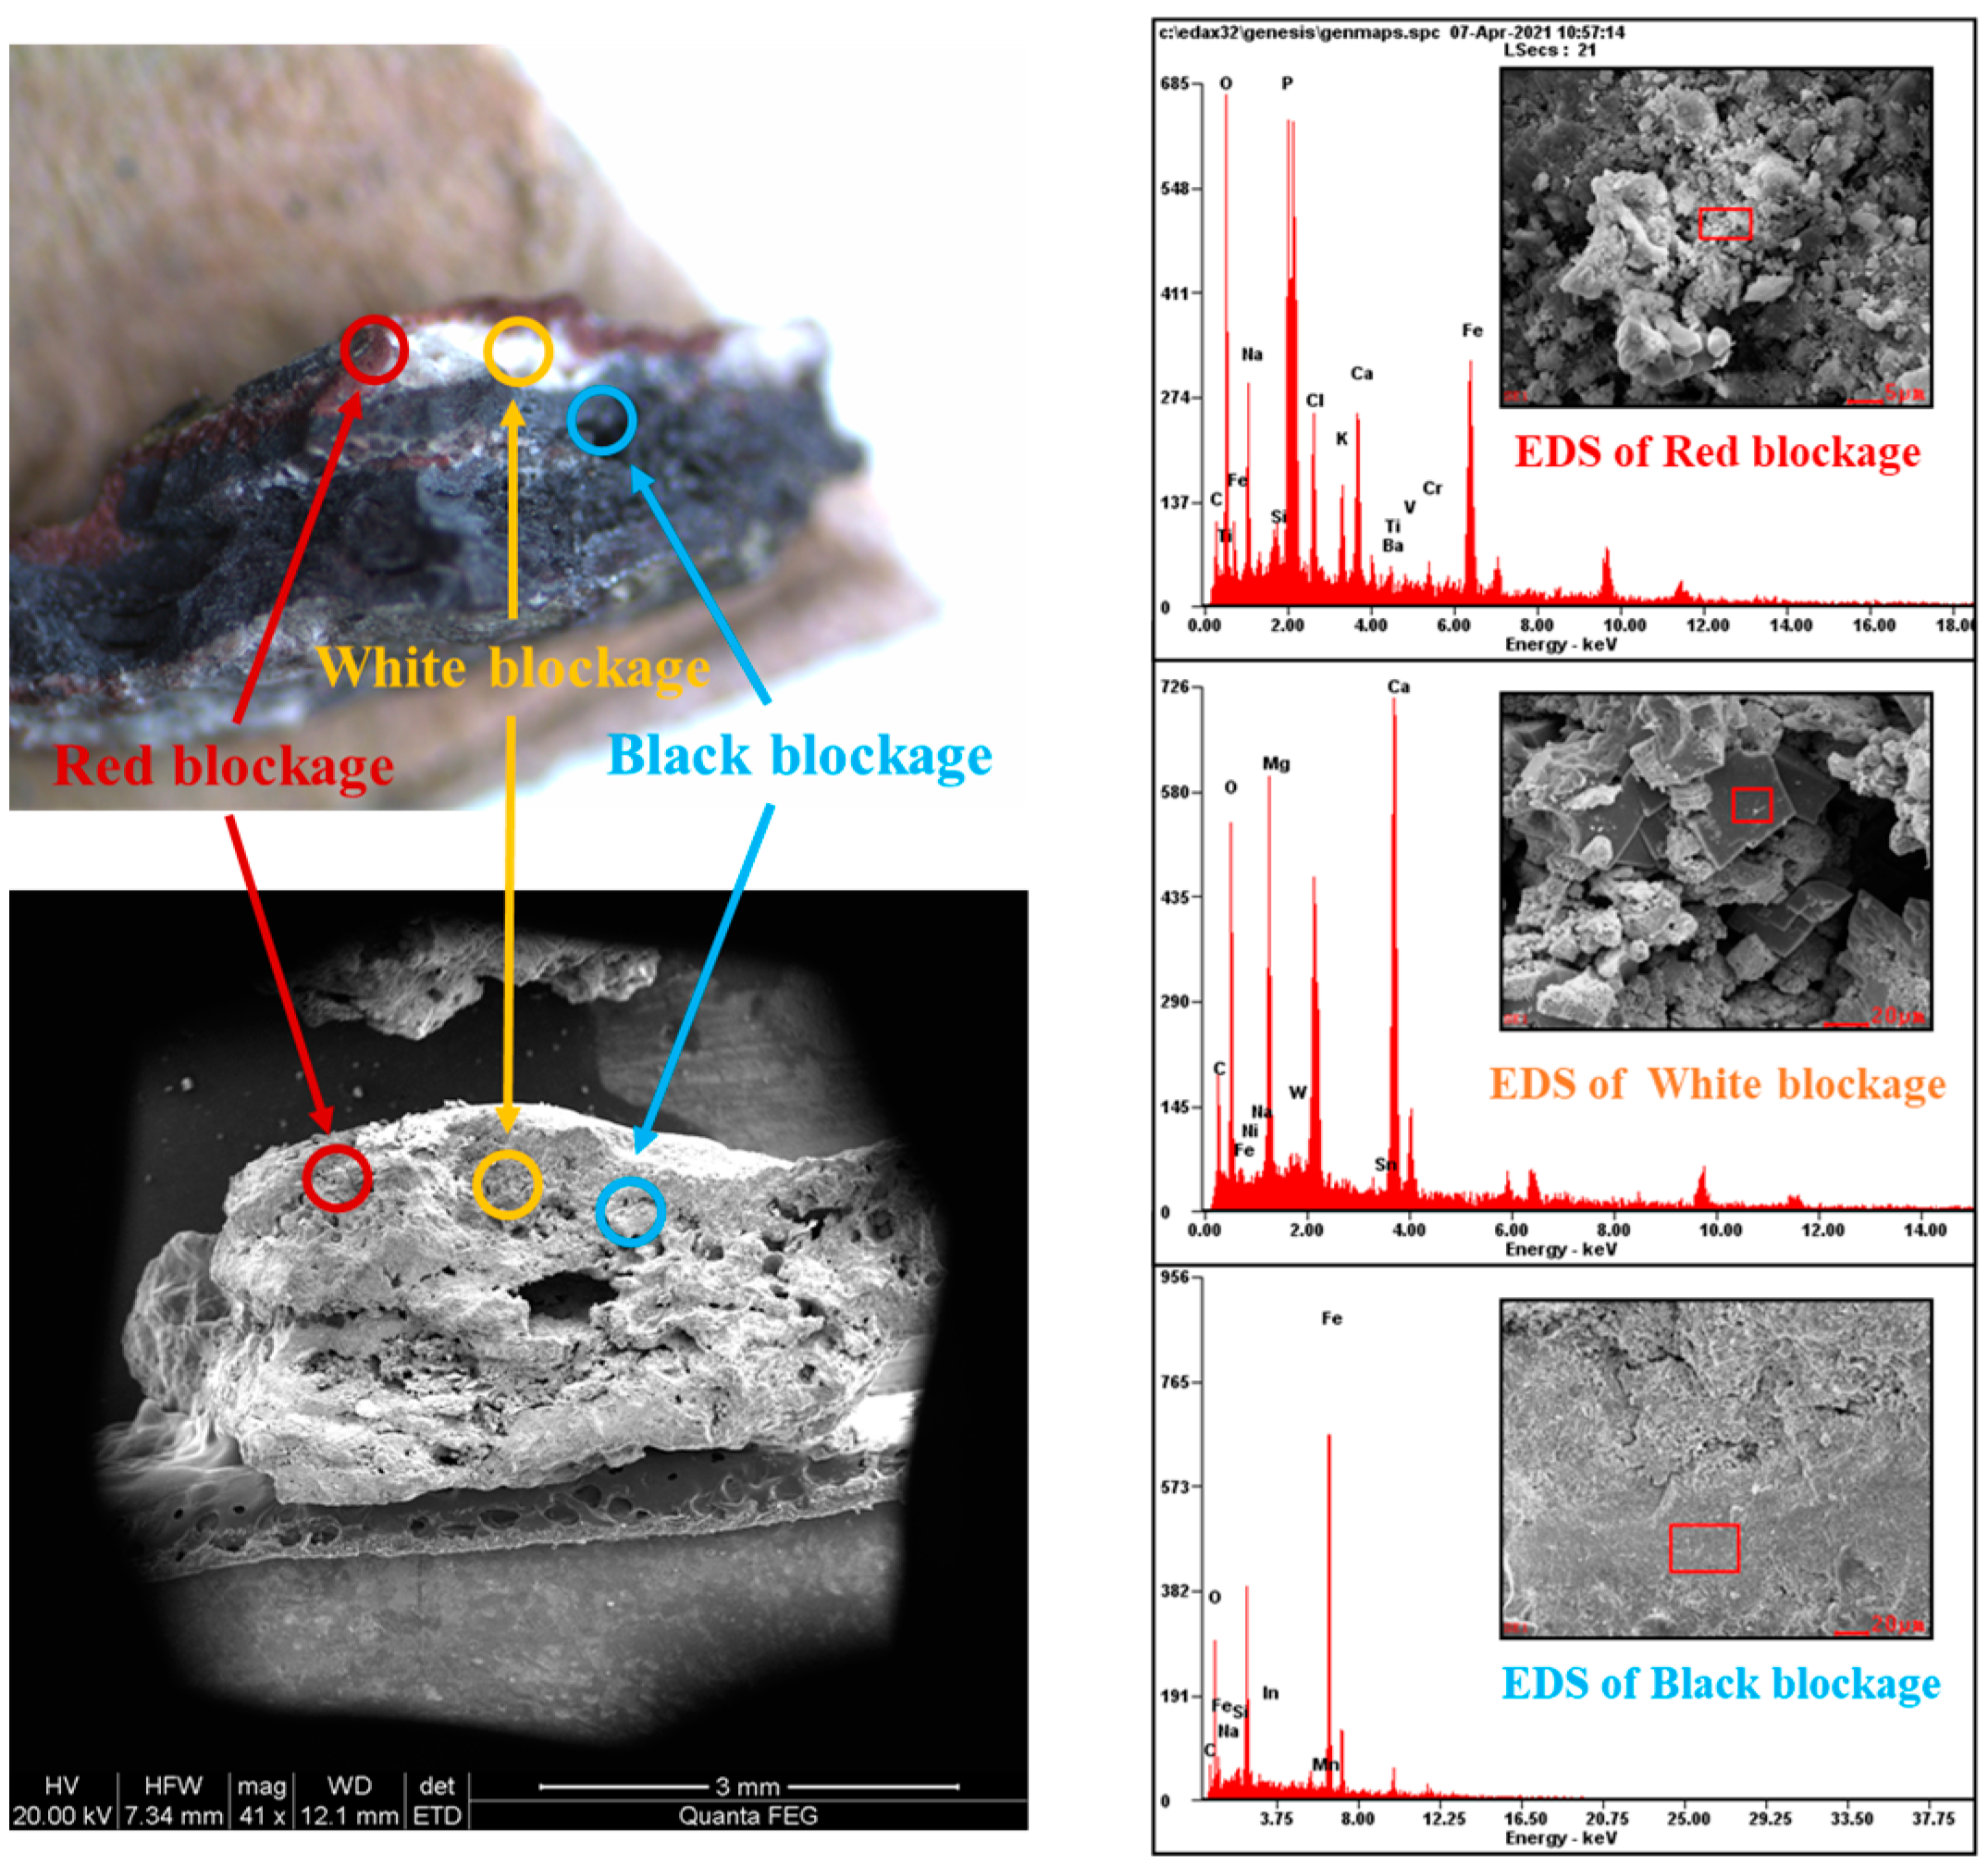
3.1. Analysis of Wellbore Scale Composition

Determining the structure and composition of the wellbore scale is fundamental to the study of wellbore obstruction. Figure 2 shows SEM and EDS images of the wellbore minerals.
As shown in the left panel of Figure 2, the blockage can be observed to consist of a stack of white, black, and red material. Through the red square region is analyzed by energy spectrum scanning, it can be obtained that the absorption peaks of elements such as C, O, Fe, and Ca are observed in the energy spectrum of the surface red blockage, which can be determined to have iron oxides and calcium carbonate crystals. The crystals are mutually encapsulated, and it is tentatively judged that scaling and corrosion are occurring simultaneously. The electron microscope photograph of the white blockage can observe flake, strip crystals, and granular accumulation, there are absorption peaks of Ca, Mg, C, and O elements in the energy spectrum, and preliminary judgment of square scaly crystals are dolomite and calcite crystals. The bottom black blockage carbon and iron elements’ content are high after analysis and scaling is considered to be caused by electrochemical corrosion from the original pipe off the steel. In summary, the scale in the wellbore is mainly composed of calcite, dolomite, and oxides of the steel of the wellbore.

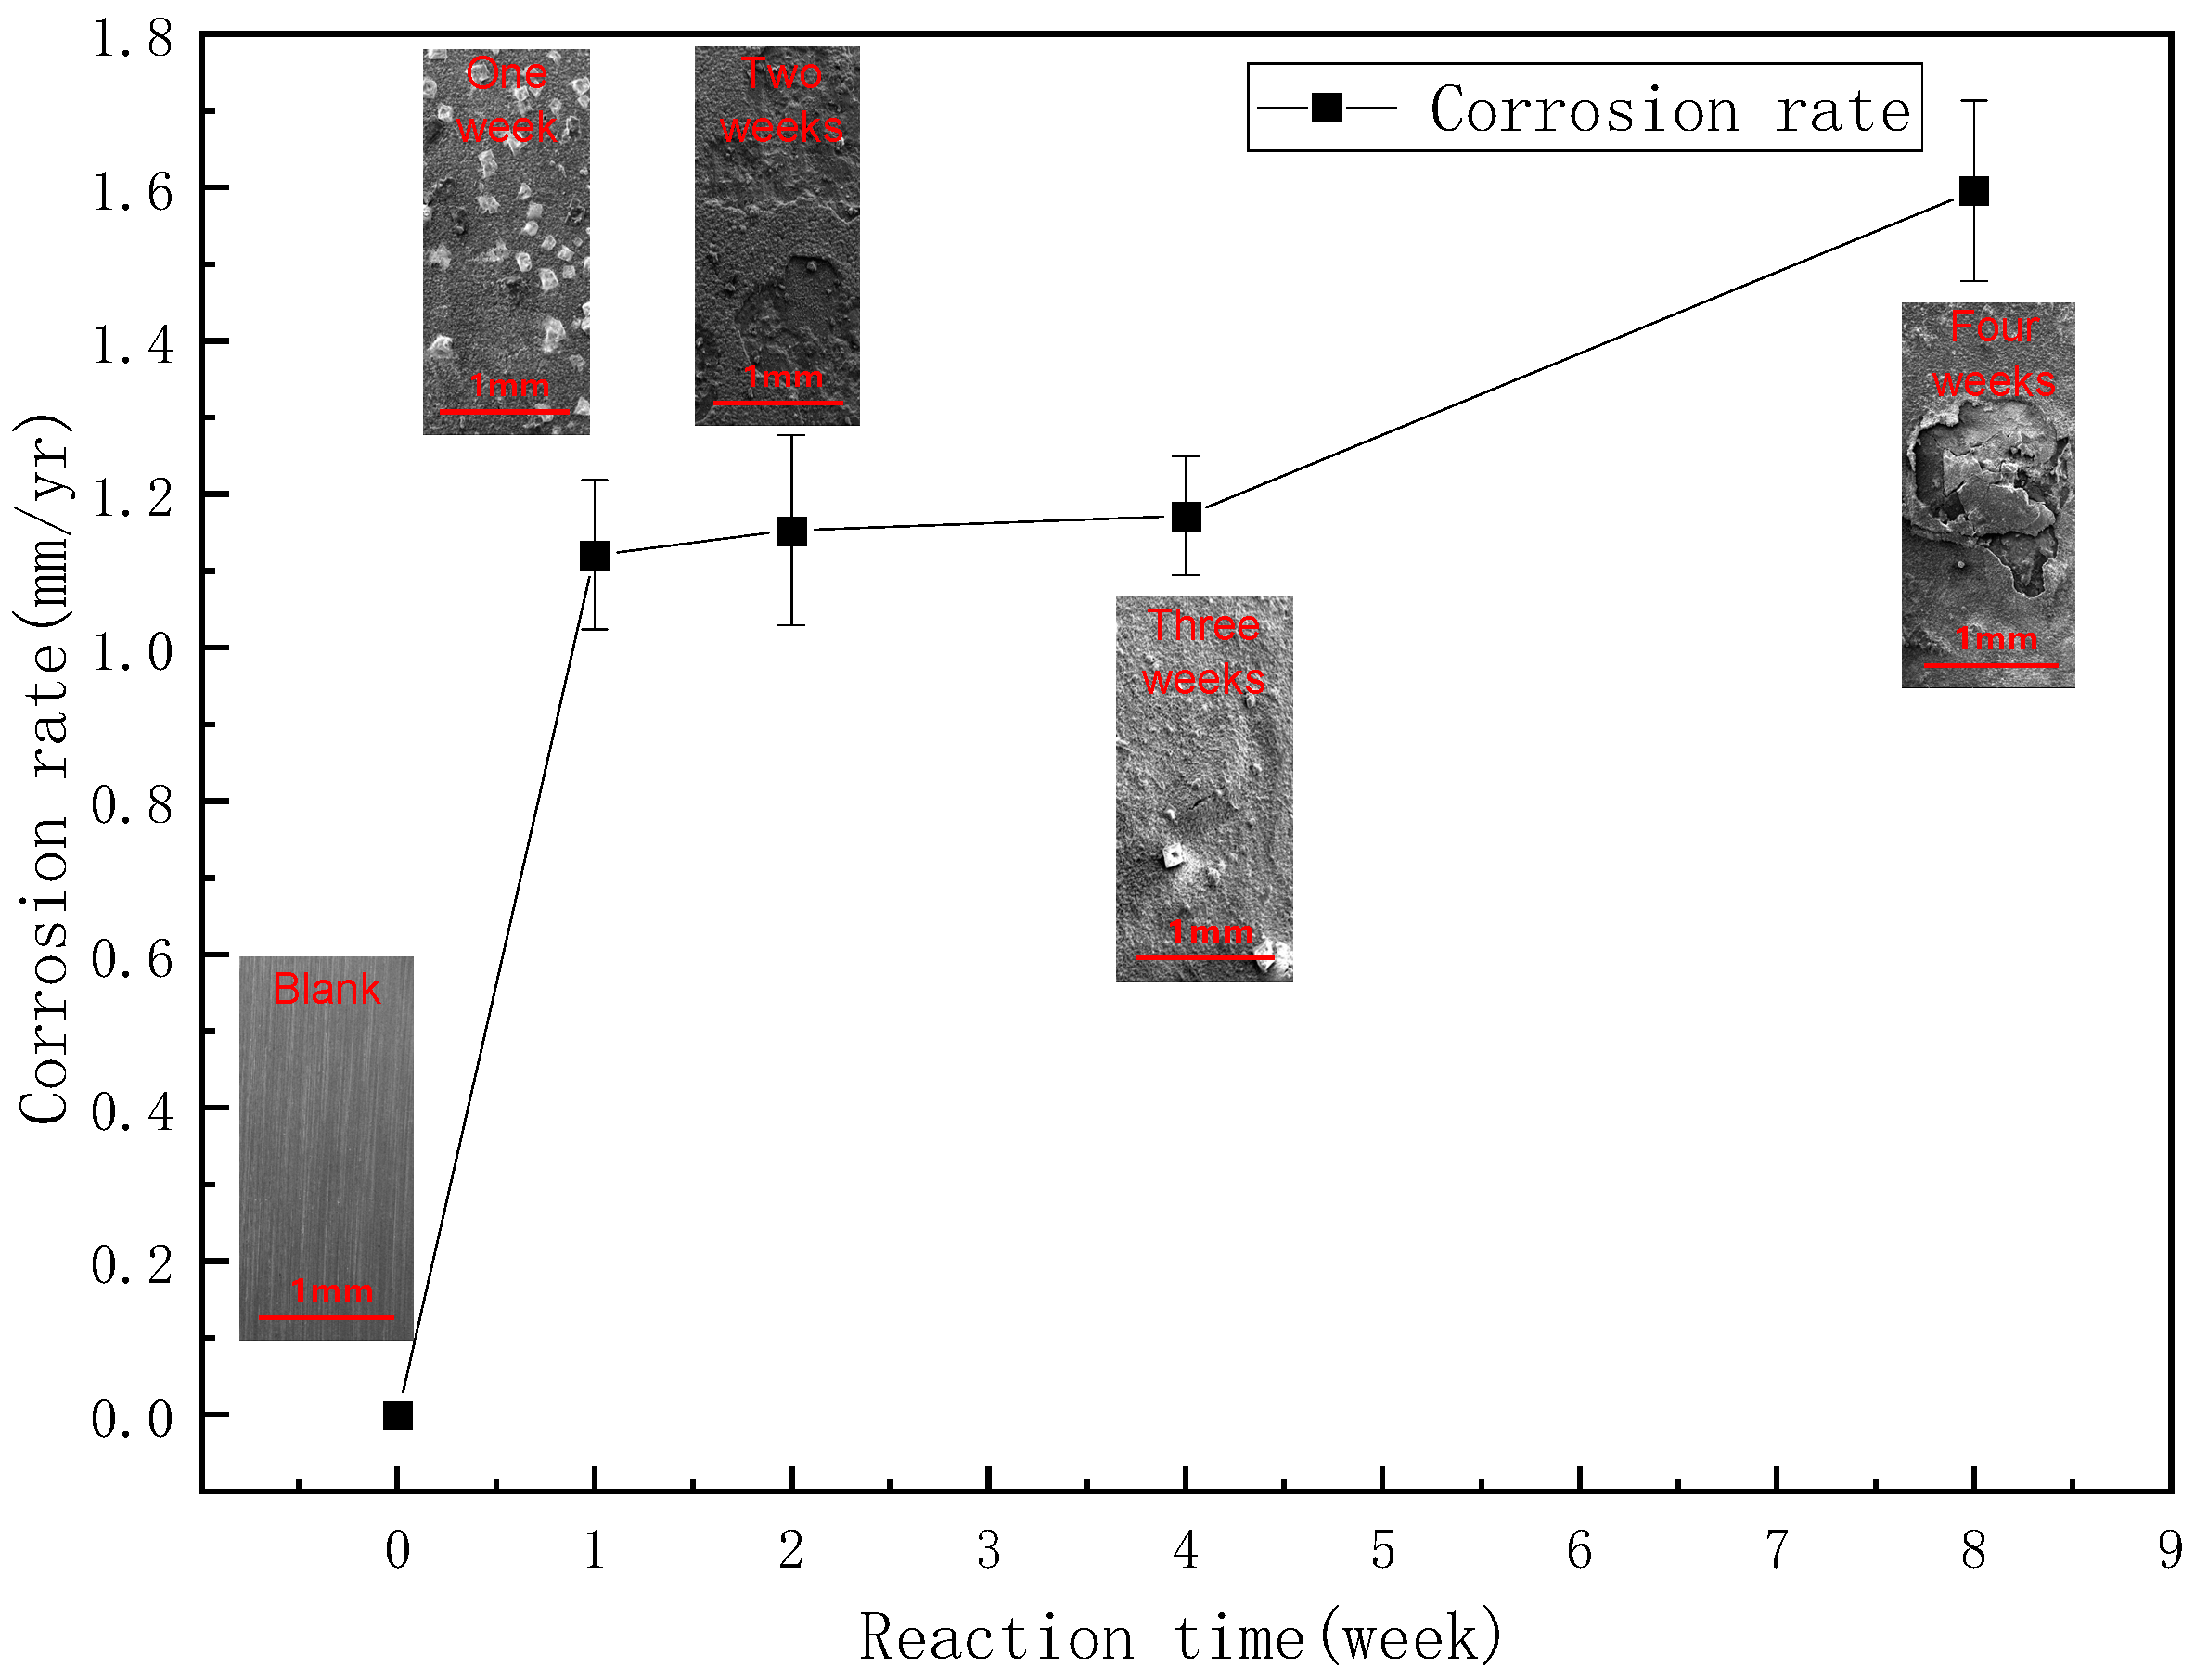
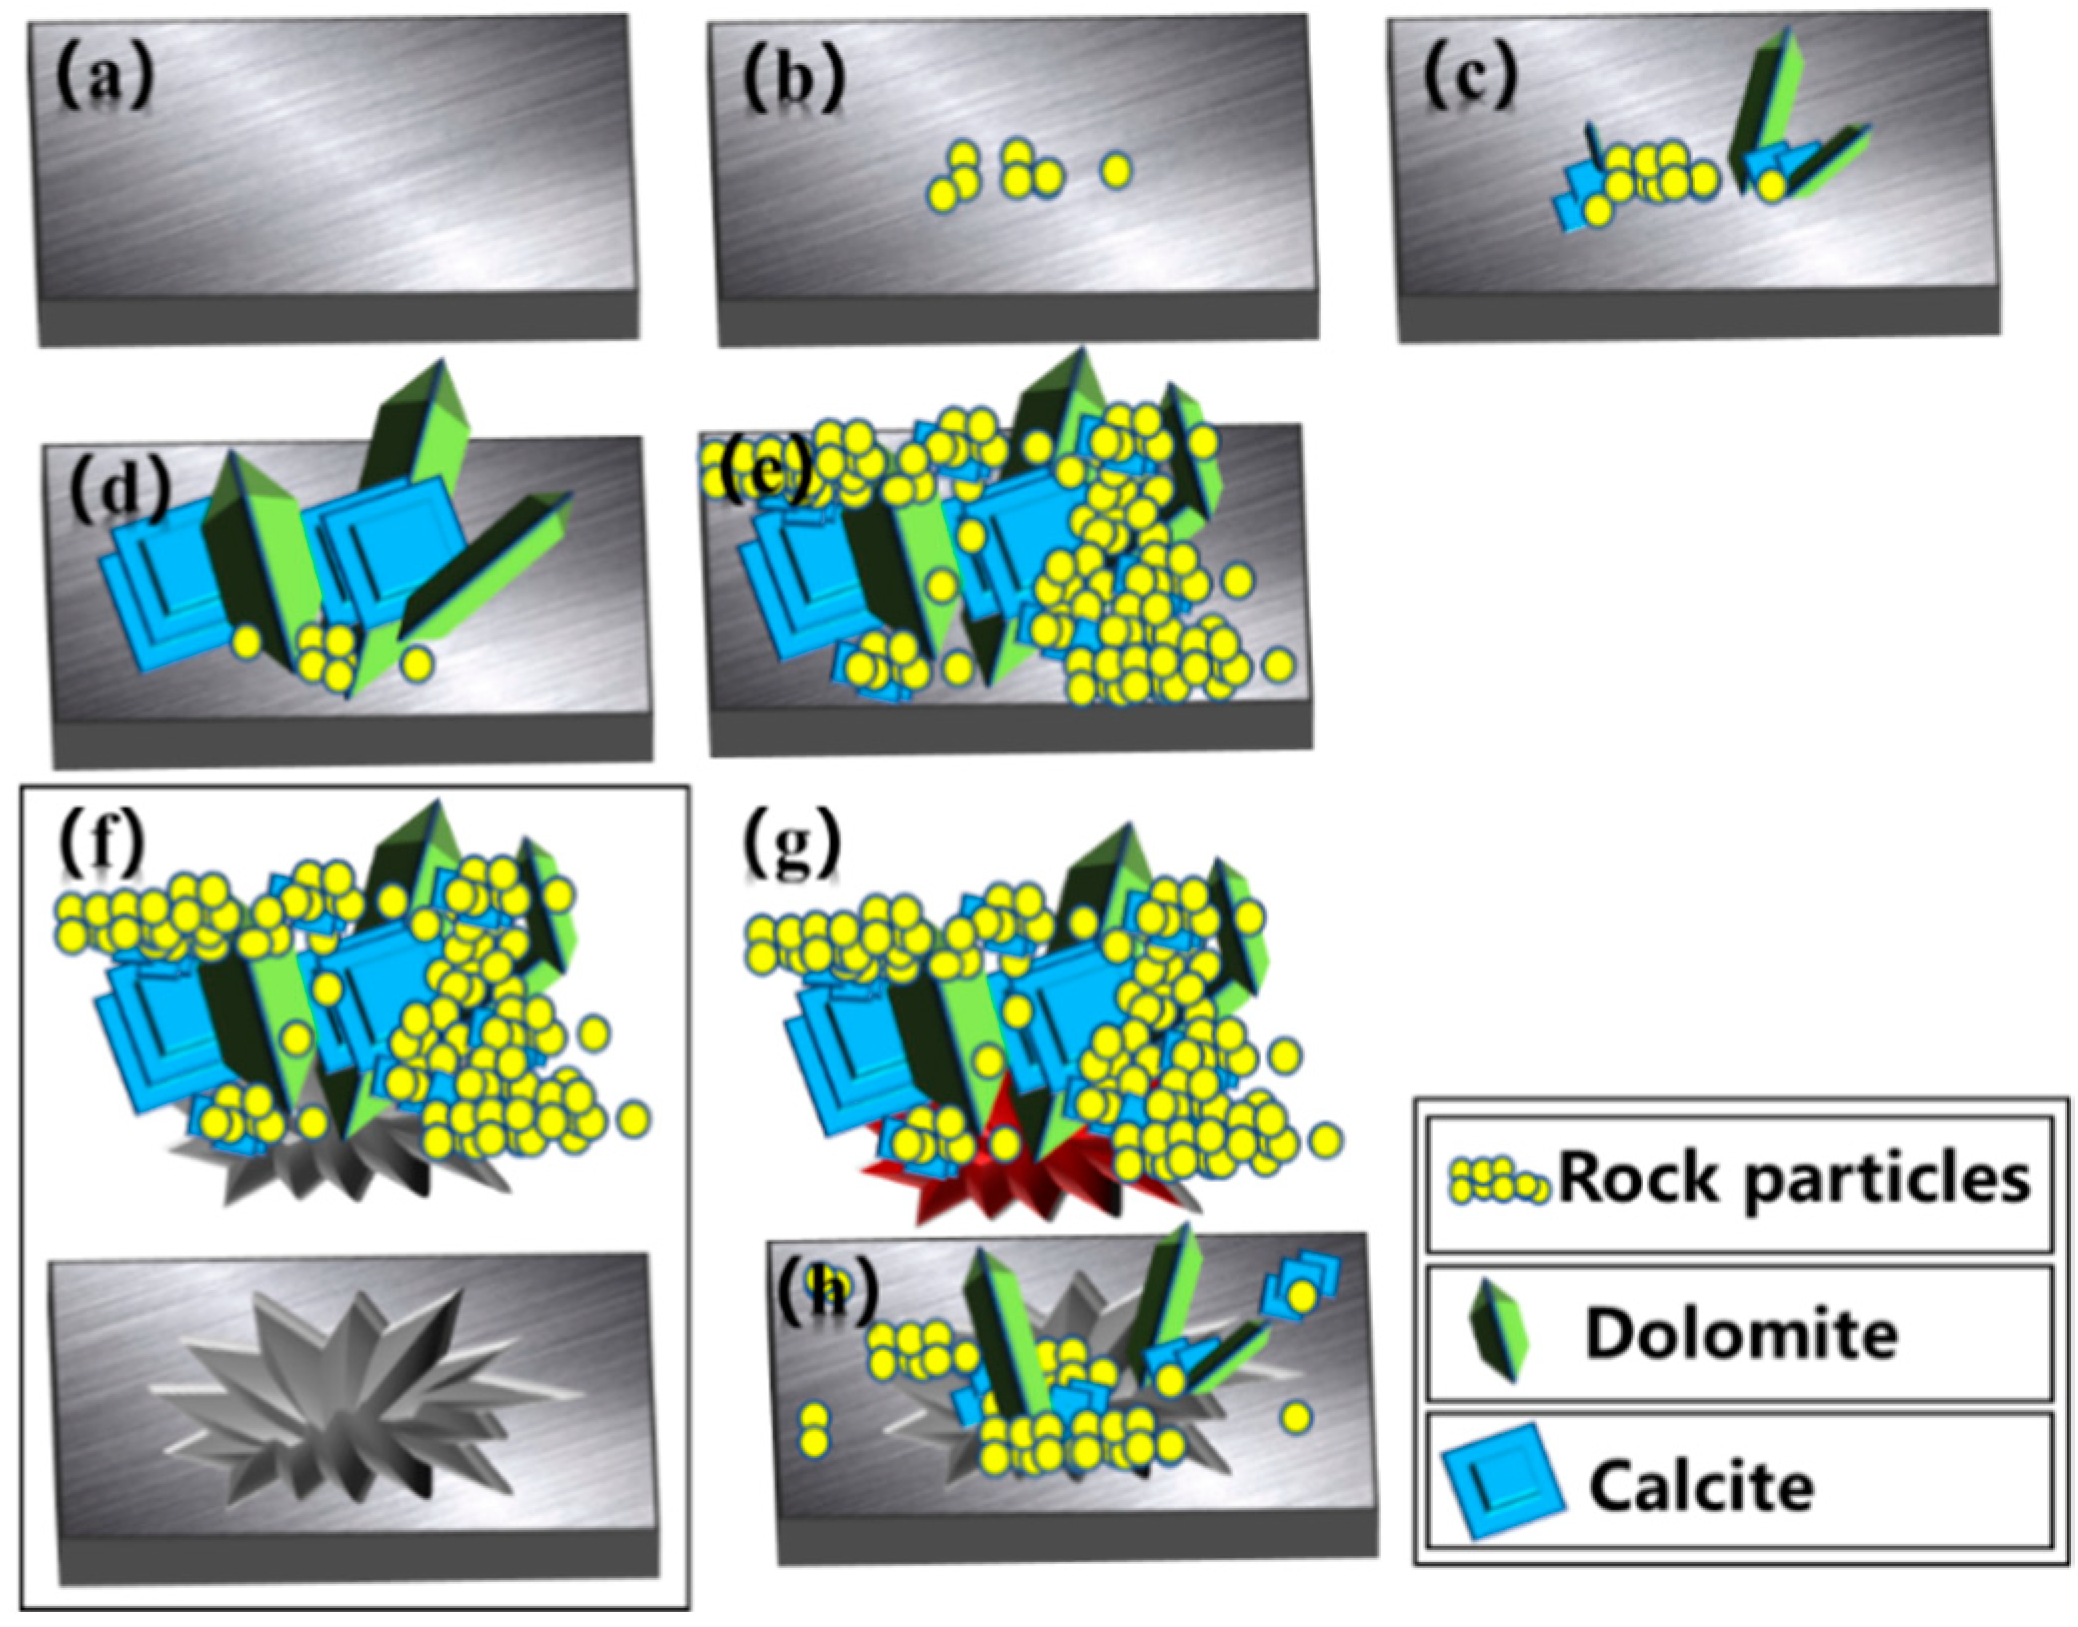
3.2. Study of Wellbore Fouling and Corrosion Patterns in Blocks in Keshen

Based on the results obtained for the composition of the wellbore obstruction, physical simulation experiments were carried out to investigate the relationship between surface fouling and corrosion of N80 steel sheets.
After one week of reaction, there was a large amount of scale deposited on the N80 steel sheet (Figure 3). Electron micrographs from the second week show that the metal matrix has flaked off the surface of the steel sheet. The fourth week’s electron microscopy shows that the spalled metal matrix had been filled in with scale and a crack can be found on the steel sheet, indicating that sub-scale corrosion has occurred. After eight weeks of reaction, a large area of blistering occurs on the surface of the N80 steel sheet, indicating that severe electrochemical corrosion has occurred on the surface of the N80 steel sheet. From the first week to the fourth week of the reaction, the corrosion rate of the N80 steel sheet was equal, approximately 1.23 mm/yr. When the reaction proceeded to the eighth week, the corrosion rate of the N80 steel sheet suddenly increased to 1.59 mm/yr. Combined with the SEM diagram and the solution ion concentration table, it can be seen that the surface of the N80 steel sheet showed the phenomenon of hydrogen embrittlement bulging in the eighth week, which proves that electrochemical corrosion occurred, resulting in an accelerated corrosion rate.
The formation process of the wellbore scale is shown in Figure 4, where the square flake crystals are calcite crystals, the granular accumulation is rock particles and the striped crystals are dolomite crystals. Figure 4a represents the original shape of the N80 steel sheet. The original nuclei in the wellbore are generated due to the temperature and pressure and changes in the wellbore on the one hand; on the other hand, during the flow of fluid through the reservoir to the wellbore, the fluid will carry the tiny nuclei in the reservoir to drift and flow, thus forming original deposits on the surface of the N80 steel sheet. Thereafter, the sediment attached to the surface of the N80 steel sheet starts to grow (Figure 4d), and other scales use this as an “anchor point” to grow and eventually become a bulk accumulation of scale. Afterward, the scale and the N80 steel sheet react with water at high temperatures in an electrochemical reaction (Figure 4f), resulting in the formation of hydrogen atoms. The hydrogen atoms diffuse into the metal and combine to form hydrogen molecules. As the hydrogen molecules are difficult to diffuse inside the metal, the concentration and pressure of H2 inside the metal rise, causing the metal to expand and deform locally, resulting in a stress concentration that exceeds the strength limit of the steel and destroys the lattice structure of the metal matrix on the original pipe, which causes the metal matrix structure to collapse and the layer of material to fall off from the well wall or pipe steel. The dislodged scale samples intermingle to form multiple layers of scale. (Figure 4g) The diagram shows that the iron atoms or ferrous ions on the surface oxidize to a reddish-brown color as the scale is transported to the surface. The (Figure 4h) diagram shows that after the scale has been removed from its original position, the scale continues to grow in the depression, and wellbore scaling and corrosion continue to occur.

3.3. Changes in Ion Concentrations in Simulated Aqueous Solutions

As can be seen from Table 4, calcium ions were generated in the solution, and the ions showed a decreasing trend with an increasing reaction time, and the calcium ion concentration decreased by 1038 mg/L after two months of reaction. The ferrous ions generated in the solution due to corrosion showed a rising trend first, and the ferrous ion concentration jumped from 0.22 mg/L to 45.79 mg/L during the period from the fourth week to the eighth week, combined with SEM plots to speculate about the N80 surface.

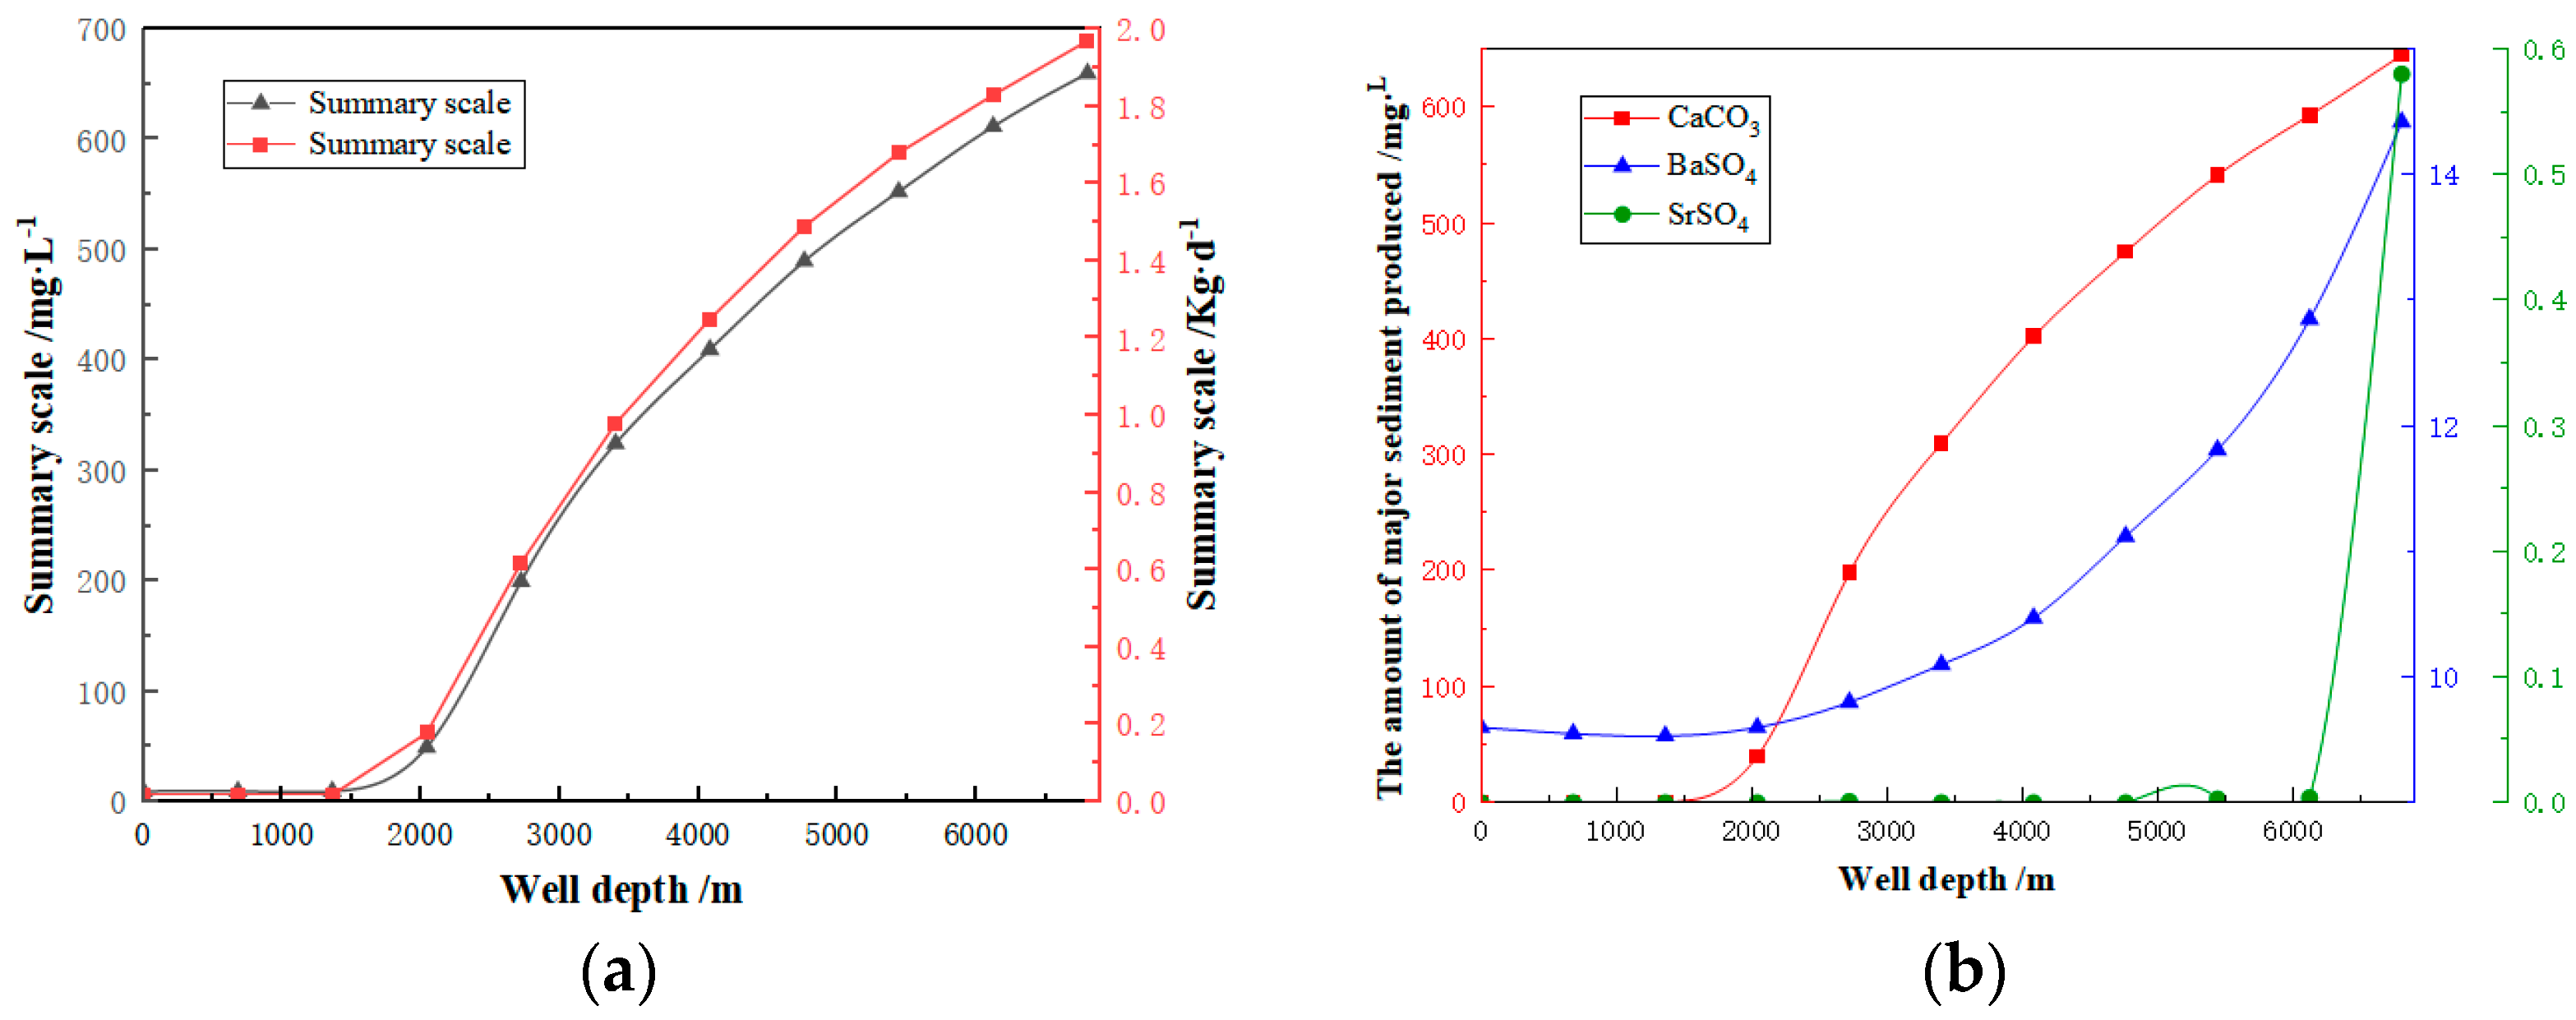
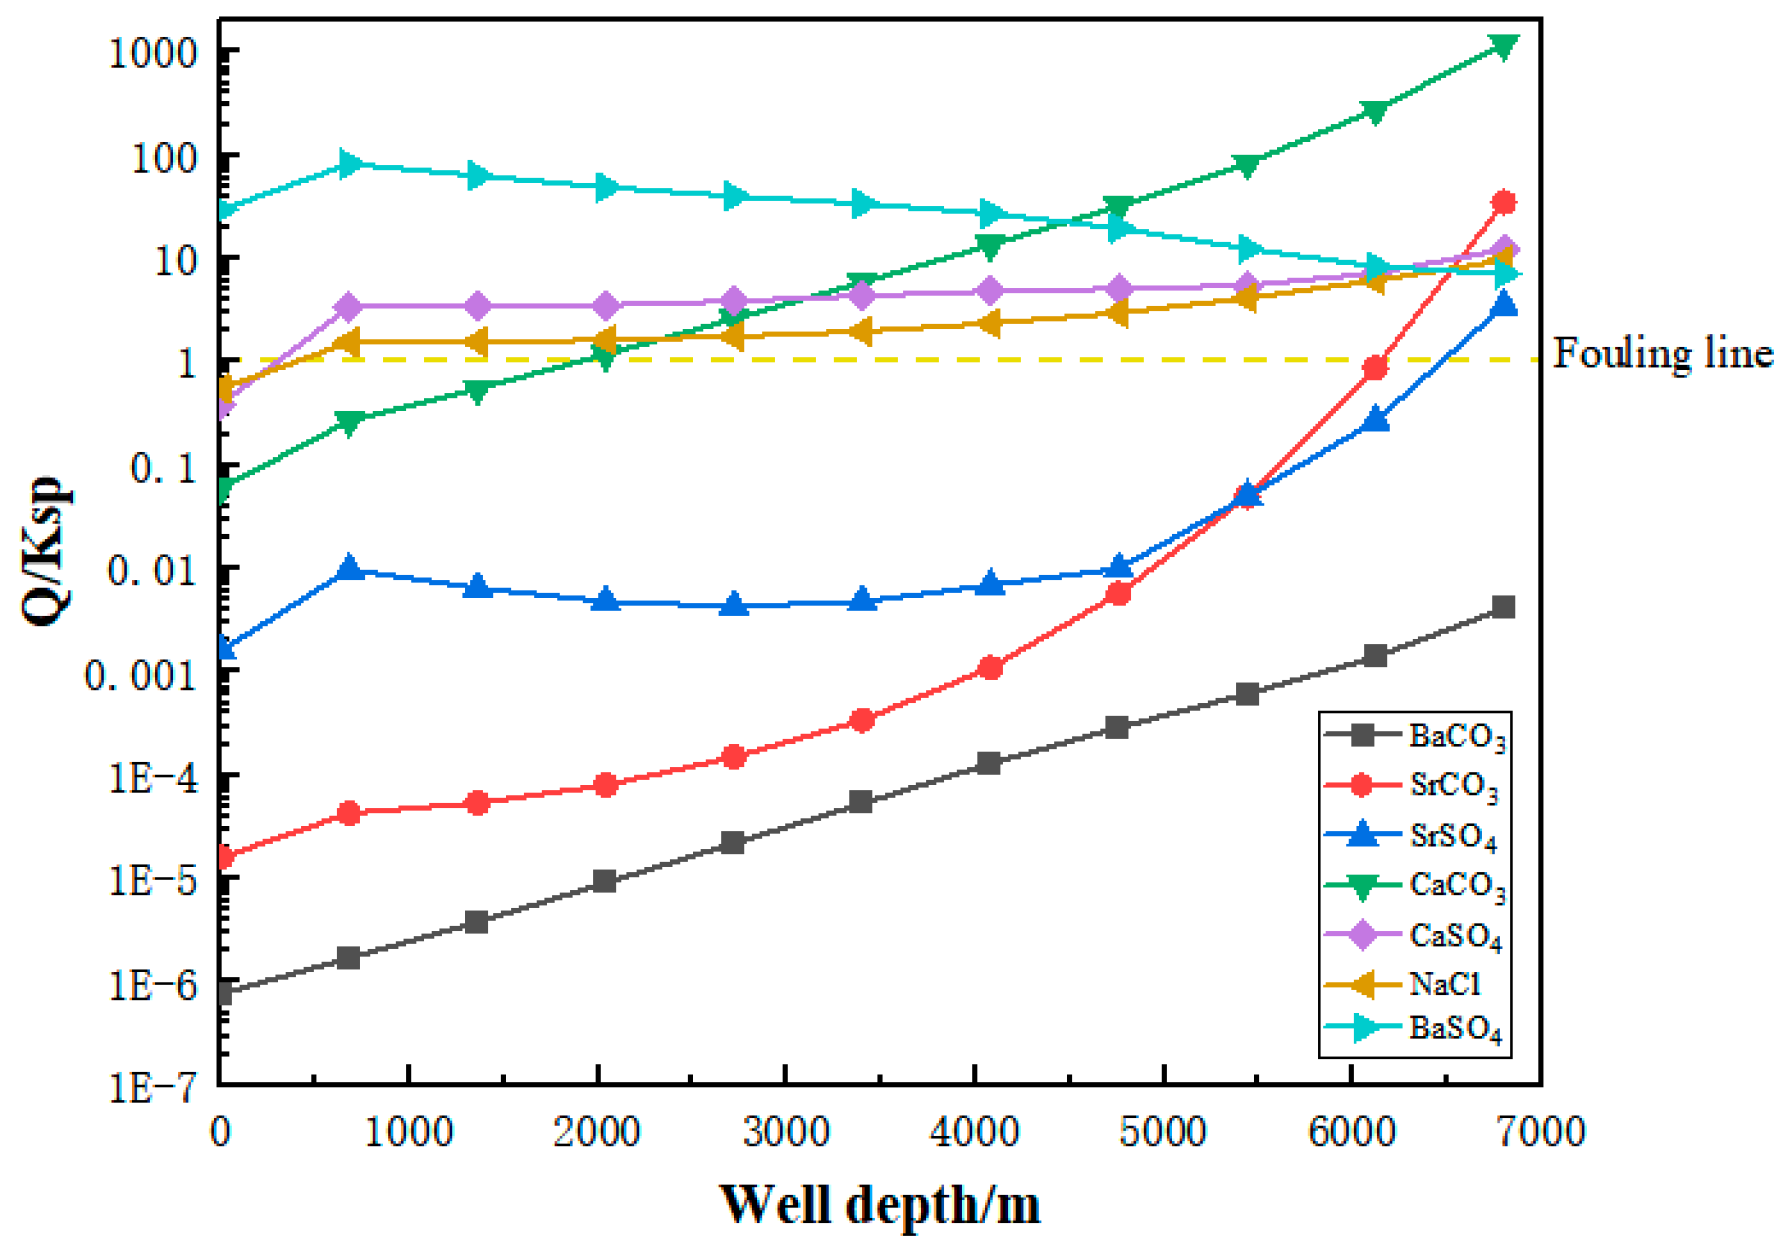
3.4. Gram Deep Wellbore Fouling Prediction

(1)
Wellbore fouling prediction results
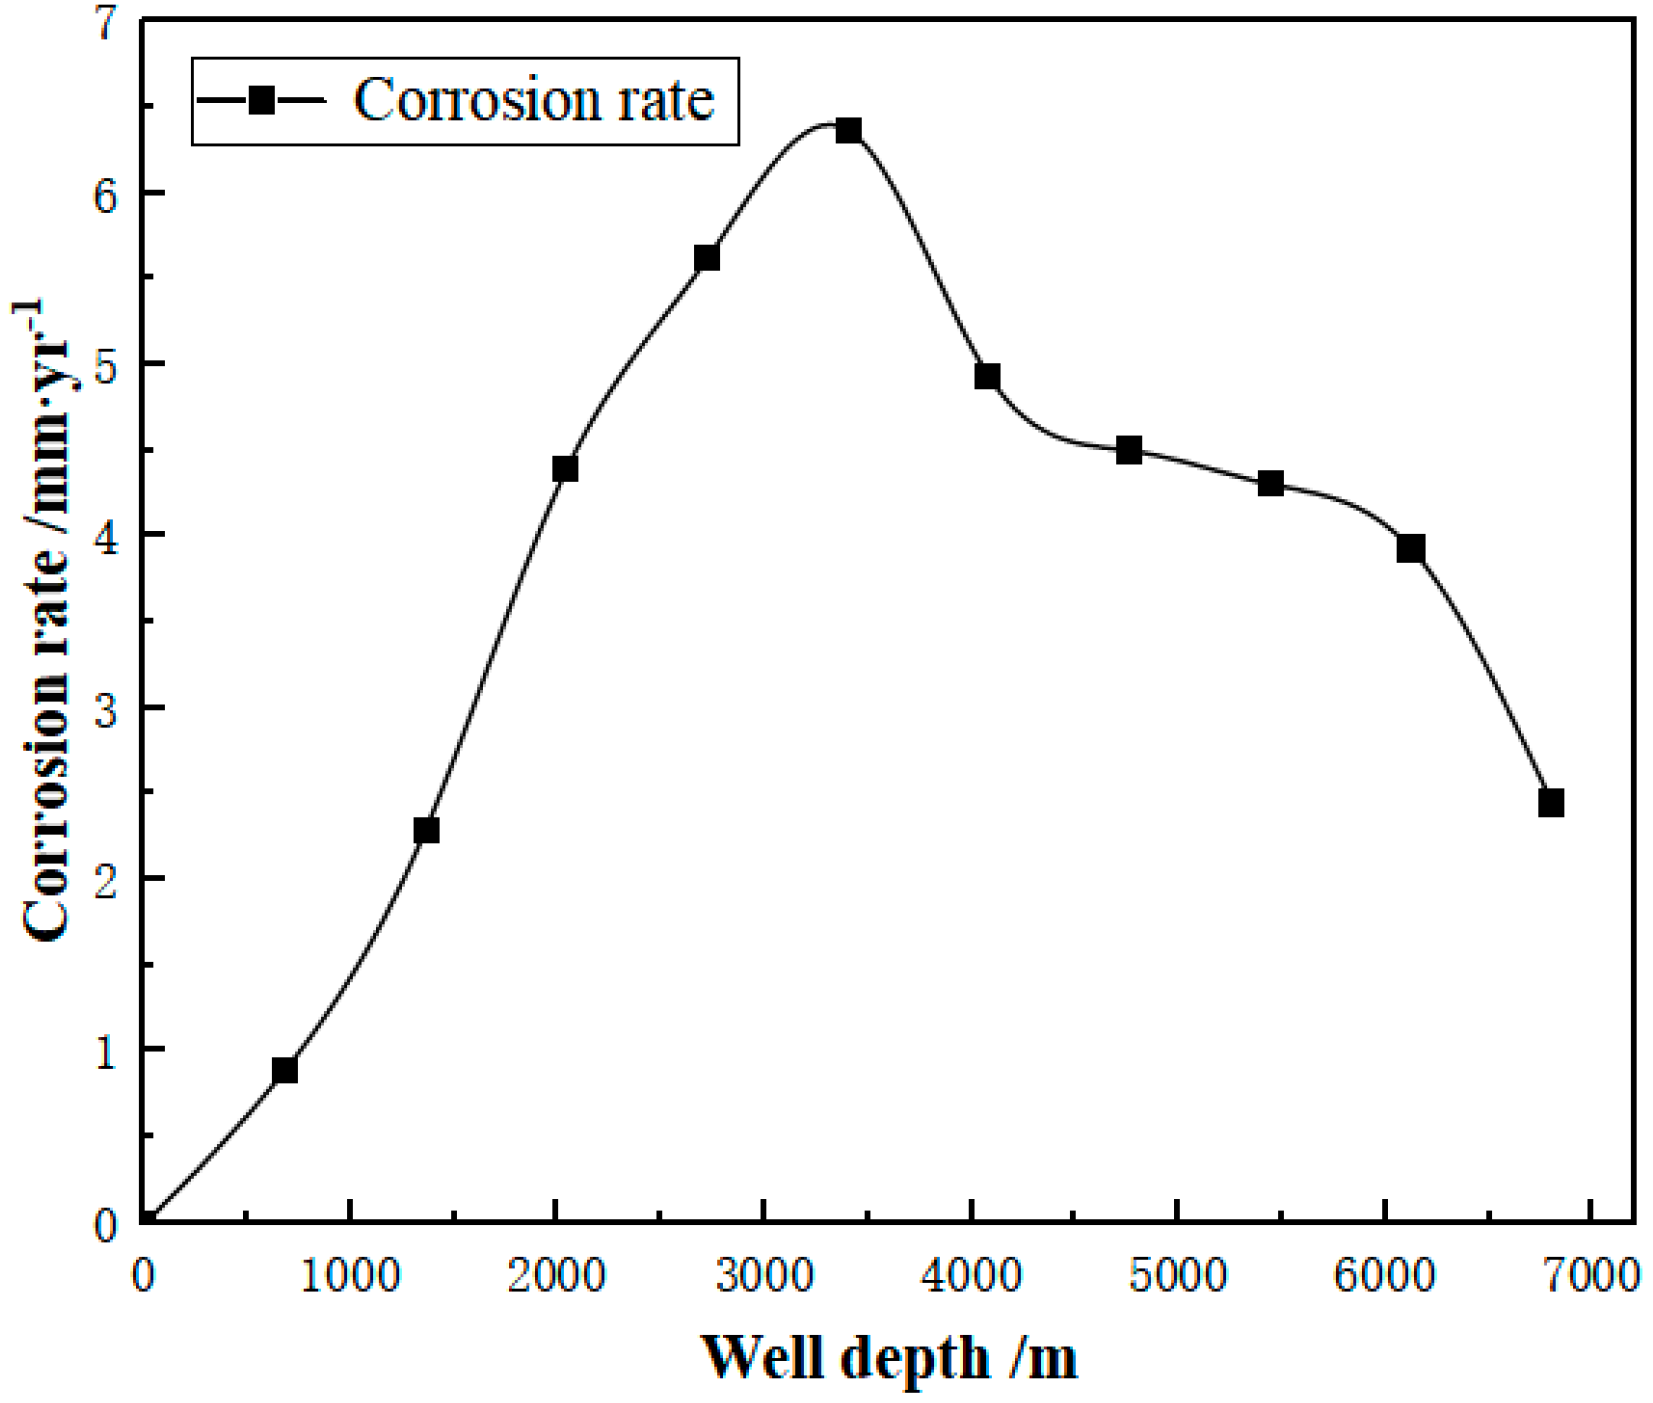
Combined with the field production data, the gas component of the extracted gas was set concerning Table 5. Light hydrocarbon component analysis was performed and testing was reported, and the flow rate was set to 155 km3/d.
Combined with the results of the wellbore obstruction analysis, the generation of calcium carbonate, barium sulphate, and strontium carbonate and the location of this generation are predicted in this section, and the predicted results of the Keshen blockbore are shown in Figure 5.
As shown in Figure 5a, the amount of scale generation increases with the depth of the wellbore. From the surface to 2000 m depth, very little was generated in the wellbore, and the amount of wellbore scale increased sharply from 2000 m to 5000 m depth, and the increase in the amount of scale in the wellbore slowed down when the depth exceeded 5000 m, to 1.97 kg/d at 6800 m. As shown in Figure 5b, the amount of calcium carbonate and barium sulfate precipitation increased with depth from 2000 m to 6800 m depth. Strontium sulfate precipitation does not occur until the depth exceeds 6120 m.
The relationship between the scaling trend of each substance and the well depth in the well Keshen block is shown in Figure 6. As can be seen from Figure 6, when the good depth is less than 6000 m, the scaling trends of strontium carbonate, strontium sulfate, and barium carbonate are less than 1, and calcium sulfate, sodium chloride, calcium carbonate, and barium sulfate precipitation are greater than 1. Therefore, strontium carbonate, strontium sulfate, and barium carbonate precipitation will not be generated in the wellbore, but calcium sulfate, sodium chloride, calcium carbonate, and barium sulfate precipitation will be generated, and among these substances calcium carbonate’s precipitation generation trend is the largest. The reason for this is that the activity product (Q) of calcium carbonate far exceeds the solubility product (Ksp) at this working condition, resulting in extensive scaling in the wellbore. The tendency for calcium carbonate and barium sulfate fouling increases with depth, so the amount of calcium carbonate and barium sulfate precipitation also increases with depth.
Calcium carbonate is mostly generated in boreholes deeper than 2000 m. As depth increases, the tendency for calcium carbonate scaling increases, with a mixture of calcium sulfate, sodium chloride, and barium sulfate scaling at depths of 1000–2000 m. Scaling hardly occurs in boreholes above 1000 m. The scaling tendency does not equate to the generation of major scales (e.g., barium sulfate) because of the low ionic concentration of some substances resulting in low-scale generation.
(2)
Wellbore corrosion rate prediction
The temperature and pressure at the bottom of the Keshen block are high, and the temperature gradient and pressure gradient in the well vary greatly, so it is difficult for the physical simulation experiment to simulate the corrosion damage of the Keshen block. Therefore, the corrosion prediction of the Keshen block was performed using OLI-Corrosion Analyzer software, and the effect of the corrosion rate of the temperature flow rate N80 test piece was investigated. The simulation used the reduced formation water ion concentration of Keshen block as the simulation environment, and the simulation was set at 133 °C, 125 MPa pressure, and 2.567% CO2 content.
The simulation used the reduced formation water ion concentration of Keshen block as the simulated environment, with 2.567% CO2. From Figure 7, it can be seen, with the increase in good depth, and the corrosion rate of N80, with the increase in temperature steel pieces will all decrease. The reason for this phenomenon is that when the pressure is the same, as the temperature increases, the electrochemical corrosion reaction of the specimen accelerates, resulting in the rapid dissolution of the metal ions in the specimen, but when the temperature increases to a certain level, the solubility of its corrosion product FeCO3 decreases with increasing temperature, which leads to a corrosion product film adhering to the metal surface, thus protecting the metal specimen. Figure 6 shows that the borehole corrosion rate increases with depth and then decreases, reaching a maximum value of 6.37 mm/yr at a depth of 3400 m (67.5 °C, 7500 KPa).

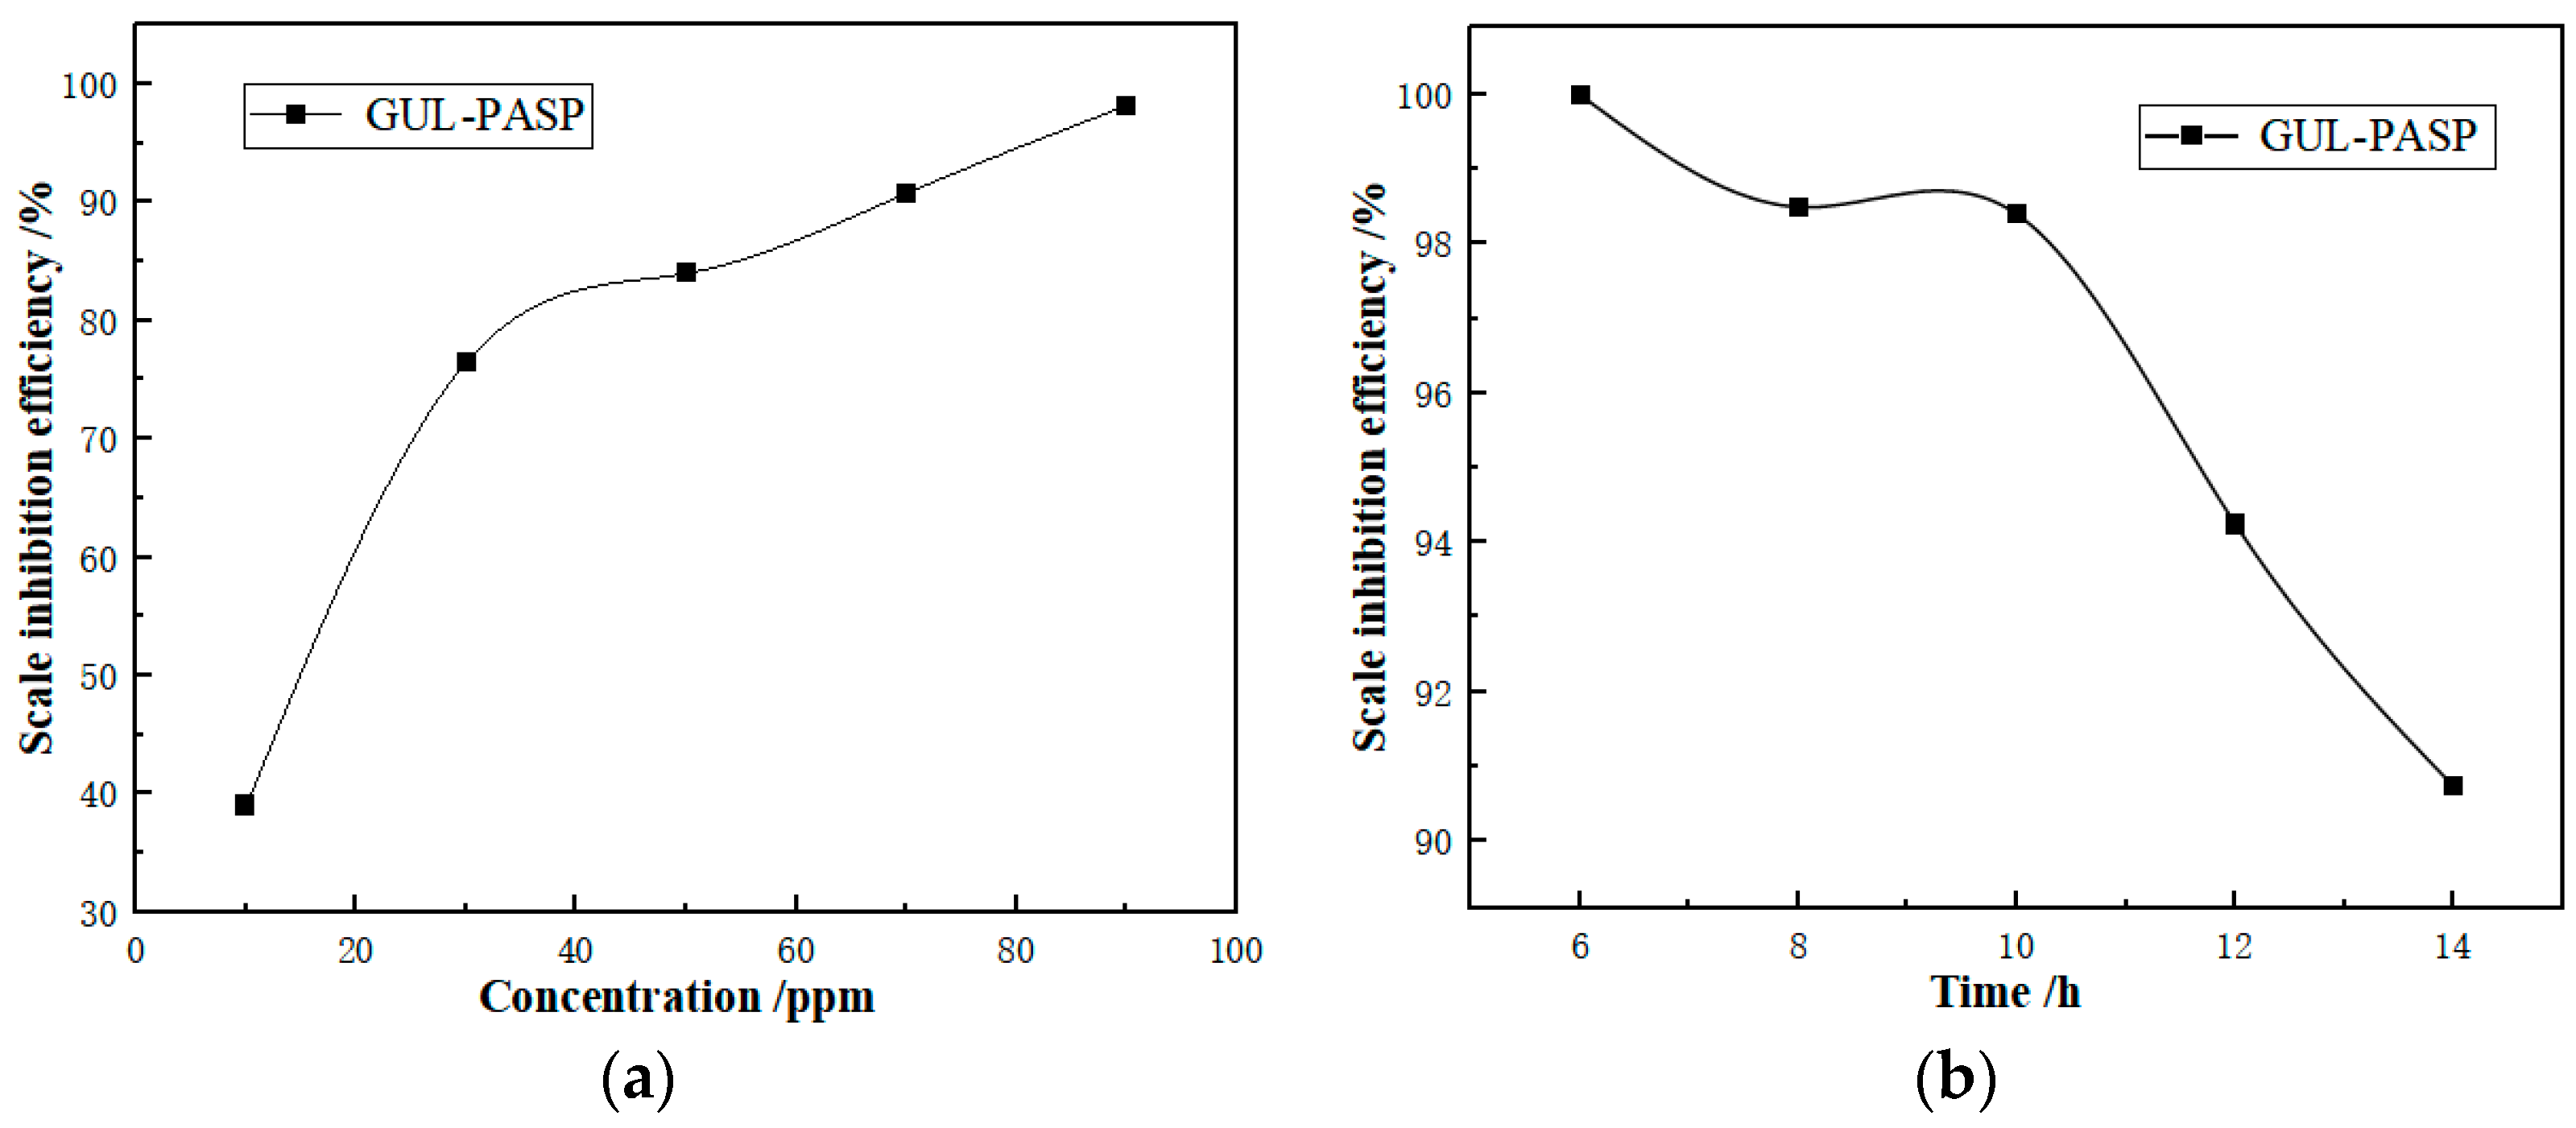
3.5. Scale Inhibitor Performance Evaluation

The scale inhibition efficiency of the G-PASP scale inhibitor is shown in Figure 8a; in the simulated water of Keshen block formation, the scale inhibitor showed a fast and then slow trend with the increase in solution concentration. The scale inhibition rate of G-PASP was 90.74% for 70 mg/L scale inhibitor and 98.15% for 90 mg/L scale inhibitor, respectively; as shown in Figure 8b, the scale inhibition rate of G-PASP scale inhibitor decreased continuously with the increase in heating time, and the scale inhibition rate of 90 mg/L G-PASP scale inhibitor was as high as 100.00% at 6 h of heating, and by 14 h, the scale inhibition rate of 90 mg/L G-PASP scale inhibitor reached 100.00%. L of the G-PASP scale inhibitor was 90.74% by 14 h.
When poly aspartic acid scale inhibitors are not added, the scale is superimposed in sharp scale-like crystals, the scale crystals have a tight structure and are large (Figure 9a). After the addition of polyaspartic acid scale inhibitor, the scale crystals formed, the peripheral scale angles become smooth, and the scale crystals become irregular, no longer sharp scale-like superimposed crystals. After the addition of polyaspartic acid scale inhibitor, the scale crystals are deformed and dispersed, the scale structure is loose (Figure 9b). After the addition of polyaspartic acid scale inhibitor, Ca2+ will collide with CO32− in the ground simulated water due to the action of polyaspartic acid scale inhibitor, resulting in the deformation and dispersion of the generated crystal structure, and lattice distortion, resulting in the loosening of the scale structure and the generation of spherical chalcocite, thus playing the role of scale inhibition.

4. Conclusions

In this paper, SEM and EDS were used to find that the scale in the Keshen block consisted of iron oxides, calcium carbonate crystals, calcite crystals, and wellbore steel that had been dislodged due to electrochemical corrosion. Based on this, hanging experiments were conducted to observe the microscopic morphological changes of the wellbore steel at different times, inferring the formation process of the wellbore scale and revealing the root cause of the wellbore scale formation. The simulation results show that the amount of scale formation increases with the depth of the wellbore, with 1.97 kg/d of scale formation at 6800 m. The highest wellbore corrosion rate of 6.37 mm/yr was achieved at a depth of 3400 m. The predicted results are highly consistent with the actual field conditions, proving that the method is effective and accurate. The prediction results were highly consistent with the actual field conditions, proving that the method is an effective and accurate prediction method. Finally, the G-PASP scale inhibitor was synthesized. When the scale inhibitor concentration was 90 mg/L, the scale inhibition rate could reach 98.15%, and the experiment showed that this agent is an effective agent in preventing scale in Keshen gas wells.

Author Contributions

L.Z.: investigation, data curation, formal analysis, writing—original draft. Y.Z.: investigation, data curation, formal analysis, writing—original draft. Y.H.: investigation, data curation, formal analysis. Z.Y.: conceptualization, formal analysis, investigation, methodology, project administration, supervision, writing—review and editing. X.L.: investigation, formal analysis. X.W.: investigation, formal analysis. Q.M.: conceptualization, writing—review and editing. All authors have read and agreed to the published version of the manuscript.

Funding

Supported by China National Petroleum Corporation’s Major Science and Technology Special Project “Research on Supporting Technologies for Efficient Development of Complex Reservoirs in Bozi-Dabei Trillion Square Meter Gas Area and Field Application” (No. TXN011020120001).

Data Availability Statement

Data are contained within the article.

Conflicts of Interest

Authors “Libin Zhao, Yongling Zhang, Yuanyuan He, Xiao Liang, Xiaopei Wang” were employed by the company “Tarim Oilfield Company ta Southwest Exploration and Development Company”. Author “Qi Mao” was employed by the company “China Oilfield Services Limited”. The remaining authors declare that the research was conducted in the absence of any commercial or financial relationships that could be construed as a potential conflict of interest.

References

  1. Jiang, T.; Sun, X. Understanding and technical countermeasures of ultra-deep and ultra-high pressure gas reservoir development in Keshen gas field of Kuqa foreland basin. Nat. Gas Ind. 2018, 38, 1–9. [Google Scholar]
  2. Zhao, L. Characteristics of Micro-fractures in Tight Sandstone Reservoirs and Their Influence on Physical Properties—A Case Study of Shilijiahan Zone in Hangjinqi Area. Eval. Dev. Oil Gas Reserv. 2022, 12, 285–291. [Google Scholar]
  3. Wang, K.; Zhang, R.; Dai, J.; Wang, J.; Zhao, L. Fracture development characteristics of low permeability sandstone reservoir in Keshen 2 gas field of Kuqa depression. Oil Gas Geol. Recovery Ratio 2016, 23, 53–60. [Google Scholar]
  4. Shen, Y.; Lü, X.; Guo, S.; Song, X.; Zhao, J. Effective evaluation of gas migration in deep and ultra-deep tight sandstone reservoirs of Keshen structural belt, Kuqa depression. J. Nat. Gas Sci. Eng. 2017, 46, 119–131. [Google Scholar] [CrossRef]
  5. Zeng, L.; Lv, W.; Xu, X.; Tian, H.; Lu, S.; Zhang, M. Development characteristics, formation mechanism and oil and gas significance of bedding fractures between typical tight sandstone and shale. Acta Pet. Sin. 2022, 43, 180–191. [Google Scholar]
  6. Liu, H.; Cui, Y.; Xia, S.; Liu, X.; Fei, S.; Wang, Z. Occurrence mechanism and main controlling factors of formation water in tight gas reservoirs in He-8 and Shan-1 member—Taking a block in Sulige as an example. Nat. Gas Explor. Dev. 2020, 43, 84–91. [Google Scholar]
  7. Gui, F.; Cai, M.; Zhang, C. Study on irreducible water saturation of low porosity and permeability reservoirs in Keshen area. Contemp. Chem. Ind. 2021, 50, 178–182. [Google Scholar]
  8. Yang, B.; Xun, T.; Li, F.; Tian, H.; Yang, L. Numerical Simulation Study on the Influence of Water-rock Interaction on Reservoir Permeability—A Case Study of Upper Paleozoic Sandstone Reservoir in Northeast Ordos Basin. J. Jilin Univ. Earth Sci. Ed. 2019, 49, 526–538. [Google Scholar]
  9. Du, Z.; Ma, L.; Wang, X.; Chen, Z. Study of Sanding Mechanism and a New Model to Calculate the Sanding Critical Drawdown in Loosened Sandstone. In Proceedings of the SPE Production and Operations Symposium, Oklahoma City, OK, USA, 4–8 April 2009. [Google Scholar]
  10. Zhang, P.; Kan, A.T.; Tomson, M.B. Oil Field Mineral Scale Control. In Mineral Scales and Deposits; Elsevier: Amsterdam, The Netherlands, 2015. [Google Scholar]
  11. Amjad, Z.; Demadis, K. Mineral Scales and Deposits; Elsevier: Amsterdam, The Netherlands, 2015. [Google Scholar]
  12. Vazirian, M.M.; Charpentier, T.V.; de Oliveira Penna, M.; Neville, A. Surface inorganic scale formation in oil and gas industry: As adhesion and deposition processes. J. Pet. Sci. Eng. 2016, 137, 22–32. [Google Scholar] [CrossRef]
  13. Jiang, T.; Meng, X.; Huang, K.; Zhao, L.; Chen, D.; Wu, H. Mechanism of wellbore plugging and plugging removal technology in Keshen 2 gas field. Pet. Drill. Prod. Technol. 2020, 42, 611–657. [Google Scholar]
  14. Weng, Z.; Xie, G.; Li, Y. Scaling in oil field and application of chemical scale remover. Chem. Eng. 2020, 34, 61–65. [Google Scholar]
  15. Revie, R.W. Corrosion and cOrrosion Control: An Introduction to Corrosion Science and Engineering; John Wiley & Sons: Hoboken, NJ, USA, 2008. [Google Scholar]
  16. Zahedzadeh, M.; Karambeigi, M.S.; Roayaei, E.; Emadi, M.A.; Radmehr, M.; Gholamianpour, H.; Ashoori, S.; Shokrollahzadeh, S. Comprehensive management of mineral scale deposition in carbonate oil fields—A case study. Chem. Eng. Res. Des. 2014, 92, 2264–2272. [Google Scholar] [CrossRef]
  17. Bahadori, A.; Zahedi, G.; Zendehboudi, S. Estimation of Potential Barium Sulfate (Barite) Precipitation in Oilfield Brines Using a Simple Predictive Tool. Environ. Prog. Sustain. Energy 2013, 3, 860–865. [Google Scholar] [CrossRef]
  18. Xu, T.; Ontoy, Y.; Molling, P.; Spycher, N.; Parini, M.; Pruess, K. Reactive transport modeling of injection well scaling and acidizing at Tiwi field, Philippines. Geothermics 2004, 33, 477–491. [Google Scholar] [CrossRef]
  19. Ge, X.; Shan, Q.; Zhang, Q.; Wang, T.; Ge, L. Study on scaling trend and compatibility of produced water in tight reservoir. Ind. Water Wastewater 2021, 52, 25–29. [Google Scholar]
  20. Kamalipour, M.; Abbasi, S.; Dehghani, S.M.; Naseri, A. Experimental and simulation study of scale formation in a carbonate Iranian reservoir. In Proceedings of the Conference of Oil, Washington, PA, USA, 3–14 May 2014. [Google Scholar]
  21. Liu, Z.; Sun, Y.; Zhou, X.; Wu, T.; Tian, Y.; Wang, Y. Synthesis and scale inhibitor performance of polyaspartic acid. J. Environ. Sci. 2011, 23, S153–S155. [Google Scholar] [CrossRef] [PubMed]
  22. Cui, R.; Gu, N.; Li, C. Polyaspartic acid as a green corrosion inhibitor for carbon steel. Mater. Corros. 2011, 4, 362–369. [Google Scholar] [CrossRef]
  23. Zheng, D.; Ozbayoglu, E.; Miska, S.; Zhang, J. Experimental Study of Anisotropic Strength Properties of Shale. In Proceedings of the 57th U.S. Rock Mechanics/Geomechanics Symposium, Atlanta, GA, USA, 25 June 2023. [Google Scholar] [CrossRef]
  24. GB/T 16632-2019; Determination of Scale Inhibition Performance of Water Treatment Chemicals—Calcium Carbonate Precipitation Method. Chinese Standard: Beijing, China, 2020.
Figure 1. Diagram of the hanging experimental setup.
Processes 12 00782 g001
Figure 2. SEM and EDS images of grams depth block bore scale.
Processes 12 00782 g002
Figure 3. SEM diagram and corrosion rate diagram of N80 steel sheet before and after reaction.
Processes 12 00782 g003
Figure 4. Schematic diagram of the wellbore scale formation process. (a) The original shape of the N80 steel sheet. (b) Rock particl is attached. (c) Dolomitel is attached. (d) Sediment growth (e) Scale inhibition growth. (f) Electrochemical reaction. (g) The dislodged scale samples intermingle to form multiple layers of scale. (h) after the scale has been removed from its original position, the scale continues to grow in the depression, and wellbore scaling and corrosion continue to occur.
Processes 12 00782 g004
Figure 5. Comparison of gram block depth, summary scale volume, and major scale materials. (a) Keshen block summary of scale volume versus well depth, (b) Gram depth block scale versus well depth.
Processes 12 00782 g005
Figure 6. Graph of fouling trends for each substance in the Keshen block versus well depth.
Processes 12 00782 g006
Figure 7. Plot of corrosion rate of N80 steel sheet versus borehole depth.
Processes 12 00782 g007
Figure 8. (a) Effect of concentration on the scale inhibition efficiency of G-PASP; (b) effect of heating time on the scale inhibition efficiency of G-PASP.
Processes 12 00782 g008
Figure 9. (a) SEM image of scale after heating of simulated water; (b) SEM image of scale after heating with G-PASP scale inhibitor.
Processes 12 00782 g009
Table 1. Chemical composition of N80 material (mass fraction/wt%).
ElementCSiPSCrNiMnMoCu
Content0.450.320.0140.0130.030.041.700.200.03
Table 2. Ion composition of well block gram depth (mg/L).
IonicCa2+K+Mg2+Na+Sr2+Ba2+Fe2+ClSO42−HCO3
Concentration3340.015660.121.7660,330.93113.118.120104,921.12360.8798.21
Table 3. Correspondence between depth and temperature and pressure in Keshen blocks.
Depth/mTemperature/°CPressure/KPa
0102000
68021.53100
1360334200
204044.55300
2720566400
340067.57500
4080798600
476090.59700
544010210,800
6120113.511,900
680012513,000
Table 4. The ionic concentration of aqueous solution before and after corrosion experiments on N80 steel sheet (unit: mg/L).
Reaction TimeBlankOne WeekTwo WeeksFour WeeksEight Weeks
Ion Name
Ca2+3340.00318731522940.002302.00
K+56605586549353103968
Mg2+1.761.731.71.681.36
Na+60,33059,51058,46056,8704168
Sr2+113108106110103
Ba2+8.17.77.67.66.9
Fe2+00.130.190.2245.79
Cl104,921103,476102,634100,60899,173.08
SO42−360.87321.5286.32224.42183.24
HCO398.2195.72493.10692.59890.361
Table 5. Composition of natural gas components.
Gas NameN2CO2C1C2C3iC4nC4iC5nC5
Percentage %3.5462.56793.1770.6830.0190.0020.0040.0010.001
Disclaimer/Publisher’s Note: The statements, opinions and data contained in all publications are solely those of the individual author(s) and contributor(s) and not of MDPI and/or the editor(s). MDPI and/or the editor(s) disclaim responsibility for any injury to people or property resulting from any ideas, methods, instructions or products referred to in the content.

