Abstract
With the rapid development of 3D printing technologies, more attention has been focused on using 3D printing for the fabrication of membranes. This study investigated the application of digital light processing (DLP) 3D printing combined with quaternization processes to develop dense anion exchange membranes (AEMs) for electrodialysis (ED) separation of Cl− and SO42− ions. It was discovered that at optimal curing times of 40 min, the membrane pore density was significantly enhanced and the surface roughness was reduced, and this resulted in an elevation of desalination rates (97.5–98.7%) and concentration rates (165.8–174.1%) of the ED process. Furthermore, increasing the number of printed layers improved the membranes’ overall polymerization and performance, with double-layer printing showing superior ion flux. This study also highlights the impact of the polyethylene glycol diacrylate (PEGDA) molecular weight on membrane efficacy, where PEGDA-700 outperformed PEGDA-400 in ion transport capabilities and desalination efficiency. Additionally, higher 4-vinylbenzyl chloride (VBC) content improved the quaternary ammonium group concentration and membrane conductivity, and hence elevated the ED performance. Under optimized conditions, DLP 3D printed membranes demonstrated exceptional selectivity of 24.0 for Cl−/SO42− and a selective purity of 81.4%. With a current density of 400 A/m2, the current efficiency and energy consumption were in the range of 82.4% to 99.7%, and 17.2 to 25.4 kW‧h‧kg−1, respectively, showcasing the potential of advanced manufacturing techniques in creating efficient and functional ion exchange membranes.
1. Introduction
An ion exchange membrane (IEM) is a semi-permeable membrane composed of a polymer matrix with attached ion groups (fixed charges) [1]. Based on the differences in their fixed charges, IEMs can be divided into cation exchange membranes (CEMs) and anion exchange membranes (AEMs). The functional groups of CEMs include sulfonic acid groups (-SO3−), phosphonic acid groups (-PO32−), carboxylic acid groups (-COO−), etc.; while anion exchange membranes include secondary amines (-NRH2+), tertiary amines (-NR2H+), quaternary ammonium groups (-NR3+), ammonium groups (-NH3+), metal cations, etc. [2]. Under the influence of an electric field, the co-ions that have the same charge as the fixed ions are repelled and hindered from passing through the membrane; meanwhile, the counter ions are allowed to pass through the membrane [3].
IEMs are commonly used in electrodialysis (ED) technology since they can effectively remove ions from water, reducing liquid waste and aligning with the zero liquid discharge (ZLD) concept [4]. ED is an electrically driven process where charged ions selectively pass through IEMs under an electric field, achieving separation of the target product. Depending on the membrane used, ED can offer different functionalities, such as the selective separation of monovalent and multivalent ions using monovalent selective IEMs [5]. An electrodialysis stack consists of two electrodes, spacers and IEMs (AEM/CEM). In an ED unit, CEMs and AEMs are arranged alternately in a sequence, and one set of AEM/CEM comprises a basic working unit called a membrane pair. The number of membrane pairs ranges from a few on the laboratory scale and dozens on the pilot scale to hundreds on the commercial scale [6]. The difference in IEMs and their arrangements in the ED results in different functionalities. For instance, Zhang et al. designed a new membrane stack configuration of selective electrodialysis, enhancing the overall selective separation ability of the ED for monovalent ions [7]. Apart from electrodialysis, ion exchange membranes also find applications in capacitive deionization (CDI), bipolar membrane electrodialysis (BMED), diffusion dialysis (DD), reverse electrodialysis (EDR) and ion exchange membrane bioreactors (IEMB), serving functions such as desalination, mixed salt purification, hydrogen production, acid/base recovery, energy production, and denitrification [8,9,10,11,12]. The development of IEMs diversifies their applications, necessitating the creation of new types of IEMs for broader uses.
Ion exchange membrane preparation methods include solvent evaporation, pore-filling, in situ polymerization, etc. Solvent evaporation is the most common method for traditional IEMs, which involves mixing polymers with a low boiling point solvent to form a casting solution, which is then cast into a wet membrane. At a certain temperature, the solvent evaporates and the concentration of polymers in the casting solution increases until a membrane forms [13]. The pore-filling method involves incorporating soft electrolyte polymers into a porous substrate with chemical inertness and mechanical stability to create IEMs. The porous substrate includes polymers such as porous polyacrylonitrile, polyethersulfone and high-density polyethylene, as well as inorganic materials like porous aluminum oxide. During membrane preparation, the electrolyte polymer solution is initially poured over the surface of the substrate and this step is repeated multiple times to ensure that the membrane is formed without any defects. After the solvent has evaporated, an IEM is formed [14]. Finally, the in situ polymerization method involves dissolving reactive monomers, catalysts and initiators in an organic solvent. Through chemical reactions between the monomers, high molecular weight polymers are directly formed. However, this process utilizes a significant amount of solvent, which has led to the development of solvent-free strategies for in situ polymerization [15].
Membrane structures are often disordered or asymmetric due to the difficulty in controlling various parameters during the membrane fabrication process. 3D printing technology has frequently draw the public attention in recent years and this new additive manufacturing technology has brought new trends to the preparation of IEMs [16,17,18,19]. 3D printed membranes use computer-designed three-dimensional images as prototypes, allowing for the precise control of parameters to achieve the targeted structure. Additionally, this technology can produce structures that are denser and more hydrophobic compared to conventional IEMs, rendering them capable of monovalent selective separation. Common monovalent selective IEMs often employ surface modification techniques, which are complex and make it difficult to control their thickness. In contrast, 3D printing enables the straightforward synthesis of monovalent selective IEMs as a whole. This simplification represents a significant advantage in terms of manufacturing efficiency and consistency in membrane performance. The utilization of 3D printing technologies for membrane fabrication has been widely reviewed in previous studies [20,21,22]. Common 3D printing technologies include fused deposition modeling (FDM), selective laser sintering (SLS), stereolithography (SLA), and digital light processing (DLP), each with their own advantages and disadvantages [20,22,23]. Although DLP technology is known for its higher resolution, the existing 3D printed membranes have tended to use FDM and SLS, with less attention on the use of DLP technology for the preparation of IEMs, with few analyses of their performance [24,25].
This study introduces the preparation of dense IEMs for ED using a DLP 3D printer for this purpose for the first time. It is believed that the properties of DLP printed material are influenced by the formulation of the photosensitive resin and the printing parameters. Therefore, this research explored the impact of curing time, the number of printed layers and the formulation of the casting solution on the structure of the DLP 3D printed membranes. Additionally, the membranes were used in desalination experiments to investigate the effect of membrane structure and current density on the desalination performance as well as the water/salt transport mechanism. Meanwhile, due to the hydrophobicity of the membrane and the compactness of the membrane structure, the separation performance of monovalent and divalent ions (Cl− and SO42−) by the DLP 3D printed membrane was evaluated. This paper is the first to use the mechanism of photopolymerization, utilizing a digital light processing 3D printer to create dense IEMs suitable for electrodialysis and to perform related performance tests. The experimental results show that the IEMs produced in this study are denser compared to those made by traditional means and can achieve monovalent selective separation, which is not possible with conventional ion-exchange membranes. This allows for the simple synthesis of monovalent selective exchange membranes.
2. Materials and Methods
2.1. Materials
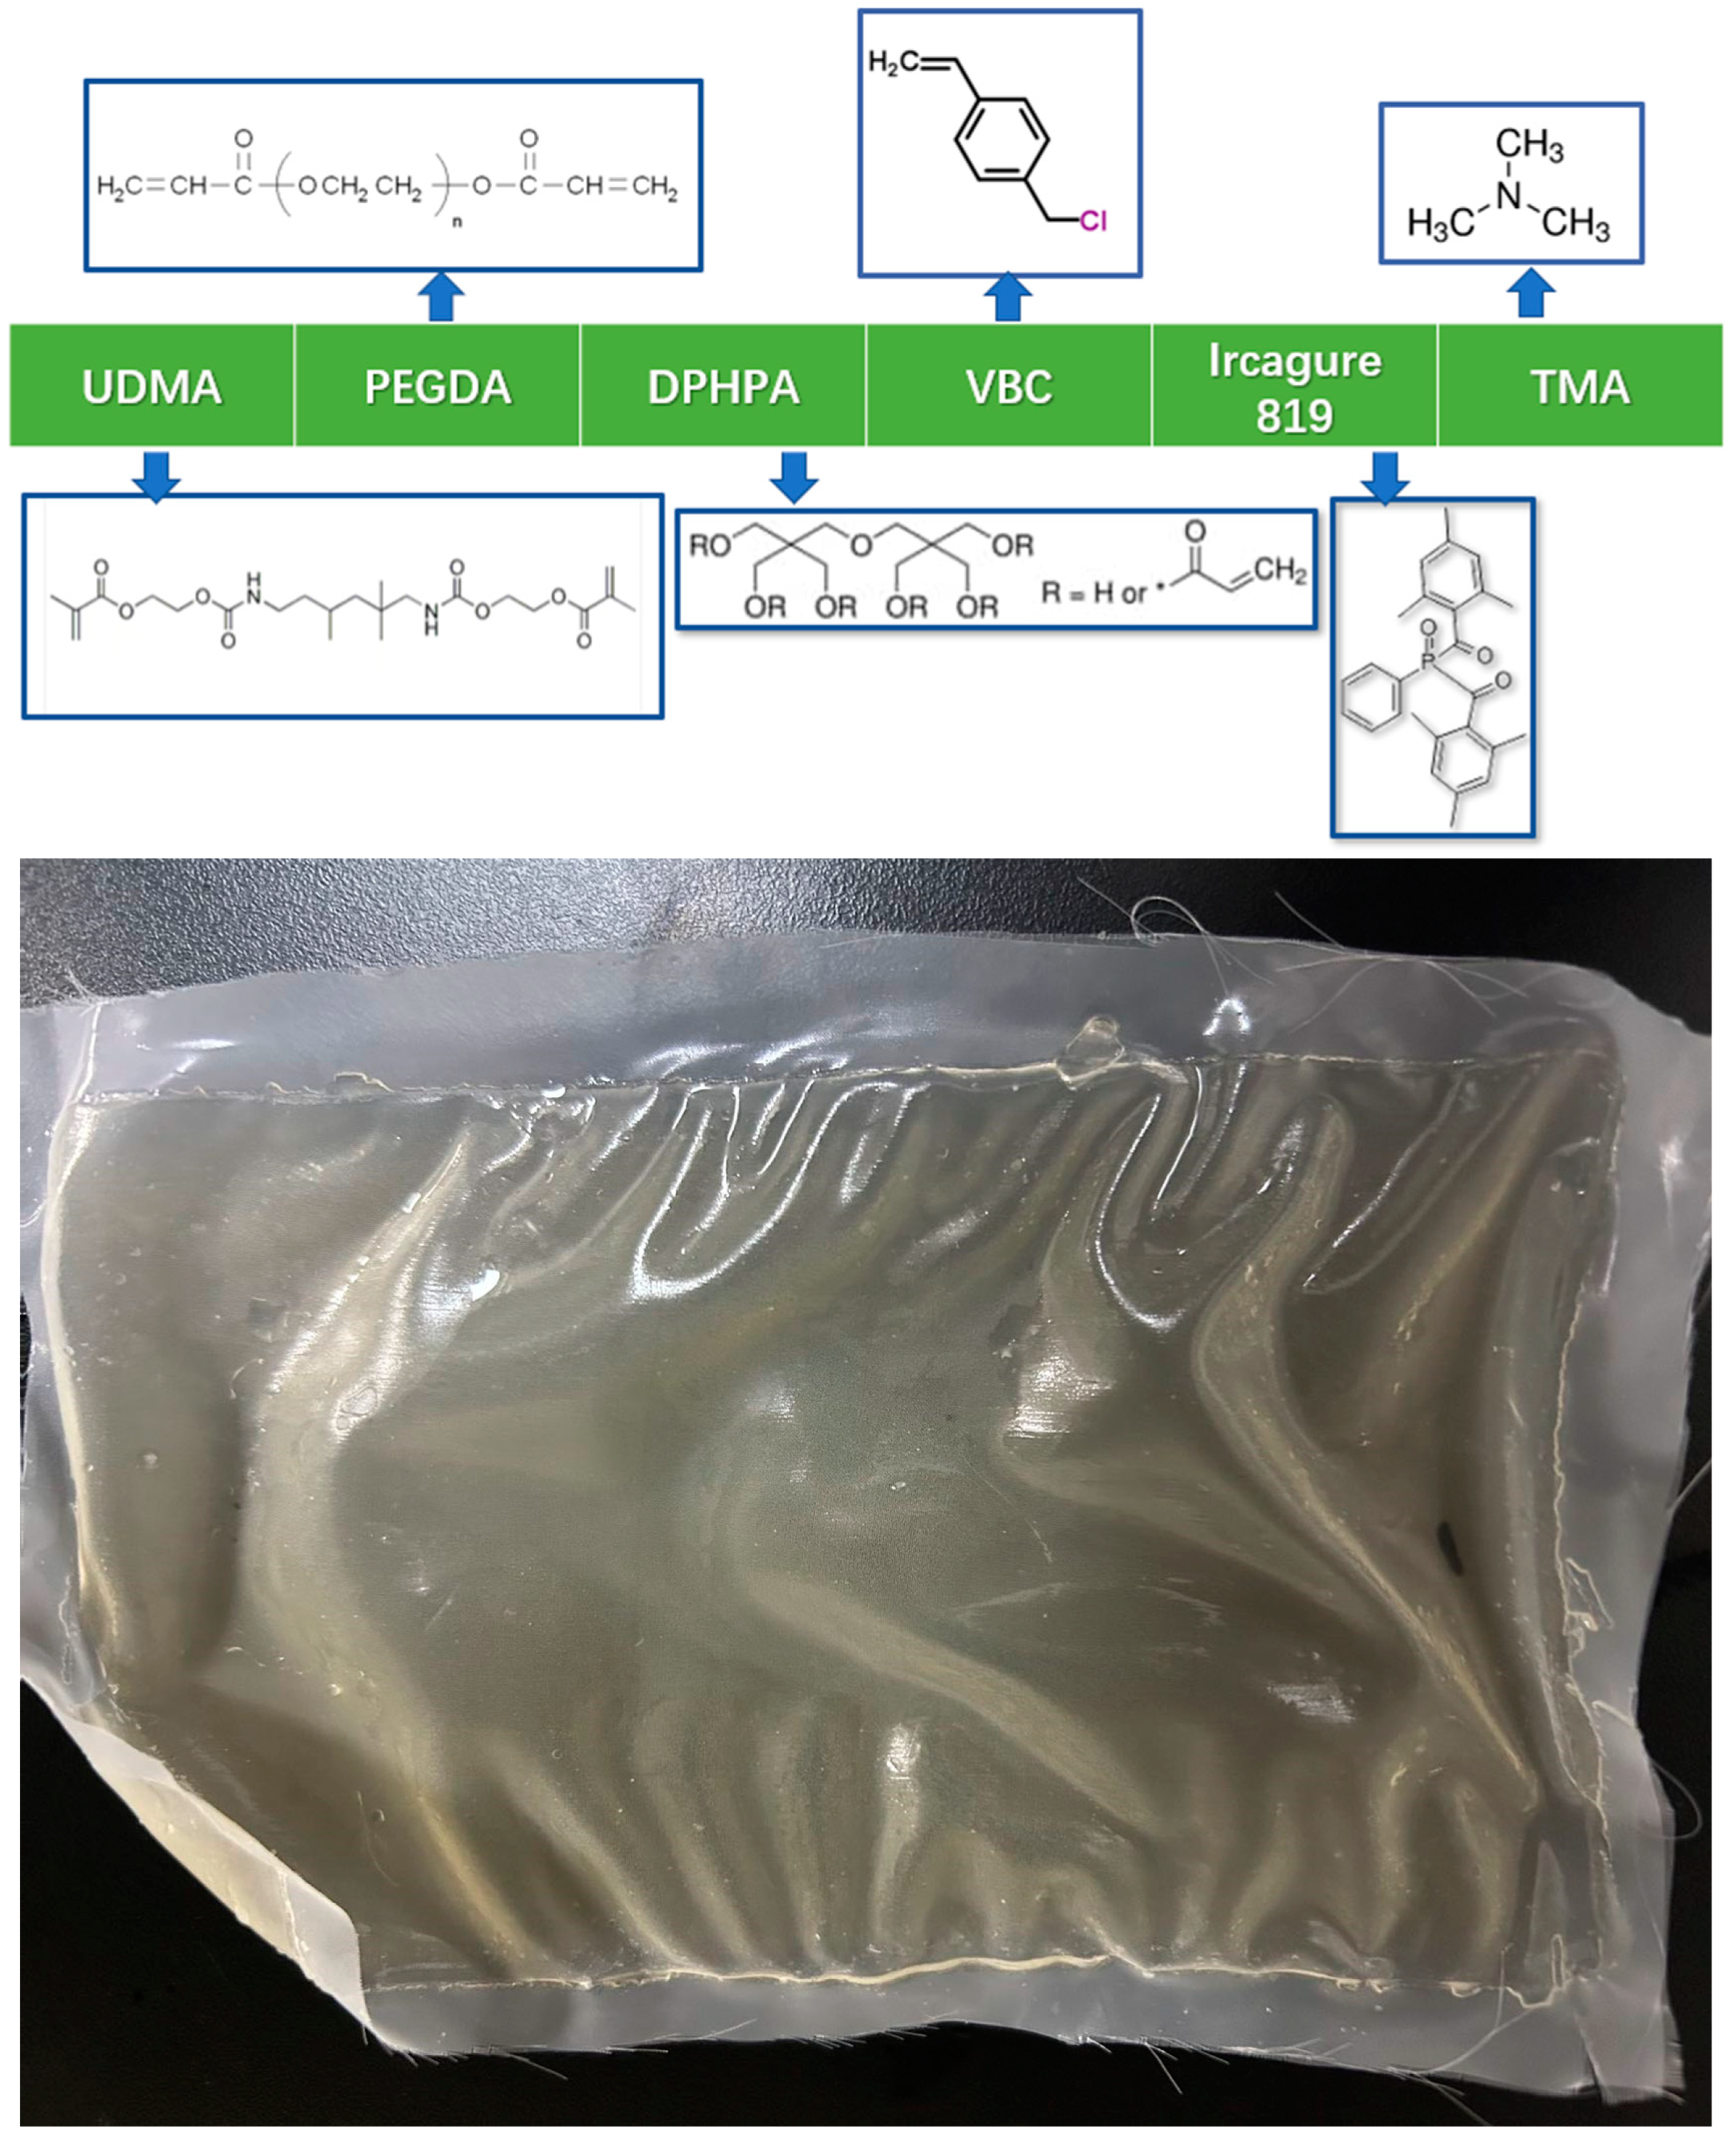
Polyethylene glycol diacrylate (PEGDA, Macklin®, Shanghai, China), urethane dimethacrylate (UDMA, Evonik®, Frankfurt, Germany), dipentaerythritol pentaacrylate (DPHPA, Macklin®, Shanghai, China), 4-vinylbenzyl chloride (VBC, Macklin®, Shanghai, China) and phenylbis(2,4,6-trimethylbenzoyl)-phosphine oxide (Irgacure 819, Macklin®, Shanghai, China) were mixed in a brown reagent bottle to prevent precuring occurred under the natural light. The mass fraction ratio of UDMA:DPHPA:VBC was set at 10:6:1 based on previous research, in which different variables have been studied [18]. After mixing, the casting solution was stirred at a spin speed of 500 rpm at room temperature for 12 h to achieve homogenization before being used for the 3D printing process.
A textile fabric was pre-fixed on the printing platform of a DLP 3D printer (Breuck T3D®, Qingdao, China) to facilitate the formation of the photocurable membrane. The casting solution was poured into a resin vat carefully to prevent the generation of bubbles. Printing parameters such as the slice thickness, number of printing layers and photocuring time were preset according to the experiment’s requirements. During the printing process, it was essential that the room temperature was controlled within the range of 24 to 25 °C. The printing was conducted in a dark environment without any strong light exposure. Figure 1 demonstrates the forming principles of DLP 3D printing.
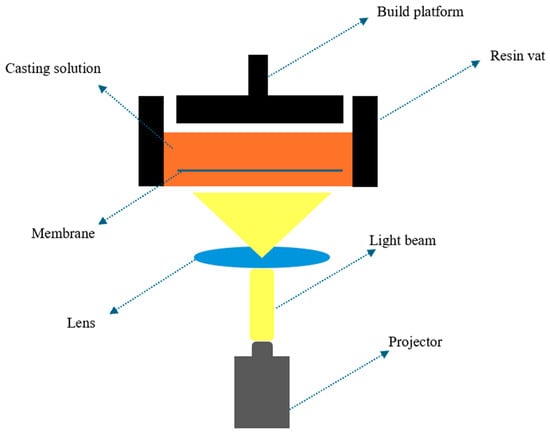
Figure 1.
Schematic diagram of the DLP 3D printing process.
After printing, the membrane was removed from the platform and repeatedly rinsed with methanol and deionized water to remove any uncured parts. Then, it was soaked in a mixed solution of methanol and trimethylamine for 24 h to achieve quaternization of the base membrane, with a volume ratio of TMA (30 wt%) to MeOH of 1:9. After quaternization, the membrane was washed with a 0.5 mol NaCl solution and stored. The solution was changed three times within 24 h, and thereafter, the 3D printed anion exchange membrane was stored in the same salt solution.
During the experiment, the variables for membrane printing included curing time (20, 30, 40 and 60 min), number of printed layers (25 μm × 2 layers and 50 μm × 1 layer), PEGDA molecular weight (200, 400 and 700) and VBC content (10%, 15% and 20%). The content of the photoinitiator in all experiments was kept the same at 2%. The various membrane printing parameters are shown in Table 1. The structural formulas of the raw materials and the actual image of the DLP 3D printing membrane are shown in Figure 2.

Table 1.
Print parameters of the DLP 3D printed membranes.
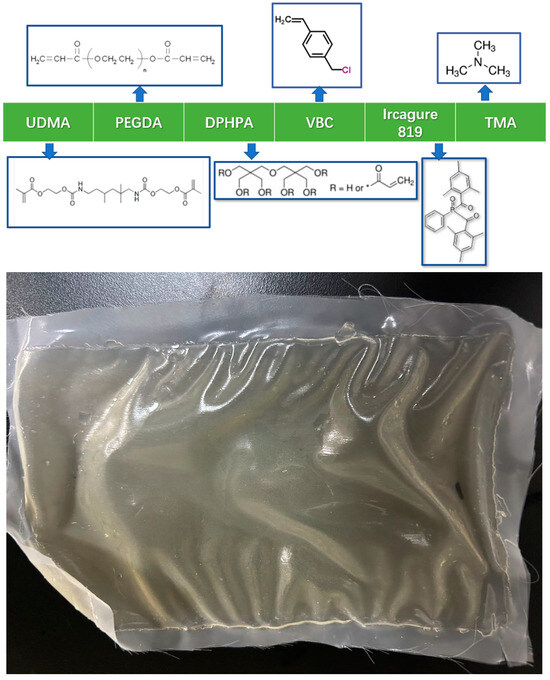
Figure 2.
Structural formulas of the raw materials and the actual image of the DLP 3D printed membrane.
2.2. Experimental Methods
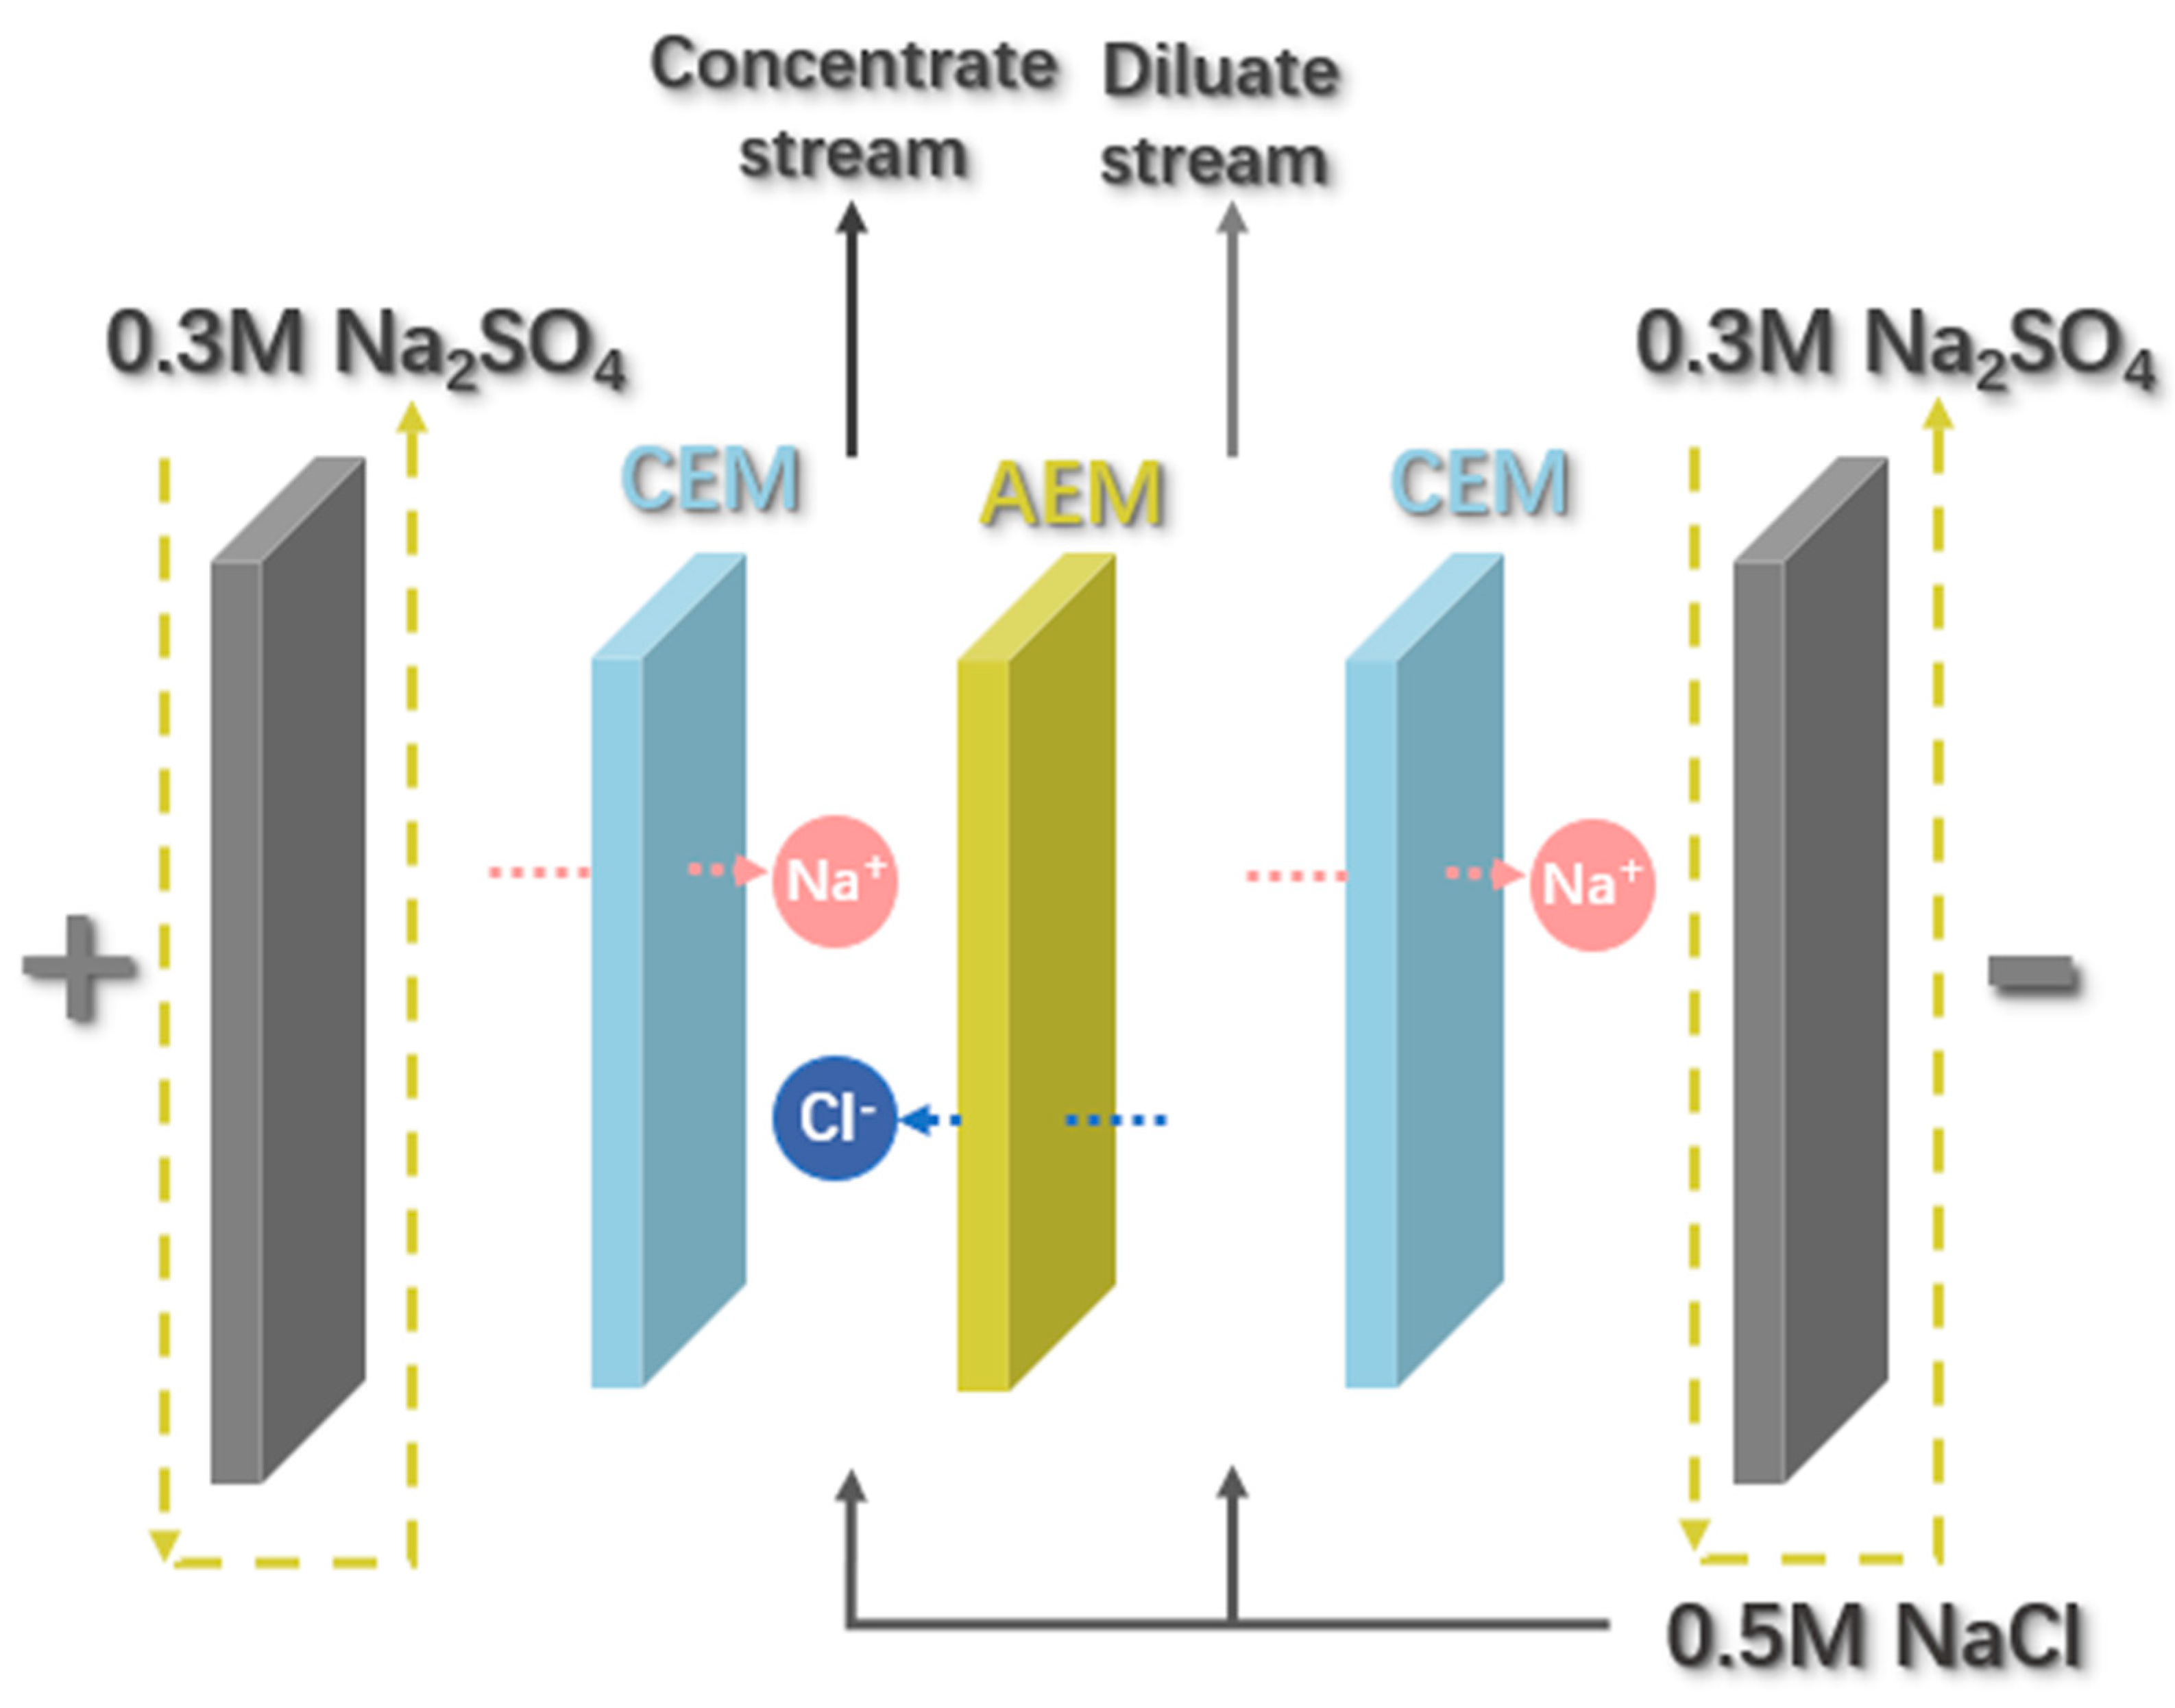
The performance of the DLP 3D printed membranes was investigated through electrodialysis experiments. The membrane stack used in the electrodialysis experiment is shown in Figure 3. This setup consists of ruthenium-coated titanium electrodes and acrylic spacers (13.2 cm × 10 cm × 1 cm). Ion exchange membranes were arranged in the sequence of CEM/AEM/CEM between the acrylic spacers and were sealed with silicone gaskets. CEMs utilized SYMC-2 (SinoMem®, Jieshou, China) commercial membranes, while the AEMs were either SYMA-1 (SinoMem®, Jieshou, China) commercial membranes or the laboratory-made DLP 3D printed membranes. The effective membrane area of the stack was 20 cm2, with a thickness of 1 cm for each chamber. The number of membrane stacks used in this experiment was 1, including a concentrate chamber, a diluate chamber, and an electrode chamber. The initial solution in the electrode chamber was 0.3 mol Na2SO4, while the concentrate and diluate chambers were filled with 0.5 mol NaCl. The volume of each chamber was 0.3 L, with a flow rate of 30 L‧h−1. Except for the investigation of the impact of the current density on desalination performance, a direct current density of 400 A/m2 was applied. During the experiment, a sample with a volume of 3 mL was taken periodically and the experiment was terminated when the voltage reached 60 V.

Figure 3.
Configuration of the electrodialysis membrane stack.
The ion separation experiment used the same setup, also with a single stack module, including concentrate, diluate, and electrode chambers. The CEMs on both sides were still SYMC-2 commercial membranes, and the AEMs were DLP 3D printed membranes (membrane parameters: PEGDA-100, 15% VBC, 1 h curing time, and a layer of 50 μm × 1 layer). The initial solution in the electrode chamber was 0.1 mol Na2SO4, while the diluate chamber contained a mixture of 0.1 mol Na2SO4 and 0.1 mol NaCl, and the concentrate chamber contained 0.1 mol NaCl solution. The volume in each chamber was 0.3 L with a flow rate of 30 L‧h−1 at a current density of 100 A/m2. Samples of 3 mL were taken hourly for analysis and the experiment was stopped after 9 h. The durability of the DLP 3D printed membrane in the conditions of the electrodialysis experiment was approximately 2 to 3 uses, which was influenced by factors such as the quality of the membrane itself, the current density, and the flow rate.
2.3. Analytical Methods
2.3.1. Membrane Structure Analysis
Before characterization, the DLP 3D printed membrane was placed in an oven at 60 °C for 24 h to remove moisture. The chemical structure characteristics of the membrane surface were analyzed using Fourier transform infrared (FTIR) spectrometer (Nicolet IS10, ThermoFisher Scientific®, Waltham, MA, USA) in the range of 4000 to 400 cm−1 with a resolution of 4 cm−1. The surface elemental composition and molecular structure of the membrane were analyzed using X-ray photoelectron spectroscopy (XPS) (D/MAX/2500PC, Rigaku®, Tokyo, Japan). The surface roughness of the membrane was analyzed using an atomic force microscope (AFM) (Dimension Icon, Bruker®, Qingdao, China). The surface and cross-sectional structures of the membrane were observed using a scanning electron microscope (SEM) (Sigma 300, ZEISS®, Shanghai, China). The observation of the cross-section membrane surface was conducted using the conventional liquid nitrogen cryogenic fracture method.
2.3.2. Membrane Performance Analysis
The ion exchange capacity (IEC) of the membrane was determined using a titration method. Since the DLP 3D printed membrane had been stabilized for 24 h and was stored in a 0.5 mol NaCl solution, making it a chloride-type anion membrane, it was not further treated for soaking. The 3D printed membrane was cut into 2 cm × 2 cm squares, rinsed with deionized water, and soaked in 100 mL of 2 mol NaNO3 solution for 24 h. During the titration process, K2CrO4 was used as an indicator and the solution was titrated with 0.1 mol AgNO3 solution until the endpoint was reached. The formula for calculating the IEC value (mmol·g−1) is as follows:
where is the concentration of AgNO3 solution (mol·L−1), is the volume of AgNO3 solution (mL) and is the dry weight of the membrane (g).
After soaking the membrane in deionized water for 24 h and absorbing the surface moisture using filter paper, the membrane was placed on a weighing scale to measure the membrane’s wet weight. The thickness and area of the membrane were measured as well, recording the weight at this time as and the thickness as . The wet membrane was then dried in an oven at 60 °C for 24 h and the weight of the dry membrane () was recorded when the weight became constant. The equation for calculating the water uptake () of the membrane is given by:
The water contact angle of the DLP 3D printed membrane was determined using the sessile drop method [26]. The dry membrane was fixed onto a glass slide using double-sided tape and placed on the sample stage. An appropriate amount of deionized water was loaded into a syringe and the height from the membrane to the syringe was adjusted accordingly. Then, the syringe was slowly pushed to form a droplet and dropped onto the sample surface. A photo of the droplet on the sample surface was taken. The contact angle was measured by identifying the three-phase contact line on the membrane surface.
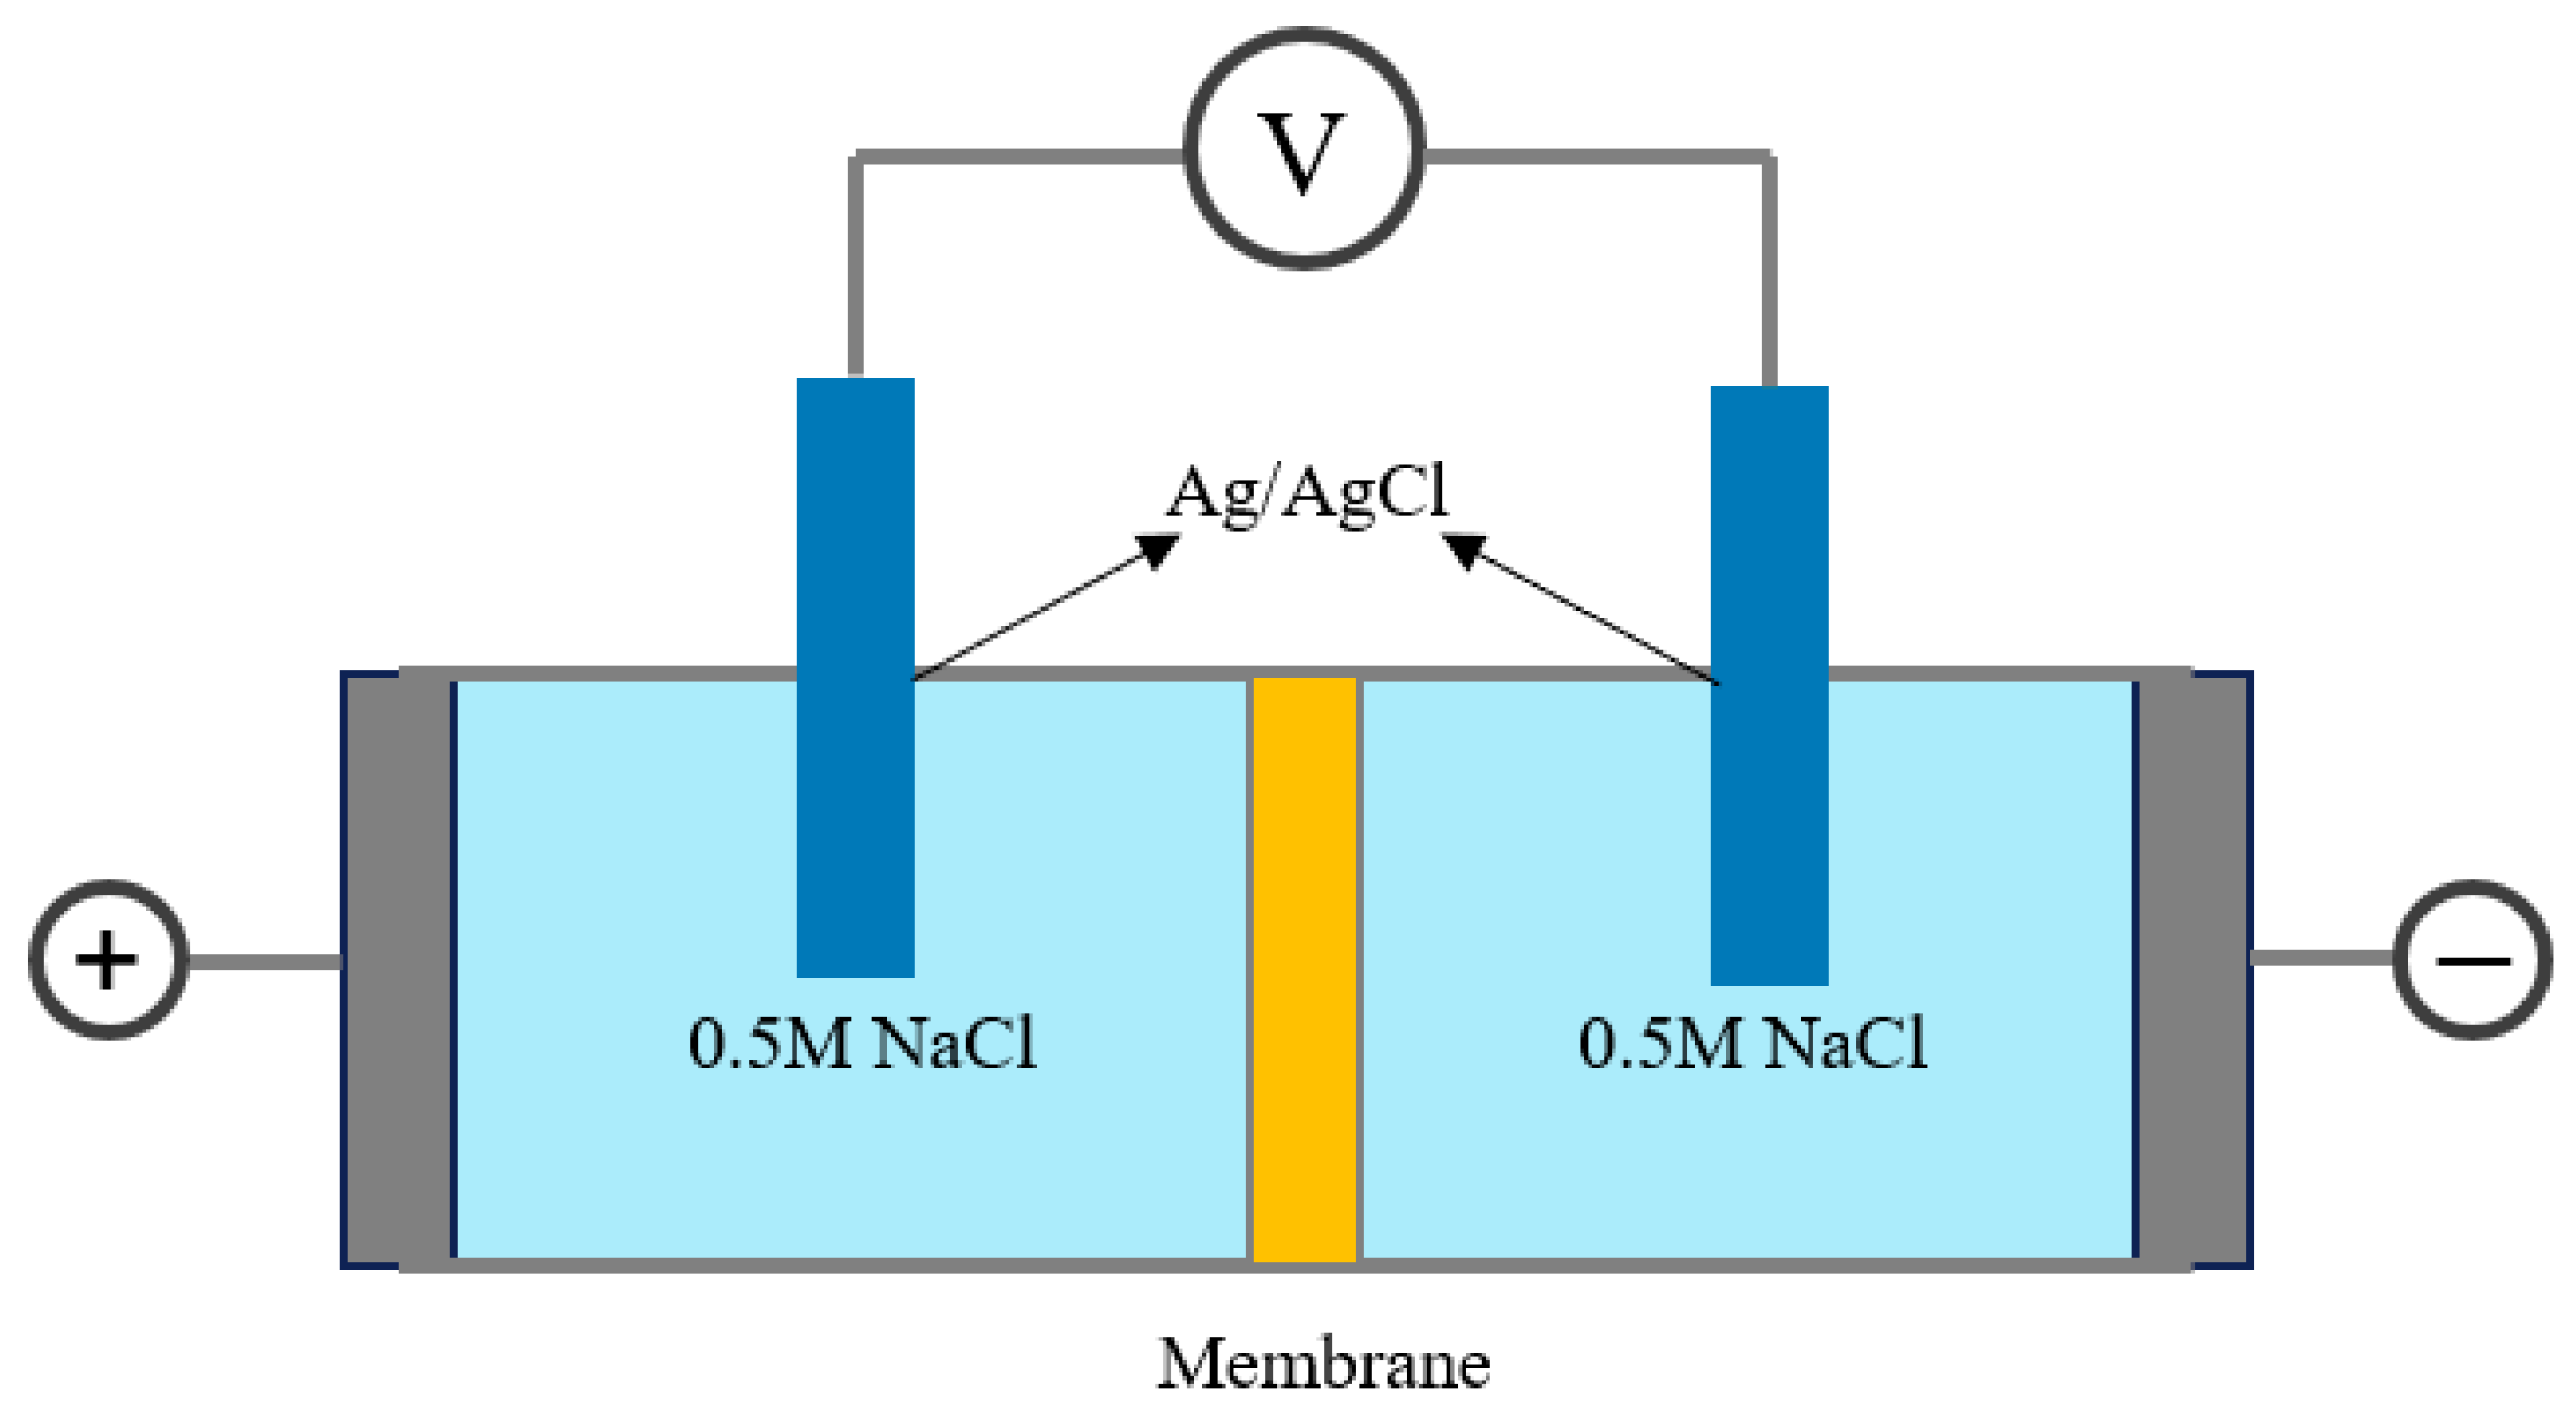
The membrane surface resistance was measured using a direct current through a two-chamber device as shown in Figure 4. The prepared membrane was soaked in 0.5 mol/L NaCl for 24 h before testing. During the test, the membrane was fixed between the two chambers and a peristaltic pump was used to fill each chamber with 0.5 mol/L NaCl solution and maintain the circulation, with an effective membrane area of 7.065 cm2. Direct current was applied to the electrodes on both sides and the potential drop across the membrane was measured with Ag/AgCl electrodes. Data were recorded using LabView software and the measurements were repeated three times to obtain an average value. Using the same method, a control group without the membrane was measured to eliminate the resistance brought by the NaCl solution. The formula for calculating the membrane surface resistance (, Ω·cm2) is given in Equation (3):
where is the resistance with the membrane (Ω), is the resistance measured from the control group (Ω) and is the effective membrane area (cm2).

Figure 4.
A schematic diagram of the membrane surface resistance measuring device.
2.3.3. Electrodialysis Performance Analysis
The concentration of all samples was measured using an ion chromatography (IC) device manufactured by Shanghai Sunny Hengping Scientific Instrument Co., Ltd., Shanghai, China (IC-1286). The desalination rate (DR) in the diluate chamber can be calculated as:
where and are the concentration of NaCl (mg/L) at the beginning and at time in the diluate chamber, respectively.
The concentration rate (CR) can be expressed as:
where and are the concentration of NaCl (mg/L) at the beginning and at time in the concentrate chamber, respectively.
The water loss rate in the diluate chamber (, %) can be calculated using Equation (6):
where is the initial solution volume in the diluate chamber (L) and is the solution volume in the diluate chamber at the end of the ED experiment (L).
The water increase rate in the concentrate chamber (, %) can be calculated as:
where is the initial solution volume in the concentrate chamber (L) and is the solution volume in the concentrate chamber at the end of the ED experiment (L).
The ion flux (mol·m−2·h−1) and water flux (L·m−2·h−1) are expressed as shown in Equations (8) and (9):
where is the ion concentration (mol·L−1) at time , is the solution volume (L) at time and is the effective membrane area (m2), which in this experiment is 0.002 m2.
To specifically analyze the economic efficiency of different membrane parameters, it is necessary to calculate the current efficiency and energy consumption during the electrodialysis process. The current efficiency (, %) can be calculated as:
where is the valence state of the ion and in this experiment, for Cl− and SO42−, is 1 and 2, respectively; is the Faraday constant, expressed as 96485 C·mol−1; is the mole number of ions transferred during the electrodialysis experiment (mol); is the number of membrane stacks and its value is 1 in this equation; is the current density (A·m−2); and is the time of the experiment (s).
The energy consumption (kWh·kg−1) in the desalination experiment is calculated as follows:
where is the voltage drop (V) and is the molar mass of the ion (g·mol−1).
The energy consumption in the monovalent and divalent ion separation experiment is provided by both Cl− and SO42−, thus the energy consumption is calculated with Equations (12) and (13):
where is the charge transfer amount required to produce the ion and is the total charge transfer amount.
To analyze the performance of the DLP 3D printed membrane for the divalent and monovalent separation, the following values need to be calculated:
where and are the purity of Cl− and SO42− (%).
The monovalent/divalent ion selective coefficient can be calculated as:
The relative migration rate of the DLP 3D printed membrane can be calculated using Equation (17):
When > 0, the migration of Cl− is greater than that of SO42−, while when < 0, the migration of Cl− is less than that of SO42−.
3. Results and Discussion
3.1. Analysis of the Membrane Characteristics
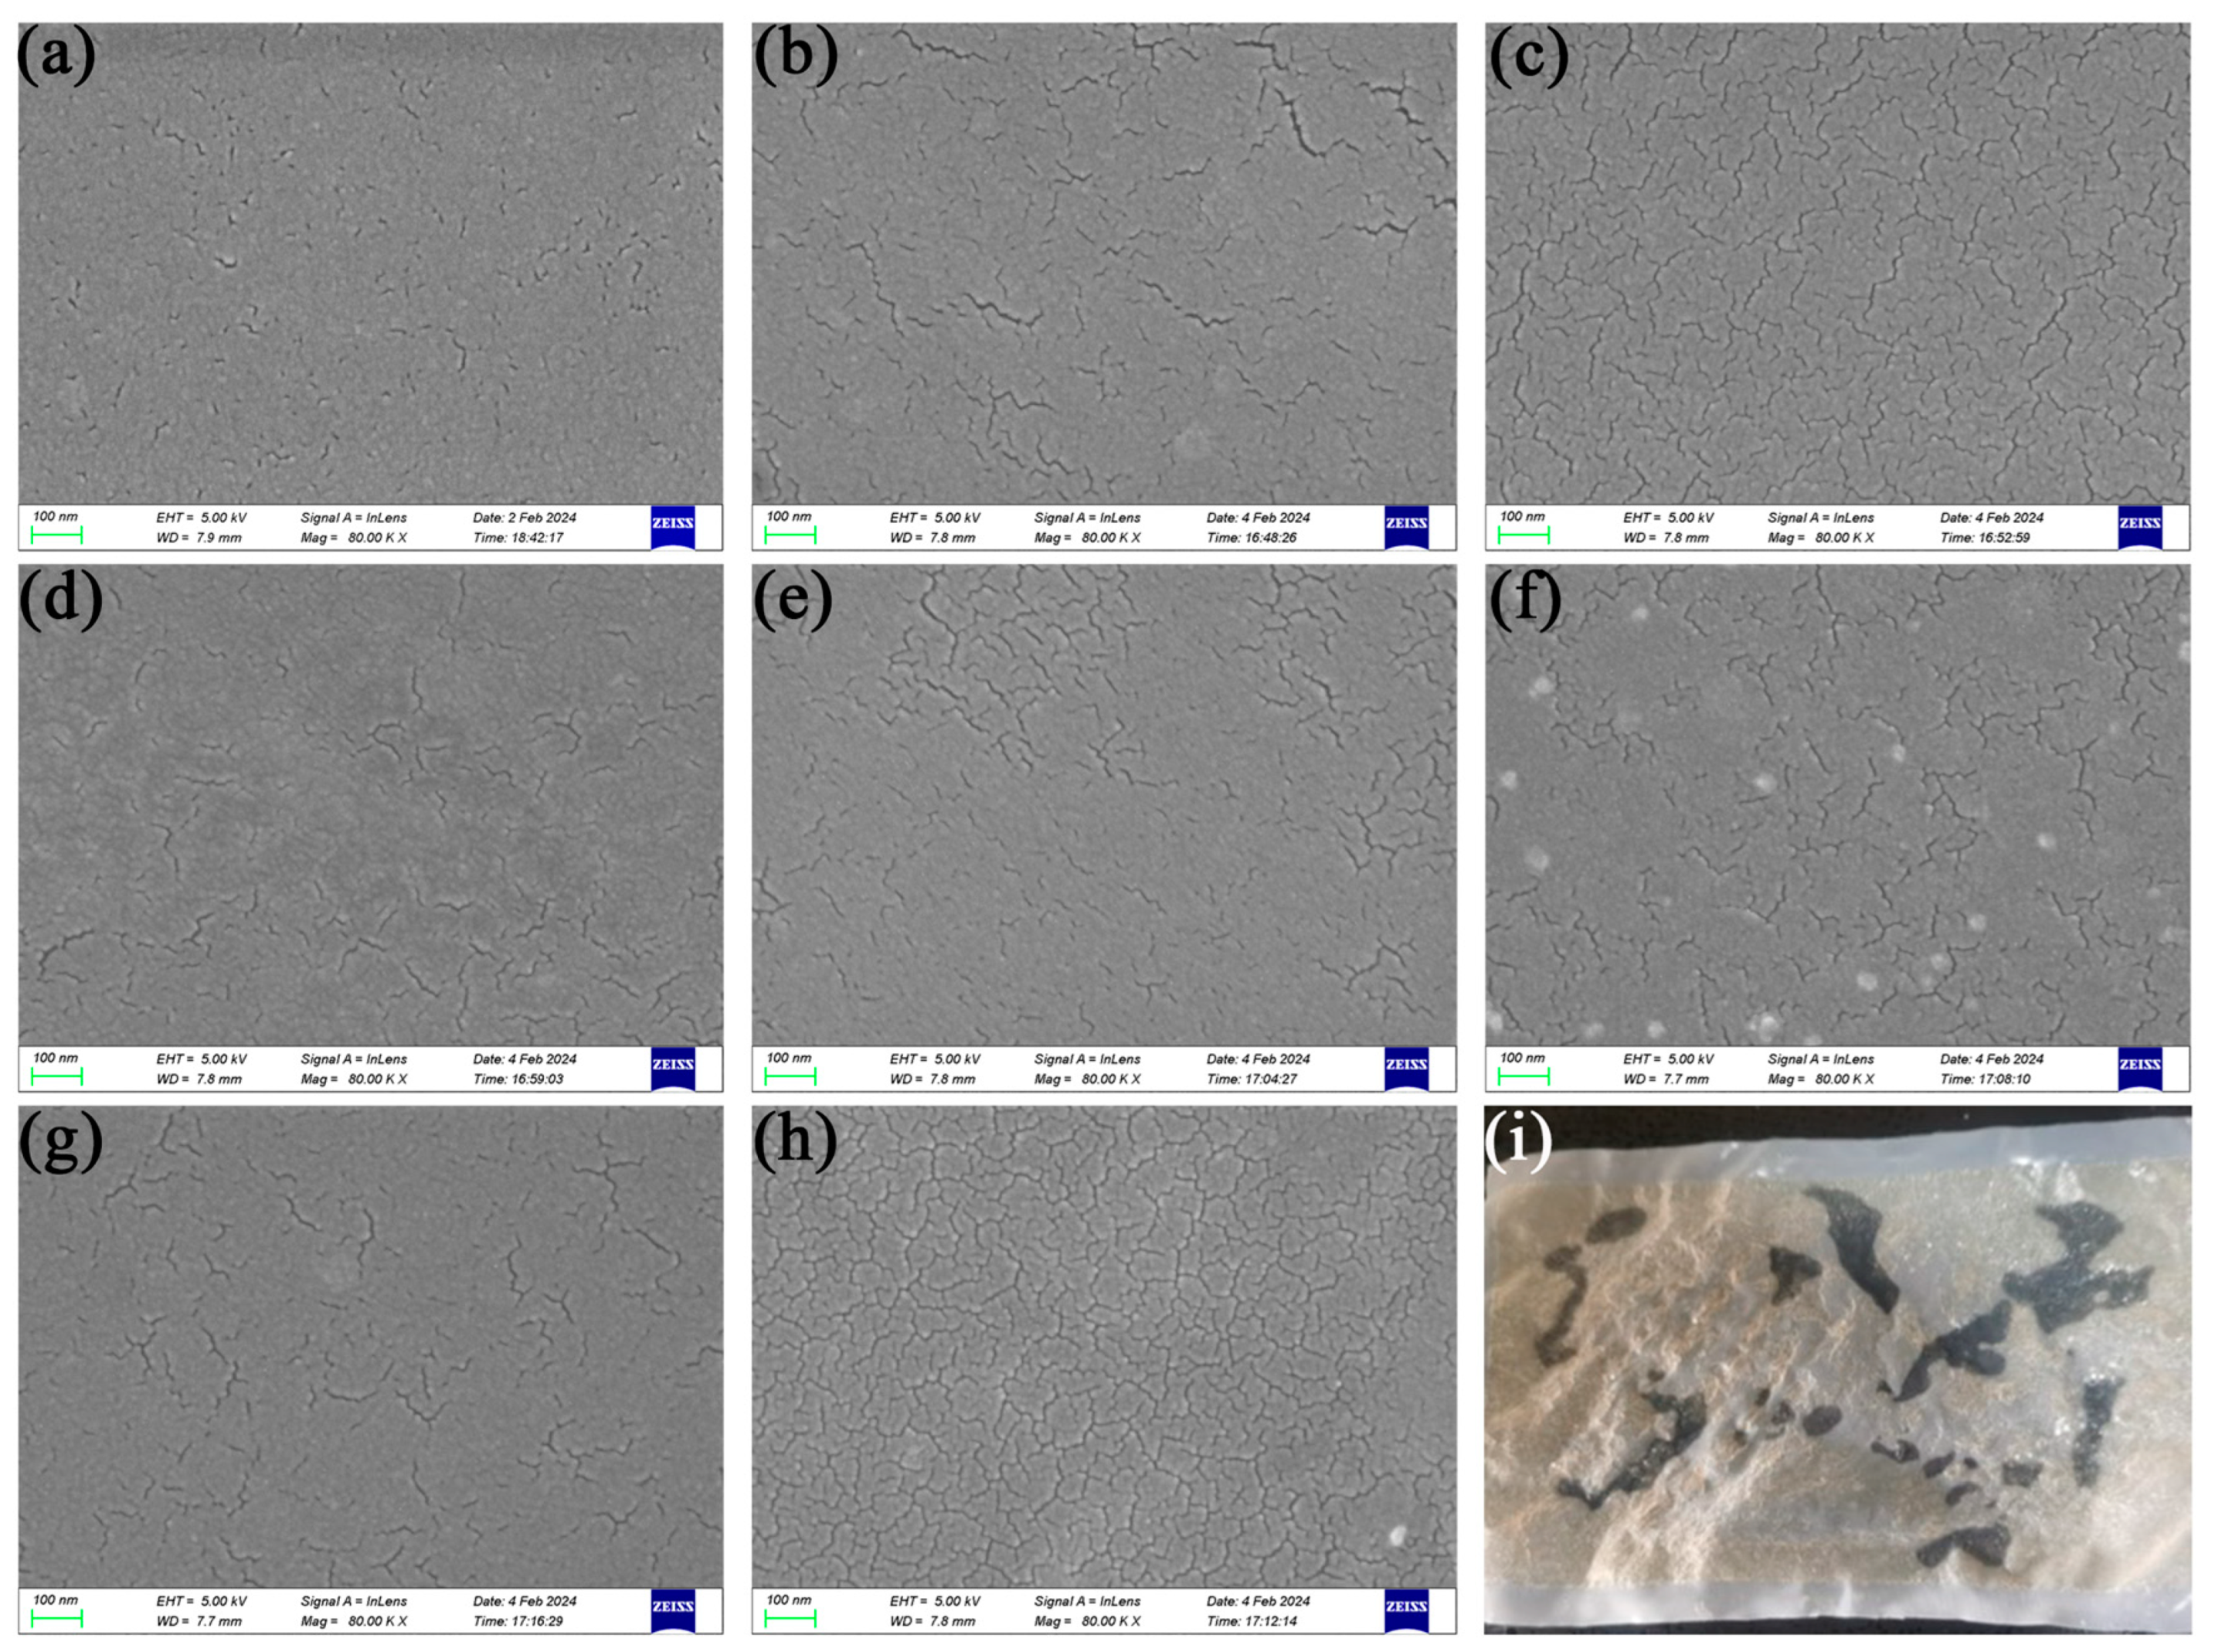
The SEM images of the surface morphology of the DLP 3D printed membranes listed in Table 1 have been illustrated in Figure 5. The images from (a) to (h) in Figure 5 correspond to No. 1 to 8 in Table 1, while Figure 5i is a picture of the membrane with 25% VBC content, which was damaged due to over quaternization. The SEM images of the cross-section morphology of the membranes are shown in Figure 6 and the images from (a) to (h) correspond to No. 1 to 8 in Table 1 and similarly, Figure 7 shows the AFM images of the membranes, indicating their surface roughness.
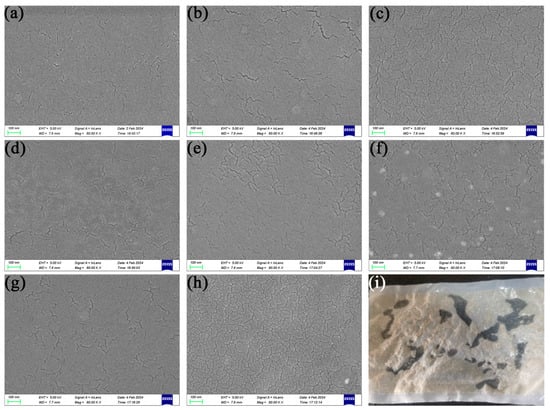
Figure 5.
SEM images of the membrane surface with (a) 20 min curing time; (b) 40 min curing time; (c) 60 min curing time; (d) single-layer printing; (e) PEGDA-200; (f) PEGDA-700; (g) 10% VBC content; (h) 20% VBC content; and (i) picture of membrane with 25% VBC content.
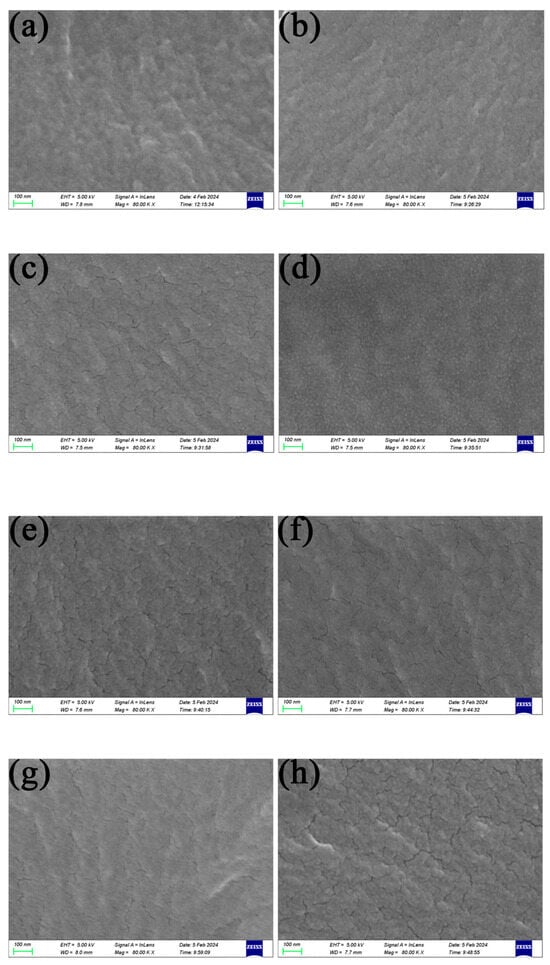
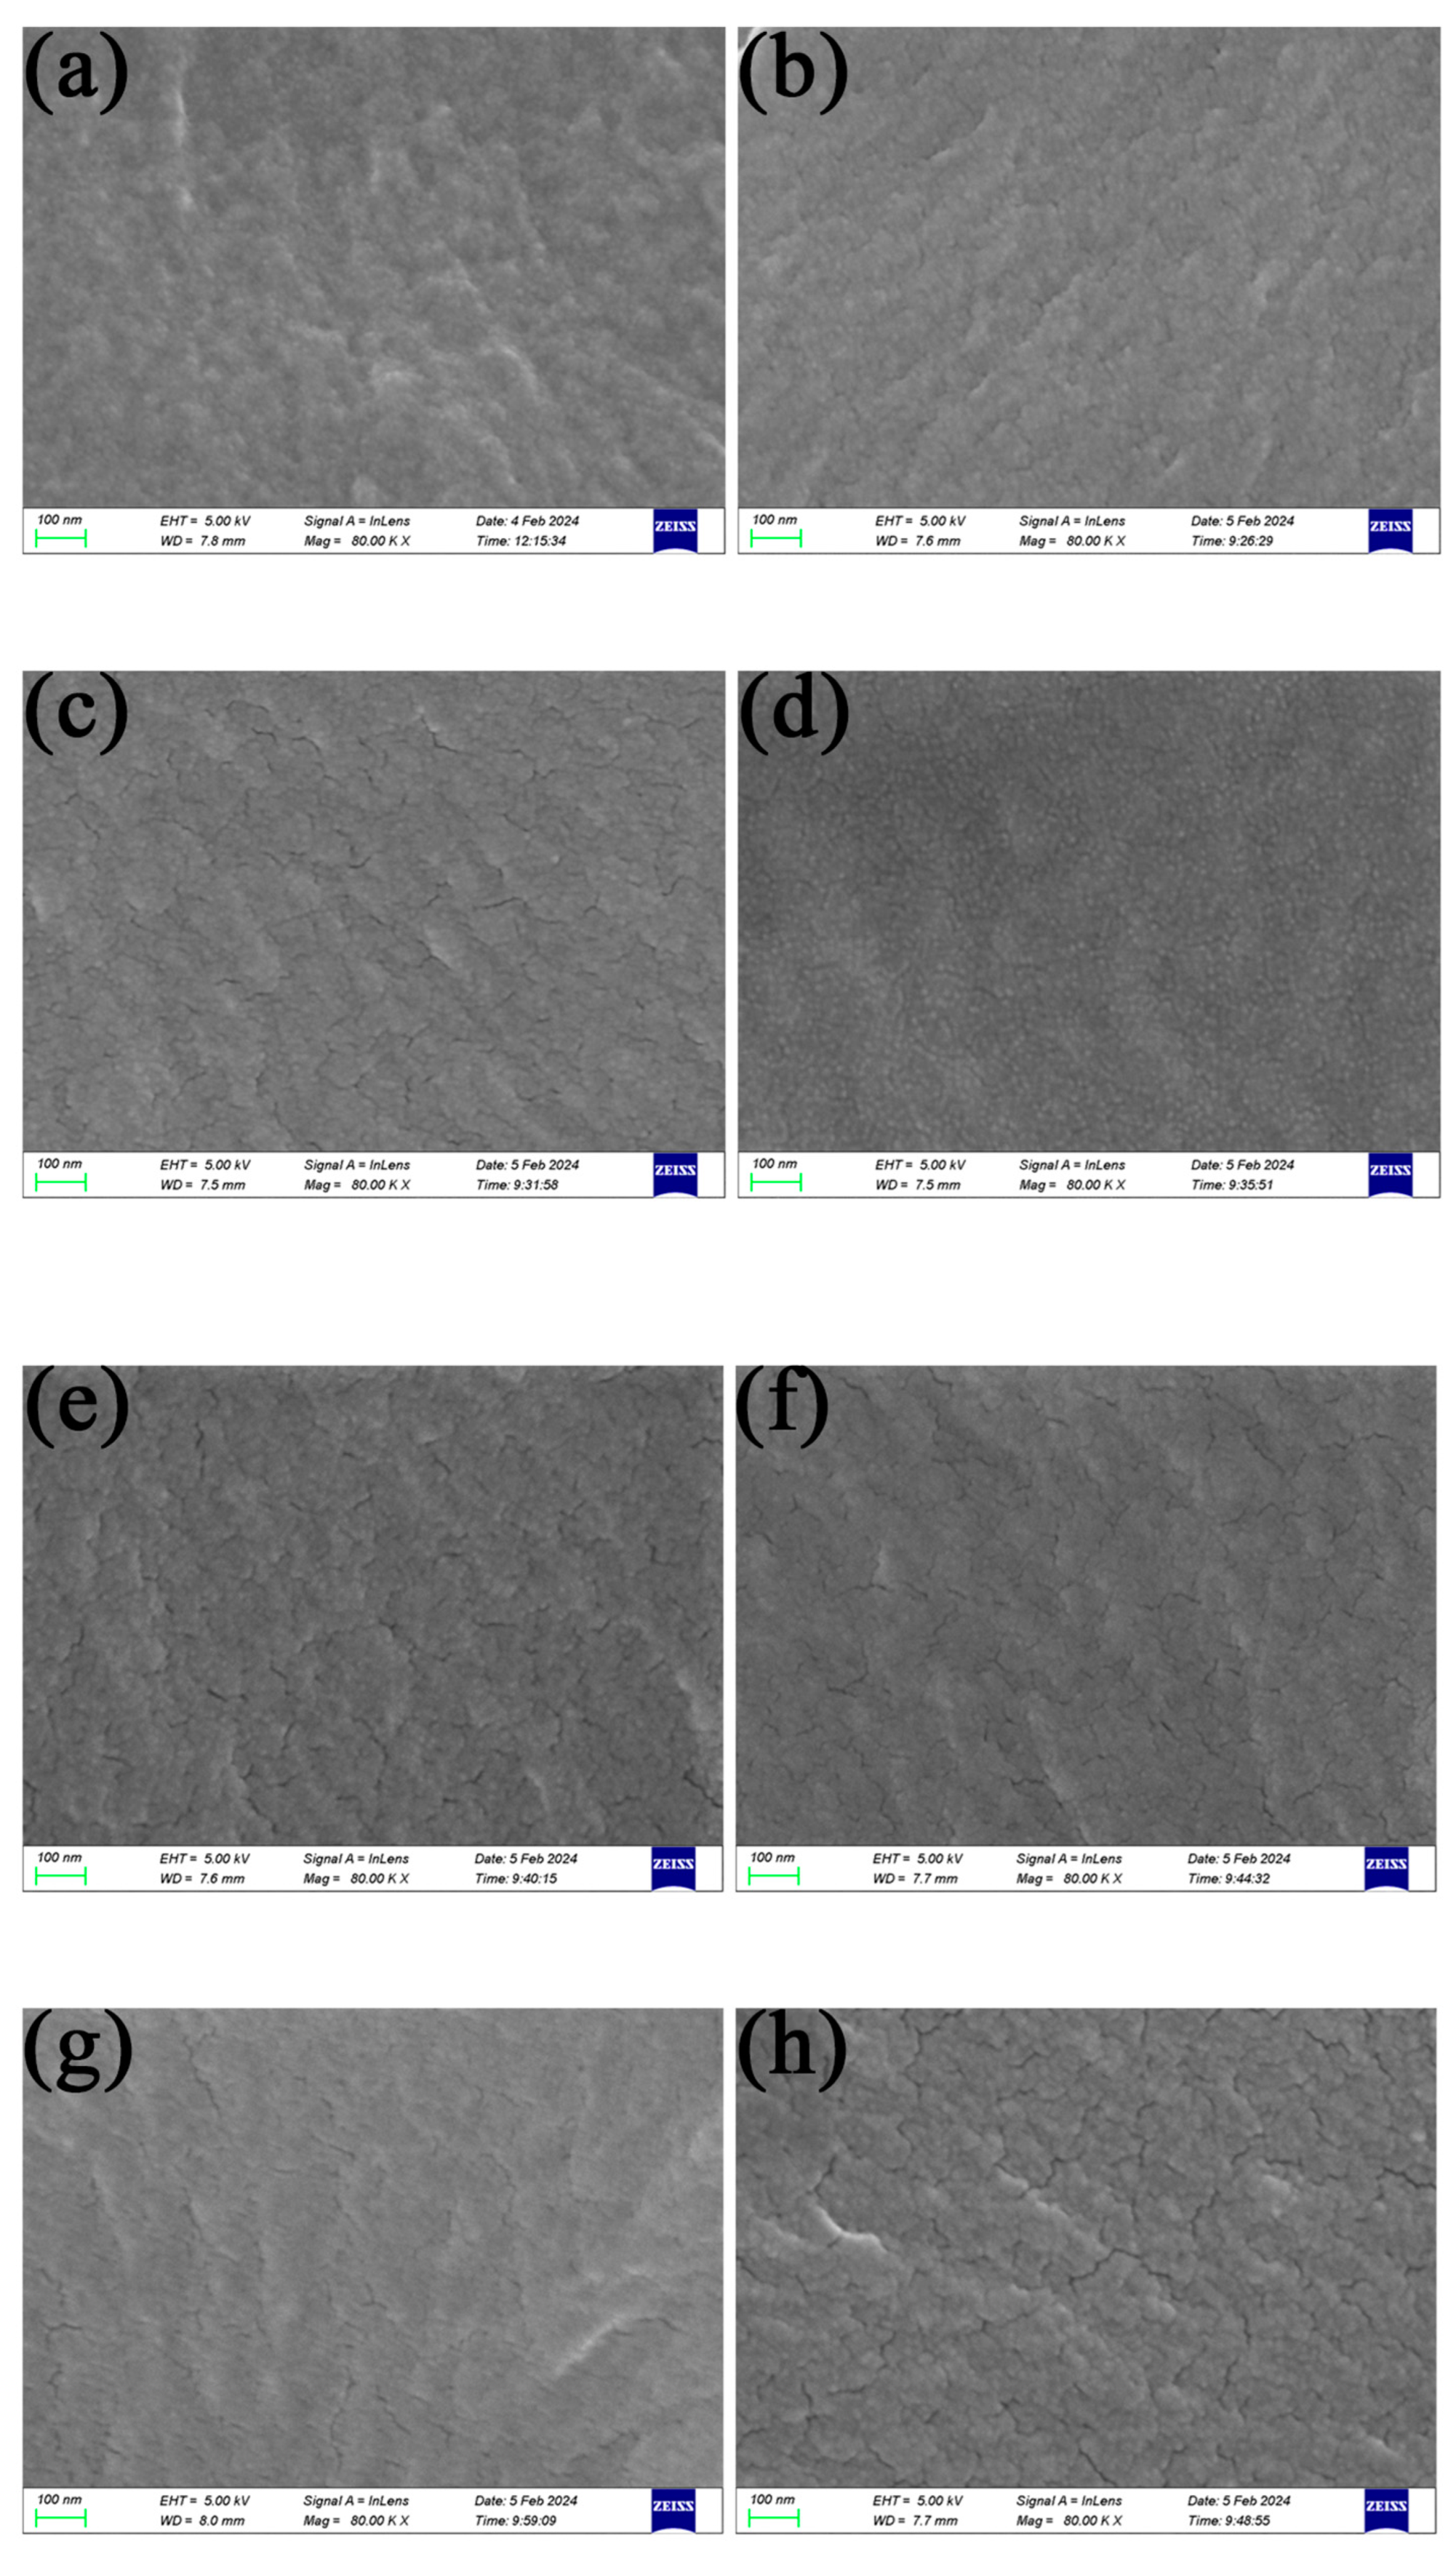
Figure 6.
SEM images of the cross-section membrane with (a) 20 min curing time; (b) 40 min curing time; (c) 60 min curing time; (d) single-layer printing; (e) PEGDA-200; (f) PEGDA-700; (g) 10% VBC content; (h) 20% VBC content.

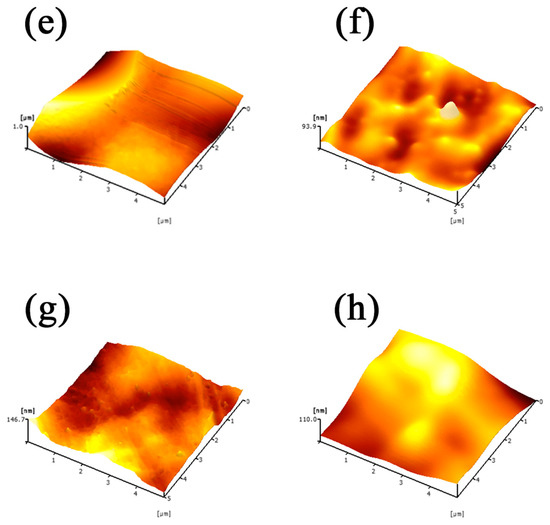
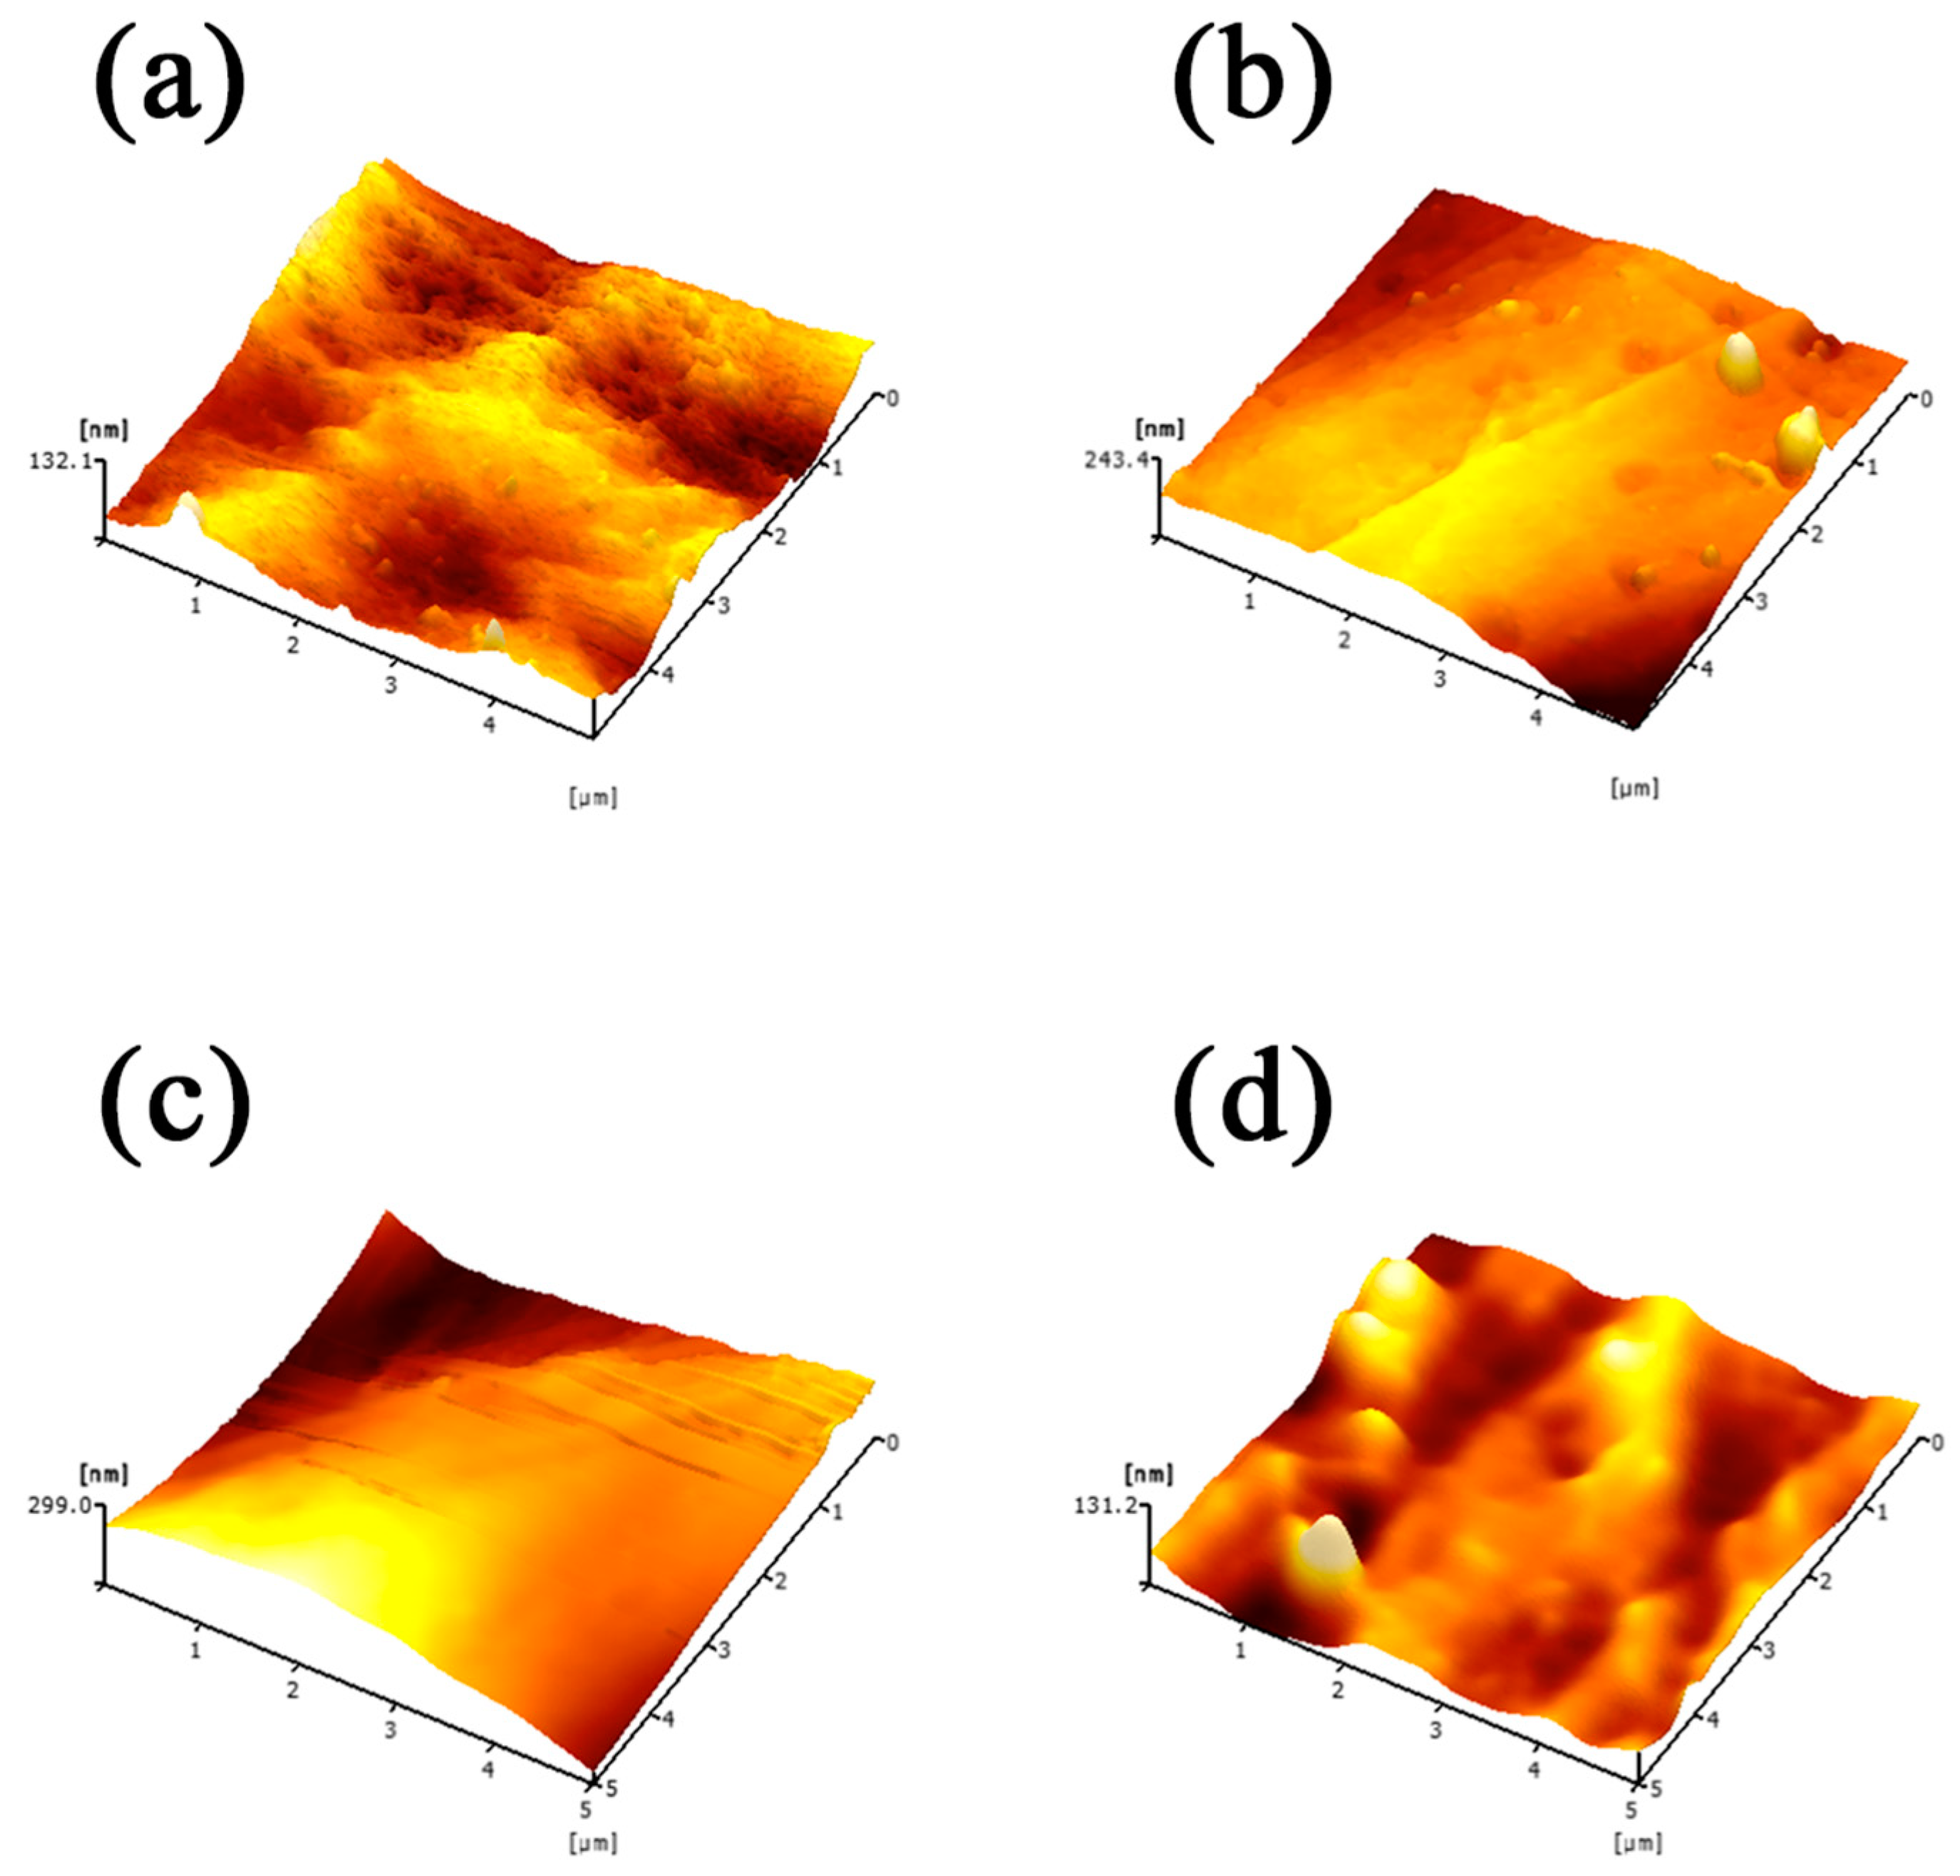
Figure 7.
AFM images of the membrane surface with (a) 20 min curing time; (b) 40 min curing time; (c) 60 min curing time; (d) single-layer printing; (e) PEGDA-200; (f) PEGDA-700; (g) 10% VBC content; (h) 20% VBC content.
3.1.1. Impact of Curing Time
As shown in Figure 5a–c and Figure 6a–c, the SEM images of the surface and cross-section morphology of the membranes prepared at different curing times were obtained at 80 k magnification. Due to the characteristics of the photosensitive resin and the features of the light curing process, the structures of the DLP 3D printed membranes were dense and uniform. By comparing the surface morphology characteristics of the membranes, it can be seen that the membrane surface structure was the densest when the curing time was 20 min. When the curing time was less than 20 min, the structure of the 3D printed membrane was relatively loose and unable to withstand quaternization and thus broke, which made it unsuitable for use in electrodialysis experiments. After increasing the curing time to 20 min, the structure of the membrane was just strong enough to withstand the corrosion of quaternization. However, as the curing time continued increasing, the pore density on the surface of the membrane started to increase. This may be due to the replacement of Van der Waals spaces by covalent bonds as the monomers in the photosensitive resin polymerized, reducing the free volume and causing polymerization shrinkage, which led to the formation of more micro-pores in the membrane. Comparing the cross-section morphology of different membranes, as the curing time increased, the pore density of the membrane cross-section increased and at a curing time of 60 min, the pore structure of the membrane cross-section was the most obvious.
As shown in Figure 7a–c, the impact of different curing times on the surface roughness of the membrane was demonstrated using AFM images. With the increase of curing time, the membrane surface became smoother, and the surface roughness (Rq) decreased from 18.01 nm for 20 min to 7.396 nm for 40 min and 3.677 nm for 60 min of curing time. Therefore, it can be concluded that the surface roughness of the membrane was reduced with an increase in curing time. The greater the surface roughness, the easier it is for the membrane to accumulate foulants on the membrane surface; thus, as the curing time increases, the possibility of membrane fouling gradually decreases [27]. However, a rough membrane surface also helps to keep the water flow in a turbulent state, which means the membrane with 20 min of curing time has the greatest extent of elimination of the concentration polarization phenomenon on the membrane surface.
The surface elements and chemical structures of the membranes were analyzed by XPS and FTIR as shown in Figure S1. Figure S1a presents the N1s spectrum of the membranes, and it can be noted that a peak at a binding energy of 399.68 eV is observed, representing the chemical bond of C-N, which indicates that the quaternary ammonium groups have been successfully grafted onto the base membrane. Here, the membrane with 20 min curing time is taken as an example, and other groups of membranes prepared in this section are similar and will not be shown individually. A full-spectrum XPS analysis of the membranes is shown in Figure S1b, where the main elements of the DLP 3D printed membrane are C, O, and N, corresponding to the photosensitive resin materials used for membrane preparation. At the same time, it can be observed that the content of Cl is very low, which is almost considered as a background value, indicating that the chloride ions on the base membrane have basically been replaced by quaternary ammonium groups, and the quaternization of all of the membranes is quite thorough.
As shown in Figure S1c, the content ratio of the surface elements among the different membranes was analyzed. With the increase in curing time, the proportion of N on the membrane surface increased, and the concentration of quaternary ammonium groups increased correspondingly. This indicated that the increase in curing time was in favor of opening the double bond of the quaternization precursor VBC for reacting with other photosensitive resins. When the curing time reached 40 min, the proportion of N on the membrane surface reached its peak, and a further increase in curing time slightly decreased this proportion. This suggests that further increasing the curing time hinders the effect of VBC in the polymerization reaction, which is possibly due to the relatively limited amount of VBC (15 wt%) and the excessive polymerization of the other photosensitive monomers.
The chemical structure of the membrane surface was analyzed using FTIR, as shown in Figure S1d. The peaks at 770 to 900 cm−1 correspond to the out-of-plane C-H bending vibration; the peak at 978 cm−1 corresponds to the C-N stretching vibration; 1102 cm−1 to the C-O-C stretching vibration; 1469 cm−1 and 1531 cm−1 to the C-C in-plane bending stretching vibration; 1707 cm−1 to the C=O stretching vibration; and 2950 cm−1 to the -CH3 stretching vibration. The peak positions of the membranes prepared at various curing times are essentially consistent, indicating that the basic framework of the membrane has not changed. Moreover, the characteristic peak of the quaternary ammonium group at 978 cm−1 further confirms that all of the membranes have successfully grafted quaternary ammonium groups. With the increase in curing time, the peak intensity of the quaternary ammonium group characteristic peak first increased and then decreased, suggesting it reached its peak at a curing time of 40 min.
3.1.2. Impact of the Number of Printed Layers
The surface and cross-section morphology of membranes fabricated with different numbers of printed layers are shown in Figure 5a,d and Figure 6a,d, respectively. With the increase in the number of printed layers, the membrane porosity increases. This is because during layer-by-layer printing, the overall curing time of a double-layer membrane is the same as in single-layer printing, while a reduction in print thickness means that each layer of photosensitive resin can absorb more energy within a fixed time. The increase in energy density enhances the curing rate of the photosensitive resin, thereby increasing its shrinkage stress, which leads to an increase in the porosity when printing the double-layer membrane.
The impact of different numbers of printed layers on the surface roughness of the membrane is shown in Figure 7a,d. Through comparisons, it is evident that the surface roughness (Rq = 18.01 nm) of the membrane printed in a single layer is slightly higher than that of the membrane printed in double layers (Rq = 15.73 nm). Therefore, it can be summarized that as the number of printed layers increases, a smoother surface has been obtained, which improves the membrane’s fouling resistance. However, a smoother surface may also allow for a more stable layer of concentrated solute to form at the membrane interface due to less turbulence effect, thereby enhancing the concentration polarization effects.
The surface elements and chemical structures of the DLP 3D printed membrane samples with different numbers of printed layers were analyzed using XPS and FTIR (Figure S2). In Figure S2a, the content of chlorine is very low, which also confirms that all membranes have been fully quaternized. Figure S2b compares the proportion of surface element contents, showing that with the increase in the number of printed layers, the proportion of N content rises, indicating that VBC is dominate in the polymerization reaction. Furthermore, the infrared spectrum in Figure S2c also shows that during double-layer printing, the characteristic peak of the quaternary ammonium group in the membrane is enhanced.
3.1.3. Impact of the PEGDA Molecular Weight
The surface and cross-section morphology of membranes made from different PEGDA molecular weights are depicted in Figure 5c,e,f and Figure 6c,e,f. At the same dosage, PEGDA with lower molecular weights contains more acrylate groups (photosensitive groups), which can enhance the crosslinking level of the photosensitive resin. Therefore, adjusting the PEGDA molecular weight is a common method used to change the crosslinking levels [28,29,30]. When comparing their surface morphological characteristics, it was found that at a molecular weight of 400, the surface exhibited more porous structures. In a comparison of the cross-section SEM images, it can be seen that the membrane made with PEGDA-200 has a slightly more porous structure. Nevertheless, the difference is not significant, and the cross-section structures of all three are substantially consistent.
The impact of different PEGDA molecular weights on the surface roughness of the membranes is shown in Figure 7c,e,f. When the PEGDA molecular weights were 200, 400, and 700, the corresponding surface roughness values (Rq) were 2.238 nm, 3.677 nm, and 9.143 nm, respectively. It is observed that the membranes with PEGDA molecular weights of 200 and 400 have smoother surfaces, while the membrane with a PEGDA molecular weight of 700 appears rougher. This demonstrates that the PEGDA molecular weight has a significant impact on the surface roughness of the membrane and based on the analysis from aforementioned sections, it can be inferred that PEGDA-200 and PEGDA-400 both have better anti-fouling capabilities.
As shown in Figure S3, the surface elements and chemical structures of membranes made from different PEGDA molecular weights were analyzed using XPS and FTIR. Similar to the previous results, Figure S3a confirms that all of the membranes are fully quaternized. Figure S3b shows that with the increase in PEGDA molecular weight, the proportion of N content initially decreased and then increased. In Figure S3c, it is observed that with the increase in PEGDA molecular weight, the intensity of the characteristic peak of the quaternary ammonium group at 978 cm−1 first decreased and then increased, with the weakest intensity at PEGDA-400 and the strongest at PEGDA-700. The reasons for this change still needs to be further explored.
3.1.4. Impact of the VBC content
Finally, the impact of the VBC content was investigated. As shown in Figure 5c,g,h and Figure 6c,g,h, the surface and cross-section morphology of membranes made with various contents of VBC are illustrated. It can be observed that the porosities of both the surface and cross-section of the membrane increased noticeably with the increase in VBC content. VBC is the raw material of the chloromethylation, which has a function of introducing chloride ions into the base membrane during the fabrication process. These chloride ions are subsequently converted to quaternary ammonium groups through quaternization, achieving functionalization of the IEM. As the VBC content increases, the proportion of other photosensitive resin monomers that contribute to the membrane’s structural framework decreases. Eventually, when the VBC content reaches 25% as shown in Figure 5i, the structure of the membrane fails to withstand the quaternization and breaks apart.
As shown in Figure 7c,g,h, the surface roughness of membranes made with different VBC contents is depicted. The surface roughness (Rq) of the membranes with VBC contents of 10%, 15%, and 20% were 5.500 nm, 3.677 nm, and 3.632 nm, respectively. The membrane with a VBC content of 10% exhibited the highest surface roughness, but overall, the impact of the VBC content on surface roughness appeared to be limited. The AFM images indicate that all three membranes are relatively smooth, which is advantageous in preventing membrane fouling.
The surface elements and chemical structures of membranes made with different VBC contents were examined using XPS and FTIR (Figure S4). The results from Figure S4a demonstrated results similar to previous findings that all membranes with different VBC contents were fully quaternized. Figure S4b shows that as the VBC content increased, the proportion of N content increased, while the total proportion of other elements dropped. This indicates that as the VBC content increased, the total amount of membrane structure monomers relatively decreased, thus enhancing VBC’s advantage in the polymerization reaction. When the VBC content increased from 15% to 20%, the content of membrane structure monomers decreased, which led to a reduction in the number of available binding sites. This reduction is a negative effect since it limits the number of positions where VBC can bind. However, simultaneously, the increase in the proportion of VBC, which acts as a functional monomer, enhanced its competitive ability to occupy available binding sites and eliminated the aforementioned negative effect. This explains the phenomenon of the N proportion reaching a relatively balanced state. Finally, the FTIR results in Figure S4c show that with the increase in VBC content, the intensity of the characteristic peak of the quaternary ammonium group at 978 cm−1 also gradually increased.
3.2. Membrane Performance Analysis
3.2.1. Impact of Curing Time
The membrane performance parameters were measured and calculated as listed in Table 2. With the increase in curing time, the thickness of the membrane gradually decreased from 325.7 μm to 240.6 μm. This reduction supports the idea that as curing time increases, the polymerization level of the monomers in the casting solution increases, leading to a reduction in membrane thickness.
Table 2.
The membrane performance parameters with different curing times.
The water contact angle of the membrane could reveal its hydrophobicity or hydrophilicity. Previous FTIR analysis showed that with the increase in curing time, the concentration of quaternary ammonium groups on the membrane surface first increased and then decreased. Since quaternary ammonium groups are hydrophilic, this causes the water contact angle to first decrease and then increase, meaning the hydrophilicity of the membrane surface first improves and then diminishes, and at 40 min of curing time, the optimal hydrophilicity state is achieved. Although the surface hydrophobicity or hydrophilicity affects the membrane’s water permeability, combining it with other properties is also necessary to determine the desalination performance of the membrane.
As the curing time increases, the membrane’s IEC initially rises from 0.93 mmol·g−1 to 1.35 mmol·g−1, then decreases to 0.94 mmol·g−1. Since DLP 3D printed membranes are relatively uniform, their surface characterization also represents the overall performance of the membrane to some extent, and the specific measurements of IEC are generally consistent with the infrared detection results. The trend in IEC suggests that there is a peak IEC for the given formula of the casting solution. Once this peak is reached, a further increase in curing time leads to excessive polymerization of the structural monomers in the casting solution, resulting in a relative decrease in IEC.
For the IEMs used in desalination experiments, it is crucial to minimize the membrane’s water uptake to reduce non-ideal water and salt transport. The membranes produced in this study, which absorb water from the environment via quaternary ammonium groups, are constrained by the IEC and show a similar trend of initially increasing and then decreasing. When the curing time increases from 20 min to 40 min, the number of grafted quaternary ammonium groups also increases. Since quaternary ammonium groups are hydrophilic, the water absorption rate is higher at 40 min compared to 20 min. Upon further curing to 60 min, as the quaternary ammonium groups reache saturation and the hydrophobic components of the membrane continue to increase, the water uptake rate decreases again. The water uptake rates of the membranes with different curing times range between 11.38% and 14.08%, indicating that DLP 3D printed membranes have a relatively low water uptake rate.
The conductivity of the membrane involves both the number of fixed groups within the membrane that facilitate conduction (i.e., the IEC) and the migration of the counterions inside the membrane (i.e., the water uptake). Increasing both the IEC and the water uptake can reduce membrane resistance. Therefore, as the curing time increases, the surface resistance of the membrane first decreases and then increases, and the membrane with a 40 min curing time has the lowest surface resistance.
3.2.2. Impact of the Number of Printed Layers
Table 3 shows the performance parameters of membranes fabricated with different numbers of printing layers. It can be seen that the thickness of the double-layer membrane is slightly bigger than the single-layer membrane, rising from 325.7 μm to 345.2 μm, which may be due to the limited resolution of the DLP 3D printer on the z-axis. Additionally, the water contact angle on the surface of the double-layer printed membrane is smaller than that of the single-layer one, indicating a more hydrophilic surface. When comparing the IEC of different membranes, it is found that increasing the number of printed layers can enhance the IEC. Specifically, when the number of printed layers increases from one to two, the IEC of the membrane rises from 0.93 mmol·g−1 to 1.17 mmol·g−1. The water uptake rate of the membrane, which is influenced by the IEC, also increases with the number of printed layers from 11.38% to 13.59%, making the membrane more hydrophilic overall. The membrane receives more energy during the double-layer printing, resulting in a higher number of grafted quaternary ammonium groups, which leads to an increase in the water uptake rate. Meanwhile, the surface resistance of the membrane decreases, influenced by both the water uptake and IEC.
Table 3.
The membrane performance parameters with different numbers of printed layers.
3.2.3. Impact of the PEGDA Molecular Weight
The performance of the membranes fabricated with different PEGDA molecular weights is summarized in Table 4. As the molecular weight of PEGDA increases, the thickness of the membrane first decreases and then increases, being the thinnest at PEGDA-400 with 240.6 μm and thickest at PEGDA-700 with 360.9 μm. Comparing the water contact angles of membranes made with different PEGDA molecular weights, it is observed that the water contact angle first increases and then decreases as the PEGDA molecular weight increases, indicating that the membrane surface is most hydrophobic at PEGDA-400 and most hydrophilic at PEGDA-700. Additionally, both the IEC and water uptake of the membranes exhibit a trend of first decreasing and then increasing with the increase in PEGDA molecular weight. At PEGDA-400, both the IEC and water uptake are at their lowest, at 0.94 mmol·g−1 and 11.42% respectively; in contrast, at PEGDA-700, they are at their highest, at 1.31 mmol·g−1 and 15.14% respectively. However, the mechanism of such phenomena requires further investigation. These parameters are consistent with the FTIR testing results. Considering both the water uptake rate and IEC, the membrane resistance is highest at PEGDA-400, at 0.17 Ω·cm2, and lowest at PEGDA-700, at 0.05 Ω·cm2.
Table 4.
The membrane performance parameters with different PEGDA molecular weights.
3.2.4. Impact of the VBC Content
Table 5 shows the performance parameters of membranes made with different VBC contents. A comparison of membrane thickness reveals that the membrane made with 10% VBC is the thickest, at 271.3 μm, which can be attributed to it having the largest amount of structural monomers. The membrane thicknesses for 15% VBC and 20% VBC are essentially the same, with the membrane made with 20% VBC being slightly thicker than that with 15% VBC, possibly due to its slightly higher water uptake rate, which leads to water-induced swelling. As the VBC content increases, the water contact angle of the membrane decreases, making the membrane surface more hydrophilic. Furthermore, both the IEC and water uptake rate of the membranes show an increasing trend with the rise in VBC content. At 10% VBC, both the IEC and water uptake rate are the lowest, at 0.93 mmol‧g−1 and 10.75%, respectively; while at 20% VBC, they are the highest, at 1.17 mmol‧g−1 and 14.10%, respectively. The surface resistance of the membrane decreases continuously with the increase in VBC content, with the highest surface resistance at 10% VBC with 0.36 Ω·cm², and the lowest at 20% VBC with 0.12 Ω·cm².
Table 5.
The membrane performance parameters with different VBC contents.
3.3. Electrodialysis Experiments
3.3.1. Impact of Curing Time on Desalination Performance
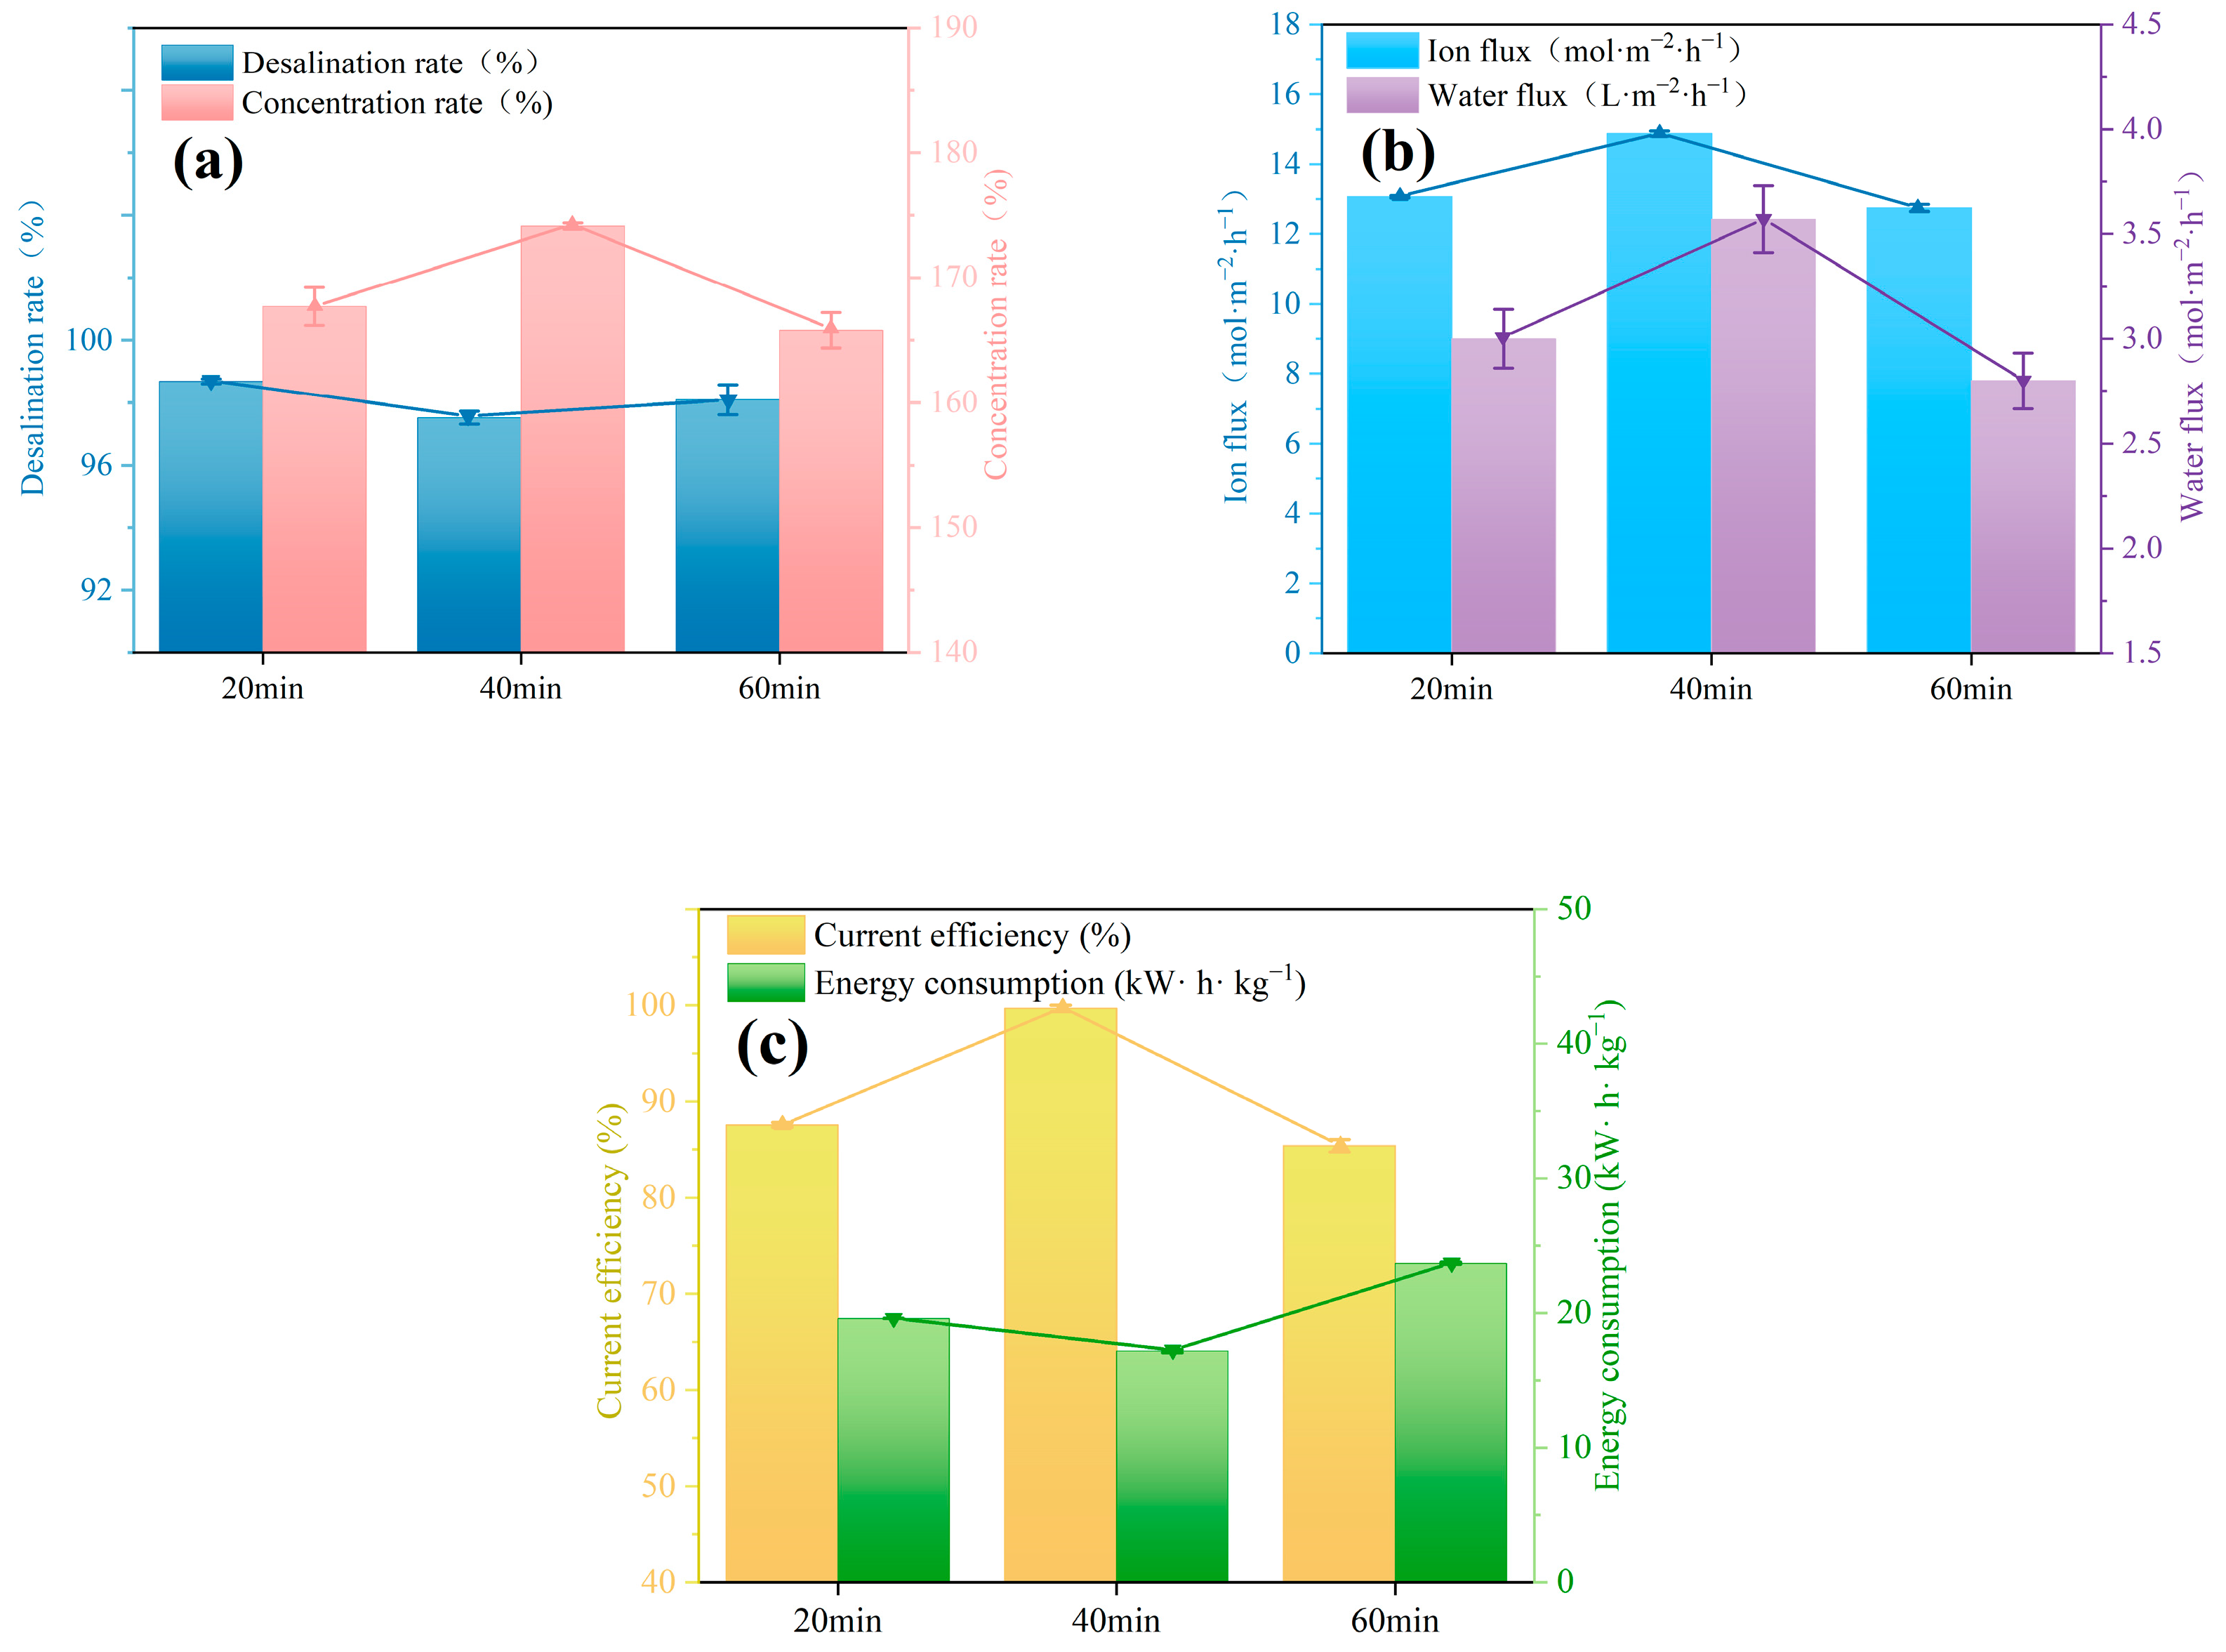
After completing the characterization and basic performance testing, the membranes were used in ED experiments with a 0.5 M NaCl solution to evaluate their practical application performance. In the ED tests, ion migration was dominated by electromigration, with anions moving across the membrane under an electric field, thereby increasing the salt concentration in the concentrate chamber and reducing it in the diluate chamber [31]. As shown in Figure 8a, it can be seen that membranes of all curing times exhibited good desalination performance, with the desalination rate in the dilute chamber between 97.5% and 98.7%. On the other hand, the change in the salt concentration rate was more noticeable. With the increase in curing time, the salt concentration rate peaked at 40 min, with a rate of 174.1%. To understand the water–salt transport mechanism during the ED process of the DLP 3D printed membranes, further analysis of the ion flux and water flux during this process is needed.
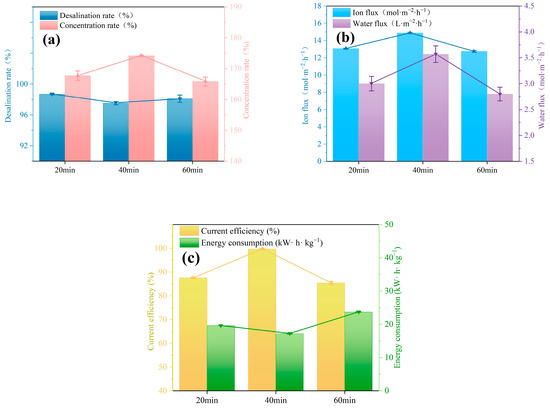
Figure 8.
Effect of curing time on desalination performance of membrane: (a) Trend of desalination rate and concentration rate with curing time; (b) Trend of ion flux and water flux with curing time; and (c) Trend of current efficiency and energy consumption with curing time.
Figure 8b shows the trends of ion flux and water flux during electrodialysis as a function of membrane curing time. The overall low water uptake rate of the DLP 3D membranes means that their fixed ion concentration is primarily limited by the IEC, resulting in the ion flux following the same trend as the IEC. As the curing time increases, the ion flux of the membrane first rises and then falls, peaking at 40 min with 14.9 mol·m−2·h−1. Simultaneously, the water flux of membranes prepared at different curing times also shows a trend of first rising and then dropping, peaking at 40 min with 3.6 L·m−2·h−1. The membrane’s water flux is determined by both the osmotic water flux and the electroosmotic water flux. The osmotic water flux is related to the concentration difference between the concentrate and dilute chambers and is proportional to the membrane’s water uptake rate, while the electroosmotic water flux is proportional to the ion flux. Combined with the basic performance testing of the membrane, these factors together cause this trend in water flux.
In this experiment, both osmotic and electroosmotic water fluxes migrate from the dilute chamber to the concentrate chamber. However, the different formation mechanisms of the osmotic and electroosmotic water flux result in an increased relative proportion of electroosmotic water flux, which is more favorable for raising the salt concentration in the concentrate chamber. Therefore, when there is little difference in the membrane’s osmotic water flux, the membrane’s ion flux affects the relative proportion of the electroosmotic water flux, thereby dominating the efficiency of salt concentration. At a curing time of 40 min, the membrane’s electroosmotic water flux led to an increase in the total water flux, achieving the highest salt concentration rate.
Figure 8c shows the trends in current efficiency and energy consumption with curing time. Comparing the current efficiency and energy consumption among different membranes helps to assess their economic feasibility. Current efficiency refers to the utilization rate of electricity during electrodialysis, and since the electric current remains constant and only one type of solution (NaCl) is used in the experiment, the current efficiency is determined by the mole number of ions transferred over a period. Energy consumption is generated by overcoming the concentration potential difference between the concentrate and dilute chambers, as well as the ohmic resistance of ion migration through the membrane and solution, with most of the energy consumption used to overcome the voltage drop of ohmic resistance. According to Figure 8c, as curing time increases, the membrane’s current efficiency first rises and then falls. Previous tests on membrane performance indicated that as curing time increases, membrane surface resistance first decreases and then rises. A better conductivity of the membrane results in a lower energy consumption and a higher current efficiency during the ED process. Therefore, at a curing time of 40 min, when the membrane surface resistance is at its lowest, the membrane has the highest current efficiency (99.7%) and the lowest energy consumption (17.2 kW·h·kg−1). Overall, the membrane’s current efficiency is above 85%, indicating good economic feasibility for DLP 3D printed membranes.
In conclusion, the optimal curing time of the DLP 3D printed membranes under the conditions of this experiment is 40 min. The optimal curing time for the casting solution may vary under different circumstances, therefore it is necessary to find the appropriate curing time based on different casting solution formulas and experimental conditions.
3.3.2. Impact of the Number of Printed Layers on Desalination Performance
In this section, the impact of the number of printed layers on the desalination performance of membranes was determined. As shown in Figure S5a, as the number of printed layers increases from single to double, both the salt concentration rate and removal rate of electrodialysis slightly rise, from 98.7% to 98.8%, and from 167.7% to 168.9%, respectively. Further analysis of their ion flux and water flux is shown in Figure S5b. With the increase in the number of printed layers, the membrane’s ion flux rises from 13.1 mol·m−2·h−1 to 13.9 mol·m−2·h−1, and the water flux increases from 3.0 L·m−2·h−1 to 3.1 L·m−2·h−1. It is evident that compared to single-layer printing, double-layer printing results in a higher fixed ion concentration, greater ion flux, and better ion migration performance. The increase in ion flux and membrane water uptake also leads to an increase in water flux during double-layer printing. Previous analysis has shown that when the difference in osmotic water flux is negligible, the electroosmotic water flux caused by the ion flux dominates the salt concentration efficiency; therefore, the increased ion flux during double-layer printing raises the salt concentration rate. Figure S5c analyzes the current efficiency and energy consumption of membranes made with different numbers of printed layers. With double-layer printing, both the membrane surface resistance and water permeability are lower than with single-layer printing. As the number of printed layers increases, the current efficiency rises from 87.6% to 93.0%, and the energy consumption decreases from 19.6 kW·h·kg−1 to 18.6 kW·h·kg−1, making double-layer printed membranes more economically feasible than single-layer printed membranes. In conclusion, increasing the number of printed layers can improve the overall performance of the membrane.
3.3.3. Impact of the PEGDA Molecular Weight on Desalination Performance
Figure S6 illustrates the impact of different PEGDA molecular weights on the desalination performance of the membranes. As shown in Figure S6a, the salt removal rate and concentration rate in the ED process exhibit a trend of initially declining and then increasing as the PEGDA molecular weight increases, with corresponding salt removal rates and concentration rates of 99.0%, 98.1%, 98.4% and 167.3%, 165.8%, 165.9% for PEGDA-200, PEGDA-400, and PEGDA-700, respectively. The membrane made from PEGDA-200 shows the strongest ion separation and enrichment capabilities. From Figure S6b, it can be seen that at PEGDA-400, the membrane has the lowest fixed ion concentration and the poorest ion migration performance, with an ion flux of 12.7 mol·m−2·h−1. In contrast, at PEGDA-700, the membrane has the highest fixed ion concentration and the best ion migration performance, with an ion flux of 13.8 mol·m−2·h−1. At PEGDA-400, the poor ion migration performance restricts the transfer of ions from the dilute chamber to the concentrate chamber; therefore, even with the smallest water flux, both its desalination and concentration rates are at their lowest. At PEGDA-700, while the membrane shows the best ion migration performance, the relative increase in the proportion of osmotic water flux due to the membrane’s water uptake means its concentration rate is lower than that of PEGDA-200. Figure S6c shows the trends in current efficiency and energy consumption as a function of the PEGDA molecular weight. At PEGDA-400, the membrane has the highest surface resistance, resulting in the highest energy consumption (23.7 kW·h·kg−1) and the lowest current efficiency (85.4%) during electrodialysis. At PEGDA-700, the membrane has the lowest surface resistance, the lowest energy consumption (18.8 kW·h·kg−1), and the highest current efficiency (92.5%). Overall, membranes made from PEGDA-400 exhibit inferior desalination performance compared to those made from the other two molecular weights, while PEGDA-200 and PEGDA-700 each have their own advantages and disadvantages in terms of desalination capabilities and economic efficiency.
3.3.4. Impact of the VBC Content on Desalination Performance
Figure S7 demonstrates the impact of different VBC contents on the desalination performance of membranes. As shown in Figure S7a, as the VBC content increases, the desalination rate rises from 97.5% to 98.7%, while the concentration rate decreases from 165.9% to 165.0%. Figure S7b analyzes the effects of different VBC contents on ion flux and water flux. With the increase in VBC content, the membrane’s fixed ion concentration also rises, and its ion flux increases from 12.3 mol·m−2·h−1 to 13.4 mol·m−2·h−1. The increase in ion flux leads to a rise in electroosmotic water flux, and as the water uptake rate increases, the osmotic water flux also shows an upward trend, with the total water flux increasing from 2.7 L·m−2·h−1 to 3.0 L·m−2·h−1. However, the increase in water permeability offsets the positive effects brought by the increase in ion flux, leading to a decreasing trend in the concentration rate as the VBC content increases, showing the best concentration performance at a VBC content of 10%. Further analysis through Figure S7c examines the impact of VBC content on current efficiency and energy consumption. It can be observed that as the VBC content increases, the energy consumption continuously decreases under the effect of membrane surface resistance, thus leading to the current efficiency increasing. At a VBC content of 20%, the membrane shows the best economic feasibility.
3.3.5. Impact of the Current Density on Desalination Performance
Figure S8 demonstrates the impact of different current densities on the desalination performance of membranes. As shown in Figure S8a, with the increase in current density, the desalination rate decreases from 99.8% to 98.1%, while the concentration rate increases from 161.8% to 165.8%. According to Figure S8b, when the current density increases from 200 A·m−2 to 400 A·m−2, both the ion flux and water flux during the ED process are enhanced. Previous studies have mentioned a good linear relationship between ion flux and current density, a similar phenomenon that is also observed in this experiment [32,33]. Ion flux is driven by the electric potential gradient; therefore, it increases from 6.5 mol·m−2·h−1 to 12.7 mol·m−2·h−1 as the current density increases. The increase in ion flux results in an increase in electroosmotic water flux, which in turn leads to a total water flux increase from 1.7 L·m−2·h−1 to 2.8 L·m−2·h−1. In this section, at a current density of 400 A·m−2, the rise in membrane ion flux increases the relative proportion of electroosmotic water flux, thereby enhancing the salt concentration rate. From Figure S8c, the trends in current efficiency and energy consumption reveal that despite the increase in current density having a better enrichment effect, it also causes an increase in energy consumption and a decrease in current efficiency, thus sacrificing the economic viability. Therefore, it is necessary to adjust the current density according to the actual conditions.
3.4. Ion Selectivity under Various Current Density
The parameters of the DLP 3D printed membrane used in this section are: PEGDA-400, 15% VBC, a curing time of 1 h, and a printing layer of 50 μm × 1 layer. The initial solution in the dilute chamber was a mixture of 0.1 M Na2SO4 and 0.1 M NaCl, and the concentrate chamber contained 0.1 M NaCl. The DLP 3D printed membrane was applied to the separation of monovalent and divalent ions (Cl− and SO42−) under a current density of 100 A·m−2 to explore the Cl−/SO42− ion selectivity of the DLP 3D printed membrane, as shown in Figure 9. Under the influence of an external electric field, Cl− and SO42− migrated from the dilute chamber toward the concentrate chamber and selectively passed through the membrane to achieve separation.
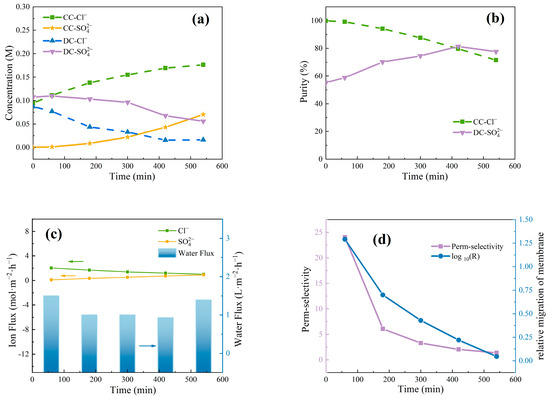
Figure 9.
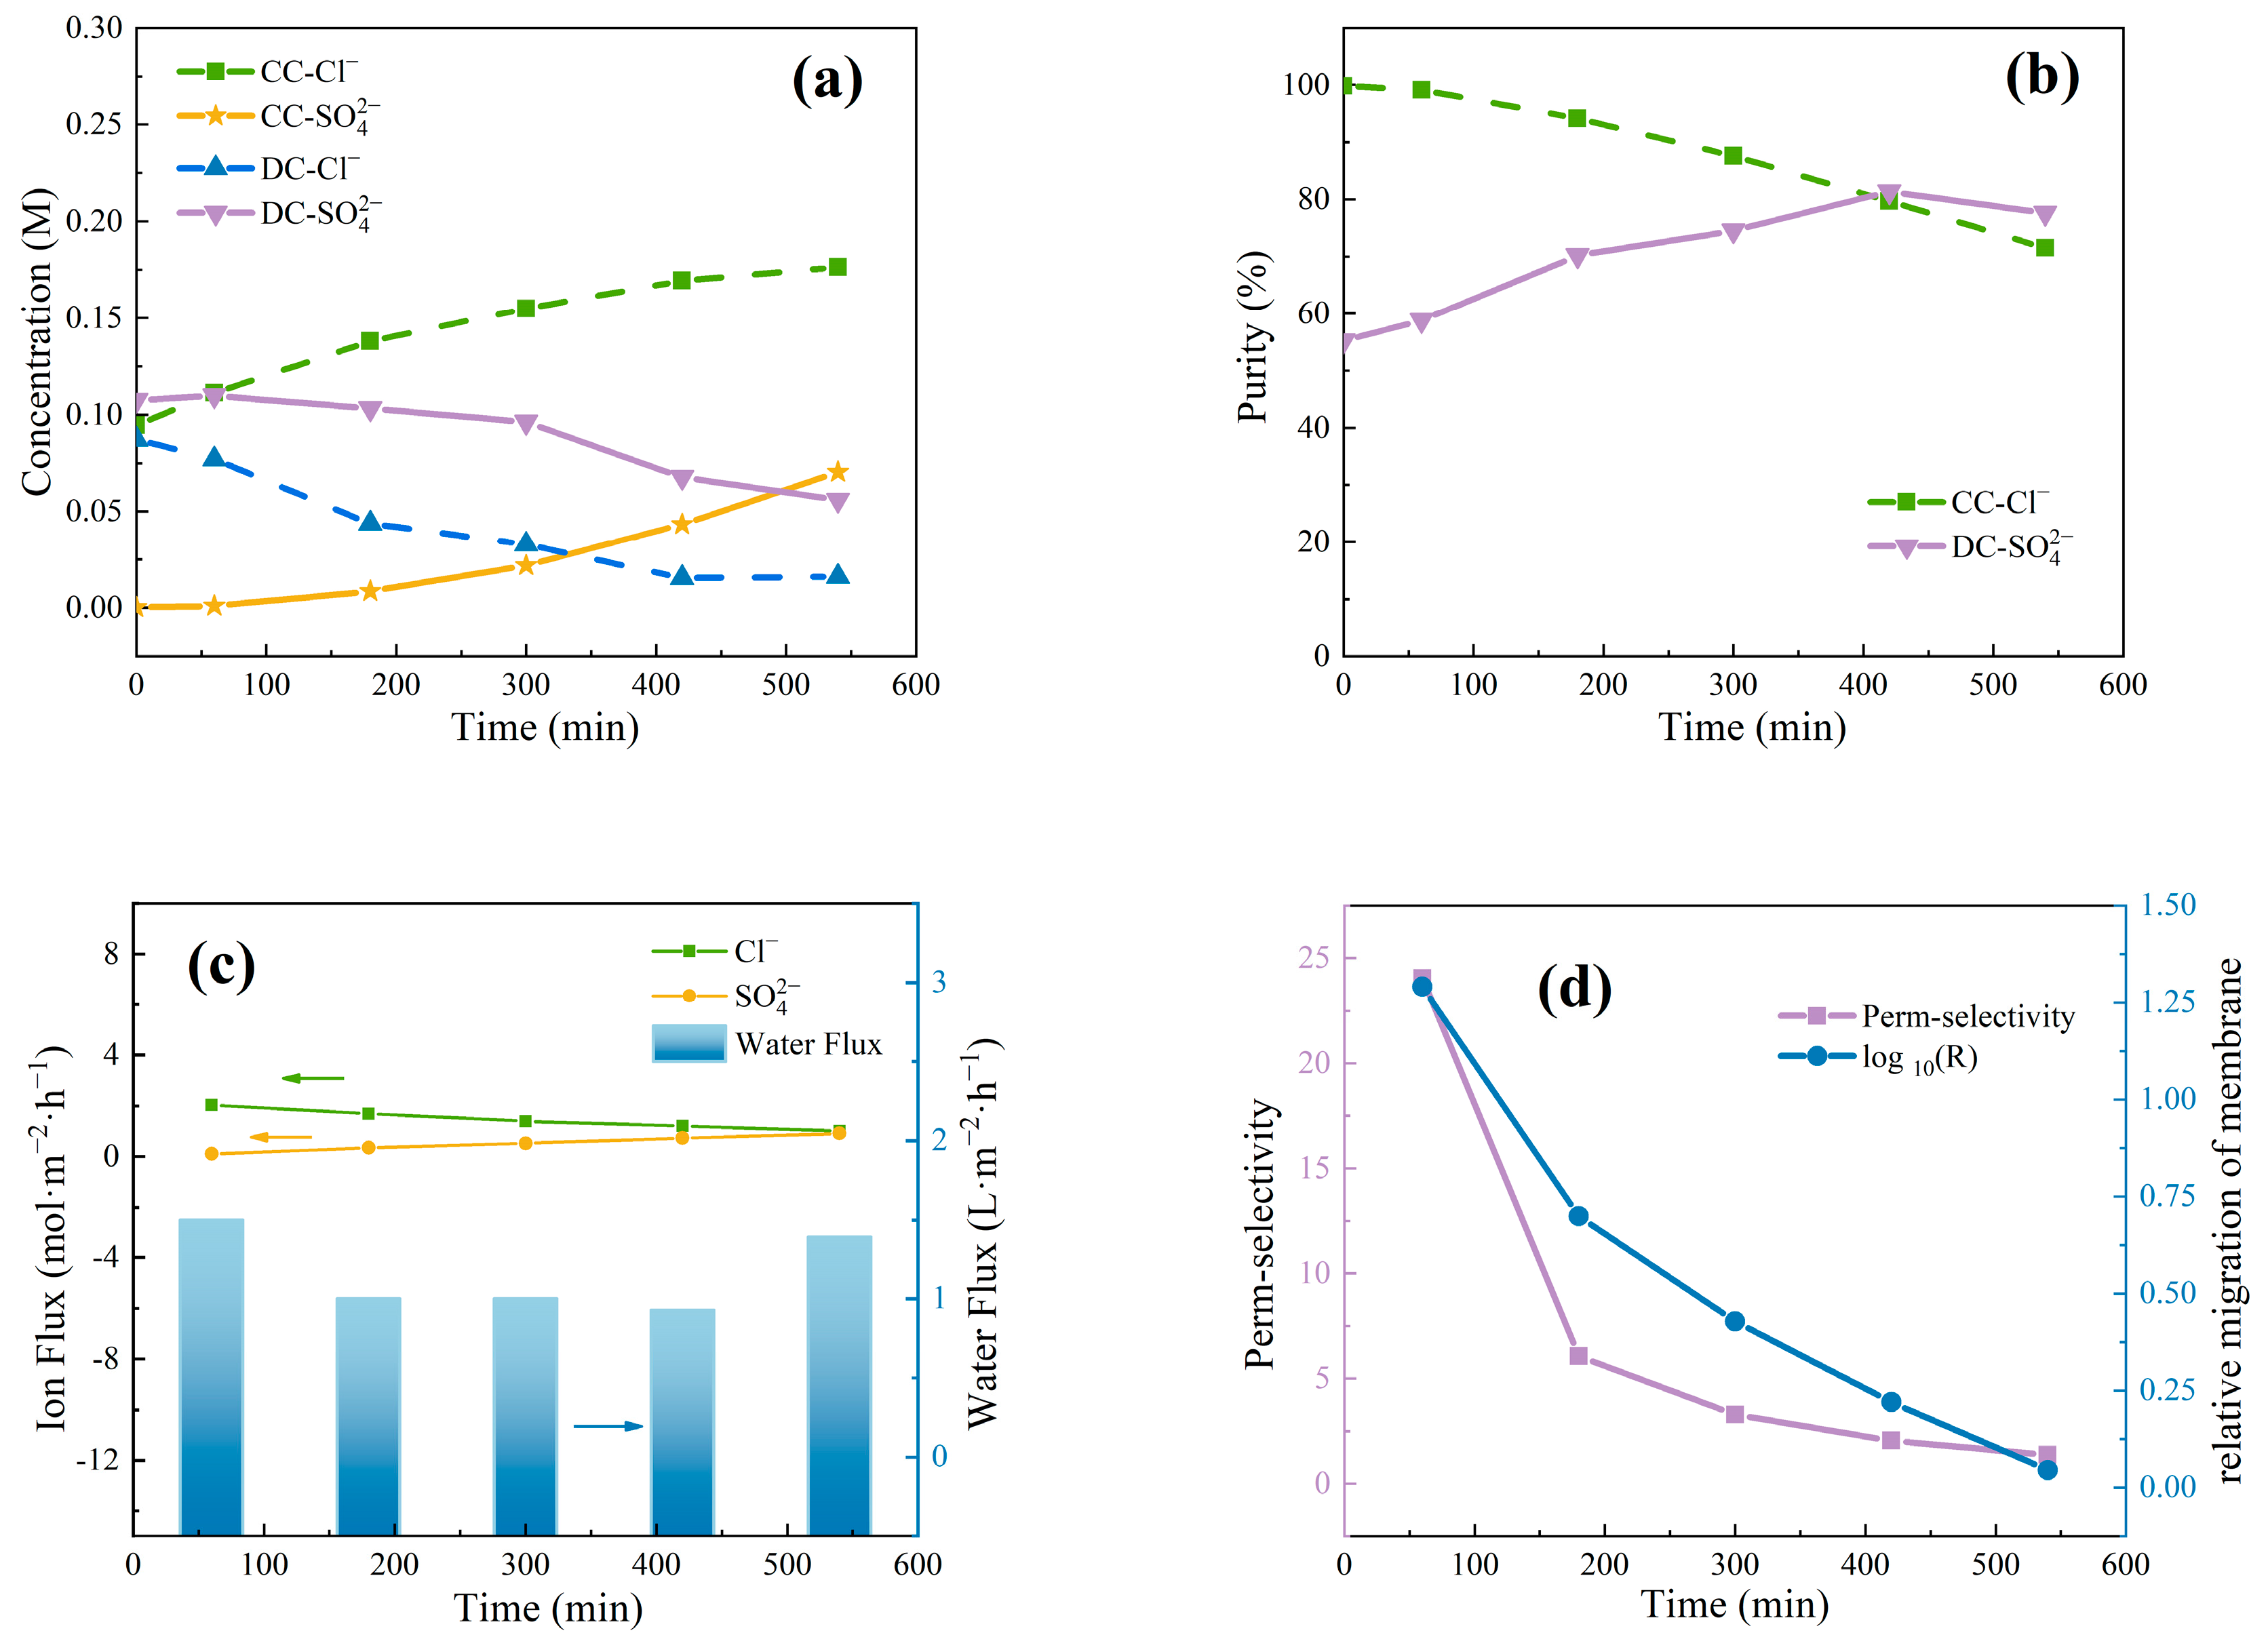
DLP 3D printed membrane for selective separation of monovalent anions: (a) Variation of salt concentration with time; (b) Variation of salt purity with time; (c) Variation of ion flux and water flux with time; and (d) The Cl−/SO42− anions perm-selectivity and relative migration of membrane with time.
The higher hydration energy of SO42− (−1000 kJ·mol−1) compared to Cl− (−337 kJ·mol−1 means that as the membrane’s hydrophobicity increases, Cl− is more likely to dehydrate or rearrange its hydration shell under the force of the electric field, thereby diffusing through the membrane pores, while SO42− is left behind [34,35,36]. The water uptake rate of the DLP 3D printed membrane fabricated in this study ranges from 10.75% to 15.14% and has a relatively dense structure. The lower water uptake rate facilitates an easier migration of Cl− into the narrow ion channels and it occupies the channels, thus inhibiting the migration of SO42−, increasing the membrane’s separation capability for Cl− and SO42−.
As shown in Figure 9a, the concentration of Cl− and SO42− in the dilute chamber decreased over time along the electric potential gradient toward the concentrate chamber, while the opposite trend was found in the concentrate chamber. In the dilute chamber, the decrease in Cl− concentration was more pronounced than that of SO42−, indicating that the DLP 3D printed membrane has better selective permeability for Cl−. The purity of Cl− in the concentrate chamber and SO42− in the dilute chamber were calculated based on the amount of substance. As shown in Figure 9b, even though the membrane showed higher selectivity for Cl− over SO42−, SO42− also migrated to the concentrate chamber at a relatively slow rate during the electrodialysis experiment, continuously decreasing the purity of the Cl− in the concentrate chamber to 71.5%. The purity of SO42− in the dilute chamber initially increased and reached 81.4% at 420 min before it starting to decline.
To analyze the specific mass transfer mechanisms during the experiment, further analysis of ion flux and water flux during the separation process is required. As shown in Figure 9c, as time progresses, the ion flux of Cl− shows a decreasing trend, while the ion flux of SO42− continually rises. This is due to the faster decrease in Cl− concentration compared to SO42− in the dilute chamber, causing a continuous decrease in the molar ratio of Cl−/SO42−. As the concentration of Cl− decreases, its competitive ability also declines. This also leads to the purity of SO42− in the dilute chamber reaching its maximum at 420 min before starting to decline. Overall, the ion flux of Cl− is greater than that of SO42−, indicating that the DLP 3D printed membrane has better transport capability for Cl−. The water flux during the ED process initially decreases and then increases due to Cl− being the dominant ion carrying water molecules during electromigration. On the other hand, the continuous decrease in its ion flux causes a decline in water transport, while the increase in SO42− ion flux further drives water movement. As shown in Figure 9d, analyzing the membrane’s relative migration amount shows that decreases from an initial 1.3 to 0.05 by the end of the experiment, indicating that the membrane consistently exhibits positive selectivity for Cl−/SO42− throughout the experiment. Further calculation of the ion selectivity coefficient of the DLP 3D printed membrane analyzes the trend of the membrane’s Cl−/SO42− ion selectivity capability over time. Initially, the DLP 3D printed membrane exhibits an excellent Cl−/SO42− selectivity of 24.0. However, as time progresses, the ion flux ratio of Cl−/SO42− continually decreases, and the membrane’s ion selectivity also declines, but it still maintains a Cl−/SO42− ion selectivity coefficient of 1.4 at the end of the experiment (540 min). In summary, the DLP 3D printed membrane exhibits remarkable Cl−/SO42− separation capability, distinguishing this work from the common preparation process of monovalent selective IEMs such as by adding modification layers, and proposes an overall synthesis strategy.
4. Conclusions
This study utilized DLP 3D printing technology and quaternization processes to fabricate dense AEMs, which were applied for electrodialysis and selective separation of Cl− and SO42− ions. It was found that increasing the curing time enhanced the membrane’s pore density and reduced the surface roughness, with 40 min identified as the optimal curing time. At this duration, the membranes demonstrated excellent desalination rates (97.5–98.7%) and concentration rates (165.8–174.1%). In addition, increasing the number of printed layers improved the overall polymerization and performance of the membranes, with double-layer printing exhibiting superior ion and water flux. The molecular weight of the PEGDA significantly impacted the membrane performance. Membranes with PEGDA-400 displayed the most compact pore structure but showed poorer ion transport performance, whereas those with PEGDA-700 exhibited better ion transport capabilities and desalination efficiency. The impacts of the VBC content were also investigated and it was found that increasing the VBC content enhanced the concentration of quaternary ammonium groups and conductivity of the membranes, thereby improving ED performance. Finally, increasing the current density enhanced the water–salt separation efficiency of the membranes but also led to higher energy consumption. Under specific conditions, the DLP 3D printed membranes demonstrated superior selectivity for Cl−/SO42− ions. This research provides robust technical support for the design and application of efficient IEMs, demonstrating the benefits of integrating advanced manufacturing techniques like DLP 3D printing in the development of functional membrane technologies.
Supplementary Materials
The following supporting information can be downloaded at: https://www.mdpi.com/article/10.3390/pr12061043/s1, Figure S1: XPS and FTIR of DLP 3D printed membranes with different curing times; (a) N1s spectra analysis; (b) XPS; (c) Proportion of different elements; and (d) FTIR.; Figure S2. XPS and FTIR of DLP 3D printed membranes with different printing layers: (a) XPS; (b) Proportion of different elements; and (c) FTIR.; Figure S3. XPS and FTIR of DLP 3D printed membranes with different PEGDA molecular weight: (a) XPS; (b) Proportion of different elements; and (c) FTIR.; Figure S4. XPS and FTIR of DLP 3D printed membranes with different VBC content: (a) XPS; (b) Proportion of different elements; and (c) FTIR.; Figure S5. Effect of the number of printing layer on desalination performance of membrane: (a) Trend of desalination rate and concentration rate with the number of printing layer; (b) Trend of ion flux and water flux with the number of printing layer; and (c) Trend of current efficiency and energy consumption with the number of printing layer.; Figure S6. Effect of PEGDA molecular weight on desalination performance of membrane: (a) Trend of desalination rate and concentration rate with PEGDA molecular weights; (b) Trend of ion flux and water flux with PEGDA molecular weights; and (c) Trend of current efficiency and energy consumption with PEGDA molecular weights.; Figure S7. Effect of the VBC content on desalination performance of membrane: (a) Trend of desalination rate and concentration rate with VBC content; (b) Trend of ion flux and water flux with VBC content; and (c) Trend of current efficiency and energy consumption with VBC content.; Figure S8. Effect of the current density on desalination performance of membrane: (a) Trend of desalination rate and concentration rate with current density; (b) Trend of ion flux and water flux with current density; and (c) Trend of current efficiency and energy consumption with current density.
Author Contributions
Conceptualization, Y.Z. and X.Y.; methodology, X.Y., H.Y. and X.L.; software, X.Y.; validation, X.Y. and X.Z. (Xin Zhang); formal analysis, X.Y. and X.Z. (Xin Zhang); investigation, X.Y., H.Y. and X.L.; resources, Y.Z.; data curation, X.Y. and X.Z. (Xin Zhang); writing—original draft preparation, X.Y. and X.Z. (Xin Zhang); writing—review and editing, X.Z. (Xin Zhang) and Y.Z.; visualization, X.Y.; supervision, V.J., X.Z. (Xiaobin Zhou) and Y.Z.; project administration, Y.Z.; funding acquisition, Y.Z. All authors have read and agreed to the published version of the manuscript.
Funding
This research was funded by the National Key R&D Program, grant number 2022YFB3805104.
Data Availability Statement
The data presented in this study are available on request from the corresponding author due to copyright.
Acknowledgments
The authors would like to acknowledge the financial support of the National Key R&D Program (2022YFB3805104) and Provincial Youth Innovative Research Team of Universities, Shandong Department of Education.
Conflicts of Interest
Author Xiaobin Zhou was employed by the company Qingdao Breuck 3D Manufacturing Co., Ltd., Qingdao, China. The remaining authors declare that the research was conducted in the absence of any commercial or financial relationships that could be construed as a potential conflict of interest.
References
- Ran, J.; Wu, L.; He, Y.; Yang, Z.; Wang, Y.; Jiang, C.; Ge, L.; Bakangura, E.; Xu, T. Ion Exchange Membranes: New Developments and Applications. J. Membr. Sci. 2017, 522, 267–291. [Google Scholar] [CrossRef]
- Zha, Y.; Disabb-Miller, M.L.; Johnson, Z.D.; Hickner, M.A.; Tew, G.N. Metal-Cation-Based Anion Exchange Membranes. J. Am. Chem. Soc. 2012, 134, 4493–4496. [Google Scholar] [CrossRef]
- Goh, P.S.; Ismail, A.F. Flat-Sheet Membrane for Power Generation and Desalination Based on Salinity Gradient. In Membrane-Based Salinity Gradient Processes for Water Treatment and Power Generation; Elsevier: Amsterdam, The Netherlands, 2018; pp. 155–174. ISBN 978-0-444-63961-5. [Google Scholar]
- Gurreri, L.; Tamburini, A.; Cipollina, A.; Micale, G. Electrodialysis Applications in Wastewater Treatment for Environmental Protection and Resources Recovery: A Systematic Review on Progress and Perspectives. Membranes 2020, 10, 146. [Google Scholar] [CrossRef] [PubMed]
- Strathmann, H. Electrodialysis, a Mature Technology with a Multitude of New Applications. Desalination 2010, 264, 268–288. [Google Scholar] [CrossRef]
- Al-Amshawee, S.; Yunus, M.Y.B.M.; Azoddein, A.A.M.; Hassell, D.G.; Dakhil, I.H.; Hasan, H.A. Electrodialysis Desalination for Water and Wastewater: A Review. Chem. Eng. J. 2020, 380, 122231. [Google Scholar] [CrossRef]
- Zhang, Y.; Paepen, S.; Pinoy, L.; Meesschaert, B.; Van Der Bruggen, B. Selectrodialysis: Fractionation of Divalent Ions from Monovalent Ions in a Novel Electrodialysis Stack. Sep. Purif. Technol. 2012, 88, 191–201. [Google Scholar] [CrossRef]
- Folaranmi, G.; Bechelany, M.; Sistat, P.; Cretin, M.; Zaviska, F. Towards Electrochemical Water Desalination Techniques: A Review on Capacitive Deionization, Membrane Capacitive Deionization and Flow Capacitive Deionization. Membranes 2020, 10, 96. [Google Scholar] [CrossRef]
- Miesiac, I.; Rukowicz, B. Bipolar Membrane and Water Splitting in Electrodialysis. Electrocatalysis 2022, 13, 101–107. [Google Scholar] [CrossRef]
- Cheng, C.; Shen, H.Y.; Gong, Y.; Chen, W.; Li, P. Auxiliary Functional Group Diffusion Dialysis Membranes for Acid Recovery. J. Polym. Sci. 2022, 60, 3043–3053. [Google Scholar] [CrossRef]
- Moreno, J.; Grasman, S.; Van Engelen, R.; Nijmeijer, K. Upscaling Reverse Electrodialysis. Environ. Sci. Technol. 2018, 52, 10856–10863. [Google Scholar] [CrossRef]
- Velizarov, S.; Reis, M.A.; Crespo, J.G. Integrated Transport and Reaction in an Ion Exchange Membrane Bioreactor. Desalination 2002, 149, 205–210. [Google Scholar] [CrossRef]
- Blagojevic, N.; Müller, M. Simulation of Membrane Fabrication via Solvent Evaporation and Nonsolvent-Induced Phase Separation. ACS Appl. Mater. Interfaces 2023, 15, 57913–57927. [Google Scholar] [CrossRef]
- Getachew, B.A.; Kim, S.-R.; Kim, J.-H. Improved Stability of Self-Healing Hydrogel Pore-Filled Membranes with Ionic Cross-Links. J. Membr. Sci. 2018, 553, 1–9. [Google Scholar] [CrossRef]
- Adamczak, M.; Kamińska, G.; Bohdziewicz, J. Preparation of Polymer Membranes by In Situ Interfacial Polymerization. Int. J. Polym. Sci. 2019, 2019, 1–13. [Google Scholar] [CrossRef]
- Seo, J.; Kushner, D.I.; Hickner, M.A. 3D Printing of Micropatterned Anion Exchange Membranes. ACS Appl. Mater. Interfaces 2016, 8, 16656–16663. [Google Scholar] [CrossRef] [PubMed]
- Zárybnická, L.; Stránská, E.; Janegová, K.; Vydrová, B. The Effect of 3D Printing Parameters on Electrochemical Properties of Heterogeneous Cation Exchange Membrane. RPJ 2021, 27, 1538–1547. [Google Scholar] [CrossRef]
- Capparelli, C.; Fernandez Pulido, C.R.; Wiencek, R.A.; Hickner, M.A. Resistance and Permselectivity of 3D-Printed Micropatterned Anion-Exchange Membranes. ACS Appl. Mater. Interfaces 2019, 11, 26298–26306. [Google Scholar] [CrossRef]
- Zhang, Y.; Liu, L.; Shi, Y.; He, S. Method for Preparing Organic Separating Membrane through Three-Dimensional Molding Technology 2016. CN105643931A, 6 August 2016. [Google Scholar]
- Soo, A.; Ali, S.M.; Shon, H.K. 3D Printing for Membrane Desalination: Challenges and Future Prospects. Desalination 2021, 520, 115366. [Google Scholar] [CrossRef]
- Ligon, S.C.; Liska, R.; Stampfl, J.; Gurr, M.; Mülhaupt, R. Polymers for 3D Printing and Customized Additive Manufacturing. Chem. Rev. 2017, 117, 10212–10290. [Google Scholar] [CrossRef] [PubMed]
- Thiam, B.G.; El Magri, A.; Vanaei, H.R.; Vaudreuil, S. 3D Printed and Conventional Membranes—A Review. Polymers 2022, 14, 1023. [Google Scholar] [CrossRef] [PubMed]
- Tijing, L.D.; Dizon, J.R.C.; Ibrahim, I.; Nisay, A.R.N.; Shon, H.K.; Advincula, R.C. 3D Printing for Membrane Separation, Desalination and Water Treatment. Appl. Mater. Today 2020, 18, 100486. [Google Scholar] [CrossRef]
- Ayrilmis, N.; Kariz, M.; Kwon, J.H.; Kitek Kuzman, M. Effect of Printing Layer Thickness on Water Absorption and Mechanical Properties of 3D-Printed Wood/PLA Composite Materials. Int. J. Adv. Manuf. Technol. 2019, 102, 2195–2200. [Google Scholar] [CrossRef]
- Yuan, S.; Strobbe, D.; Kruth, J.-P.; Van Puyvelde, P.; Van Der Bruggen, B. Super-Hydrophobic 3D Printed Polysulfone Membranes with a Switchable Wettability by Self-Assembled Candle Soot for Efficient Gravity-Driven Oil/Water Separation. J. Mater. Chem. A 2017, 5, 25401–25409. [Google Scholar] [CrossRef]
- Ponomar, M.; Krasnyuk, E.; Butylskii, D.; Nikonenko, V.; Wang, Y.; Jiang, C.; Xu, T.; Pismenskaya, N. Sessile Drop Method: Critical Analysis and Optimization for Measuring the Contact Angle of an Ion-Exchange Membrane Surface. Membranes 2022, 12, 765. [Google Scholar] [CrossRef] [PubMed]
- Mikhaylin, S.; Bazinet, L. Fouling on Ion-Exchange Membranes: Classification, Characterization and Strategies of Prevention and Control. Adv. Colloid Interface Sci. 2016, 229, 34–56. [Google Scholar] [CrossRef]
- Cavallo, A.; Madaghiele, M.; Masullo, U.; Lionetto, M.G.; Sannino, A. Photo-Crosslinked Poly(Ethylene Glycol) Diacrylate (PEGDA) Hydrogels from Low Molecular Weight Prepolymer: Swelling and Permeation Studies. J. Appl. Polym. Sci. 2017, 134, app.44380. [Google Scholar] [CrossRef]
- S Grewal, M.; Ishibashi, K.; Hara, M.; Ishizaki, Y.; Nagano, S.; Yabu, H. Effect of the Poly(Ethylene Glycol) Diacrylate (PEGDA) Molecular Weight on Ionic Conductivities in Solvent-Free Photo-Cross-Linked Solid Polymer Electrolytes. Langmuir 2023, 39, 10209–10215. [Google Scholar] [CrossRef]
- O’Donnell, K.; Boyd, A.; Meenan, B.J. Controlling Fluid Diffusion and Release through Mixed-Molecular-Weight Poly(Ethylene) Glycol Diacrylate (PEGDA) Hydrogels. Materials 2019, 12, 3381. [Google Scholar] [CrossRef]
- Khan, M.; Luque, R.; Akhtar, S.; Shaheen, A.; Mehmood, A.; Idress, S.; Buzdar, S.; Ur Rehman, A. Design of Anion Exchange Membranes and Electrodialysis Studies for Water Desalination. Materials 2016, 9, 365. [Google Scholar] [CrossRef]
- Borges, F.J.; Roux-de Balmann, H.; Guardani, R. Investigation of the Mass Transfer Processes during the Desalination of Water Containing Phenol and Sodium Chloride by Electrodialysis. J. Membr. Sci. 2008, 325, 130–138. [Google Scholar] [CrossRef]
- Vanoppen, M.; Bakelants, A.F.A.M.; Gaublomme, D.; Schoutteten, K.V.K.M.; Bussche, J.V.; Vanhaecke, L.; Verliefde, A.R.D. Properties Governing the Transport of Trace Organic Contaminants through Ion-Exchange Membranes. Environ. Sci. Technol. 2015, 49, 489–497. [Google Scholar] [CrossRef] [PubMed]
- Liao, J.; Chen, Q.; Pan, N.; Yu, X.; Gao, X.; Shen, J.; Gao, C. Amphoteric Blend Ion-Exchange Membranes for Separating Monovalent and Bivalent Anions in Electrodialysis. Sep. Purif. Technol. 2020, 242, 116793. [Google Scholar] [CrossRef]
- Sata, T.; Tagami, Y.; Matsusaki, K. Transport Properties of Anion-Exchange Membranes Having a Hydrophobic Layer on Their Surface in Electrodialysis. J. Phys. Chem. B 1998, 102, 8473–8479. [Google Scholar] [CrossRef]
- Tansel, B.; Sager, J.; Rector, T.; Garland, J.; Strayer, R.F.; Levine, L.; Roberts, M.; Hummerick, M.; Bauer, J. Significance of Hydrated Radius and Hydration Shells on Ionic Permeability during Nanofiltration in Dead End and Cross Flow Modes. Sep. Purif. Technol. 2006, 51, 40–47. [Google Scholar] [CrossRef]


Disclaimer/Publisher’s Note: The statements, opinions and data contained in all publications are solely those of the individual author(s) and contributor(s) and not of MDPI and/or the editor(s). MDPI and/or the editor(s) disclaim responsibility for any injury to people or property resulting from any ideas, methods, instructions or products referred to in the content. |
© 2024 by the authors. Licensee MDPI, Basel, Switzerland. This article is an open access article distributed under the terms and conditions of the Creative Commons Attribution (CC BY) license (https://creativecommons.org/licenses/by/4.0/).