Article

Performance Analysis and Optimization of Sub-Atmospheric Purging through Microcapillaries in an ICF Cryogenic Target

Institute of Refrigeration and Cryogenic Engineering, Xi’an Jiaotong University, Xi’an 710049, China
*
Author to whom correspondence should be addressed.
Processes 2024, 12(6), 1050; https://doi.org/10.3390/pr12061050
Submission received: 11 April 2024 / Revised: 6 May 2024 / Accepted: 6 May 2024 / Published: 21 May 2024
(This article belongs to the Section Energy Systems)

Abstract

:
In inertial confinement fusion, the sub-atmospheric purging through microcapillaries is of great importance to the high gas purity inside the cryogenic target and the low failure rate of experiments. In this study, a non-continuous flow model is developed for this sub-atmospheric purging process and verified through National Ignition Facility experiments to study the evolution of parameters such as pressure and gas composition that are not possible to measure directly. The effects of microcapillary structures and sizes on the transient evacuation–filling behaviors are analyzed, and the periodic purging scheme is optimized. The results show that the extension of evacuation and filling time caused by the elongated microtube can be described as a linear function of microtube length or an exponential decay function of microtube diameter, and the change of the inner diameter has a more drastic effect. The conical-straight composite can effectively reduce the evacuation and filling time while meeting the thermal and mechanical requirements. The overall performance of the purging process exhibits a strong dependence on the cycle trough pressure. The total purging time firstly decreases and then increases with the increase in the trough pressure, and the optimal trough pressure falls at around 20% of the filling pressure where the evacuation and filling times are almost evenly balanced. These results can provide theoretical guidance for the selection of microtubes and the design of the filling–evacuating scheme in the experiments.

1. Introduction

Recently, Inertial Confinement Fusion (ICF) has gained increasing attention in many countries as an efficient and clean form of energy facing the global energy challenges and uncertainties [1,2,3,4]. It refers to confining the thermonuclear fuel of high temperature and high density inside a capsule by the inertia of the residual mass of the ablation to achieve thermonuclear fusion, as shown in Figure 1 [5,6].
The main components of the ICF cryogenic target are a spherical capsule containing fusion fuel and a hohlraum to provide a proper thermal environment for the capsule, both of which need to be filled with gas with precise compositional and density requirements [7,8]. As for the capsule, the non-hydrogen gas can result in ice plugging during cooldown to 18 K and deteriorate the icy fuel layer which is deficient for the successful ignition. For the hohlraum, the deposition of non-helium gas on the sealing films and walls presents a significant impedance to the ice layer characterization. In general, the non-hydrogen gas content inside the capsule should be lower than 205 ppm, and the non-helium gas content inside the hohlraum should be lower than 8250 ppm [9]. Currently, the impurity gases are mainly removed from the capsule and hohlraum by sub-atmospheric purging, i.e., evacuation and filling cycles, through microcapillaries that are only tens of microns in diameter [10,11,12,13]. Since the capsule and hohlraum volumes are too small to take measurements in situ, accurately predicting the flow characteristics inside the microtubes and the chambers is critical for the purging of the target.
One of the main difficulties in predicting gaseous transport in microgeometries is that the wall surface may behave as “slippery” due to the rarefied gas effect, and the continuum flow regime is no longer acceptable. The gas flow inside microchannels was studied analytically as well as numerically, and the numerical methods involved include but are not limited to the Direct Simulation Monte Carlo (DSMC) method [14,15,16], Lattice Boltzmann method [17,18,19], and CFD method (herein referring only to methods of extending the scope of Navier–Stokes equations with slip flow modifications) [14,15,16,20,21,22,23,24,25,26]. In view of the computational time and cost, researchers generally use the CFD method to model this slip flow problem, that is, solving the Navier–Stokes (N–S) and energy equations along with including the slip velocity and temperature jump at duct walls. In 2005, Suo et al. [20] established a two-dimensional compressible model based on the Navier–Stokes equation with slip velocity for rarefied gas in microchannels, and found that rarefaction has a greater impact on microchannel gas flow compared to gas compressibility under the calculated operating conditions. In 2007, Stevanovic [27] studied the compressible subsonic gas flow in a variable cross-section microtube to provide support for the design of the microtube. In 2015, Das and Tahmouresi [28] applied an integral transformation to calculate the pressure distribution of fully developed slip flow in an elliptical microtube. In 2017, Kurkin et al. [29] investigated the slip flow in the tube inlet section and gave an analytical formula for the Knudsen number between 0 and 1, which agreed well with the simulation results. Different slip boundary conditions were proposed. Croce and Rovenskaya [21,22] modeled a bent three-dimensional microchannel using N–S equations and a first-order slip boundary condition for walls, and reported that at high Kn and with the same channel length and pressure difference, the mass flow rate in a straight microchannel is smaller than the bent one. Dongari et al. [30] solved the N–S equation for slip flow in a long microtube using a second-order slip boundary, showing that the use of high-order slip boundary conditions improves the validity of the N–S equation for rarefied gas flow. Lockerby et al. [26] studied the numerical stabilities as geometry changes and the phenomenon of the velocity slip using Maxwell’s slip boundary condition. Struchtrup et al. and Choi et al. [23,24] used Maxwell’s boundary condition to study the effects of accommodation coefficients on slip phenomena. Myong [25] developed a slip boundary condition using Langmuir’s model, and carried out research on the slip phenomena and on the chemical reactions around the microscale objects. For flow past solid bodies, direct numerical simulation (DNS) [31] and large eddy simulations (LESs) [32] also show their capability in addition to the Navier–Stokes method based on Maxwell’s slip boundary conditions. However, Uncertainty Quantification (UQ) has been exploited with CFD simulation to evaluate input variable uncertainty [33].
However, much work has been devoted to single-species gas flows through various microchannels with different cross sections. Studies on the flow characteristics with respect to microcapillaries in ICF targets are still limited, and species transports in such microgeometries are seldomly involved. Bhandarkar et al. [34] presented a model for compressible gas flow, building on a set of well-known equations, and discussed its applicability to the evacuation and filling operations of the actual NIF targets. They performed experiments with helium and air for a range of pressures and temperatures to verify the model, and this work provided reliable experimental data for the later numerical study. Lin et al. [35] investigated the filling process of a planar cryotarget, and the results showed that a slower filling rate is helpful for the accurate measurement of the saturated vapor pressure of liquid hydrogen at the given temperature. Yu et al. [36] studied the gas filling and leaking performance through unified flow theory, and proposed some methods to prevent ruptures of the sealing films. Wu et al. [37] examined the pressure difference across the hole on the support tent during the microcapillary filling–evacuating process. They pointed out that increasing the hole diameter and decreasing the filling microcapillary length could induce a larger critical pressure variation and pressure difference across the hole. Guo et al. [38] applied the Hagen–Poiseuille formula to investigate the helium pressurization in ICF, and found that the capillary flow capacity has a great influence on the pressure rise in the hohlraum. Zou et al. [39] conducted a numerical simulation on the filling and evacuation processes through microtubeswith different lengths and diameters, and the results showed that for the microtubes with a diameter of 5 µm, decreasing the length from 50 mm to 5 mm could save 80% of the operation time. In spite of the great effort of research in this area, the exact pressure variations and gas composition distributions during the complete purging sequence are not well understood. Further study is greatly needed to obtain a better understanding of the microcapillary-based purging in order to meet the precise compositional and density requirements of the ICF target.
This paper is concerned with the microtube-based sub-atmospheric purging for the ICF cryogenic target, aiming to achieve high fuel purity and to avoid deposition of residual gas during cooling of the target to below 20 K. Numerical investigations are carried out to predict the characteristic behaviors of multi-species fluid in the hohlraum and capsule chambers, which are not possible to measure directly. A wide range of configurations and conditions are considered, and an optimal purging scheme is proposed to provide guidance for the experiments and operations of the ICF cryogenic target.

2. Numerical Model

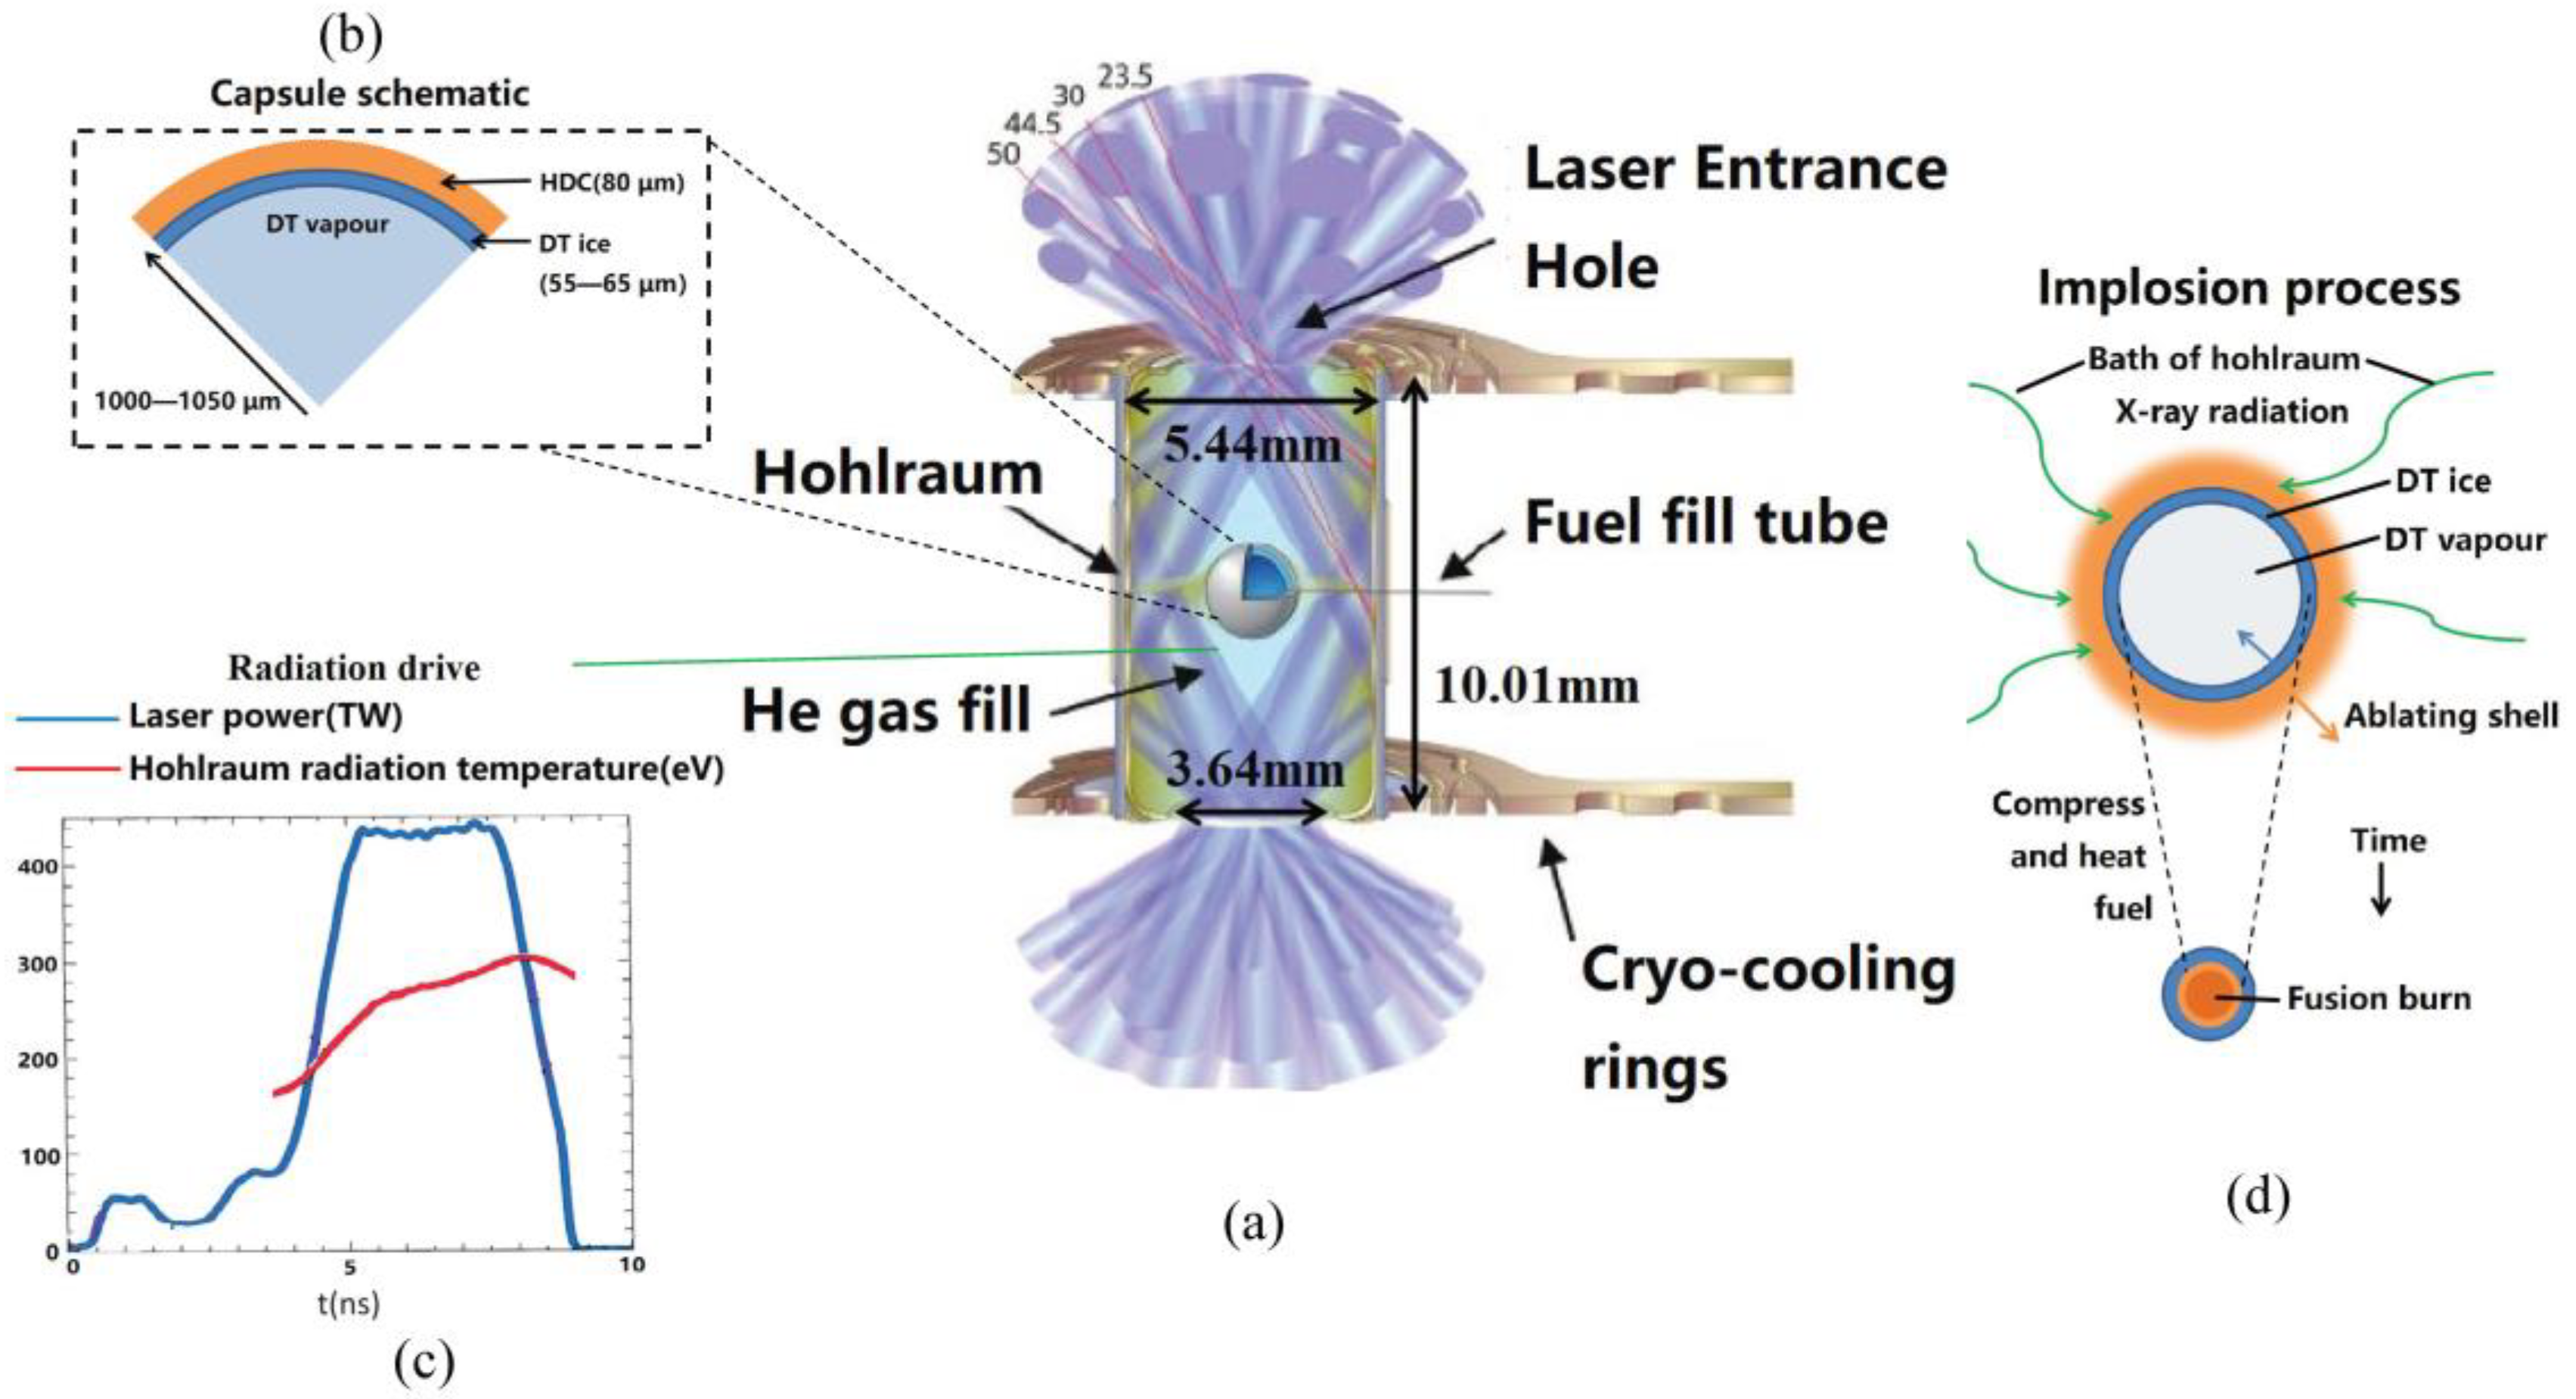
2.1. Cryogenic Target Configuration

Figure 2 schematically shows the present cryogenic target, the dimensions of which are referenced from the National Ignition Facility Rev 5 [5,6]. The cylinder hohlraum has a height of 10.01 mm and an inner diameter of 5.44 mm. The fuel capsule, with an outer diameter and a shell thickness of 1.0 mm and 0.1 mm, respectively, is situated in the center of the hohlraum. During the purging process, the hohlraum is alternately evacuated and filled with helium to meet the precise compositional requirement, while the capsule uses deuterium (D2) as the purge gas. The microtube connecting the capsule to the D2 source or vacuum has a length of 50 mm and an inner diameter (i.d.) of 20 μm. The microcapillaries used for hohlraum purging vary in size and type, and the default configuration is a 500 mm long, 100 μm i.d. microtube. Gas composition monitoring points are set in chambers for better illustration.

2.2. Model Description

2.2.1. Governing Equations

The gas mixtures involved in the hohlraum and capsule chambers are air/helium and air/deuterium, respectively. The flow of gas mixture is modeled by solving 3D transient compressible conservation equations [40] based on the following assumptions:
(1)
Air is regarded as a single-species fluid, irrespective of its actual constituent species such as nitrogen and oxygen.
(2)
Mass diffusion arises due to concentration gradients, and the effect of temperature gradients can be neglected.
(3)
The gas species are compressible and the variation in density with pressure follows the ideal gas law.
The continuity conservation equation takes the following form:
ρ m Y i t + ρ m v m Y i = J i + S i
where Si is the rate of creation by sources and Yi is the local mass fraction of each species. J i is the diffusion flux of species i, which arises due to gradients of concentration, and it can be written as
J i = ρ m D i , m Y i
Here, Di,m is the mass diffusion coefficient for species i in the mixture and is equal to the thermal conductivity divided by the specific heat capacity. The density ρm and the mass-averaged velocity v m of mixture are defined as
ρ m = i α i ρ i v m = 1 ρ m i α i ρ i v i
where αi, ρi, and v i are the volume fraction, the density, and the velocity of species i, respectively.
The momentum conservation equation for the mixture is:
t ρ m v m + ρ m v m v m = p + μ m v m + v m T + ρ m g + i α i ρ i v dr , i v dr , i
where p is the pressure and g denotes the gravity vector; v dr , i is the velocity of species i relative to the center of the mixture mass; μm is the mixture viscosity in terms of the viscosity of species i, μi; and v dr , i and μm take the following form:
v dr , i = v i v m μ m = i α i μ i

2.2.2. Non-Continuous Flow Model

Due to the size difference in orders of magnitude between the chambers and the microtubes, the gas flow regime inside the microtubes can be quite different from that of the chambers. The wall surface may behave as “slippery” due to the rarefied gas effect, and the gas flow cannot be explained simply by continuum mechanics anymore. The flow regime transition is determined by the Knudsen number, Kn:
K n = k T 2 2 π d 2 R p
where k denotes the Boltzmann constant with the value of 1.380469 × 10⁻²³ J·K−1; T is temperature with the value of 300 K in this study; d is the mean diameter of the gas molecule; and R is the radius of the microtube. For non-continuous flow of Kn > 0.01, the no-slip boundary condition is no longer applicable and slip velocities need to be considered for more precise prediction.
The Maxwellian slip boundary condition is implemented to extend the range of applicability of the Navier–Stokes equations to the non-continuous flow regime. The slip velocity along the axial direction of the microtube vm,ls is computed by:
v m , l s = ξ v m , l r r = R
where vm,l denotes the velocity component of v m along the axial direction of the microtube; r represents the radial direction of the microtube; and ξ is the slip coefficient and takes the following form:
ξ = 2 f f λ
where f is the reflection coefficient of the microtube’s inner surface and λ denotes the mean free path of the gas molecule and takes the form
λ = 2 R K n

2.3. Numerical Procedure

The evacuation and filling processes are simulated via Fluent (ANSYS, Inc., Canonsburg, PA, USA) by a pressure-based solver with double precision. A coupled algorithm is used as the pressure–velocity coupling method. The pressure inlet and outlet boundary conditions are specified at the end of the microtubes to define the filling and evacuation pressures, respectively. The Maxwellian boundary condition for the non-continuous slip flow regime is implemented by using user defined functions (UDFs).
For the transient simulations of evacuation and filling through microtubes, the governing equations are discretized in both space and time. To be specific, a Second-Order Upwind Scheme is used for the spatial discretization of convection terms in momentum, species transport, and energy equations. A Least Squares Cell-Based approach is utilized to evaluate the diffusion terms and velocity derivatives. The Body Force Weighted method is selected for pressure interpolation. The Second-Order Implicit formulation is used for temporal discretization, and the time step size for the filling process is 10−3 s. The convergence criterion for a time step is set to be 10−6, except for the continuity equation, for which the residual below 10−5 is deemed to have converged.

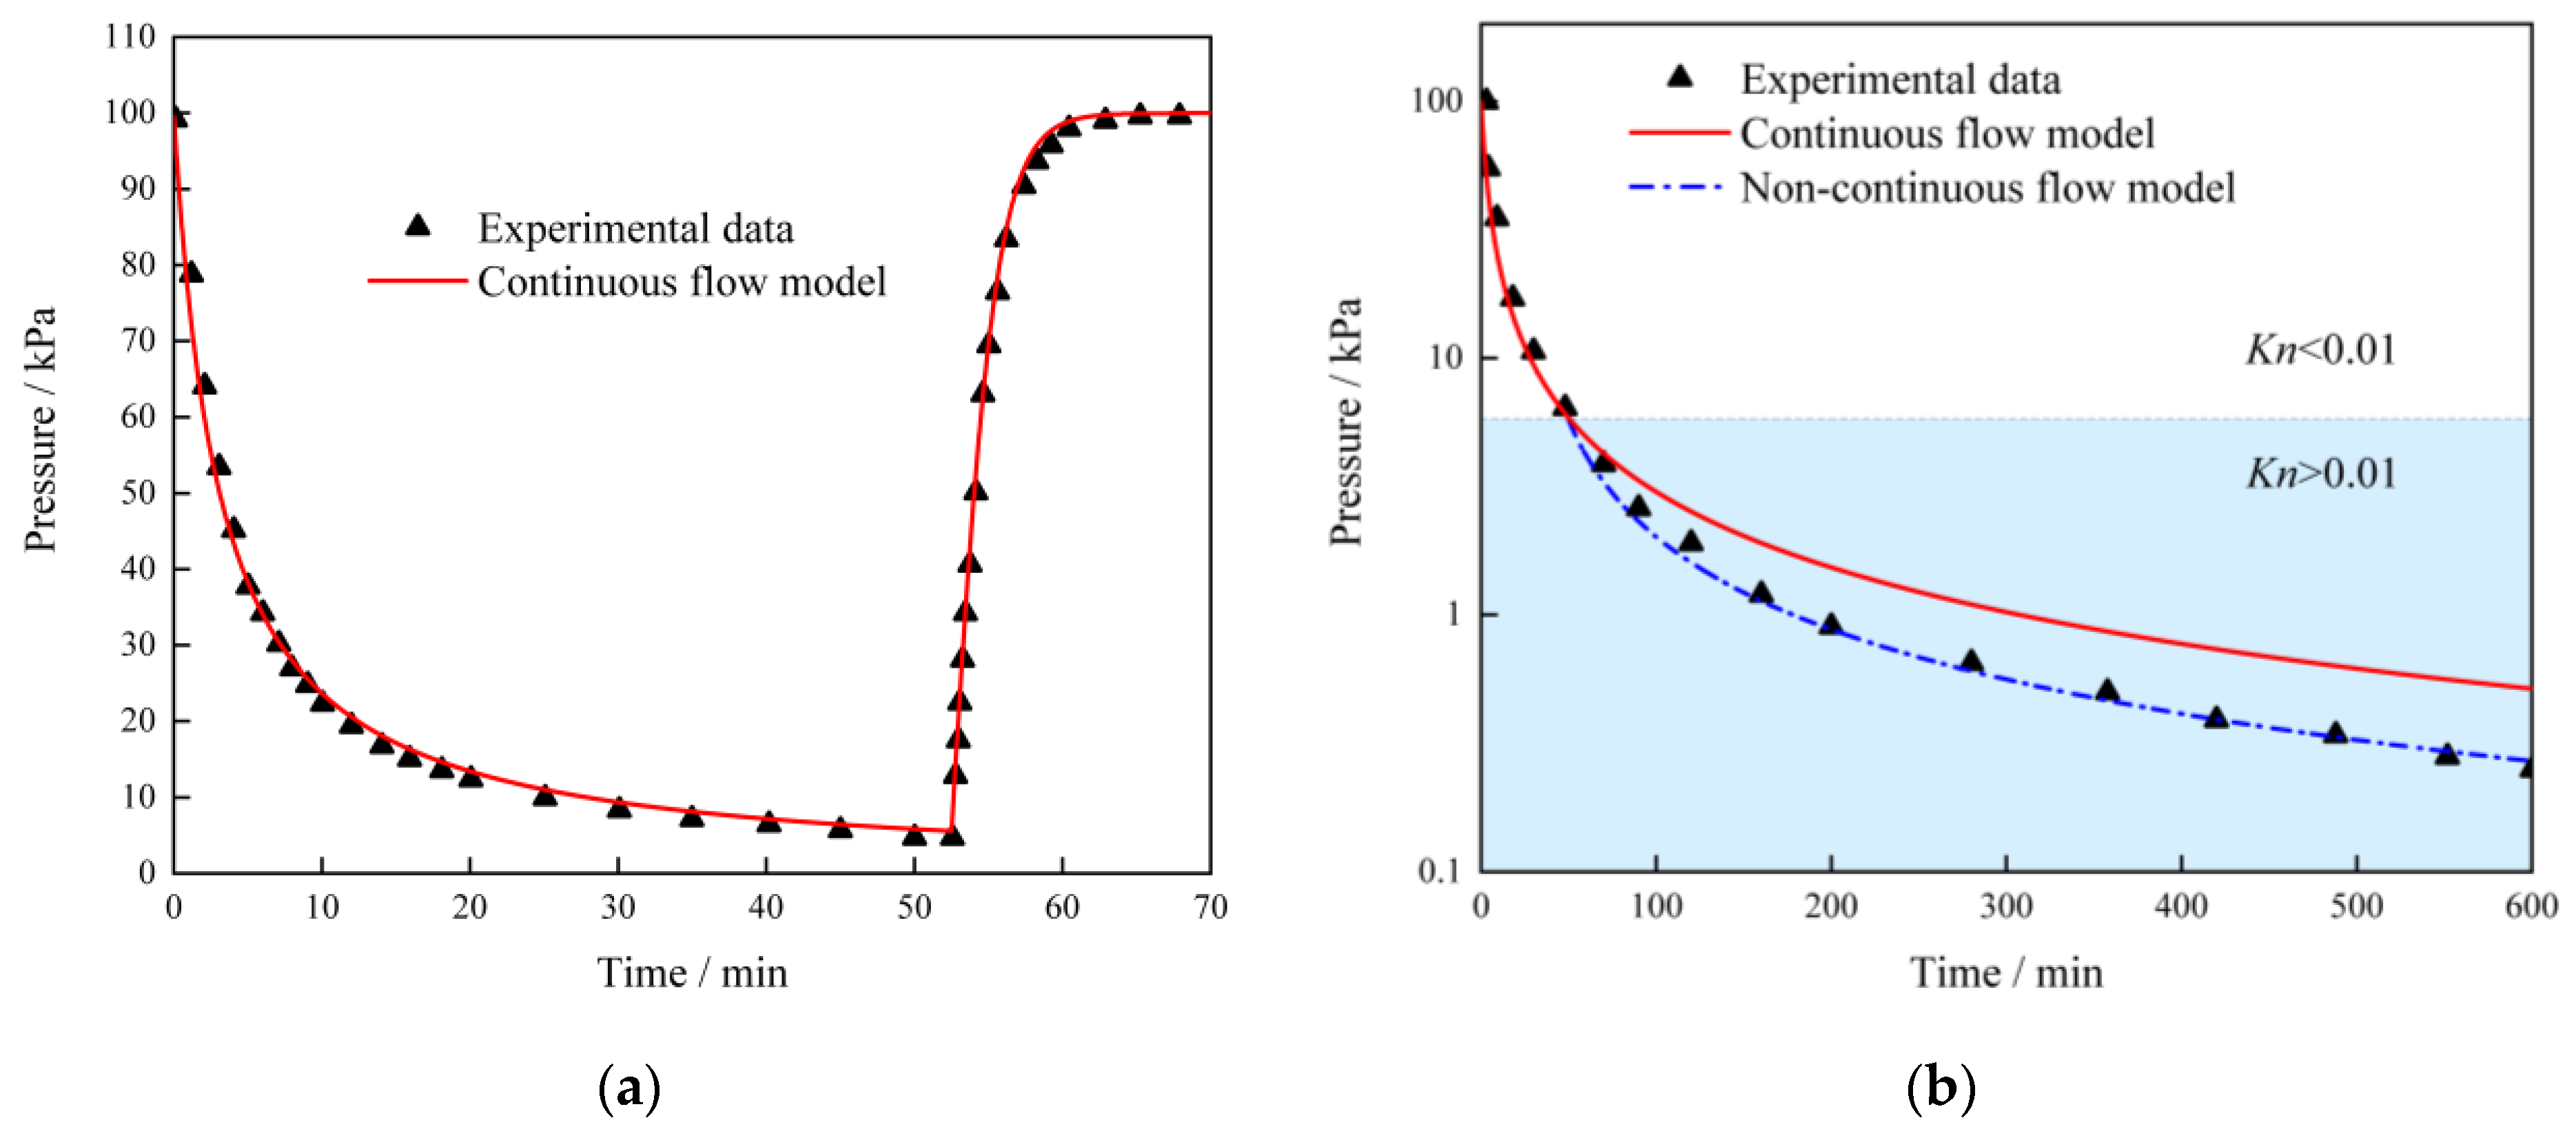
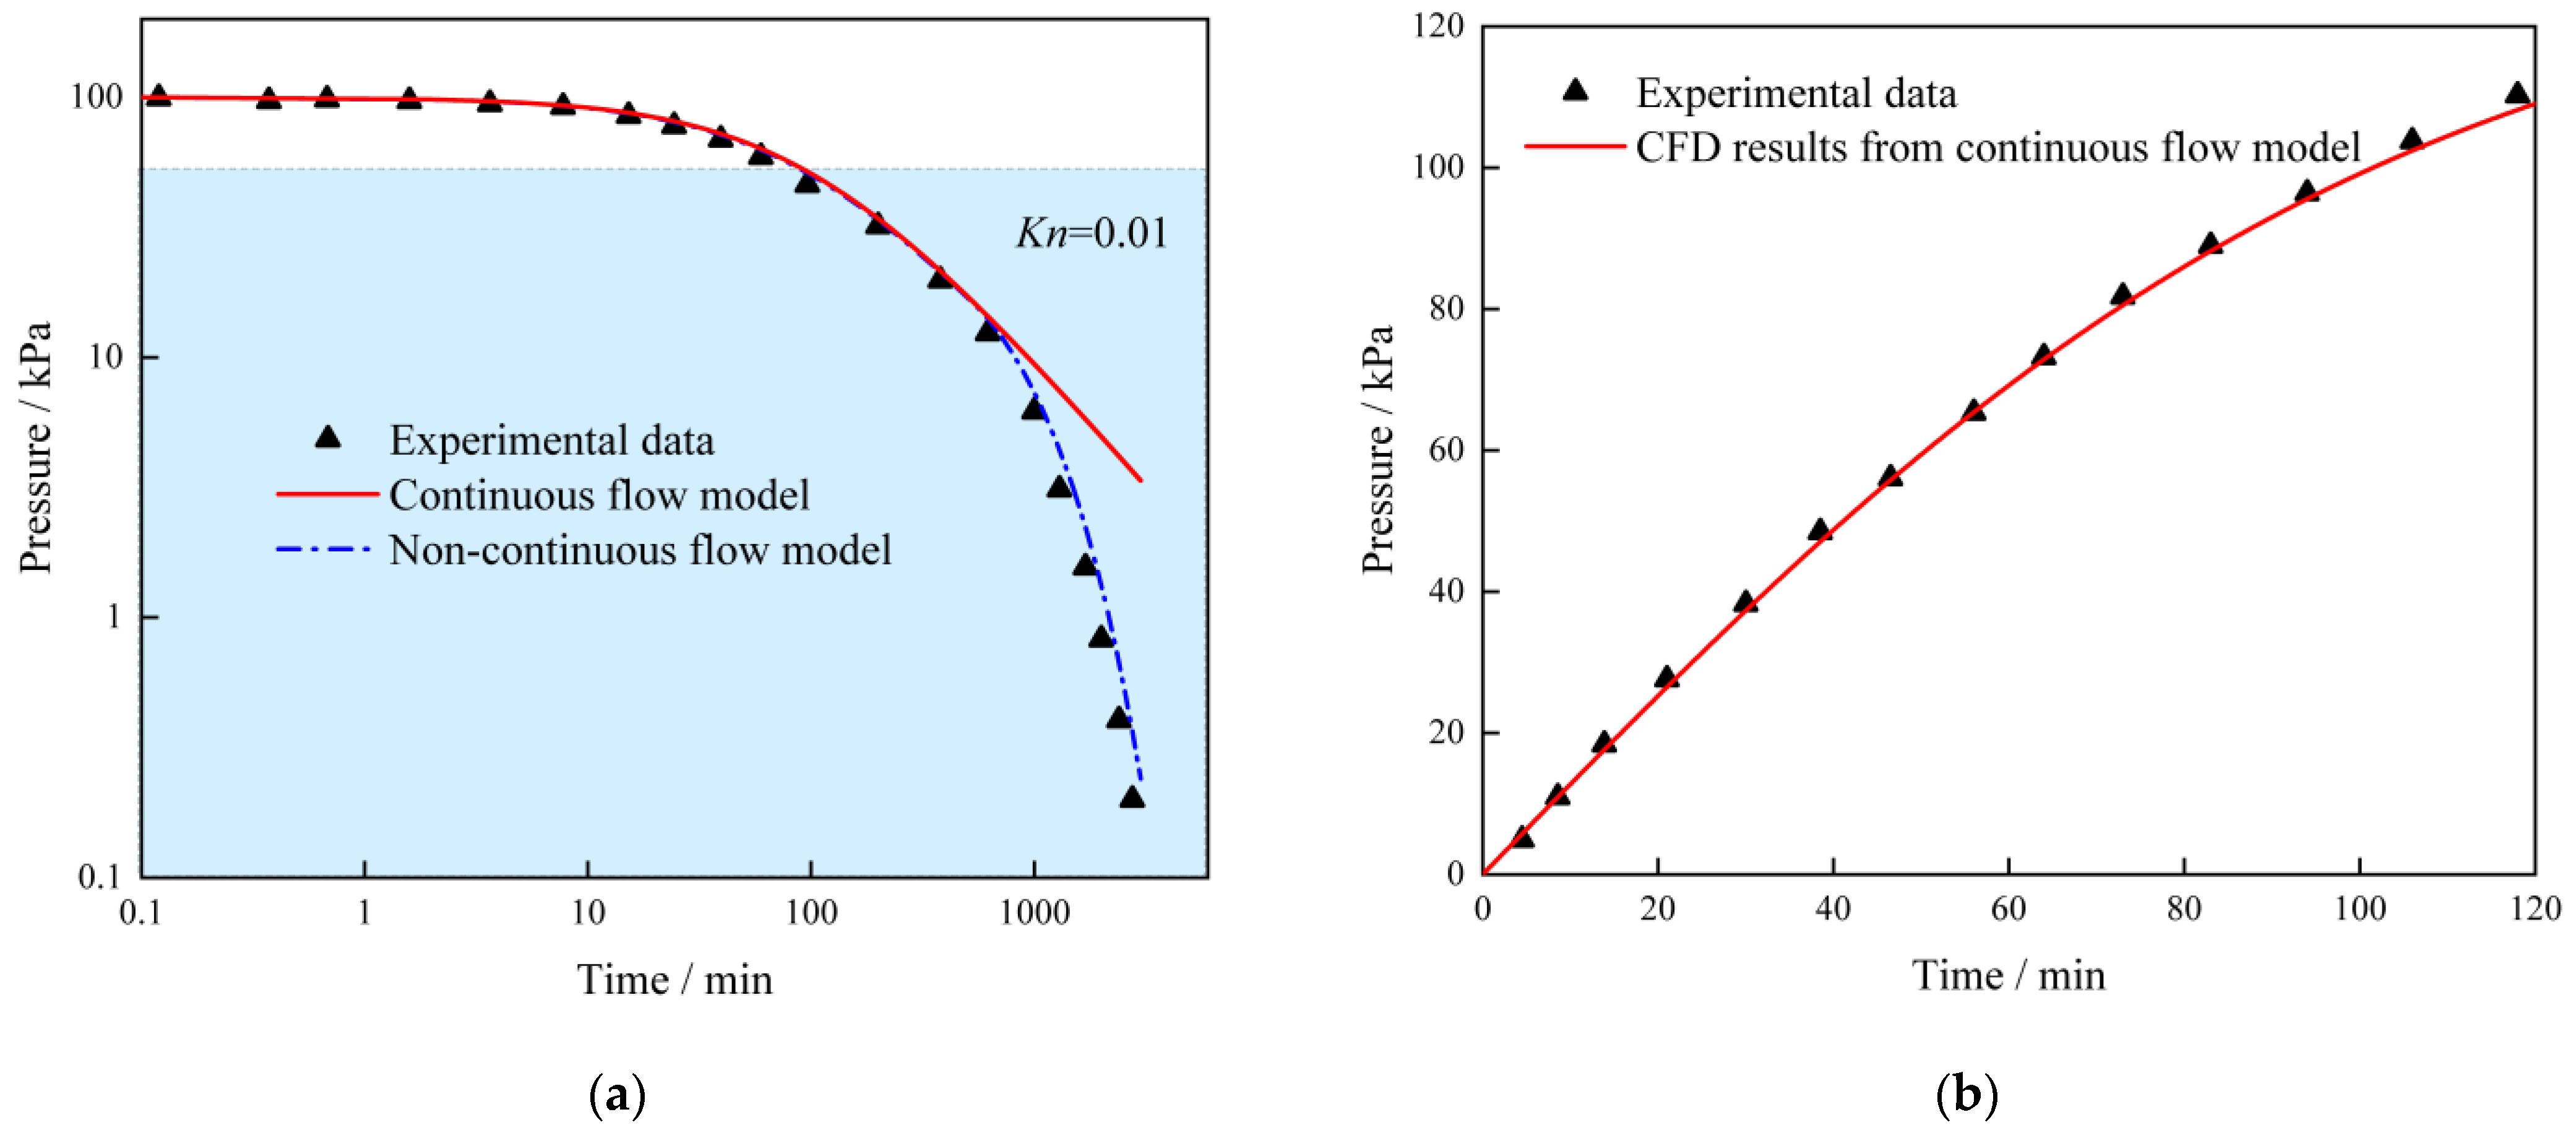
2.4. Numerical Model Validation

The applicability of the established numerical model to the operation of the actual ICF targets is validated by the evacuation and filling experiments from Bhandarkar [34]. As mentioned above, it is not possible to measure the pressure inside the capsule or the hohlraum. Bhandarkar et al. made use of a pressure-measuring device with a fixed-volume chamber, and measured the gas pressure in this volume while being evacuated or filled through microcapillaries, which can serve to verify the model. The experiments are performed with air and helium at room temperature.
Figure 3 illustrates the comparison of experimental data and simulation results for air. The air chamber has a volume of 3.4 cm3, being evacuated and later filled with a 115 mm long, 75 μm i.d. microtube. The initial pressure in the air chamber is 100 kPa and the pressure of the vacuum is maintained at 10 Pa. From Figure 3a, it can be seen that the simulation results from the continuous flow model agree well with the experimental data during the evacuation and filling processes, except for at the end of the evacuation. When the evacuation pressure data are plotted on a semi-log scale, as seen in Figure 3b, the deviation of the predicted pressure from the measured pressure is clear. And, this is attributed to the fact that the gas flow inside the microtube transforms from the continuous flow to the non-continuous flow at lower pressures. In comparison, the non-continuous flow model with slip boundary modification appears to predict the pressure drop satisfactorily, with a maximum error of about 7.8%.
Similar curves can be obtained by evacuating and filling the chambers with the non-condensable helium gas. It should be pointed out here that helium is evacuated from a 3.4 cm3 chamber with a 92 mm long, 30 mm i.d. microcapillary at room temperature, but is later filled into a 94.5 cm3 volume with a 172 mm long, 75 mm i.d. microcapillary. As is shown in Figure 4, the non-continuous flow model provides a better fit with the measured chamber pressure than the continuous flow model, especially at low pressures of the evacuation process. The good agreements between the computation and NIF experiment results for both air and helium indicate the applicability of the present model to the simulation of actual microtube-based purging, which is, in nature, made up of a series of evacuation and filling processes.

3. Characteristics of a Single Evacuation–Filling Period

During the single evacuation–filling period, the pressure of the hohlraum and capsule varies in a similar way to that shown in Figure 3 and Figure 4, and the decreasing gas density makes the evacuation slower than the subsequent filling. However, the gas composition also changes as the purging gas fills into the hohlraum and capsule. At constant evacuation–filling conditions, the characteristics of a single purging period show a strong configuration dependence.

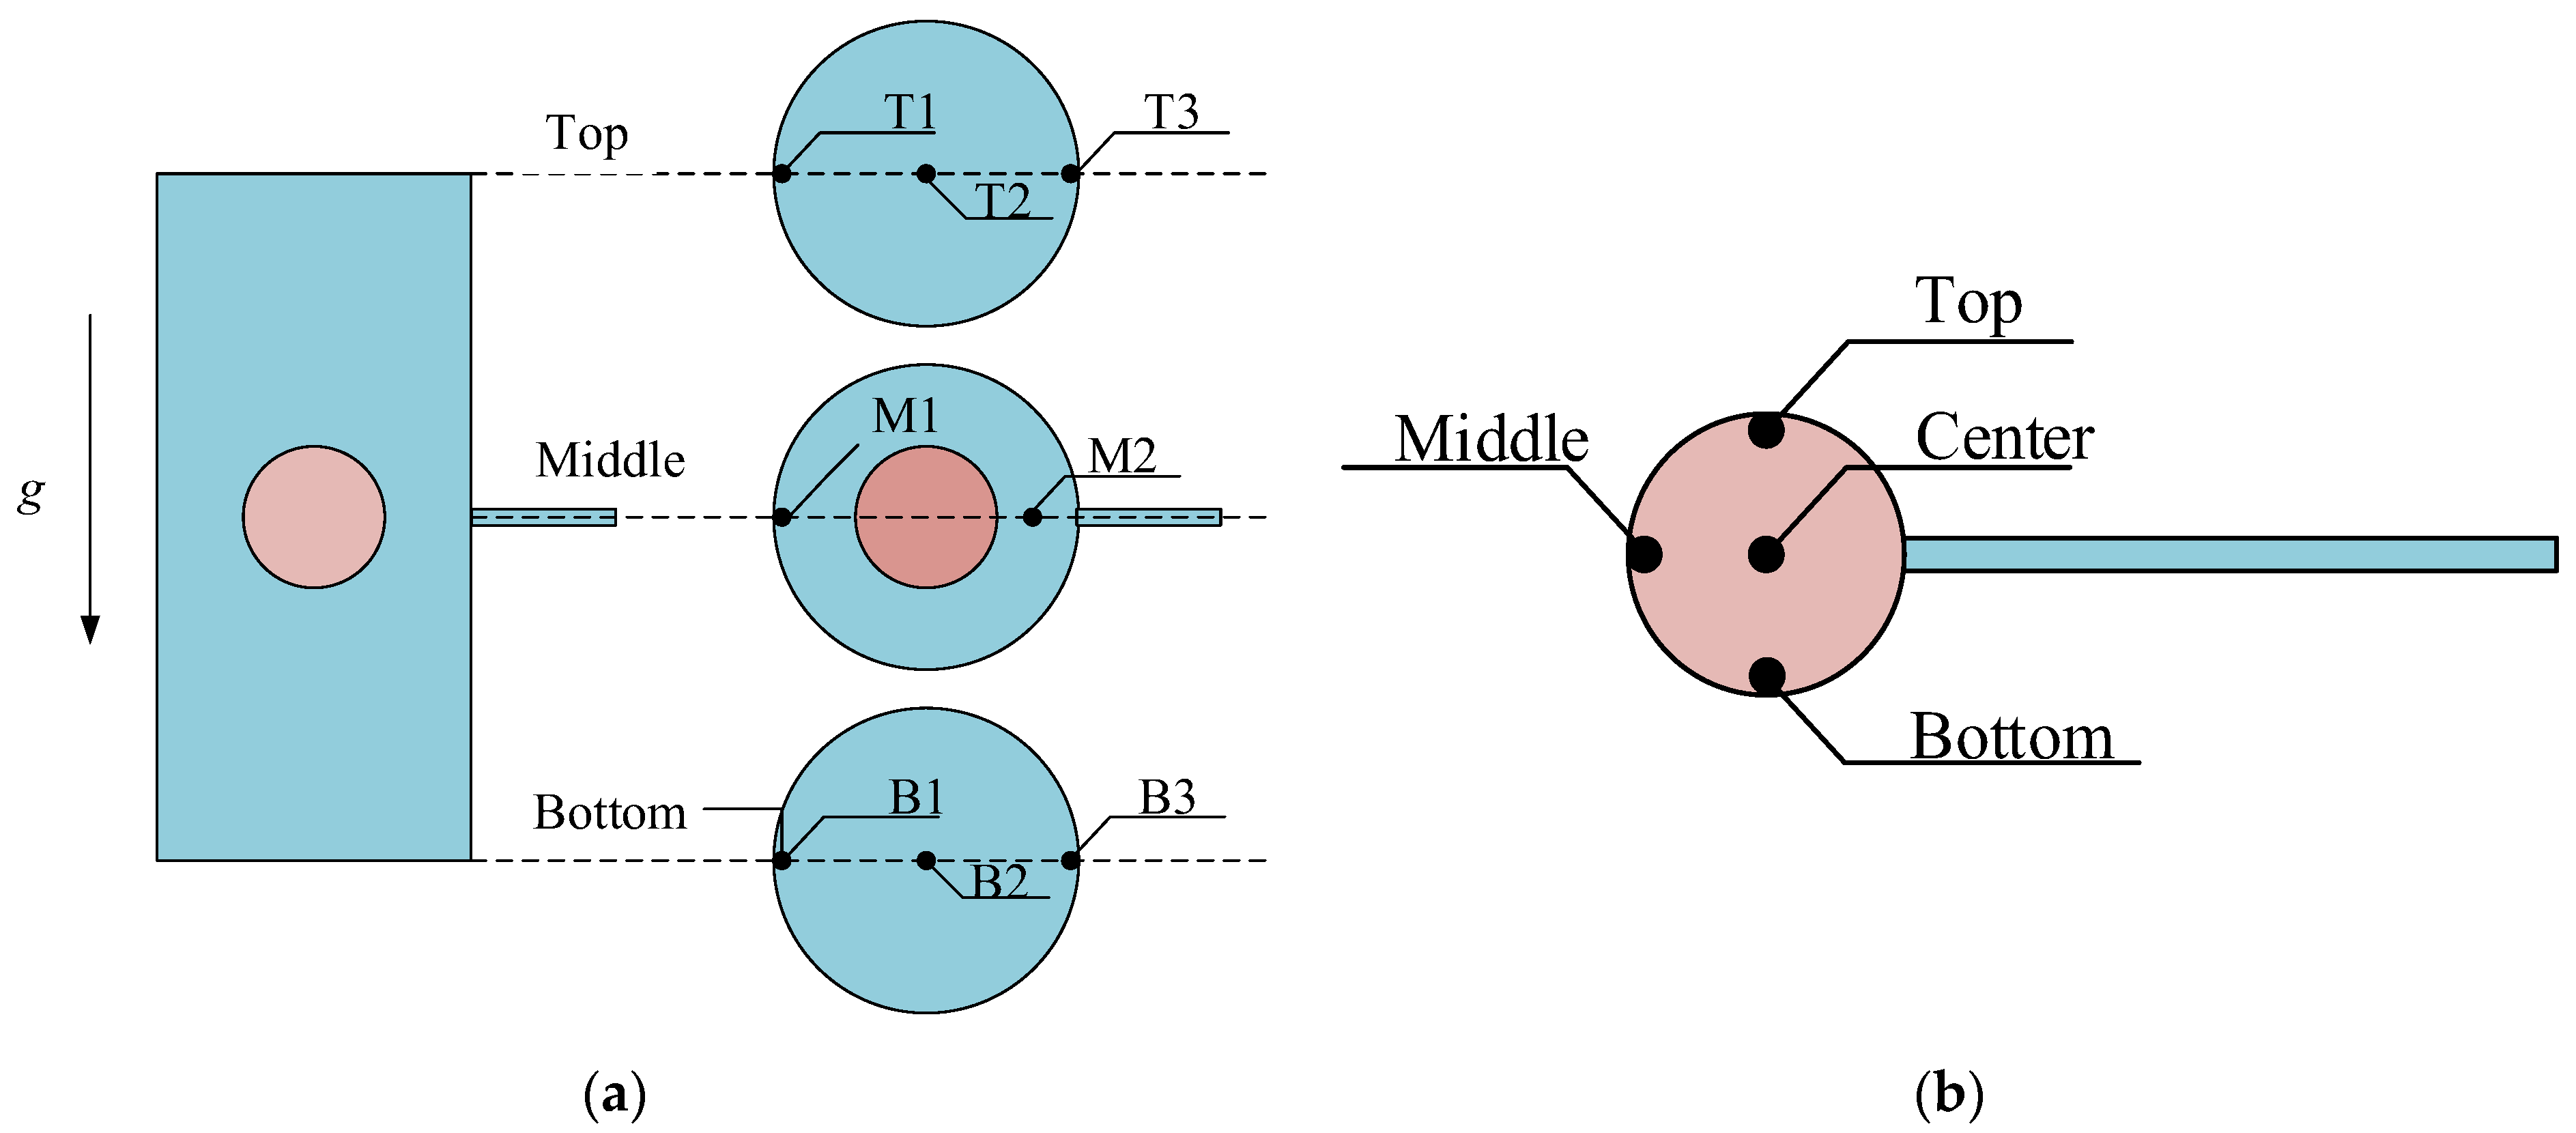
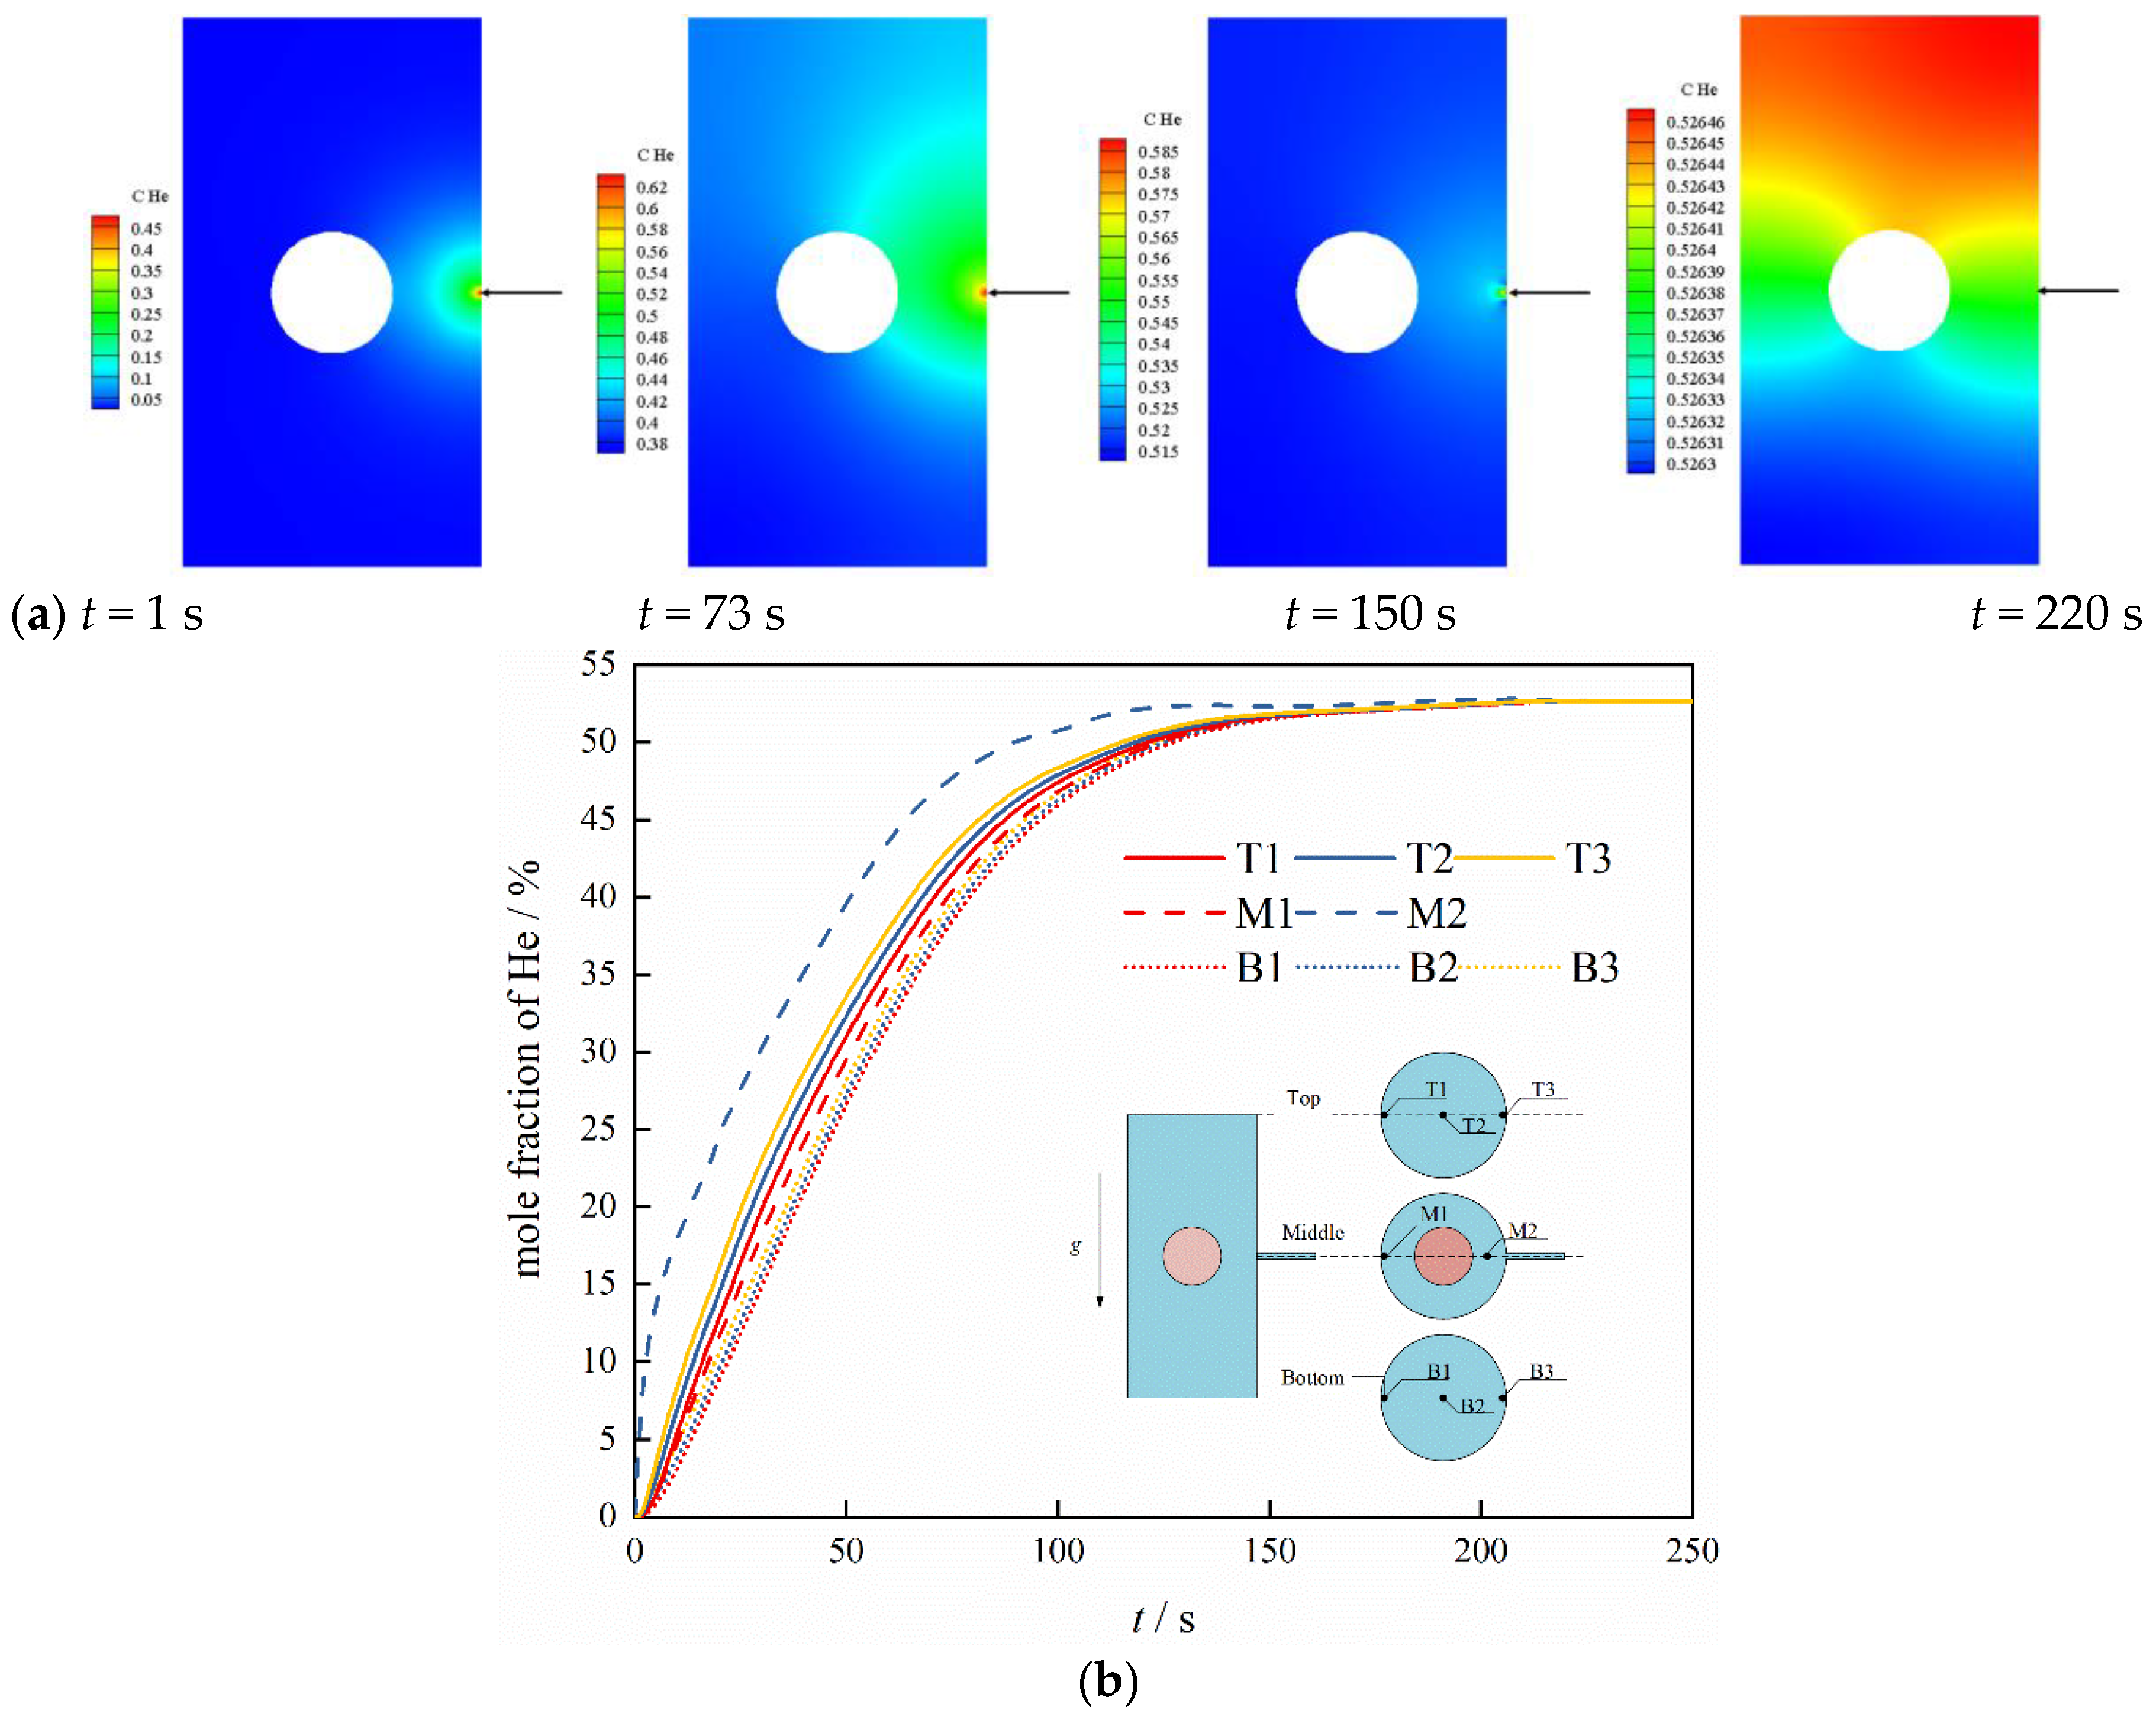
3.1. Gas Distribution Characteristics

The change in gas composition comes with the filling of purging gas. Figure 5 shows the evolution of gas composition in the hohlraum when it is filled from 25 kPa by a constant helium source of 50 kPa through a 500 mm long, 100 μm i.d. microtube. The ‘C He’ in the contour legend of Figure 5a indicates the molar fraction of He. It can be seen that during the early to middle stage of the filling process, the helium enters the hohlraum, flows upwards because of its lower density than air, and gathers mainly in the upper part. As the filling proceeds, the filling rate gradually decreases with the hohlraum pressure, leading to a slower growth in the helium mole fraction, as shown in Figure 5b. Helium and air gradually mix, and distribute more evenly in the hohlraum. At the end of the filling process, no significant differences in the molar fraction of He are observed throughout the hohlraum, and the minor difference in the vertical direction is due to gas stratification caused by gravity. This suggests that late in filling, helium and air are well mixed inside the hohlraum and can be treated as a homogeneous mixture approximately.
Similar growth is observed in the mole fraction of deuterium (D2) when the capsule is filled through a 50 mm long, 20 μm i.d. microtube. However, as shown in Figure 6, the difference in the D2 molar fraction among the monitoring points is barely detectable, which is due to the rapid mixing of D2 with air resulting from the small volume of the capsule.
Since the gas composition is also independent of the evacuation operating conditions, it seems reasonable to simplify the composition distribution in these small chambers and describe the gas mixture of the evacuation–filling cycle with an average molar fraction.

3.2. Effect of Microtube Size

The flow conductance of the microtube is configuration dependent, so are the hohlraum pressure and the evacuation–filling time. Figure 7 shows the dependence of pressure history on the microtube length when the hohlraum containing atmospheric air is evacuated to about 1 kPa at a vacuum pressure of 100 Pa and then filled to about 49.9 kPa by a helium source of 50 kPa.
It can be seen that for a constant inner diameter of 0.1 mm, the hohlraum pressure changes in a similar way when the microtube length ranges from 300 mm to 700 mm. At constant evacuation and filling pressures, the pressure change rate decreases with microtube length L, and this in turn results in a linear increase in the evacuation or filling time for the process. For every 100 mm increase in L, the time required for the evacuation and filling increases by ~5.7 min and ~0.4 min, respectively, suggesting the superiority of a shorter microtube in improving the filling–evacuating efficiency.
Similar curves can be obtained by varying the inner diameter, D, of the microtube when the length is fixed at L = 500 mm. As is shown in Figure 8, the transient hohlraum pressure strongly depends on the microtube inner diameter. A shrinkage in D dramatically lowers the rate of pressure change, and consequently extends the evacuation and filling time. The diameter dependence on the required time can be described by an exponential decay function.

3.3. Combined Form of Microtube

The results mentioned above show the way forward for improving the evacuation–filling efficiency through shortening or enlarging a straight microtube. Typically, microtubes of composite forms can be considered to balance the evacuation–filling efficiency and the mechanical or thermal requirements. In addition to the straight form (Type ①), three other composite forms are studied in this paper. As is shown in Figure 9, the three new forms have a larger tail end of 150 μm i.d., and differ only in their first half. Type ② has a stepped configuration, and the two straight microtubes of different inner diameters are equal in length. Type ③ goes further and contains a tapered microtube to ensure a smooth transition between the two straight microtubes. As for Type ④, its front half is a tapered microtube with a minor diameter of 0.1 mm.
Figure 10 shows the results for the four types of microtubes under the same evacuation and filling conditions. No significant qualitative differences were observed in the hohlraum pressure histories between the straight and composite microtube forms. From type ① to type ④, the time required for the evacuation or filling reduces dramatically, benefitting from the improvement in microtube flow conductance, which is in accordance with the results of the parametric study concerning the microtube inner diameter. Moreover, the microtube of type ④, with its small diameter end connected to the hohlraum and the large diameter end connected to the gas source, is considered to have a less impact on the thermal field of the hohlraum as well as a higher evacuation–filling efficiency.

4. Performance of the Complete Purging Cycle

A purging cycle is the sequential repetition of evacuation–filling periods. For the hohlraum, it focuses on rapidly evacuating the non-helium component to the required concentration in order to avoid the deposition of residual gases on the wall surfaces and sealing films during the cooldown process. And, it is clear that a low evacuation pressure helps to obtain a large decrease in residual gas concentration during a single evacuation–filling period. As is mentioned above, however, a much slower decline in the pressure occurs toward the end of low-pressure evacuation due to the decreasing gas density, and this extends the evacuation time significantly compared with the subsequent filling process. Thus, an appropriate trough pressure is critical for the complete purging process in view of the cycle number and the overall operation time.
Figure 11 shows the variations in pressure and air concentration in the hohlraum during the purging process when the cycle trough pressure, pL, ranges from 2 to 40 kPa. Still, the hohlraum that is initially filled with atmospheric air alternately connects to the vacuum source of 100 Pa and the helium source of 50 kPa through a 500 mm long, 100 μm i.d. microtube. As can be seen, the hohlraum pressure alternates between rising up to 50 kPa and falling down to the trough pressure, pL, in a form resembling that of the “rounded” square wave. The arrival of the rising edge of the hohlraum pressure waveform causes the air concentration to change in the opposite direction. As the periodic evacuation–filling process proceeds, the air concentration drops step by step. When the trough pressure pL increases, the hohlraum pressure varies over a shorter period, and the reduction in air concentration by one filling operation gets smaller, leading to a significant increase in the number of evacuation–filling cycles, as shown in Figure 12. As a result, the total time required to fully purge the hohlraum first decreases and then increases, accompanied by a larger proportion of filling time. Within the range of 2–40 kPa, the percentage of filling time monotonically increases from 11.8% to 88.4%, while the required time varies between 14 min and 35 min. The minimum time shortens the purging life cycle by 60% and appears at about 10 kPa, i.e., 20% of the filling pressure. Under this condition, the percentage filling time is close to 50%. In other words, the purging cycle works most efficiently when the filling process follows a 50% duty cycle.
The purging of the capsule with deuterium (D2) demonstrates a similar dependency on the cycle trough pressure, pL. The capsule pressure periodically decreases to its trough pressure and rises up to 100 kPa due to the repetitive evacuation and filling through a 20 mm long, 10 μm i.d. microtube. Figure 13 shows the dependency of cycle parameters on the trough pressure with 205 ppm as the air concentration standard. It is clear that trough pressures that are too high or too low prolong the required time. The shortest time falls in the range of 18–20 kPa, around 20% of the filling pressure, and the corresponding percentage of filling time is 42.7%, which are consistent with those of the hohlraum. From the purging results, it can be concluded that an appropriate trough pressure is helpful in quickly lowering the residual gas in the hohlraum and capsule chambers to the required level.

5. Conclusions

Based on Navier–Stokes equations and slip flow modification, a numerical model has been developed and well validated for the sub-atmospheric purging through microtubes in the cryogenic target. The structural parameters of the microtubes and the evacuation–filling scheme have been investigated, and the main results are as follows:
(1)
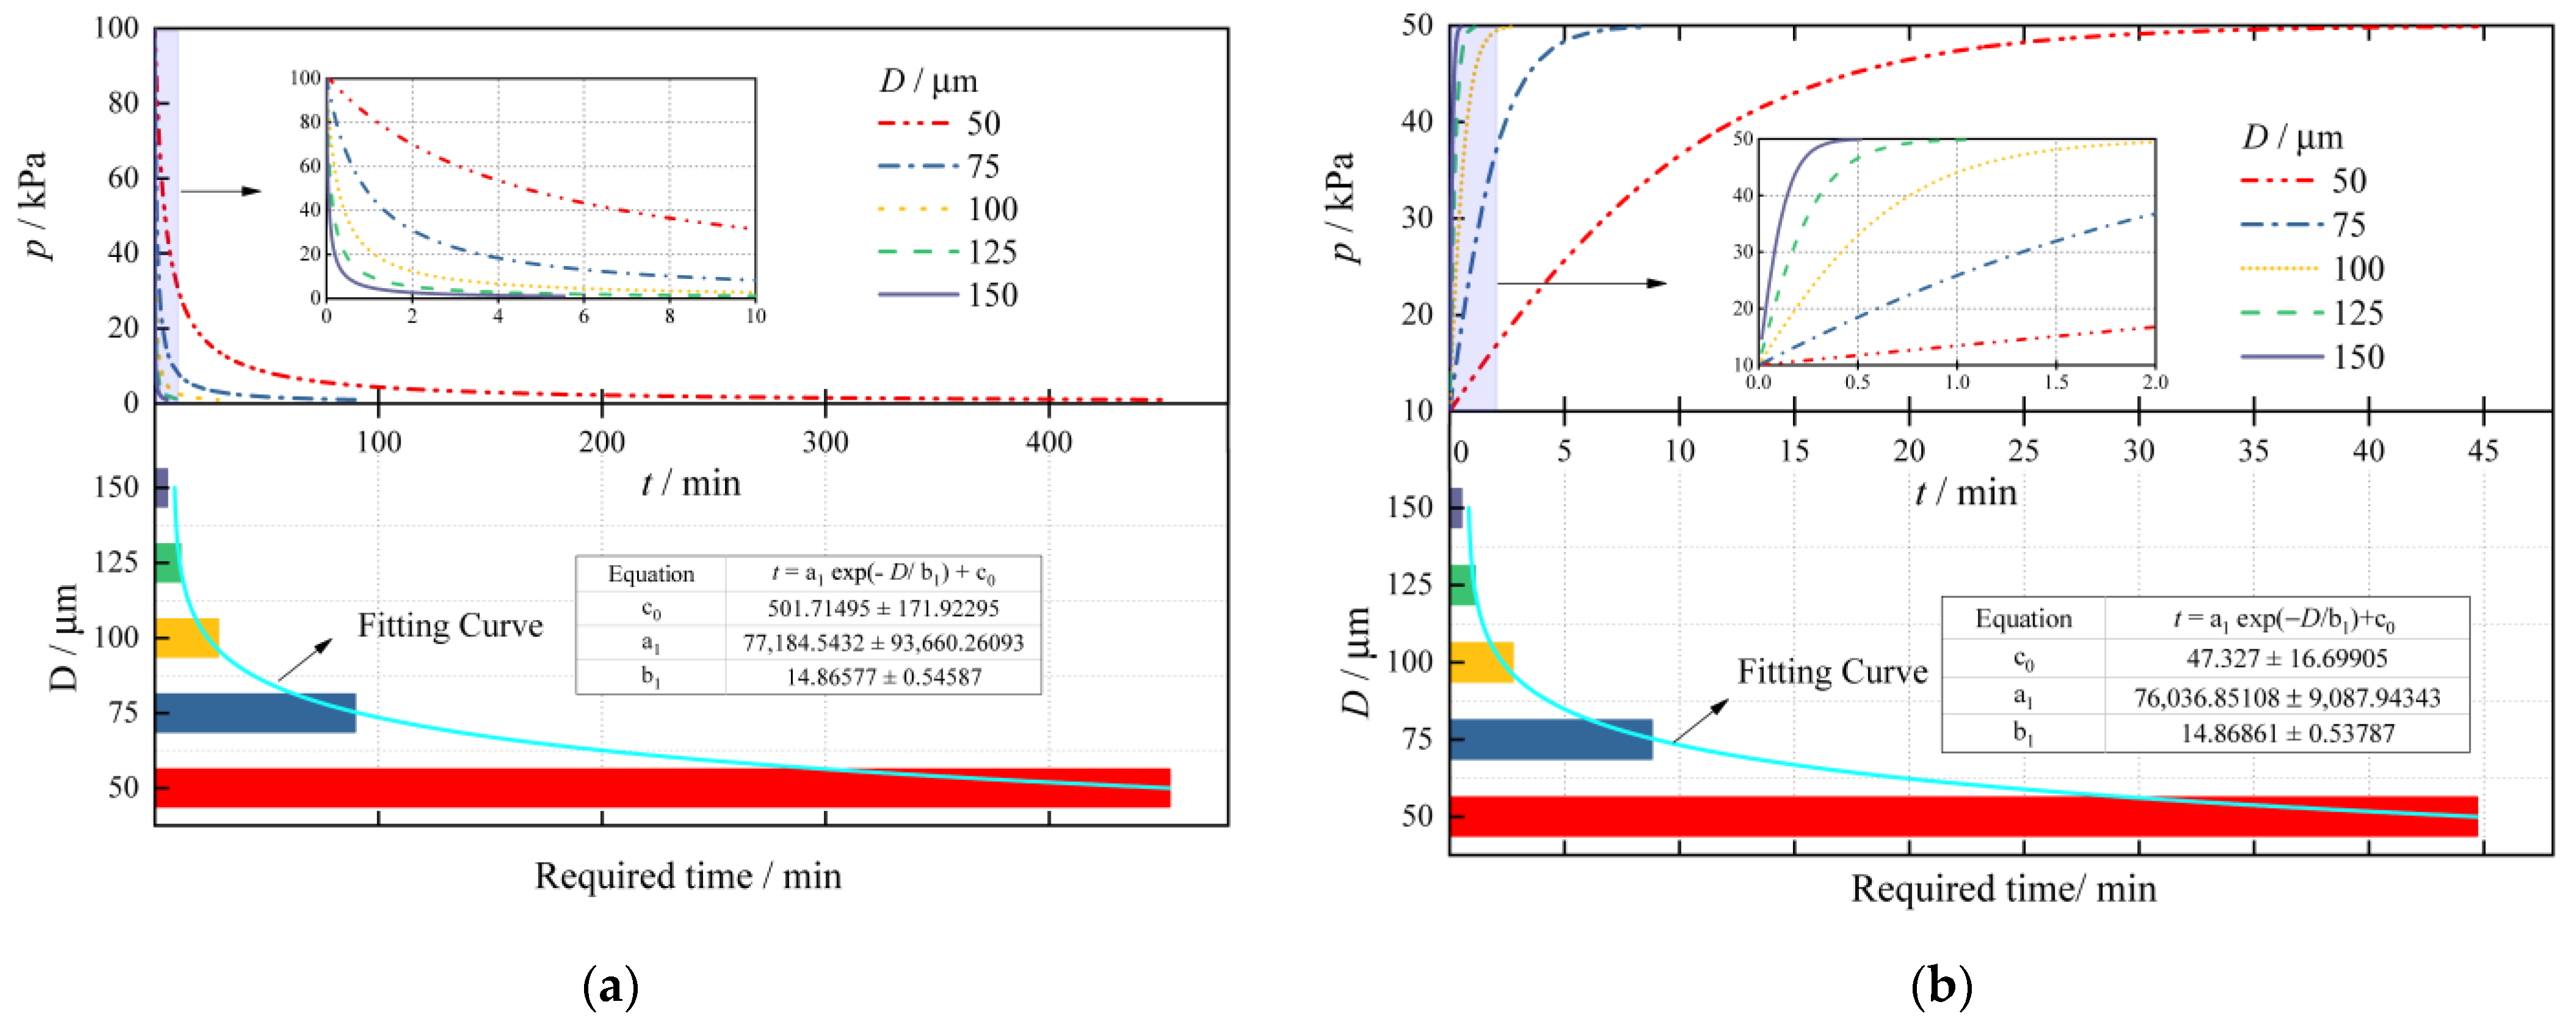
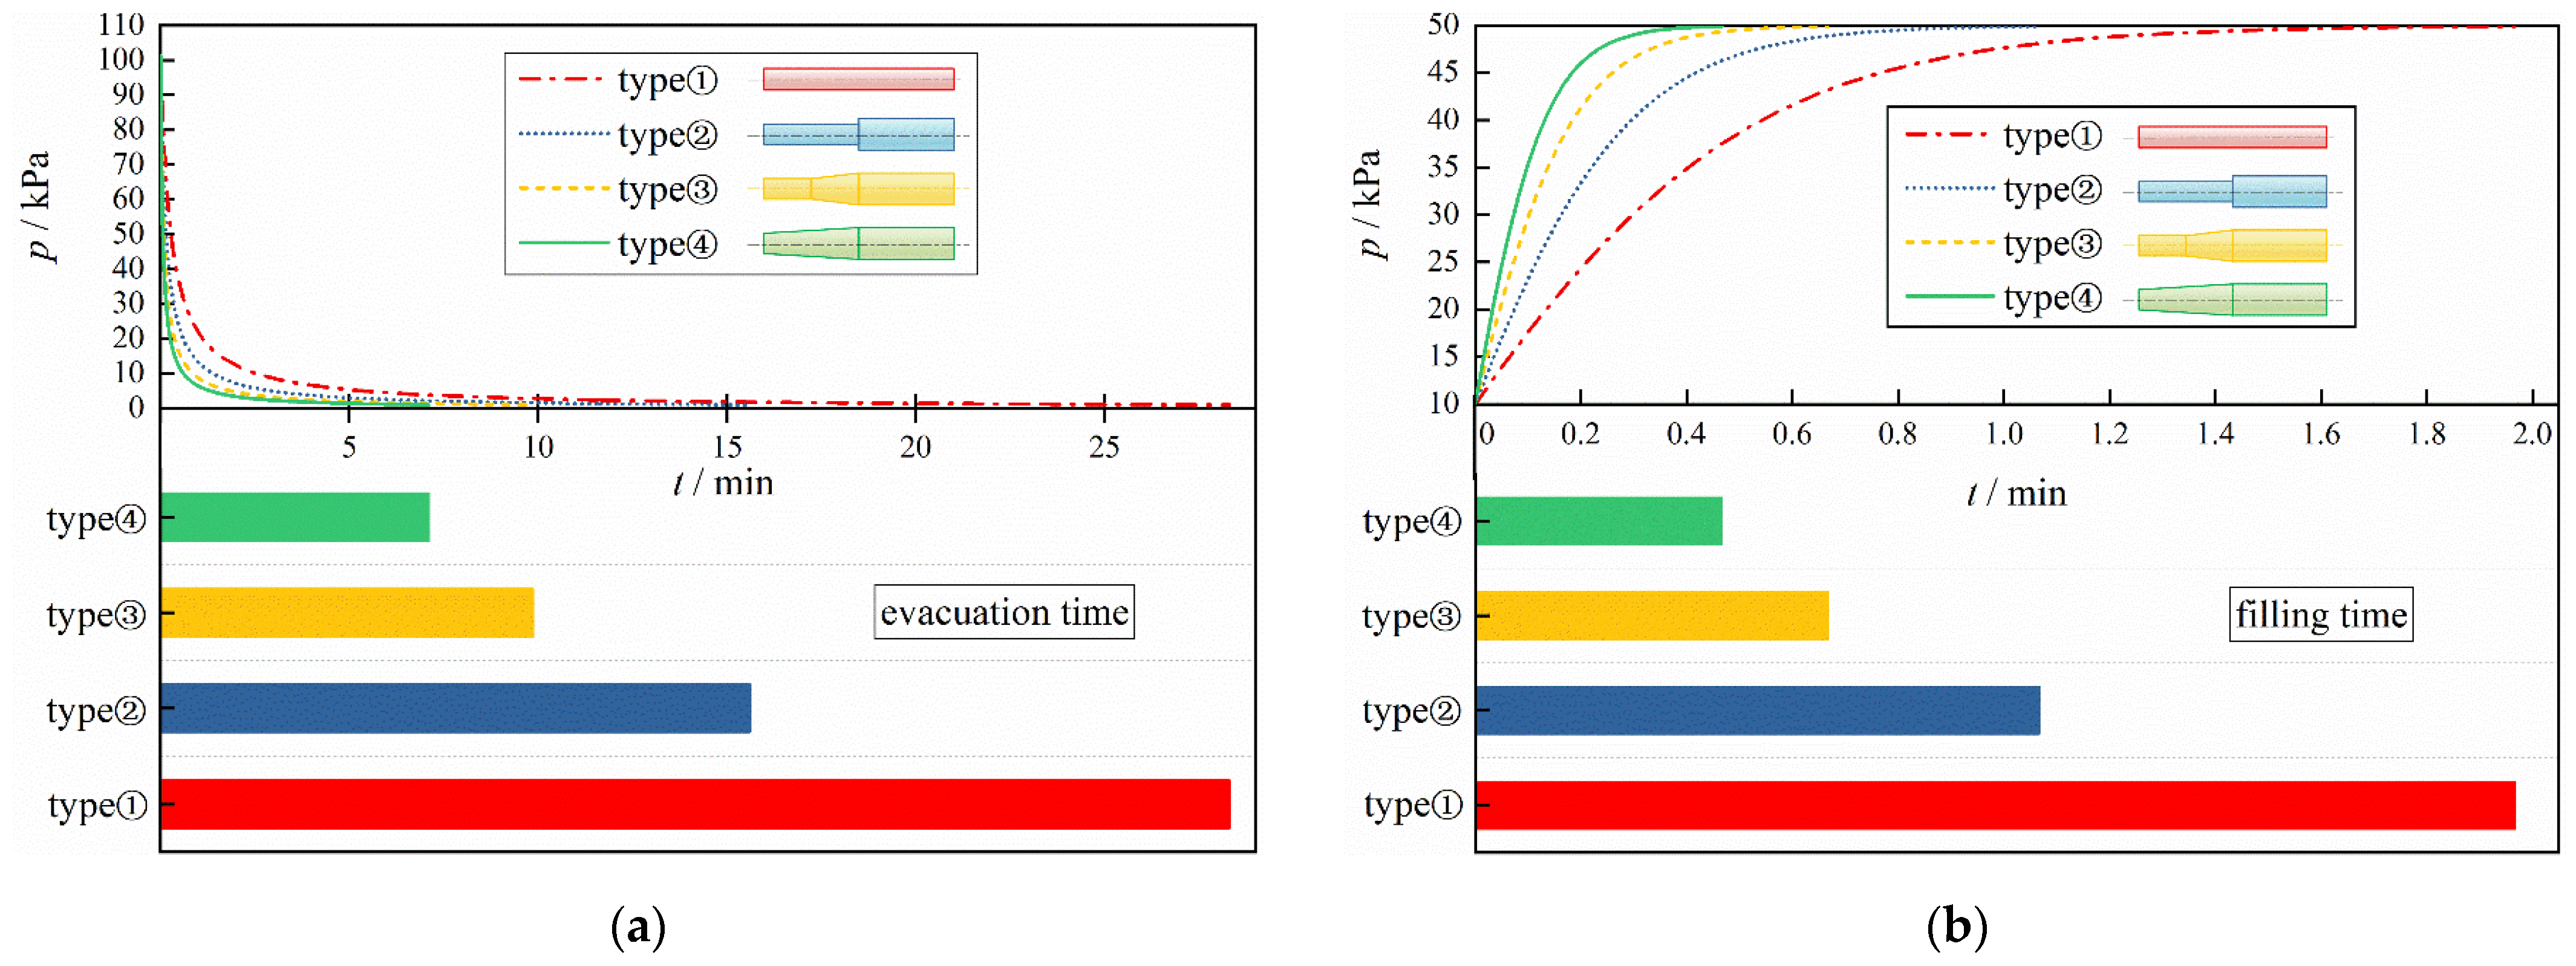
The transient behavior during every evacuation–filling period is susceptible to the structure and size of the microtubes at constant evacuation and filling pressures. Lengthening the microtube lowers the pressure change rate and results in a linear increase in the evacuation or filling time, while enlarging the microtube diameter reduces the time by way of exponential decay. Comparisons among the composite forms further demonstrate the advantage of large cross-section microtubes.
(2)
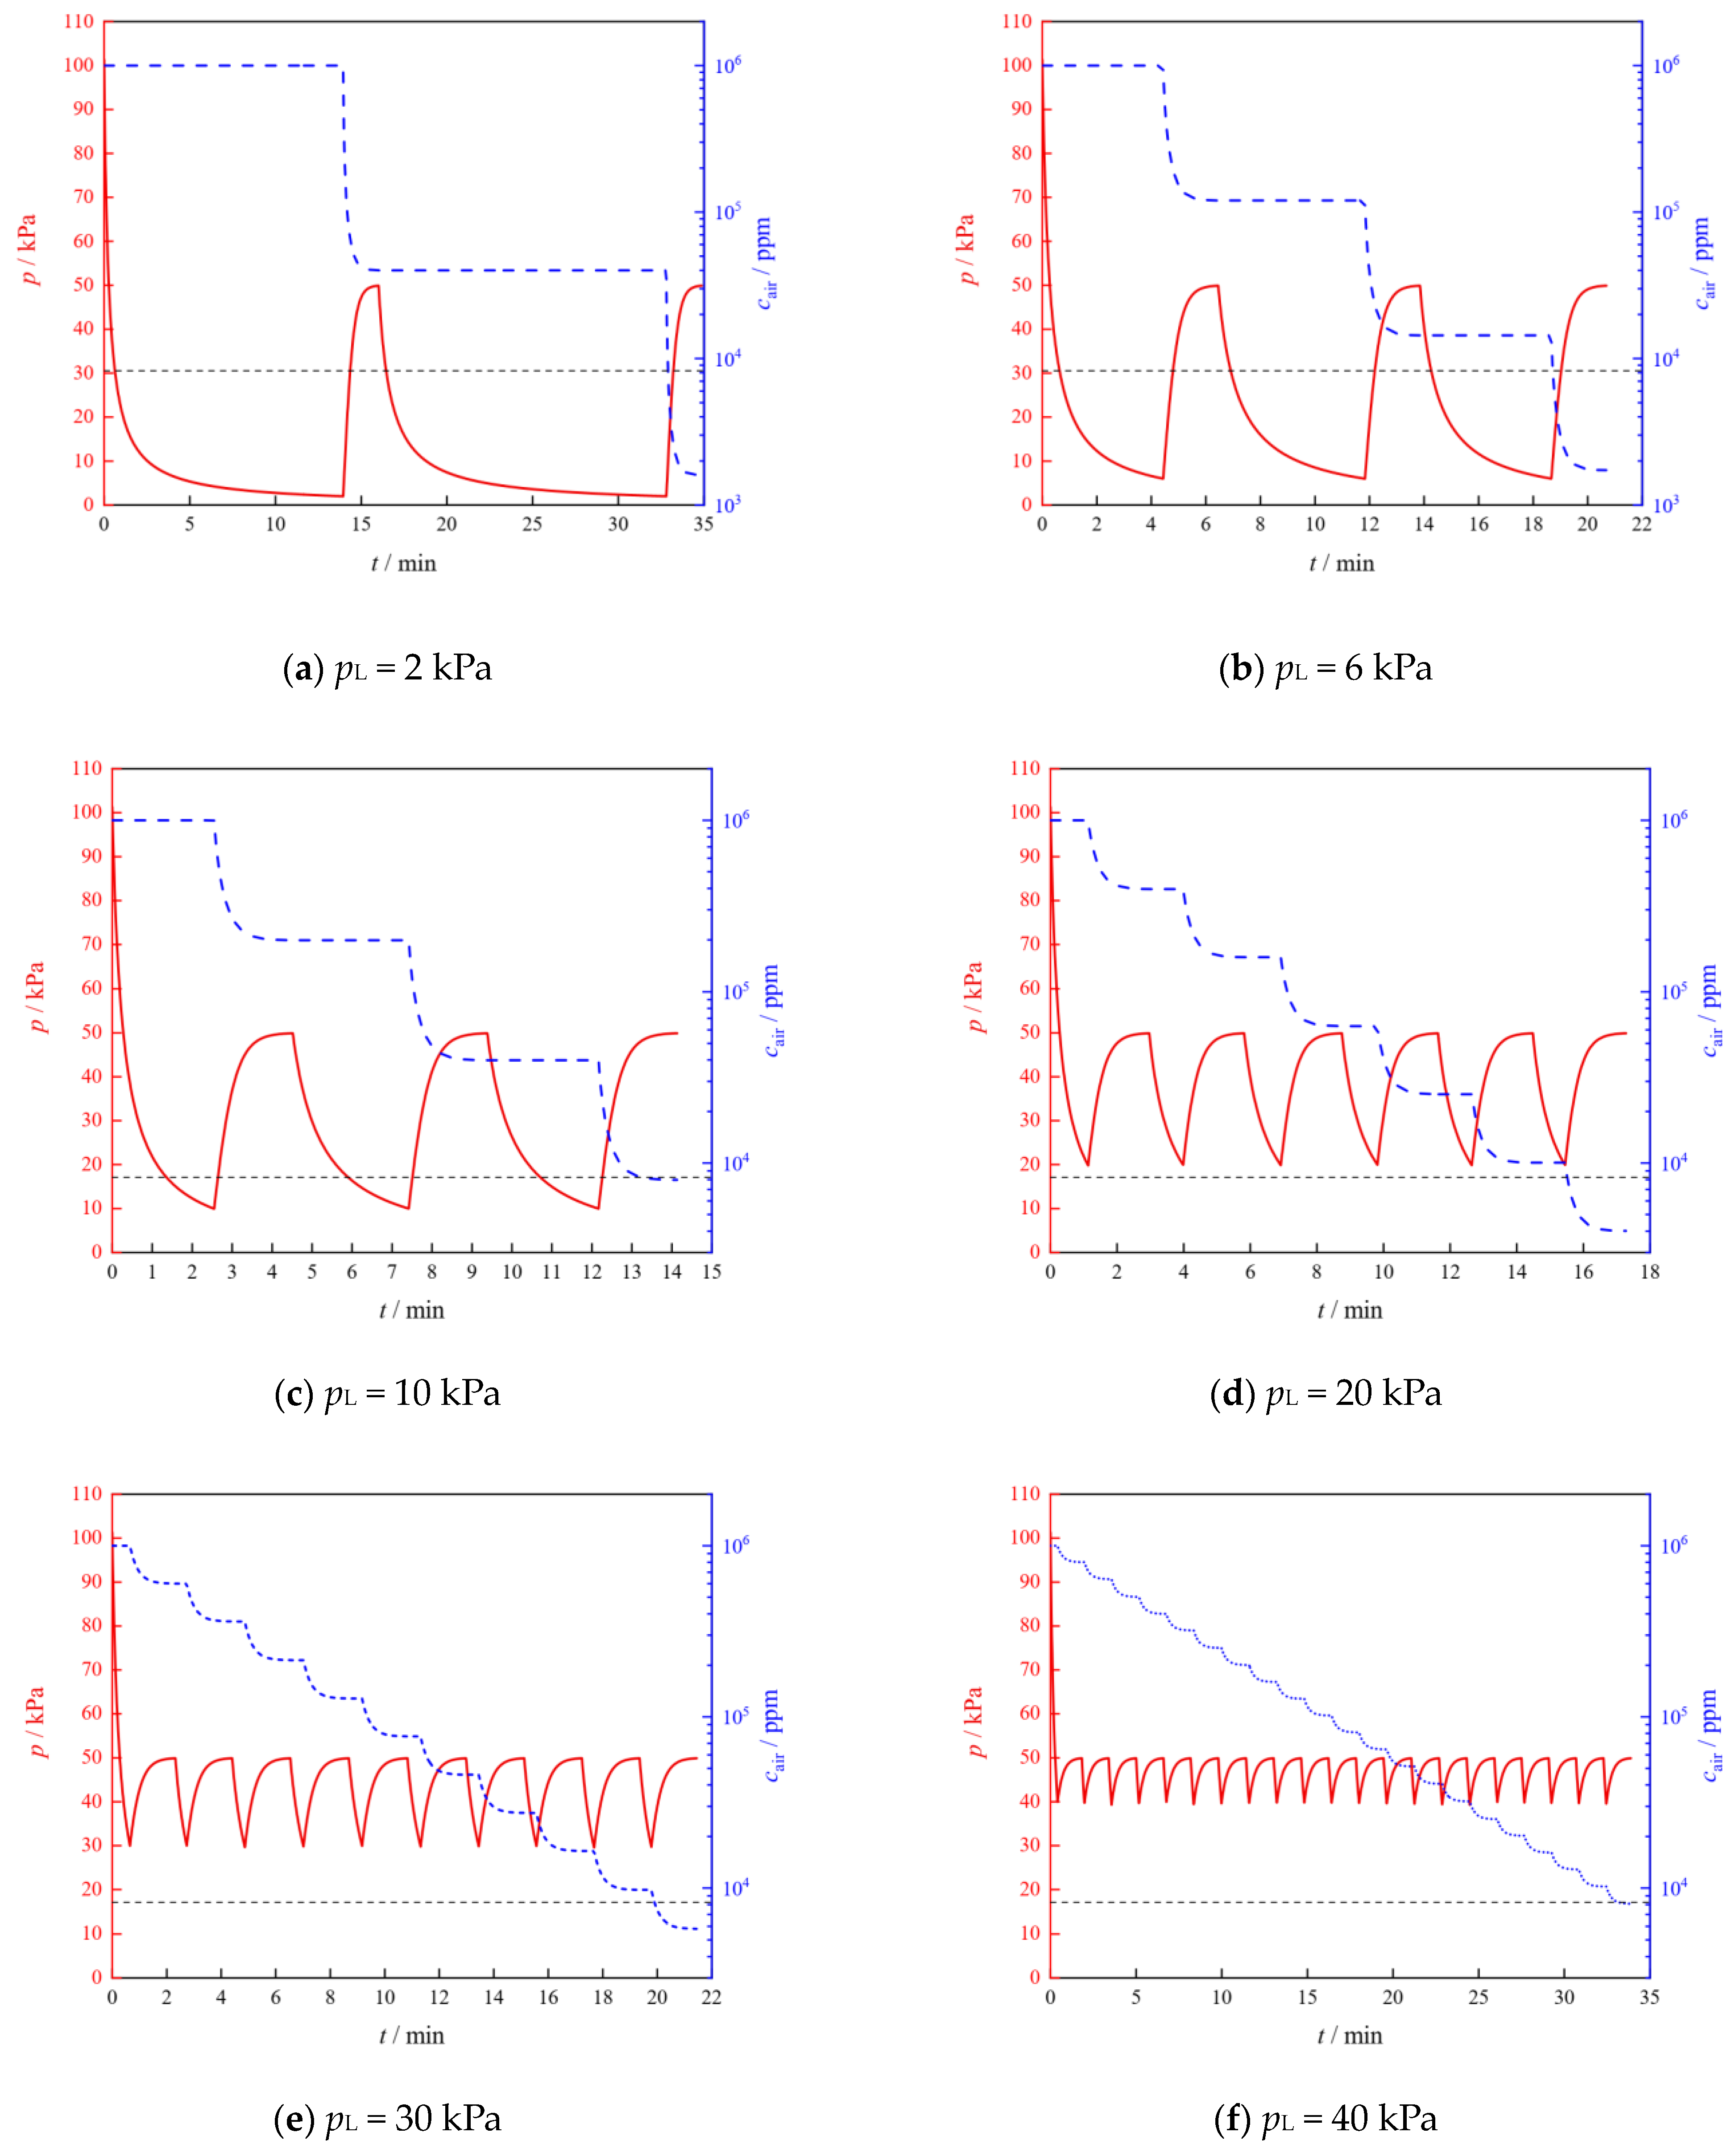
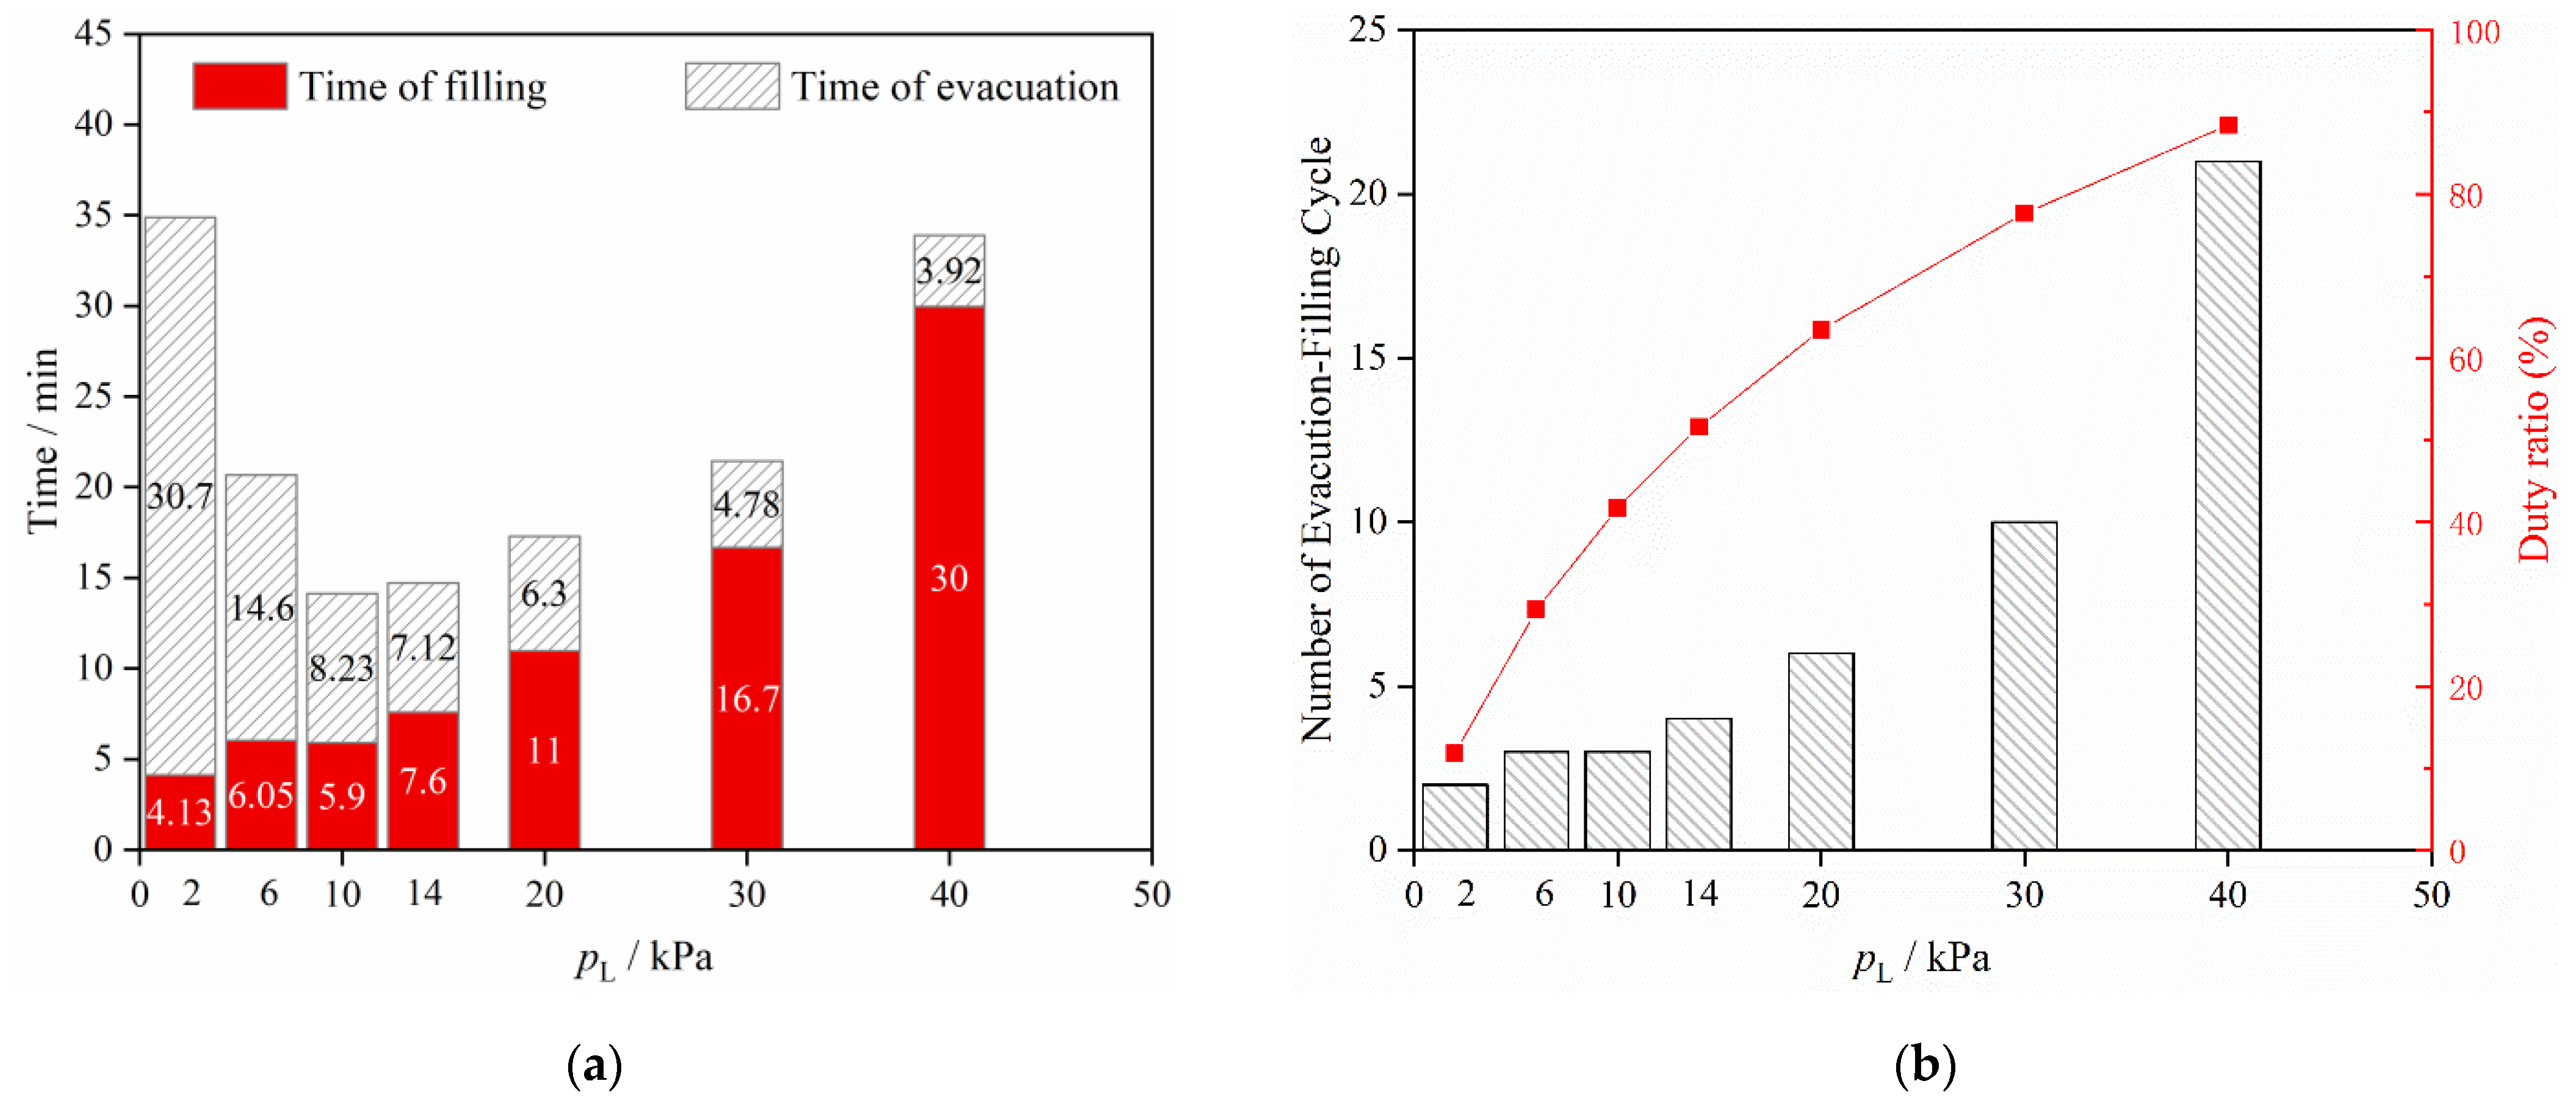
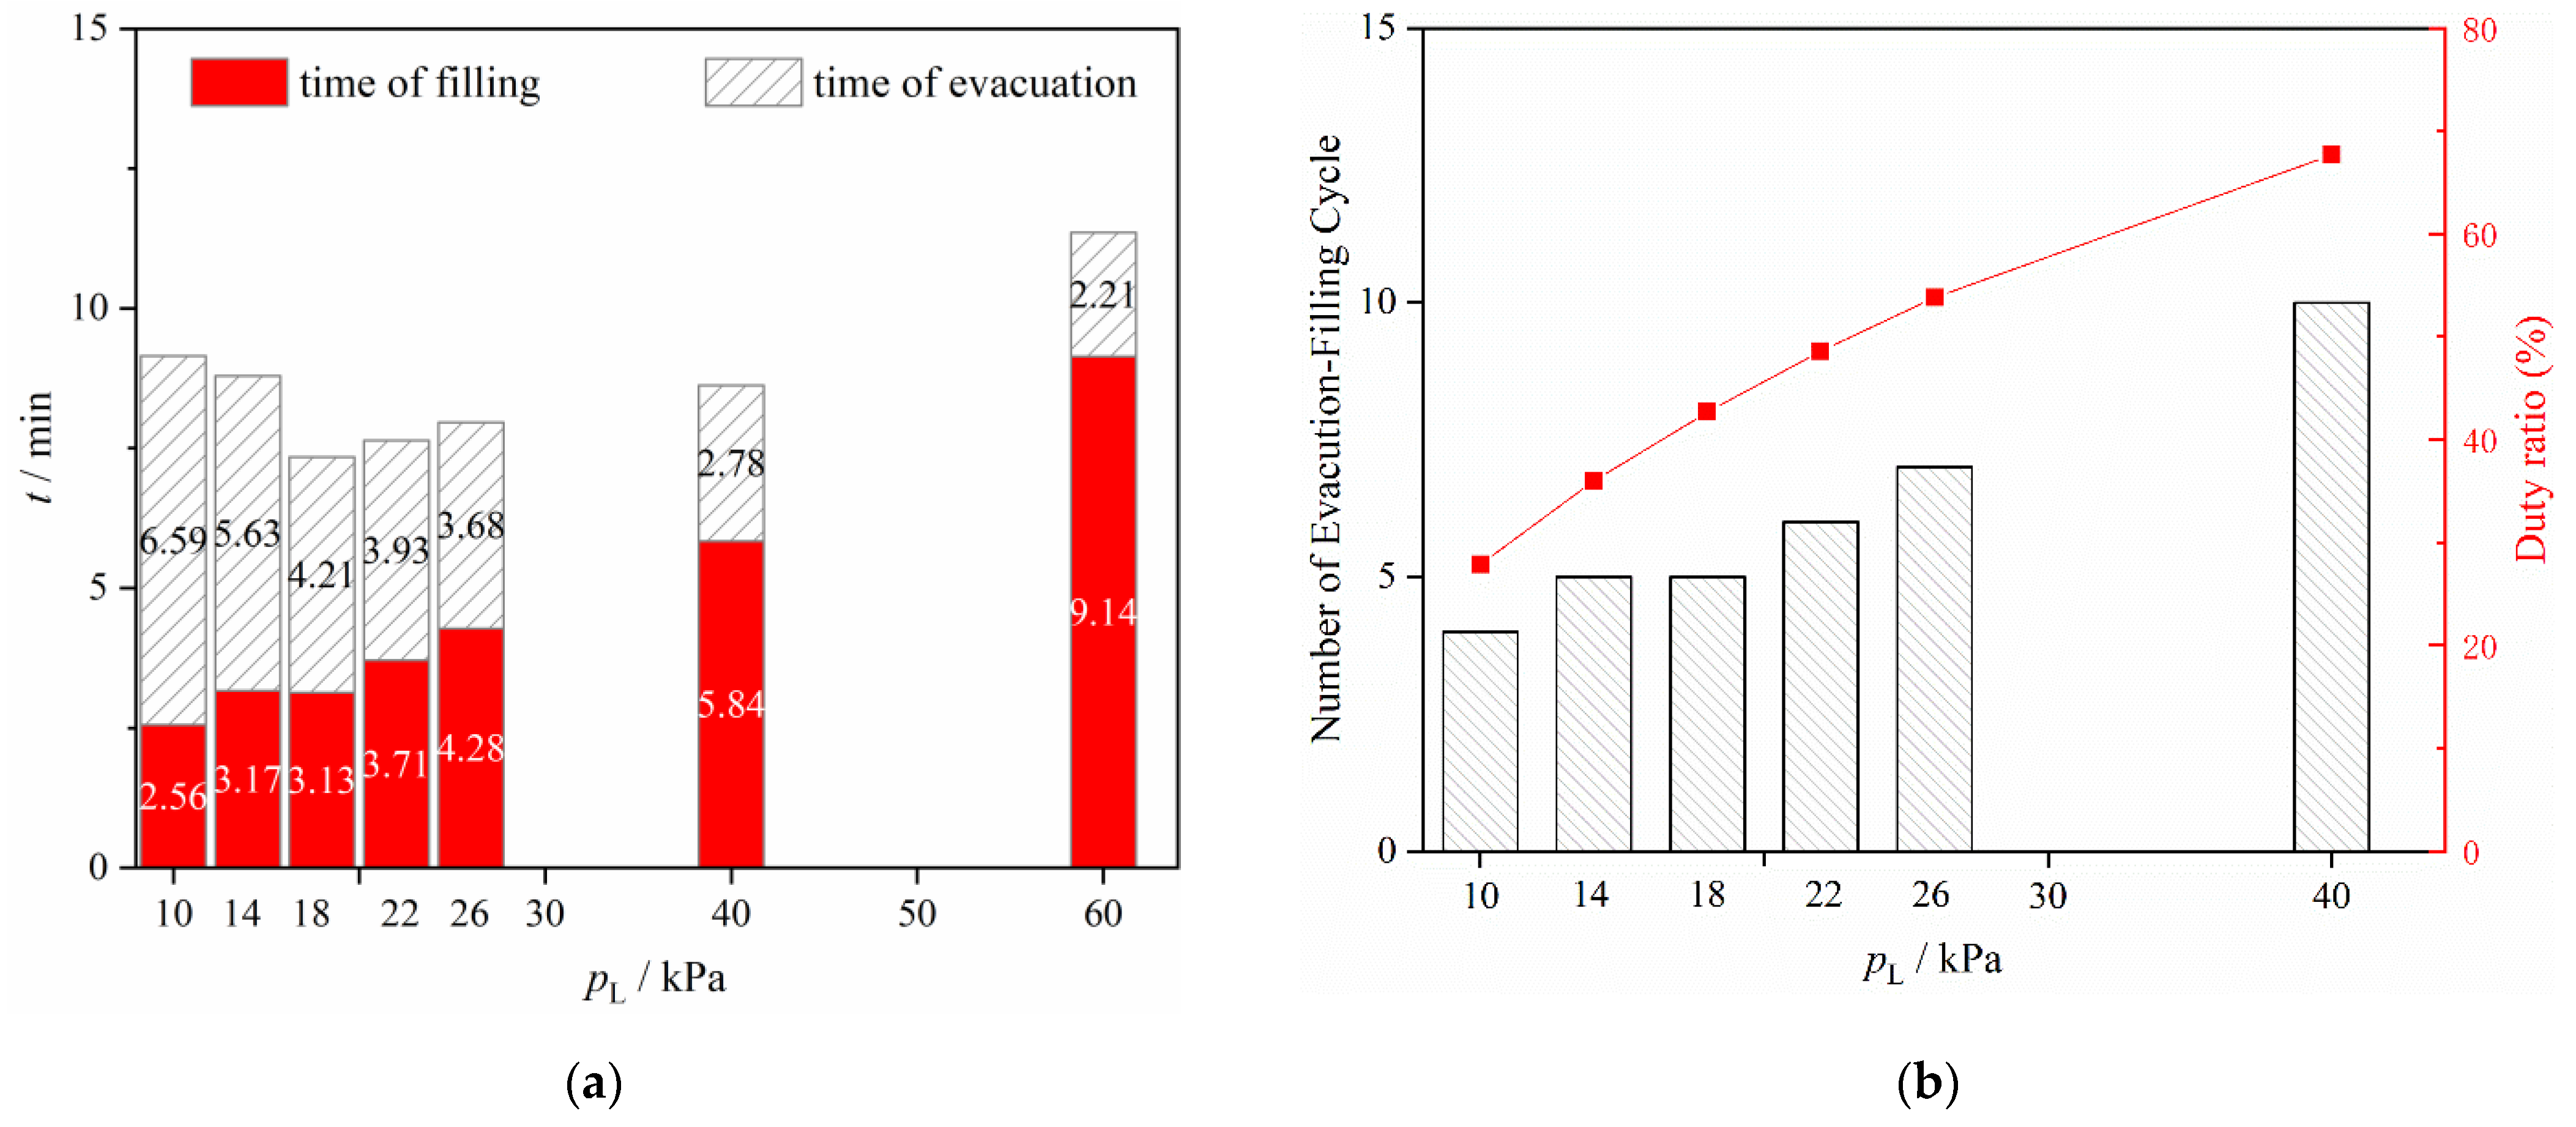
The residual air concentration drops step by step as the evacuation–filling periods proceed in sequence. Low evacuation pressures help to achieve large concentration decreases within one period and require fewer evacuation–filling operations, but in the meantime, extend the evacuation time significantly.
(3)
An appropriate cycle trough pressure is critical to the purging cycle in quickly lowering the residual gas to the required level. For both the hohlraum and capsule, the shortest purging time falls in the pressure range of around 20% of the filling pressure, where the evacuation and filling times are almost evenly balanced.

Author Contributions

Conceptualization, C.L.; methodology, C.L.; software, C.L.; validation, Z.F.; investigation, S.Y. and H.W.; writing—original draft preparation, S.Y.; writing—review and editing, C.L.; supervision, Y.L.; project administration, Y.L.; funding acquisition, C.L. and Y.L. All authors have read and agreed to the published version of the manuscript.

Funding

This study was supported by the National Natural Science Foundation of China (Grant No. 52176021) and the Fundamental Research Funds for the Central Universities.

Data Availability Statement

Data are contained within the article.

Conflicts of Interest

The authors declare no conflicts of interest.

References

  1. Bustreo, C.; Giuliani, U.; Maggio, D.; Zollino, G. How fusion power can contribute to a fully decarbonized European power mix after 2050. Fusion Eng. Design 2019, 146, 2189–2193. [Google Scholar] [CrossRef]
  2. Ongena, J.; Oost, G.V. Energy for future centuries: Will fusion be an inexhaustible, safe, and clean energy source? Fusion Sci. Technol. 2004, 45, 3–14. [Google Scholar] [CrossRef]
  3. Chapman, I.; Morris, A. UKAEA capabilities to address the challenges on the path to delivering fusion power. Philos. Trans. R. Soc. A 2019, 377, 20170436. [Google Scholar] [CrossRef]
  4. Entler, S.; Horacek, J.; Dlouhy, T.; Dostal, V. Approximation of the economy of fusion energy. Energy 2018, 152, 489–497. [Google Scholar] [CrossRef]
  5. Haan, S.; Lindl, J.; Callahan, D.; Clark, D.; Salmonson, J.; Hammel, B.; Atherton, L.; Cook, R.; Edwards, M.; Glenzer, S. Point design targets, specifications, and requirements for the 2010 ignition campaign on the National Ignition Facility. Phys. Plasmas 2011, 18, 051001. [Google Scholar] [CrossRef]
  6. Harding, D.; Wittman, M.; Edgell, D. Considerations and requirements for providing cryogenic targets for direct-drive inertial fusion implosions at the National Ignition Facility. Fusion Sci. Technol. 2013, 63, 95–105. [Google Scholar] [CrossRef]
  7. Kozioziemski, B.; Mapoles, E.; Sater, J.; Chernov, A.; Moody, J.; Lugten, J.; Johnson, M. Deuterium-tritium fuel layer formation for the National Ignition Facility. Fusion Sci. Technol. 2011, 59, 14–25. [Google Scholar] [CrossRef]
  8. Parham, T.; Kozioziemski, B.; Atkinson, D.; Baisden, P.; Bertolini, L.; Boehm, K.; Chernov, A.; Coffee, K.; Coffield, F.; Dylla-Spears, R. Cryogenic target system for hydrogen layering. Fusion Sci. Technol. 2016, 69, 407–419. [Google Scholar] [CrossRef]
  9. Baxamusa, S.; Field, J.; Dylla-Spears, R.; Kozioziemski, B.; Suratwala, T.; Sater, J. Effects of self-heating and phase change on the thermal profile of hydrogen isotopes in confined geometries. J. Appl. Phys. 2014, 115, 124901. [Google Scholar] [CrossRef]
  10. Yang, H.; Tao, C.; Gao, S.; Wang, K.; Qi, X.; Jiang, B.; Xie, J.; Liang, J.; Zhang, H.; Li, G. Predicting spherical symmetry degeneration of non-infrared deuterium ice layer in a cryogenic capsule. Nucl. Fusion 2020, 60, 026010. [Google Scholar] [CrossRef]
  11. Xin, Y.; Li, Y.; Ding, L.; Li, C. Numerical Investigations on Temperature Distribution of Spherical Hohlraum Cryogenic Target under Radiation Condition. At. Energy Sci. Technol. 2019, 53, 102. [Google Scholar]
  12. Haan, S.; Salmonson, J.; Clark, D.; Ho, D.; Hammel, B.; Callahan, D.; Cerjan, C.; Edwards, M.; Hatchett, S.; Landen, O. NIF ignition target requirements, margins, and uncertainties: Status February 2010. Fusion Sci. Technol. 2011, 59, 1–7. [Google Scholar] [CrossRef]
  13. Yang, H.; Du, K.; Lei, H.; Qi, X.; Jiang, B.; Zhang, H.; Wu, W.; Zhang, J.; Wang, K.; Lin, W. Mechanical design and analysis of an indirect-drive cryogenic target. J. Fusion Energy 2016, 35, 673–682. [Google Scholar] [CrossRef]
  14. Wang, M.; Li, Z. Simulations for gas flows in microgeometries using the direct simulation Monte Carlo method. Int. J. Heat Fluid Flow 2004, 25, 975–985. [Google Scholar] [CrossRef]
  15. White, C.; Borg, M.K.; Scanlon, T.J.; Reese, J.M. A DSMC investigation of gas flows in micro-channels with bends. Comput. Fluids 2013, 71, 261–271. [Google Scholar] [CrossRef]
  16. Taassob, A.; Kamali, R.; Bordbar, A. Investigation of rarefied gas flow through bended microchannels. Vacuum 2018, 151, 197–204. [Google Scholar] [CrossRef]
  17. Agrawal, A.; Djenidi, L.; Agrawal, A. Simulation of gas flow in microchannels with a single 90 bend. Comput. Fluids 2009, 38, 1629–1637. [Google Scholar] [CrossRef]
  18. Ahangar, E.K.; Ayani, M.B.; Esfahani, J.A.; Kim, K.C. Lattice Boltzmann simulation of diluted gas flow inside irregular shape microchannel by two relaxation times on the basis of wall function approach. Vacuum 2020, 173, 109104. [Google Scholar] [CrossRef]
  19. Zhang, L.; Liu, X.; Zhao, Y.; Zhou, Y.; Shan, B. Effect of pore throat structure on micro-scale seepage characteristics of tight gas reservoirs. Nat. Gas Ind. B 2020, 7, 160–167. [Google Scholar] [CrossRef]
  20. Suo, X.; Wang, Q.; Luo, L. The influence of compressibility and thinness on gas flow and heat transfer in microchannels. J. Eng. Thermophys. 2005, 4, 659–661. (In Chinese) [Google Scholar]
  21. Croce, G.; Rovenskaya, O. Three dimensional effects in compressible, rarefied gas flow in bent microchannels. Int. J. Microscale Nanoscale Therm. Fluid Transp. Phenom. 2012, 3, 31–48. [Google Scholar]
  22. Rovenskaya, O. Computational study of 3D rarefied gas flow in microchannel with 90 bend. Eur. J. Mech.-B/Fluids 2016, 59, 7–17. [Google Scholar] [CrossRef]
  23. Struchtrup, H. Maxwell boundary condition and velocity dependent accommodation coefficient. Phys. Fluids 2013, 25, 112001. [Google Scholar] [CrossRef]
  24. Choi, Y.J.; Kwon, O.J. Numerical study of effects of accommodation coefficients on slip phenomena. J. Mech. Sci. Technol. 2015, 29, 1883–1888. [Google Scholar] [CrossRef]
  25. Myong, R. Gaseous slip models based on the Langmuir adsorption isotherm. Phys. Fluids 2004, 16, 104–117. [Google Scholar] [CrossRef]
  26. Lockerby, D.A.; Reese, J.M.; Emerson, D.R.; Barber, R.W. Velocity boundary condition at solid walls in rarefied gas calculations. Phys. Rev. E 2004, 70, 017303. [Google Scholar] [CrossRef] [PubMed]
  27. Stevanovic, N.D. A new analytical solution of microchannel gas flow. J. Micromech. Microeng. 2007, 17, 1695. [Google Scholar] [CrossRef]
  28. Das, S.K.; Tahmouresi, F. Analytical solution of fully developed gaseous slip flow in elliptic microchannel. Int. J. Adv. Appl. Math. Mech. 2016, 3, 1–15. [Google Scholar]
  29. Kurkin, E.I.; Samsonov, V.N.; Shakhov, V.G. Simulation of rarefied gas flows in microchannels. Procedia Eng. 2017, 185, 160–167. [Google Scholar] [CrossRef]
  30. Dongari, N.; Agrawal, A.; Agrawal, A. Analytical solution of gaseous slip flow in long microchannels. Int. J. Heat Mass Transf. 2007, 50, 3411–3421. [Google Scholar] [CrossRef]
  31. Zhang, W.; Samtaney, R. Low-Re flow past an isolated cylinder with rounded corners. Comput. Fluids 2016, 136, 384–401. [Google Scholar] [CrossRef]
  32. Shi, L.; Yang, G.; Yao, S. Large eddy simulation of flow past a square cylinder with rounded leading corners: A comparison of 2D and 3D approaches. J. Mech. Sci. Technol. 2018, 32, 2671–2680. [Google Scholar] [CrossRef]
  33. Cravero, C.; De Domenico, D.; Marsano, D. Uncertainty Quantification Analysis of Exhaust Gas Plume in a Crosswind. Energies 2023, 16, 3549. [Google Scholar] [CrossRef]
  34. Bhandarkar, S.; Parham, T.; Fair, J. Modeling and experiments of compressible gas flow through microcapillary fill tubes on NIF targets. Fusion Sci. Technol. 2011, 59, 51–57. [Google Scholar] [CrossRef]
  35. Wei, L.; Kai, W.; Jun, L.; Yuanqiong, L.; Yongjian, T.; Haile, L. Effect of filling rates on preparation of planar cryotargets. High Power Lasers Part. Beams 2013, 25, 3243–3246. (In Chinese) [Google Scholar]
  36. Yu, C.; Wu, S.; Yang, W. Theoretical investigation of gas filling and leaking in inertial confinement fusion hohlraum. Sustainability 2018, 10, 3763. [Google Scholar] [CrossRef]
  37. Wu, L.; Zhou, H.; Yu, C.; Yao, F. Simulation of the Gas Filling and Evacuation Processes in an Inertial Confinement Fusion (ICF) Hohlraum. Processes 2019, 7, 269. [Google Scholar] [CrossRef]
  38. Guo, F.-C.; Li, C.; Chen, X.; Li, Y.-Z. Numerical Simulation and Analysis of Helium Filling Process in Cryogenic Target Hohlraum. J. Xi‘an Jiaotong Univ. 2019, 53, 79–84. (In Chinese) [Google Scholar]
  39. Zou, X.; Qi, X.-B.; Zhang, T.-X.; Gao, Z.-F.; Huang, W.-X. Numerical simulation of filling and evacuating process of impurity gas in target capsule of inertial confinement fusion. Acta Phys. Sin. 2021, 70, 075207. [Google Scholar] [CrossRef]
  40. Shao, X.-Y.; Pu, L.; Li, Q.; Li, Y.-Z. Numerical investigation of flammable cloud on liquid hydrogen spill under various weather conditions. Int. J. Hydrog. Energy 2018, 43, 5249–5260. [Google Scholar] [CrossRef]
Figure 1. Typical indirect-drive ICF target configuration from National Ignition Facility [5,6]: (a) Laser beams (blueish violet) enter the hohlraum through laser entrance holes at various angles; (b) Schematic of fuel capsule. (c) The temporal laser power pulse-shape (blue) and associated hohlraum radiation temperature (red); (d) The capsule at the center of the hohlraum is bathed in X-rays, which ablate the capsule shell. The pressure generated implodes the capsule, compressing and heating the DT fuel.
Processes 12 01050 g001
Figure 2. Schematic cross section of the ICF cryogenic target and the monitoring points of gas composition: (a) hohlraum and (b) capsule.
Processes 12 01050 g002
Figure 3. Results from continuous and non-continuous flow models compared to the experimental data for air: (a) the evacuating and filling process; (b) the evacuating process.
Processes 12 01050 g003
Figure 4. Results from continuous and non-continuous flow models compared to the experimental data for helium: (a) the evacuation process; (b) the filling process.
Processes 12 01050 g004
Figure 5. The variation in gas components in the hohlraum during the filling process: (a) the contour of the helium concentration; (b) the mole fraction curves of He at different monitoring points.
Processes 12 01050 g005
Figure 6. The mole fraction curves of D2 at different monitoring points in the capsule.
Processes 12 01050 g006
Figure 7. Pressure histories and required time for different microtube lengths during a single evacuation–filling period of hohlraum: (a) the evacuation process; (b) the filling process.
Processes 12 01050 g007
Figure 8. Pressure histories and required time for different microtube inner diameters during a single evacuation–filling period of hohlraum: (a) the evacuation process; (b) the filling process.
Processes 12 01050 g008
Figure 9. Composite microtube forms (unit: mm).
Processes 12 01050 g009
Figure 10. Curves of pressure and evacuation or filling time in the hohlraum for different microtube forms during a single filling–evacuating period: (a) the evacuation process; (b) the filling process.
Processes 12 01050 g010
Figure 11. Variations in pressure and air concentration in the hohlraum at different pL values.
Processes 12 01050 g011
Figure 12. Dependency of evacuation–filling efficiency on pL: (a) the required time for purging, and (b) the cycle number and duty ratio.
Processes 12 01050 g012
Figure 13. Dependency of evacuation–filling efficiency on pL for capsule: (a) the required time for purging, and (b) the cycle number and duty ratio.
Processes 12 01050 g013
Disclaimer/Publisher’s Note: The statements, opinions and data contained in all publications are solely those of the individual author(s) and contributor(s) and not of MDPI and/or the editor(s). MDPI and/or the editor(s) disclaim responsibility for any injury to people or property resulting from any ideas, methods, instructions or products referred to in the content.

