Article

Analysis of the Processes of Paraffin Deposition of Oil from the Kumkol Group of Fields in Kazakhstan

1
Geology and Oil-Gas Business Institute Named after K. Turyssov, Kazakh National Technical University after K.I. Satpayev, 22 Satpaev Str., Almaty 050013, Kazakhstan
2
Department of Oil and Petrochemistry, Kazan National Research Technological University, 68, K.Marksst., Kazan 420015, Russia
3
Kazenergy Association, Astana 010000, Kazakhstan
4
School of Pharmacy, JSC “S.D. Asfendiyarov Kazakh National Medical University”, Almaty 050000, Kazakhstan
*
Author to whom correspondence should be addressed.
Processes 2024, 12(6), 1052; https://doi.org/10.3390/pr12061052
Submission received: 8 April 2024 / Revised: 10 May 2024 / Accepted: 16 May 2024 / Published: 21 May 2024
(This article belongs to the Section Chemical Processes and Systems)

Abstract

:
The oil pipeline transportation of highly waxy oils when it is cold is accompanied by the deposition of paraffins in the inner surface of the pipeline. This study of the initial properties of the oil; the composition, structure, and nature of the components of normal alkanes in oil; and their influence on the aggregative stability of the resulting system makes it possible to find the best solutions to optimize the conditions of oil transportation with the lowest energy costs. This study shows that, according to the content of solid paraffin (14.0–16.2%), the oils of the Kumkol group of fields in Kazakhstan are highly waxy. They are characterized by high yield loss temperature values (+9–+12 °C), which also correlate with the values of the rheological parameters (τ0 1.389 Pa, 3.564 Pa). The influence of the temperature and shear rate on the shear stress and effective viscosity of the initial oils was studied. At temperatures below 20 °C, depending on the shear rate, there is an increase in the effective viscosity values (0.020 Pa∙s, 0.351 Pa∙s). The influence of the nature of solid hydrocarbons on the parameters of the paraffinization process and of the intensity of the paraffinization of the metal surfaces was studied. Our study shows that the main share of n-alkanes in the Kumkol and Akshabulak oils falls on paraffins of the C15–C44 group. The greater the temperature difference between the oil and the cold steel surface (≤40 °C), the lesser the amount of asphalt–resin–paraffin deposits (ARPDs) that fall out on the surface of the rod, although the content of long-chain paraffins prevails in these ARPDs. At the same time, the consistency of the released asphalt–resin–paraffin deposits (ARPDs) becomes denser, which makes their mechanical removal more difficult. Furthermore, the results of this study of the cooling rate shows that the rapid cooling of oils leads to the formation of a large number of crystallization centers, which leads to an increase in the values of the yield loss temperature and kinematic viscosity of the oils.

1. Introduction

ARPDs are one of the problems causing complications in the operation of pipeline communications during oil transportation. The accumulation of asphalt–resin–paraffin deposits (ARPDs) on the inner surface of pipes leads to the narrowing of the cross section of the pipeline and, as a consequence, to a decrease in productivity (in some cases up to a complete cessation of pumping) [1,2,3]. The cause of paraffin deposition is the gradual crystallization of long-chain n-alkanes when the temperature of the paraffinic oil decreases. In addition, the factors influencing the formation of asphalt–resin–paraffin deposits (ARPDs) include the route profile, the flow velocity, pressure drops in the oil flow, and the aggregative stability of the oil mixture. One of the promising methods of control, widely used nowadays, is a method that uses chemical reagents, which are inhibitors of asphalt–resin–paraffin deposits (ARPDs). One part of the inhibitor molecules is related to petroleum paraffin hydrocarbons and the other part contains polar groups. The inhibiting additives convert oil deposits into a suspended state and hold fine particles in solution, preventing aggregation and settling [4]. The adsorption of the additive on the surface of the dispersed particle prevents the further aggregation of paraffins in the solution [5,6,7]. In oil, the released paraffins are crystalline and, as a rule, crystallize from oil at temperatures below the pour point temperature [5]. The structuring process in an oil system can be described by several parameters: the crystallization onset temperature, the mass crystallization onset temperature, and the formation of a strong crystal lattice [8]. It is these parameters that often serve as the basis for describing the low-temperature properties of an oil system. Due to the fact that oil is a complex, multi-component, dispersive system, any phase transition is the result of many factors, such as physicochemical composition, thermodynamic conditions, and external influences. The greatest influence on the aggregative stability of the oil dispersion system is exerted by normal alkanes with a high molecular weight [9], which, under the action of dispersion forces [10,11], form groups or swarms of molecules oriented parallel to each other at temperatures much higher than the crystallization onset temperature. This arrangement greatly facilitates the appearance of nuclei and further structural transformations in the system.
When analyzing the problems of paraffin deposition in the pipeline for the studied oil, it is necessary to take into account the concentration of n-paraffins; the carbon number distribution; the concentration of branched paraffins, naphthenes, and aromatics; the concentration of resins and asphaltenes; and the temperature regimes [12]. While the first, second, and fifth factors will help us predict the potential for wax (macrocrystalline) deposition, the remaining factors indicate that the magnitude of the problem is moderate. The ability to determine the degree of wax deposition is an extremely important issue for the oil industry. Unfortunately, wax deposition is a complex process, the mechanism of which is not fully understood. In addition, although significant progress has been made in understanding this complex process over the past few decades, the ability to accurately account for all factors affecting deposition is currently lacking the wax deposition simulators that are used in the industry [13]. This paper examines the influence of factors such as the concentration of n-paraffins and the temperature and oil cooling rate during the deposition process. The influence of these factors is illustrated by the results of cold finger experiments and rheological parameter studies, which are often used as a simple means of approximating the deposition process in flow lines [14]. How they affect the amount and nature of sediments formed from oil from the Kumkol group of fields is shown. Although the results are not a direct reflection of in-line deposition data, they provide a reasonably comprehensive set of illustrative examples of how deposition can vary depending on the conditions. Oil producers can use thermal, chemical, or mechanical methods to prevent or eliminate wax deposition. To select the best method, it is important to understand how different wax deposition test methods can best generate the most field-like wax deposition conditions.
The purpose of this paper is to study the initial physicochemical and rheological properties of oil, the structure and nature of normal alkanes in oil, and their influence on the aggregative stability of the resulting system [11,15] under laboratory conditions to predict the closest approximation to field conditions for wax deposition.

2. Materials and Methods

2.1. Oil Density

The oil density was determined using oil areometers in thermostated cylinders for the density measurement from Technoglass (Nordwijkerhout, The Netherlands) [16]. A sample of the test oil was placed in a cylinder, and the sample temperature was brought to the specified value. The appropriate thermometer and areometer were immersed in the test sample. After a temperature equilibrium was reached, the areometer scale was read, and the temperature of the test sample was noted. The thermometer was read to the nearest 0.1 °C. The observed areometer reading was corrected for the meniscus (+0.7) and the thermal expansion of the areometer glass and brought to a standard temperature of 20 °C.

2.2. Extraction of Paraffins, Asphaltenes, and Resins

The extraction of paraffins, asphaltenes, and resins from the oil was carried out according to the methodology [17]. The essence of the method consisted in the preliminary removal of resin–asphaltene substances from the oil, the extraction and removal of resins, and the subsequent separation of paraffins with a mixture of acetone and toluene at minus 20 °C. A 3–5 g oil suspension was diluted with 40 times the volume of n-heptane and kept for 16 h for the complete precipitation of the asphaltenes. After the separation of the asphaltenes, the extraction of resins and paraffins was carried out through an adsorption column and a solution with paraffin was obtained. The desorption of resins was carried out with an alcohol–toluene mixture. The obtained filtrate was distilled from the solvent and poured into a mixture of acetone and toluene (35:65) to precipitate the paraffins into a flask. Furthermore, the precipitated paraffins were filtered under vacuum in a special cooling bath.

2.3. The Pour Point Temperature

The pour point temperature was determined using an S.D.M.-530 unit (Germany), equipped with three chambers to maintain temperatures of 0 °C, −17 °C, and −34 °C [18]. After preheating, the sample was cooled at a predetermined rate, while the flow characteristics were monitored every 3 °C. The lowest temperature that a movement of the sample was observed was recorded as the yield loss temperature. In a chamber with a temperature of 0 °C, the test tube itself was at 30 °C. If the sample did not solidify to +9 °C, the test tube was moved to a chamber with a temperature of −17 °C, then to the next chamber at a temperature of −24 °C until the sample solidified.

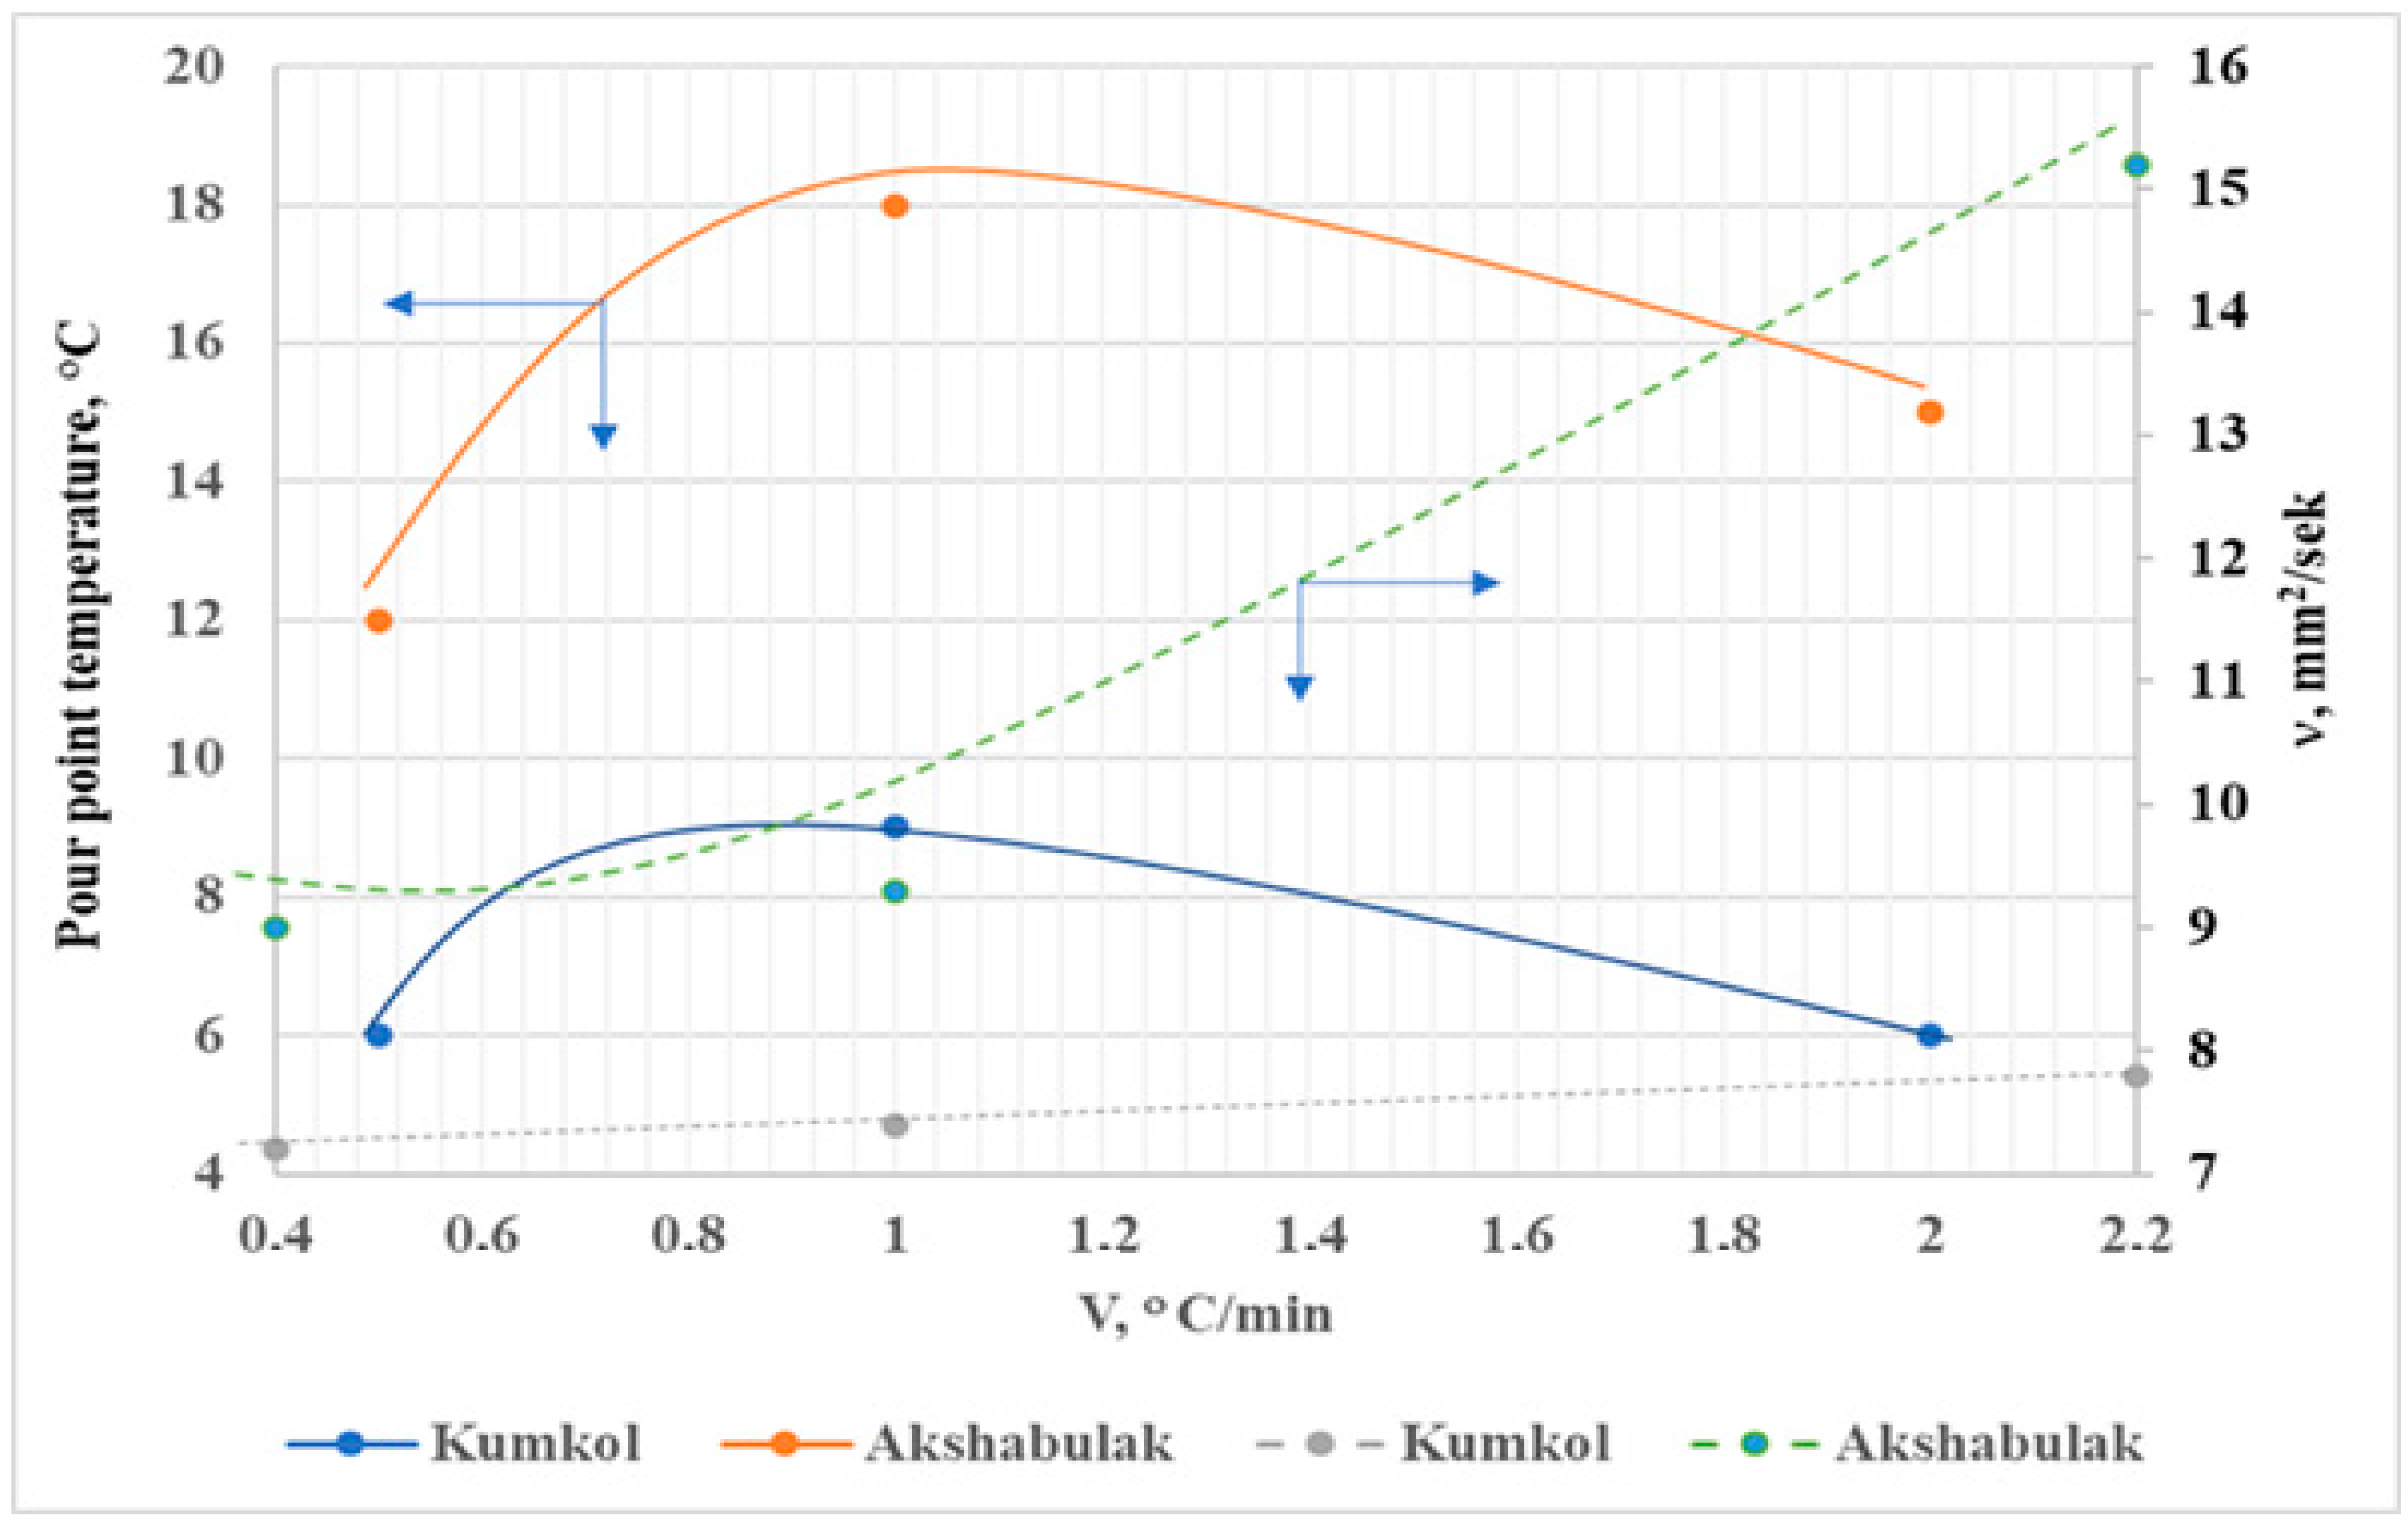
2.4. The Kinematic Viscosity

The kinematic viscosity was determined [19] using the Ubellode capillary viscometers on a Labovisco TV-2000 viscometric bath (Arnhem, The Netherlands). The viscometers, after being washed and dried, were filled with the test oil product. Then, they were set vertically in the thermostat and kept for at least 15 min. Following that, we measured the time of the oil flow between the marks. On all viscometers, several measurements of the liquid flow time were performed (at least 3–4 times). For accurate determinations of the viscosity—from 0.6 to 1000 mm2/s—the individual results of measuring the flow time of the liquid should not differ from each other by more than 0.6%.

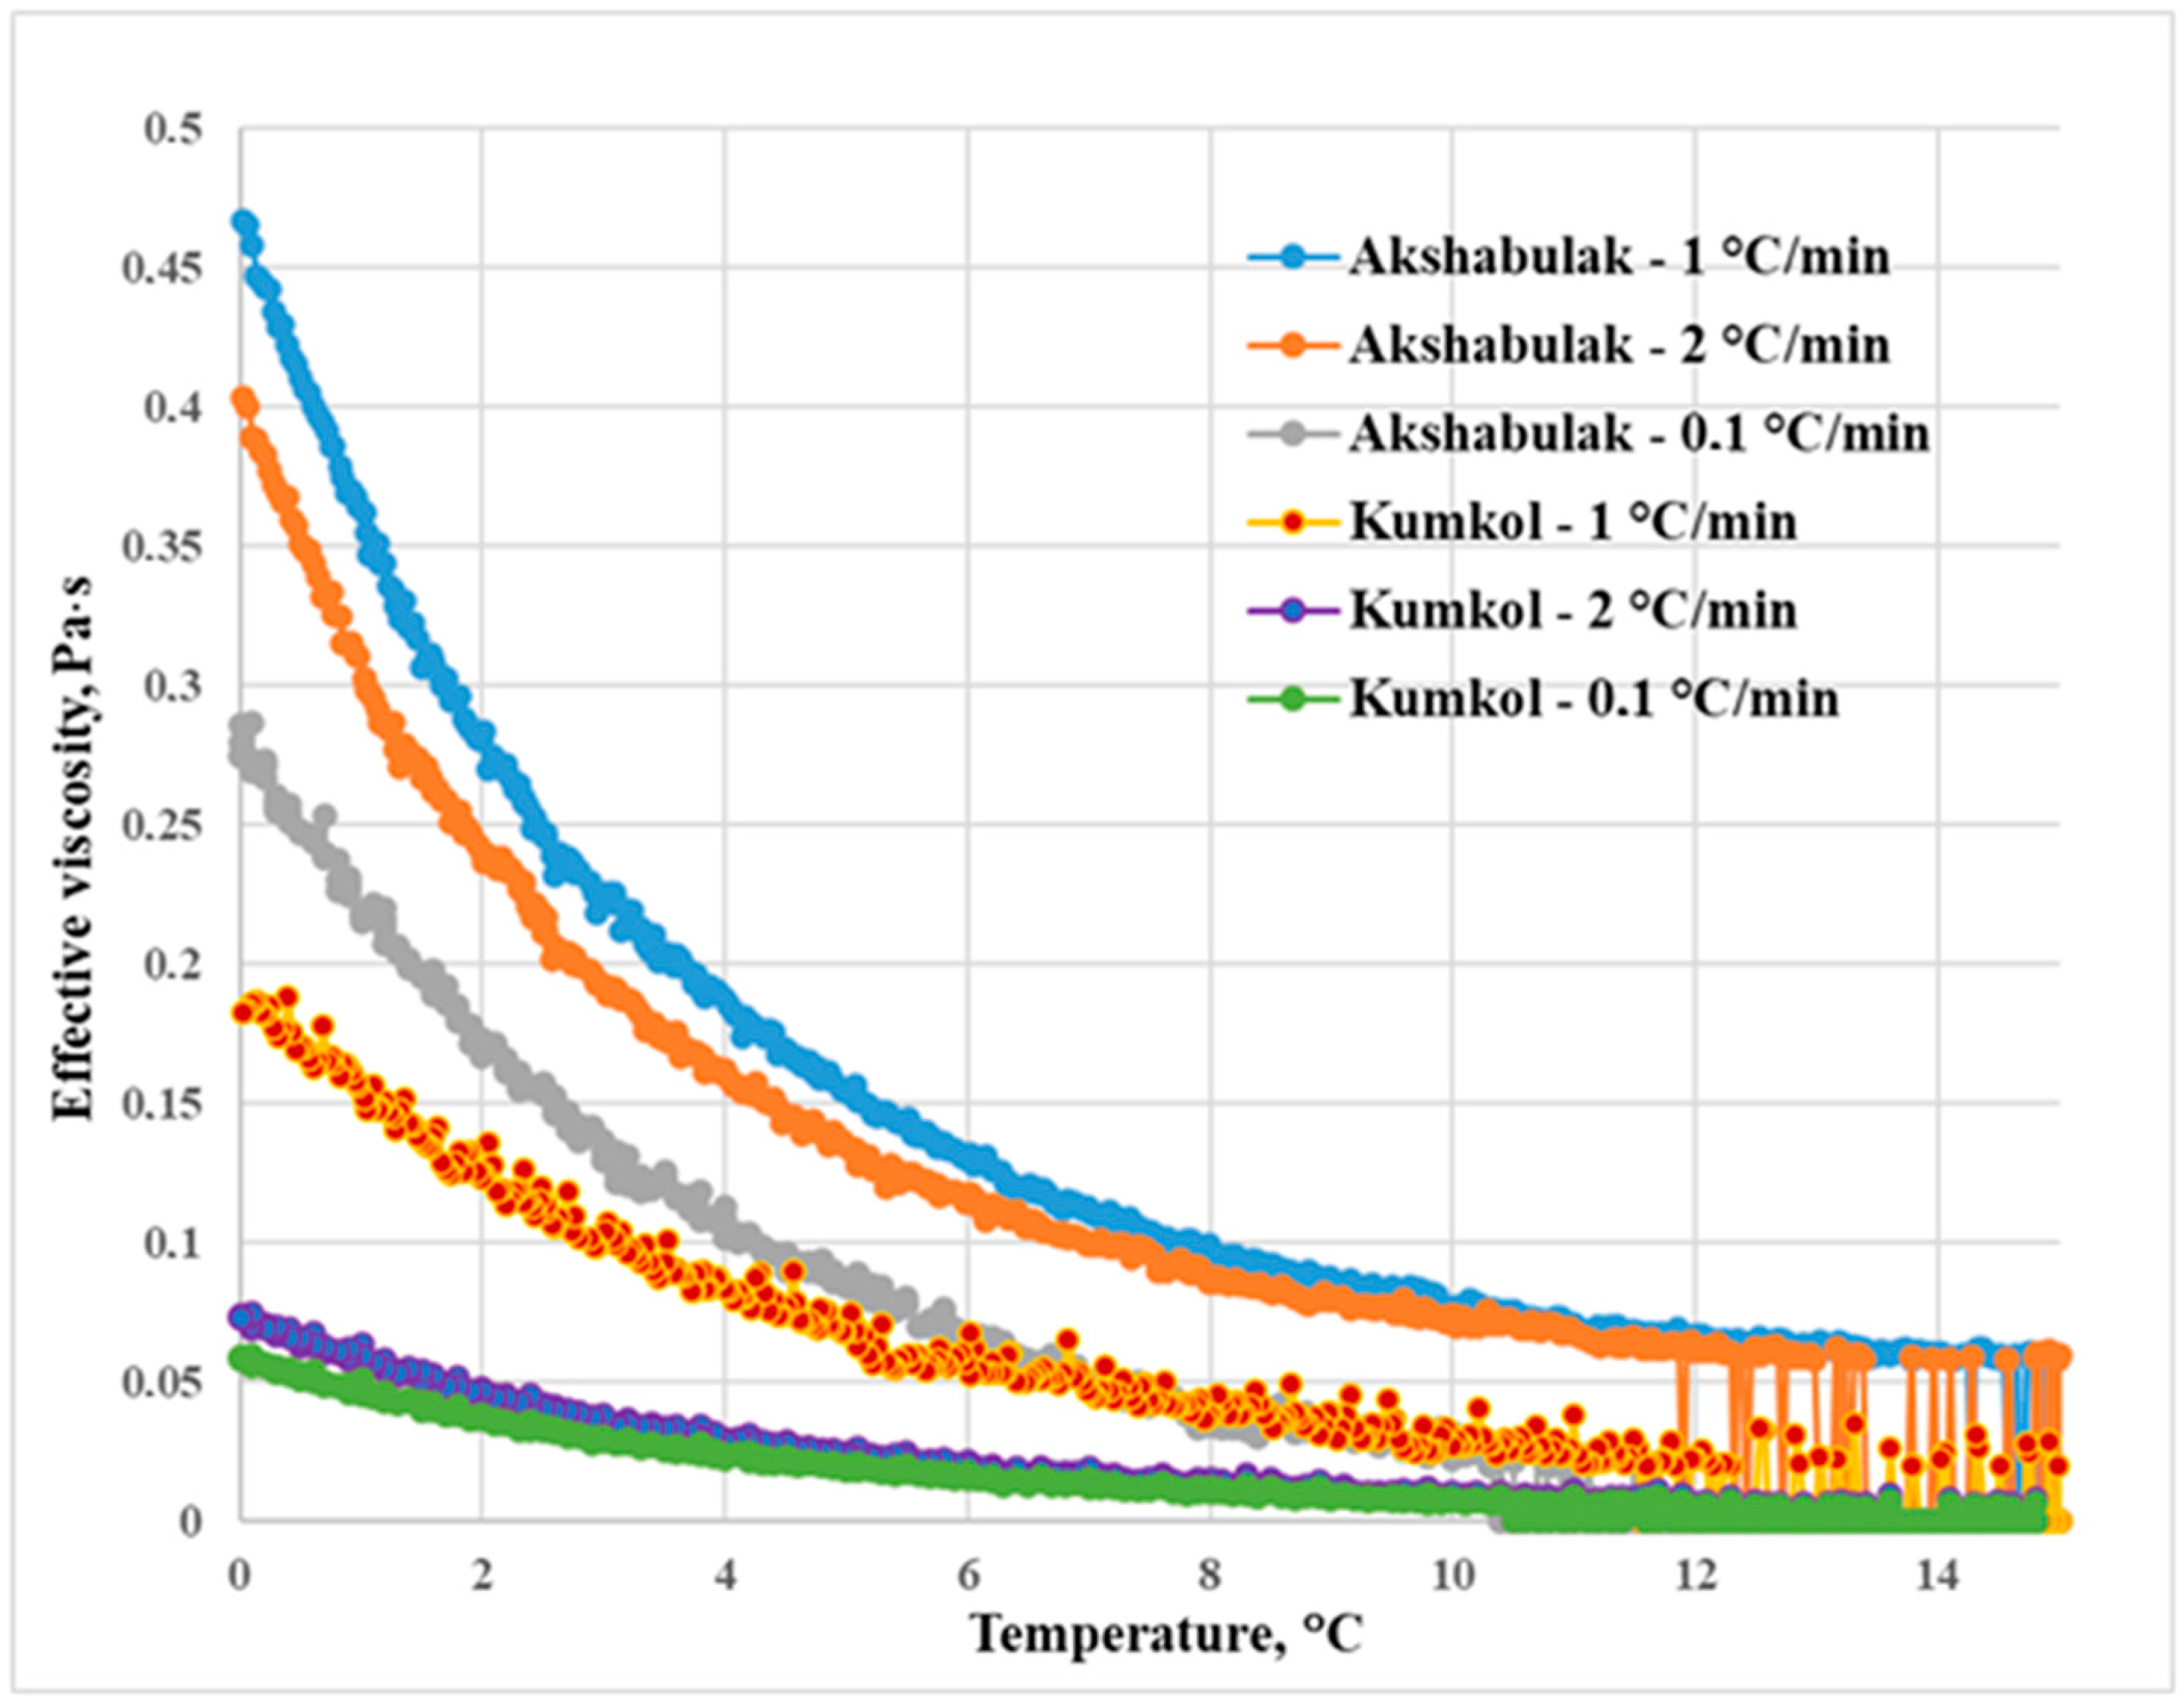
2.5. The Effective Viscosity and Shear Stress

The effective viscosity and shear stress were measured [20], using a Brookfield rotary rheometer (Middleboro, MA, USA) with a thermostated MK-CC45 (MS-CC45) cylindrical measuring system of a cylinder-to-cylinder type and a MB-CC 45 (MB-CC 48) measuring cylindrical element. The parameters (the temperature, shear rate, and measurement frequency) were controlled by a specialized computer program: RHEO 2000 (version 2.6). The measurements of the apparent (or effective) viscosity and shear stress were performed in the mode of the linear variation of the shear rate (from 0 to 100 s−1) at a constant temperature. The dynamic ultimate shear stress and yield stress were also calculated by the specialized RHEO 2000 computer program using the Bingham–Schwedow equation:
τ = τ 0 + D × η
where τ0 is the Bingham ultimate shear stress and η is the Bingham plastic viscosity (the yield strength).

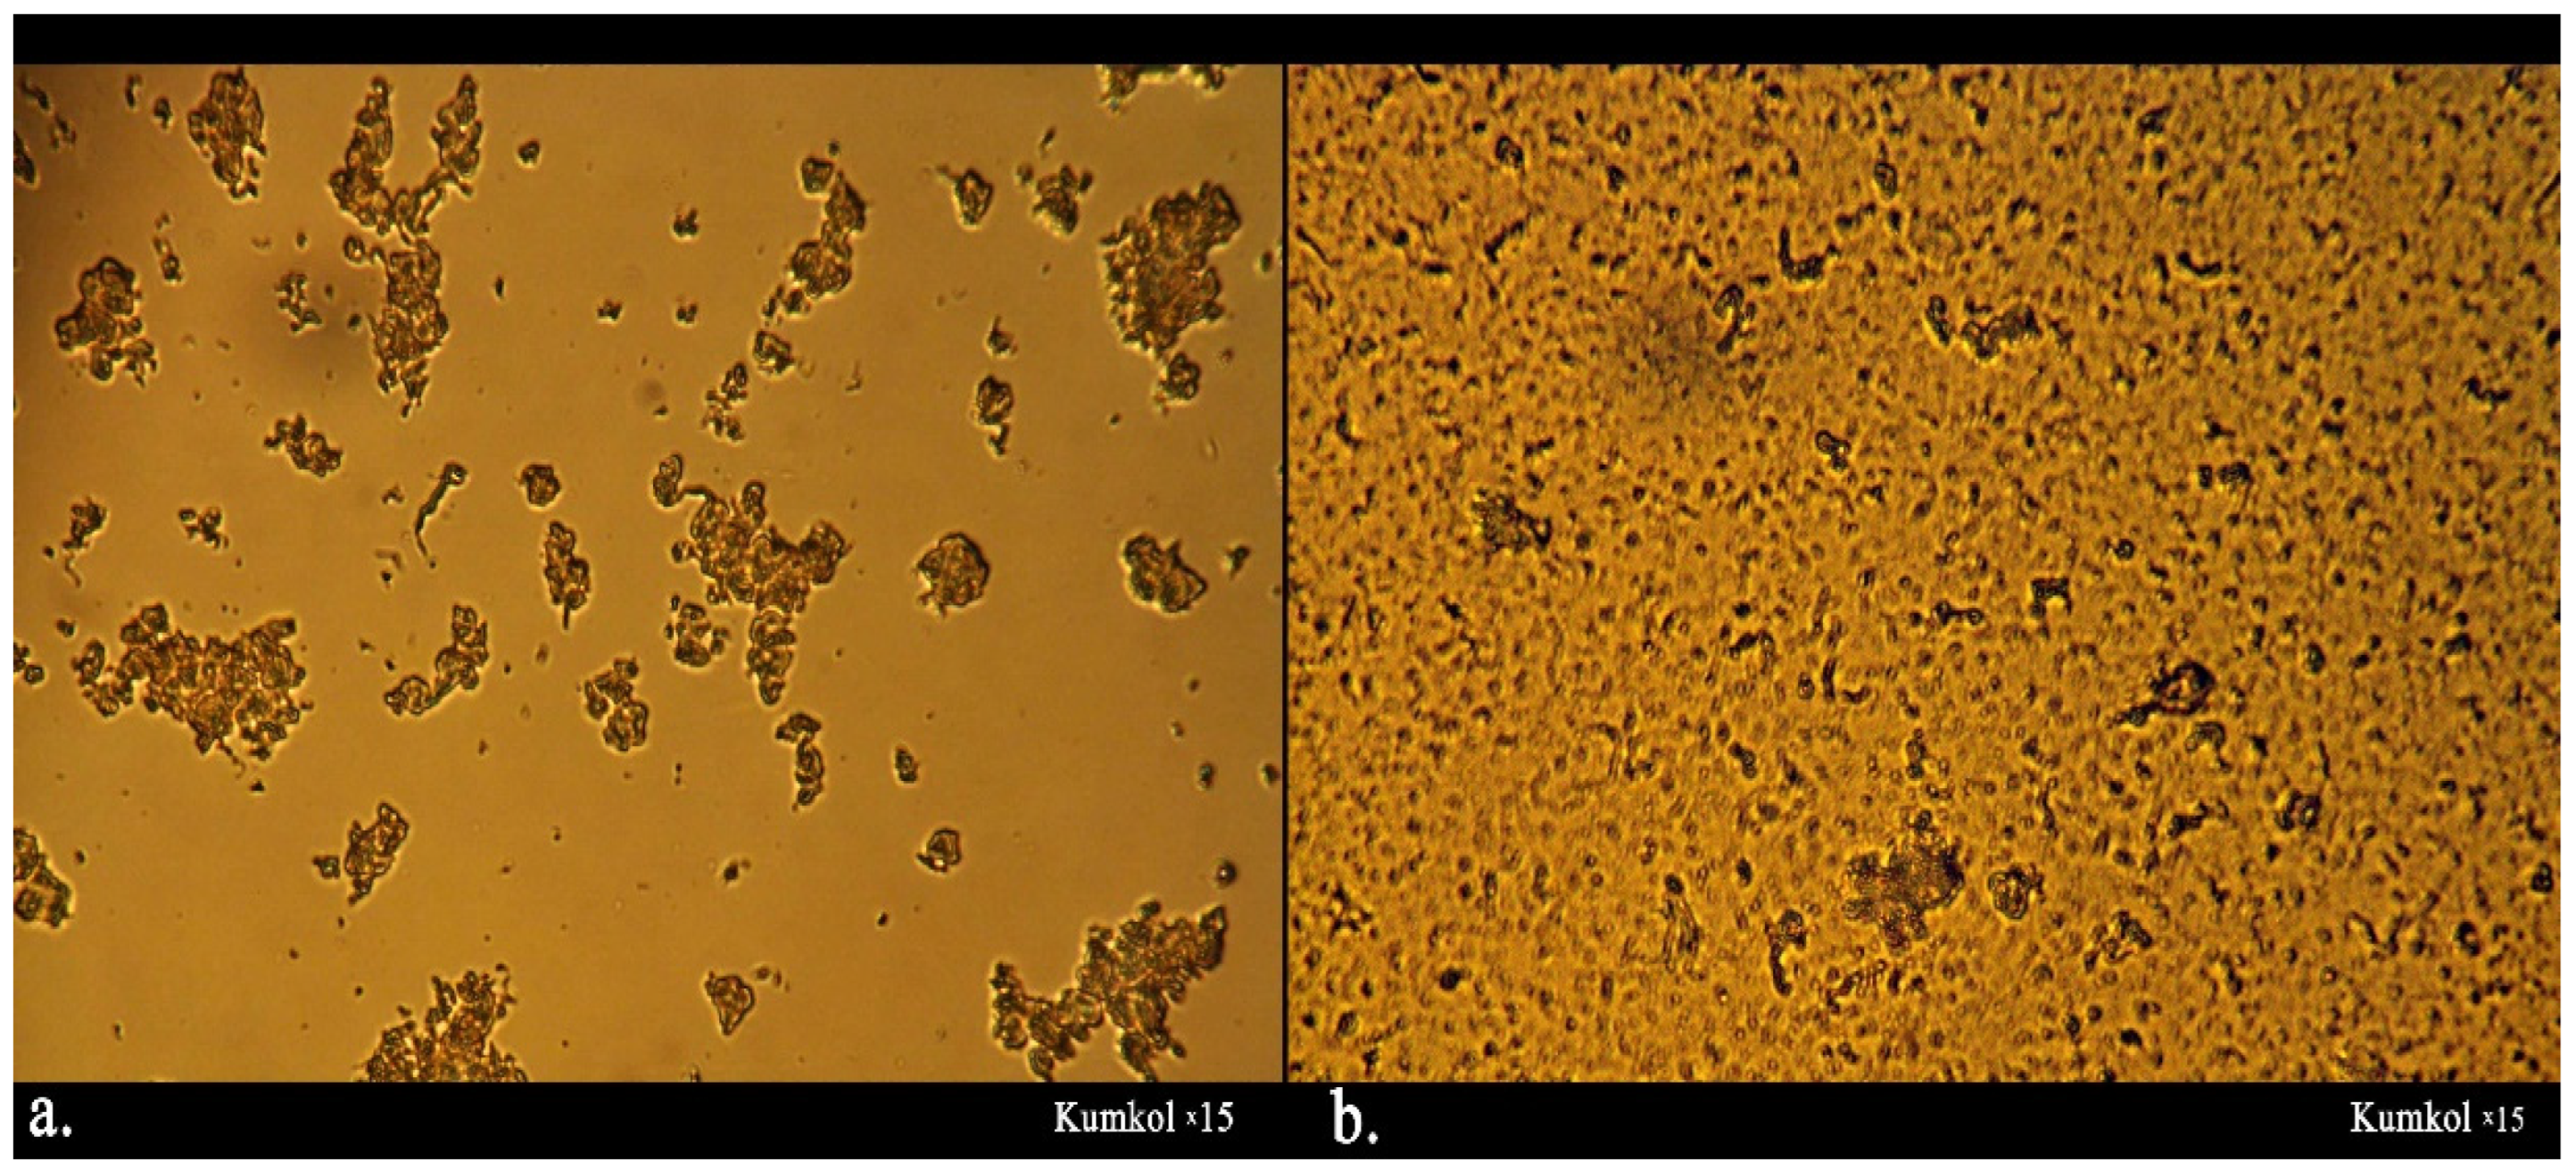
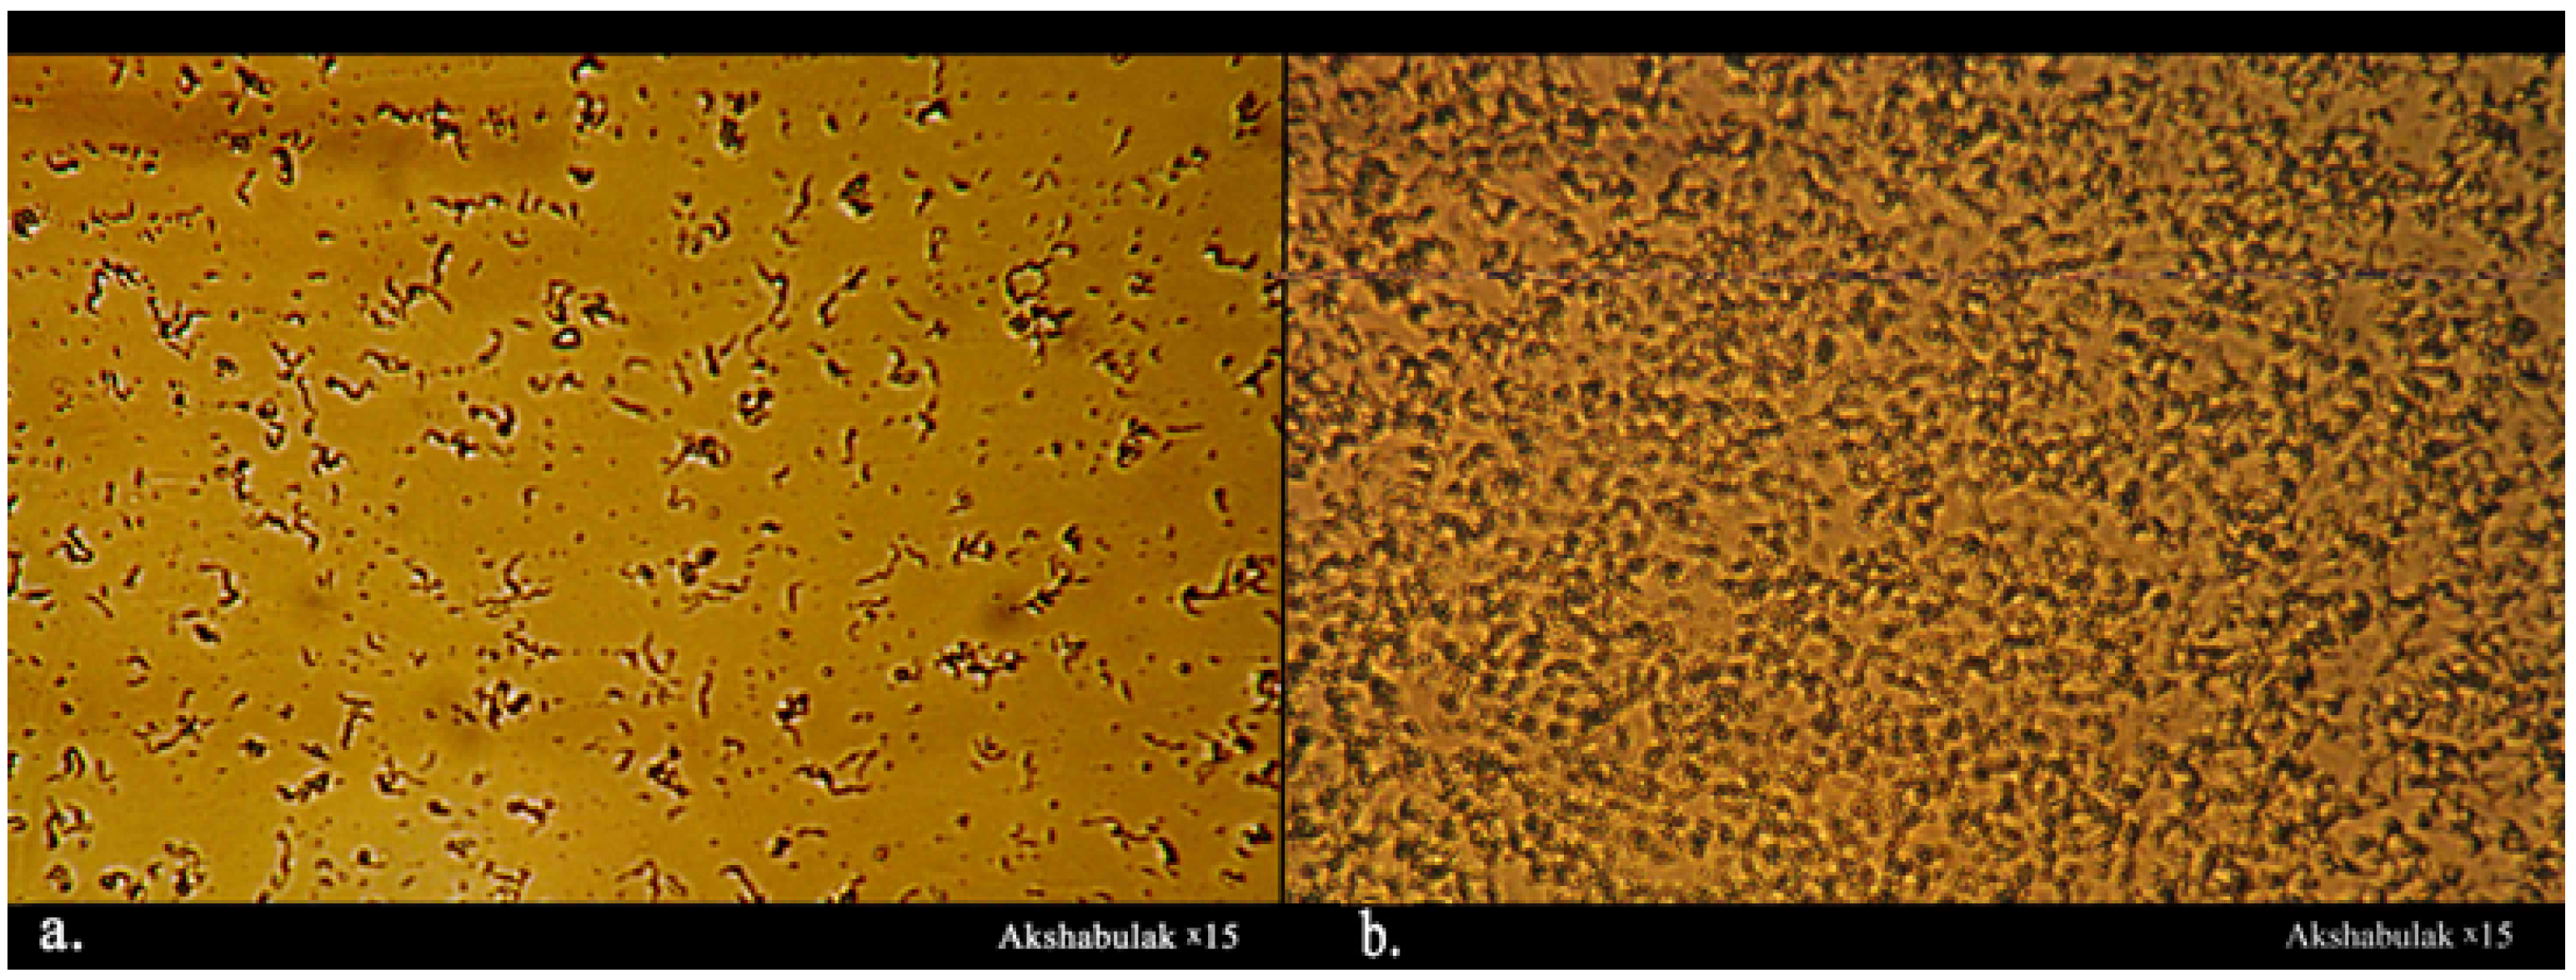
2.6. Oil Microstructure, Paraffin Melting Temperature, and the Onset of Paraffin

The crystal formations were investigated using a Linkam Hot Stage unit. The unit consisted of a Euromex polarizing microscope (Arnhem, The Netherlands) with a built-in video camera (VC 3011) controlled through a computer with the help of a special program that allowed the display of the image in the camera lens on the monitor. The oil sample was placed on a special temperature-controlled table (LTS 350). The temperature regime was controlled by the TMS 94 heating plate and the LNP cooling system, also controlled via a computer.

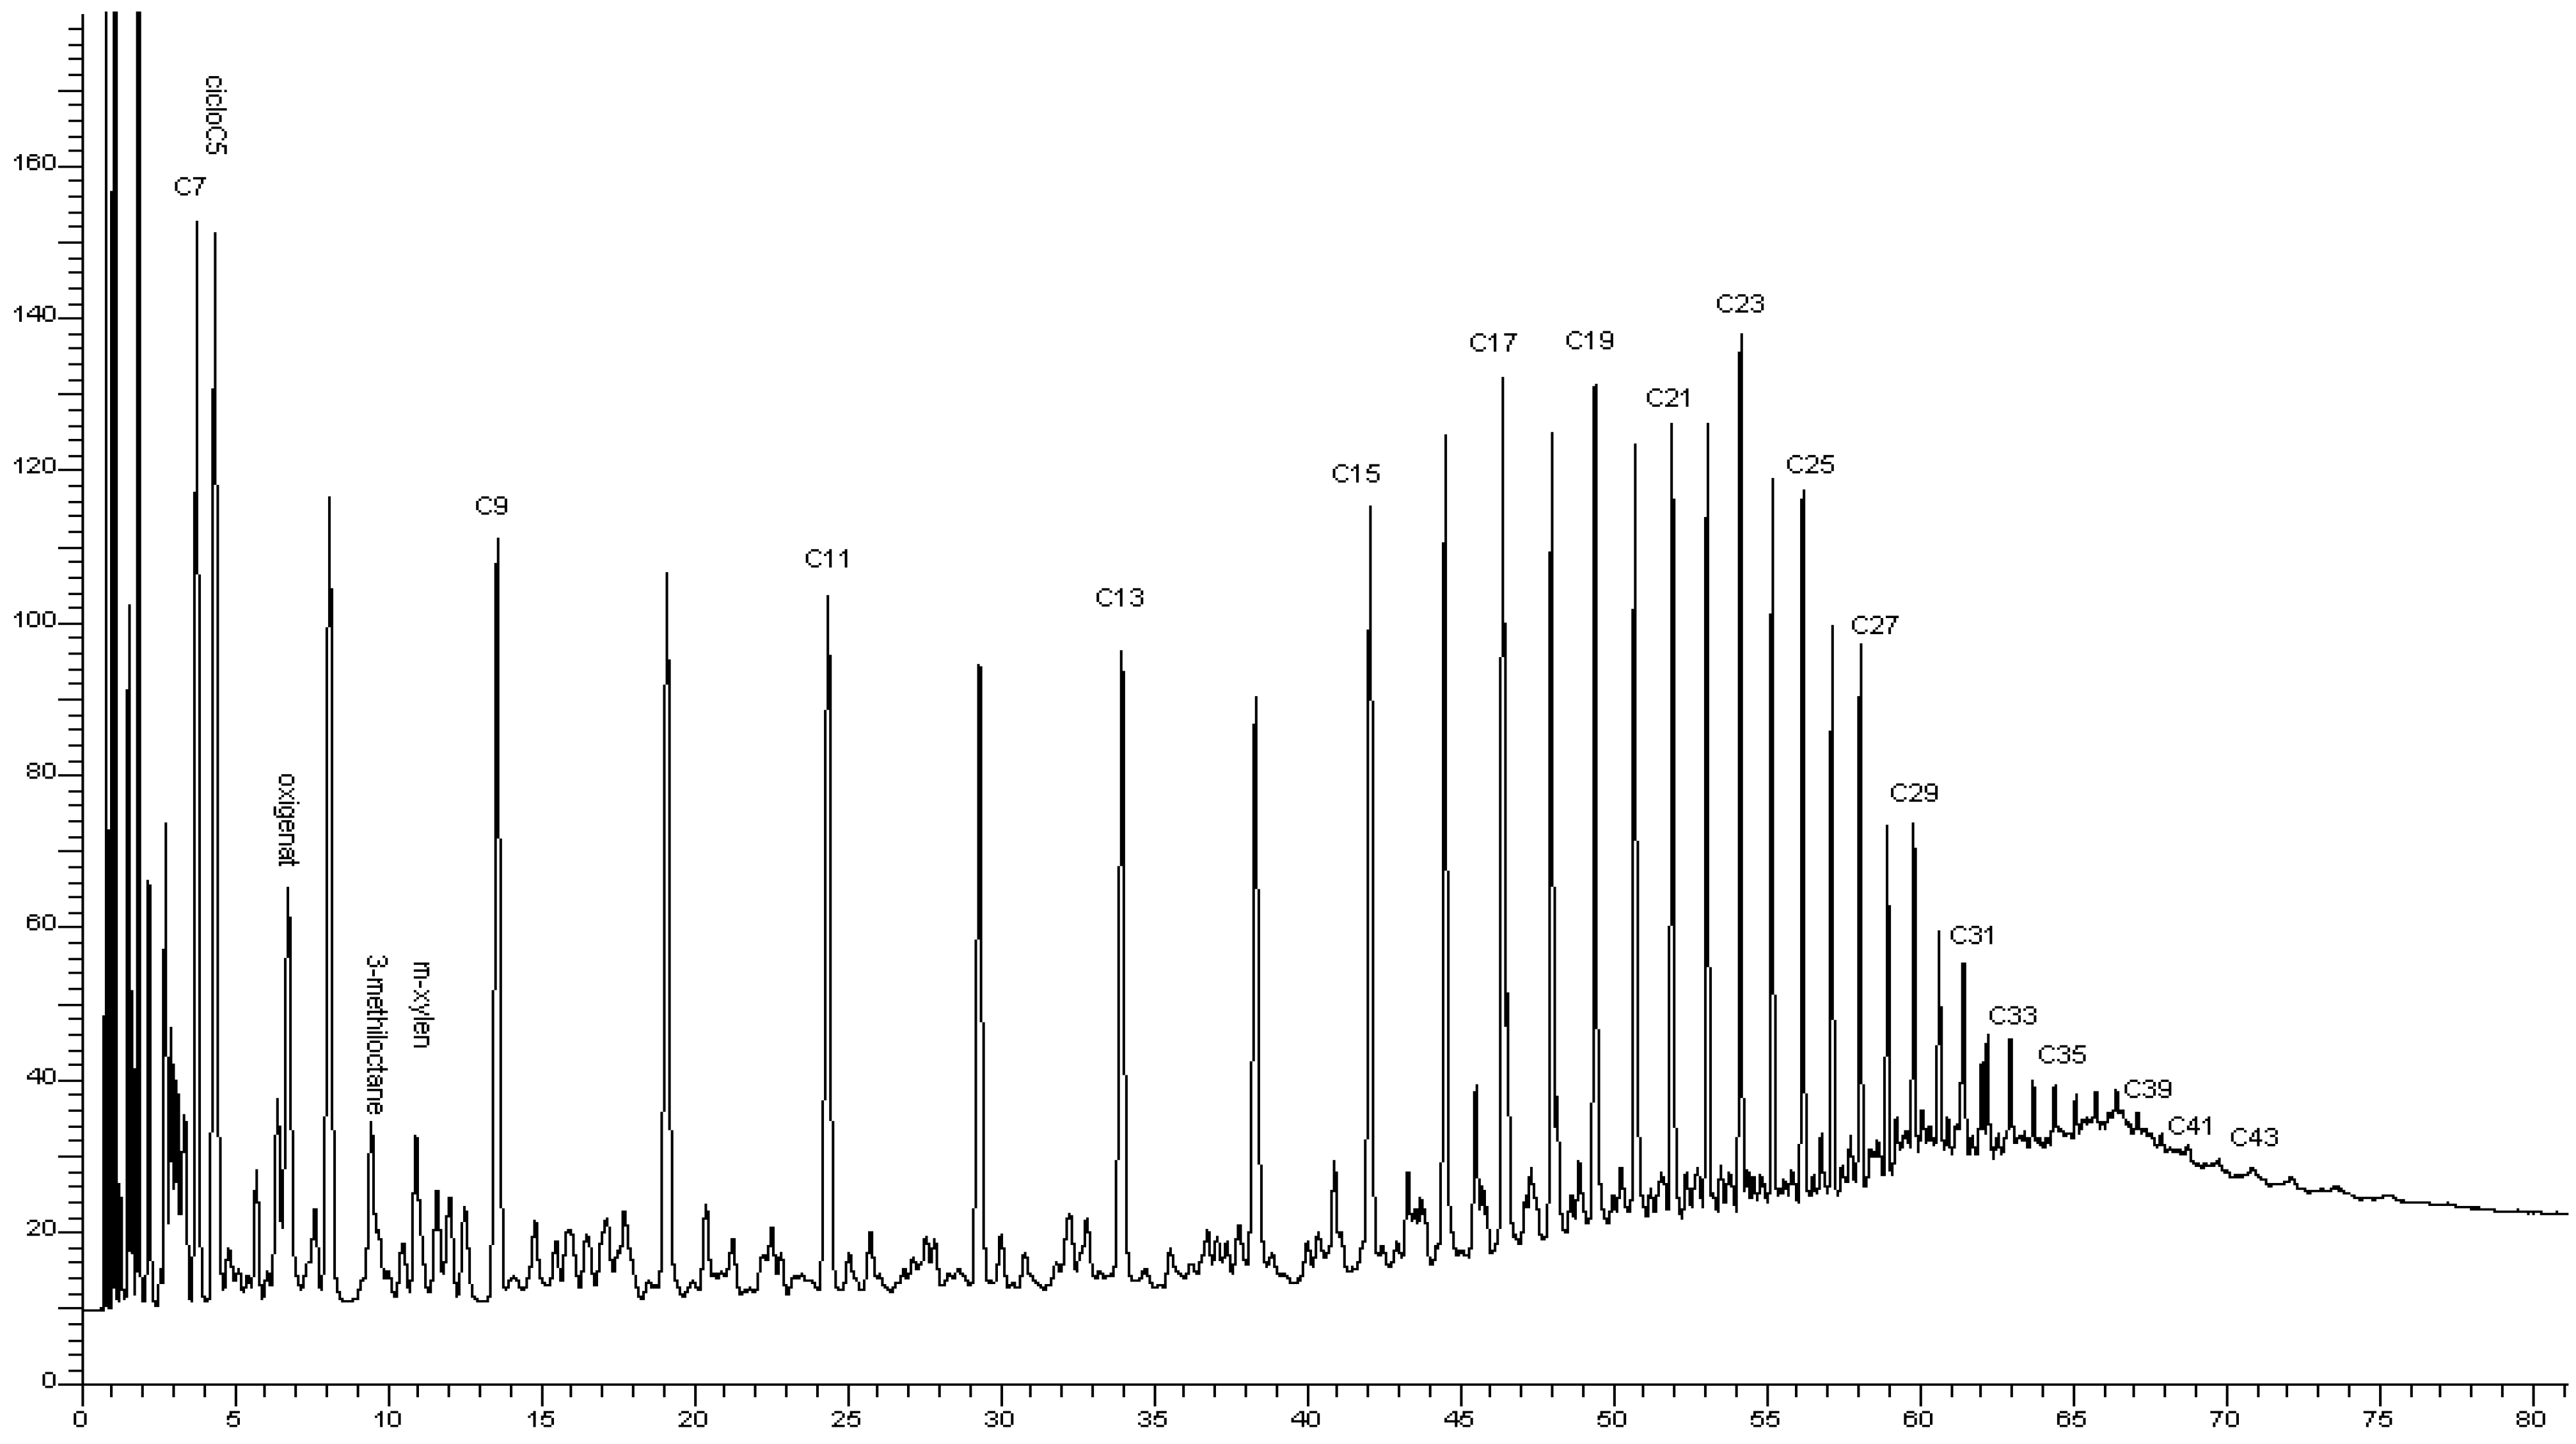
2.7. Gas Chromatographic Analysis

A gas chromatographic analysis of the commercial oil samples was performed on an AutoSystem LX gas chromatograph (model 3012 SIMDIS) [21], with a programmable column thermostat and a universal capillary column injector, as well a pneumatic autosampler for liquid samples. The AutoSystem LX chromatograph features a flame ionization detector with a digital signal amplifier, pneumatics for the hydrogen and air supply, automatic ignition, and flame control of the detector.
The methodology of the sample preparation was as follows. The investigated oil sample was placed in a pre-weighed box with a weight of 5.3245 g and reweighed on electronic analytical scales with an accuracy of 0.1 mg. According to the weight difference, the amount of the sample in grams was determined. A pipette was used to add 1 mL of sulfur dioxide as the solvent. Before the analysis, the prepared samples were incubated for at least half an hour. Identical 0.3 µL samples of oils were introduced into the chromatograph.
The chromatographic analysis of the oil samples was carried out on a 10 m long ELITE PS 2887 capillary column with an internal diameter of 530 µm and a fixed phase thickness of 2.65 µm. In the gap between the injector and the column, there was an empty quartz capillary 5 m long and with an internal diameter of 530 µm. The heavy, non-volatile components of the analyzed oils were deposited on the inner surface of this capillary. The flow rate of the carrier gas (Ne) through the quartz capillary and the analytical column was 50 cm/min.

2.8. Inhibition of Asphalt–Resin–Paraffin Deposits

The asphalt–resin–paraffin deposits (ARPDs) were studied by the “cold finger” method on a special installation simulating the deposition process of asphalt–resin–paraffin deposits (ARPDs) on the main pipeline.
The measurements were carried out in a cylindrical thermostated stainless steel beaker with a volume of 500 mL under stirring with a magnetic stirrer. The volume of the tested oil was 300 mL. A cooled rod made of stainless steel was placed in the beaker to maintain a constant temperature. The temperature of the rod was 3 °C and the temperature of the oil ranged from 60 to 20 °C. The deposition was carried out for 4 h. Afterward, the rod was removed from the beaker and immersed in 50 mL of acetone to wash off the oil. The precipitated asphalt–resin–paraffin deposits (ARPDs) were removed mechanically and the mass was determined. The degree of inhibition was calculated using the following formula:
W % = m m 0 m 0 100
where m0 is the mass (g) of the asphalt–resin–paraffin deposits (ARPDs) precipitated in the initial oil and m is the mass (g) of the asphalt–resin–paraffin deposits (ARPDs) precipitated after the oil treatment.

3. Results and Discussion

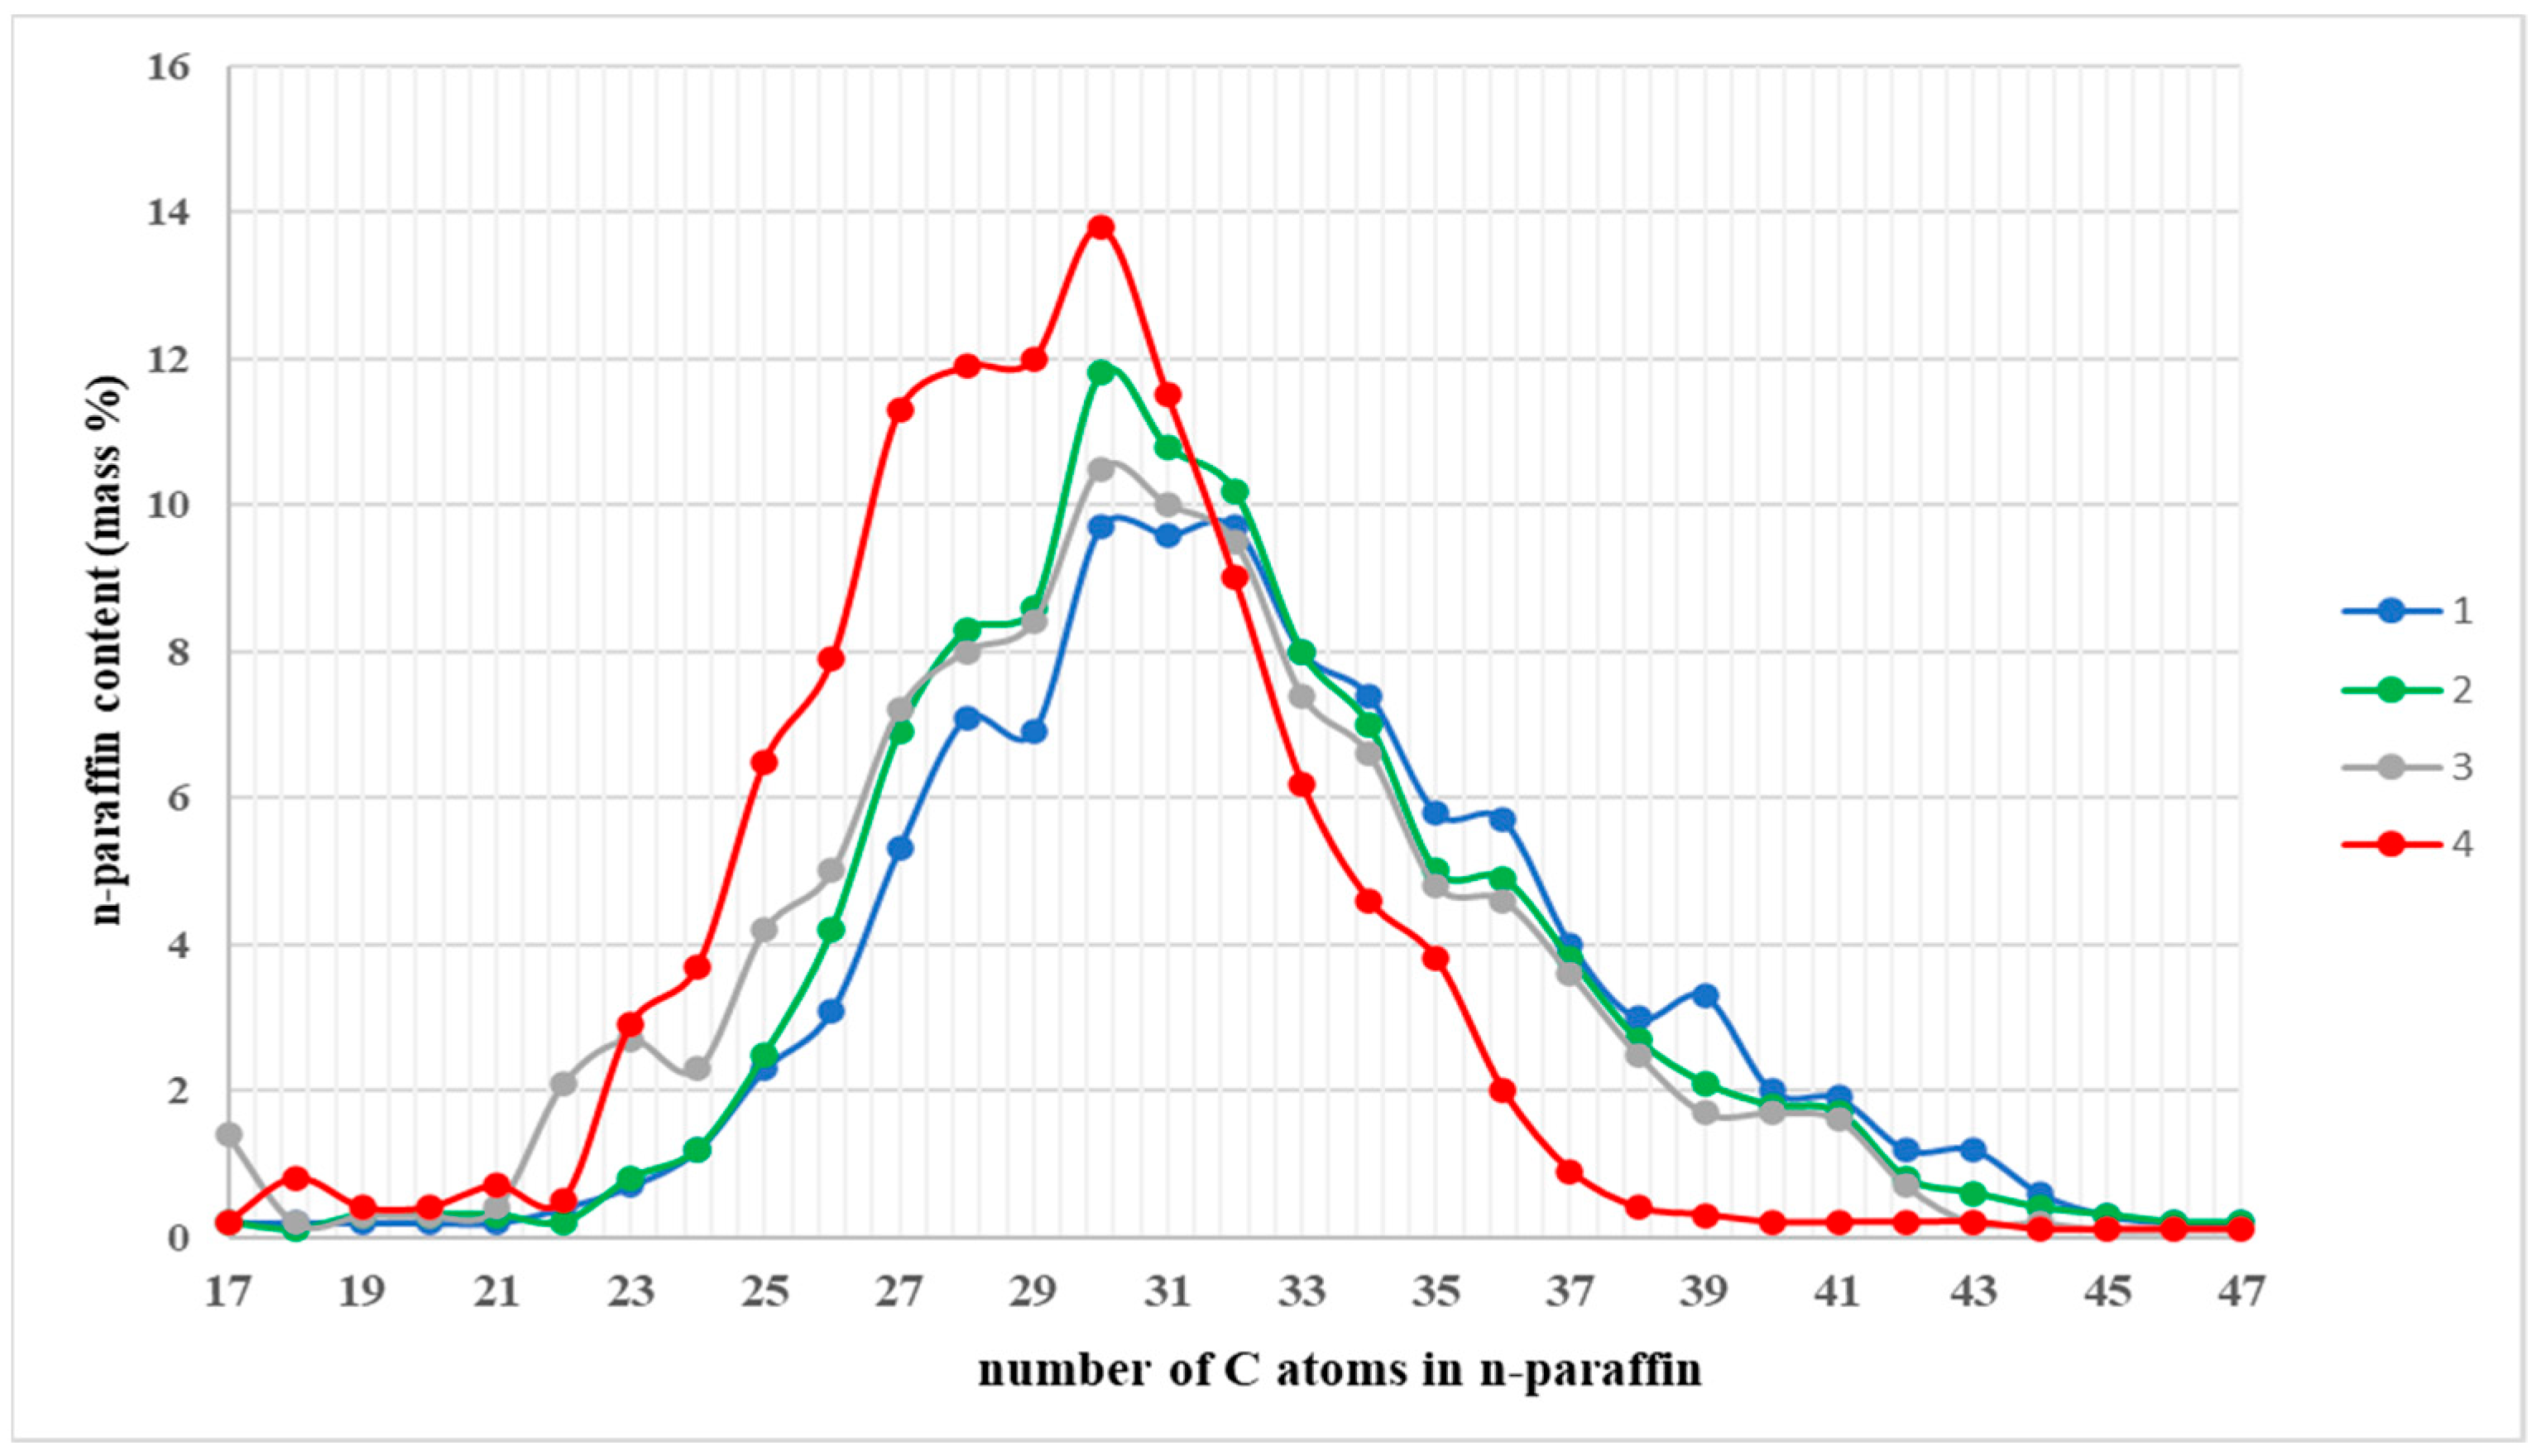
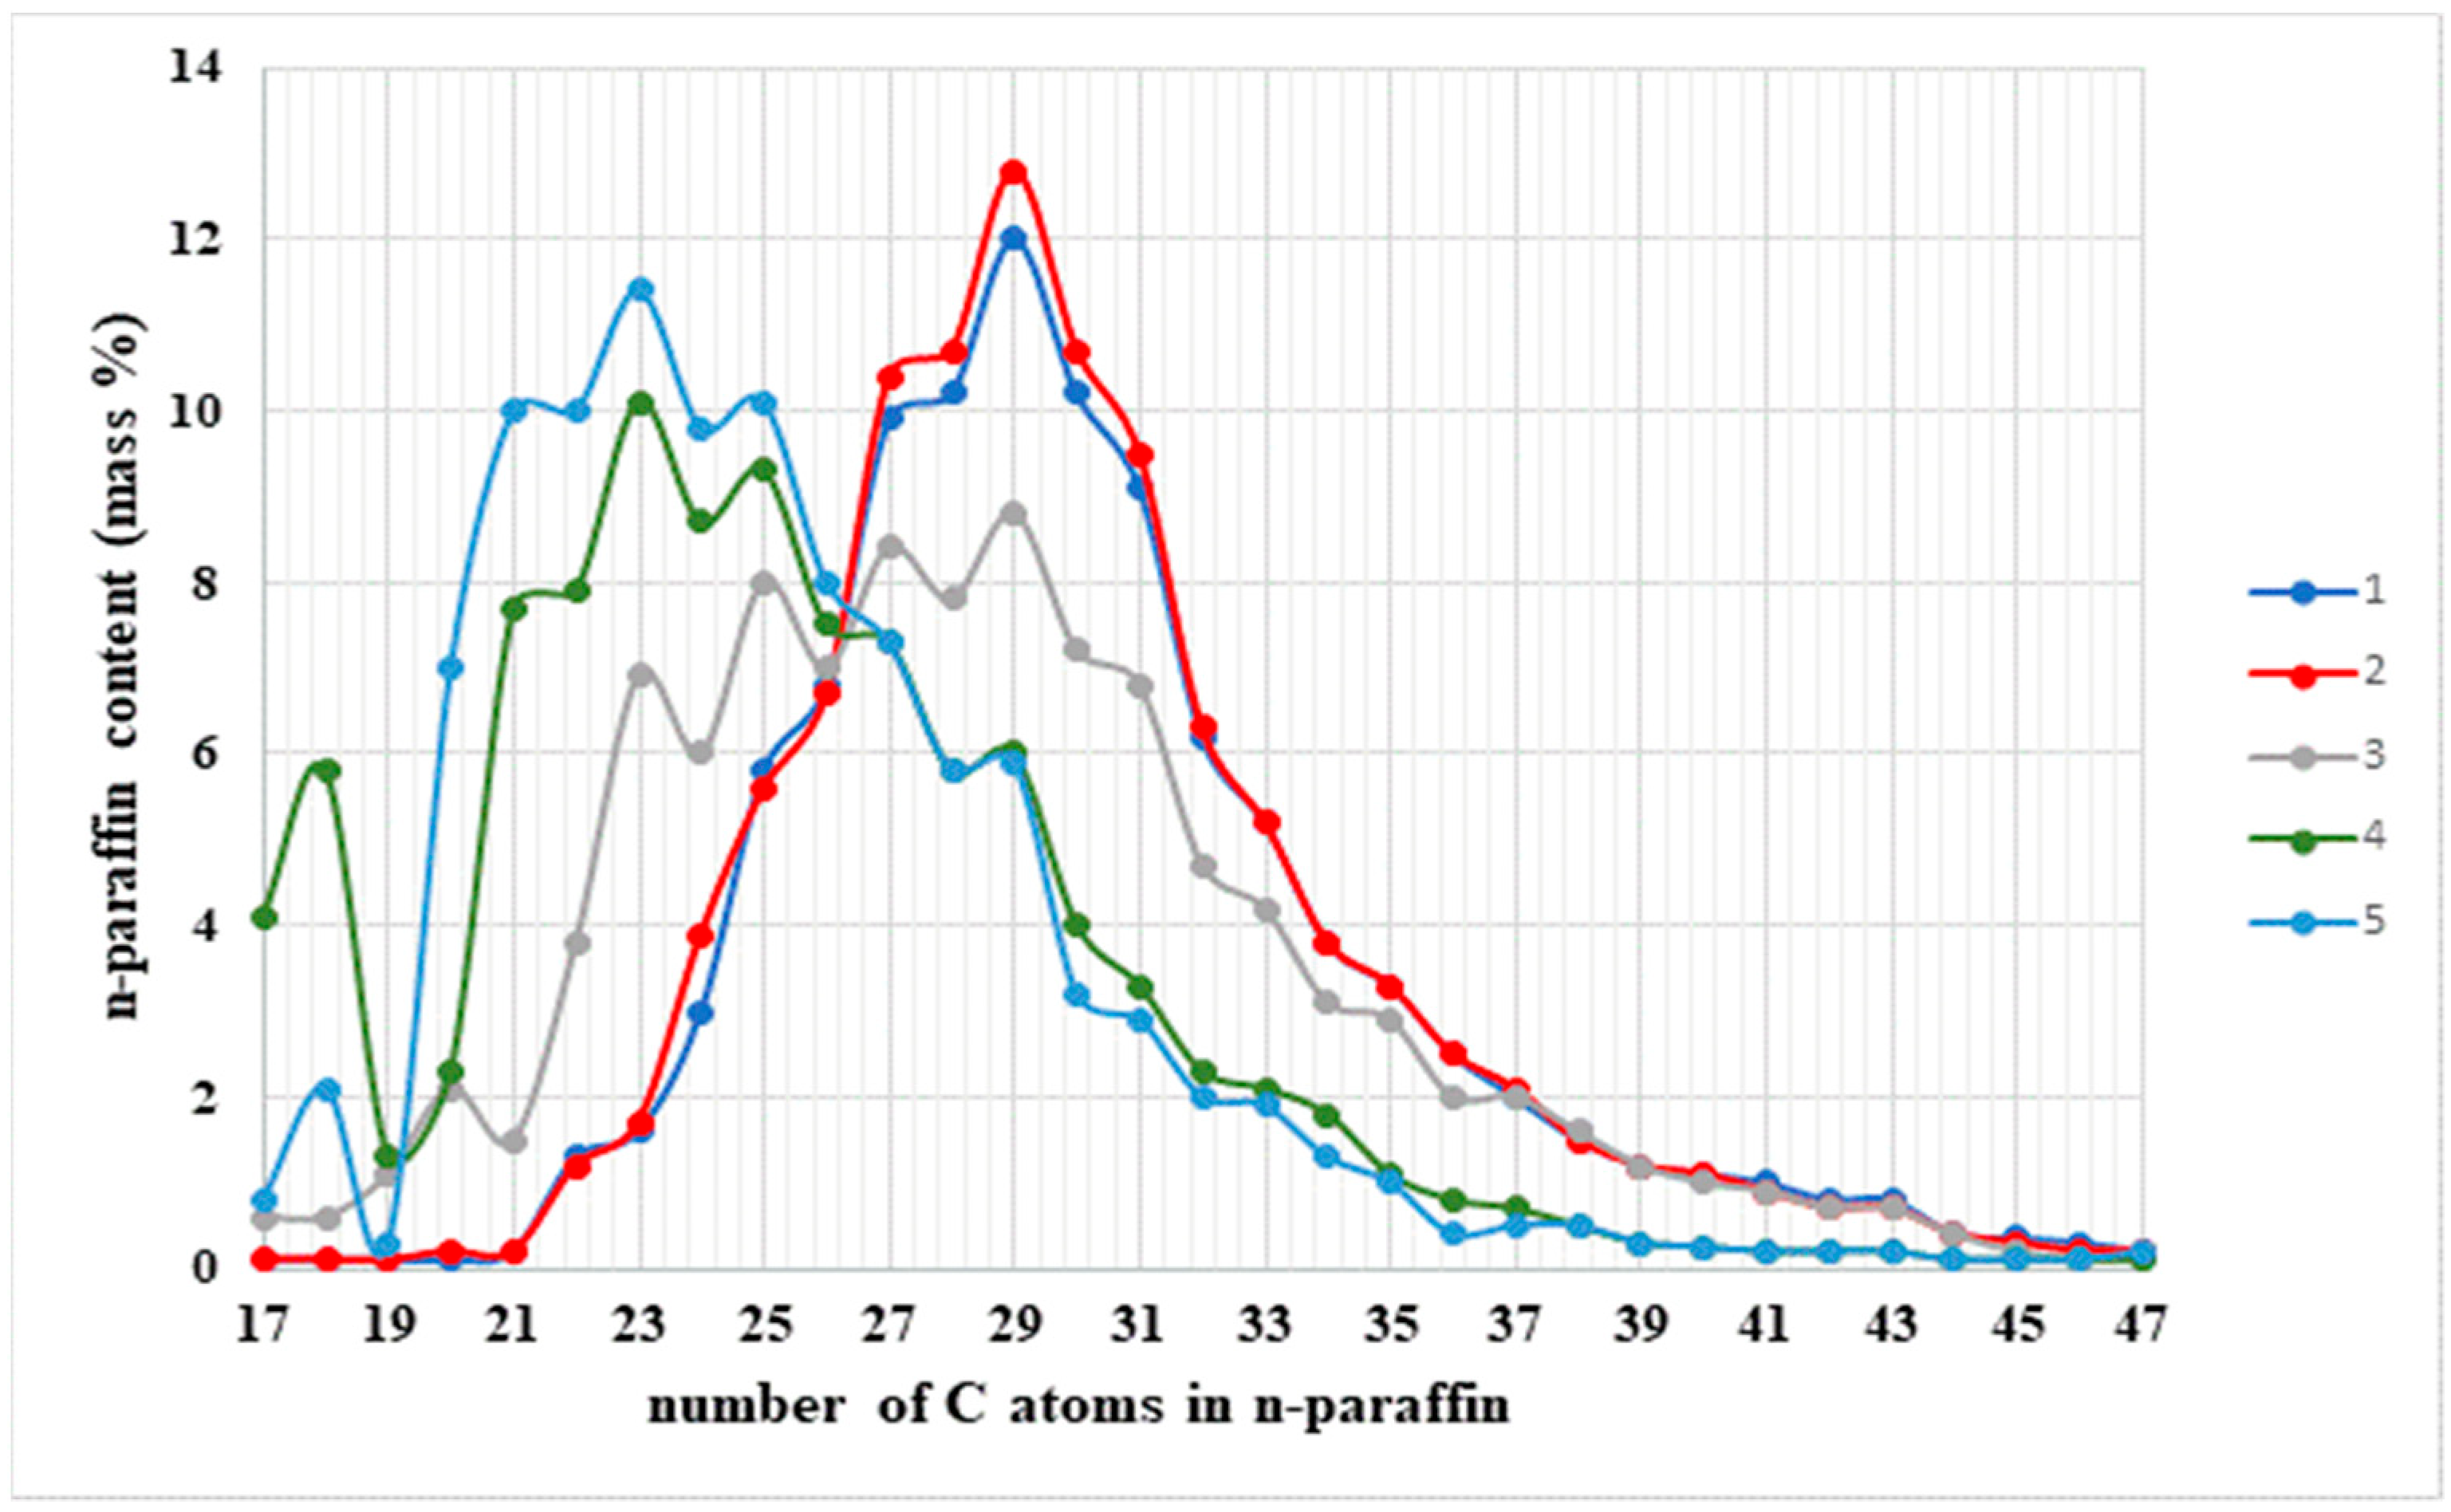
3.1. The Composition, Structure, and Nature of the Components of Normal Alkanes in Oil and Their Influence on the Aggregative Stability of the Paraffinic Oils of the Kumkol Group of Fields

Marketable oils from the Kumkol and Akshabulak fields without a depressor additive were used as the object of this study. The data on density and the composition of the components of the initial oils, as well as their rheological and cold flow properties, are presented in Table 1, Table 2 and Table 3.
After analyzing the data in Table 1 and Table 2, it can be noted that according to the classification of oils by solid paraffin content, the oils from the southern Turgai group of fields are highly paraffinic. The paraffin content in the Akshabulak oil is higher, corresponding to 16.2%. The asphaltene content varies within the range of 0.6–0.8%. The density value for the Kumkol oil and the Akshabulak oil are 815.1 kg/m3 and 821.6 kg/m3 [22,23], respectively.
These oils are characterized by high yield loss temperature values (FLT) of +9–+12 °C, which correlates with the values of the rheological parameters. It is noted that at temperatures of 25–20 °C and above, the effective viscosity does not depend on the shear rate, because the oil is in the state of being a Newtonian liquid (Table 3) [24].
Table 4 and the chromatograms (Figure 1 and Figure 2) present the data on the limiting hydrocarbons (alkanes) contained in the studied oils [25].
The presented data show that the main share of n-alkanes in the Kumkol and Akshabulak oils falls on paraffins of the C15–C44 group. In turn, among this group, the highest percentage of paraffins are C15–C19 and C20–C29 and the lowest C30–C44.
The temperatures at which mass crystallization of the paraffins begins were determined using the microscopy method (Figure 3).
The method operates on the principle of initially heating the oil sample to a high temperature, causing all paraffins to transition into a molten state (see Figure 3a). Subsequently, gradual cooling ensues until crystal formation becomes visually observable and one or two white crystals are formed (see Figure 3b). Then, there is a significant increase in the number of crystals (see Figure 3c). In Figure 3d, there is a massive separation of the isolated nuclei of the paraffin crystals from the homogeneous medium. There is also an increase in their size during this process, and the temperature is recorded. This temperature is similar to the turbidity temperature of petroleum products. It is noteworthy that, with further cooling of the sample, the number of crystals remains constant; only their size increases with time.
Thus, for the Kumkol oil, the temperature at the beginning of the mass crystallization of the paraffins is 40–45 °C and, for the Akshabulak oil, it is 45–50 °C. As can be seen from the data in Table 4, in the Akshabulak oil there is a greater number of alkanes with a chain length of C15–C29, which probably leads to an increase in the temperature at the onset of the crystallization of the paraffins in the oil to 50 °C, because alkanes with longer hydrocarbon chains usually have higher crystallization temperatures.
The process of the separation of the asphalt–resin–paraffin deposits (ARPDs) from the commercial oils was investigated using a “cold rod” unit modelling the deposition process of the asphalt–resin–paraffin deposits (ARPDs) on the main pipeline [26,27].
The asphalt–resin–paraffin deposits (ARPD*) deposited on the cold steel surface were removed mechanically and analyzed using a gas chromatograph. The results of the studies are presented in Table 5 and Table 6.
The following can be seen from Table 5 and Table 6:
The higher the oil temperature (i.e., as the temperature difference between the oil and the cold steel surface increases), the smaller the amount of asphalt–resin–paraffin deposits (ARPDs) that precipitate on the rod surface. However, in these ARPDs, the content of long-chain paraffins prevails (the content of asphaltene–resin substances is low). At the same time, the consistency of the released asphalt–resin–paraffin deposits (ARPDs) becomes denser, which makes their mechanical removal more difficult.
As the temperature difference between the oil and the cold steel surface decreases, there is an increase in the amount of asphalt–resin–paraffin deposits (ARPDs) precipitated on the rod wall. Moreover, in the composition of these ARPDs, there is an increase in asphalt–resin substances. By their physical state, the samples of the asphalt–resin–paraffin deposits (ARPDs) become more friable, are fluid at room temperature, and are easily removed mechanically.
The addition of the additive leads to a decrease in the amount of the asphalt–resin–paraffin deposits (ARPDs), although the observed trend of dependence on oil temperature and steel surface temperature remains.
It is also necessary to consider the contribution of asphaltenes and resins to the process of paraffin deposition formation. As is known [28], petroleum fluid is usually divided into three parts: paraffins (i.e., saturated and branched), resins, and asphaltenes. Asphaltenes are formed from polyaromatic nuclei with aliphatic side chains and rings. These compounds, in the presence of aromatic hydrocarbons (or other polar solvents), bind and form micellar aggregates. If we consider the components of crude oil in terms of polarity, asphaltenes and resins are polar molecules, while paraffins are either non-polar or weakly polar. Most crude oils contain more saturated and aromatic substances, but even small concentrations of asphaltenes affect the crude oil quality, because they can easily aggregate and deposit on surfaces. The most important parameters contributing to the asphaltene aggregation are the amount of long-chain paraffins and the temperature [29,30]. At the same time, resins are considered as specific stabilizers of the asphaltene molecules. Studies of resins, with regard to their influence on the stability of asphaltenes in oil, show that, in the presence of resins, the surface becomes wetter and the roughness of the asphaltenes decreases [31,32]. Thus, at decreasing temperatures, with an increasing amount of long-chain paraffins, the long-chain paraffins can act as nuclei for the deposition of resins and asphaltenes.
The molecular mass distribution of paraffins in isolated asphalt–resin–paraffin deposits (ARPDs) studied by gas chromatographic analysis is presented in Figure 4 and Figure 5. The presented graphs show the correlation between the results of the chromatographic and laboratory analyses. The following tendency is characteristic for all the investigated oils—a decrease in the difference between the oil temperature and the temperature of the steel surface of the rod in the separation process of the asphalt–resin–paraffin deposits (ARPDs) on the “cold” rod leads to a change in the content of long-chain and short-chain paraffins in the asphalt–resin–paraffin deposits (ARPDs). Thus, the content of short-chain (up to C30) n-alkanes in asphalt–resin–paraffin deposits (ARPDs) increases with the decreasing temperature of the tested oil. Long-chain paraffins (C30 and higher) predominate in the samples of the asphalt–resin–paraffin deposits (ARPDs) isolated from oil at a high temperature [33].

3.2. The Influence of Heat Treatment and Cooling Rate on the Processes of Paraffin Deposition of Oils

The cooling rate of the oil mixture after the heat treatment is one of the important factors influencing the process of the formation of oil paraffin crystals. Therefore, a study on the influence of the cooling rate is a relevant direction in the search for successful ways to regulate the rheological parameters of anomalous oils in order to give them optimal cold flow properties [34,35].
For the oils of the Kumkol group of fields, such as Kumkol and Akshabulak, with a small content of asphaltenes, the content of paraffins exceeds 14%. These paraffins are hydrocarbons of the alkane series from C17H36 to C71H144, differing in structure—normal, iso-building, and cyclic. According to the physical and chemical properties, the paraffins are usually divided into two groups: paraffins—from C17H36 to C36H74; and ceresins—from C36H74 to higher.
Depending on the temperature conditions, n-alkanes can crystallize in four forms: monoclinic for n-alkanes up to C26H54, triclinic for n-alkanes from C26H54, orthorhombic for n-alkanes from C40H82, and hexagonal [10].
As oils represent a multicomponent system, paraffin crystals often take hexagonal and orthorhombic forms [36,37,38]. It should be noted that the process of transition of one modification of crystals into another can be observed. For example, an orthorhombic structure is stable at low temperatures and is characterized by a lamellar structure of crystals; at higher temperatures up to the melting point of paraffins, crystals have a hexagonal structure characterized by friability and plasticity. Often, dendritic structures and helical dislocations are formed in untreated oils, characterized by a high degree of branching and friability [39].
The microphotographs in Figure 6 and Figure 7 show the process of the crystallization of the paraffins in the oil samples from the Kumkol and Akshabulak fields, which were heat-treated at 60 °C and cooled at different rates.
From the microphotographs, it is obvious that, both for the Kumkol oil and for the Akshabulak oil, slow cooling leads to a process of growth and the obtaining of large paraffin crystals (see Figure 6a and Figure 7a). At the same time, fast cooling leads to the formation of a large number of small crystallization centers (see Figure 6b and Figure 7b). This is explained by the fact that, at high rates of oil cooling, the hydrocarbon links of different paraffin molecules do not have time to take the sterically most optimal position relative to each other, which leads to a disordered structure [40]. This analysis is also confirmed by the results of the studies in Figure 8.
Figure 8 shows the dependence of the paraffin crystal size on the temperature at a cooling rate of 0.1 °C/min. The growth of paraffin crystals can be conditionally divided into several stages: nucleation, subsequent crystal growth due to adsorption of paraffin molecules on the faces, and the association of large crystals with the formation of a grid [8,11]. The graph shows that for the Kumkol oil the formation of paraffin germs occurs up to 42 °C; then, there is a mass growth of paraffin crystals from 20 to 85 microns; and, by 30 °C, there is a transition from a loose to a more rigid structure and the formation of a volumetric structural lattice between individual agglomerates.
The results of these studies show that an increase in the cooling rate leads to an increase in the yield loss temperature and kinematic viscosity of oils [41]. Figure 9 shows the dependence of the cooling rate on the yield loss temperature (FLT, °C) and kinematic viscosity at 20 °C (ν, mm2/s). As can be seen from the data, the increase in the cooling rate leads to an increase in the yield loss for the Kumkol oil up to 9 °C; for the Akshabulak oil, the yield loss temperature rises from 12 °C to 18 °C. With an increasing cooling rate, we also observed a change in the kinematic viscosity, the maximum of which falls for both oils at a cooling rate of 2 °C/min.
Figure 10 shows that for the Kumkol oil at cooling rates of 0.1 and 2 °C/min the graphs of dependence on the temperature for the effective viscosity show better rheological characteristics. On the contrary, the Akshabulak oil at all cooling rates shows a non-Newtonian nature (with non-linear curves). It should be noted that the maximum effective viscosity for both the Kumkol and Akshabulak oils is observed at a cooling rate of 1 °C/min.
Figure 9 shows that, with an increasing cooling rate, there is the mass formation of nucleated paraffin crystals and an increase in the kinematic and effective viscosity, which leads to the deterioration of the rheological characteristics of the oil.

4. Conclusions

Long-chain paraffins, which crystallize at high temperatures, start to precipitate at the initial section of the pipeline when “hot” oil enters a “cold” pipeline (especially in the case of a large difference between the temperature of the oil and the pipe wall). At the same time, the amount of asphalt–resin–paraffin deposits (ARPDs) precipitated during a single passage of oil will be small, but these deposits will represent a dense mass that is difficult to remove (due to the predominance of long-chain paraffins in the composition) and, as the deposits accumulate (in the case of a long gap in the schedule of the EI passage), can lead to serious problems in the oil pumping process (a narrowing of the cross section of the pipeline, a reduction in productivity, an increase in start-up pressure, etc.).
To prevent and reduce the deposition of such asphalt–resin–paraffin deposits (ARPDs), it can be recommended, firstly, to observe the schedule of the initial intake of the EI and, secondly, not to allow the oil mixture with a high temperature (50–60 °C) to enter the pipeline without achieving a temperature reduction to 30–40 °C.
When there is a small difference between the temperature of the oil and the pipe wall (<10 °C), more asphalt–resin–paraffin deposits (ARPDs) precipitate. This phenomenon may occur in more remote sections of the pipeline. However, these asphalt–resin–paraffin deposits (ARPDs) will be more friable and more easily removable (due to the high content of short-chain paraffins and asphaltene–tar substances and the relatively low content of long-chain paraffins). A depressor additive combining the qualities of a paraffin deposit inhibitor can be used to prevent and reduce the deposition of such asphalt–resin–paraffin deposits (ARPDs). The introduction (or the activation at the heating stage) of the depressor additive leads to a reduction of up to five times in the amount of precipitating asphalt–resin–paraffin deposits (ARPDs).
In addition, one of the effective measures to reduce the amount of precipitating asphalt–resin–paraffin deposits (ARPDs) is to maintain a constant and high oil flow rate (through the connection of additional main pumping units). The oil flow rate is calculated for each pipeline individually depending on the diameter, length, and capacity. It should also be noted that with an increasing cooling rate there is the nucleation and mass formation of paraffin crystals and an increase in the kinematic and effective viscosity, which leads to the deterioration of the rheological characteristics of the oil.

Author Contributions

Conceptualization: L.B. and G.B.; methodology, L.B., G.B., A.S. and N.L.; software, G.B., N.L. and R.S.; validation, A.K. and S.M.; formal analysis, A.K., A.S. and S.M.; investigation, L.B., G.B. and N.L.; resources, N.L. and R.S.; data curation, R.S., A.K., A.S. and S.M.; writing—original draft preparation, L.B. and G.B.; writing—review and editing, L.B.; visualization, N.L., R.S., A.K. and S.M.; supervision, G.B.; project administration, L.B. and G.B.; and funding acquisition, G.B. All authors have read and agreed to the published version of the manuscript.

Funding

This research received no external funding.

Data Availability Statement

The original contributions presented in the study are included in the article, further inquiries can be directed to the corresponding author/s.

Conflicts of Interest

The authors declare no conflicts of interest.

References

  1. Korshak, A.A.; Nechval, A.M. Pipeline Transport of Oil, Oil Products and Gas; UGNTU: Ufa, Russia, 2005; 516p. [Google Scholar]
  2. Matzain, A.; Apte, M.S.; Zhang, H.Q.; Volk, M.; Brill, J.P.; Creek, J.L. Investigation of paraffin deposition during multiphase flow in pipelines and wellbores—Part 1: Experiments. J. Energy Resour. Technol. 2002, 124, 180–186. [Google Scholar] [CrossRef]
  3. Aiyejina, A.; Chakrabarti, D.P.; Pilgrim, A.; Sastry, M. Wax formation in oil pipelines: A critical review. Int. J. Multiphase Flow 2011, 37, 671–694. [Google Scholar] [CrossRef]
  4. Loskutova, Y.V.; Ryzhova, N.S.; Yudina, N.V.; Beshagina, E.V. The influence of processing conditions on the sedimentation kinetics of highly waxy crude oil. Procedia Chem. 2015, 15, 49–53. [Google Scholar] [CrossRef]
  5. Terteryan, R.A. Depressor Additives for Crude Oils, Fuels and Lube Oils (Khimiya, Moscow, 1990). Khimiya 1990, 237. (In Russian) [Google Scholar]
  6. Wang, L.S.; Flamberg, A.; Kikabhai, T. Select the optimum pour point depressant. Hydrocarb. Process. 1999, 78, 59–62. [Google Scholar]
  7. del Carmen Garcia, L.M.; Carbognani, M.; Orea, A. Urbina. The influence of alkane class-types on crude oil wax crystallization and inhibitors efficiency. J. Pet. Sci. Eng. 2000, 25, 99–105. [Google Scholar] [CrossRef]
  8. Tumanyan, B.P. Scientific applied aspects of the theory of oil dispersed systems. Technics 2000, 336. [Google Scholar]
  9. Garcia, M.d.C.; Orea, M.; Carbognani, L.; Urbina, A. The Effect of paraffinic fractions on crude oil wax crystallization. Pet. Sci. Technol. 2001, 19, 189–196. [Google Scholar] [CrossRef]
  10. Kazakova, L.P. Solid hydrocarbons of oil. Khimiya 1986, 176. [Google Scholar]
  11. Vignati, E.; Piazza, R.; Visintin, R.F.G.; Lapasin, R.; D’Antona, P.; Lockhart, T.P. Wax crystallization and aggregation in a model crude oil. J. Phys. Condens. Matter 2005, 17, S3651–S3660. [Google Scholar] [CrossRef]
  12. Alhejaili, A.; Bell, E.; Daraboina, N. Paraffin Deposition in Production Lines: Effect of Operating Parameters on Deposition Characteristics. Energy Fuels 2023, 37, 18642–18651. [Google Scholar] [CrossRef]
  13. Jennings, D.W.; Weispfennig, K. Effects of shear and temperature on wax deposition: Coldfinger investigation with a Gulf of Mexico crude oil. Energy Fuels 2005, 19, 1376–1386. [Google Scholar] [CrossRef]
  14. Padula, L.; Gon, S.; Russell, C.; Pohl, E.; Littlehales, I.; Neilson, A. Systematic study of temperature and different types of mixing in paraffin deposition test methods. ACS Omega 2020, 5, 12320–12328. [Google Scholar] [CrossRef] [PubMed]
  15. Affens, W.A.; Hall, J.M.; Hazlett, R.N. Effect of composition on freezing points of model hydrocarbon fuels. Fuel 1984, 63, 543–547. [Google Scholar] [CrossRef]
  16. GOST 3900 (ST SEV 6754-89); Crude Oil and Petroleum Products. Methods of Density Determination: Moscow, Russia, 2023.
  17. GOST 11851; Petroleum. Methods of Determination of Paraffins: Moscow, Russia, 2018.
  18. ST RK ASTM D 5853; Standart Test Method for Pour. Point of Crude Oils: Astana, Kazakhstan, 2010.
  19. ASTM D 445; 2011 Standard Test Method for Kinematic Viscosity of Transparent and Opaque Liquids (and Calculation of Dynamic Viscosity). IDT: Astana, Kazakhstan, 2011.
  20. GOST 1929; Petroleum Products. Methods of Test for Determination of Dynamic Viscosity by Rotary Viscosimeter. USSR State Committee for Standards: Moscow, Russia, 1987.
  21. ST RK ASTM D 2887; Standard Method for Determination of Boiling Point Intervals of Oil Fractions by Gas Chromatography. Astana, Kazakhstan, 2019.
  22. Mussabayeva, B.K.; Orazzhanova, L.K.; Kudaibergenov, S.E.; Kassymbayeva, D.S. Selection of depressor additives for transportation of high-viscositive Kazakhstan oils. Bull. Karaganda Univ. Chem. 2015, 59. [Google Scholar]
  23. Kucherov, V.G.; Chernoutsan, A.I. Reciprocal influence of crystallization and vitrification processes in complex hydrocarbon systems. I. M. Gubkin Russian State University of Oil and Gas. Khimiya I Tekhnologiya Topl. I Masel 2006, 3, 36–38. [Google Scholar]
  24. Malkin, A.Y.; Isaev, A.I. Rheology: Concepts, methods, applications. St. Petersburg. ChemTec Publishing: St. Petersburg, Russia, 2005; pp. 164–165. [Google Scholar]
  25. Mereke, A.; Bauyrzhan, A. Analysis of Kazakhstan Crude Oil Biomarkers by Gas Chromatography in Combination with Mass Spectrometry. Separations 2023, 10, 561. [Google Scholar] [CrossRef]
  26. Santos, J.S.T.D.; Fernandes, A.C.; Giulietti, M. Study of the paraffin deposit formation using the cold finger methodology for brazilian crude oils. J. Pet. Sci. Eng. 2004, 45, 47–60. [Google Scholar] [CrossRef]
  27. Bello, O.O.; Teodoriu, C.; Reinicke, K.M. An evaluation of the performance of selected wax inhibitors on paraffin deposition of Nigerian crude oils. Pet. Sci. Technol. 2006, 24, 195–206. [Google Scholar] [CrossRef]
  28. Soorghali, F.; Zolghadr, A.; Ayatollahi, S. Effect of resins on asphaltene deposition and the changes of surface properties at different pressures: A microstructure study. Energy Fuels 2014, 28, 2415–2421. [Google Scholar] [CrossRef]
  29. Hammami, A.; Phelps, C.H.; Monger-McClure, T.; Little, T. Asphaltene precipitation from live oils: An experimental investigation of onset conditions and reversibility. Energy Fuels 2000, 14, 14–18. [Google Scholar] [CrossRef]
  30. Speight, J.G. The chemical and physical structure of petroleum: Effects on recovery operations. J. Pet. Sci. Eng. 1999, 22, 3–15. [Google Scholar] [CrossRef]
  31. Sedghi, M.; Goual, L. Role of Resins on Asphaltene Stability. Energy Fuels 2009, 24, 2275–2280. [Google Scholar] [CrossRef]
  32. Pereira, J.C.; López, I.; Salas, R.; Silva, F.; Fernández, C.; Urbina, C.; López, J.C. Resins: The molecules responsible for the stability/instability phenomena of asphaltenes. Energy Fuels 2007, 21, 1317–1321. [Google Scholar] [CrossRef]
  33. Jennings, D.W.; Weispfennig, K. Experimental solubility data of various n-alkane waxes: Effects of alkane chain length, alkane odd versus even carbon number structures and solvent chemistry on solubility. Fluid Phase Equilibria 2005, 227, 27–35. [Google Scholar] [CrossRef]
  34. Rehan, M.; Nizami, A.-S.; Taylan, O.; Al-Sasi, B.O.; Demirbas, A. Determination of wax content in crude oil. Pet. Sci. Technol. 2016, 34, 799–804. [Google Scholar] [CrossRef]
  35. Kok, M.V.; Letofe, J.M.; Clau, P. Comparative methods in the determination of wax content and pour points of crude oils. J. Therm. Anal. Calorim. 2007, 90, 827–831. [Google Scholar] [CrossRef]
  36. Loskutova, Y.V.; Yudina, N.V. Influence of a permanent magnetic field on structural and mechanical properties of paraffinic oils. Neftekhimiya 2004, 1, 63–67. [Google Scholar]
  37. Loskutova, Y.V.; Prozorova, I.V.; Yudina, N.V.; Rikkonen, S.V.; Daneker, V.A. Change of rheological properties of high-paraffin oils under the influence of vibrojet magnetic activation (in Russian). Eng. Phys. J. 2004, 77, 27–34. [Google Scholar]
  38. Lukman, I.; Robin, E.W.; Xiongwei, N. On the effect of wax content on paraffin wax deposition in a batch oscillatory baffled tube apparatus. Chem. Eng. J. 2008, 137, 205–213. [Google Scholar] [CrossRef]
  39. Mansoori, G.A.; Barnes, H.L.; Webster, G.M. Petroleum waxes. Fuels Lubr. Handb. 2003, 19, 525–558. [Google Scholar]
  40. Li, B.; Guo, Z.; Zheng, L.; Shi, E.; Qi, B. A comprehensive review of wax deposition in crude oil systems: Mechanisms, influencing factors, prediction and inhibition techniques. Fuel 2024, 357, 129676. [Google Scholar] [CrossRef]
  41. Li, H.; Zhang, J. A generalized model for predicting non-Newtonian viscosity of waxy crudes as a function of temperature and precipitated wax. Fuel 2003, 82, 1387–1397. [Google Scholar] [CrossRef]
Figure 1. Chromatogram of oil from the Kumkol field.
Processes 12 01052 g001
Figure 2. Chromatogram of oil from the Akshabulak field.
Processes 12 01052 g002
Figure 3. Microphotographs reflecting the process of crystal formation in the oil of the Kumkol field at 40× magnification of the microscope: (a) the homogeneous state of the oil (at 80 °C), (b) the appearance of the first germs of the paraffin crystals (at 52 °C), (c) the mass appearance of the germs of the paraffin crystals (at 40–45 °C); (d) the enlargement of the crystals.
Processes 12 01052 g003
Figure 4. Molecular weight distribution of paraffins contained in asphalt–resin–paraffin deposits (ARPDs) released on a “cold” rod (rod temperature +6 °C) from Kumkol oil at oil temperatures of 50 °C (1), 40 °C (2), 30 °C (3), and 20 °C (4).
Processes 12 01052 g004
Figure 5. Molecular weight distribution of paraffins contained in asphalt–resin–paraffin deposits (ARPDs) released on a “cold” rod (rod temperature +12 °C) from Akshabulak oil at oil temperatures of 60 °C (1), 50 °C (2), 40 °C (3), 30 °C (4), and 20 °C (5).
Processes 12 01052 g005
Figure 6. Microphotographs of Kumkol oil at 0.1 °C/min (a) and 2 °C/min (b) cooling rates.
Processes 12 01052 g006
Figure 7. Microphotographs of Akshabulak oil at 0.1 °C/min (a) and 2 °C/min (b) cooling rates.
Processes 12 01052 g007
Figure 8. Dependence on the temperature for the size of the paraffin crystals for the Kumkol oil at a cooling rate of 0.1 °C/min.
Processes 12 01052 g008
Figure 9. Variations of yield loss temperature and kinematic viscosity with cooling rate.
Processes 12 01052 g009
Figure 10. Variation of the effective viscosity of the Kumkol and Akshabulak oils related to the temperature at different cooling rates.
Processes 12 01052 g010
Table 1. Density (ρ) at 20 °C and component composition in oil samples from Kumkol and Akshabulak fields.
Oilρ, kg/m3Asphaltenes, %Paraffins,%Resins, %
Kumkol821.60.614.06.4
Akshabulak815.10.816.26.1
Table 2. Kinematic viscosity and yield loss temperature (FLT) of oil from Kumkol and Akshabulak fields.
OilKinematic Viscosity, mm2/sFLT, °C
20 °C25 °C30 °C35 °C40 °C45 °C50 °C55 °C60 °C
Kumkol11.8509.2956.7405.7774.8144.3843.9543.6623.370+9
Akshabulak11.2208.9566.6925.6274.5634.0913.6193.3303.042+12
Table 3. Rheological parameters of oil from Kumkol and Akshabulak fields.
Oil Samplet, °Cτ, Pa
(D = 5 s−1)
η, Pa·sec
(D = 5 s −1)
τ, Pa
(D = 10 s−1)
η, Pa·s
(D = 10 s−1)
τ0, PaKtek, Pa·s
Kumkol200.0200.0040.0400.00400.004
150.0350.0070.2040.0200.0310.018
101.1190.2221.6230.1611.3890.057
56.1711.2227.3180.7255.0250.165
021.8524.32726.8332.65729.3500.409
Akshabulak250.0350.0070.0700.00700.007
200.1400.0280.2280.02300.023
152.7050.5363.5430.3513.5640.073
109.5471.89011.0541.09410.6500.143
526.3715.22229.6712.93830.5300.408
Table 4. Distribution of hydrocarbons in oils depending on the number of carbon atoms (n) in the main chain.
OilHydrocarbons and Paraffins
(C4–C14), %
Paraffins, %
C4–C8C9–C14C15–C19C20–C29C30–C44
Kumkol16.3220.4922.0632.369.75
Akshabulak1.1224.5529.6137.206.40
Table 5. Amount of ARPDs released from the Kumkol oil.
ConditionsARPD Mass, gAmount of Solid Paraffins in ARPD*, %Appearance
Toil, °CTrod, °CΔT, °C
606546.623.4hard, dense,
fine grained
506444.819.9hard, dense,
fine grained
406347.813.7hard, loose,
coarse grained
306247.211.1hard,
coarse grained
206147.88.6friable,
liquid at room temperature
Table 6. Amount of ARPDs released from the Akshabulak oil.
ConditionsARPD Mass, gAmount of Solid Paraffins in ARPD*, %Appearance
Trod, °C
Toil, °CTrod, °CΔT, °C
6012486.630.6hard, dense,
fine grained
5012387.220.2hard, dense,
fine grained
40122815.012.4hard, dense,
coarse grained
30121850.49.9liquid at room temperature
2012810.29.8liquid at room temperature
Disclaimer/Publisher’s Note: The statements, opinions and data contained in all publications are solely those of the individual author(s) and contributor(s) and not of MDPI and/or the editor(s). MDPI and/or the editor(s) disclaim responsibility for any injury to people or property resulting from any ideas, methods, instructions or products referred to in the content.

