Article

Research and Application of Non-Steady-State CO2 Huff-n-Puff Oil Recovery Technology in High-Water-Cut and Low-Permeability Reservoirs

1
Xinmu Oil Production Plant of PetroChina Jilin Oilfield Company, PetroChina, Songyuan 138000, China
2
Research Institute of Petroleum Exploration & Development, PetroChina, Beijing 100083, China
3
State Key Laboratory of Enhanced Oil and Gas Recovery, PetroChina, Beijing 100083, China
4
School of Engineering Sciences, University of Chinese Academy of Sciences, Beijing 100049, China
5
Institute of Porous Flow and Fluid Mechanics, Chinese Academy of Sciences, Langfang 065007, China
6
China Petroleum Technology and Development Corporation, PetroChina, Beijing 100028, China
*
Authors to whom correspondence should be addressed.
Processes 2024, 12(6), 1120; https://doi.org/10.3390/pr12061120
Submission received: 26 March 2024 / Revised: 26 May 2024 / Accepted: 27 May 2024 / Published: 29 May 2024

Abstract

:
In response to the issues of poor water flooding efficiency, low oil production rates, and low recovery rates during the high-water-cut period in the low-permeability reservoirs of the Mutou Oilfield, the non-steady-state (NSS) CO2 huff-n-puff oil recovery technology was explored. The NSS CO2 huff-n-puff can improve the development effect of low-permeability reservoirs by replenishing the reservoir energy and significantly increasing the crude oil mobility. Experimental investigations were carried out, including a crude oil and CO2–crude oil swelling experiment, minimum miscibility pressure testing experiment, high-temperature and high-pressure microfluidic experiment, and NSS CO2 huff-n-puff oil recovery on-site pilot test. The experimental results showed that the main mechanisms of NSS CO2 huff-n-puff include dissolution, expansion, viscosity reduction, and swept volume enlargement, which can effectively mobilize the remaining oil from the various pore throats within the reservoir. The high-temperature and high-pressure microfluidic experiment achieved an ultimate recovery rate of 83.1% for NSS CO2 huff-n-puff, which was 7.9% higher than the rate of 75.2% obtained for steady injection. This method can effectively utilize the remaining oil in the corners and edges, enlarge the swept volume, and increase the recovery rate. Field trials of NSS CO2 huff-n-puff in a low-permeability reservoir in the Mutou Oilfield indicated that it cumulatively increased the oil production by 1134.5 tons. The achieved results and insights were systematically analyzed and could provide key technical support for the application of NSS CO2 huff-n-puff technology in low-permeability reservoirs, promoting the innovative development of this technology.

1. Introduction

Against the backdrop of the increasing global energy demand and the gradual depletion of traditional oil and gas resources, CO2 is gradually attracting widespread attention due to its environmentally friendly and renewable nature, as well as its applications in enhanced oil recovery (EOR) and carbon capture, utilization, and storage (CCUS) [1,2,3,4,5,6,7,8,9,10,11,12,13,14]. Research on the use of CO2 to enhance oil recovery can be traced back to literature records as early as 1920, with its practical application starting in 1956 [7]. In the United States, CO2 miscible displacement tests were first carried out in the Permian Basin in 1956, followed by large-scale applications, making CO2 injection an important technology for enhanced oil recovery with significant economic benefits; it may enhance the recovery rates by 10% to 25%. Since the 1970s, global CO2 flooding technology has been further promoted and developed [15].
In low-permeability reservoirs where water flooding has not been conducted or where water flooding is ineffective, CO2 flooding has broad application prospects and significant economic and social benefits. Traditional CO2 flooding schemes, such as continuous CO2 flooding [16,17,18] and water–CO2 alternating flooding [19,20], have demonstrated promising potential for enhanced oil recovery in laboratory or field applications. However, their widespread application is limited due to the significant consumption of CO2. In low-permeability reservoirs, the introduction of large volumes of hydraulic fractures during primary oil recovery is common [21,22,23]. This often leads to serious early breakthrough issues during CO2 flooding, thereby reducing the recovery rate. Table 1 lists the problems faced in the development of low-permeability reservoirs.
CO2 huff-n-puff oil recovery technology is a new production enhancement measure developed for reservoirs with relatively high oil viscosity, a low oil-to-gas ratio, and relatively insufficient reservoir energy. This technology can be effective in complex small-fault reservoirs with limited inter-well connectivity, a confined area, and low permeability [32,33,34,35,36,37]. The basic principle involves injecting CO2 into the oil well to increase the reservoir pressure, improve the crude oil mobility, and displace the crude oil towards the wellhead, ultimately increasing the recovery rate. The implementation of this technology typically involves three stages [36,38]: the injection stage (Huff) involves injecting CO2 into the target formation through the production well to increase the reservoir pressure; the soaking stage (Puff), following the injection stage, involves soaking CO2 in the reservoir, facilitating diffusion and engaging in physical and chemical exchange reactions with the crude oil, thereby improving the reservoir mobility; finally, in the production stage, crude oil is produced through the production well, and, at this stage, the changes in pressure and the physical and chemical properties of CO2 assist in pushing the crude oil towards the wellhead.
CO2 huff-n-puff oil recovery technology is widely used to increase the recovery rates of low-permeability reservoirs, high-water-cut oilfields, and high-viscosity oil reservoirs [10,32,38]. By adjusting parameters such as the CO2 injection volume, injection pressure, and injection duration, the effective development of different types of reservoirs can be achieved. Despite its excellent performance in enhancing recovery rates, the application of this technology still faces some challenges, including the uneven distribution of CO2, interactions between rocks and oil, and reservoir changes induced by injection [39,40].
The mechanisms underlying CO2 huff-n-puff for production enhancement mainly include the following aspects [32,41,42,43,44,45]: (1) reducing the crude oil viscosity and increasing the energy; (2) preventing rock expansion and relieving near-wellbore blockages; (3) promoting the alteration of the rock wettability; (4) decreasing interfacial tension and reducing the displacement resistance. These mechanisms work together to play a significant role in enhancing the recovery rates through CO2 huff-n-puff oil recovery technology [46,47].
The Mutou Oilfield has entered an ultra-high-water-cut stage (94.7%), with a large proportion of low-permeability reserves and an average recovery rate of only 22.5%, so it has great potential for recovery. The situation regarding stable production is severe, and there is a strong demand for reservoir stimulation. In the MM block, the porosity is 18%, the permeability is 12.5 mD, the reservoir temperature is 70 °C, the reservoir pressure is 14.5 MPa, the reservoir depth is 1200 m, the formation crude oil density is 0.847 g/cm³, and the formation crude oil viscosity is 7.8 mPa·s. The existing problems include fault blocks that are small, fragmented, scattered, and thin; ineffective water injection; incomplete injection–production connectivity; poor sweeping in oil-rich areas; and limitations in tapping into low-production reserves. In response to the low-energy well areas of the MM block, which are rich in remaining oil and poor in flooded conformance, NSS CO2 huff-n-puff oil recovery technology is employed to enlarge the swept volume and increase the well production.
This study, on the basis of the actual conditions in the MM block, conducted experiments including a crude oil and CO2–crude oil swelling experiment, minimum miscibility pressure testing experiment, high-temperature and high-pressure microfluidic experiment, and NSS CO2 huff-n-puff oil recovery pilot test on-site. These experiments revealed the mechanisms and patterns of NSS CO2 huff-n-puff oil recovery technology. A systematic analysis of the results and insights achieved from the application of NSS CO2 huff-n-puff oil recovery in low-permeability reservoirs in the Mutou Oilfield was conducted, which provides key technical support for the large-scale application of NSS CO2 huff-n-puff oil recovery technology in low-permeability reservoirs, promoting the innovative development of this technology.

2. Experimental Methods

2.1. Crude Oil Sample

A crude oil sample was obtained from Well MM-4-2 in the Mutou Oilfield under reservoir conditions of 70 °C and 12.9 MPa. The density of the crude oil sample was measured to be 0.8684 g/cm3 at 20 °C and 0.8476 g/cm3 at 50 °C. The original viscosity of the crude oil sample at 50 °C was measured to be 25.9 mPa·s. The composition analysis results of the formation crude oil from Well MM-4-2 under reservoir conditions are shown in Table 2.

2.2. Composition of Formation Water

The composition of the formation water used in the experiment is listed in Table 3.

2.3. Methods to Characterize Crude Oil Properties

To characterize the PVT properties of the crude oil, conventional PVT experiments were conducted, including a CO2–crude oil swelling experiment. These experiments aimed to determine the properties of the CO2–crude oil mixture, such as the CO2 solubility, volume swelling factor, and crude oil viscosity. A visualization apparatus was used to measure the oil swelling factor at different equilibrium pressures. The apparatus consisted of a high-pressure display unit, a high-pressure cylinder, a constant-flow pump, and a temperature controller. The experimental procedure was as follows.
(1)
Clean, dry, and vacuumize the whole system, including the PVT kettle, pipeline, and sample barrel. Inject a 40 mL crude oil sample into the visualization chamber.
(2)
At 70 °C, use CO2 with purity of 99.99% to pressurize to a predetermined pressure. Stabilize until the system pressure reaches equilibrium. Use an oil bath to regulate the experimental temperature.
(3)
Measure the height and pressure of the sample. After stirring, keep the pressure stable for 40 min to allow the system to reach thermodynamic equilibrium. At the same time, measure the oil level and volume.
(4)
Remove the oil from the kettle and place it into a small cylinder that has been evacuated and weighed. Calculate the mass of CO2 dissolved in the oil through the weight difference method.
(5)
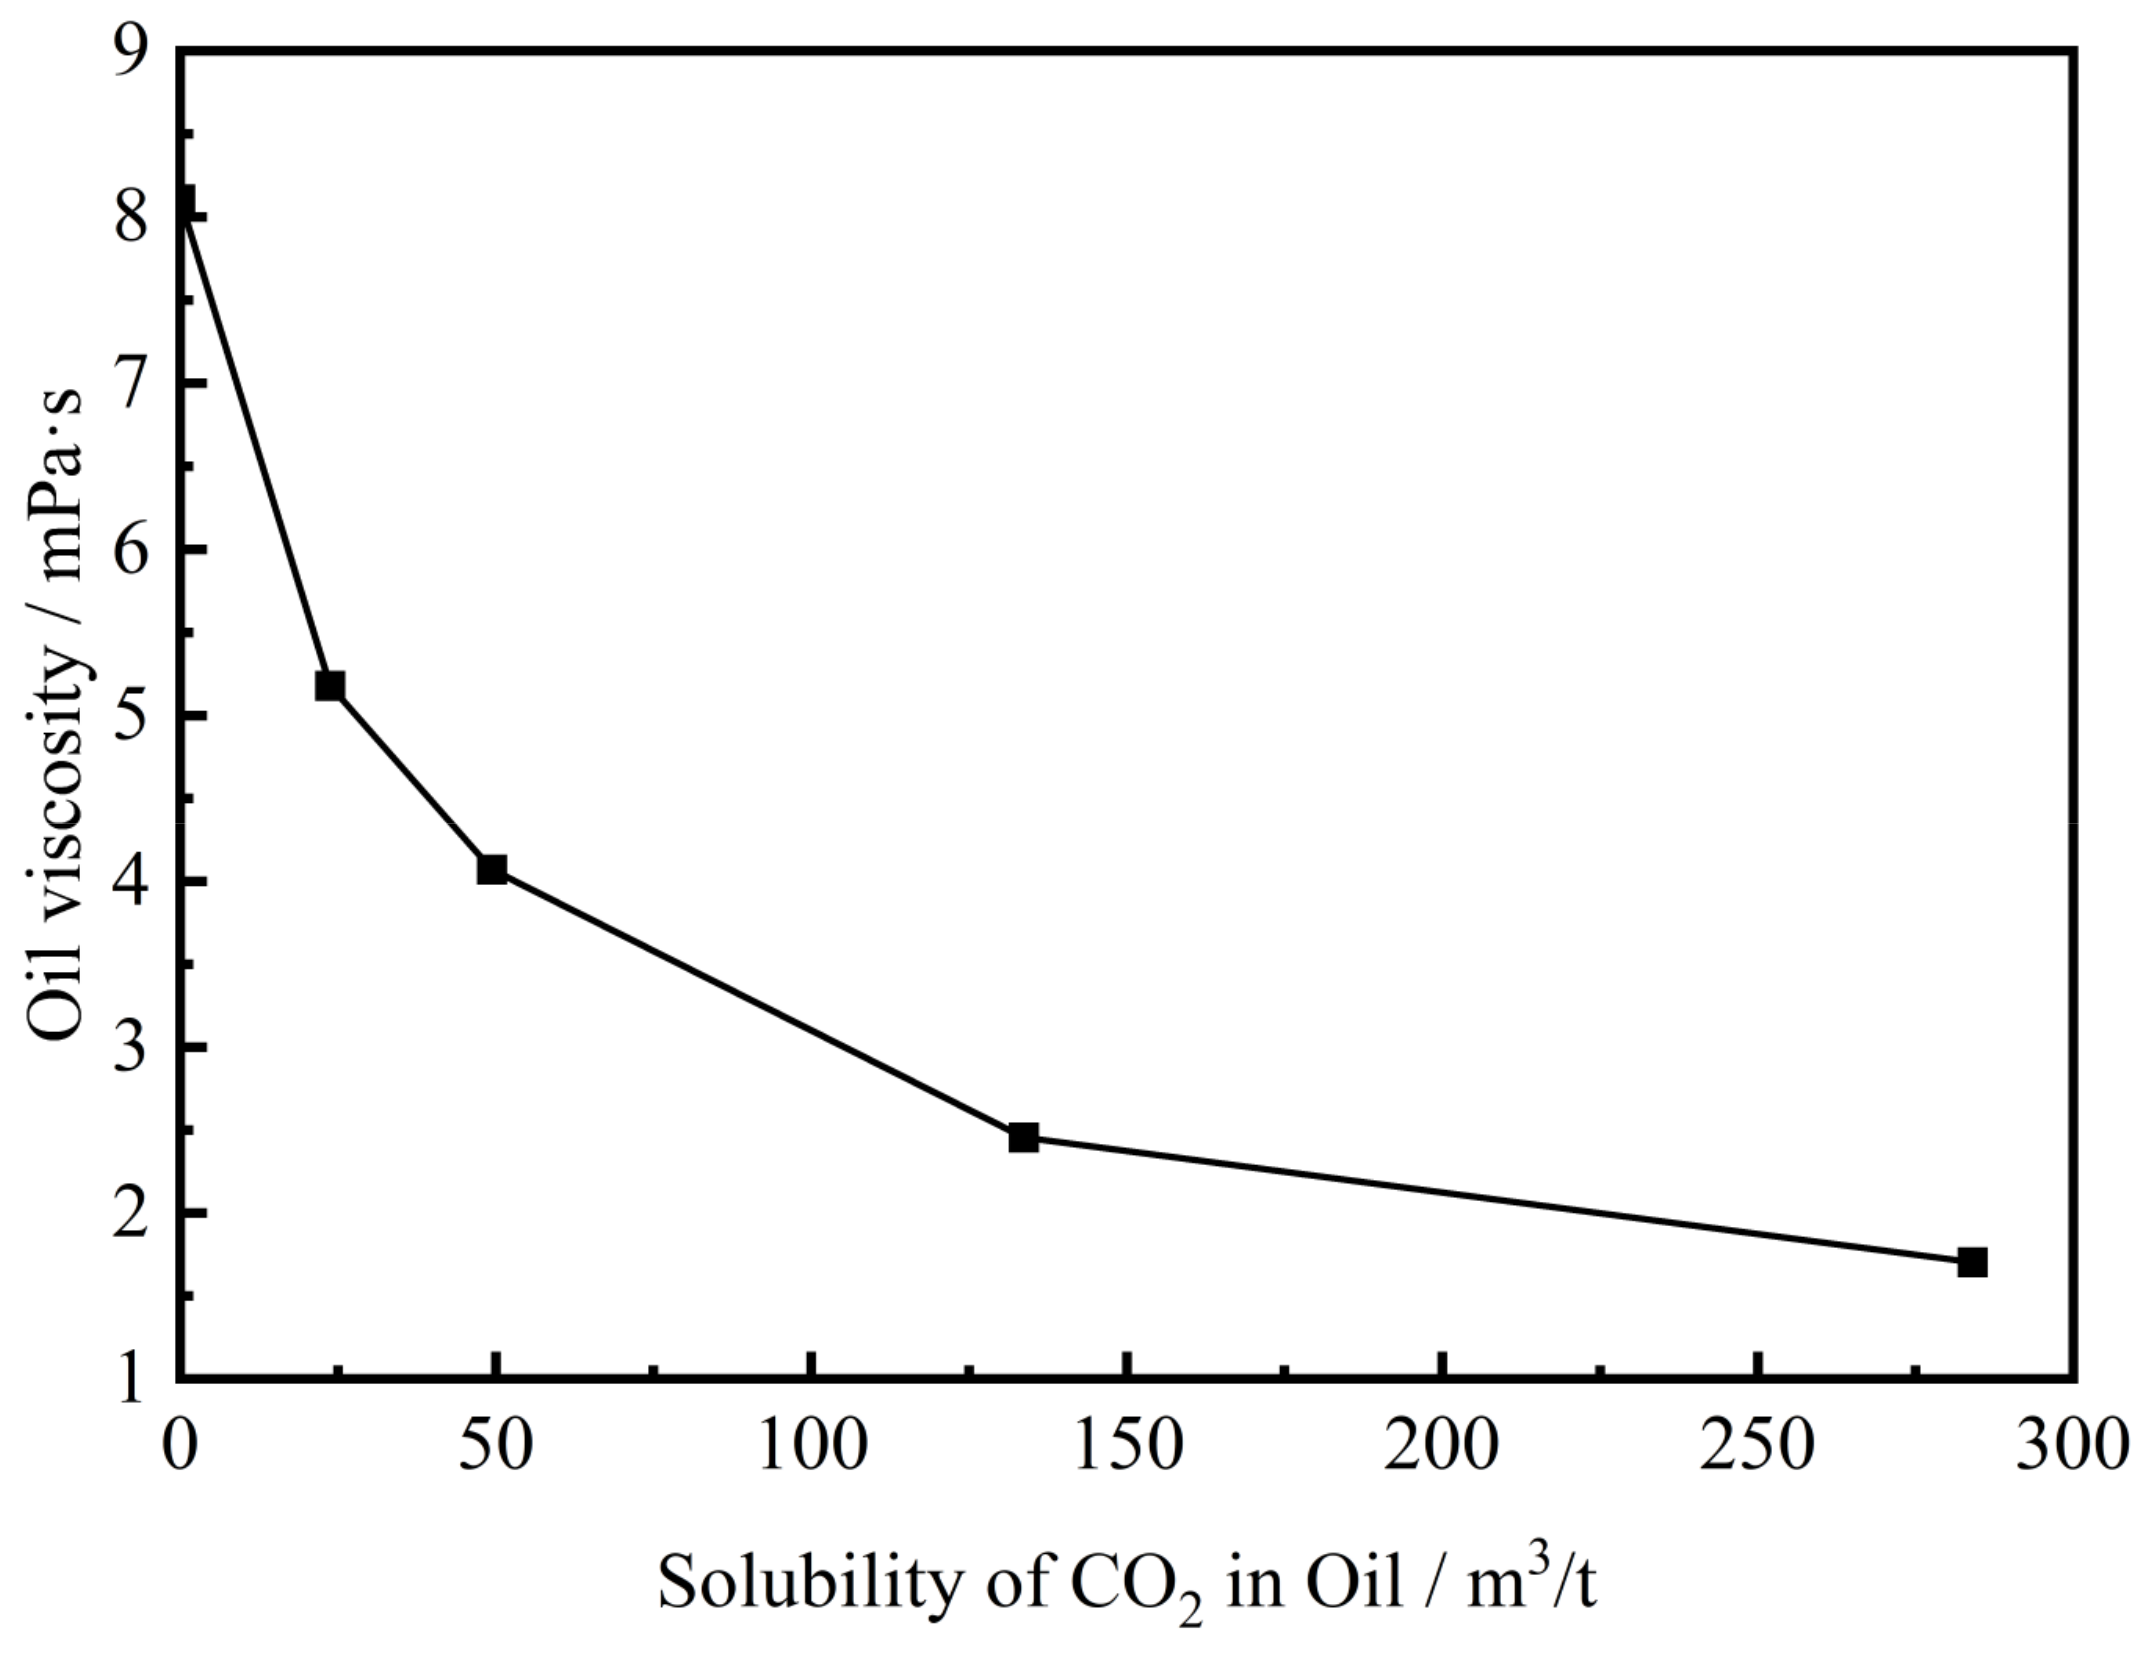
Use a high-temperature and high-pressure viscometer to measure the viscosity of the crude oil at different solubilities.
The crude oil swelling factor (SF) is defined as the ratio of the crude oil volume Vo,f after the CO2 injection pressure stabilizes to the initial crude oil volume Vo,i.
S F = V o , f V o , i
The minimum miscibility pressure (MMP) is a crucial parameter in the process of CO2 huff-n-puff. The MMP was determined with a slim tube experiment in this study. Figure 1 shows the schematic diagram of the experimental apparatus for the measurement of the MMP of CO2 and crude oil at 70 °C. The apparatus primarily consisted of an injection pump, slim tube (length = 15 cm, diameter = 4.58 mm), back pressure regulator, gas–liquid separator, gas flow meter, and temperature controller. The experimental procedure was as follows.
(1)
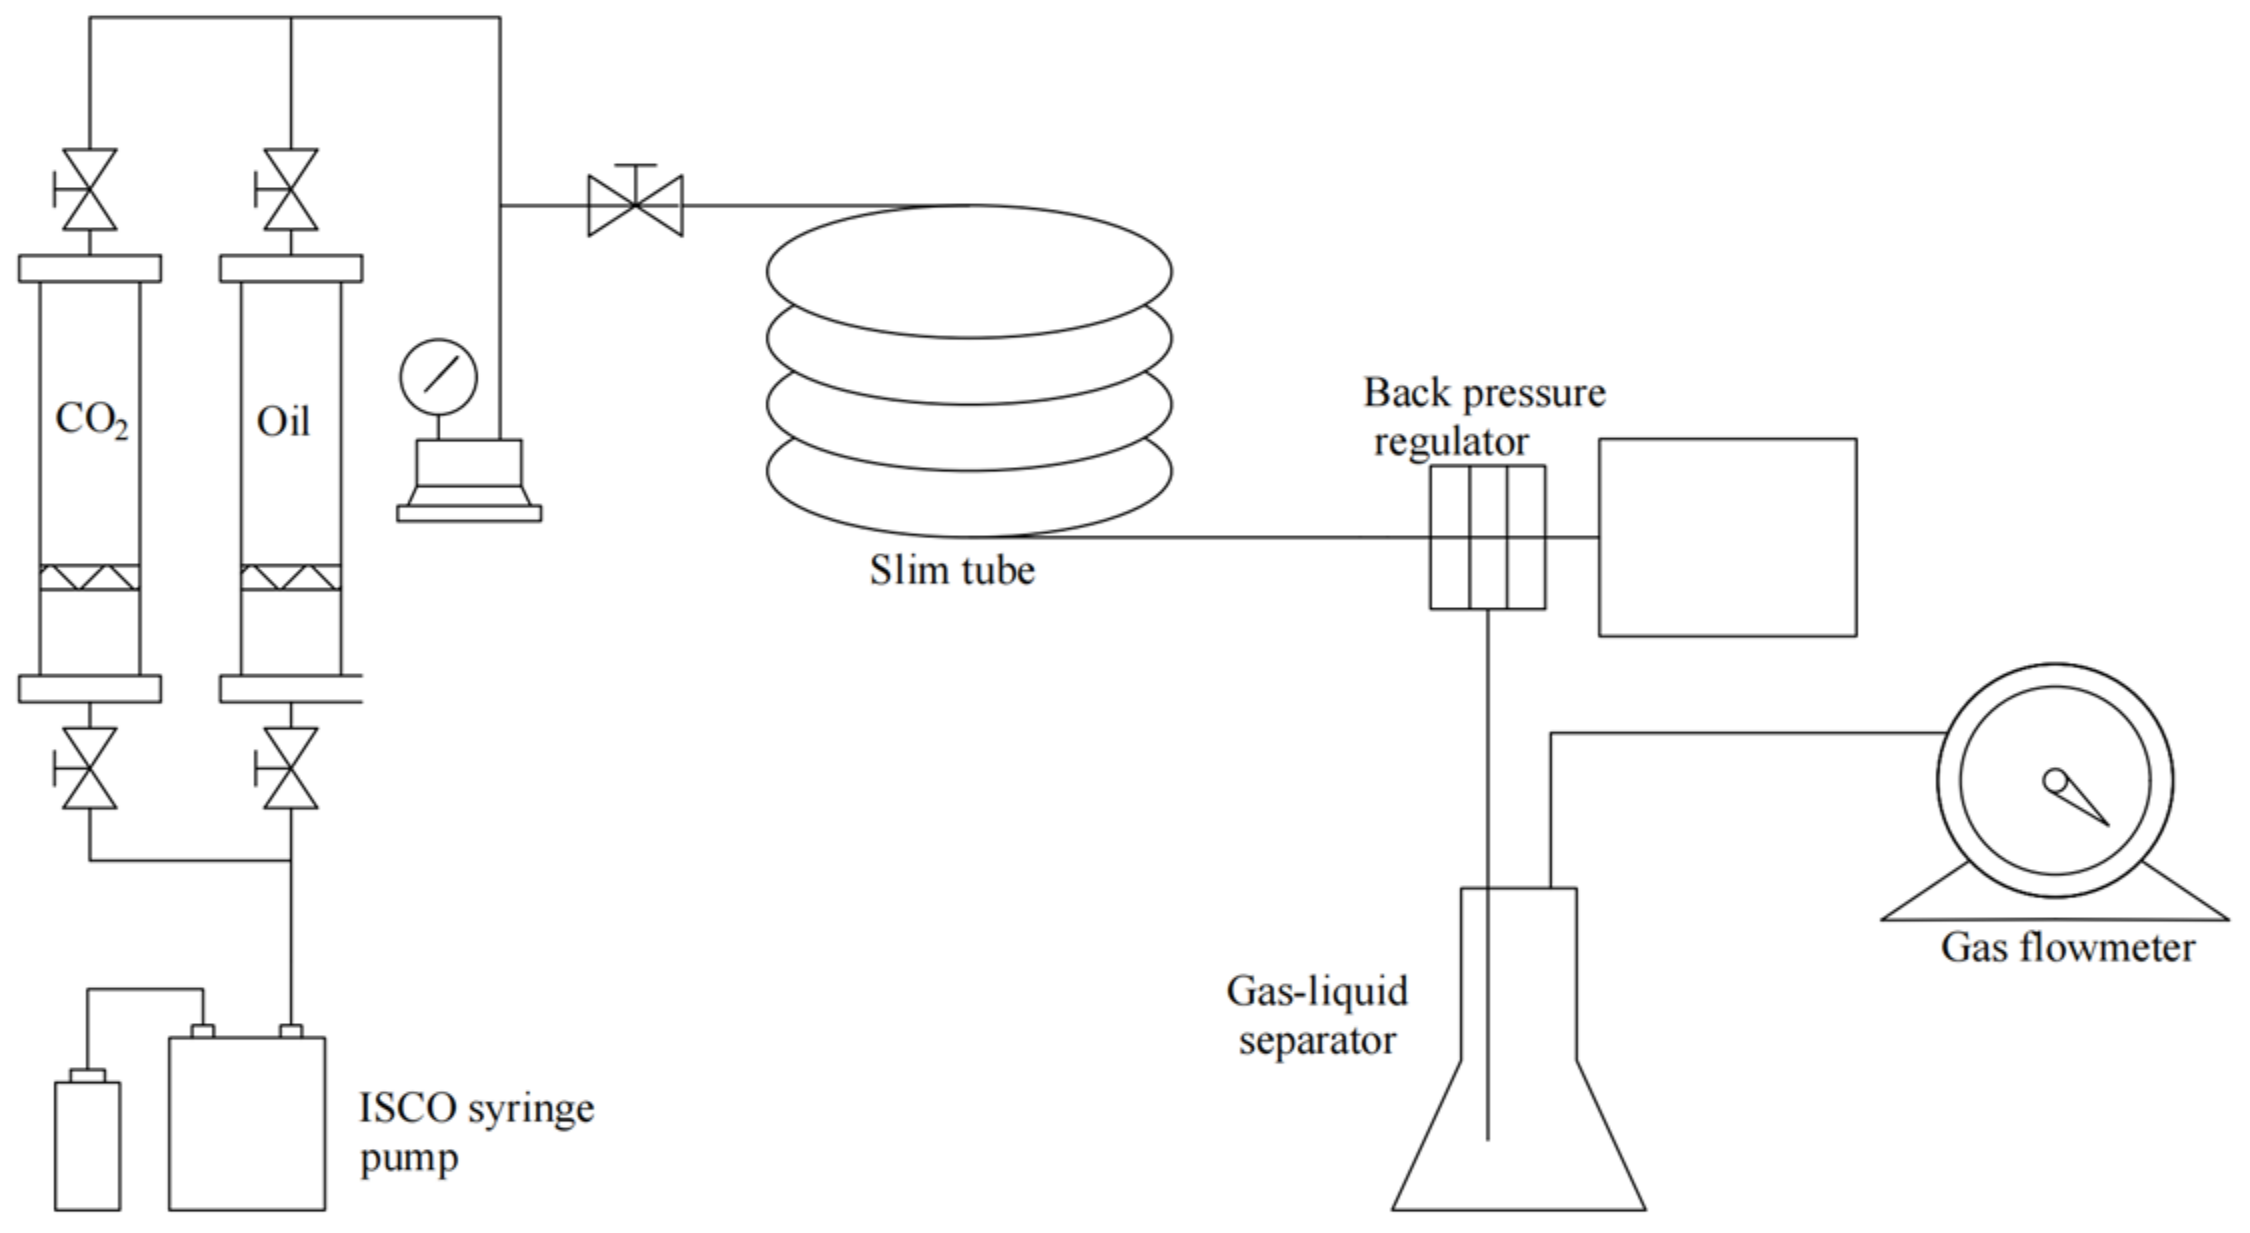
Six pressure points were set for the experiment, which included the MMP, at least two pressure values greater than the MMP, and two pressure values less than the MMP. The original formation pressure of the Mutou Oilfield was used as the reference to set the injection pressure, and six injection pressure points were selected for the slim tube experiment: 15 MPa, 20 MPa, 25 MPa, 30 MPa, 35 MPa, and 40 MPa.
(2)
The temperature and pressure of the equipment were adjusted to specified values and it was run for a period of time to balance the formation system. A back pressure valve was used to control the injection pressure to ensure that the set pressure was reached.
(3)
Then, CO2 was injected for displacement. The gas injection rate was set to be 0.15 mL/min, and the volume of the produced crude oil was measured during displacement.
(4)
When injecting 1.2 PV of CO2, the recovery rate remained essentially constant under different injection pressures [48]. Therefore, the recovery rate after injecting 1.2 PV of CO2 represented the overall recovery rate.

2.4. Method for High-Temperature and High-Pressure Microfluidic Experiment

The method for the testing of the effect of the NSS CO2 injection rate was as follows.
(1)
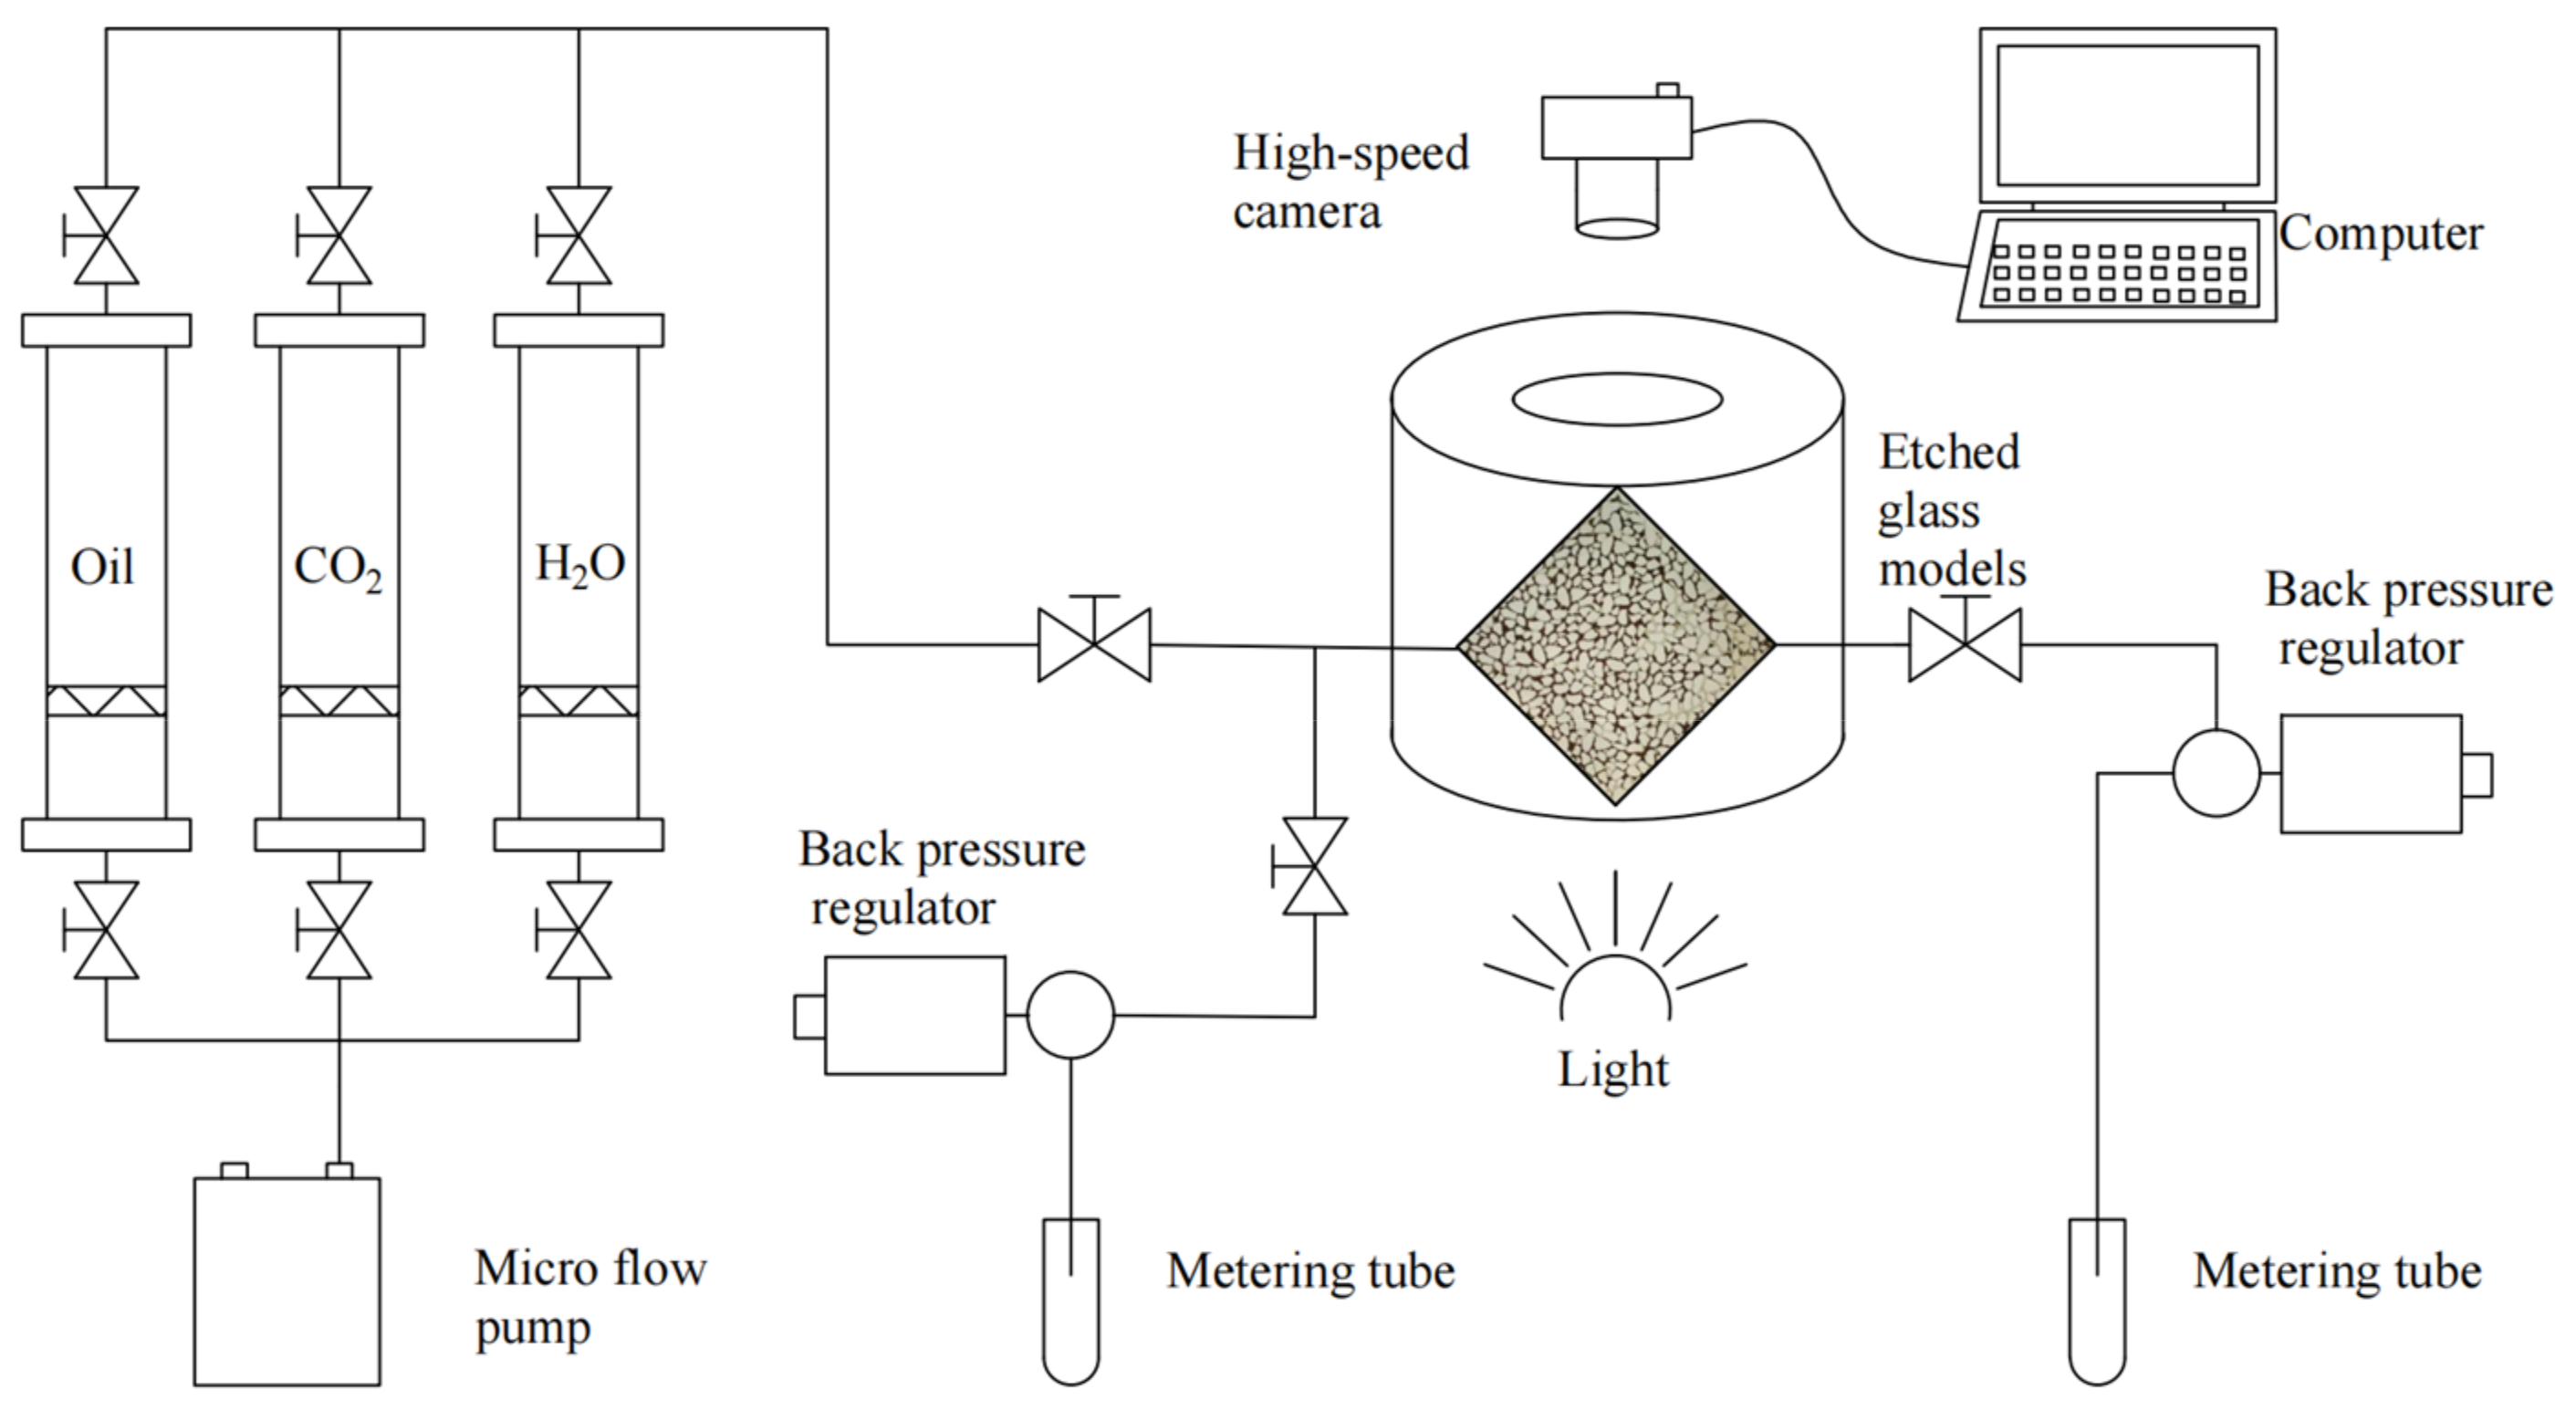
The high-temperature and high-pressure microscopic visualization displacement process is shown in Figure 2. Vacuumize it, saturate it with water and then oil, and age it.
(2)
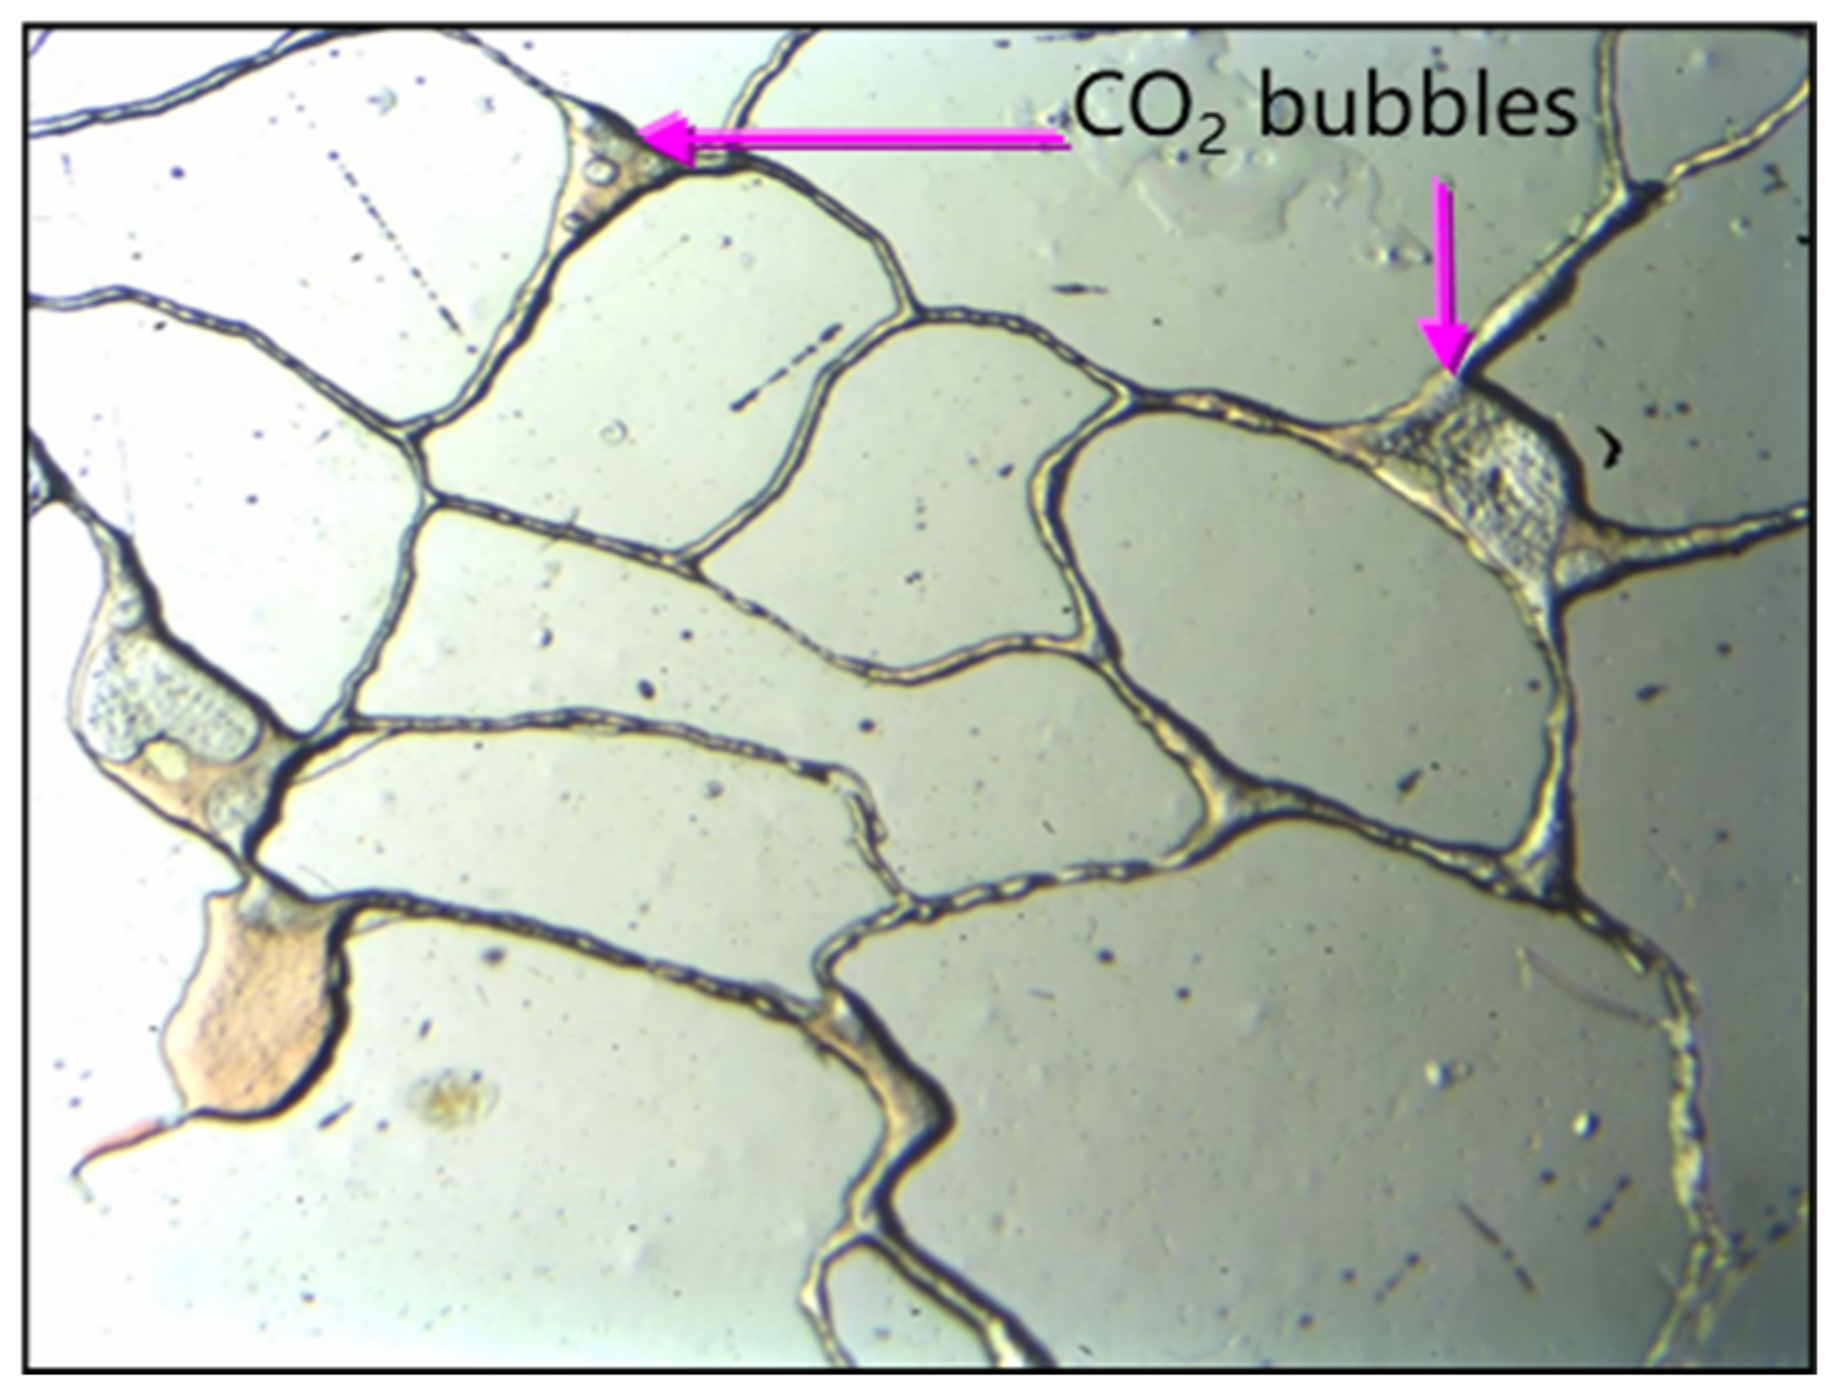
After water flooding to the high-water-cut stage, close the outlet valve. Inject CO2 at a steady constant injection rate of 0.003 mL/min for 0.3 PV or NSS stepwise increasing injection rates of 0.001 mL/min, 0.003 mL/min, and 0.005 mL/min for 0.1 PV each. Then, close the inlet valve and soak for 24 h. Open the inlet valve and record the images during the oil production process.
(3)
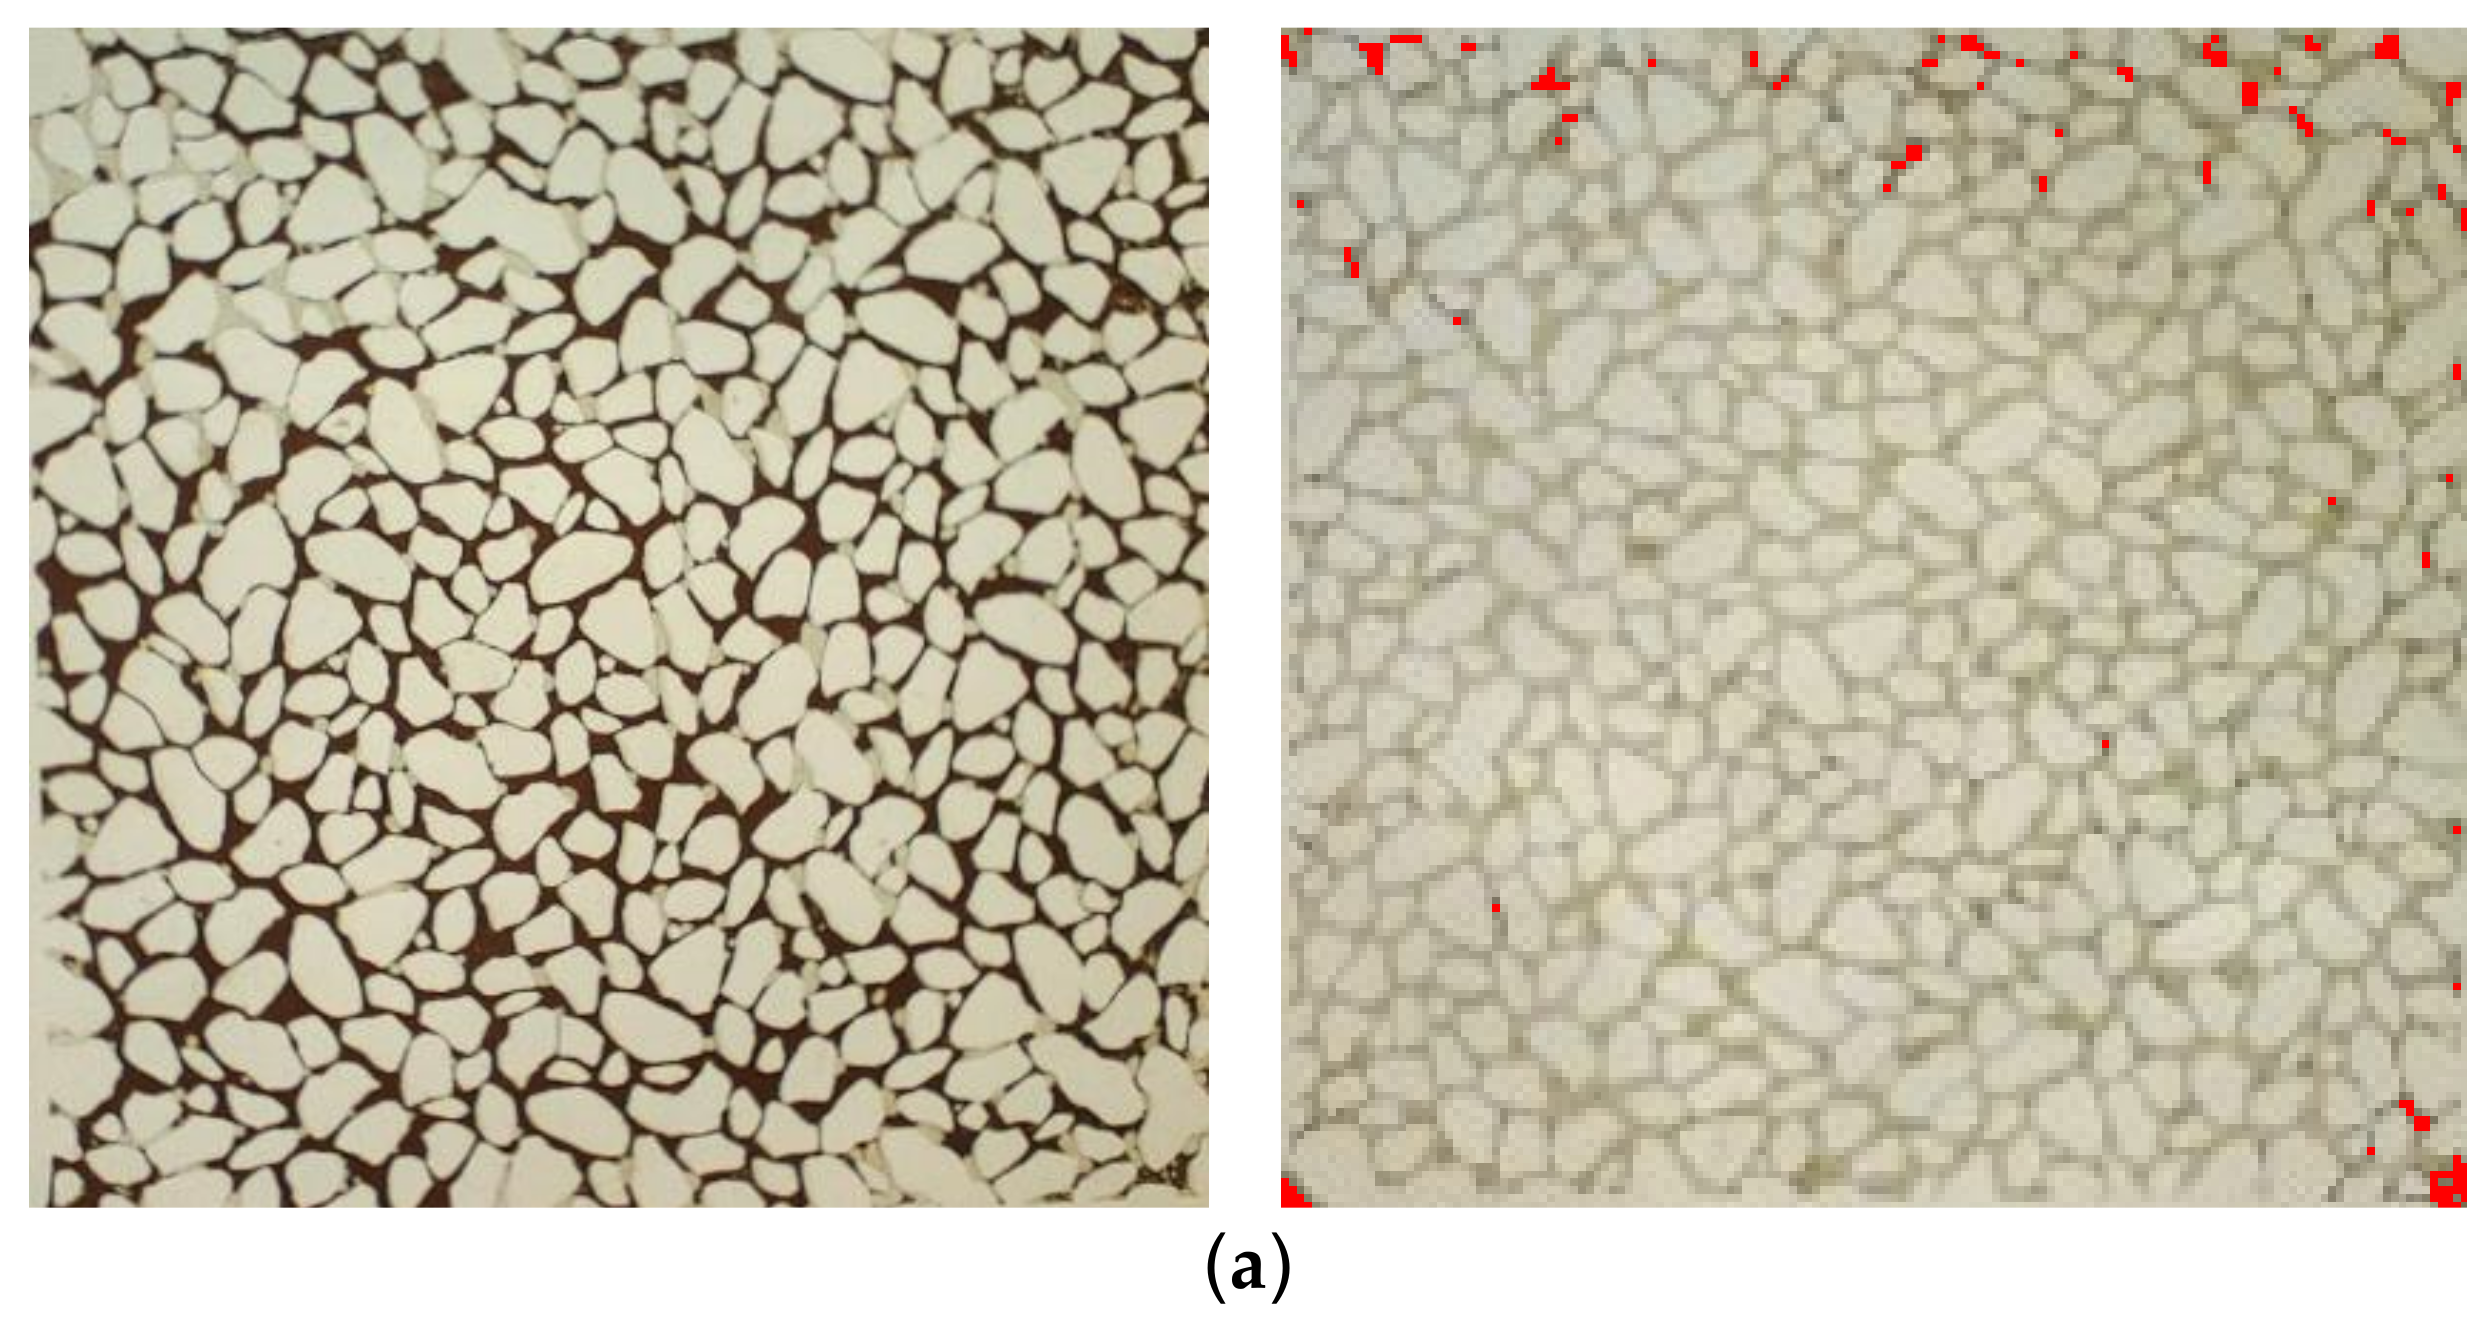
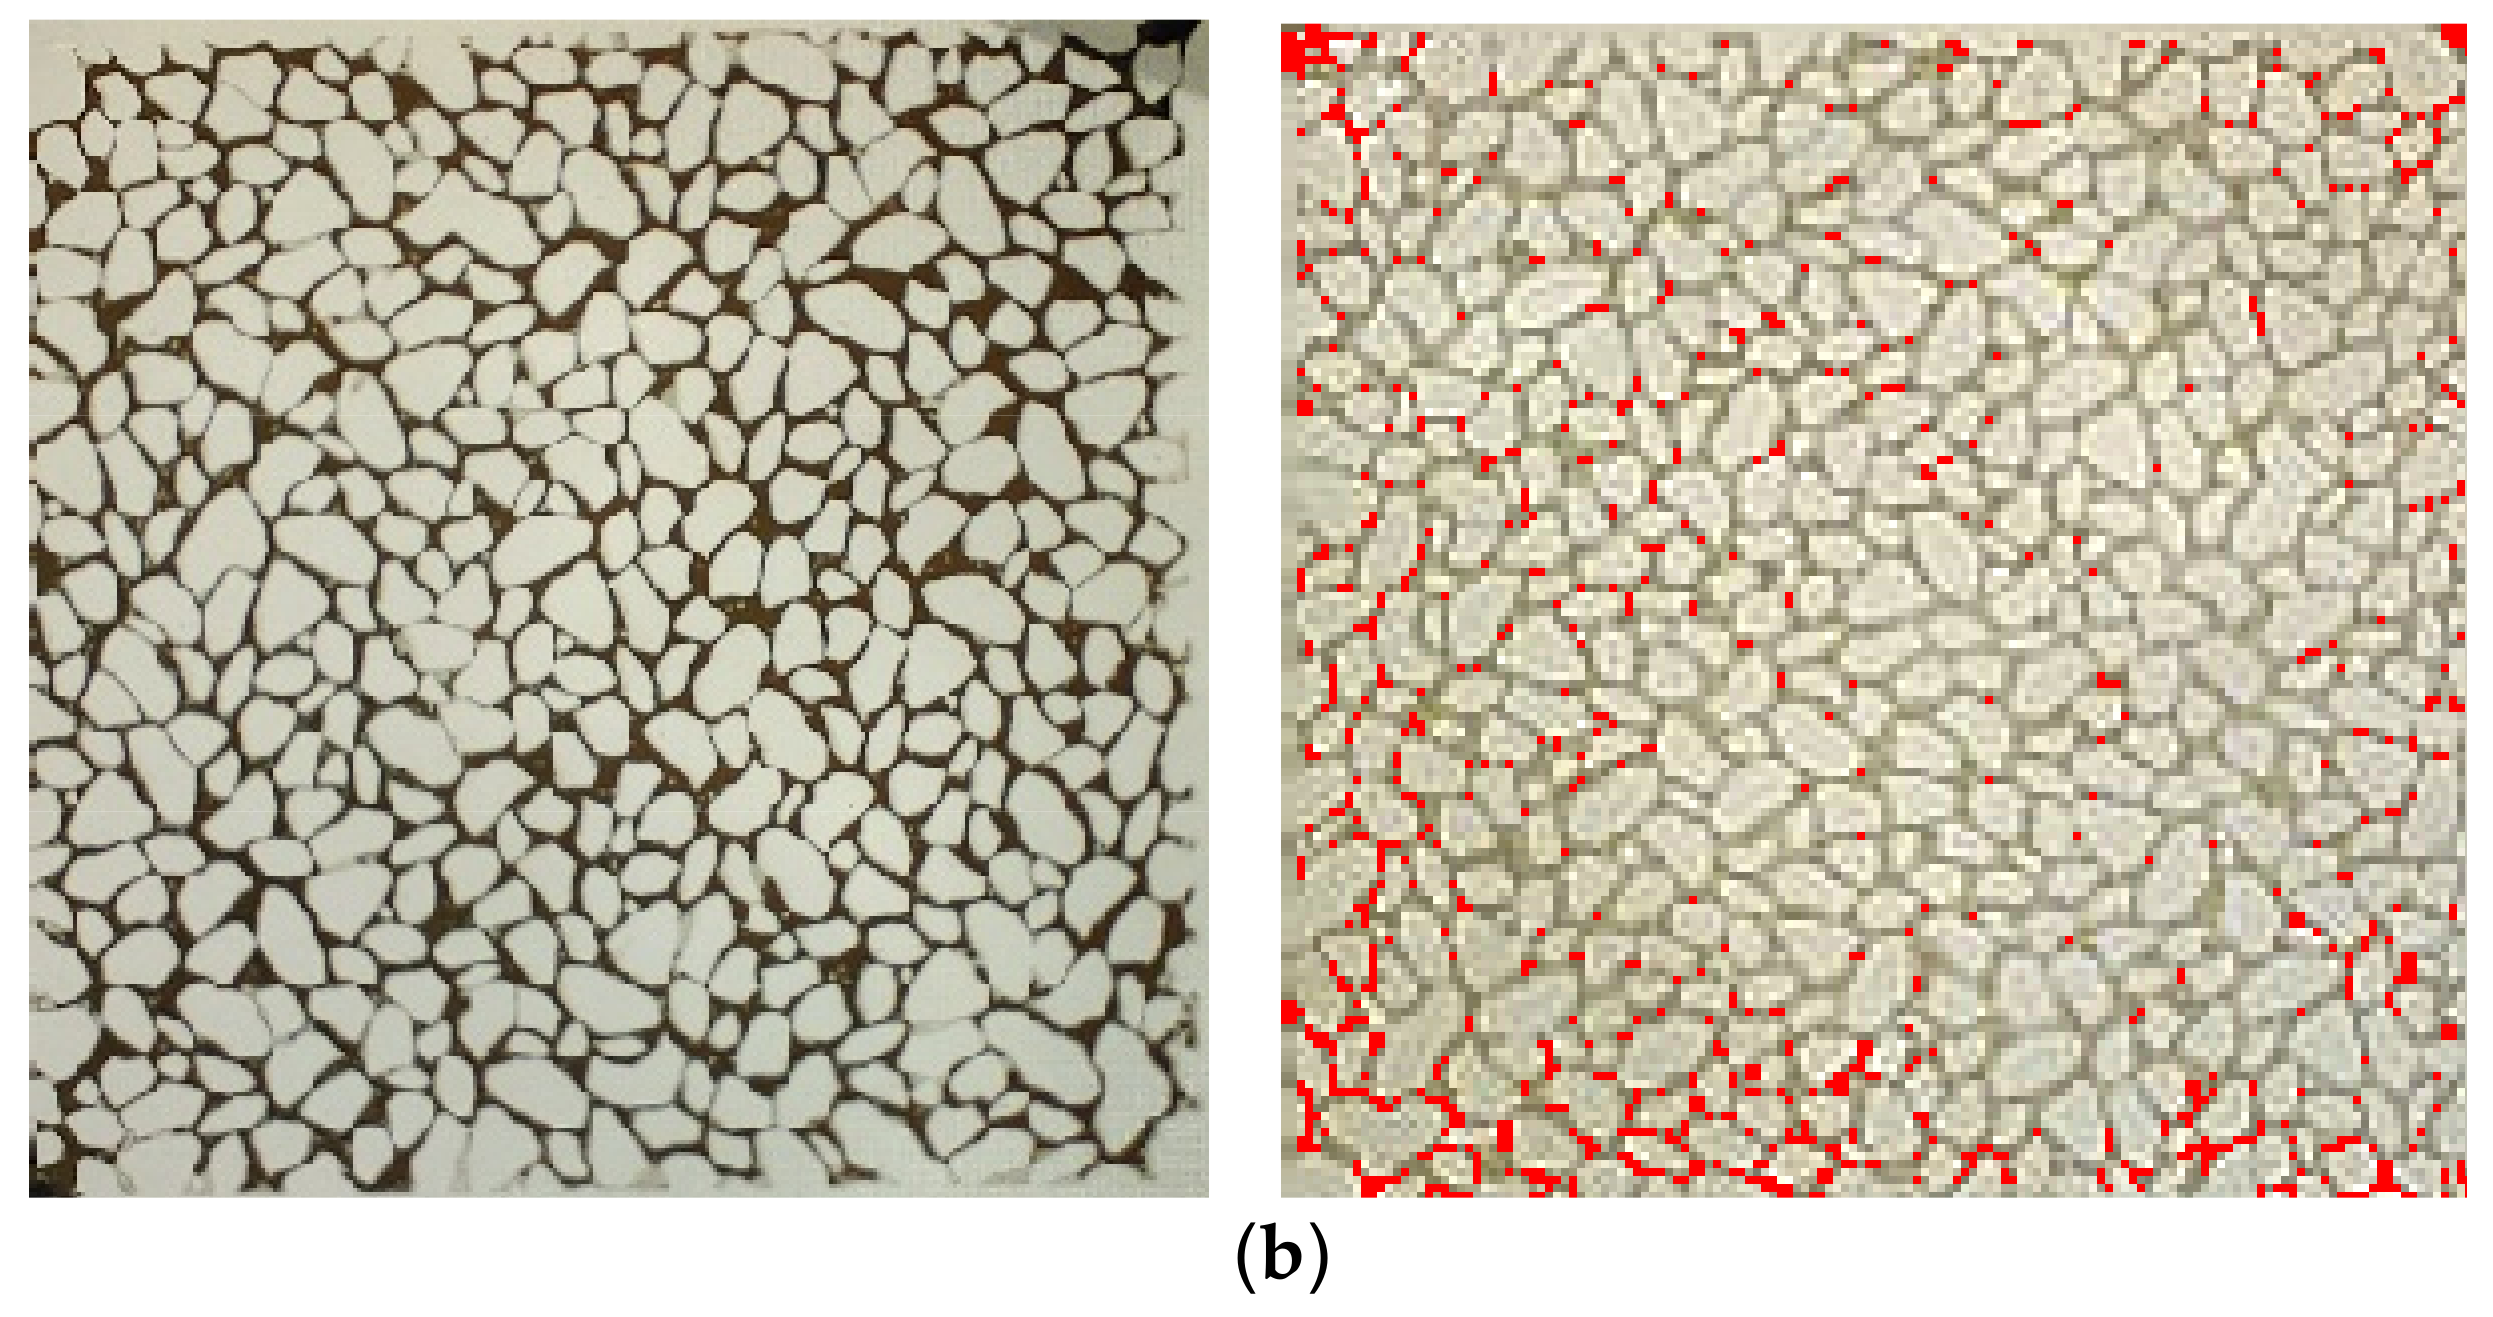
Use the software IMAGEJ v1.48 to batch-process the captured images to derive the quantified data and processed images at each moment; analyze the remaining oil and CO2 swept area, with a standard deviation of ±0.05%.

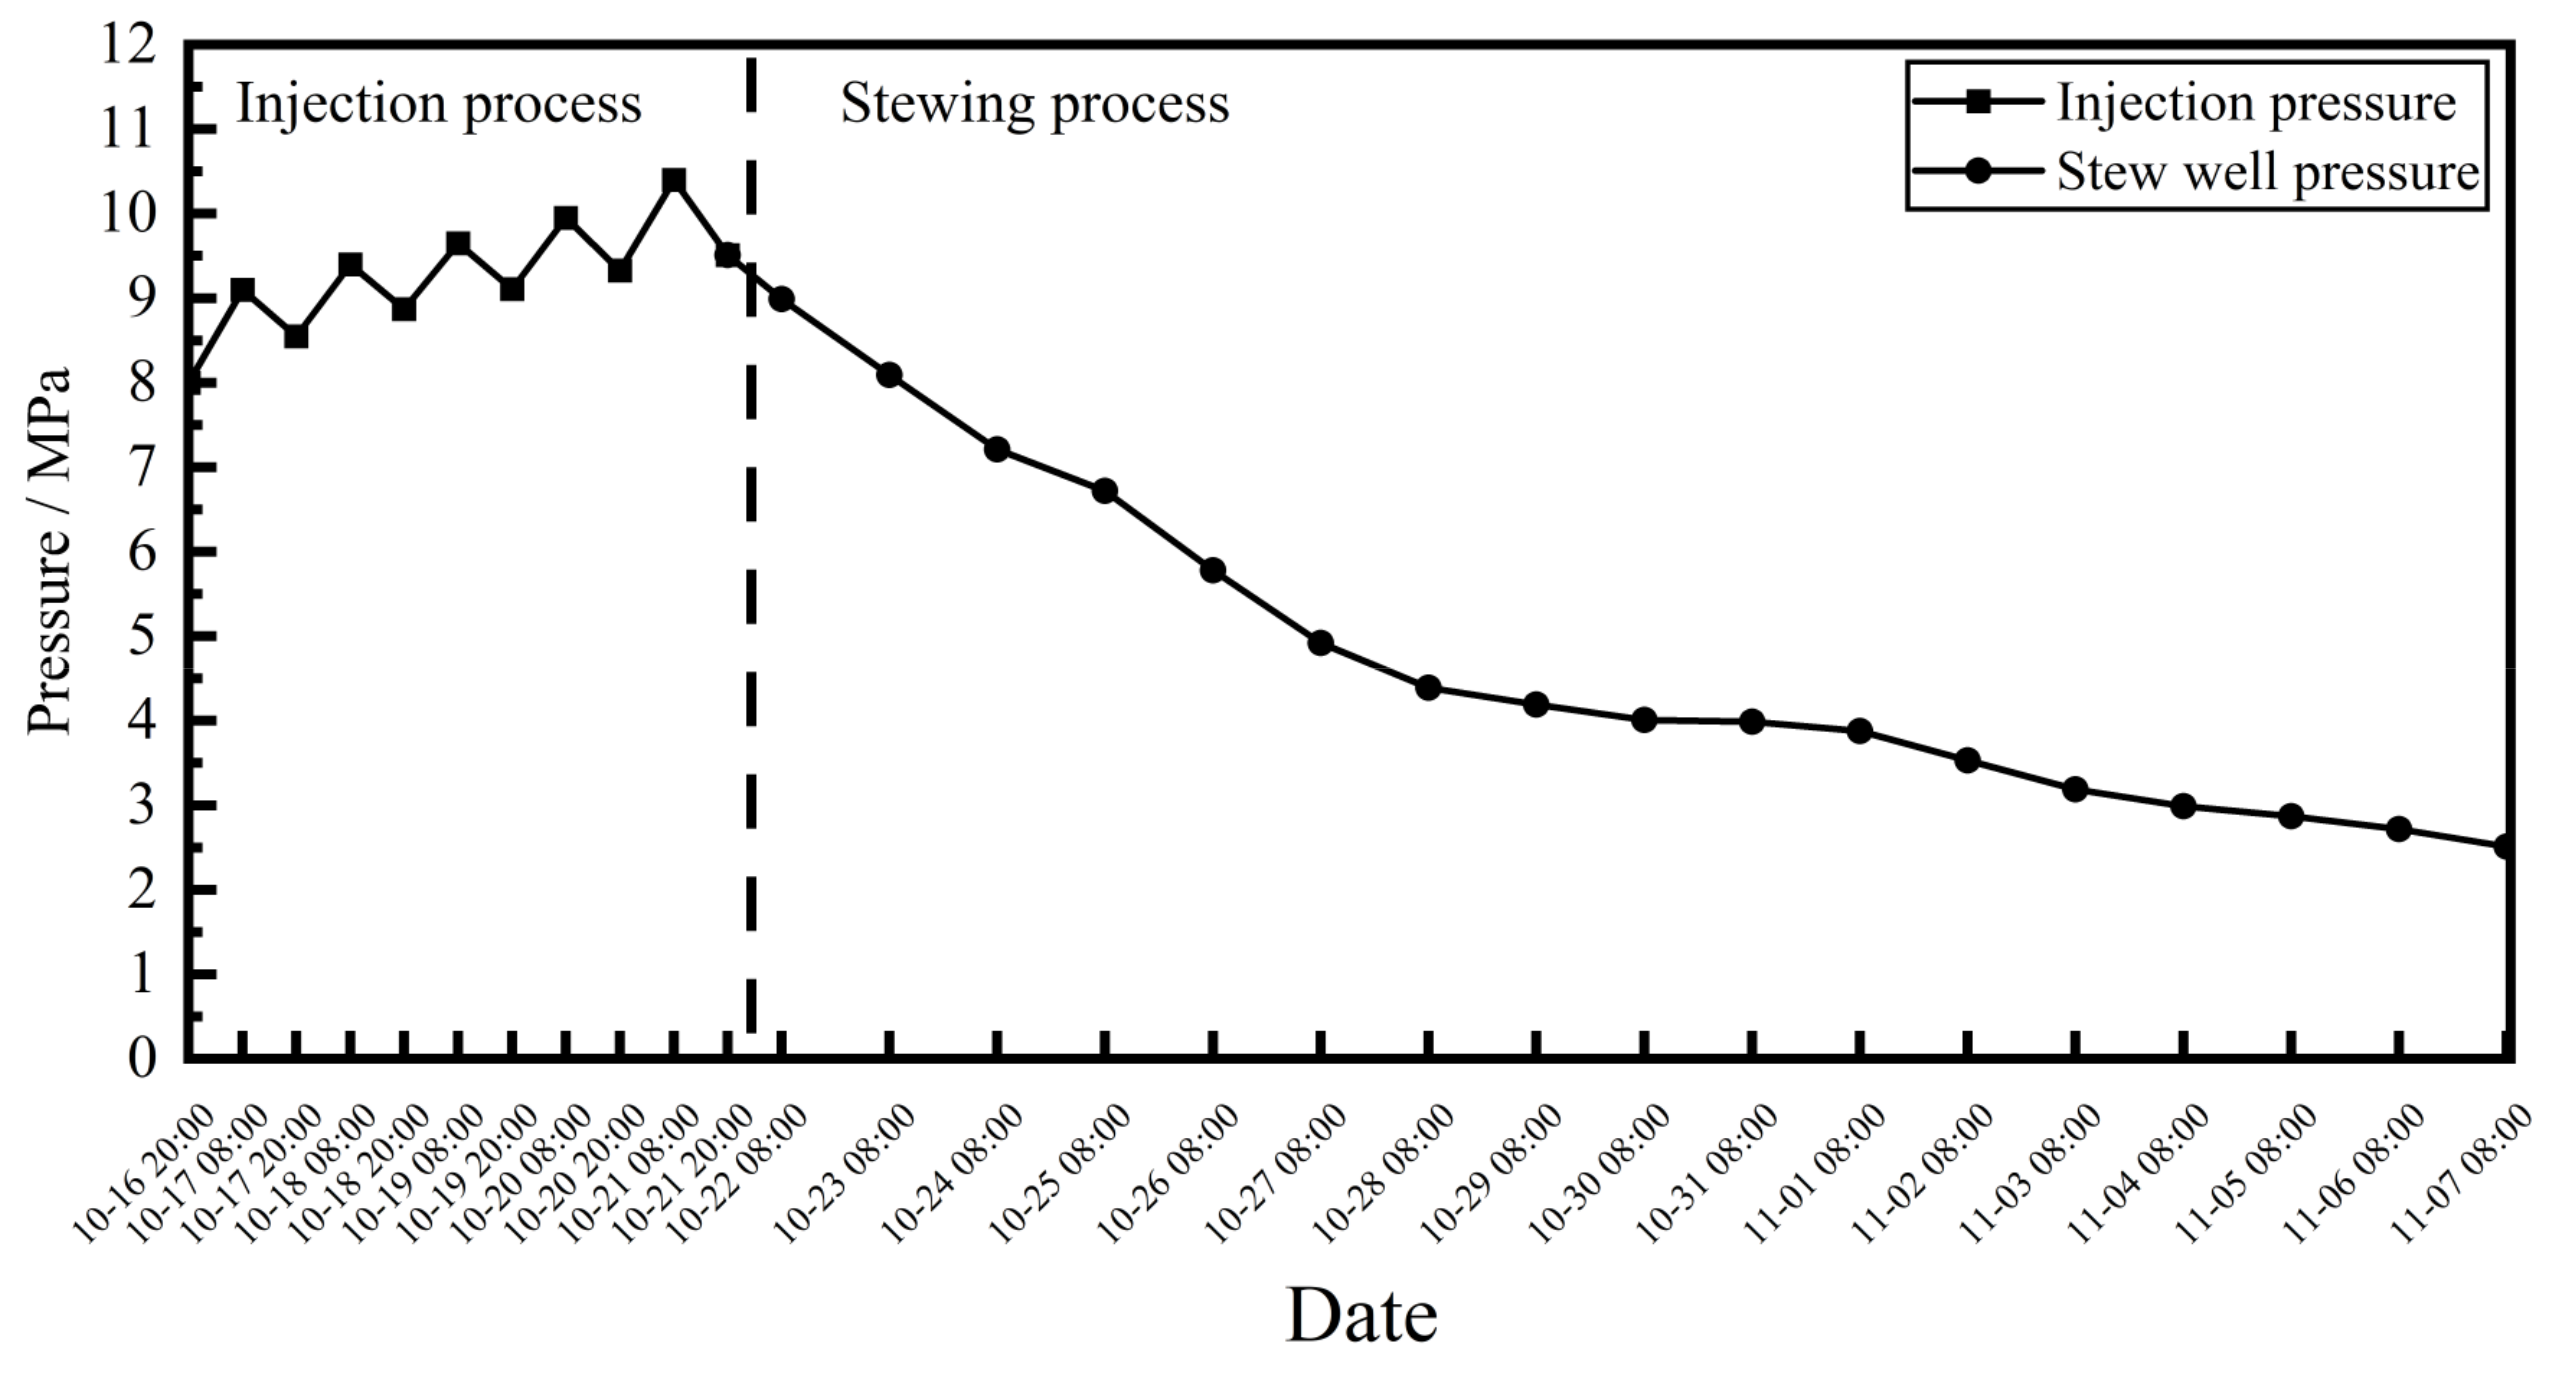
2.5. Field Pilot Test Method

Well MM-4-2 in a 2 + 2 injection–production well pattern in the Mutou Oilfield was selected as the optimal well for the NSS CO2 huff-n-puff field pilot test. The test was conducted from 16 to 21 October 2014. The CO2 was injected with a stepwise increasing injection rate between NSS plugs, and the CO2 injection rates from the 1st to the 5th day were 2.50 t/h, 2.50 t/h, 3.33 t/h, 3.33 t/h, and 5.00 t/h, respectively, with the cumulative injection of 200 tons of liquid CO2 over five days. The well was then soaked for 17 days and started production on 7 November. Throughout the NSS CO2 huff-n-puff process, the injection rate, injection pressure, oil production, and water cut were monitored. Additionally, the density of the produced oil and the composition of the produced gas were analyzed using a densitometer and gas chromatography, respectively, to assess the interaction between the injected CO2 and crude oil, enabling a more detailed analysis of the dynamic interaction and injection performance of CO2.

3. Results and Discussion

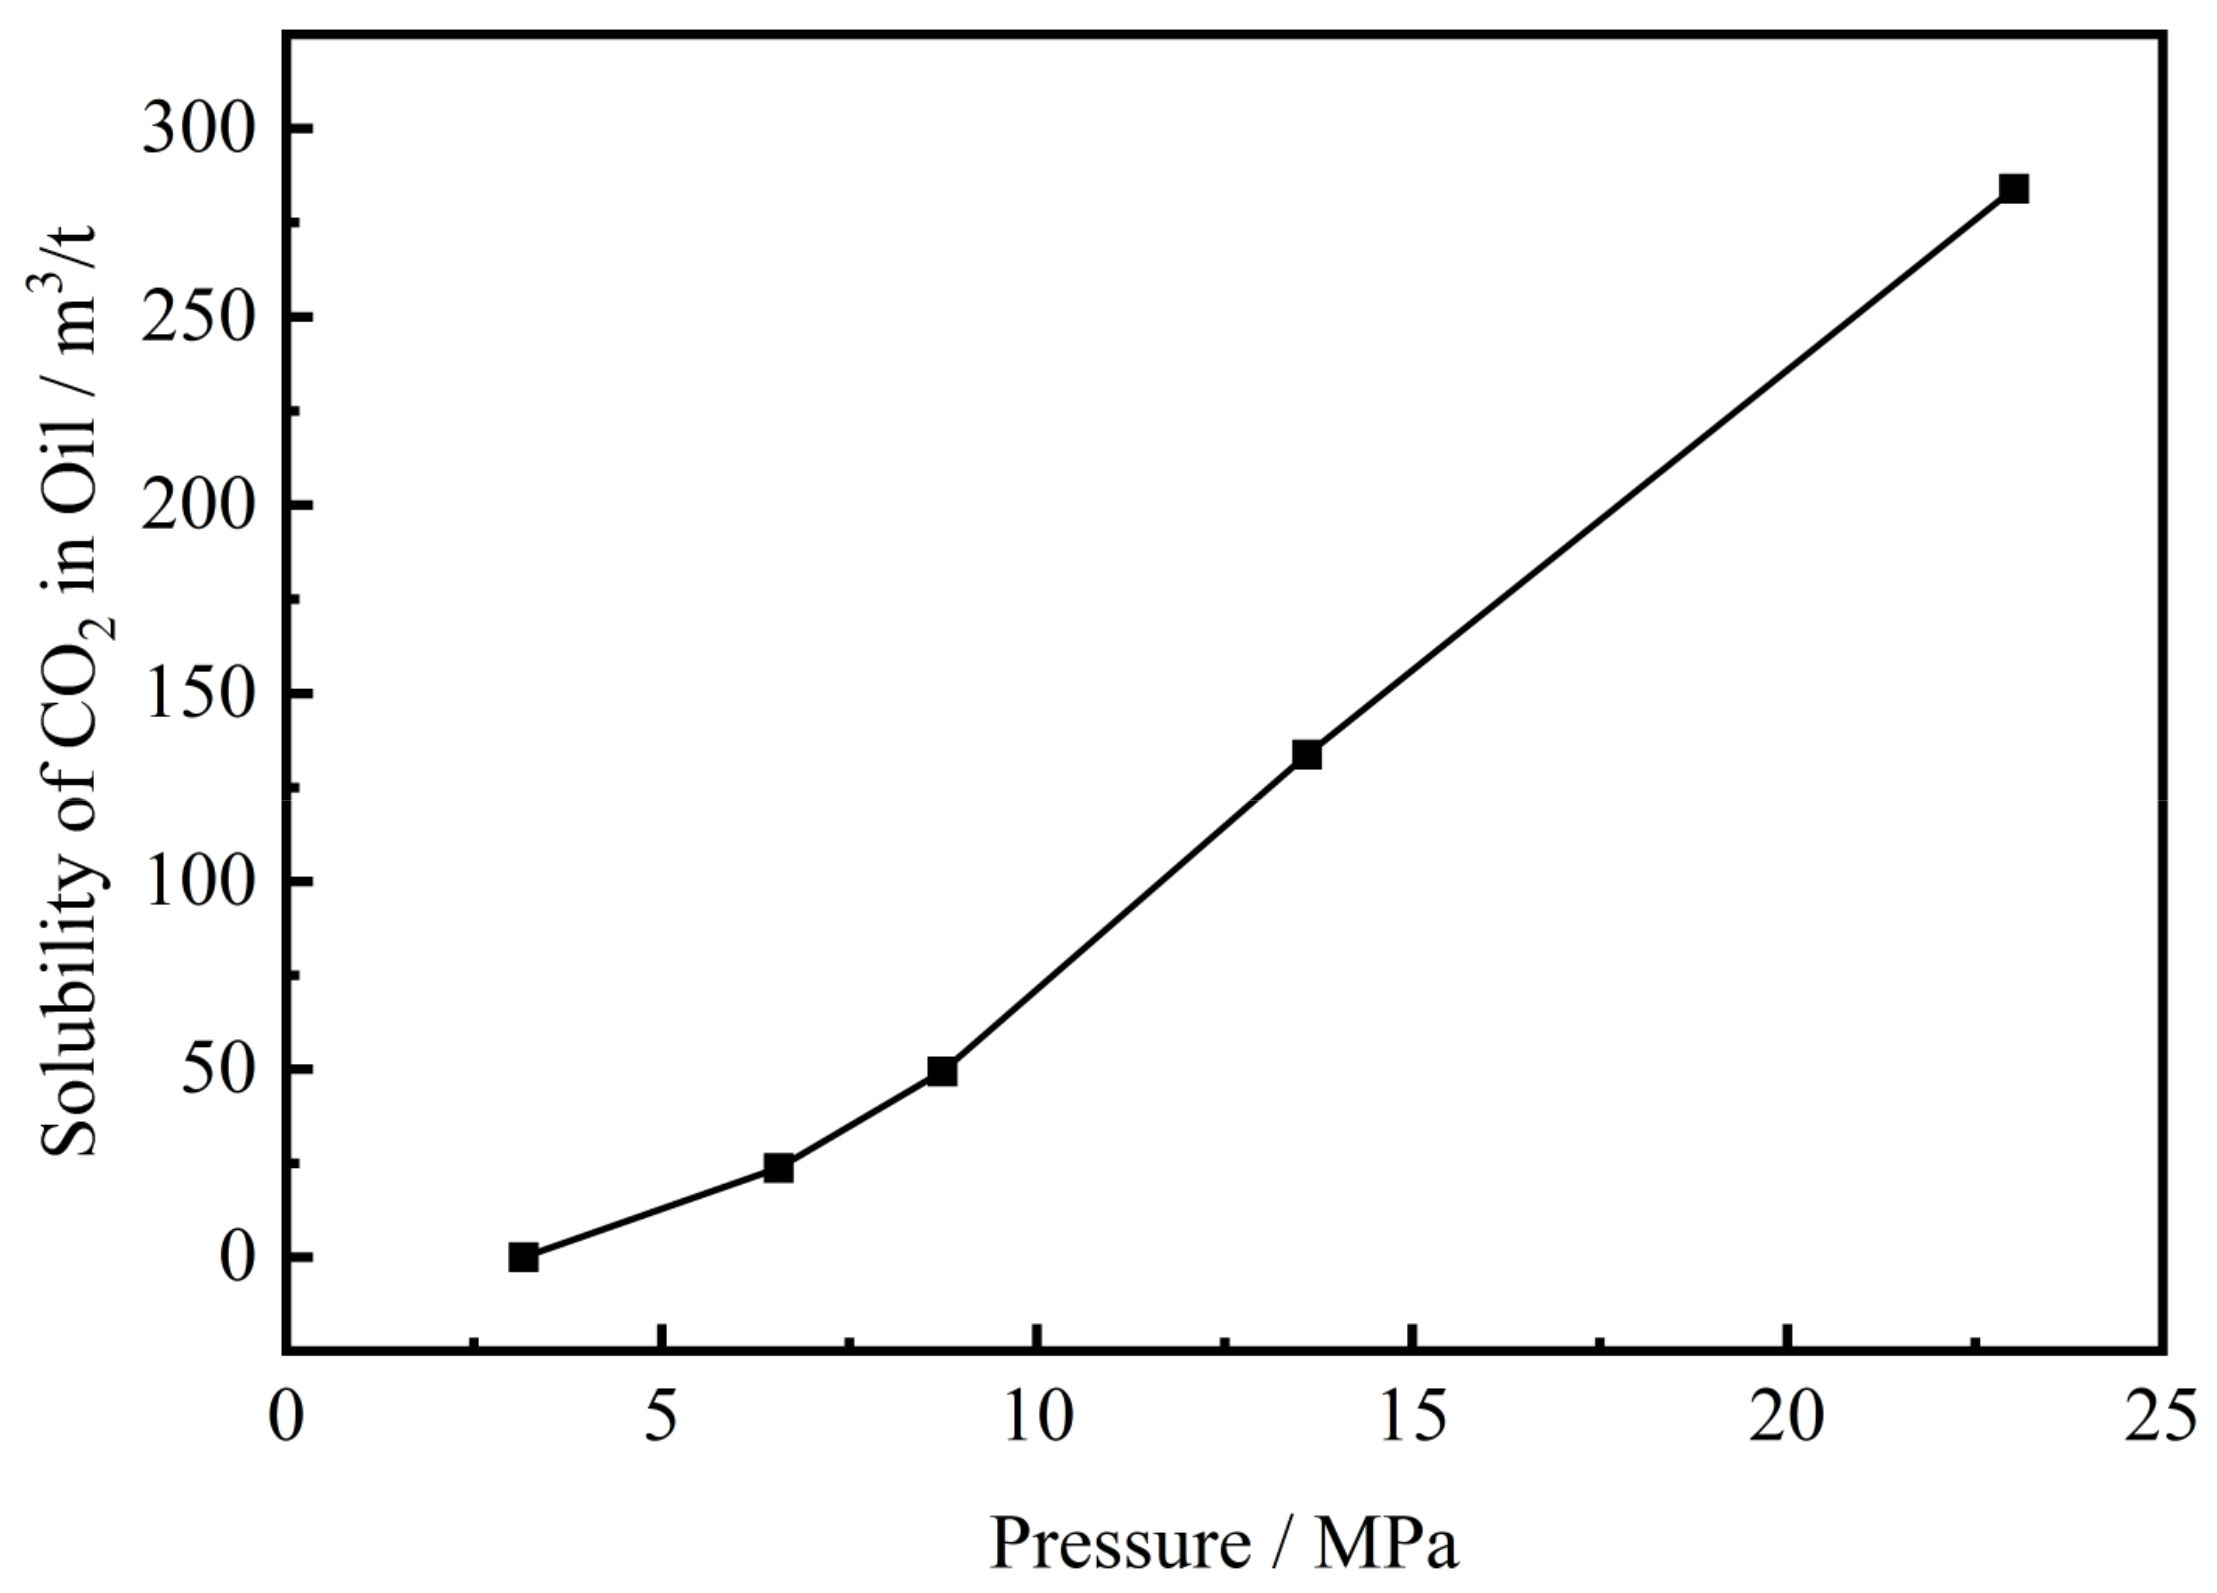
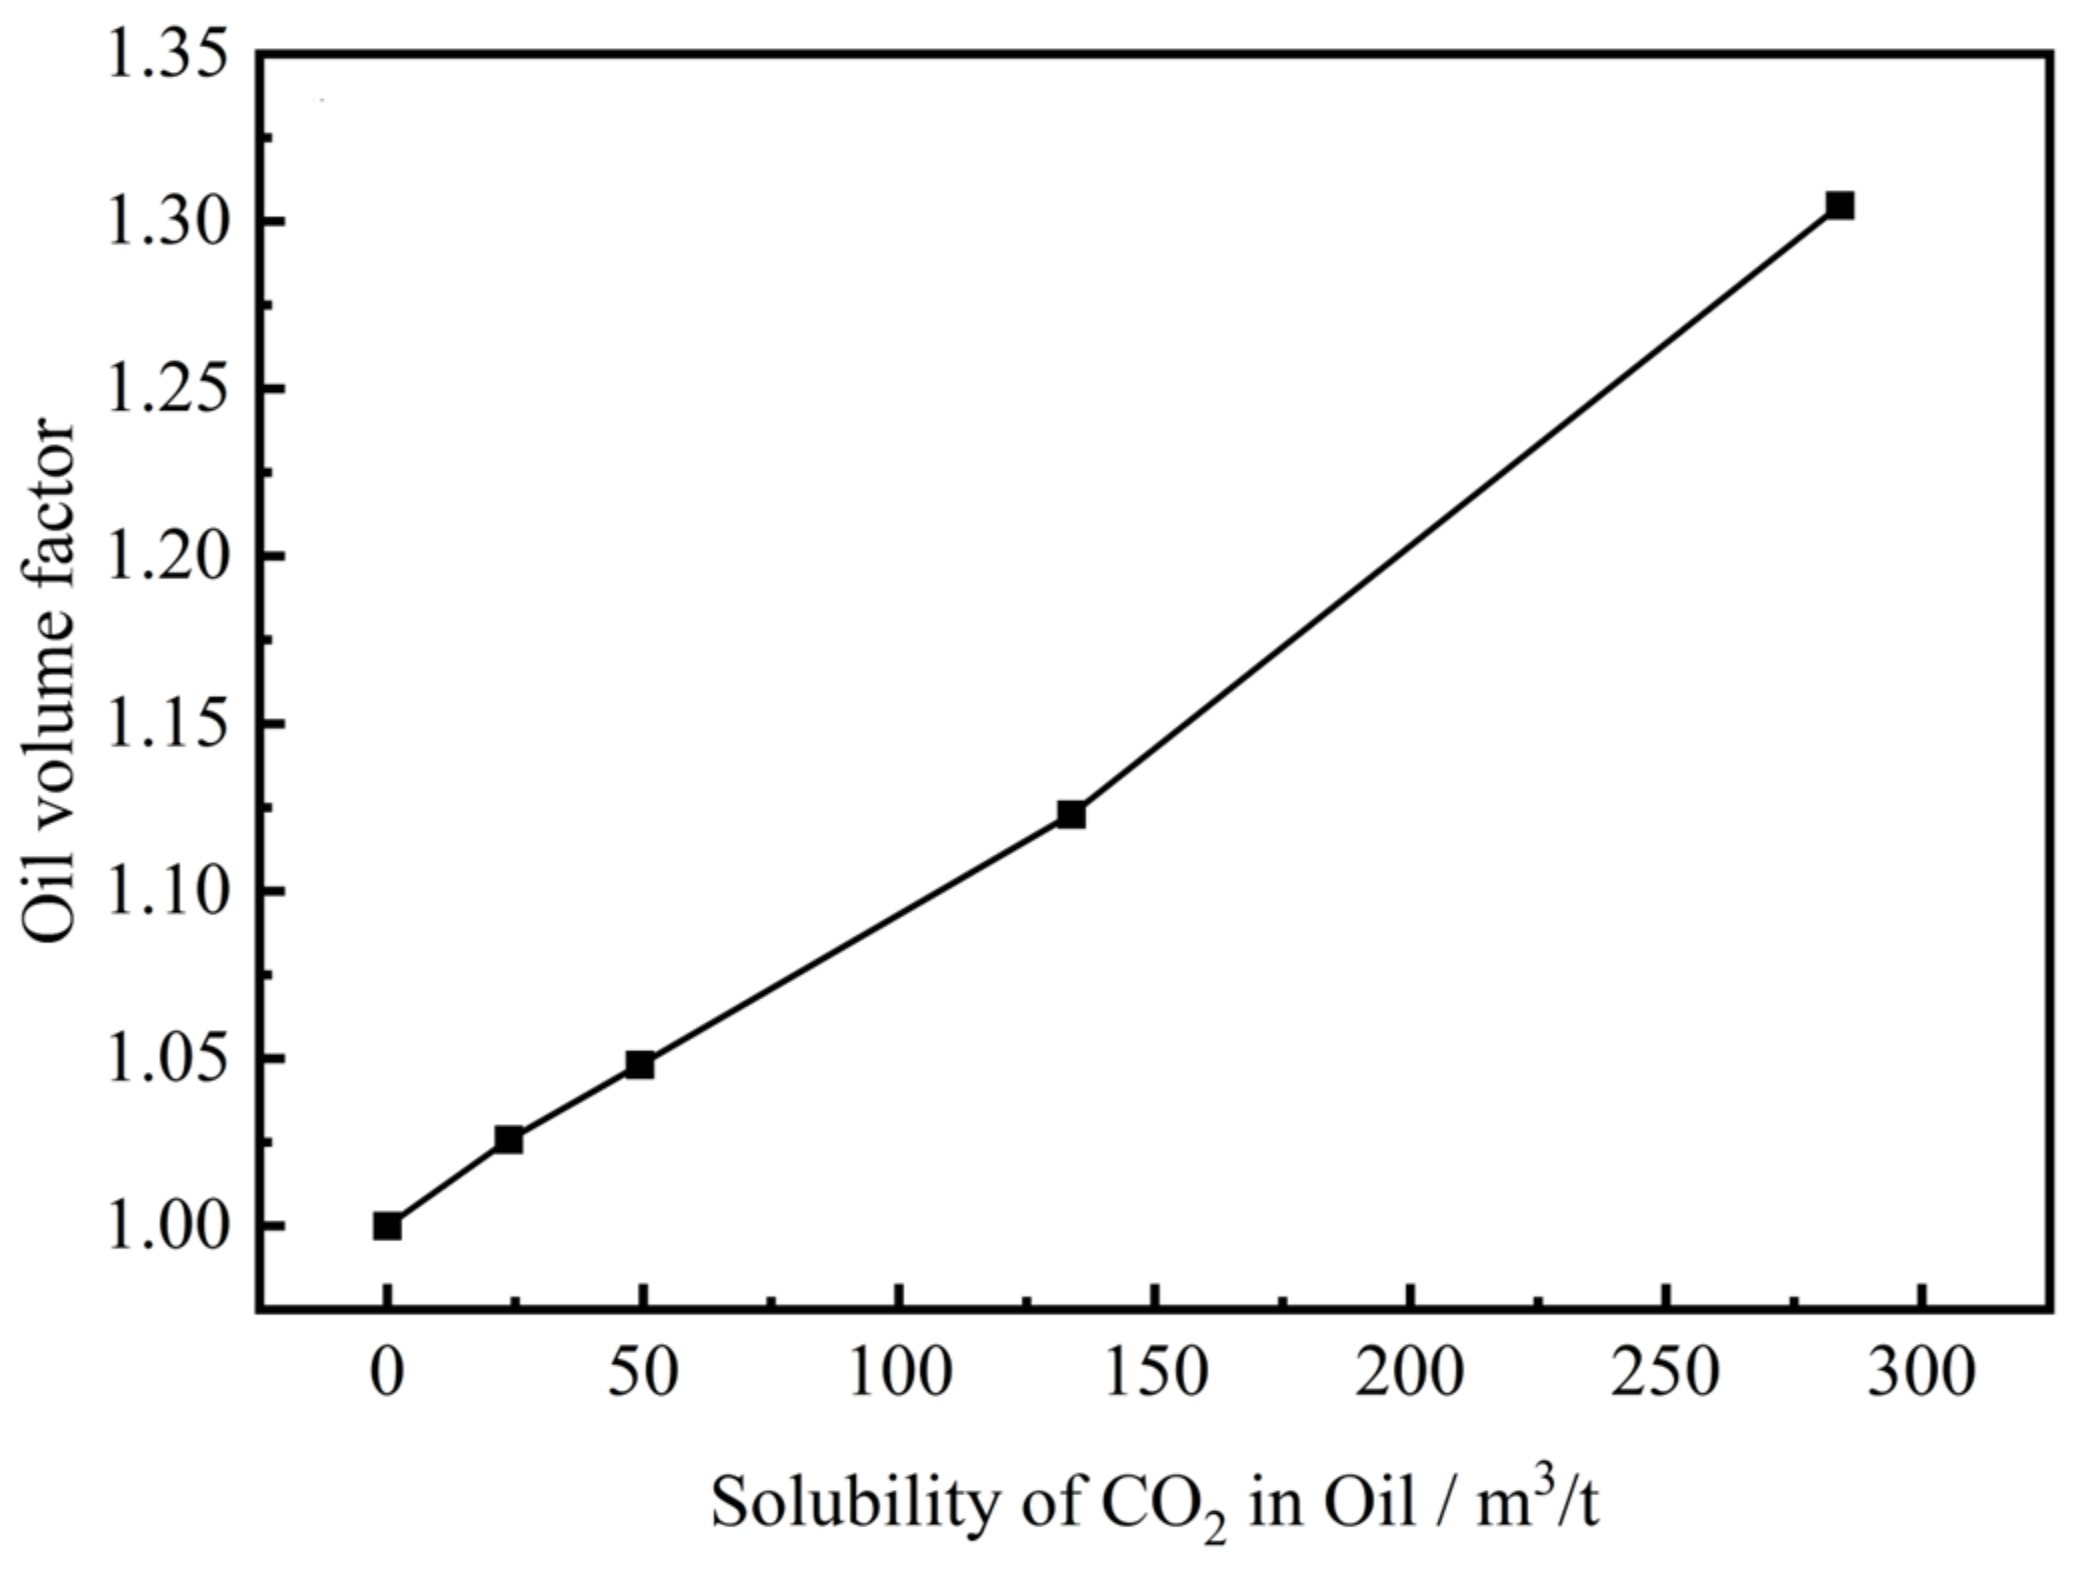
3.1. CO2–Crude Oil Gas Injection Swelling Experiment

The expansion, dissolution, and viscosity reduction of the formation crude oil caused by CO2 is one of the main mechanisms by which to increase the recovery rates in CO2–EOR processes [49,50]. The oil swelling factor in the crude oil directly affects the solubility of CO2 in the crude oil and the viscosity of the oil. Figure 3, Figure 4, and Figure 5, respectively, present the changes in the CO2 solubility with the system pressure, the volume swelling factor with the solubility of CO2, and the crude oil viscosity with the solubility of CO2.
From the experimental results, it can be observed that the solubility, swelling factor, and crude oil viscosity change with increasing pressure. Figure 3 illustrates the relationship between the CO2 solubility and saturation pressure. As the amount of injected CO2 increases, the saturation pressure gradually increases. The solubility of CO2 in the oil increases with the increase in pressure, and, at a reservoir pressure of 12.9 MPa, the solubility of CO2 is 125 m3/t. Figure 4 shows that the swelling factor gradually increases with the increase in CO2 solubility, especially with increasing pressure. The effect of the increasing pressure on the solubility in the high-pressure range is stronger than that in the low-pressure range [51,52]. When the CO2 solubility increases from 0 to 125 m3/t, the swelling factor increases from 1.0 to 1.11. The reduction in viscosity enables the oil to pass through the tight formation pores more easily. Figure 5 demonstrates the decrease in oil density and viscosity with the increase in the CO2 mole percentage. As the CO2 dissolves into the crude oil, the viscosity of the oil rapidly decreases by 67.9%, from 8.106 mPa·s to 2.600 mPa·s.

3.2. Minimum Miscibility Pressure Testing Experiment

The minimum miscibility pressure (MMP) was measured with a slim tube experiment. Table 4 and Figure 6 shows the relationship between the recovery degree and displacement pressure during CO2 flooding. With the increase in the injection pressure, the recovery rate linearly increases both below and above the MMP. At the reservoir temperature and pressure, the CO2 cannot achieve the miscible displacement of the simulated formation oil from Well MM-4-2. The minimum miscibility pressure of the CO2 with the formation oil measured in the experiment is 26.8 MPa, which is significantly higher than the reservoir pressure of 12.9 MPa. Therefore, it exhibits immiscible flooding under the reservoir pressure.

3.3. High-Temperature and High-Pressure Microfluidic Experiment

3.3.1. Results of NSS CO2 Huff-n-Puff Microscopic Displacement Experiment

Under a total injection volume of 0.3 PV, the influences of the steady constant injection rate (0.003 mL/min, 0.3 PV) and NSS stepwise increasing injection rate (0.001 mL/min, 0.003 mL/min, 0.005 mL/min, each with an injection volume of 0.1 PV) on the effect of CO2 huff-n-puff oil recovery were studied by using a high-temperature and high-pressure microscopic visualization flow device.
The swept situations under different injection methods were compared. For steady injection, the injection rate was 0.003 mL/min, while, for NSS injection, stepwise injection rates of 0.001 mL/min, 0.003 mL/min, and 0.005 mL/min were used. The swept effects before and after CO2 flooding under different injection methods are shown in Figure 7, where the red portion represents the distribution of remaining oil after software processing. The comparison of the swept areas and recovery rates under different injection methods is shown in Table 5. Compared with steady gas injection whose swept area was 76.5%, NSS gas injection resulted in the higher utilization of various pore throats, with the swept area increasing significantly by 7.6% to 84.1%. NSS CO2 injection effectively utilized the remaining oil in the corners, resulting in an ultimate recovery rate of 83.1%, which was 7.9% higher than the ultimate recovery rate of 75.2% obtained with steady injection.

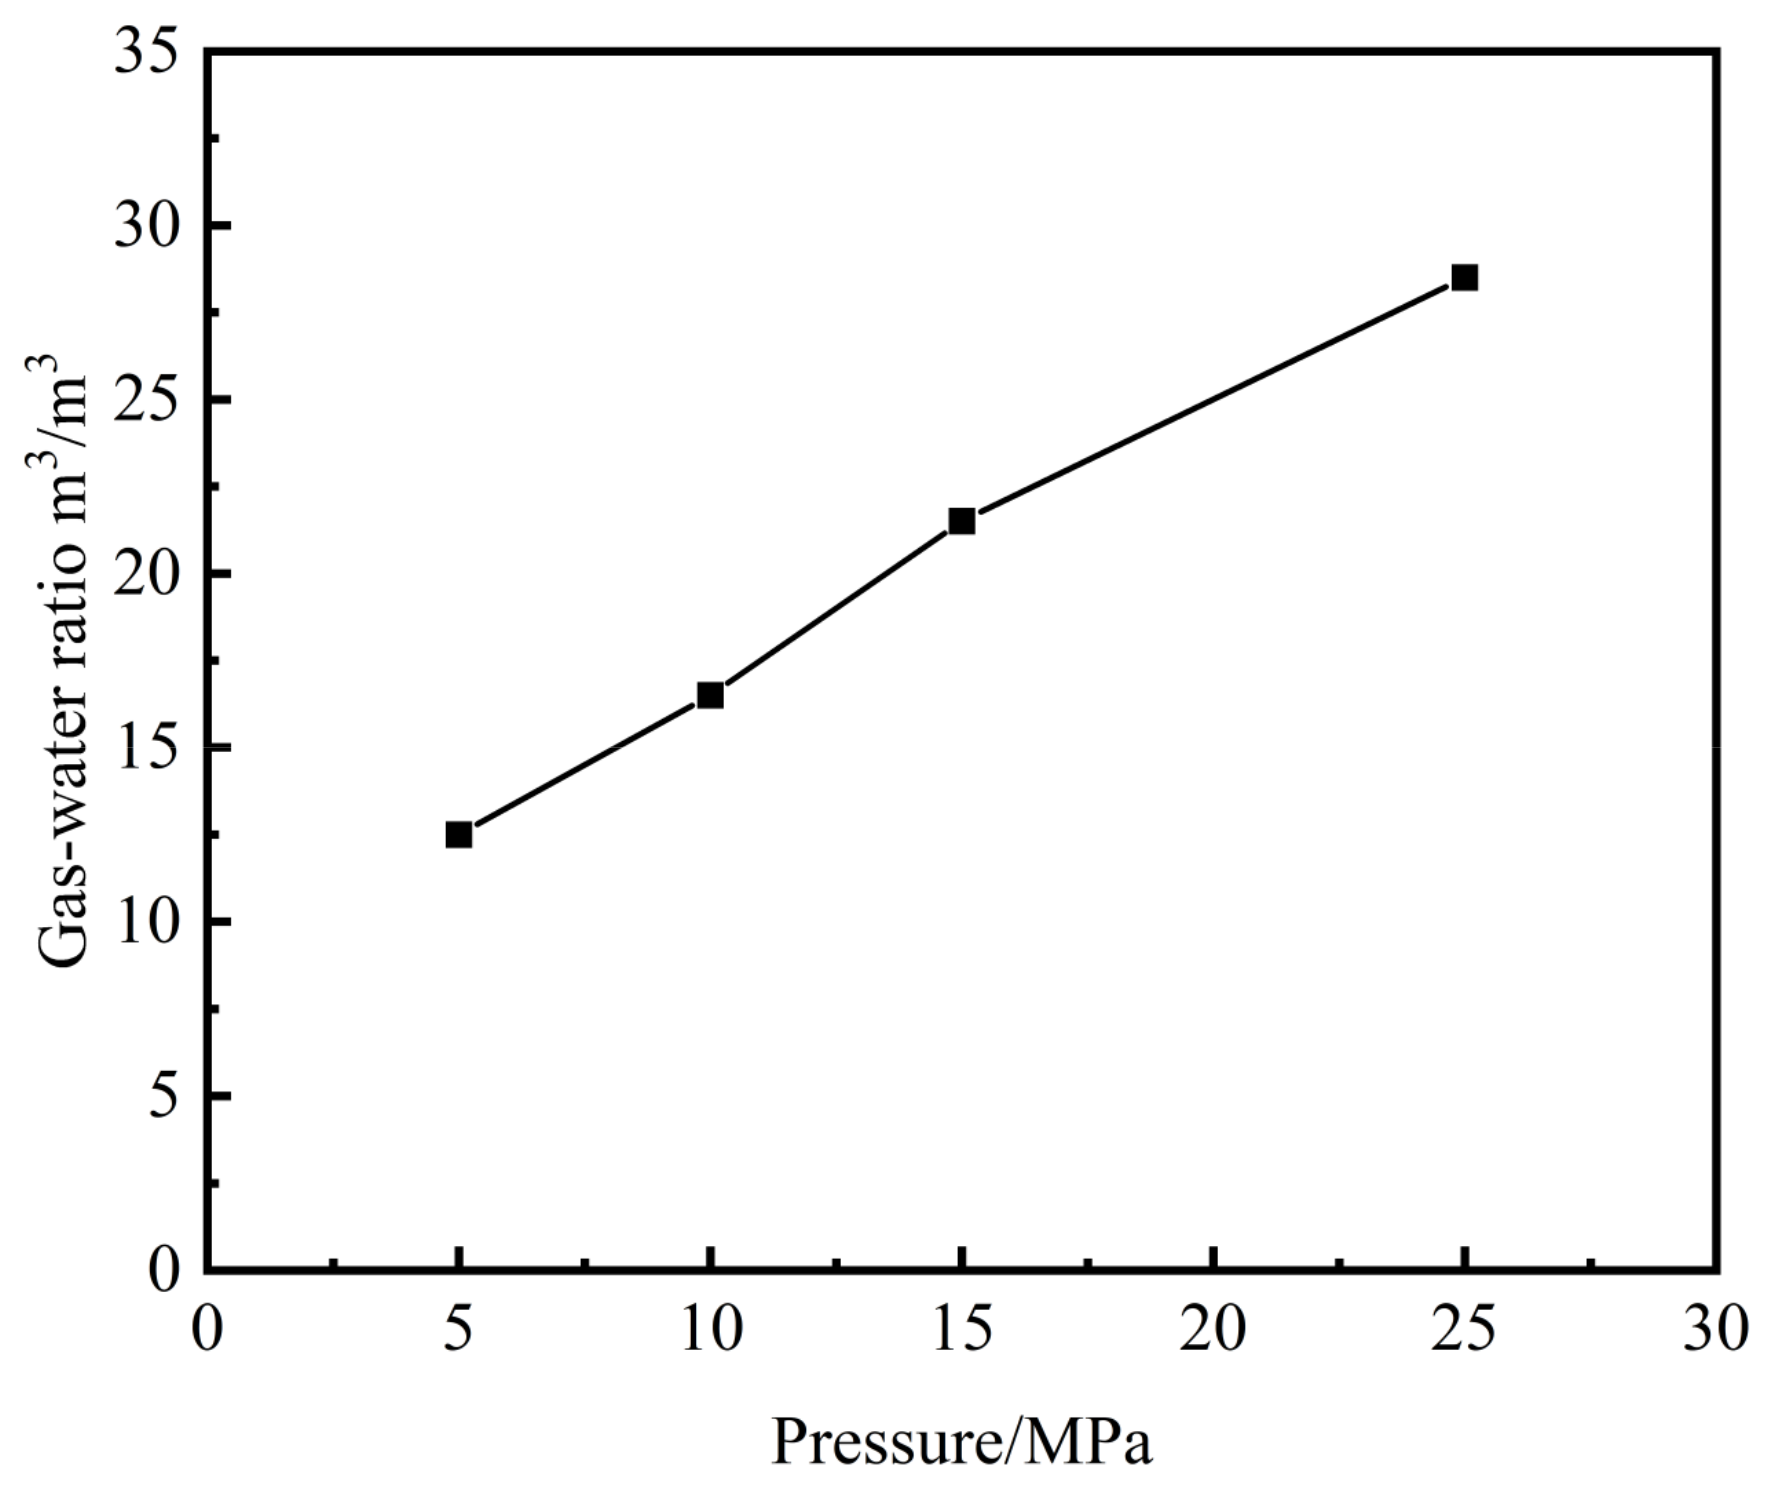
3.3.2. Changes in Solution Gas–Water Ratio during Flowback Process

During the NSS CO2 huff-n-puff oil recovery process, CO2 is usually present in both liquid and dissolved states. The solution gas–water ratio refers to the ratio of CO2 dissolved in water to its volume in the gas phase, reflecting the dissolution characteristics of the CO2 in the reservoir.
The variation in the solution gas–water ratio at different pressures is helpful to understand the dissolution and release process of CO2 in the reservoir. When CO2 enters the reservoir, some of it will dissolve in the formation water, forming the dissolved state, while the rest exists in the liquid state. With the change in the reservoir pressure, the CO2 dissolved in the water will be released, forming bubbles, thereby affecting the mobility of the oil–water mixture.
Figure 8 indicates that the solution gas–water ratio increases with an increasing saturation pressure. This indicates that some CO2 will dissolve in the formation water after entering the reservoir. During the flowback stage, as the pressure decreases, the CO2 is released from the water, forming a foam flow, which plays a temporary plugging role through the Jamin effect, achieving good oil production stabilization and water cut control (Figure 9).

3.4. Field Pilot Test Results of NSS CO2 Huff-n-Puff

The variation in the wellhead pressure during the injection process is shown in Figure 10. After CO2 injection, the injection pressure gradually increased to 10.4 MPa, and, during the soaking process, the wellhead pressure gradually decreased to 2.51 MPa. Under the driving force of the pressure and concentration gradients, the CO2 migrated into the deeper matrix pores.
From Table 6 and Figure 11 and Figure 12, it can be seen that the NSS CO2 huff-n-puff oil recovery in Well MM-4-2 achieved significant results, with the water cut decreasing from 80.1% to 60.4%, while the daily oil production increased from 0.6 t/d to 1.5 t/d (three months after the measures), achieving a cumulative oil increase of 132 t. Additionally, the surrounding six neighboring wells also experienced similar effects, with the water cut of the well group decreasing from 83.4% to 62.1%. As of December 2018, three of these six wells were still effective, with a cumulative oil increase of 1002.5 t and a total cumulative oil increase of 1134.5 t. The water-cut-reducing and oil-production-increasing effects demonstrated by the NSS CO2 huff-n-puff oil recovery technology in Well MM-4-2 of the Mutou Oilfield validate the potential and sustainability the technology in EOR from low-permeability reservoirs. A comprehensive economic analysis of the CO2 huff-n-puff process was conducted. The results indicate that the material and operational costs for CO2 are approximately 120,000 RMB, while the ex-factory price of crude oil is around 1,700,000 RMB. This yields an input–output ratio of 14.17, demonstrating significant economic viability.
The results of the NSS CO2 huff-n-puff test in Well MM-4-2 indicate that well-connected wells facilitate the exertion of the plane energizing effect. An effective production increase was observed 70 days after the measures were taken in Well MM-4-2, while the neighboring wells showed a response between 19 and 47 days after the measures. The delayed response in the production increase observed in Well MM-4-2 compared with its neighboring wells suggests a significant CO2 displacement effect.

3.5. Evaluation of Oil and Gas Properties during NSS CO2 Huff-n-Puff

The density of the produced oil and the composition of the produced gas were tested for Well MM-4-2 before and after CO2 injection, as shown in Figure 13 and Table 7. The density of the produced oil decreased from 0.8774 g/cm3 before injection to 0.8756 g/cm3 after injection, indicating a significant swelling effect due to CO2 dissolution. The statistical analysis of the gas composition of the produced gas from Well MM-4-2 during the NSS CO2 huff-n-puff test shows that the proportion of light components in the produced gas after the measures is much higher than that in the originally produced gas before the measures, indicating the significant extraction effect of CO2 on crude oil.
The pilot test of NSS CO2 huff-n-puff oil recovery for Well MM-4-2 in the Mutou Oilfield primarily aimed to enhance the recovery rate of the low-permeability oil reservoir through mechanisms such as CO2 dissolution, expansion, viscosity reduction, and swept volume enlargement, which can effectively mobilize the remaining oil from the various pore throats within the reservoir, holding promising potential for widespread application. It is necessary to further research the mechanisms of NSS CO2 huff-n-puff, including the interaction between the CO2 and formation oil and the distribution pattern of the CO2 in the reservoir, and optimize the injection parameters, such as the injection rate and volume, to significantly increase the individual well production and recovery rate. This will provide critical technical support for the large-scale application of NSS CO2 huff-n-puff in low-permeability reservoirs, promoting the innovative development of this technology.

4. Conclusions

The Mutou Oilfield exhibits CO2 immiscible flooding under a reservoir pressure of 12.9 MPa. The NSS injection method performs better in terms of the swept area and recovery rate compared with steady injection. NSS injection can effectively mobilize the remaining oil in the corner regions, with a 7.9% increase in the recovery rate, reaching an ultimate recovery rate of 83.1%. The main mechanisms of NSS CO2 huff-n-puff include CO2 dissolution, expansion, viscosity reduction, and swept volume enlargement, which can effectively mobilize the remaining oil from the various pore throats within the reservoir. As of December 2018, significant results for NSS CO2 huff-n-puff have been achieved, with a cumulative oil increase of 1134.5 tons. This technology has achieved significant economic and environmental benefits in practical applications, offering a sustainable solution for oil field development and holding broad application prospects.

Author Contributions

Conceptualization, X.X.; methodology, X.X.; validation, N.T. and S.H.; formal analysis, S.L. (Songkai Li), X.W. and N.T.; investigation, Z.W. (Zhenjun Wang), Z.W. (Zhufeng Wang) and N.T.; data curation, X.W. and S.H.; writing—original draft, Z.W. (Zhenjun Wang); writing—review and editing, Z.W. (Zhenjun Wang) and W.L.; visualization, S.L. (Shisheng Liang); supervision, Z.W. (Zhufeng Wang); project administration, Z.W. (Zhenjun Wang) and S.L. (Songkai Li); funding acquisition, W.L. All authors have read and agreed to the published version of the manuscript.

Funding

This research was funded by China National Petroleum Corporation (China) (2023ZZ04).

Data Availability Statement

Data are contained within the article.

Conflicts of Interest

Authors Zhenjun Wang, Zhufeng Wang, Songkai Li, Xianfeng Wang, Naikun Tu and Shudong He were employed by the Xinmu Oil Production Plant of PetroChina Jilin Oilfield Company, PetroChina. Author Wenli Luo was employed by the Research Institute of Petroleum Exploration & Development, PetroChina and State Key Laboratory of Enhanced Oil and Gas Recovery, PetroChina. Author Xiaohu Xue was employed by the China Petroleum Technology and Development Corporation, PetroChina. The remaining authors declare that the research was conducted in the absence of any commercial or financial relationships that could be construed as a potential conflict of interest.

References

  1. Zhou, X.; Yuan, Q.; Zhang, Y.; Wang, H.; Zeng, F.; Zhang, L. Performance Evaluation of CO2 Flooding Process in Tight Oil Reservoir via Experimental and Numerical Simulation Studies. Fuel 2019, 236, 730–746. [Google Scholar] [CrossRef]
  2. Yongle, H.; Mingqiang, H.; Guoli, C.; Ruiyan, S.; Shi, L. Technologies and Practice of CO2 Flooding and Sequestration in China. Pet. Explor. Dev. 2019, 46, 753–766. [Google Scholar] [CrossRef]
  3. Song, Z.; Li, Y.; Song, Y.; Bai, B.; Hou, J.; Song, K.; Jiang, A.; Su, S. A Critical Review of CO2 Enhanced Oil Recovery in Tight Oil Reservoirs of North America and China. In Proceedings of the SPE Asia Pacific Oil and Gas Conference and Exhibition, Virtual, 17–19 November 2020. [Google Scholar]
  4. Ren, B.; Zhang, L.; Huang, H.; Ren, S.; Chen, G.; Zhang, H. Performance Evaluation and Mechanisms Study of Near-Miscible CO2 Flooding in a Tight Oil Reservoir of Jilin Oilfield China. J. Nat. Gas Sci. Eng. 2015, 27, 1796–1805. [Google Scholar] [CrossRef]
  5. Pu, W.; Wei, B.; Jin, F.; Li, Y.; Jia, H.; Liu, P.; Tang, Z. Experimental Investigation of CO2 Huff-n-Puff Process for Enhancing Oil Recovery in Tight Reservoirs. Chem. Eng. Res. Des. 2016, 111, 269–276. [Google Scholar] [CrossRef]
  6. Lv, G.; Li, Q.; Wang, S.; Li, X. Key Techniques of Reservoir Engineering and Injection–Production Process for CO2 Flooding in China’s SINOPEC Shengli Oilfield. J. CO2 Util. 2015, 11, 31–40. [Google Scholar] [CrossRef]
  7. Qin, J.; Han, H.; Liu, X. Application and Enlightenment of Carbon Dioxide Flooding in the United States of America. Pet. Explor. Dev. 2015, 42, 232–240. [Google Scholar] [CrossRef]
  8. Hill, B.; Hovorka, S.; Melzer, S. Geologic Carbon Storage through Enhanced Oil Recovery. Energy Procedia 2013, 37, 6808–6830. [Google Scholar] [CrossRef]
  9. Ettehadtavakkol, A.; Lake, L.W.; Bryant, S.L. CO2-EOR and Storage Design Optimization. Int. J. Greenh. Gas Control 2014, 25, 79–92. [Google Scholar] [CrossRef]
  10. Du, D.; Pu, W.; Jin, F.; Liu, R. Experimental Study on EOR by CO2 Huff-n-Puff and CO2 Flooding in Tight Conglomerate Reservoirs with Pore Scale. Chem. Eng. Res. Des. 2020, 156, 425–432. [Google Scholar] [CrossRef]
  11. Dai, Z.; Middleton, R.; Viswanathan, H.; Fessenden-Rahn, J.; Bauman, J.; Pawar, R.; Lee, S.-Y.; McPherson, B. An Integrated Framework for Optimizing CO2 Sequestration and Enhanced Oil Recovery. Environ. Sci. Technol. Lett. 2014, 1, 49–54. [Google Scholar] [CrossRef]
  12. Bachu, S. Identification of Oil Reservoirs Suitable for CO2-EOR and CO2 Storage (CCUS) Using Reserves Databases, with Application to Alberta, Canada. Int. J. Greenh. Gas Control 2016, 44, 152–165. [Google Scholar] [CrossRef]
  13. Azzolina, N.A.; Nakles, D.V.; Gorecki, C.D.; Peck, W.D.; Ayash, S.C.; Melzer, L.S.; Chatterjee, S. CO2 Storage Associated with CO2 Enhanced Oil Recovery: A Statistical Analysis of Historical Operations. Int. J. Greenh. Gas Control 2015, 37, 384–397. [Google Scholar] [CrossRef]
  14. Ampomah, W.; Balch, R.; Cather, M.; Will, R.; Gunda, D.; Dai, Z.; Soltanian, M. Optimum Design of CO2 Storage and Oil Recovery under Geological Uncertainty. Appl. Energy 2017, 195, 80–92. [Google Scholar] [CrossRef]
  15. Liu, Z.; Gao, M.; Zhang, X.; Liang, Y.; Guo, Y.; Liu, W.; Bao, J. CCUS and CO2 Injection Field Application in Abroad and China: Status and Progress. Geoenergy Sci. Eng. 2023, 229, 212011. [Google Scholar] [CrossRef]
  16. Hill, L.B.; Li, X.; Wei, N. CO2-EOR in China: A Comparative Review. Int. J. Greenh. Gas Control 2020, 103, 103173. [Google Scholar] [CrossRef]
  17. Lan, Y.; Yang, Z.; Wang, P.; Yan, Y.; Zhang, L.; Ran, J. A Review of Microscopic Seepage Mechanism for Shale Gas Extracted by Supercritical CO2 Flooding. Fuel 2019, 238, 412–424. [Google Scholar] [CrossRef]
  18. Xia, X.; Deng, Q.; Sang, P.; Tan, L.; Yan, L.; Bao, J.; Li, W. Low-Carbon Oil Exploitation: Carbon Dioxide Flooding Technology. Front. Earth Sci. 2023, 10, 1035771. [Google Scholar] [CrossRef]
  19. Chai, X.; Tian, L.; Zhang, M.; Shao, H.; Wang, J.; Zhang, K. Production Characteristics, Evaluation, and Prediction of CO2 Water-Alternating-Gas Flooding in Tight Oil Reservoir. J. Energy Resour. Technol. 2022, 144, 033006. [Google Scholar] [CrossRef]
  20. Khoshsima, A.; Sedighi, M.; Mohammadi, M. Chapter 8—Enhanced Oil Recovery by Water Alternating Gas Injection. In Gas Injection Methods; Li, Z., Husein, M.M., Hemmati-Sarapardeh, A., Eds.; Enhanced Oil Recovery Series; Gulf Professional Publishing: Houston, TX, USA, 2023; pp. 295–316. ISBN 978-0-12-822302-4. [Google Scholar]
  21. Iding, M.; Ringrose, P. Evaluating the Impact of Fractures on the Performance of the in Salah CO2 Storage Site. Int. J. Greenh. Gas Control 2010, 4, 242–248. [Google Scholar] [CrossRef]
  22. Fu, P.; Settgast, R.R.; Hao, Y.; Morris, J.P.; Ryerson, F.J. The Influence of Hydraulic Fracturing on Carbon Storage Performance. J. Geophys. Res. Solid Earth 2017, 122, 9931–9949. [Google Scholar] [CrossRef]
  23. Fitts, J.P.; Peters, C.A. Caprock Fracture Dissolution and CO2 Leakage. Rev. Mineral. Geochem. 2013, 77, 459–479. [Google Scholar] [CrossRef]
  24. Zeng, J.; Cheng, S.; Kong, X.; Guo, K.; Wang, H. Non-Darcy Flow in Oil Accumulation (Oil Displacing Water) and Relative Permeability and Oil Saturation Characteristics of Low-Permeability Sandstones. Pet. Sci. 2010, 7, 20–30. [Google Scholar] [CrossRef]
  25. Yao, Y.; Ge, J. Characteristics of Non-Darcy Flow in Low-Permeability Reservoirs. Pet. Sci. 2011, 8, 55–62. [Google Scholar] [CrossRef]
  26. Liu, C. Numerical Simulation of Ultra-Low Permeability Reservoirs: Progress and Challenges. Front. Energy Res. 2022, 10, 895135. [Google Scholar] [CrossRef]
  27. Li, H.; Li, Y.; Chen, S.; Guo, J.; Wang, K.; Luo, H. Effects of Chemical Additives on Dynamic Capillary Pressure during Waterflooding in Low Permeability Reservoirs. Energy Fuels 2016, 30, 7082–7093. [Google Scholar] [CrossRef]
  28. Liu, Q.; Wu, K.; Li, X.; Tu, B.; Zhao, W.; He, M.; Zhang, Q.; Xie, Y. Effect of Displacement Pressure on Oil–Water Relative Permeability for Extra-Low-Permeability Reservoirs. ACS Omega 2021, 6, 2749–2758. [Google Scholar] [CrossRef] [PubMed]
  29. Kang, W.-L.; Zhou, B.-B.; Issakhov, M.; Gabdullin, M. Advances in Enhanced Oil Recovery Technologies for Low Permeability Reservoirs. Pet. Sci. 2022, 19, 1622–1640. [Google Scholar] [CrossRef]
  30. Zhang, H.; Yan, J.; Lu, Y.; Shu, Y.; Zhao, S. Experimental Study of Low-Damage Drilling Fluid to Minimize Waterblocking of Low-Permeability Gas Reservoirs. Pet. Sci. 2009, 6, 271–276. [Google Scholar] [CrossRef]
  31. Al-Shargabi, M.; Davoodi, S.; Wood, D.A.; Rukavishnikov, V.S.; Minaev, K.M. Minaev Carbon Dioxide Applications for Enhanced Oil Recovery Assisted by Nanoparticles: Recent Developments. ACS Omega 2022, 7, 9984–9994. [Google Scholar] [CrossRef]
  32. Sayegh, S.G.; Maini, B.B. Laboratory Evaluation of the CO2 Huff-N-Puff Process for Heavy Oil Reservoirs. J. Can. Pet. Technol. 1984, 23, PETSOC-84-03-02. [Google Scholar] [CrossRef]
  33. Chunsheng, P.; Shaofei, K.; Jingyang, P.; Xiaoyu, G.; Zhendong, G.; Yongdong, W.; Kai, W. Progress and Development Trend of Water Huff-n-Puff Technology for Horizontal Wells in Tight Oil Reservoirs in China. Acta Pet. Sin. 2023, 44, 188. [Google Scholar]
  34. Sambo, C.; Liu, N.; Shaibu, R.; Ahmed, A.A.; Hashish, R.G. A Technical Review of CO2 for Enhanced Oil Recovery in Unconventional Oil Reservoirs. Geoenergy Sci. Eng. 2023, 221, 111185. [Google Scholar] [CrossRef]
  35. Tan, Y.; Li, Q.; Xu, L.; Ghaffar, A.; Zhou, X.; Li, P. A Critical Review of Carbon Dioxide Enhanced Oil Recovery in Carbonate Reservoirs. Fuel 2022, 328, 125256. [Google Scholar] [CrossRef]
  36. Wan, Y.; Jia, C.; Lv, W.; Jia, N.; Jiang, L.; Wang, Y. Recovery Mechanisms and Formation Influencing Factors of Miscible CO2 Huff-n-Puff Processes in Shale Oil Reservoirs: A Systematic Review. Adv. Geo-Energy Res. 2024, 11, 88–102. [Google Scholar] [CrossRef]
  37. Wu, Z.; Sun, Z.; Shu, K.; Jiang, S.; Gou, Q.; Chen, Z. Mechanism of Shale Oil Displacement by CO2 in Nanopores: A Molecular Dynamics Simulation Study. Adv. Geo-Energy Res. 2024, 11, 141–151. [Google Scholar] [CrossRef]
  38. Zhou, X.; Yuan, Q.; Peng, X.; Zeng, F.; Zhang, L. A Critical Review of the CO2 Huff ‘n’ Puff Process for Enhanced Heavy Oil Recovery. Fuel 2018, 215, 813–824. [Google Scholar] [CrossRef]
  39. Dogah, B.; Atashbari, V.; Ahmadi, M.; Sheets, B. Enhanced Oil Recovery Using CO2 in Alaska. Geosciences 2021, 11, 98. [Google Scholar] [CrossRef]
  40. Zhang, X.; Wei, B.; You, J.; Liu, J.; Wang, D.; Lu, J.; Tong, J. Characterizing Pore-Level Oil Mobilization Processes in Unconventional Reservoirs Assisted by State-of-the-Art Nuclear Magnetic Resonance Technique. Energy 2021, 236, 121549. [Google Scholar] [CrossRef]
  41. Dyer, S.B.; Huang, S.S.; Ali, S.M.F.; Jha, K.N.N. Phase Behaviour And Scaled Model Studies of Prototype Saskatchewan Heavy Oils With Carbon Dioxide. J. Can. Pet. Technol. 1994, 33, PETSOC-94-08-05. [Google Scholar] [CrossRef]
  42. Zhang, Y.; Yu, W.; Li, Z.; Sepehrnoori, K. Simulation Study of Factors Affecting CO2 Huff-n-Puff Process in Tight Oil Reservoirs. J. Pet. Sci. Eng. 2018, 163, 264–269. [Google Scholar] [CrossRef]
  43. Tian, C.; Pang, Z.; Liu, D.; Wang, X.; Hong, Q.; Chen, J.; Zhang, Y.; Wang, H. Micro-Action Mechanism and Macro-Prediction Analysis in the Process of CO2 Huff-n-Puff in Ultra-Heavy Oil Reservoirs. J. Pet. Sci. Eng. 2022, 211, 110171. [Google Scholar] [CrossRef]
  44. Tang, Y.; Tang, J.; Liu, Q.; Wang, Y.; Zheng, Z.; Yuan, Y.; He, Y. Review on Phase Behavior in Tight Porous Media and Microscopic Flow Mechanism of CO2 Huff-n-Puff in Tight Oil Reservoirs. Geofluids 2020, 2020, 8824743. [Google Scholar] [CrossRef]
  45. Tang, W.-Y.; Sheng, J.J.; Jiang, T.-X. Further Discussion of CO2 Huff-n-Puff Mechanisms in Tight Oil Reservoirs Based on NMR Monitored Fluids Spatial Distributions. Pet. Sci. 2023, 20, 350–361. [Google Scholar] [CrossRef]
  46. Li, Q.; Wang, Y.; Owusu, A.B. A Modified Ester-Branched Thickener for Rheology and Wettability during CO2 Fracturing for Improved Fracturing Property. Environ. Sci. Pollut. Res. 2019, 26, 20787–20797. [Google Scholar] [CrossRef] [PubMed]
  47. Li, Q.; Liu, J.; Wang, S.; Guo, Y.; Han, X.; Li, Q.; Cheng, Y.; Dong, Z.; Li, X.; Zhang, X. Numerical Insights into Factors Affecting Collapse Behavior of Horizontal Wellbore in Clayey Silt Hydrate-Bearing Sediments and the Accompanying Control Strategy. Ocean Eng. 2024, 297, 117029. [Google Scholar] [CrossRef]
  48. Zhang, K.; Gu, Y. Two Different Technical Criteria for Determining the Minimum Miscibility Pressures (MMPs) from the Slim-Tube and Coreflood Tests. Fuel 2015, 161, 146–156. [Google Scholar] [CrossRef]
  49. Abedini, A.; Torabi, F. Parametric Study of the Cyclic CO2 Injection Process in Light Oil Systems. Ind. Eng. Chem. Res. 2013, 52, 15211–15223. [Google Scholar] [CrossRef]
  50. Abedini, A.; Torabi, F. Oil Recovery Performance of Immiscible and Miscible CO2 Huff-and-Puff Processes. Energy Fuels 2014, 28, 774–784. [Google Scholar] [CrossRef]
  51. Welker, J.R. Physical Properties of Carbonated Oils. J. Pet. Technol. 1963, 15, 873–876. [Google Scholar] [CrossRef]
  52. Mahdaviara, M.; Nait Amar, M.; Hemmati-Sarapardeh, A.; Dai, Z.; Zhang, C.; Xiao, T.; Zhang, X. Toward Smart Schemes for Modeling CO2 Solubility in Crude Oil: Application to Carbon Dioxide Enhanced Oil Recovery. Fuel 2021, 285, 119147. [Google Scholar] [CrossRef]
Figure 1. Schematic diagram of the apparatus for the slim tube experiment.
Processes 12 01120 g001
Figure 2. Flow chart for high-temperature and high-pressure microscopic visualization displacement.
Processes 12 01120 g002
Figure 3. Curve of changes in solubility of CO2 in oil with system pressure.
Processes 12 01120 g003
Figure 4. Curve of changes in volume swelling factor with solubility of CO2 in oil.
Processes 12 01120 g004
Figure 5. Curve of changes in oil viscosity with solubility of CO2 in oil.
Processes 12 01120 g005
Figure 6. Relationship curve between recovery degree and displacement pressure during CO2 flooding.
Processes 12 01120 g006
Figure 7. Swept effects before and after displacement with different injection methods: (a) NSS injection of CO2, 0 PV on the left and 0.3 PV on the right; (b) steady injection of CO2, 0 PV on the left and 0.3 PV on the right.
Processes 12 01120 g007aProcesses 12 01120 g007b
Figure 8. Solution CO2–water ratio curve under different pressures.
Processes 12 01120 g008
Figure 9. Jamin effect of CO2 bubbles during NSS CO2 huff-n-puff oil recovery process.
Processes 12 01120 g009
Figure 10. Construction pressure change curve of NSS CO2 huff-n-puff oil production test in Well MM-4-2.
Processes 12 01120 g010
Figure 11. Production curve of Well MM-4-2.
Processes 12 01120 g011
Figure 12. Production curve of neighboring wells to Well MM-4-2.
Processes 12 01120 g012
Figure 13. Changes in density of produced oil from Well MM-4-2.
Processes 12 01120 g013
Table 1. Problems in the development of low-permeability reservoirs.
TypeDevelopment Problems References
Reservoir propertiesLow-permeability reservoirs have small pore throats and poor connectivity and exhibit non-Darcy seepage patterns.[24,25,26]
The capillary force of low-permeability reservoirs is greater than that of ordinary reservoirs, and clay minerals have strong water sensitivity and high swelling properties.[27]
Low-permeability reservoirs are often separated by faults and have large variation coefficients and seepage resistance.[28]
Low-permeability and ultra-low-permeability reservoirs have strong heterogeneity and are developed by hydraulic fracturing.[29]
Development difficultyThe formation energy is consumed quickly, and the oil well’s liquid production and oil production index drop sharply after water breakthrough.[30]
Gas channeling is severe in the process of gas injection.[31]
Table 2. Composition of formation crude oil from Well MM-4-2.
Carbon No.mol. (%)
CO2 content of formation oil0.13
C1+N2 content of formation oil8.81
C2–C6 content of formation oil5.6
C7–C15 content of formation oil17.56
C15–C29 content of formation oil8.04
C30+ content of formation oil59.86
Table 3. Composition of the formation water.
Total Salinity (mg/L)Ccation (mg/L)Canion (mg/L)
Na+ + K+Mg2+Ca2+ClSO42−HCO3
6510.72082.019.389.92342.50.01977.0
Table 4. Results from slim tube experiment with CO2 injection.
No.Pressure, MPaOil Displacement Efficiency at an Injection Volume of 1.20 PV, %Evaluation
11572.48Immiscible
22084.48Immiscible
32588.87Immiscible
43094.43Miscible
53595.74Miscible
64098.21Miscible
Table 5. Comparison of swept area and ultimate recovery rate under different injection methods.
Injection MethodSwept Area/%Ultimate Recovery Rate/%
Steady injection76.575.2
NSS injection84.183.1
Table 6. Response time for NSS CO2 huff-n-puff oil recovery in Well MM-4-2 (October 2014–December 2018).
WellDays until
Response
after Measures
Normal Production before MeasuresThird Month after MeasuresData Difference ComparisonCumulative Oil Increase
Daily Liquid ProductionDaily Oil ProductionWater CutDaily
Liquid
Production
Daily Oil ProductionWater CutDaily
Liquid
Production
Daily Oil ProductionWater Cut
MM-4-2703.10.680.43.61.558.30.50.9−22.1132
MM-2-22540.2953.50.780−0.50.5−1555
MM-4-1253.60.7813.61.947.201.2−33.8275.2
MM-6-4223.80.294.531.550−0.81.3−44.5351.8
MM-4-4222.70.390.72.30.578.3−0.40.2−12.463.4
MM-6-1192.91.166.44.11.953.71.20.8−12.7139.5
MM-8-4472.81644.41.859.11.60.8−4.9117.6
Total 22.94.182.124.59.8601.65.7−22.11134.5
Table 7. Statistics of hydrocarbon components in produced gas from Well MM-4-2 during NSS CO2 huff-n-puff experiment (mol%).
WellMethaneEthanePropaneIsobutaneN-ButaneIsopentaneN-PentaneHexaneRemark
MM-4-259.463.045.341.063.881.042.881.26Before measure
MM-4-265.14.216.851.094.051.123.121.591 day after measure
MM-4-262.53.756.211.083.951.042.951.4620 days after measure
Disclaimer/Publisher’s Note: The statements, opinions and data contained in all publications are solely those of the individual author(s) and contributor(s) and not of MDPI and/or the editor(s). MDPI and/or the editor(s) disclaim responsibility for any injury to people or property resulting from any ideas, methods, instructions or products referred to in the content.

