
Improving Thermal Efficiency and Reducing Emissions with CO2 Injection during Late Stage SAGD Development

Abstract
:1. Introduction
2. Reservoir Simulation Studies
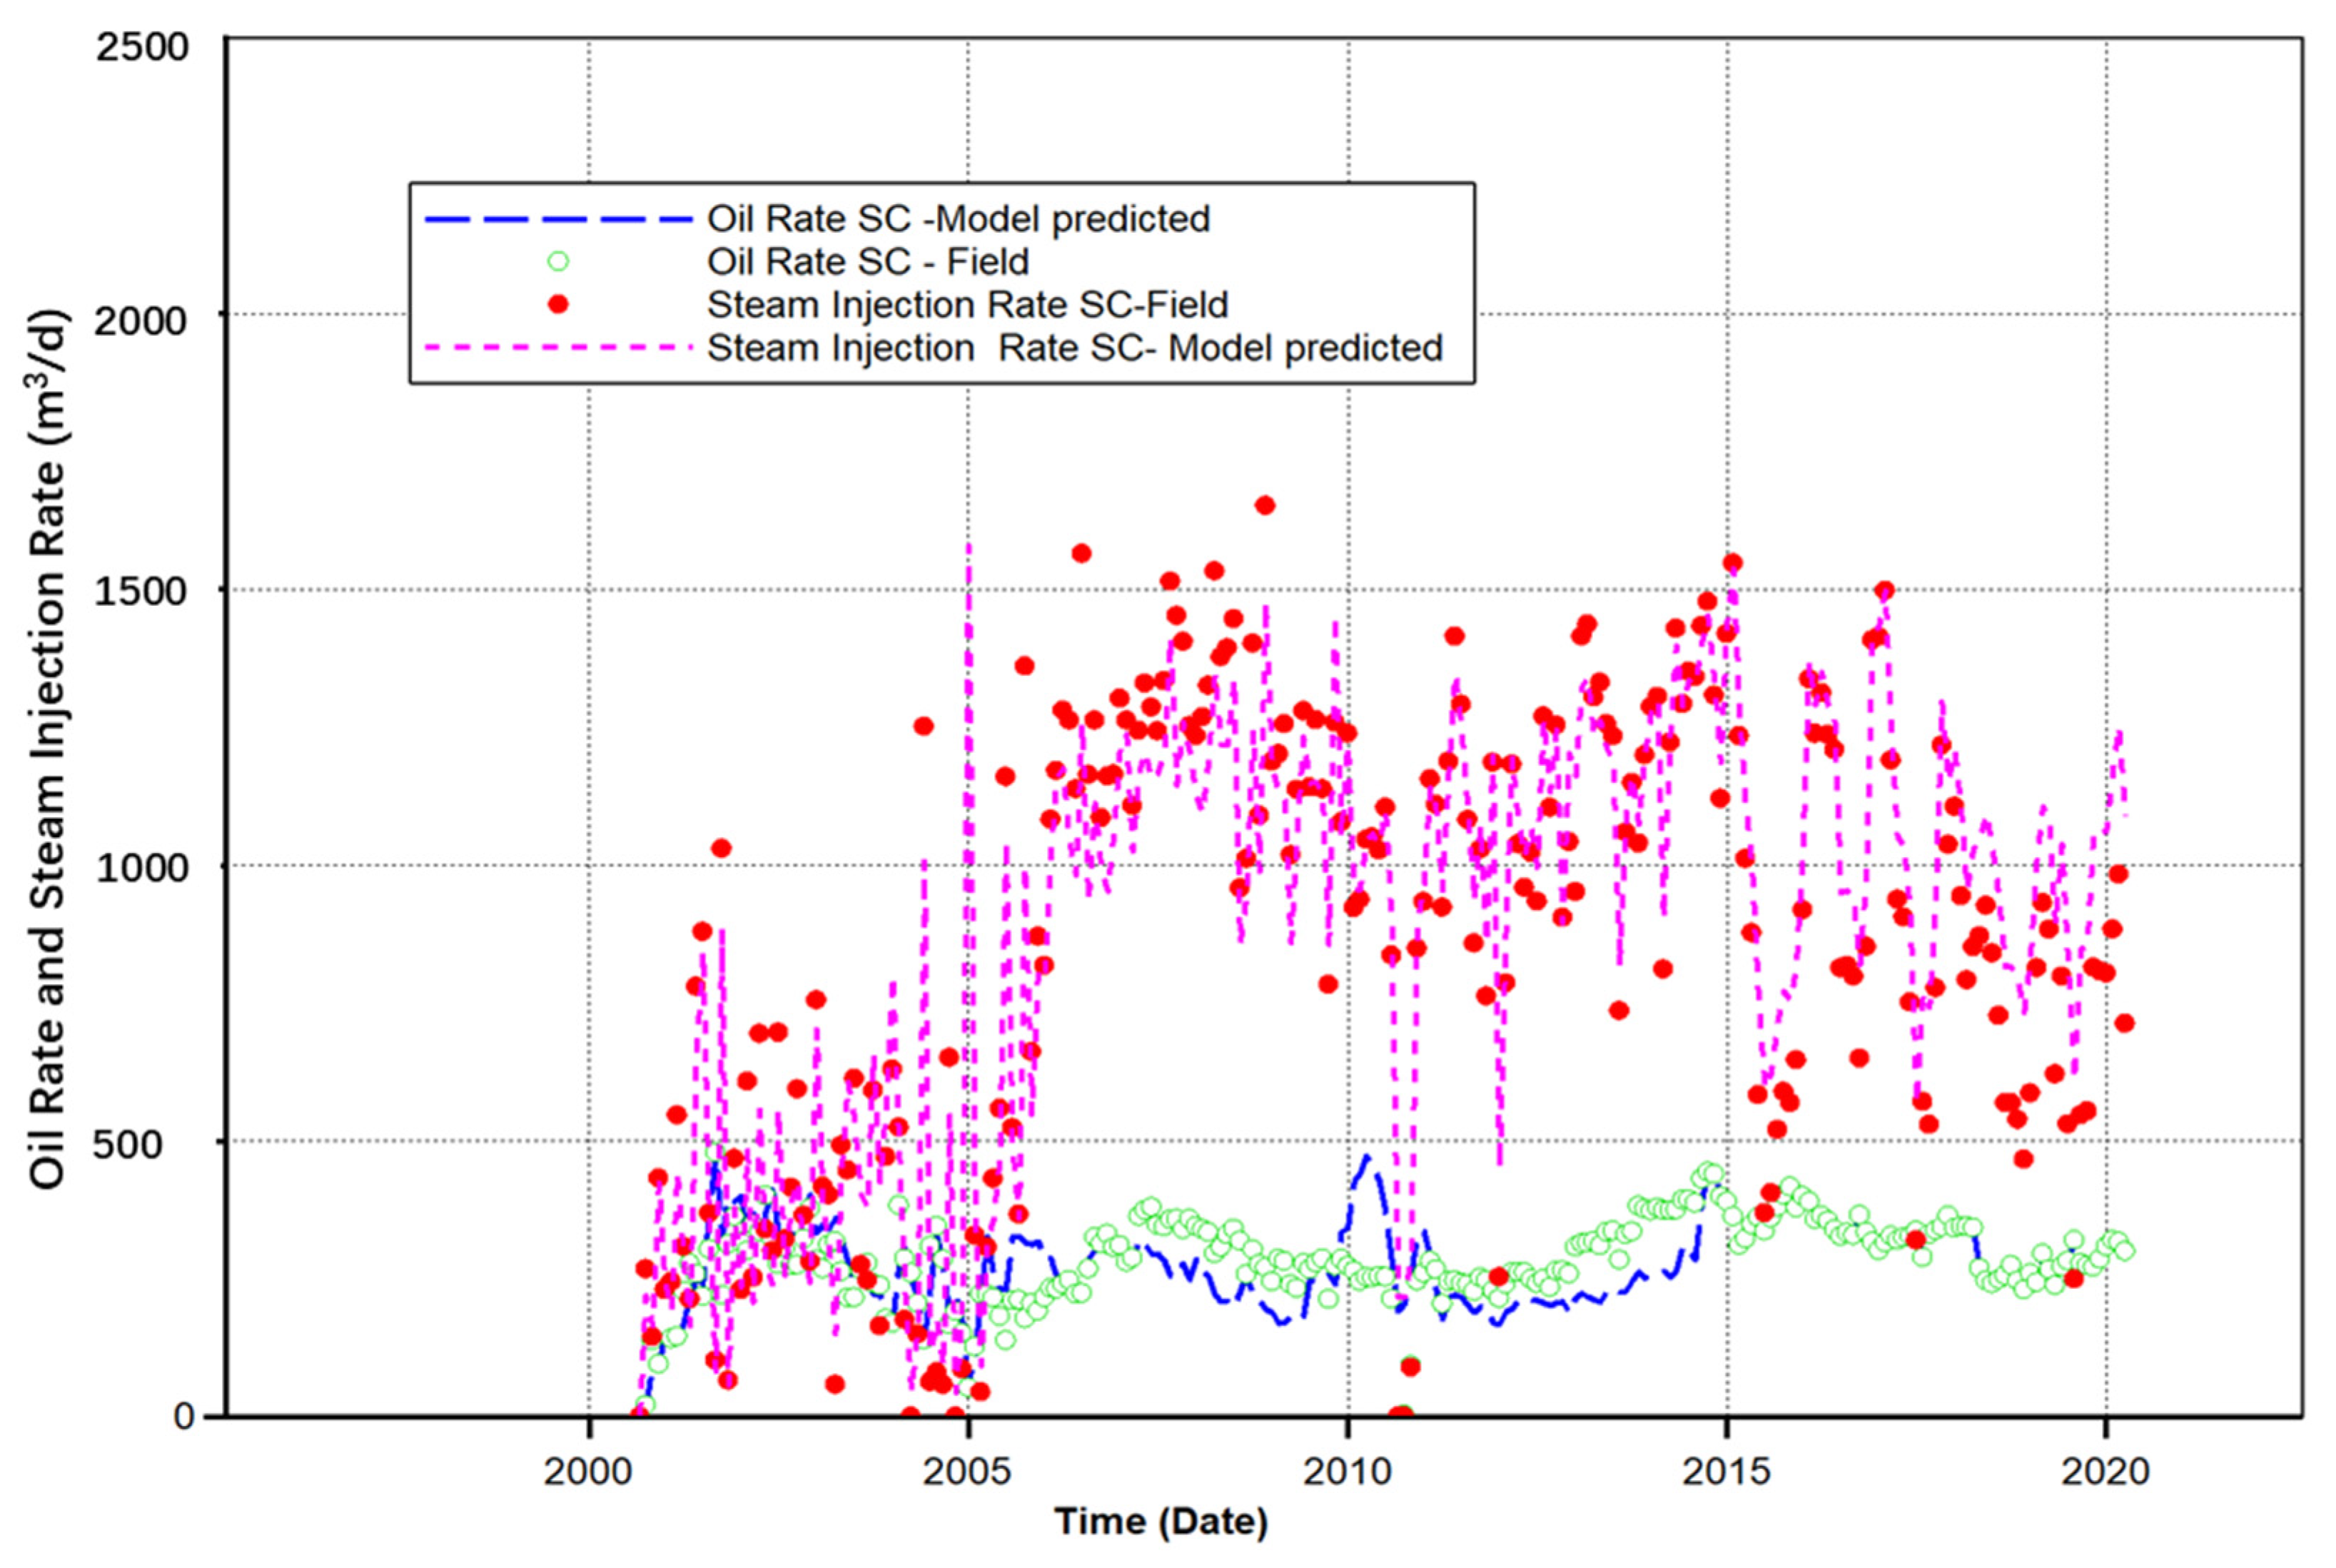
2.1. History Match of Production Performance
2.2. Operating Strategies for the Late Stage of SAGD Operation
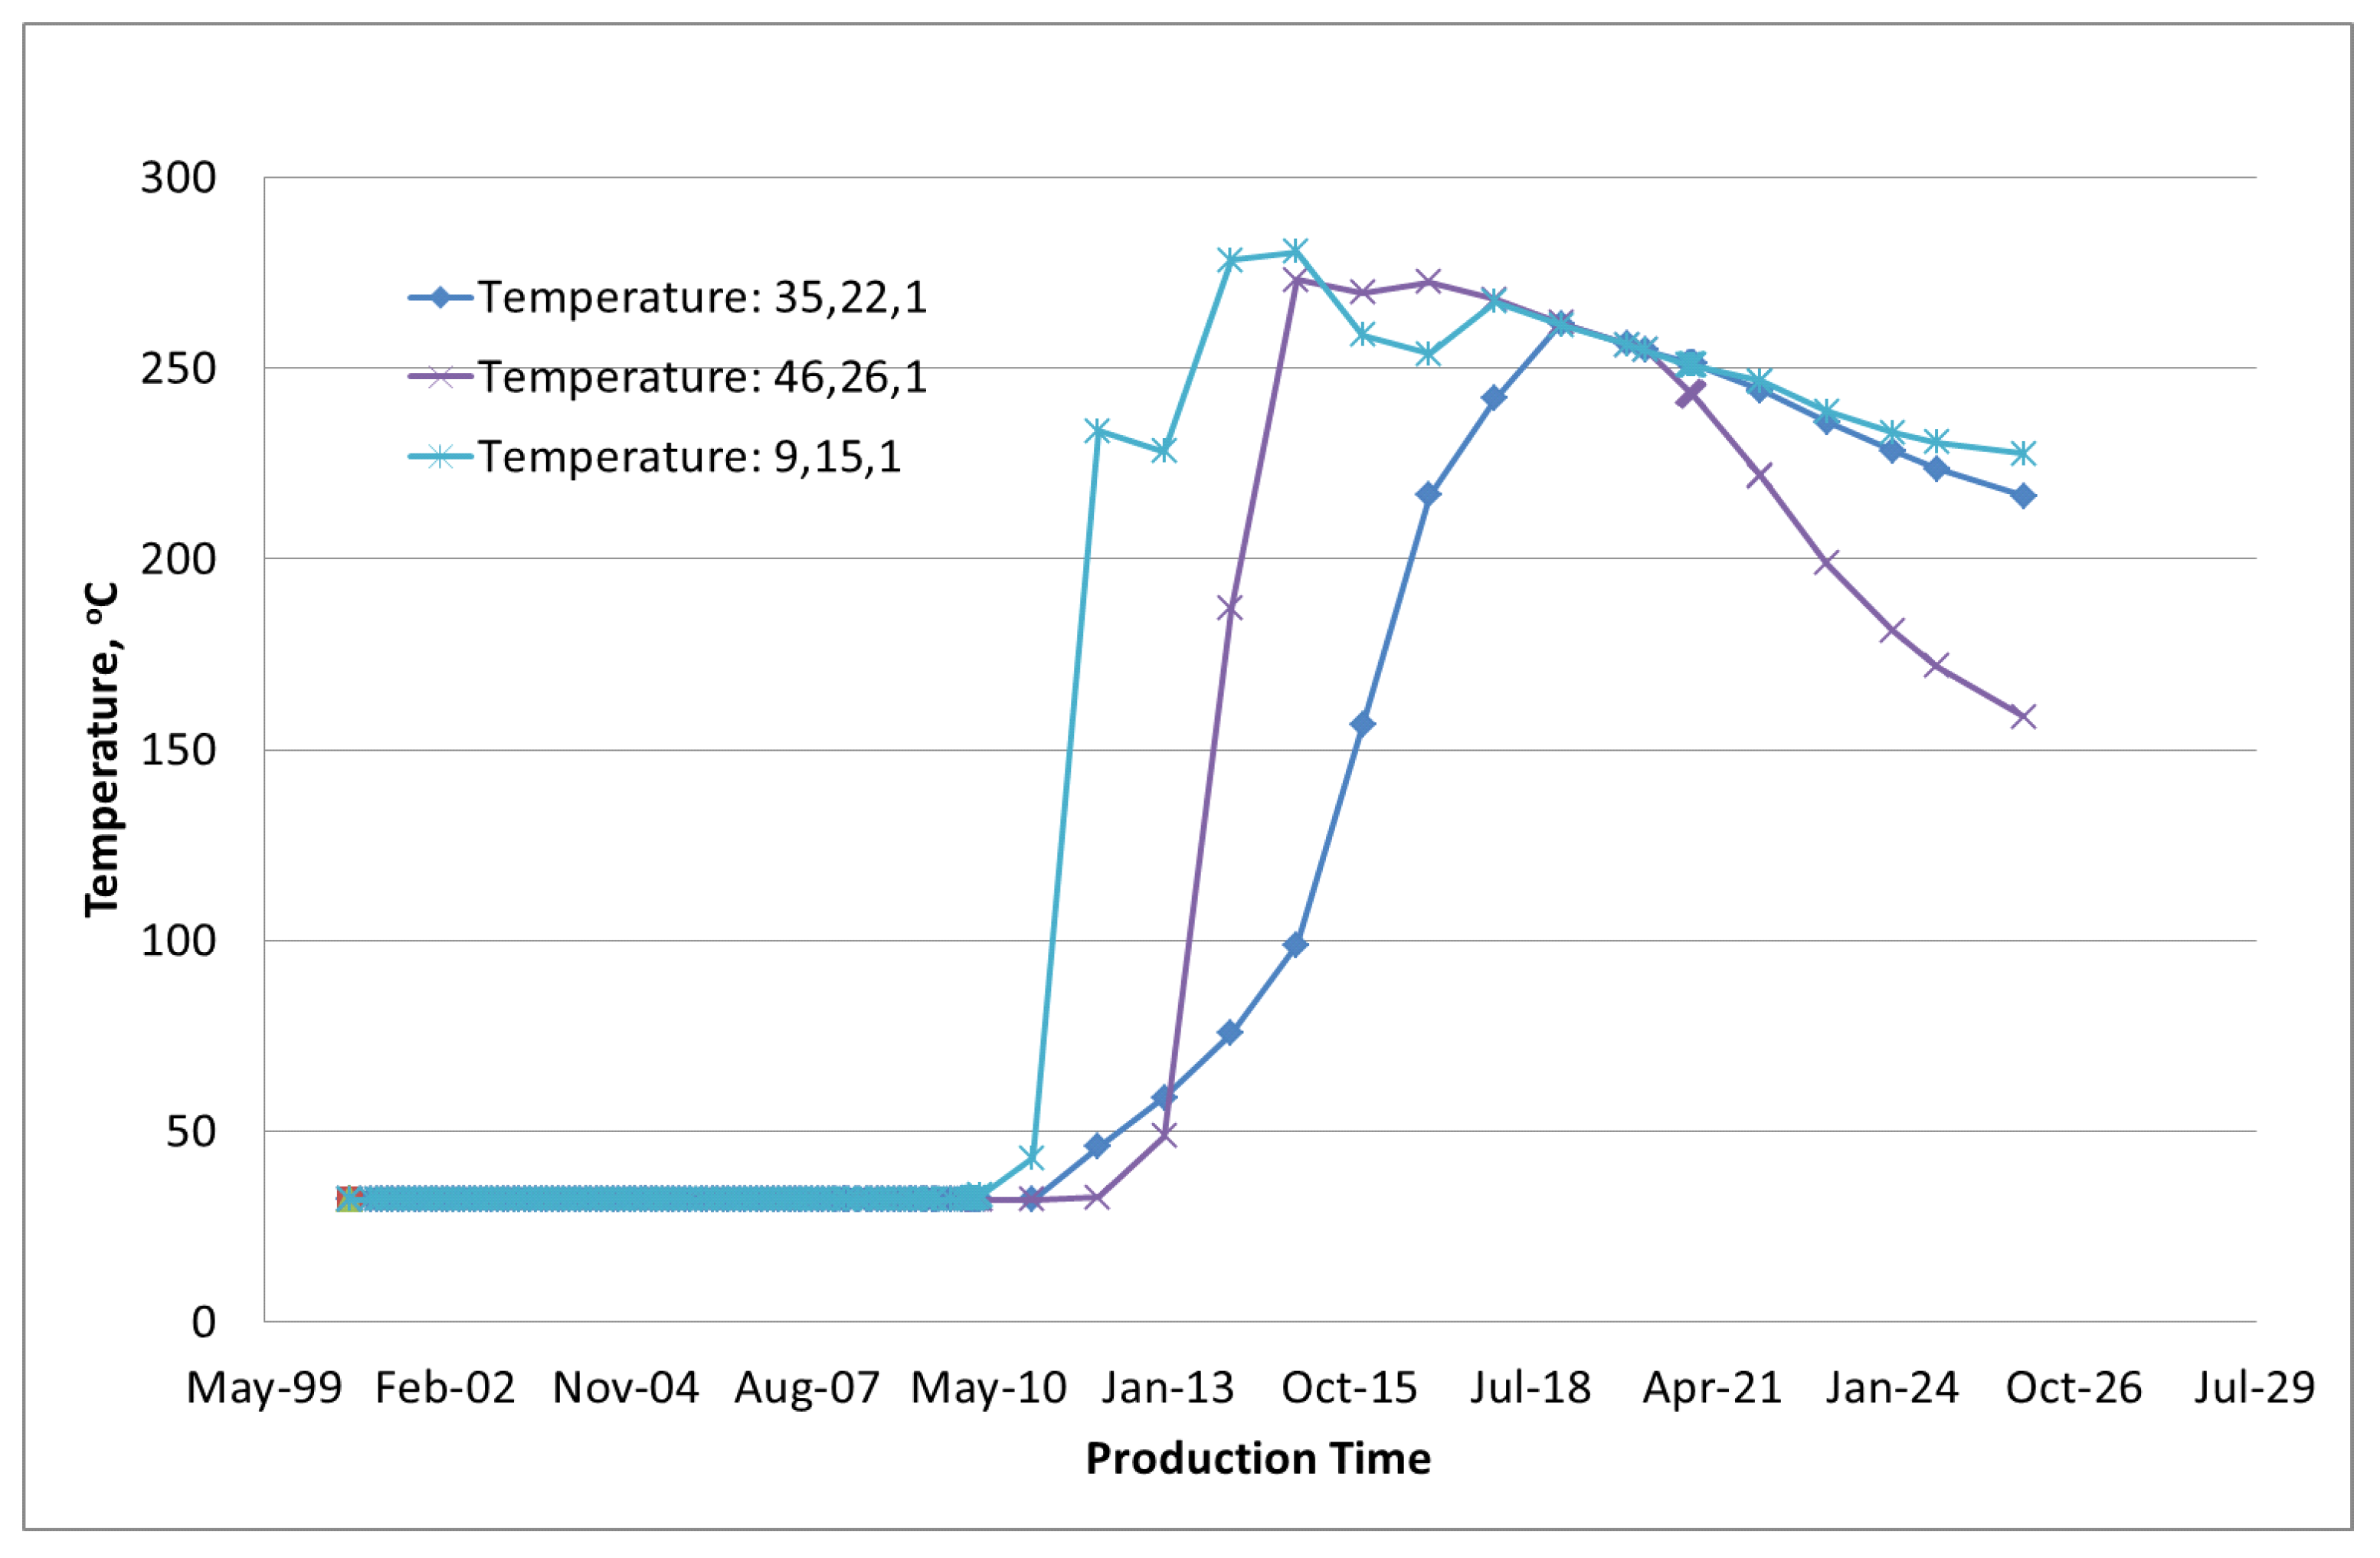
2.3. Effect of CO2 on the Temperature of the Reservoir’s Top
3. Emission Reduction from the Injection of CO2
4. Conclusions
- At the current stage of Liaohe SAGD operations, the oil rates and OSR are expected to fall continuously. The project economics may suffer with continuous high steam injection rates.
- Modeling results indicate that the OSR can be improved by 88% with the steam injection rate reduced by 66%; however, the lowering of the operating pressure in the steam chamber in this reservoir is not practical due to the high risk of top water invasion.
- By adding CO2 into the injected steam during SAGD operations, the operating pressure can be maintained with a reduced steam injection rate. The emissions of CO2 could be reduced by more than 50% due to the steam being saved and storage of CO2 in the reservoir, based on the simulation results.
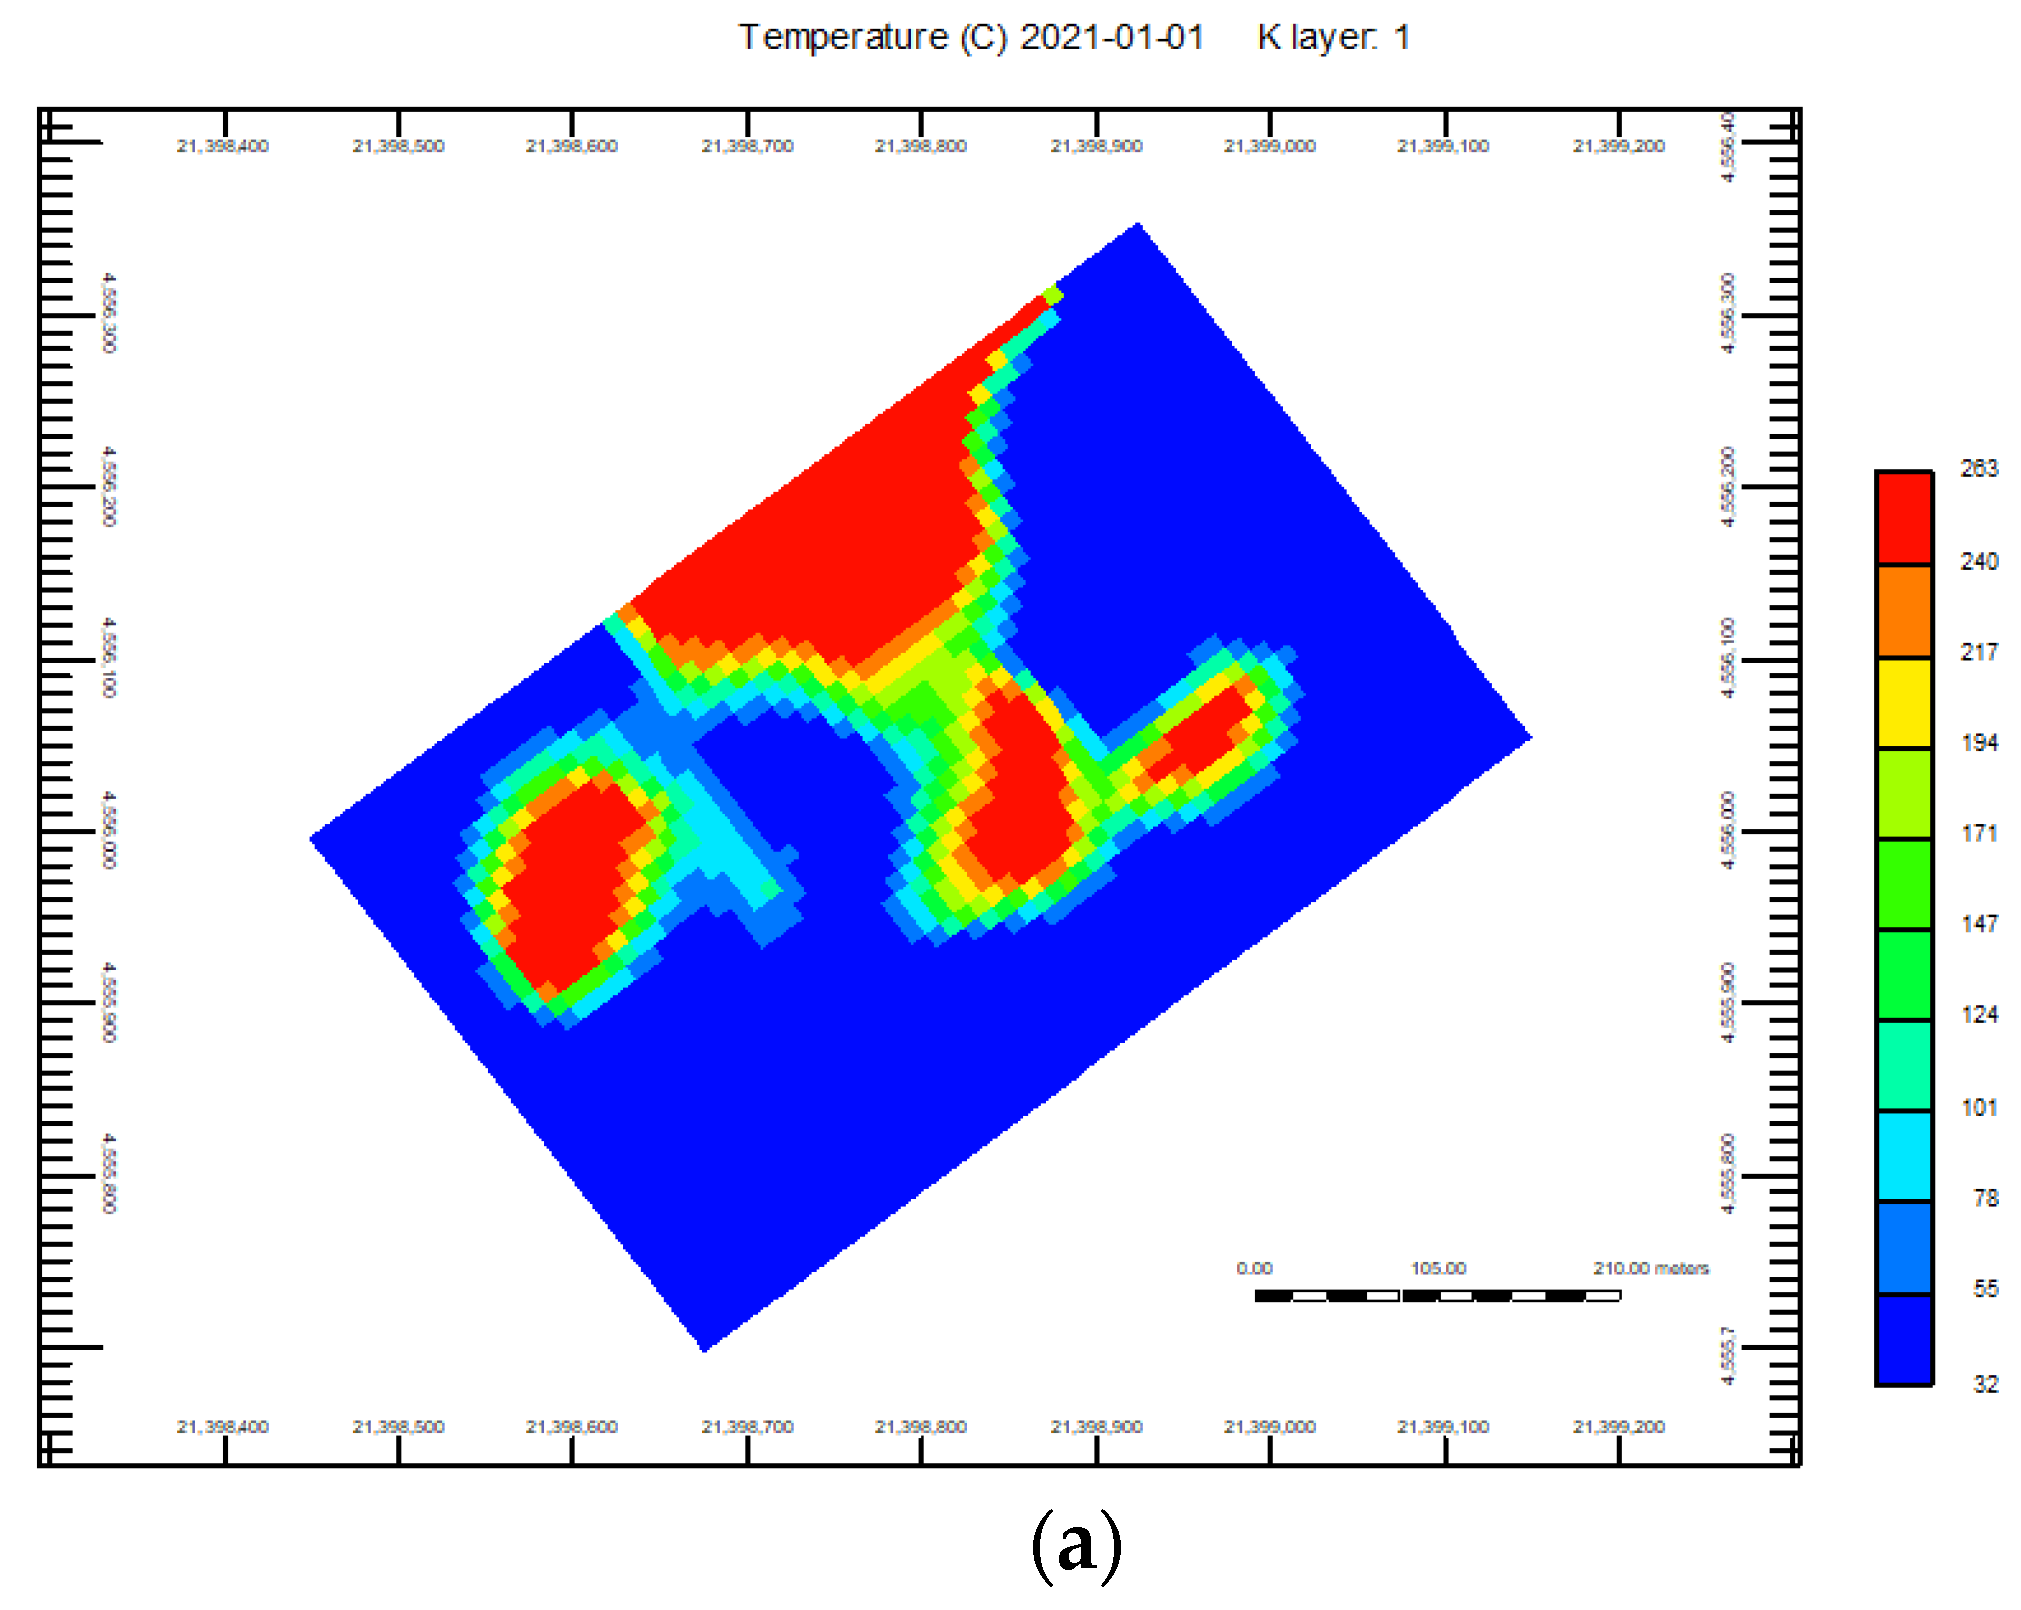
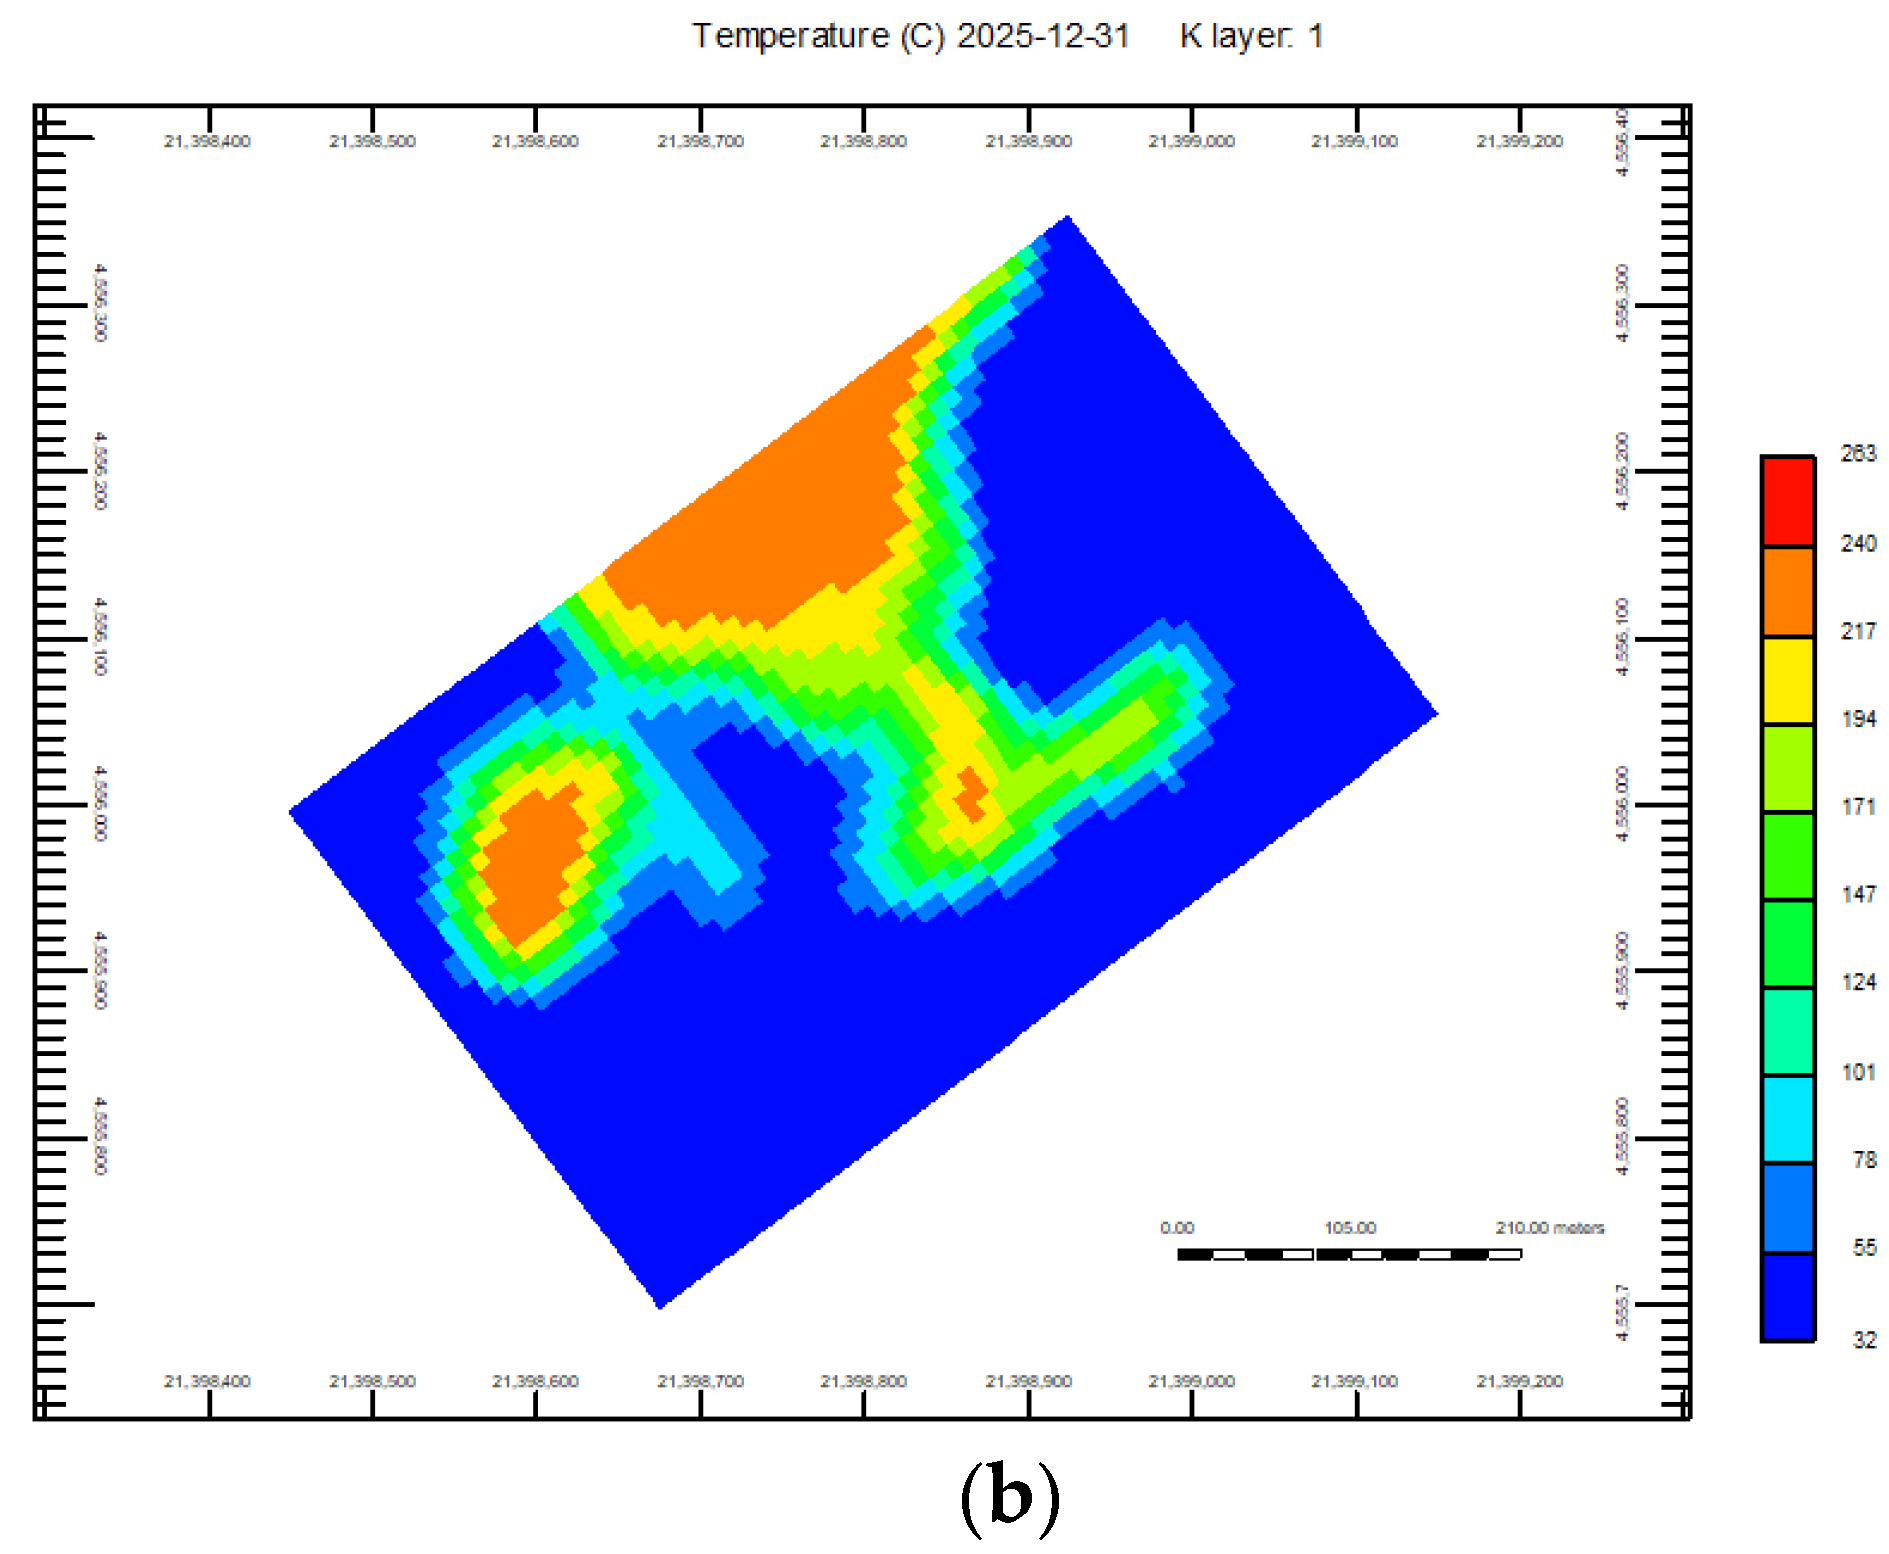
- The accumulation of CO2 at the top of steam chamber lowers the temperature in the formation near the top water layer by more than 20%, which is also beneficial to mitigating the impact of top water on SAGD performance.
- With a complete replacement of steam injection with CO2 gas during the late stage of SAGD operation, a negative emission can be achieved by effectively utilizing the remaining thermal energy in the steam chamber.
Author Contributions
Funding
Data Availability Statement
Conflicts of Interest
References
- Meyer, R.F.; Attanasi, E.D.; Freeman, P.A. Heavy Oil and Natural Bitumen Resources in Geological Basins of the World; U.S. Geological Survey Open-File Report; U.S. Geological Survey: Reston, VA, USA, 2007; pp. 1–33.
- Liu, Y.M. Status and Prospective of Heavy Oil Research. Pet. Explor. China 2010, 15, 69–76. [Google Scholar]
- Jiang, Q.; Thornton, B.; Russel-Houston, J.; Spence, S. Review of Thermal Recovery Technologies for the Clearwater and Lower Grand Rapids Formations in the Cold Lake Area in Alberta. J. Can. Pet. Technol. 2010, 49, 2–13. [Google Scholar] [CrossRef]
- Energy, C. Cenovus Foster Creek In-Situ Oil Sands Scheme (8623) Update for 2015; Subsurface Calgary: Calgary, AB, Canada, 2016; pp. 72–89. [Google Scholar]
- Butler, R. Some Recent Developments in SAGD. J. Can. Pet. Technol. 2001, 40, 18–22. [Google Scholar] [CrossRef]
- Kapadia, P.R.; Wang, J.; Kallos, M.S.; Gates, I.D. Practical process design for in situ gasification of bitumen. Appl. Energy 2013, 107, 281–296. [Google Scholar] [CrossRef]
- Azom, P.N.; Srinvasan, S. Modeling Couple Heat Transfer and Multiphase Flow during the Expanding Solvent SteamAssisted Gravity Drainage (ES-SAGD) Process. In Proceedings of the SPE Annual Technical Conference and Exhibition, New Orleans, LA, USA, 30 September–2 October 2013. SPE166357-MS. [Google Scholar]
- Nasr, T.N.; Beaulieu, G.; Golbeck, H.; Heck, G. Novel Expanding Solvent-SAGD Process “ES-SAGD”. In Proceedings of the Canadian International Petroleum Conference, Calgary, AB, Canada, 11–13 June 2002. PETSOC-2002-072-EA. [Google Scholar]
- Gupta, S.; Gittins, S. Optimization of Solvent Aided Process. J. Can. Pet. Technol. 2009, 48, 49–53. [Google Scholar] [CrossRef]
- Zhao, L. Steam Alternating Solvent Process. In Proceedings of the SPE International Thermal Operations and Heavy Oil Symposium and Western Regional Meeting, Bakersfield, CA, USA, 28–31 March 2004. SPE-86957-MS. [Google Scholar]
- Gupta, S.; Gittins, S.; Picherack, P. Field Implementation of Solvent Aided Process. J. Can. Pet. Technol. 2005, 44, 8–13. [Google Scholar] [CrossRef]
- Gupta, S.; Gittins, S. Christina Lake Solvent Aided Process Pilot. J. Can. Pet. Technol. 2006, 45, 15–18. [Google Scholar] [CrossRef]
- Butler, R. The Steam And Gas Push (SAGP). J. Can. Pet. Technol. 1999, 38, 54–61. [Google Scholar] [CrossRef]
- Jiang, Q.; Butler, R.; Yee, C.T. The Steam and Gas Push (SAGP)-2: Mechanism Analysis and Physical Model Testing. J. Can. Pet. Technol. 2000, 39, 52–61. [Google Scholar] [CrossRef]
- Butler, R.M.; Jiang, Q.; Yee, C.T. Steam And Gas Push (SAGP)-3: Recent Theoretical Developments And Laboratory Results. J. Can. Pet. Technol. 2000, 39, 51–60. [Google Scholar] [CrossRef]
- Butler, R.M.; Jiang, Q.; Yee, C.T. Steam and Gas Push (SAGP)-4; Recent Theoretical Developments and Laboratory Results Using Layered Models. J. Can. Pet. Technol. 2001, 40, 54–61. [Google Scholar] [CrossRef]
- Gu, F.; Chan, M.; Rismyhr, O.; Kjosavik, A. Optimization of SAGD Wind-down and Blow-down for Athabasca Oil Sands. In Proceedings of the SPE Heavy Oil Conference, Calgary, AB, Canada, 11–13 June 2013. SPE-165481-MS. [Google Scholar]
- Bagci, A.S.; Sotuminu, O.G.; Mackay, E.J. Performance Analysis of SAGD Wind-Down Process With CO2 Injection. In Proceedings of the SPE Symposium on Improved Oil Recovery, Tulsa, OK, USA, 19–23 April 2008. SPE-113234-MS. [Google Scholar]
- Zhao, L.; Law, D.H.-S.; Nasr, T.N.; Coates, R.; Golbeck, H.; Beaulieu, G.; Heck, G. SAGD Wind-down: Lab Test and Simulation. J. Can. Pet. Technol. 2005, 44, 49–53. [Google Scholar] [CrossRef]
- Alberta Energy Regulator. Meg Energy Christina Lake Regional Project, 2018/2019 Performance Presentation Commercial Scheme Approval No. 10773, 18 July 2019. Available online: https://static.aer.ca/prd/documents/oilsands/insitu-presentations/2019MEGChristinaLakeSAGD10773.pdf (accessed on 1 May 2020).
- Yee, C.T.; Stroich, A. Flue Gas Injection Into a Mature SAGD Steam Chamber at the Dover Project (Formerly UTF). J. Can. Pet. Technol. 2004, 43. [Google Scholar] [CrossRef]
- Wang, Z.; Lu, T.; Li, Z.; Wang, F.; Li, S.; Chen, H. Analysis of Factors on Flue Gas Assisted SAGD Based on a 2DVisualization Physical Model. Energy Fuels 2021, 35, 14510–14518. [Google Scholar] [CrossRef]
- Zare, A.; Hamouda, A.A. Coinjection of C6, C7, and CO2 with steam to improve low-pressure SAGD process. Fuel 2019, 238, 394–401. [Google Scholar] [CrossRef]
- Gong, H.; Yu, C.; Jiang, Q.; Su, N.; Zhao, X.; Fan, Z. Improving recovery efficiency by CO2 injection at late stageof steam assisted gravity drainage. Adv. Geo-Energy Res. 2022, 6, 276–285. [Google Scholar] [CrossRef]
- Beaton, M.L.; Mashhadi, N.; Dominato, K.R.; Maguire, T.J.; Rupert, K.D.; Mundle, S.O.C. Monitoring CO2 injection and retention in steam-assisted gravity drainage (SAGD) operations. J. Pet. Sci. Eng. 2022, 218, 111050. [Google Scholar] [CrossRef]
- Liu, Z.; Zhang, M.; Zhou, D. Study on SAGP for Guantao Super Heavy Oil Reservoir in Block Du84. Spec. Oil Gas Reserv. 2013, 20, 96–98. [Google Scholar]
- Xin, K. Research and Field Test of NCG Assisted SAGD technology. Sino-Glob. Energy 2017, 22, 52–56. [Google Scholar]
- Khormali, A.; Ahmadi, S. Prediction of barium sulfate precipitation in dynamic tube blocking tests and its inhibition for waterfooding application using response surface methodology. J. Pet. Explor. Prod. Technol. 2023, 13, 2267–2281. [Google Scholar] [CrossRef]
- Ameri, A.; Farajzadeh, R.; Kaveh, N.S.; Suicmez, S.; Wolf, K.; Bruining, H. Effect of matrix wettability CO2 assisted gas-oil garvity drainage in naturally fractured reservoirs. In Proceedings of the 77th EAGE Conference and Exhibition 2015, Madrid, Spain, 1–4 June 2015; pp. 845–849. [Google Scholar] [CrossRef]
- Fang, T.; Shi, J.; Sun, X.; Shen, Y.; Yan, Y.; Zhang, J.; Liu, B. Supercritical CO2 selective extraction inducing wettability alteration of oil reservoir. J. Supercrit. Fluids 2016, 113, 10–15. [Google Scholar] [CrossRef]
- Zhang, Q.; Liu, H.; Dong, X.; Liu, Y.; Li, G.; Wang, Y. A new comprehensive model to estimate the steam chamber expansion and recovery performance of entire SAGD process. J. Pet. Sci. Eng. 2020, 185, 106629. [Google Scholar] [CrossRef]
- Jiang, Q.; Liu, J.; Wang, Z.; Jiang, G.; Huang, S.; Yu, C.; Zhou, X. Prediction of top water flow rate to SAGD steam chamber and its impact on thermal efficiency. J. Pet. Sci. Eng. 2021, 205, 108976. [Google Scholar] [CrossRef]
- Greenhouse Gas Emission Guidelines: Stationary Combustion Sources, April 2009, North Carolina Division of Air Quality. Available online: http://www.ncair.org (accessed on 1 May 2022).


| Average pay thickness | 93 m |
| Thickness of top water layer | 20 m |
| Average permeability | 2350 mD |
| Average porosity | 0.32 |
| Length of horizontal well | 400 m |
| Thermal diffusivity of rock | 4.42 × 10⁻⁷ m2/s |
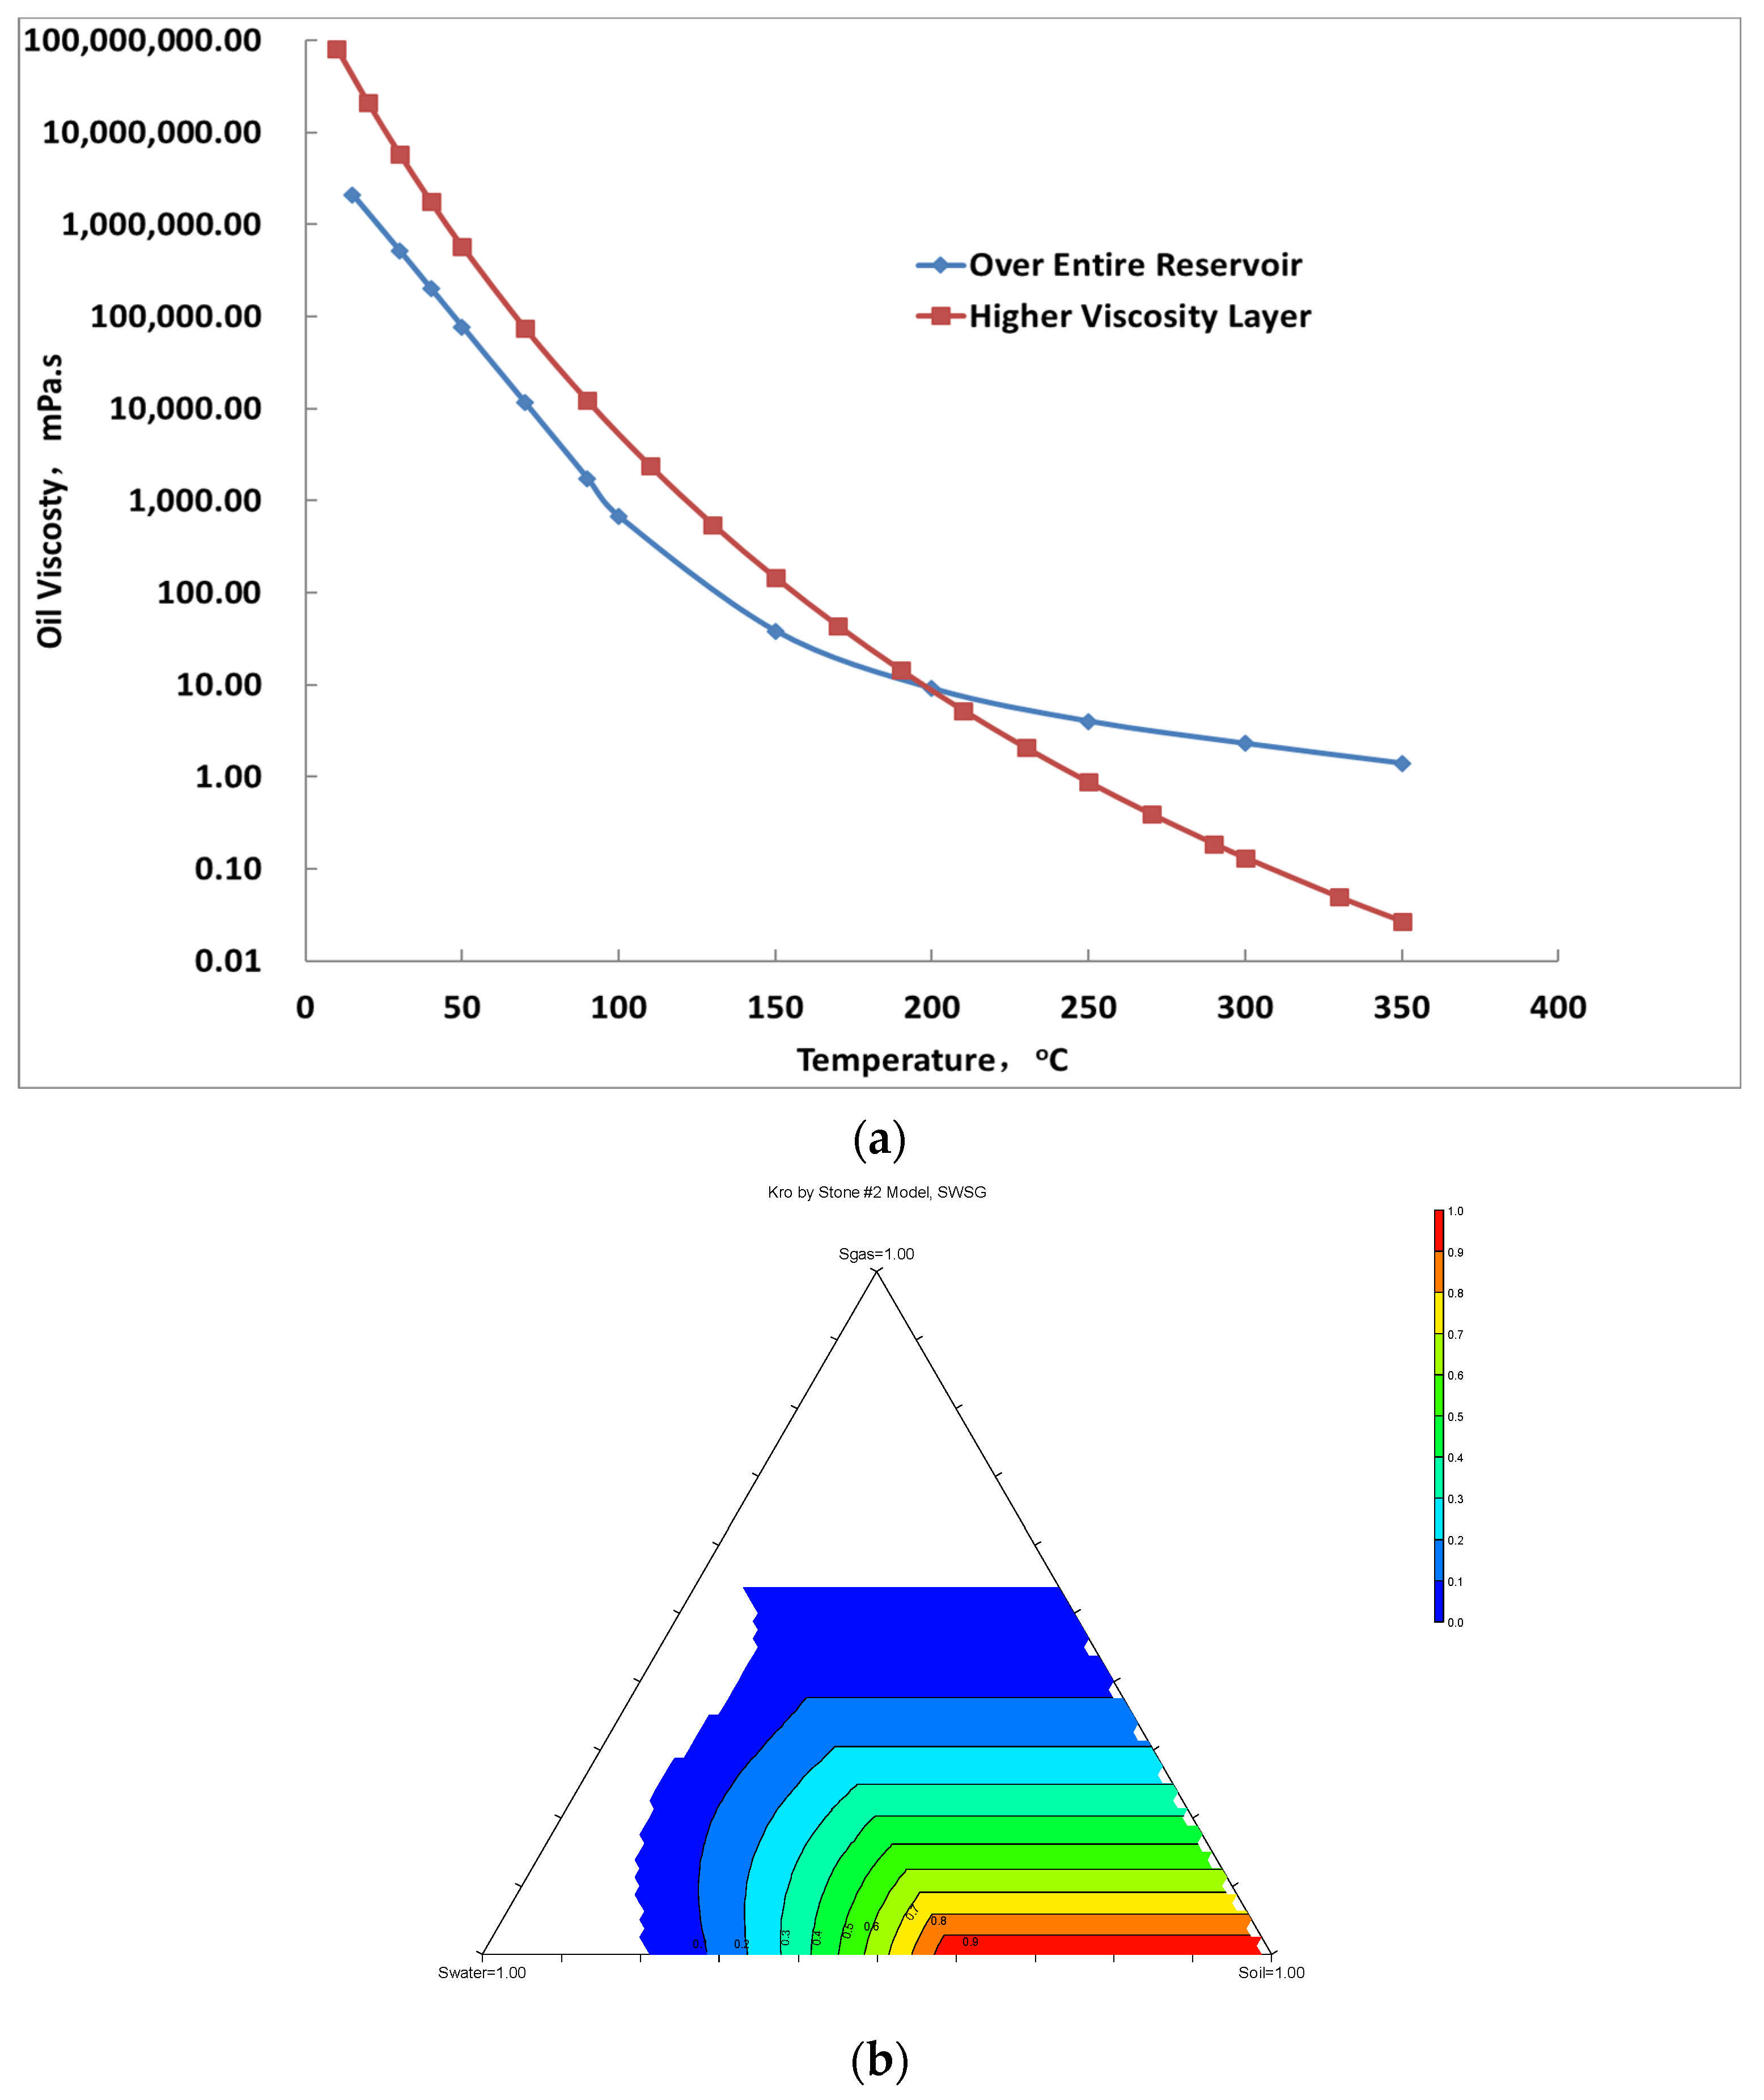
| Oil viscosity @ 40 °C | 198,000 mPa·s |
| Oil viscosity @ 100 °C | 673 mPa·s |
| Initial reservoir pressure at middle depth | 7.0 MPa |
| Pressure in top water layer | 6.0 MPa |
| Steam chamber operating pressure | 4.0 MPa |
| Initial reservoir temperature | 38 °C |
| Compressibility coefficient of rock | 7.8 × 10⁻⁵ 1/kPa |
| Heat Capacity of rock | 2100 KJ/m3-°C |
| Thermal Conductivity of rock | 150 KJ/m-day-°C |
| Thermal Conductivity of oil | 11.5 KJ/m-day-°C |
| Thermal Conductivity of water | 53.5 KJ/m-day-°C |
| Coefficient | Units | Water | Oil | CO2 |
|---|---|---|---|---|
| KV1 | kPa | 1.19 × 10⁷ | 1.89 × 10⁶ | 8.62 × 10⁸ |
| KV4 | °C | −3816.44 | −4680.46 | −3103.39 |
| KV5 | °C | −227.02 | −132.05 | −272.99 |
| Injection Scenarios | Cumulative Oil Produced (m3) | Cumulative CO2 Injection (sm3) | Cumulative CO2 Production (sm3) | Cumulative Steam Injection (m3) | Oil–Steam Ratio (m3/m3) | Net CO2 to Oil Ratio (m3/m3) | Equivalent EOSR (m3/m3) |
|---|---|---|---|---|---|---|---|
| Scenario 1 | 490,505 | 0 | 0 | 1,970,844 | 0.25 | 0 | 0.25 |
| Scenario 2 | 316,202 | 0 | 0 | 678,898 | 0.47 | 0 | 0.47 |
| Scenario 3 | 378,647 | 5,583,541 | 218,331 | 678,898 | 0.51 | 14.2 | 0.50 |
| Scenario 4 | 297,804 | 17,772,264 | 1,644,599 | 0 | 54.1 | 1.39 |
| Injection Scenarios | Oil–Steam Ratio (m3/m3) | Storage of CO2 in Reservoir (kg) | CO2 Emission from Steam Generation (kg) | Total CO2 Emission (kg) |
|---|---|---|---|---|
| Scenario 1 | 0.25 | 0 | 568 | 568 |
| Scenario 2 | 0.47 | 0 | 302 | 302 |
| Scenario 3 | 0.51 | 27 | 278 | 251 |
| Scenario 4 | 101 | 0 | (−101) |
Disclaimer/Publisher’s Note: The statements, opinions and data contained in all publications are solely those of the individual author(s) and contributor(s) and not of MDPI and/or the editor(s). MDPI and/or the editor(s) disclaim responsibility for any injury to people or property resulting from any ideas, methods, instructions or products referred to in the content. |
© 2024 by the authors. Licensee MDPI, Basel, Switzerland. This article is an open access article distributed under the terms and conditions of the Creative Commons Attribution (CC BY) license (https://creativecommons.org/licenses/by/4.0/).
Share and Cite
Jiang, Q.; Liu, Y.; Zhou, Y.; Wang, Z.; Gong, Y.; Jiang, G.; Huang, S.; Yu, C. Improving Thermal Efficiency and Reducing Emissions with CO2 Injection during Late Stage SAGD Development. Processes 2024, 12, 1166. https://doi.org/10.3390/pr12061166
Jiang Q, Liu Y, Zhou Y, Wang Z, Gong Y, Jiang G, Huang S, Yu C. Improving Thermal Efficiency and Reducing Emissions with CO2 Injection during Late Stage SAGD Development. Processes. 2024; 12(6):1166. https://doi.org/10.3390/pr12061166
Chicago/Turabian StyleJiang, Qi, Yang Liu, Ying Zhou, Zhongyuan Wang, Yuning Gong, Guanchen Jiang, Siyuan Huang, and Chunsheng Yu. 2024. "Improving Thermal Efficiency and Reducing Emissions with CO2 Injection during Late Stage SAGD Development" Processes 12, no. 6: 1166. https://doi.org/10.3390/pr12061166