Abstract
The reservoir type of the MH oil field in the Junggar Basin is a typical low-permeability conglomerate reservoir. The MH oilfield was developed by water injection in the early stage. Nowadays, the reservoir damage is serious, and water injection is difficult. There is an urgent need to carry out conversion injection flooding research to improve oil recovery. The use of CO2 oil-flooding technology can effectively supplement formation energy, reduce greenhouse gas emissions, and improve economic benefits. In order to clarify the feasibility of CO2 flooding to improve oil recovery in conglomerate reservoirs with low permeability, strong water sensitivity, and severe heterogeneity, this paper researched the impact of CO2 miscibility on production characteristics and mechanisms through multi-scale experiments. The aim was to determine the feasibility of using CO2 flooding to enhance oil recovery. This study initially elucidated the oil displacement characteristics of varying degrees of miscibility in different dimensions using slim tube experiments and long core experiments. Subsequently, mechanistic research was conducted, focusing on the produced oil components, changes in interfacial tension, and conditions for pore mobilization. The results indicate that the minimum miscibility pressure (MMP) of the block is 24 MPa. Under the slim tube scale, the increase in the degree of miscibility can effectively delay the gas breakthrough time; under the core scale, once the pressure reaches the near mixing phase, the drive state can transition from a non-mixed “closed-seal” to a “mixed-phase” state. Compared to the immiscible phase, the near-miscible and completely miscible phase can improve the final recovery efficiency by 9.27% and 18.72%. The component differences in the displacement products are mainly concentrated in the high-yield stage and gas breakthrough stage. During the high-yield stage, an increase in miscibility leads to a higher proportion of heavy components in the produced material. Conversely, in the gas breakthrough stage, extraction increases as the level of mixing increases, demonstrating the distinct extracting characteristics of different degrees of mixed phases. The core experiences significant variations in oil saturation mostly during the pre-gas stage. CO2 miscible flooding can effectively utilize crude oil in tiny and medium-sized pores during the middle stage of flooding, hence reducing the minimum threshold for pore utilization to 0.3 μm.
1. Introduction
Within the framework of global climate change, the frequent prevalence of extreme climate events has led to a shared concern among the worldwide community over the reduction of greenhouse gas emissions [1,2,3]. The Paris Agreement establishes a target of limiting global warming to a maximum of 2 °C. The technology known as CO2 capture, utilization, and storage (CCUS) is recognized as a crucial means to accomplish this objective [4]. It is anticipated that CCUS will contribute to a reduction of 4 billion tons in carbon emissions by the year 2060 [5,6]. CO2 flooding is a crucial component of CCUS and a very successful method for realizing China’s “2060 Carbon Neutral Vision”—the objective of lowering carbon emissions by 4% each year. CO2 oil flooding is a very successful method for enhancing crude oil recovery and increasing crude oil production [7,8,9]. It serves as a crucial strategy for ensuring national energy security and aligns with the objectives of the Paris Agreement and the country’s “double carbon” agenda [10].
CO2-flooding technology has emerged as one of the major ways to improve oil recovery, particularly in very heterogeneous and highly water-sensitive, low-permeability conglomerate reservoirs, by successfully supplementing formation energy. As an established enhanced oil recovery technique, miscible oil displacement technology (CO2-EOR) has drawn a lot of interest lately. According to research by Narendra Kumar et al. [11], CO2 injection can successfully raise recovery by lowering crude oil’s viscosity and improving the fluidity of oil reservoirs [12,13,14]. Presently, the research in this area has not yet established a unified comprehension of the mechanism of CO2 flooding for these particular reservoirs, particularly during the intermediate to later stages of reservoir development [15,16,17,18]. During this phase, substantial depletion and pressure reductions in subsurface energy create challenges in dealing with mixed-phase stress conditions. However, after breaking the gas phase, near-miscible displacement instead exhibits the ability to produce significant amounts of crude oil and efficiently lowers the viscosity of CO2 and the raw oil to CO2 flow ratio, which presents new possibilities for attaining more economically advantageous oil drive effects [19,20].
Traditional physical simulation tests are limited to measuring fluid conditions at the input and outflow points. They rely on gathering data at both ends of the holder to derive macroscopic parameters and assess the effectiveness of oil displacement. Nevertheless, the precise mechanism of fluid flow within the core remains unclear, and investigating the dynamic properties of pores is crucial for comprehending the impact of oil displacement. The viscosity of crude oil plays a vital role in the process of reservoir development. Lack of a clear comprehension of the fluid dynamic properties hinders the ability to thoroughly analyze the distribution of fluid saturation and the mechanisms of migration inside rocks [21]. At present, Wang et al. [22] has obtained the distribution of fluid saturation along the core at different times and the affected area of the displacement front through nuclear magnetic resonance T2 testing (NMR) and nuclear magnetic resonance imaging (MRI) scanning and realized a visual comparison of the fluid-affected area, so as to explain the macroscopic mechanism of gas injection to improve oil recovery in tight sandstone. By comparing the amplitude change characteristics of nuclear magnetic resonance T2 spectrum signals under different displacement amounts, we can obtain quantitative data on the use of crude oil in pores and the distribution of the remaining oil in different pores and quantitatively analyze the fluid migration law in the pore throat of tight conglomerate gas drives and the key influencing factors for improving oil recovery [23,24]. Understanding the distribution position thereby enables a quantitative analysis of the primary influencing elements for enhancing oil recovery as well as the fluid migration patterns in tight conglomerate gas drive pore throats [25]. The technology stands out for being highly accurate, sensitive to fluid fluidity and spacing, and information-rich. Its application aids in the visualization of the fluid wave region and explains the macro mechanism of tight conglomerate injection to boost yield rate [26,27,28].
Improving the level of reservoir usage is crucial for low-permeability conglomerate reservoir development in order to achieve a notable increase in oil recovery. The MH oilfield is located in the Junggar Basin in Xinjiang, China. It has a monocline structure with a main burial depth of 2812–4230 m. It is a fan delta deposit with conglomerate lithology. The microscopic cavity structure of the reservoir has a re-modular characteristic; the distribution of the cavity throat is extremely uneven; the pore–throat ratio is large, and the coordination number is low; the overall characteristic of the polyphonic fine state is that the type of cavity gap mainly includes intergranular holes and insulated holes in the granule; the storage layer is heterogeneous and has strong water sensitivity [29,30,31]. These characteristics lead to many challenges in the development process of this type of oil reservoir. For example, the oil field currently faces outstanding contradictions such as a continuous increase in water injection and well injection pressure and severe under-injection, a continuous decrease in oil well pressure, and an insufficient liquid supply [32]. During field tests, most water injection wells had problems such as low injection volume, resulting in low formation pressure maintenance in the test area, a rapid decline in oil well production, and low reservoir recovery [33,34]. It is urgent to carry out conversion injection flooding research [35].
In view of the large holding pressure difference in the conglomerate reservoir in the MH oil field and the potential to realize CO2 miscible oil displacement, we have conducted a study on the characteristics of CO2 driving in low-permeability conglomerate reservoirs with different miscibility levels [36,37,38]. Firstly, the minimum miscible pressure of the block and the CO2-flooding mechanism at the capillary scale were determined through slim tube experiments. Secondly, through long core gas drive experiments, high-pressure nuclear magnetic online monitoring, and other experimental methods, the actual oil storage with different mixed-phase levels of capture effect was quantified, and finally, the interaction of CO2 and crude oil, changes in oil–water interface tension, and the distribution characteristics of residual oil in the CO2 drive replacement process were clarified [39,40]. Our study quantified the differences in production at different miscibility levels at the slim tube and core scales and divided CO2 flooding into three main stages based on the driving mechanism. More importantly, we found that the composition of the produced products differed between the high-production and gas appearance stages. This article’s research enhances the versatility of CO2 oil displacement technology in conglomerate reservoirs and elucidates the efficiency of oil displacement. Furthermore, enhancing the comprehension and regulation of pore displacement can lead to more efficient utilization and retrieval of CO2, leading to a reduction in greenhouse gas emissions and an enhancement of the economic advantages of the reservoir [41,42]. This research can offer experimental data for optimizing and implementing on-site gas injection strategies in MH oil fields and provide theoretical backing.
2. Experimental Materials, Equipment, and Methods
2.1. Sample Preparation
The cores used in this study were taken from a typical well group in the MH oilfield. The basic data of the block are listed in Table 1. Each core has typical characteristics of conglomerate reservoirs. At the beginning of the experiment, the core should be end-faced and oil-washed and dried. The basic physical properties of the core are listed in Table 2. During the long core displacement experiment, the long cores were spliced according to the harmonic average; the cores required for the nuclear magnetic resonance experiment were selected from the No. 1 core with the largest permeability, the smallest No. 4 core, and the medium No. 9 core. The experimental oil was taken from a typical well in the MH oilfield, and the experimental water is simulated formation water, which is NaHCO3 water type, and the total salinity is 33.11 mg/mL. China Beijing Millennium Capital Gas Co., Ltd. provided the 99.9% pure CO2 for the experiment.

Table 1.
Block basic data.
Table 2.
Core physical property parameters.
2.2. Slim Tube Experiment
The goal of the slim tube experiment is to determine the relationship between oil displacement efficiency and displacement pressure by varying the displacement pressure and then to clarify the impact of the minimum miscibility pressure and degree of miscibility at the slim tube scale on the recovery effect. The criteria for determining CO2 miscibility in this study are as follows: From the beginning of injection to the injection of 1.2 PV CO2 until the recovery factor no longer increases, an inflection point appears in the relationship curve between displacement efficiency and displacement pressure, and the final recovery rate near the inflection point exceeds 90%. Then, the inflection point corresponds to the minimum miscible pressure (MMP); the final recovery factor when 1.2 PV is injected is used as the basis for comparison of each displacement experiment.
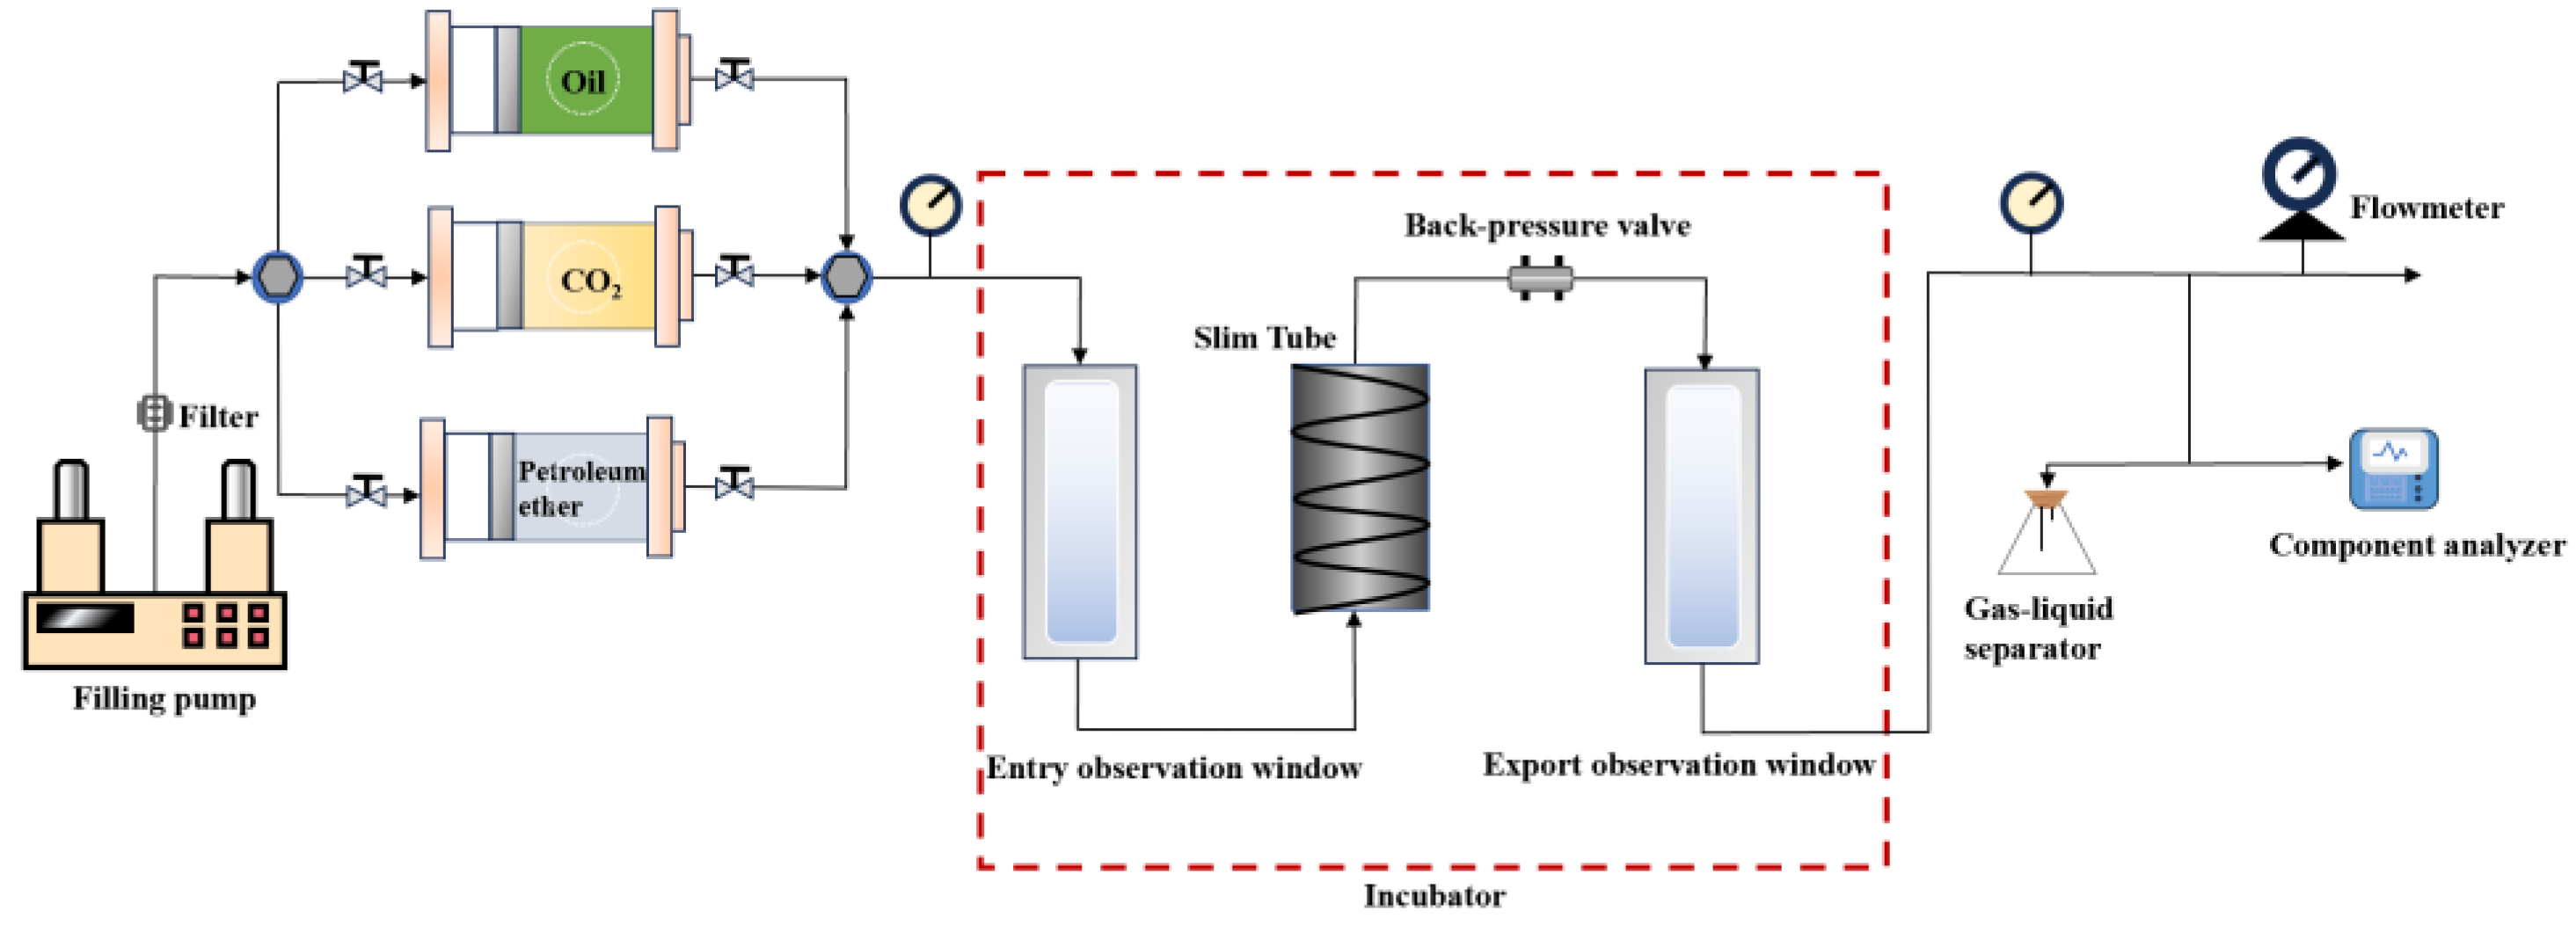
This slim tube experiment uses a SYS-III multi-stage high-temperature and high-pressure two-phase displacement system, incubator, ISCO-26 fluid pump, long slim tube, precision pressure gauge, six-way valve, gas–liquid separation device, and MC gas meter, The experimental flow chart is shown in Figure 1. Prior to the experiment, the long slim tube’s volume was calculated using Boyle’s equation, and its porosity and permeability upon sand loading were measured using N2. The measurements of the long slim tube were 0.458 cm in diameter, 1251 cm in length, and 206.1 cm3 in volume. Its pore volume is 76 cm3 and its permeability is 5.3 D.

Figure 1.
Schematic diagram of the slim tube experimental device.
The slim tube experiment operates in the following ways: (1) After cleaning and vacuum-pushing the sand-filled slim tube, adjust the incubator’s temperature to 65 °C, which is the formation temperature. (2) Configure live oil according to the on-site gas–oil ratio and well flow conditions. After the configuration is completed, transfer it to an intermediate container and place it in a thermostat. (3) Set the back pressure to 19 Mpa, 22 Mpa, 25 Mpa, 28 Mpa, and 31 Mpa, respectively, corresponding to different degrees of miscibility. (4) Use CO2 to drive oil at a steady rate of 0.2 mL/min. Stop the experiment when the injection reaches 1.2 PV and the oil output is less than 0.1 mL in 5 min. Record the upstream and downstream pressure differential, breakthrough pressure, gas time, output liquid phase and gas phase flow rates, and other parameters at various periods.
2.3. CO2 Displacement Experiment of Long Core
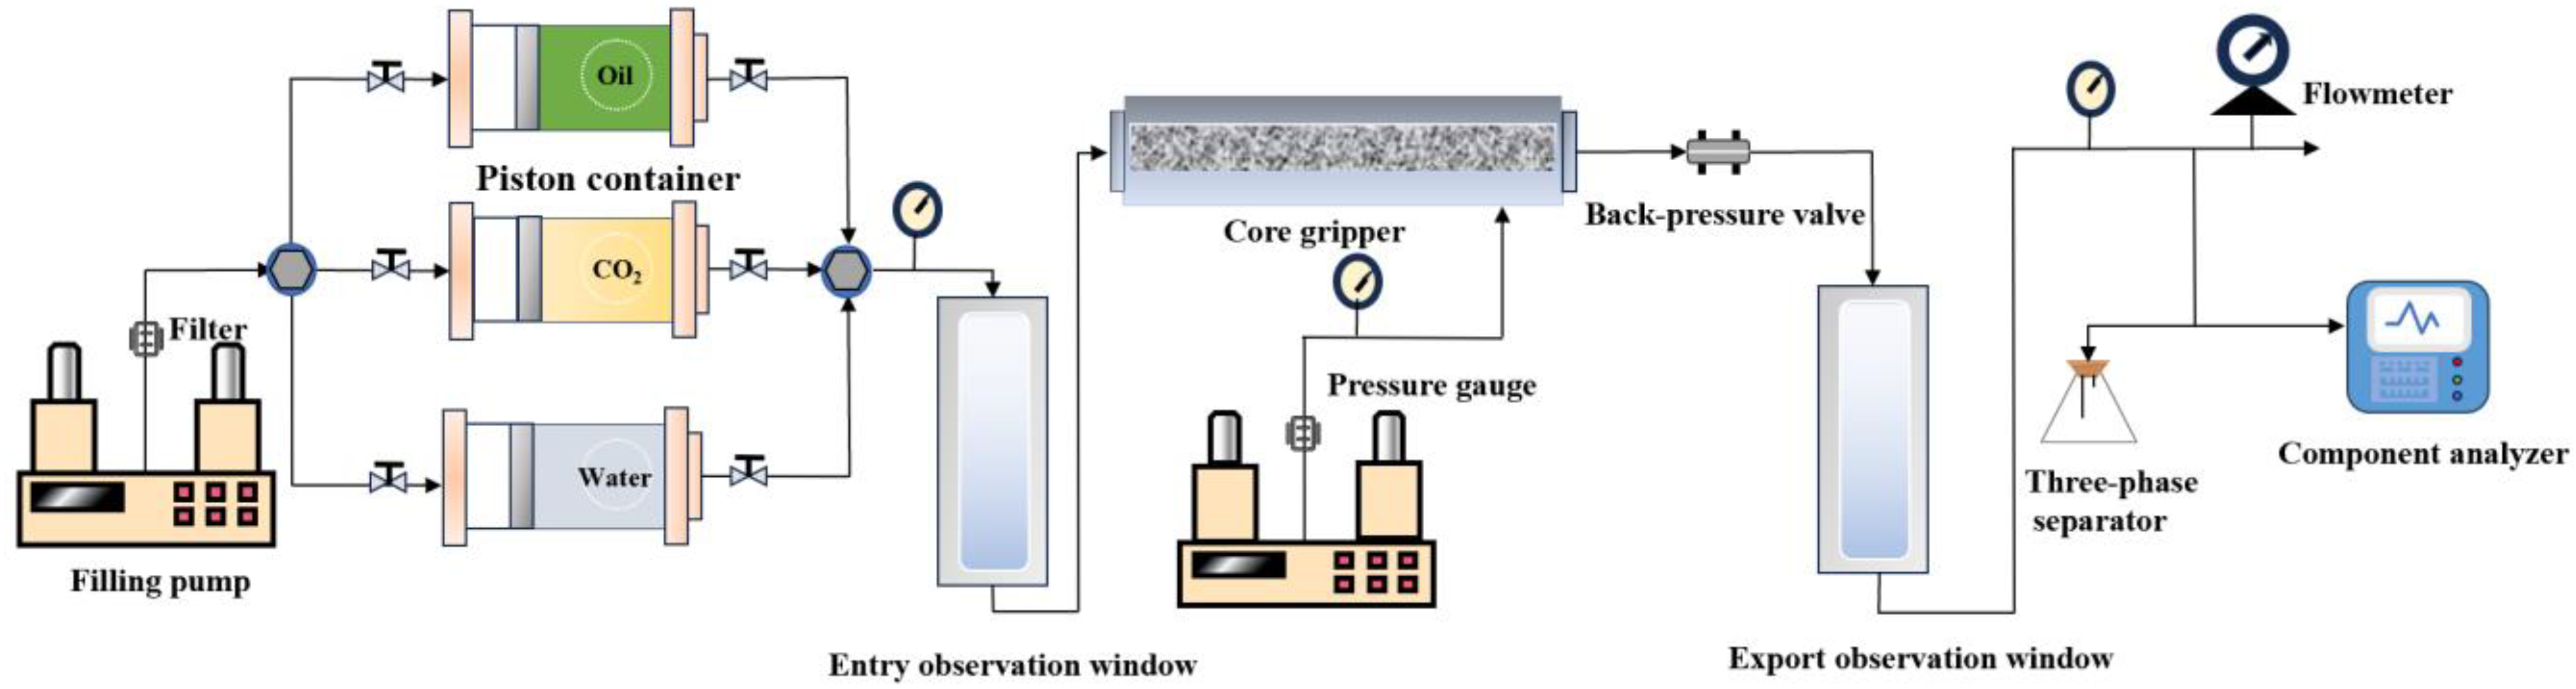
The long core displacement physical simulation experiment can replicate the oil layer to the greatest extent possible while maintaining geometric similarity with the reservoir, as well as investigate the recovery scenario under various miscibility levels under actual reservoir conditions. The equipment utilized in this long core experiment is separated into three categories: an injection system, a core holder, and an extraction system. The three systems are independent plate structures. The injection system includes an input drive replacement pump, a perpendicular pump, three piston containers (for oil samples, CO2 atmospheric samples, and ground water samples, respectively), and an extraction system with a voltage valve, a flow meter, a three-phase separator, and a gas phosphate spectrometer. The experimental procedure is depicted in Figure 2.
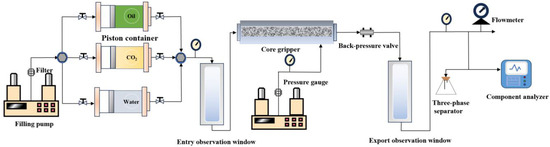
Figure 2.
Schematic diagram of CO2-flooding long core experimental device.
The long core CO2-flooding experimental procedure is described below: (1) Use N2 calibration and harmonic average sorting to splice long core porosity and permeability data. (2) Set the experimental temperature to 65 °C, evacuate for 6 h using a vacuum pump, and saturate the long core with simulated formation water to create bound water. (3) Inject 2 PV crude oil at a steady rate of 0.2 mL/min to saturate the core, then measure the saturated oil volume and irreducible water saturation. (4) Set the back pressure to 18 MPa, 21 MPa, and 24 MPa, respectively, and use CO2 to drive oil at a constant rate of 0.1 mL/min. Stop the experiment when the injection exceeds 1.5 PV and the oil output at the conclusion of production is less than 0.1 mL in 5 min. Record the pressure differential between upstream and downstream at various periods, the breakthrough pressure, the time when gas is visible at the outlet end, the liquid phase and gas phase flow rates at the outlet end, and any other characteristics.
2.4. Online Nuclear Magnetic Resonance Experiment
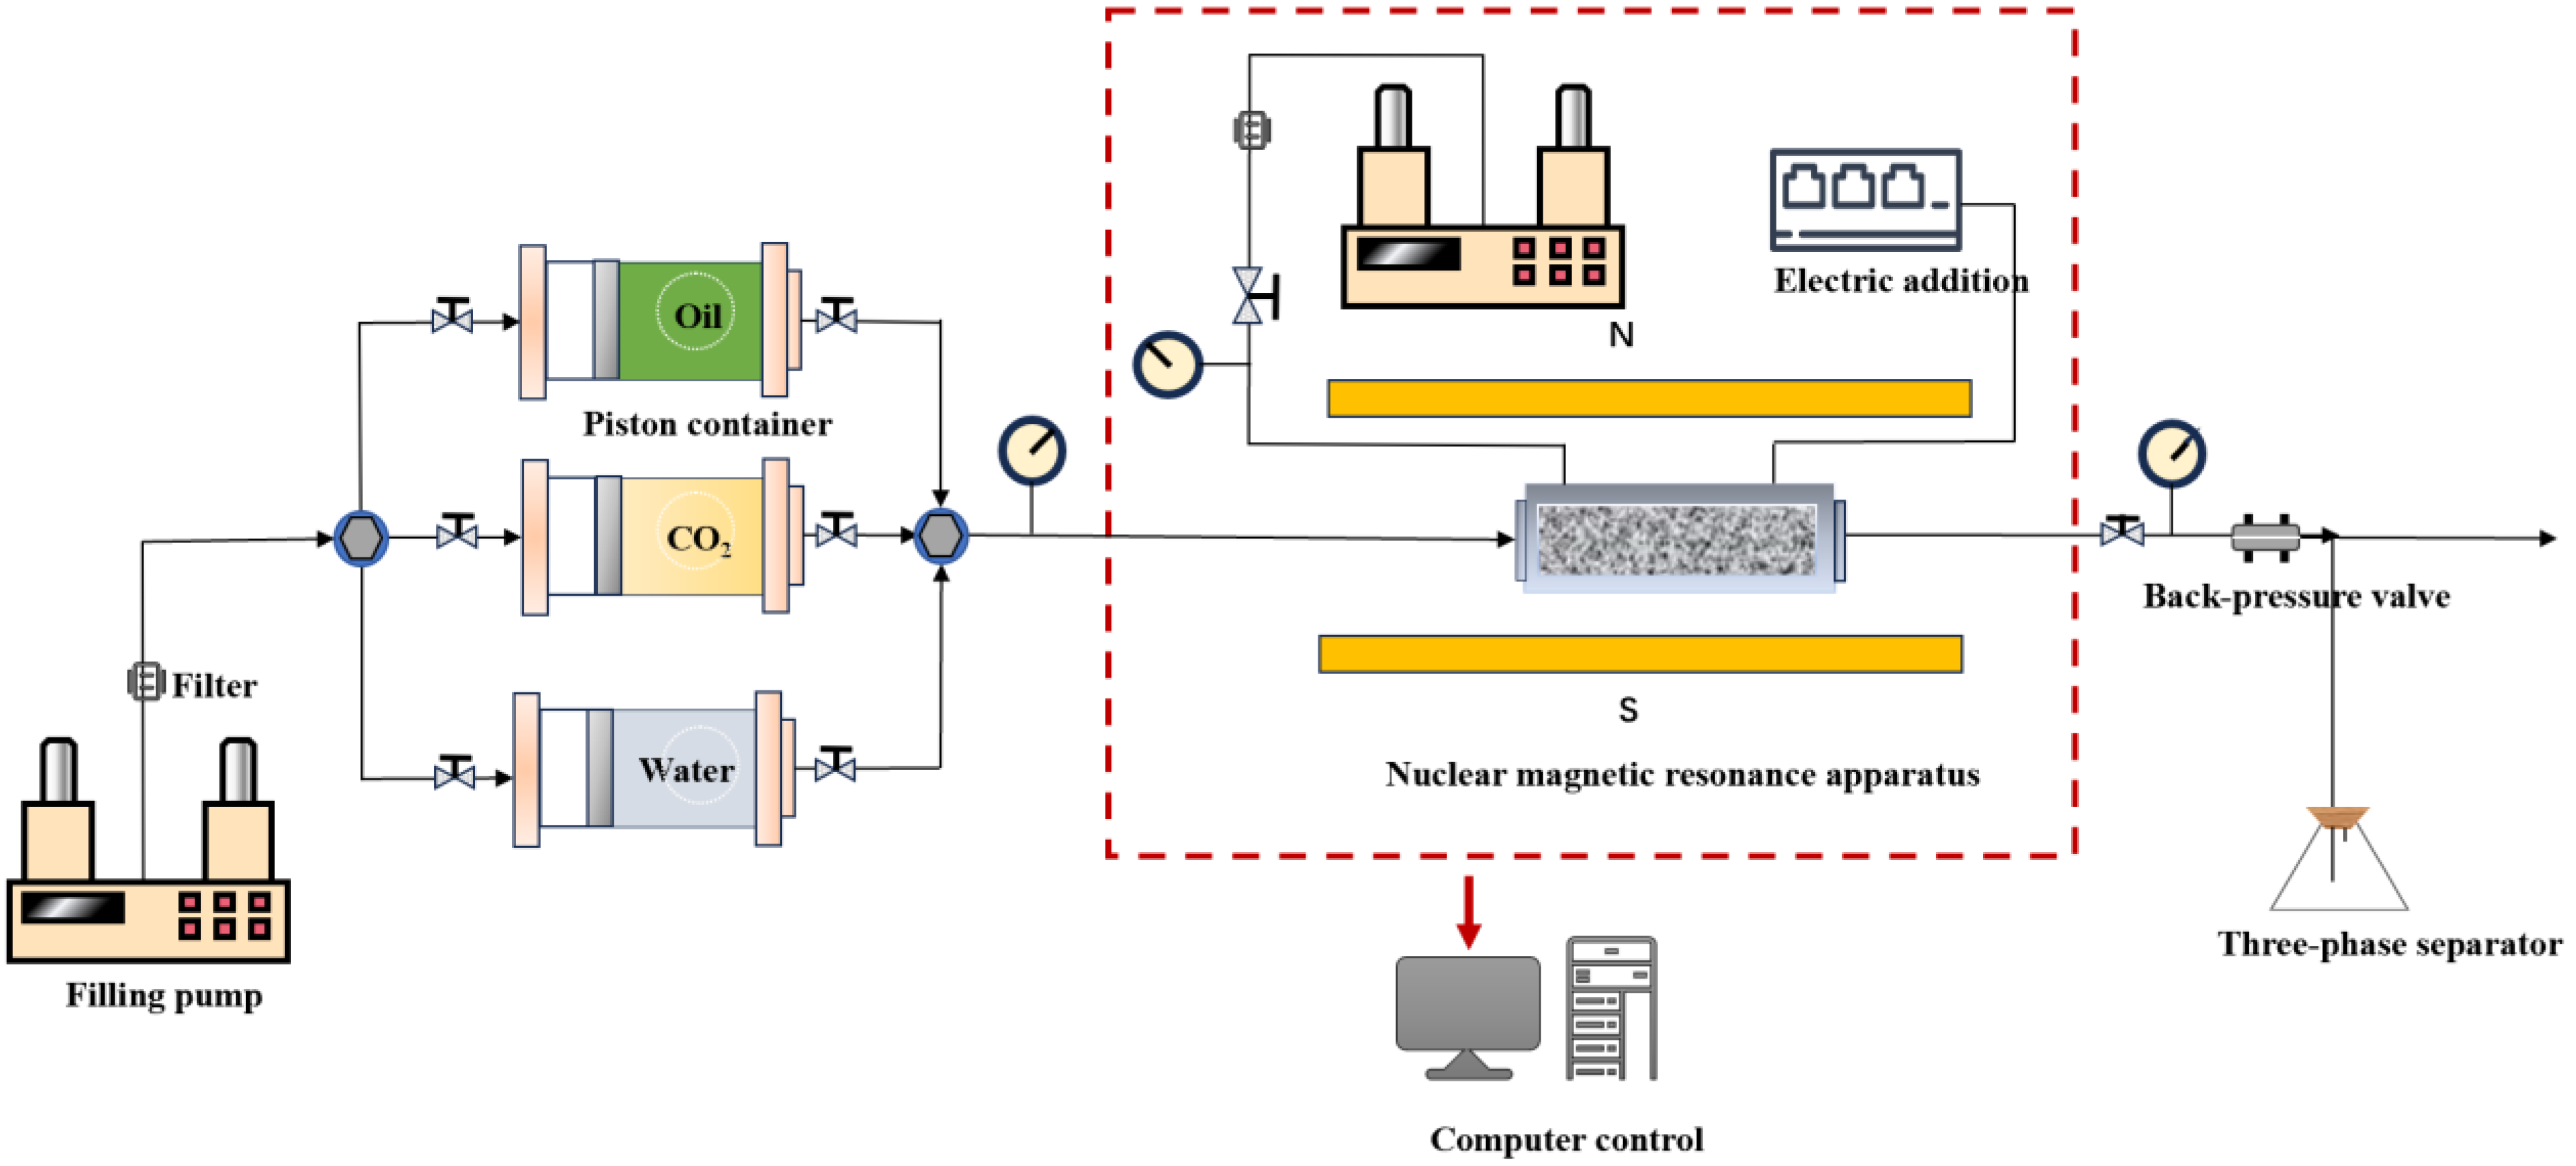
Nuclear magnetic resonance T2 testing (NMR) and nuclear magnetic resonance imaging (MRI) scanning can figure out the relationship between the peak value and relaxation time of the “H” fluid signal contained in the core at various intervals and provide visual imaging of the fluid-swept area. The nuclear magnetic resonance high-temperature and high-pressure online displacement system consists of three subsystems. ① The first is a constant-temperature oil bath-heating cycle ring pressure control system. Fluorine oil is used to circulate around the core holder to control the experimental temperature, and the annular pressure pump is used for pressure feedback adjustment to simulate the high-pressure environment of the formation. ② Fluid displacement simulation system. This is made up of a constant speed fluid pump (ISCO pump), a core device, a gas–liquid separation device, and other components that can move oil, water, gas, and other multi-phase fluids. This system controls back pressure at the gripper’s end. ③ The online nuclear magnetic experiment system can collect the fluid signal in the rock sample’s nanoscale pore throat while also correctly observing variations in the fluid signal amount in the core pore throat at various displacement moments. Figure 3 illustrates the experimental approach.

Figure 3.
Nuclear magnetic resonance high-temperature and high-pressure on-line displacement experimental device schematic diagram.
Before the experiment, the nuclear magnetic T2 spectrum parameters were first debugged, and the center frequency calibration, electronic shimming, and hard pulse amplitude adjustment were performed according to the sample conditions; the system pressure was maintained at 24 MPa, and the pressure change was less than 5% within 24 h. The remaining oil and remaining salt are washed from the rock sample in accordance with the provisions of SY/T5336, then it is blow dried with N2, the dry weight of the core is measured, and the T2 spectrum curve of the original dry core is tested. The CPMG (Carr–Purcell–Meiboom–Gill) echo sequence measures the core’s transverse relaxation time (T2) attenuation curve at an echo interval of 130 μs. The transverse relaxation time (T2) spectrum is obtained via mathematical inversion. The NMR test setup data and MPI test setup data are shown in Table 3.
Table 3.
CPMG test parameters.
The online NMR experiment protocol is as follows: raise the experimental temperature to 65 °C, vacuum the core, pressurize the core to saturate it with formation oil, and apply aging treatment. Put the oil-saturated core in the holder, activate the displacement process, and displace the crude oil until it exits the outlet section. Stop the pump and allow the internal pressure of the core to balance. Test the T2 spectrum curve and nuclear magnetic resonance imaging scan while the oil is saturated. Calculate saturated oil volume and porosity using the gravimetric and nuclear magnetic methods. Under the mixed-phase pressure of 24 MPa, the high-pressure pump injects CO2 into the rock sample, keeping the experimental temperature and pressure unchanged under different injection volumes (0.05, 0.1, 0.15, 0.21, 0.35, 0.4, 0.45, 0.51, 0.56, 0.6, 0.62, 0.65, 0.71, 0.75, 0.81, 0.85, 1 PV; PV is the volume multiplier of the cavity gap) for nuclear magnetic resonance testing.
3. Experimental Results and Discussion
3.1. Characteristics of CO2 Flooding with Different Miscibility Levels at Slim Tube Scale
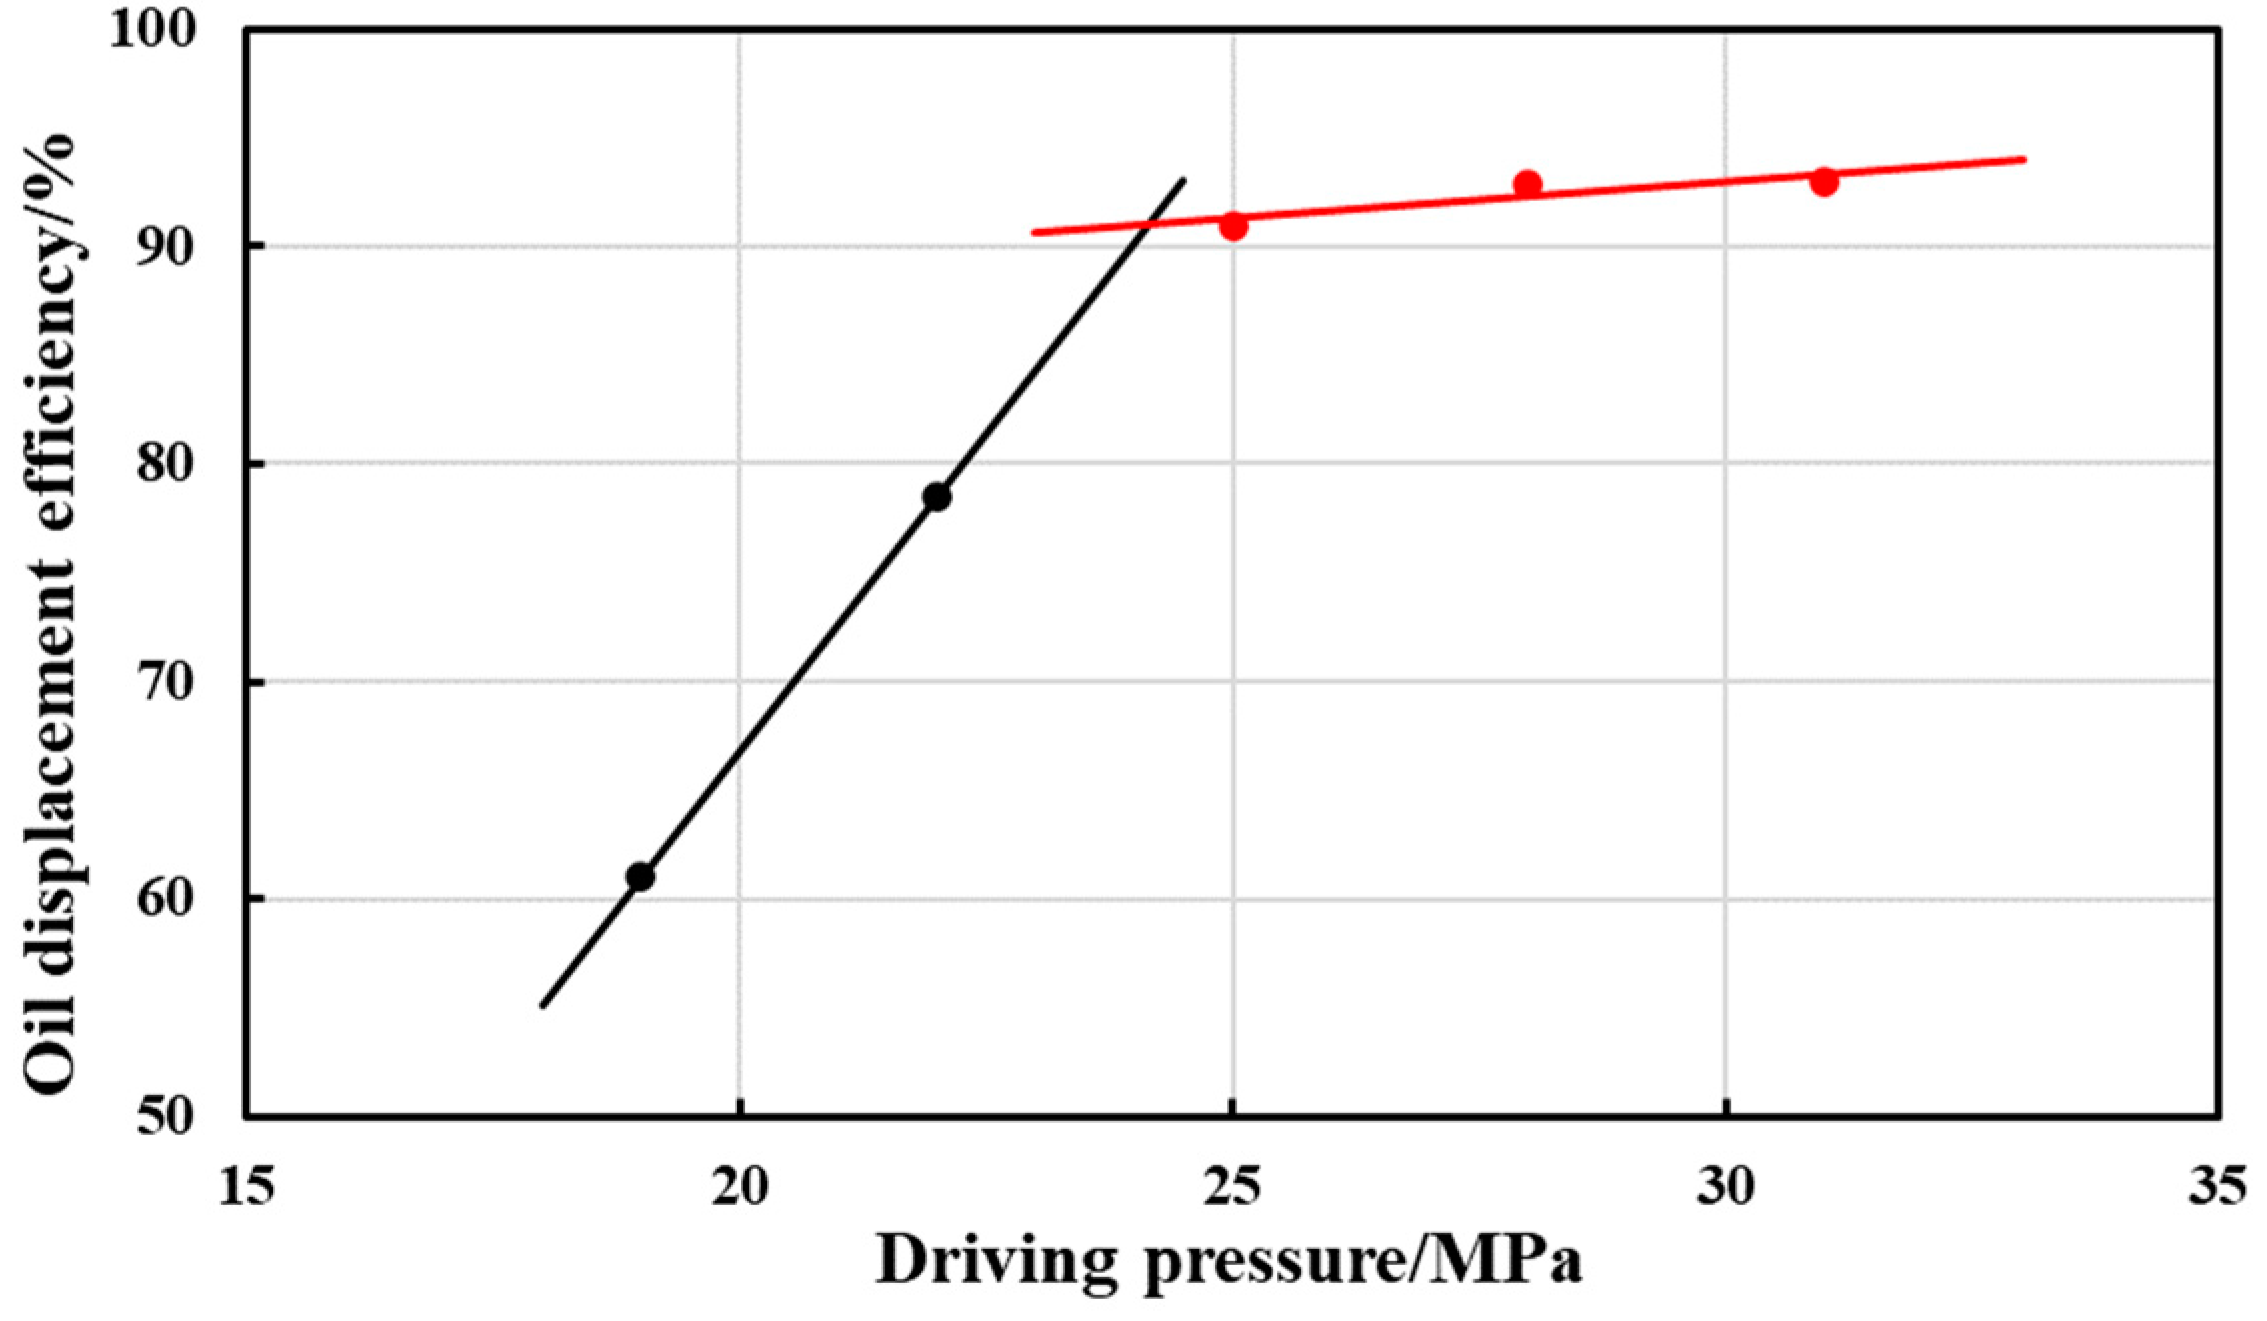
The ORF (Oil Recovery Factor, SY/T 6573-2016) standard applies the linear intersection method to establish the least miscible pressure, as shown in Figure 4. The graphic shows that this block’s minimum miscible pressure is 24 MPa. The recovery effect is strongly related to system pressure. Overall, the recovery rate improves as pressure increases. After approaching the miscible pressure, the recovery rate increases significantly. At the same time, the magnitude of change is greatly reduced. More importantly, the image shows that at the former pressure point of 21 MPa, which is close to the miscible pressure, the overall recovery rate can reach a high level. The recovery rate is only 15% different from the latter pressure point of 24 MPa, where complete miscibility can be achieved, proving that near-miscible flooding can be achieved in a small pressure range before the miscible pressure, and near-miscible flooding can also achieve a higher level of recovery. This discovery is consistent with the findings of Hao Chen, Narendra Kumar, et al. [11,43].
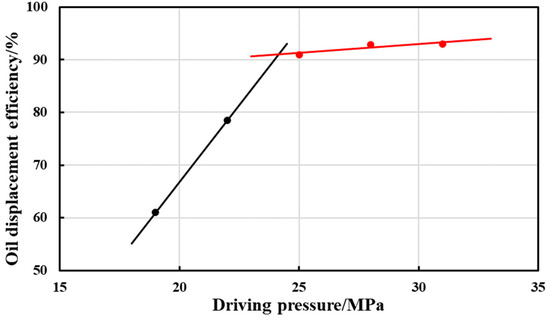
Figure 4.
Variation curve of the recovery factor with displacement pressure.
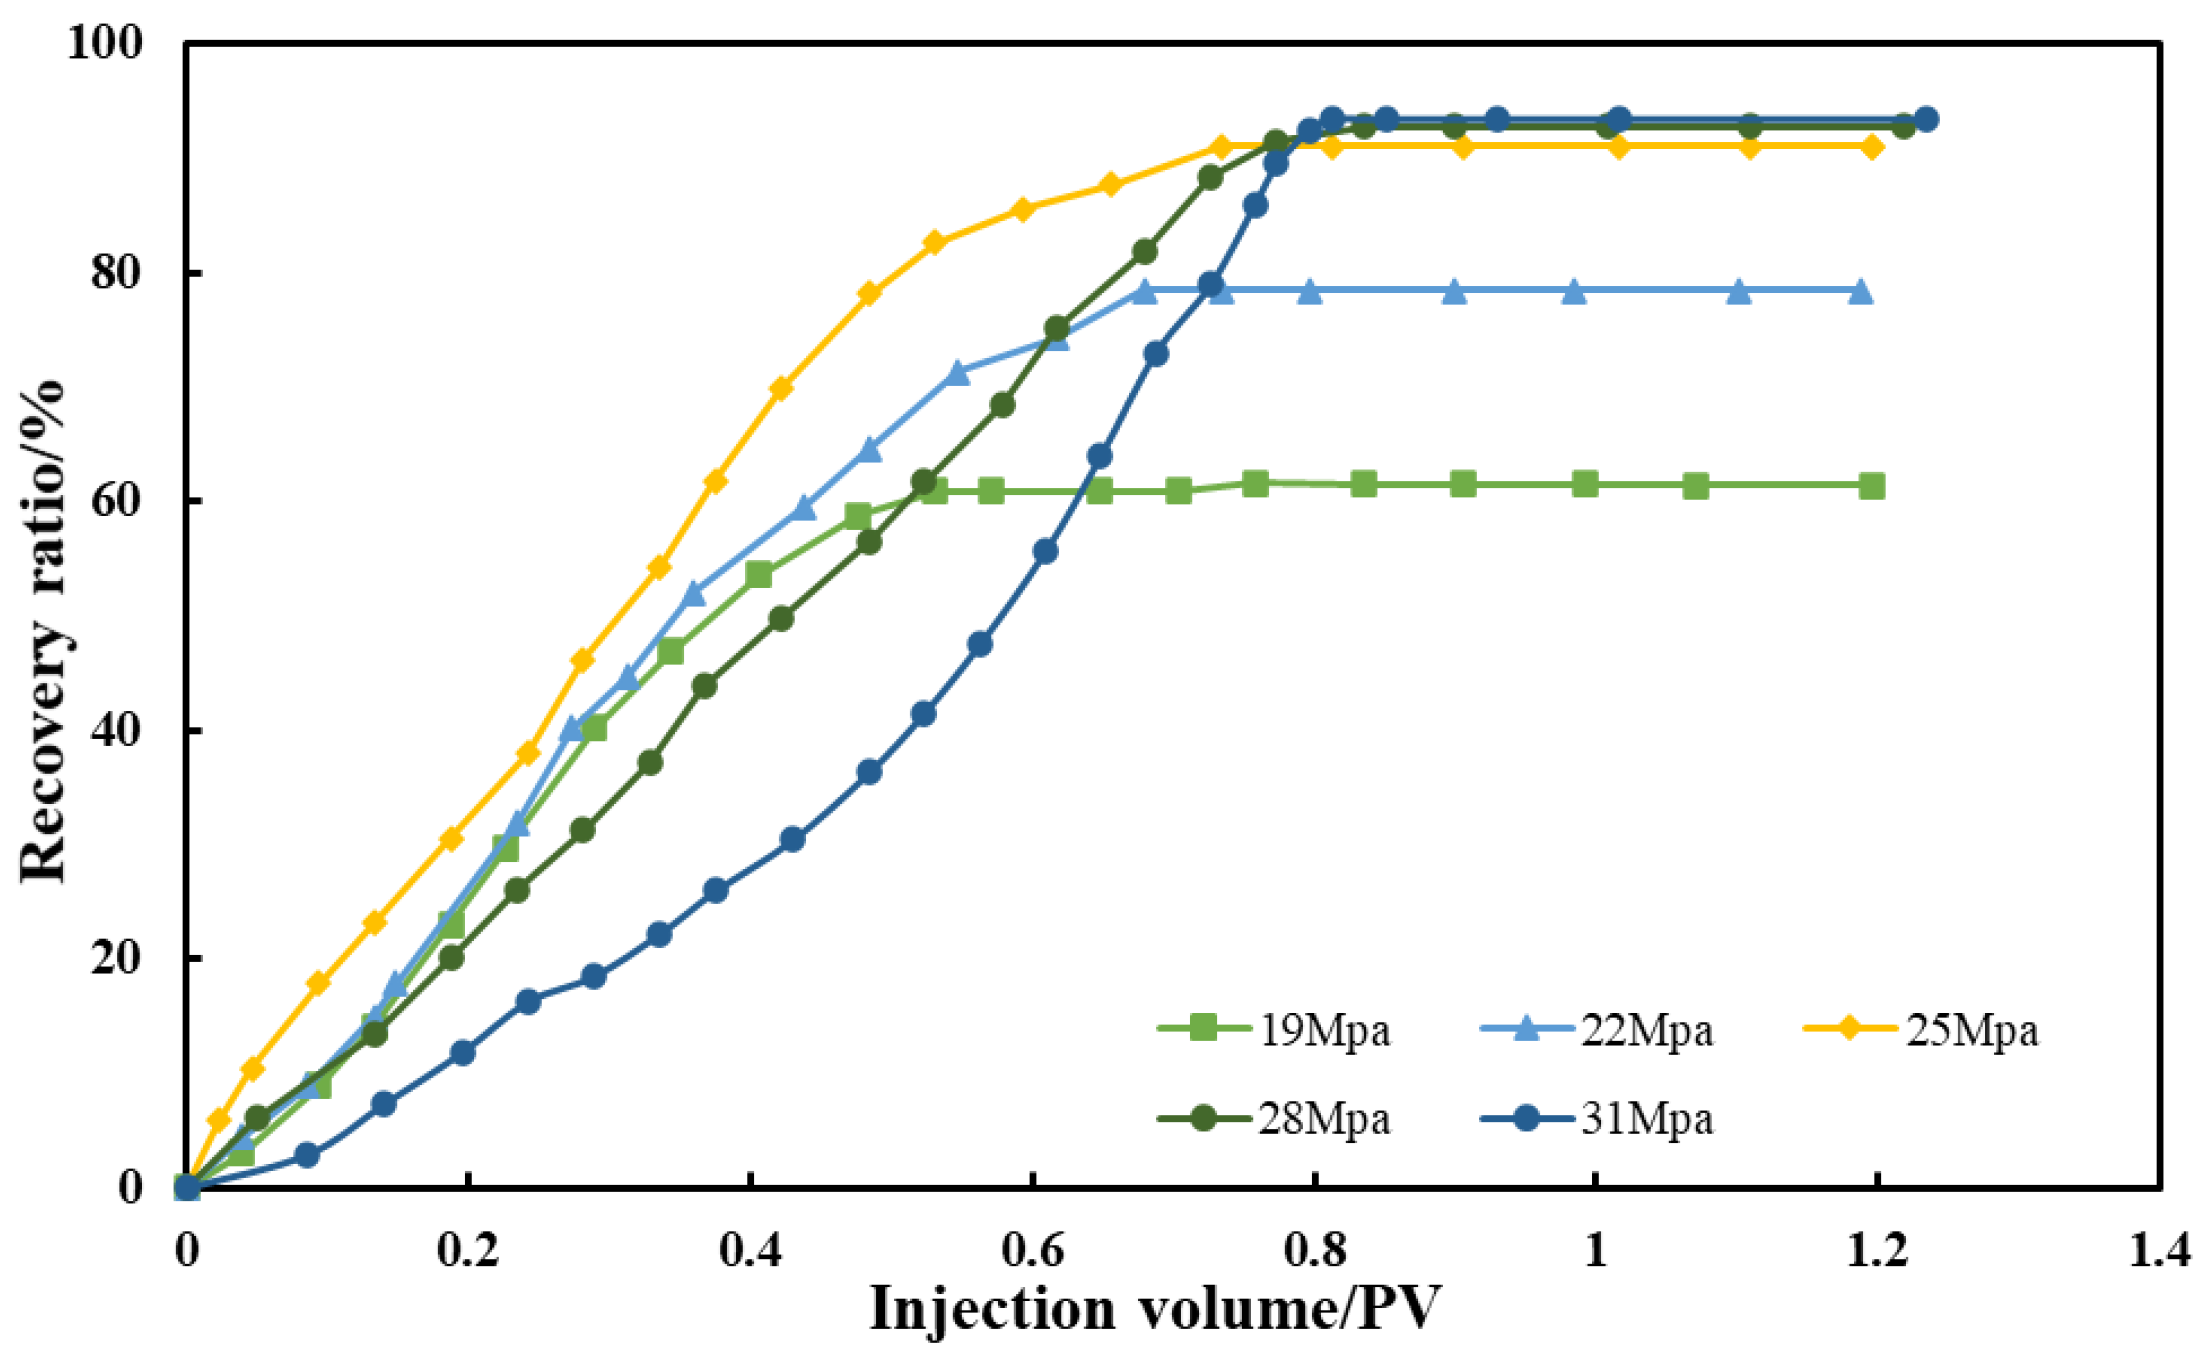
Figure 5 depicts how the recovery factor varies with injection volume under various CO2 back pressure circumstances in the long slim tube. The image shows that before the CO2 breakthrough, the recovery factor increases approximately linearly with the increase in the injection volume multiple, and the majority of the oil is produced at this stage; after the CO2 breakthrough, oil production drops rapidly, and the recovery factor gradually stabilizes. At the same time, the breakthrough time is strongly connected to the pressure. Figure 6 shows the specific impact of pressure on breakthrough timing. The figure shows that before reaching the miscible phase, the breakthrough speed increases with pressure. After reaching the miscible phase, the breakthrough speed decreases dramatically, but then accelerates as the pressure increases. This demonstrates that during the immiscible displacement stage, it is difficult for CO2 to dissolve sufficiently into the crude oil and exercise its expansion and extraction properties. The great injectability and fluidity of its gaseous state allow for the quick creation of gas-channeling channels, resulting in a faster gas breakthrough speed.

Figure 5.
The relationship between recovery factor and CO2 injection volume multiples.
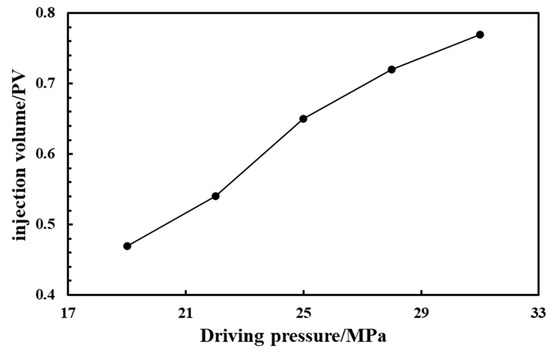
Figure 6.
Relationship between injection pressure and breakthrough time.
When miscible displacement or near-miscible displacement is achieved, CO2 becomes more soluble in crude oil, and it migrates in the form of liquid in long slim tubes, allowing the breakthrough time to be greatly delayed and the recovery characteristics of CO2 to be exerted, significantly improving the recovery factor. This is also an important reason why CO2 miscible flooding can achieve higher recovery factors.
3.2. Characteristics of CO2 Flooding with Different Miscibility Levels at Core Scale
3.2.1. Characteristics of CO2 Immiscible Flooding
Because it is difficult for CO2 and crude oil to form a miscible phase at 18 MPa on the slim tube scale, the experimental group with a back pressure of 18 MPa was considered an immiscible CO2 oil displacement. The experimental results are depicted in Figure 7 and Figure 8. The oil displacement efficiency curve in Figure 7 exhibits typical immiscible displacement features, implying that it is difficult to achieve miscibility at 18 MPa at the core scale, which is consistent with the slim tube experimental results, but with lower oil displacement efficiency. This is because of the filling. Long, thin sand tubes have more uniform porosity, permeability, and composition, whereas genuine cores vary in oil and water occurrence, homogeneity, and lithology. With the results, we believe that when the research scale advances, the minimum miscible pressure of CO2 will rise to a certain point.

Figure 7.
Relationship between injection volume and pressure fluctuation amplitude under immiscible condition.
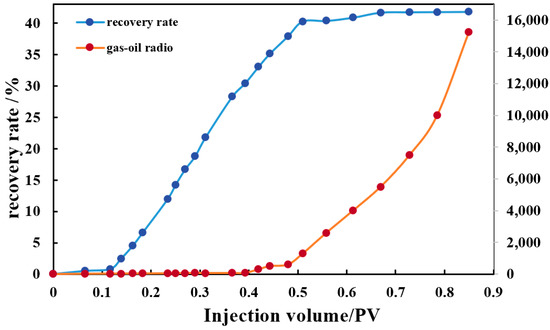
Figure 8.
Relationship between injection volume, recovery, and gasoline ratio under immiscible conditions.
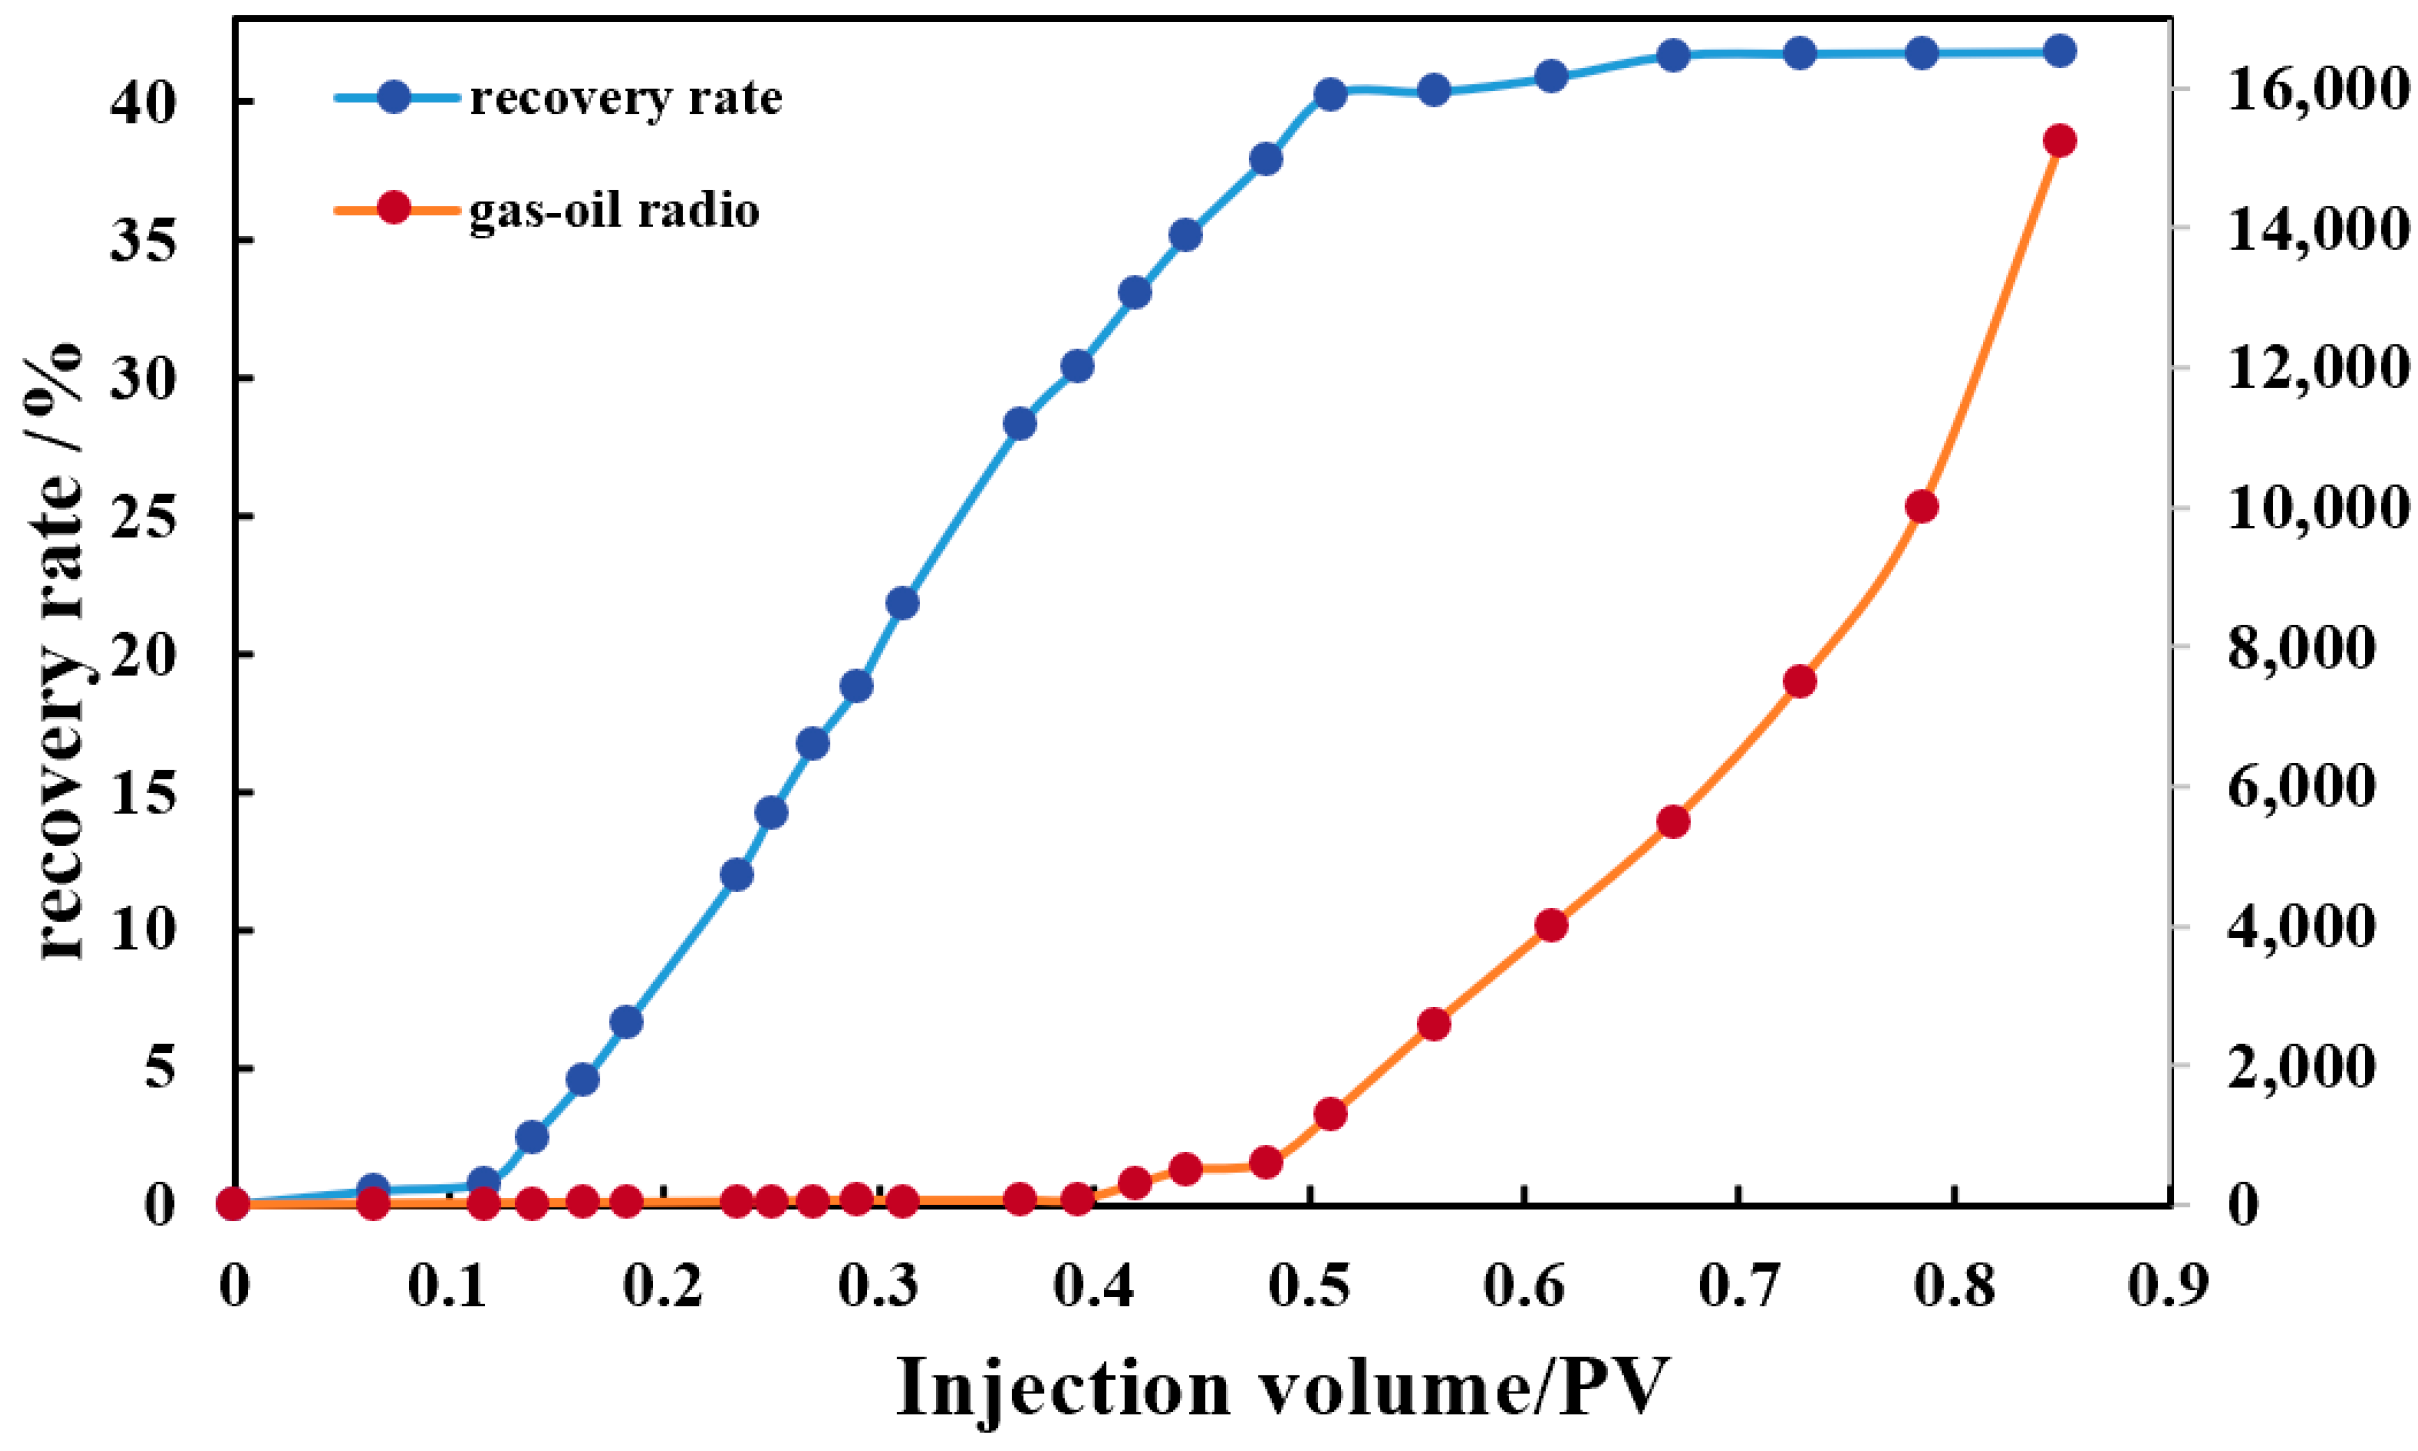
In the experiment under immiscible conditions, it was discovered that CO2 dissolved and expanded primarily in the early stages of injection (0–0.12 PV), and that pressure did not rise fast with CO2 injection. The threshold pressure gradient had not yet been reached, so the oil output was lower. However, the pressure is significantly lower than the miscible pressure, the initial dissolving quantity quickly approaches its limit, and CO2 then advances in the core in an almost piston-like manner, intensifying the pressure fluctuation and rapidly increasing the system pressure. Oil production accelerates as a result of the high-pressure difference at the production end. With continuous CO2 injection (0.36 PV–0.48 PV), the pressure fluctuation amplitude decreases, the pressure stabilizes, and the oil production rate achieves a peak and remains stable. However, this stage will only last a short time. With an additional injection of CO2, gas begins to develop at the production end, the gas–oil ratio of the outlet liquid rises, and the pressure gradient shifts from stable to gradually dropping, demonstrating that the CO2 front has progressed at this time. Gas-channeling channels gradually emerge at the core’s end, and oil output begins to decline. When the injection volume exceeds 0.66 PV, the gas-channeling channel is completely created, the gas–oil ratio at the production end rises rapidly, a breakthrough occurs during gas injection, and the pressure drops rapidly. At this point, only a small amount of crude oil can still be produced, and the recovery factor tends to stabilize. Finally, the CO2 extraction rate was 41.79% under non-mixed-phase conditions, with an intake rate of 40.19% before the injection flow, and the extraction end of the CO2 broke through to full extraction, with an extension rate of just 1.48%.
3.2.2. Characteristics of CO2 Near-Miscible Flooding
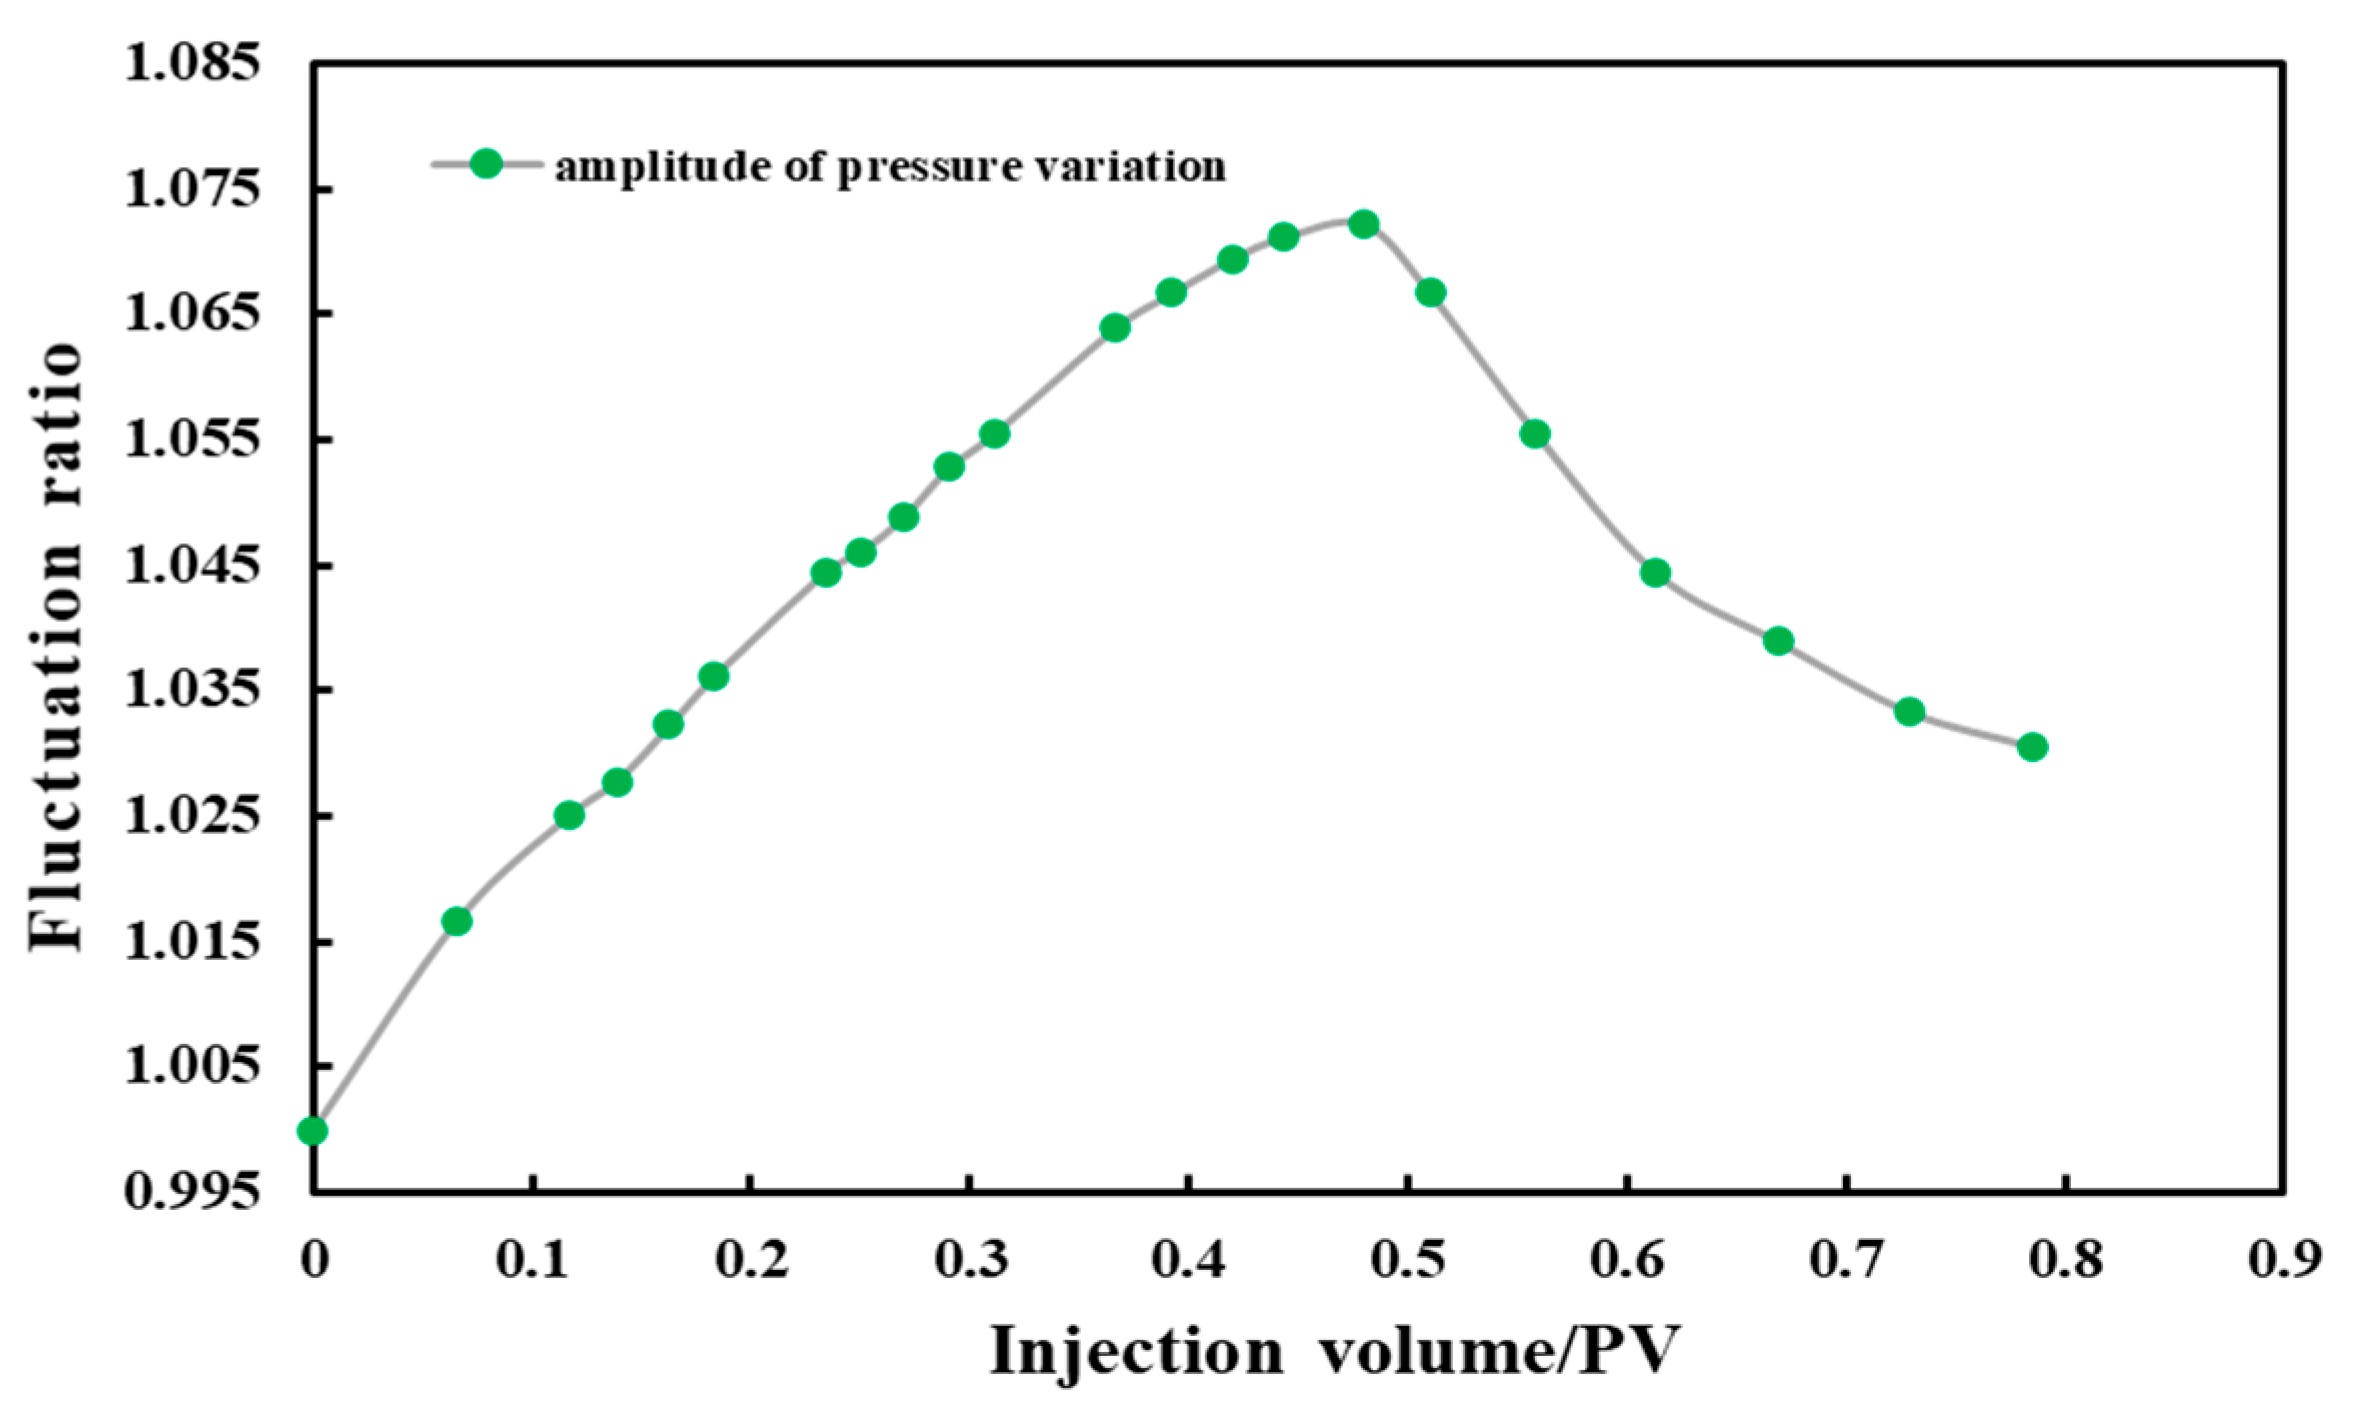
The system pressure of 21 MPa represents the near-miscible pressure range between CO2 and crude oil. The displacement characteristics under this pressure differ significantly from those in the immiscible state. Figure 9 and Figure 10 demonstrate the experimental results. Figure 9 demonstrates that the pressure characteristics at the initial stage of injection are similar to those in the immiscible state; both are dominated by dissolution and expansion, and pressure does not rise rapidly with CO2 injection. However, in the near-miscible phase state, this “slow pressure growth period” is substantially longer than in the immiscible phase state (0.21 PV–0.54 PV), meaning that the mass transfer impact between CO2 and crude oil will be greater. Its dissolving and extraction actions will be more pronounced. More crucially, the initial pressure gradient at this stage has decreased, resulting in oil appearing earlier at the production end. This demonstrates that in the near-miscible phase state, due to the viscosity reduction and expansion effects of CO2 and the oil–gas–water interface, changes in characteristics make crude oil more usable.
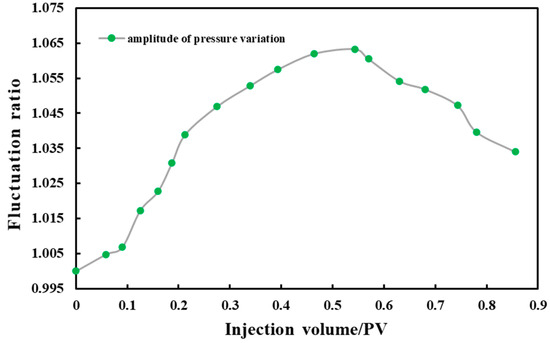
Figure 9.
Relationship between injection volume and pressure fluctuation amplitude under near-miscible condition.
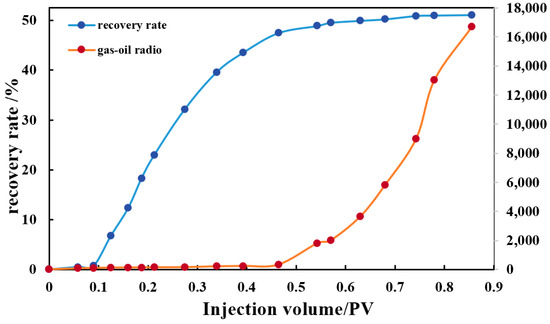
Figure 10.
Relationship between injection volume, recovery, and gas–oil ratio under near-miscible condition.
Although the pressure fluctuation gradually increases as CO2 is injected, the amplitude of the fluctuation remains significantly lower than that of the immiscible phase, demonstrating that the displacement process in the near-miscible phase state is fundamentally different from that in the immiscible phase state. The displacement mechanism in this state is no longer piston-like, but rather a near-miscible zone in a specific area that moves ahead in a blending state. This is reflected in the pressure, gas momentum, and breakthrough time, meaning that the increase in final pressure is lowered, the gas time is pushed back, and the breakthrough is effectively postponed. Furthermore, in the near-miscible condition, crude oil output in the gas stage at the outlet is significantly higher than that of immiscible flooding, reaching 2.03%, indicating that CO2 and crude oil are blending and migrating. Observation revealed that the fluidity and viscosity of the crude oil generated at this stage are clearly superior to the original state, and the color is slightly lighter. This demonstrates that the crude oil created with CO2 at this stage is a lighter component that is removed and transported, but the oil retained in the core is heavier.
When the CO2 injection volume exceeds 0.74 PV, a substantial quantity of gas is visible in the outflow portion. At this stage, the gas is completely channeled, crude oil is no longer being produced, and the breakthrough time has been effectively delayed. The overall CO2-flooding recovery rate under near-miscible phase conditions was 51.06%. Before gas injection channeling, the recovery rate was 49.16%. The CO2 production end broke through to complete gas channeling, increasing the recovery rate by 1.9% at that stage. Compared to CO2 displacement under immiscible pressure, the recovery factor following gas breakthrough and final recovery is much higher.
3.2.3. Characteristics of CO2 Miscible Flooding
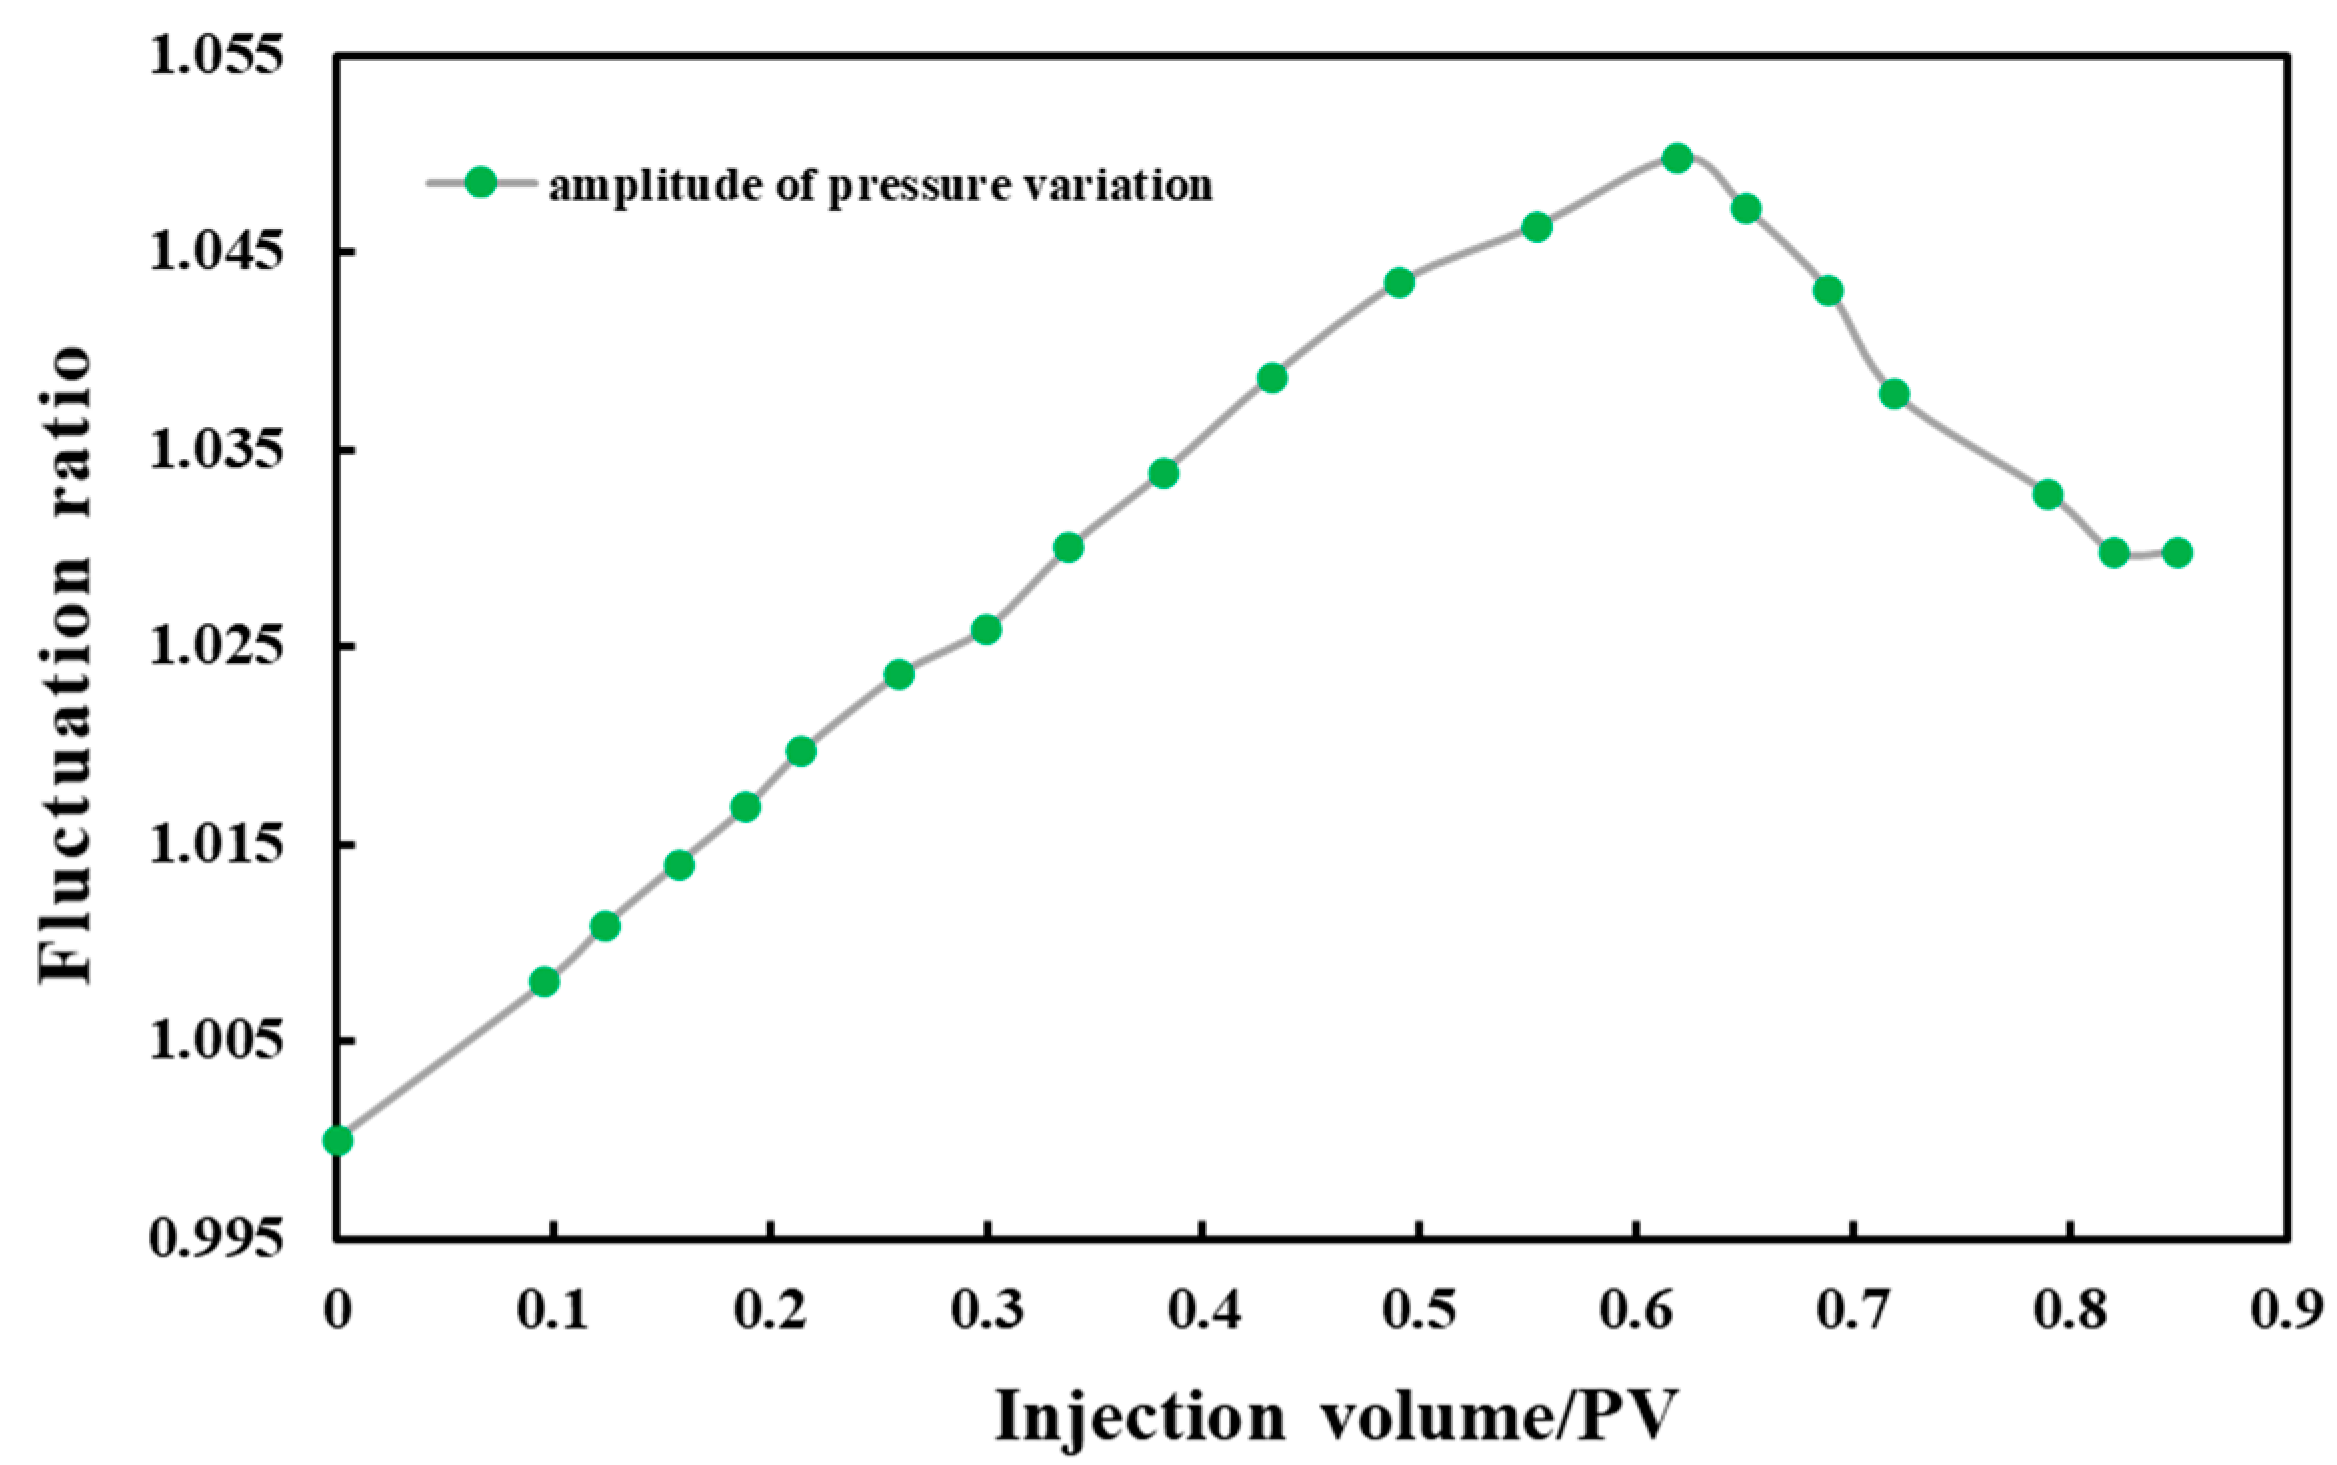
Figure 11 shows that in the miscible condition, the overall pressure fluctuation pattern is similar to that of the near-miscible phase, but more mild. The findings demonstrate that given miscible conditions, CO2 can efficiently reduce crude oil’s threshold pressure gradient and pressure rise rate. This allows CO2 to travel more equally in the core while also greatly increasing its viscosity after mixing. This efficiently reduces the mobility ratio of crude oil to CO2, considerably increasing finger gas channeling and exploiting crude oil in small pores that cannot be mobilized in the immiscible state. The situation with pore mobilization is explained in detail below.
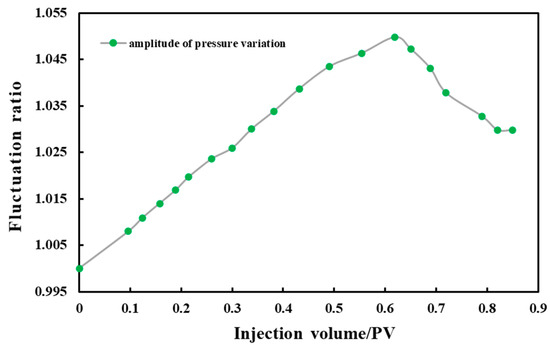
Figure 11.
Relationship between injection volume and pressure fluctuation amplitude under miscible condition.
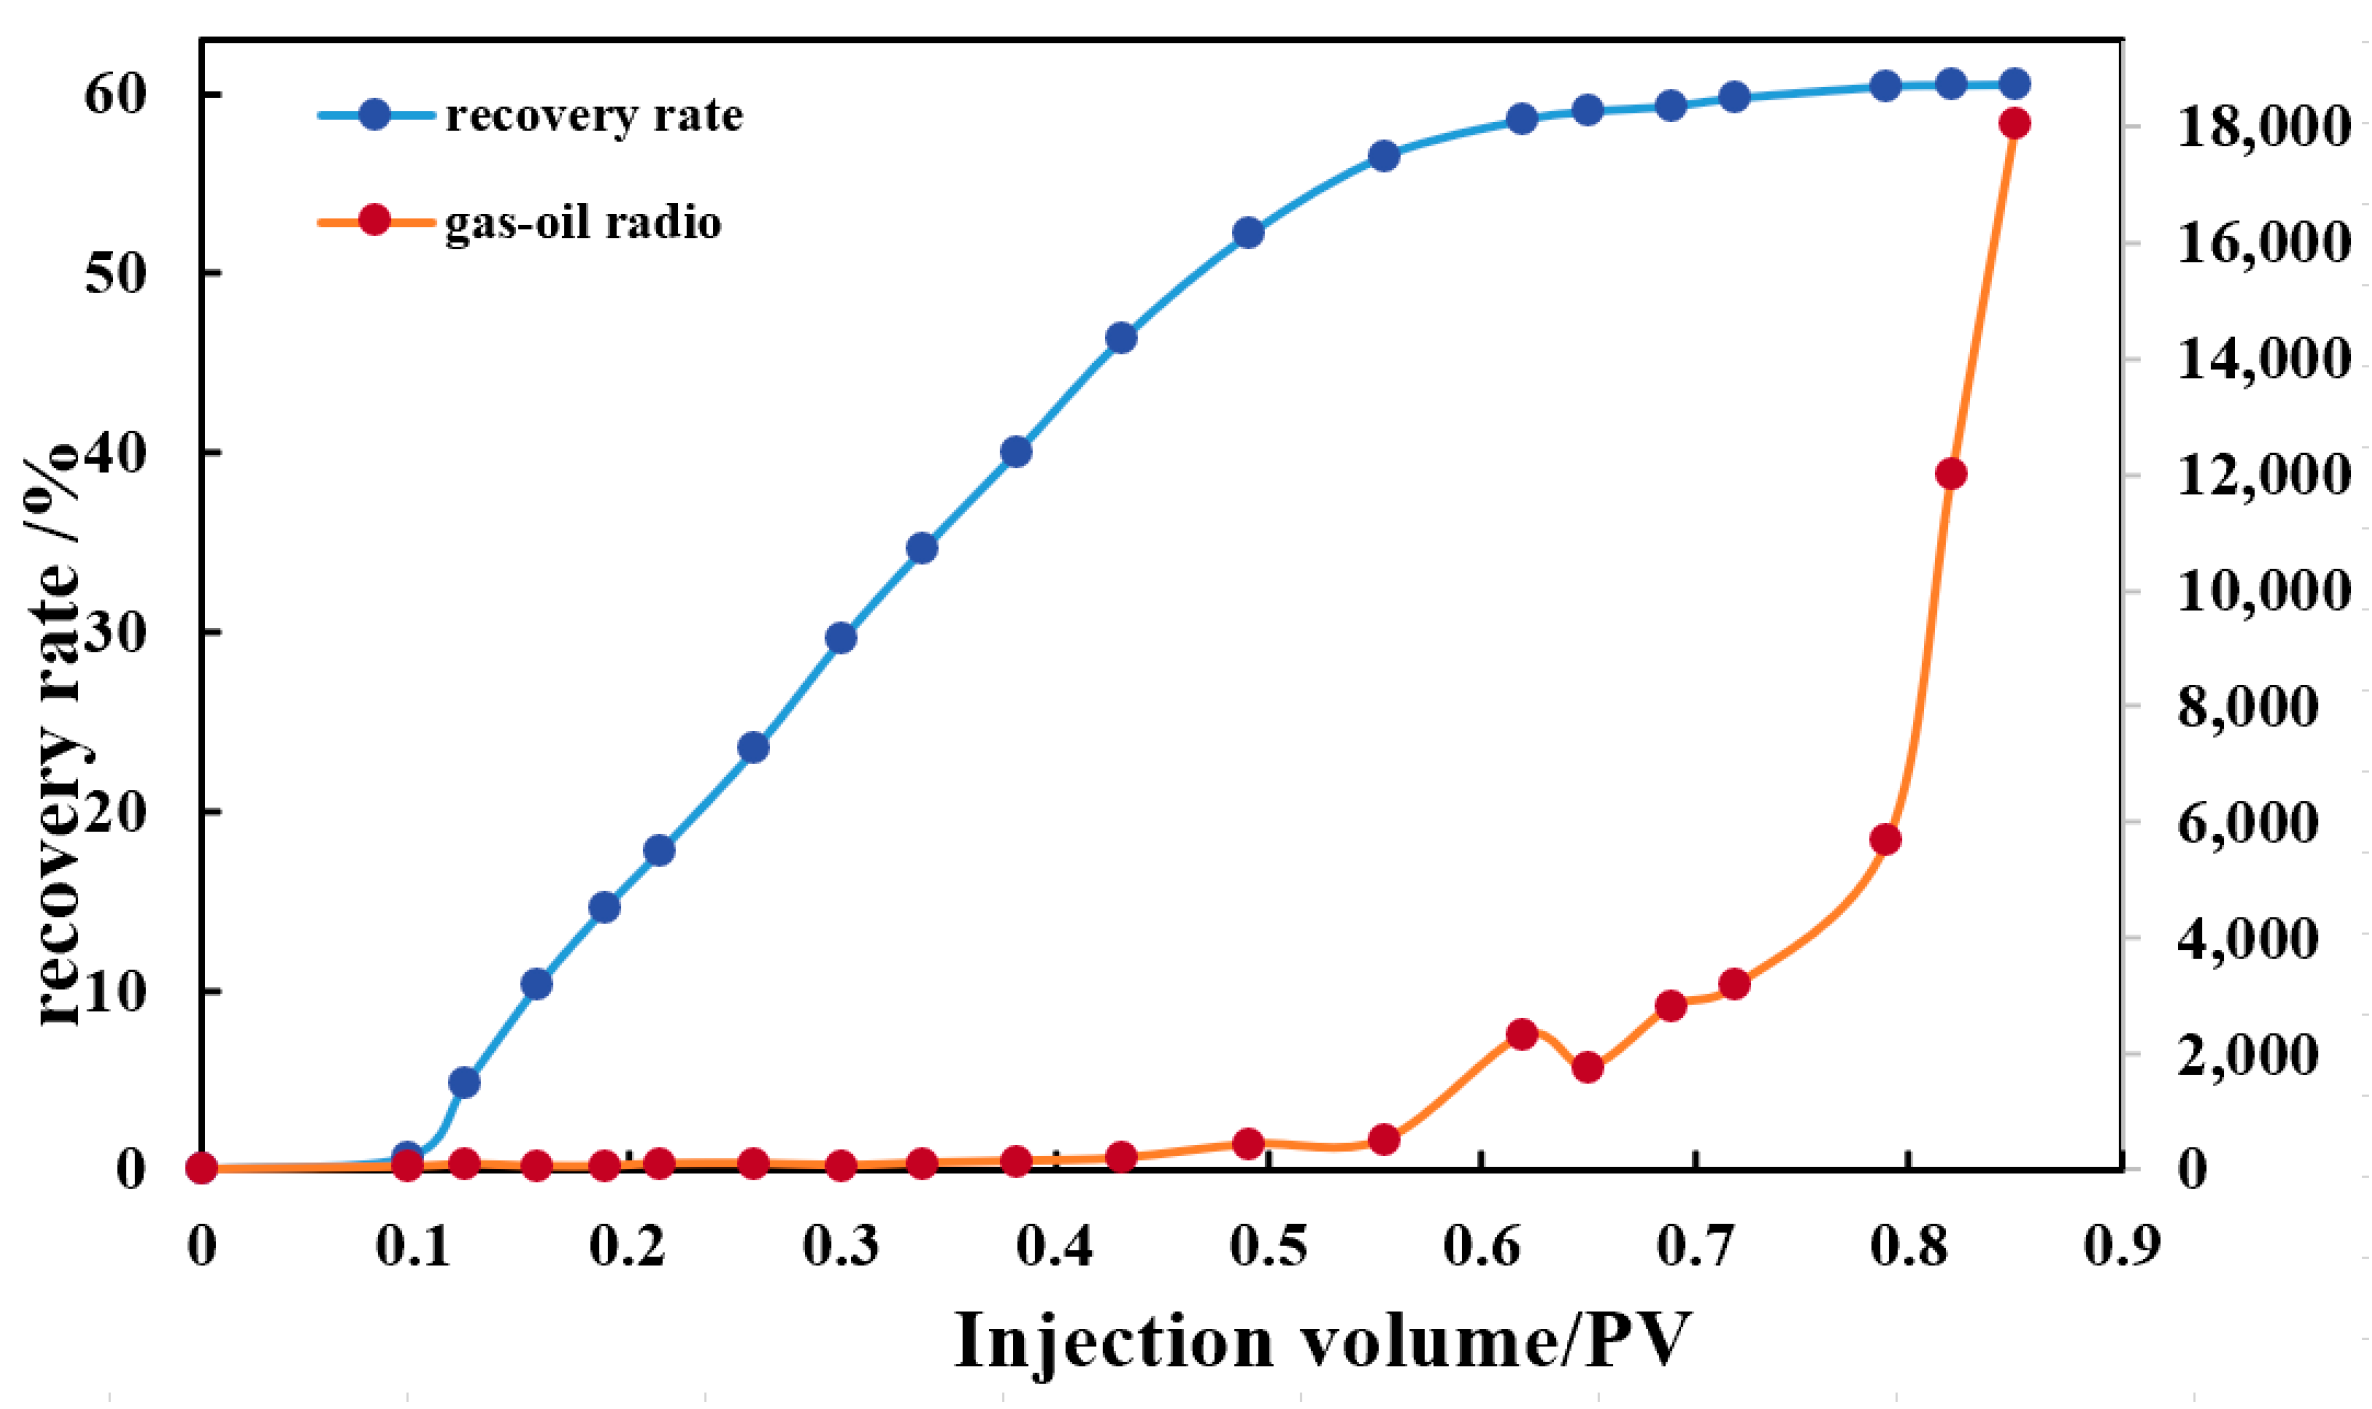
The experiment revealed that when the amount of CO2 injected exceeds 0.61 PV, the gas–oil ratio of the generated liquid rises significantly, and the gasoline ratio remains stable between 0.61 PV and 0.69 PV. This means that the gas–oil ratio will fluctuate throughout the “platform period” between gas occurrence and complete gas channeling. During this stage, CO2 will be produced alongside the miscible and extracted crude oil. On the one hand, this is owing to the co-production of oil and CO2, but oil will also partially fill small pores and channels. Because there are evident alterations in the qualities of the generated oil, we will examine the changes in the produced oil’s components thoroughly below. When the volume of CO2 injected exceeds 0.79 PV, apparent gas channeling develops, followed by total breakthrough. Figure 12 shows that the oil displacement efficiency remains stable. In the end, the recovery rate of CO2 flooding under miscible conditions was 60.51%. Compared with CO2 flooding under immiscible pressure, the recovery rate was significantly improved. Before the breakthrough of gas injection, the recovery rate was 58.53%; the recovery rate from gas penetration at the CO2 production end to complete gas channeling was 1.98%, which was further improved.

Figure 12.
Relationship between injection volume, recovery, and gas–oil ratio under miscible conditions.
A comprehensive comparison of the results of lengthy core displacement tests with varying injection pressures (degrees of miscibility) reveals that the basic rules are consistent with those of slim tube studies. Before the gas breakthrough, the cumulative injection volume and recovery degree curves are essentially linear. The recovery rate accelerates fast before the injection volume reaches 0.5 PV. The CO2 implemented at this initial step primarily dissolves and increases the system pressure to supply energy, forcing crude oil to expand. Furthermore, CO2 dissolved in crude oil can significantly reduce its viscosity, increasing its flow properties. As miscibility grows, crude oil’s threshold pressure gradient is dramatically lowered. After gas breakthrough, the oil recovery volume is reduced, but the degree of miscibility can significantly boost the oil recovery effect. At the same time, as the degree of miscibility increases, the time for CO2 to reach gas and fully escape is effectively postponed. This slows the formation of finger gas channeling, increases sweep efficiency, and eventually yields a high recovery ratio.
3.3. Analysis of Composition and Oil–Water Interfacial Tension Changes
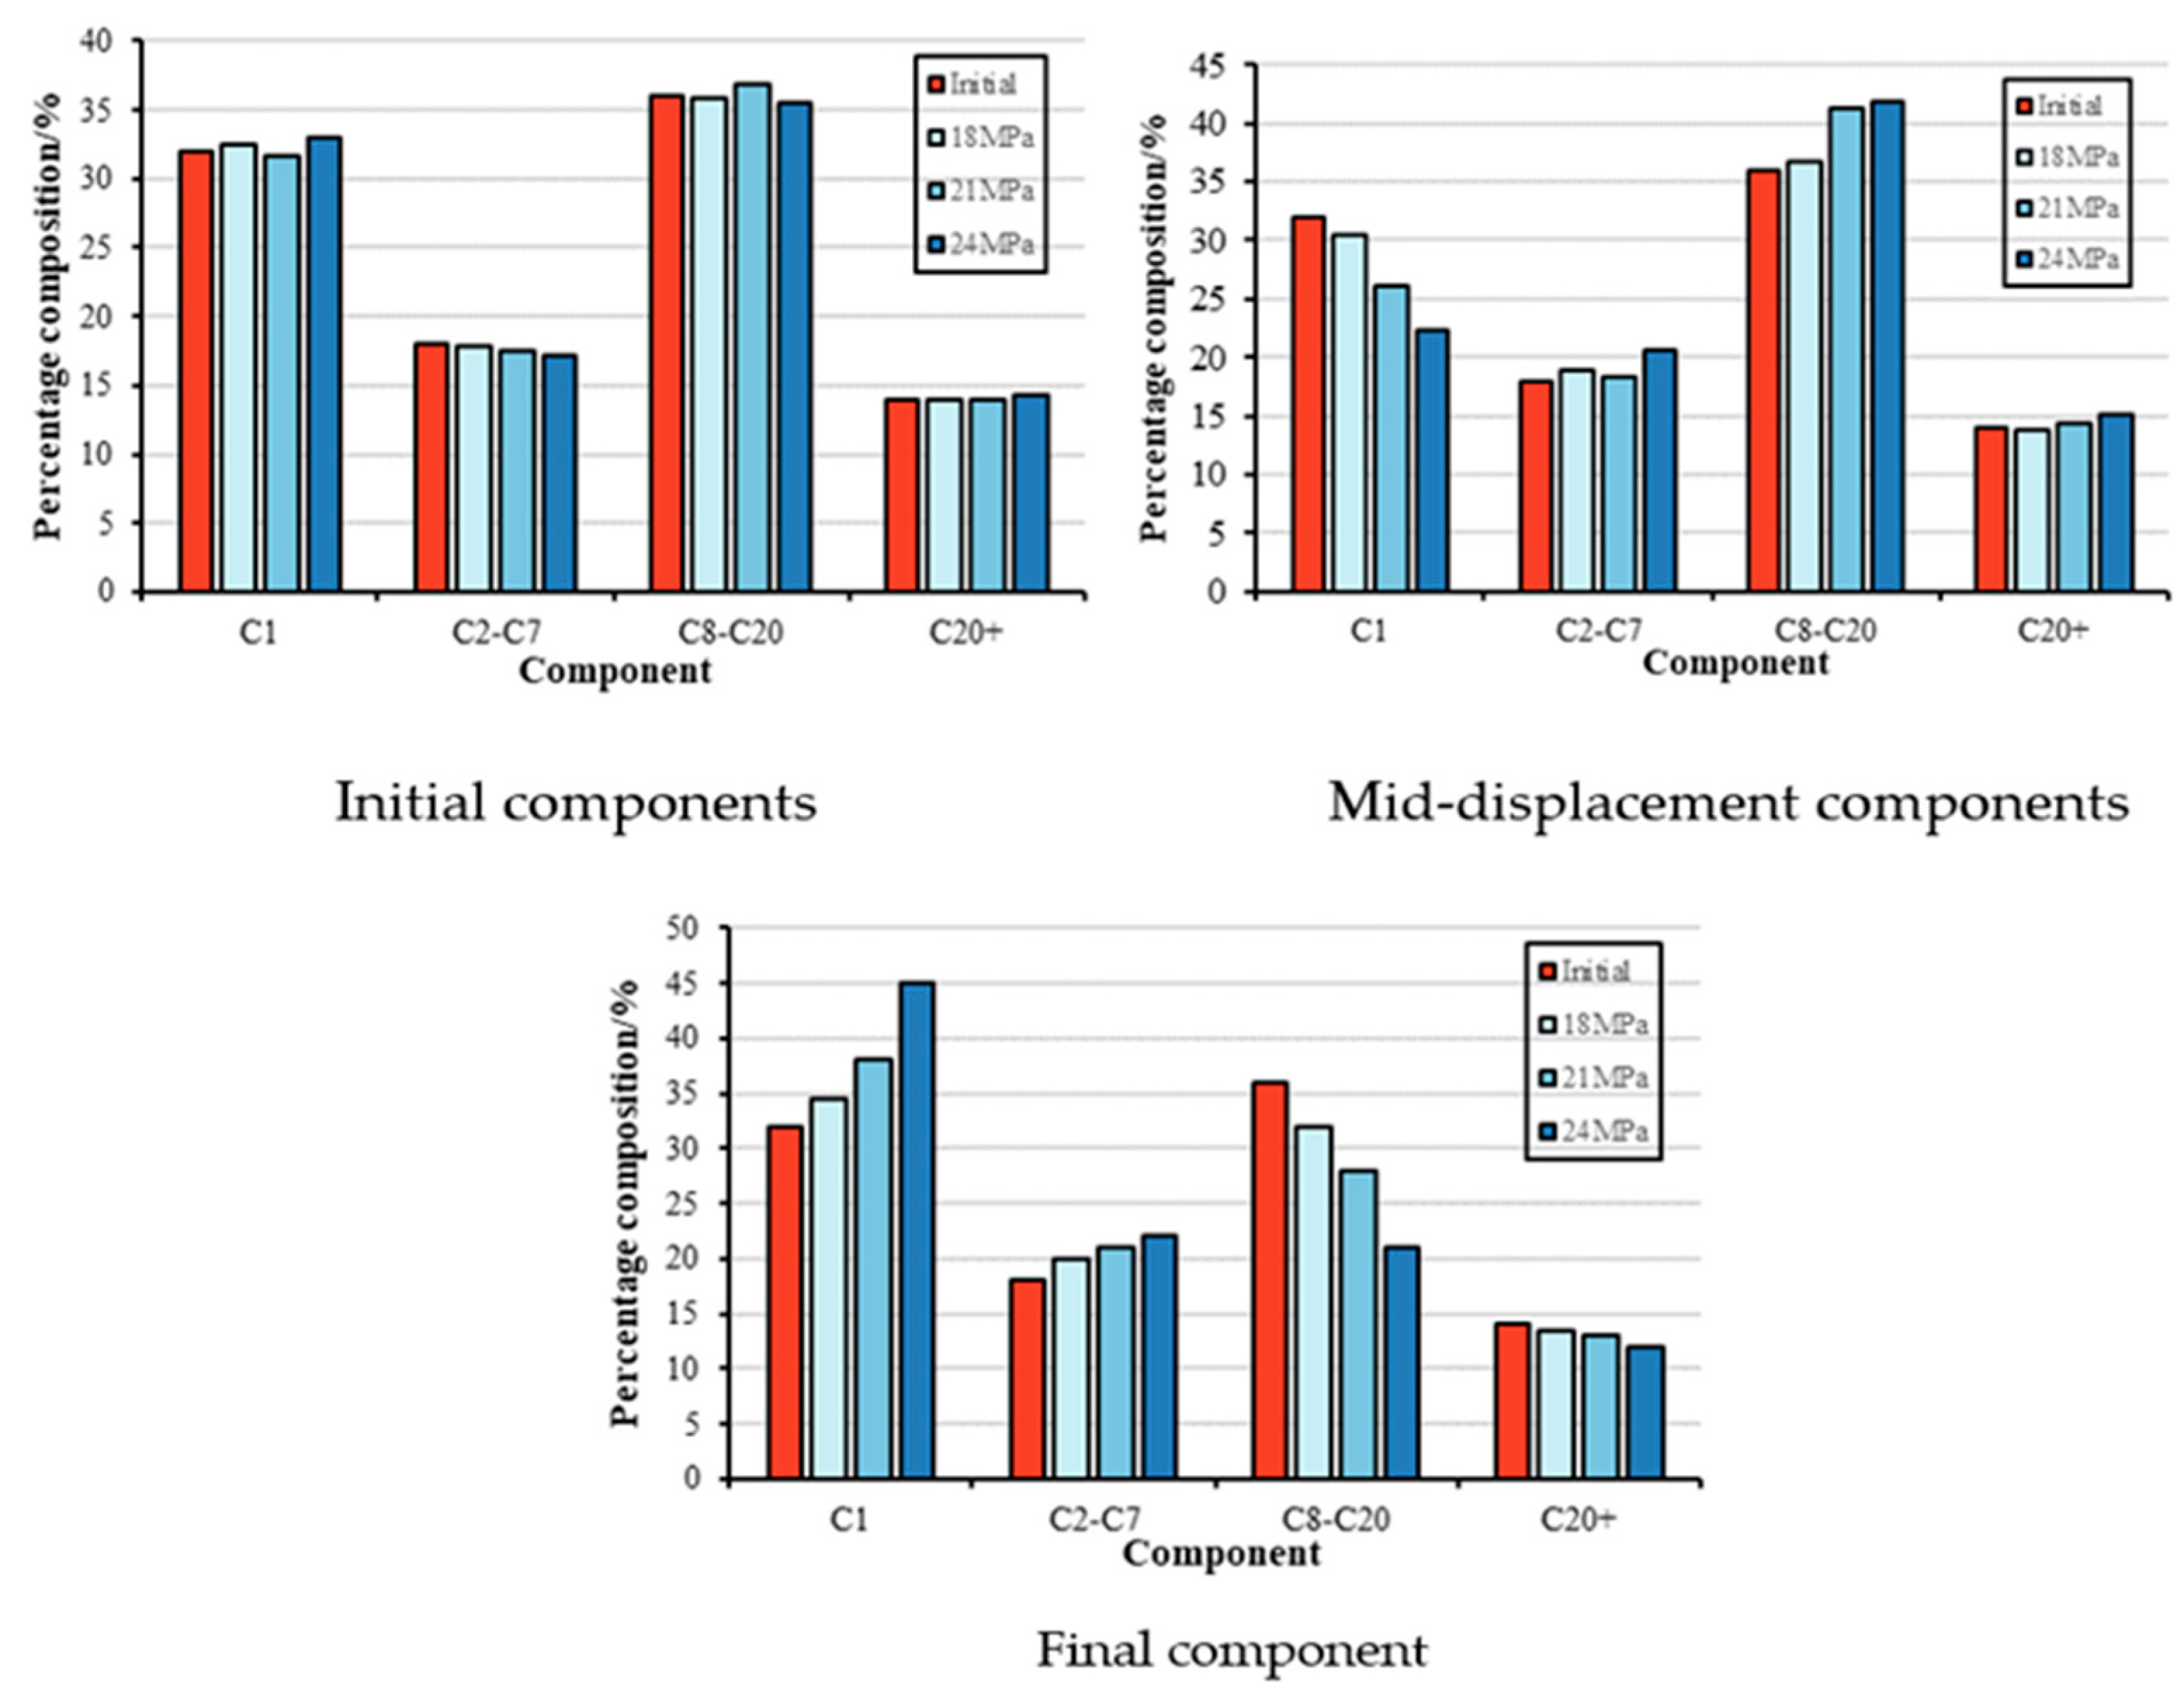
A chromatograph was used to measure the components of oil generated at various levels of miscibility and CO2-flooding stages. Figure 13 shows the test results. It is worth noting that this analysis stands out in that the “oil” component consists of compounds other than CO2 added to the oil sample component at the output end and the gas sample component. Previous research by experts solely focused on the components of oil samples at the production stage, leading readers to conclude that the produced oil became heavier. When the oil sample measurement data were compared, it was discovered that the produced oil was significantly lighter than the initial crude oil put into the core. This demonstrates that during the CO2-flooding process, light oil is always preferentially used and generated, but heavy components are difficult to use and do not easily migrate to small pore throats, re-blocking and depositing, making production difficult.

Figure 13.
Composition changes during CO2-flooding process.
Comparing the production data of different CO2-flooding stages, it was found that as the gas-flooding stage progresses, the produced oil will change from heavy to light. In the early stage of CO2 flooding, the components of the produced oil are relatively close to the initial components of the crude oil. This indicates that the early-stage crude oil produced is located far from the injection end and is therefore only marginally impacted by the extraction and dissolving of CO2. The extraction and utilization of crude oil is mainly driven by pressure, without any changes in physical or chemical properties. The process of its utilization is more similar to the piston displacement of water or insoluble gas (such as N2). With the further injection of CO2, the oil in the core comes into full contact with CO2, which allows CO2 to play a dissolving and extraction role to dissolve light components in CO2, so the heavy components of the produced oil increase. The light components in the generated oil will dramatically increase during the stages of gas breakthrough and complete gas channeling. This is because the oil at this stage is primarily produced in the form of CO2, and the heavier components are difficult to employ due to their high molecular weight and low mobility. More crucially, the crude oil leaves the formation. In the experiment, this occurs once the crude oil is forced out of the back pressure valve and into the discharge pipeline, and the pressure rapidly decreases, causing the oil–gas system that was previously in a miscible phase to quickly break away from the miscible condition. After gas breakthrough, the majority of the oil will be produced in the form of a miscible phase, which is often a light oil component, resulting in much lighter oil.
When the generated oil was compared under different pressures, it was discovered that as the degree of miscibility increased, so did the phenomena observed throughout different periods. Among these, changes in the content of C1 and C8–C21 components are more visible. In the early stages of CO2 flooding, the produced oils with varying miscibility degrees are reasonably similar; however, the discrepancies are significant in the major production stage. This is primarily because in the early stages of piston-like oil displacement, CO2 cannot directly contact the oil near the production end; therefore, the components of the originally formed oil are very close together. During the main manufacturing stage, the produced oil experiences physical and chemical processes following full contact with CO2. Thus, as the degree of miscibility increases, the capacity to use oil is significantly improved. This permits heavy oil and oil in narrow pore throats that were previously impossible to extract in the immiscible condition to be recovered, increasing the proportion of heavy components while decreasing the amount of light components. However, when it comes to the absolute total amount of components, as the degree of miscibility increases, both light and heavy components increase, but the heavy component increases more than the light component. After the gas has been released, the rules change when components other than CO2 are added to it. As miscibility increases, so will the proportion of light components. This is because part of the light oil when the gas is released is primarily removed in a mixed-phase or portable form, which makes it lighter overall.
The study measured the oil–water interfacial tension of oil samples at the exit at various stages. The results in Figure 14 show that in the stage before seeing gas, interfacial tension increases with miscibility and decreases with CO2 input. Following gas breakthrough, the generated oil’s interfacial tension rapidly falls, and the higher the degree of miscibility, the greater the decline. In this experiment, the interfacial tension and oil component variations demonstrated a strong association. When the heavy components in the generated oil increase, so does the intermolecular contact force, which causes an increase in interfacial tension. The decrease in interfacial tension demonstrates that CO2 can extract the lighter part of the reservoir crude oil via extraction, which can improve the crude oil’s flow performance to some extent and increase the production effect.
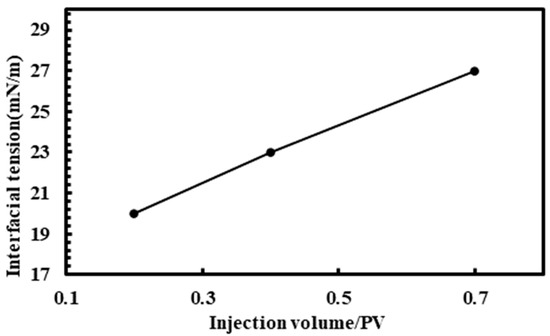
Figure 14.
Oil–water interfacial tension of displacement oil under miscible conditions.
3.4. Analysis of Pore Movement at Miscible Pressure
The MRI and T2 spectrum test results are as follows:
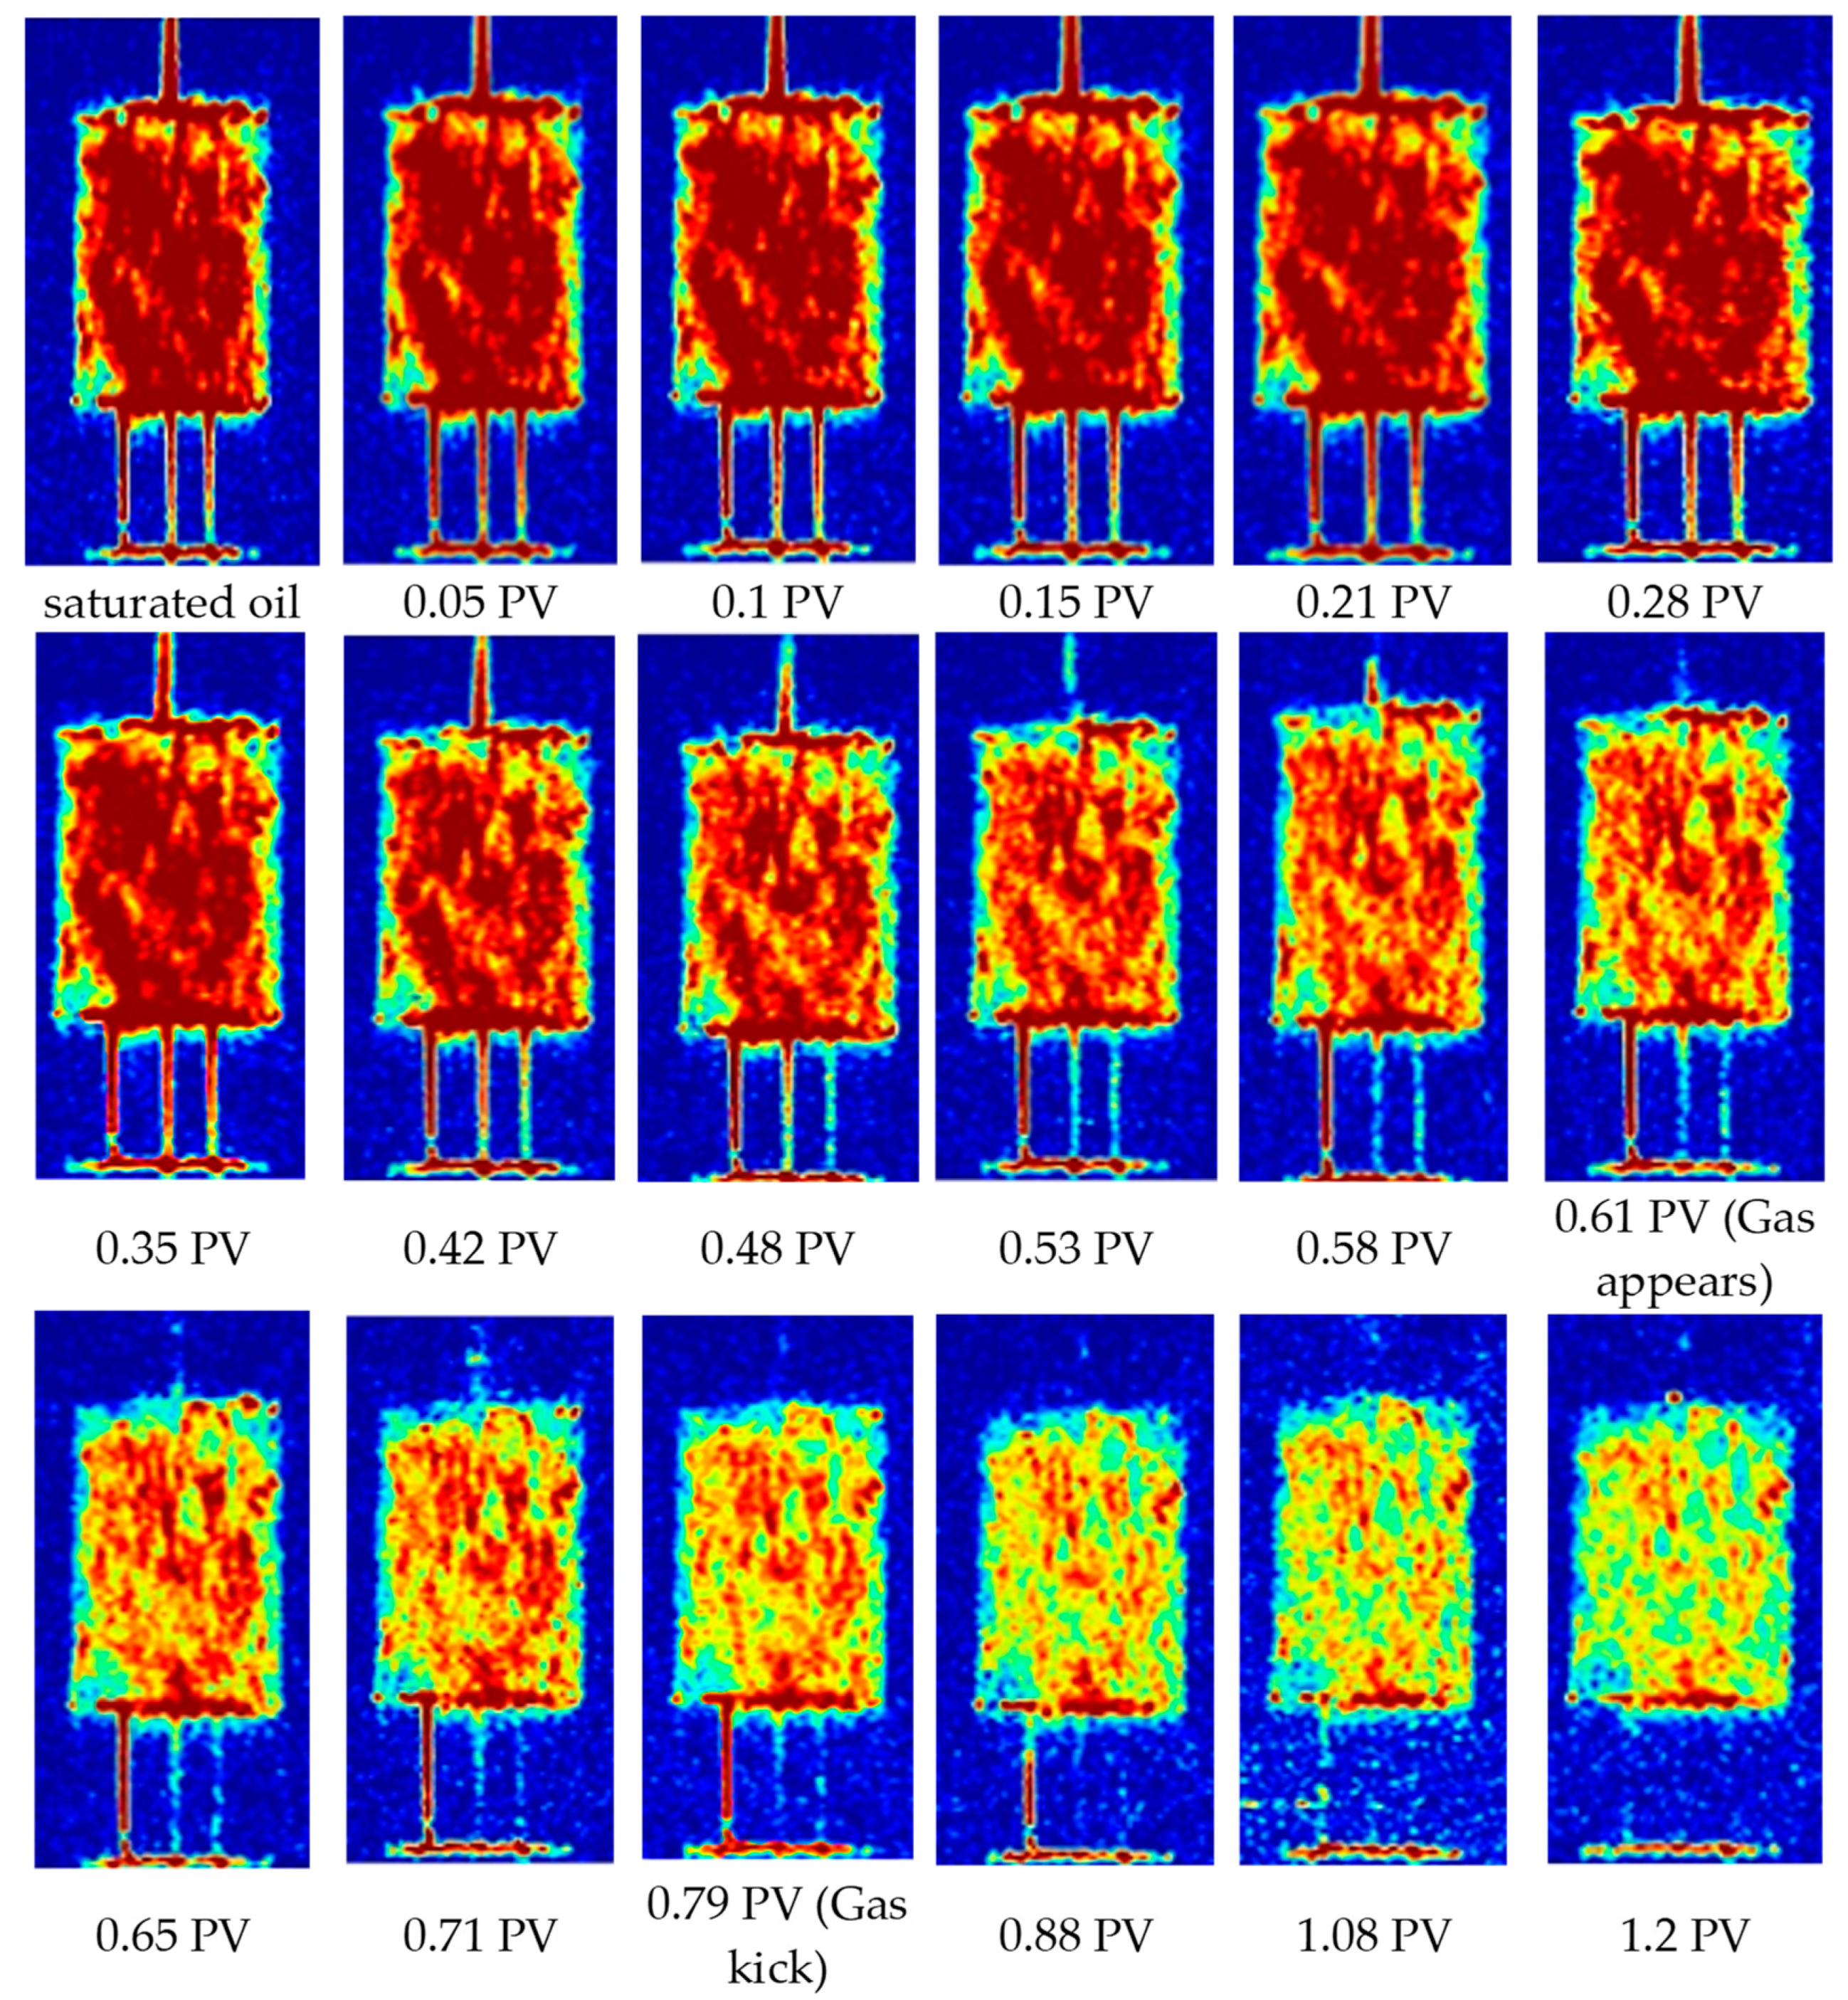
The NMR imaging results during the CO2 displacement process are shown in Figure 15. The displacement process can initially be divided into three stages. The slow oil production at the outlet end is the initial stage of displacement, the oil production at the outlet end rapidly increases when gas is encountered (the system pressure increases rapidly) in the middle stage of displacement, and the final stage of displacement is when gas occurs and then gas kick. When gas injection is initiated in the early stages of displacement, the oil-bearing area marginally expands. At this point, CO2 is primarily dissolved, and crude oil and CO2 expand following the interaction. After that, the gas drive was quite consistent, with no apparent gas drive front. Oil saturation in the core steadily dropped, and the oil in the core’s big pores was gradually depleted. This demonstrates that due to the viscosity reduction and expansion effects caused by the dissolution of CO2 and crude oil, as well as changes in the properties of the oil–gas–water interface in the miscible state, crude oil is more likely to be used, and the gas-channeling breakthrough time will be delayed.
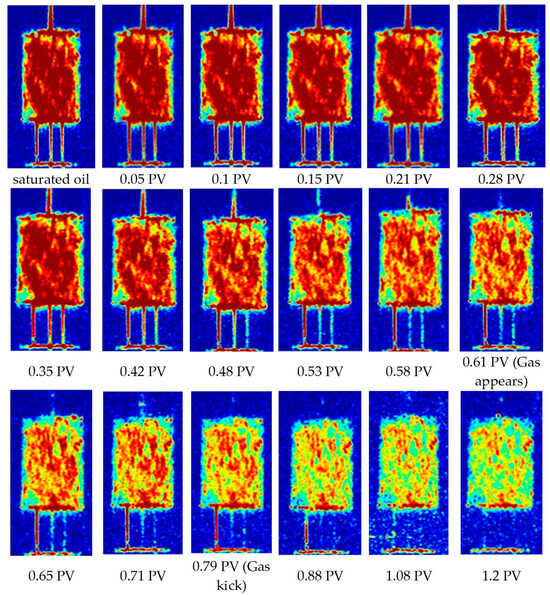
Figure 15.
Magnetic resonance imaging results during CO2 displacement.
In the middle stage of the displacement, oil production grew significantly during the 0.1 PV–0.5 PV stage, and the vast core channels were fully exploited. However, because there was no evident favorable pathway, the CO2 gas drive was rather consistent. Furthermore, because the amount of CO2 in the core increases rapidly, the crude oil is completely in contact with CO2. The growing system pressure intensifies the mass transfer between CO2 and crude oil, and the consequences of dissolution and extraction become increasingly apparent over time. At the same time, CO2 migrates from large pores to small and medium pores by spreading, matching, and dispersing, on the one hand, directly propelling the oil of the medium and small pores, and on the other hand, indirectly achieving the effect of driving the small- or medium-sized pores of the throat oil. In the later stage of displacement, obvious gas channeling occurs at 0.75 PV. Before complete gas channeling, crude oil is mainly produced through CO2 miscible carry, pressure drive, and CO2 flush carry. Since the system pressure drops significantly after gas is released, the mass transfer effect between CO2 and crude oil is significantly weakened, and the miscible carrying and pressure-driving effects are weakened. Furthermore, the production effect is further diminished, since CO2 finds it more difficult to consume crude oil in small and medium pore throats as a result of the unblocking of beneficial channels. As a result, the picture shows that even after gas is released, oil saturation can still be lowered, although at a steadily decreasing rate. There is no noticeable decrease in saturation after full gas channeling. Currently, the high-speed erosion of the injected gas occurs in the pores, which is the primary method of producing crude oil. The injected CO2 only flows along the dominant channels, so the oil carried by the flushing becomes further decreased until there is no output.
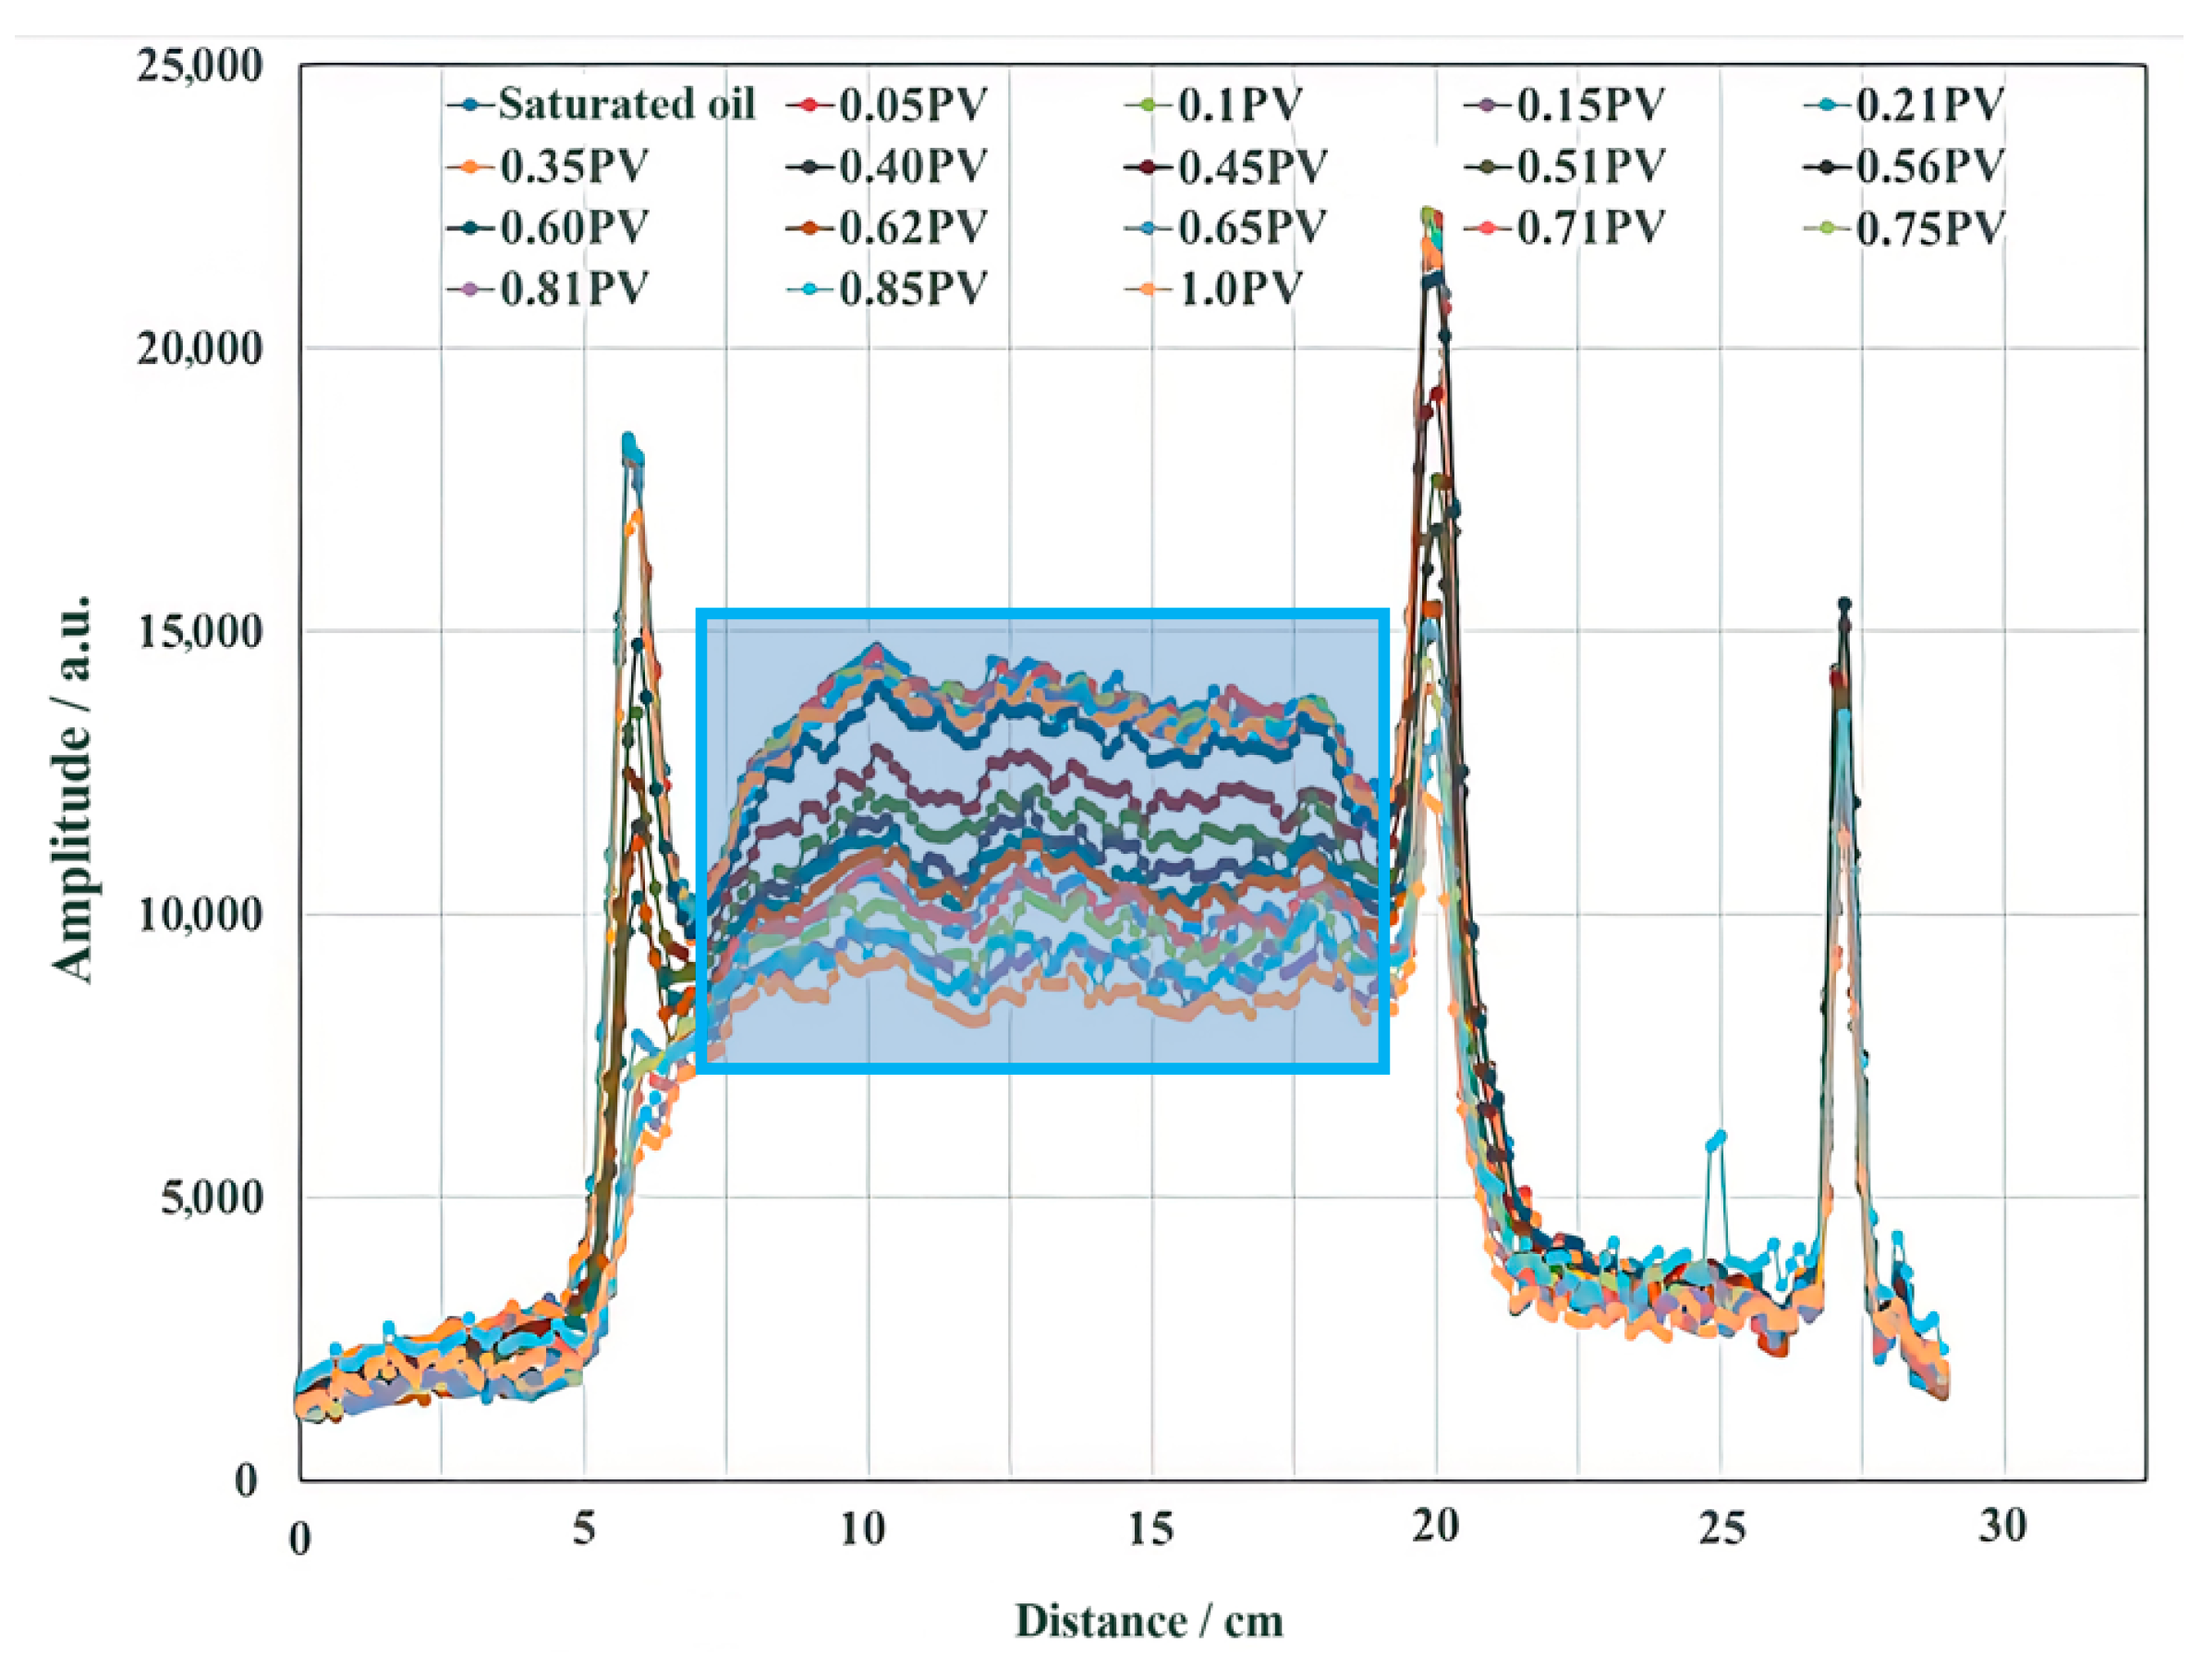
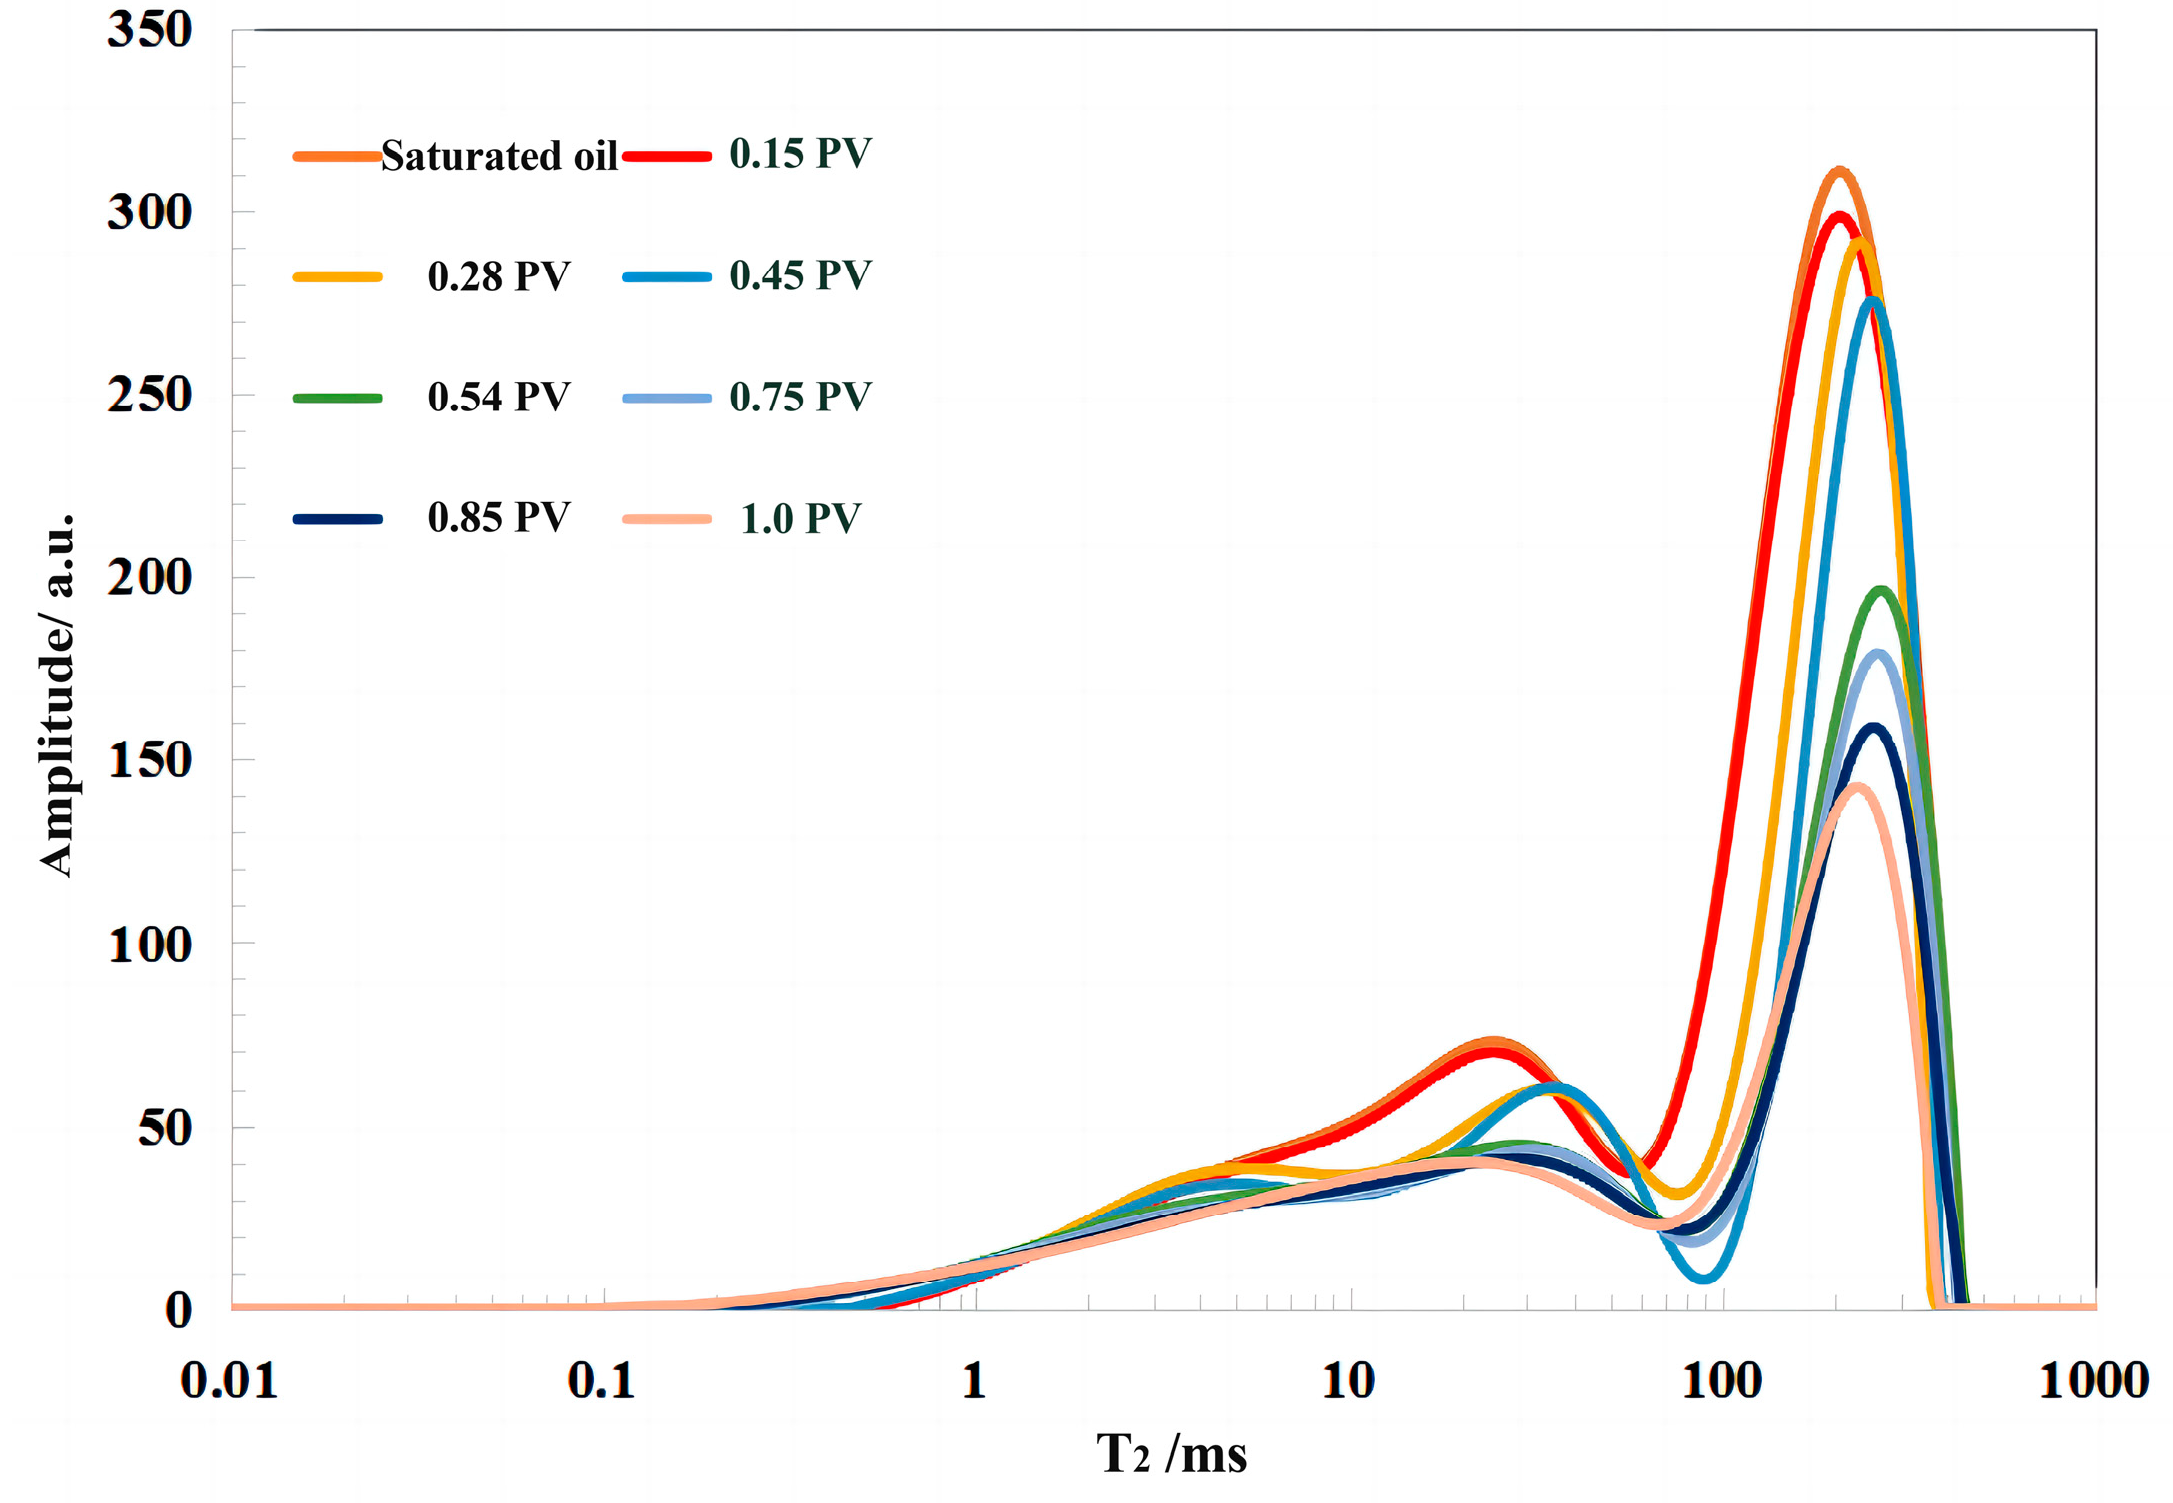
Figure 16 demonstrates the projection findings for CO2 displacement saturation along the length direction. It is also clear that the CO2 gas displacement is quite uniform, with no noticeable displacement front visible. CO2 is primarily dissolved in the early stages of displacement, and the saturation shift occurs gradually. This is consistent with earlier MRI data; the saturation was substantially lower before gas was detected, and it changed very little after gas was discovered. Figure 17 illustrates how the T2 spectrum varies during the CO2 displacement process. The T2 spectrum of saturated common water depicts the pore space signal. Because the T2 spectrum of the saturated oil state of the heavy water-saturated core depicts the dispersion of the original crude oil in the pore space, different quantities of CO2 are displaced. Figure 16 represents the distribution of crude oil at various displacement times.
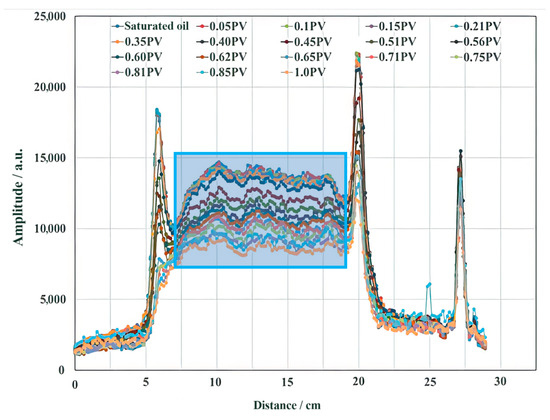
Figure 16.
CO2 displacement saturation projected along the length direction.
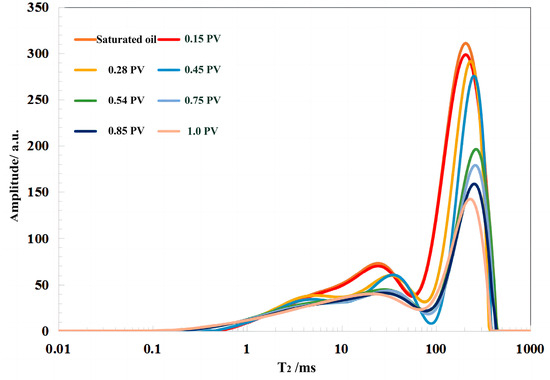
Figure 17.
Changes in T2 during CO2 flooding.
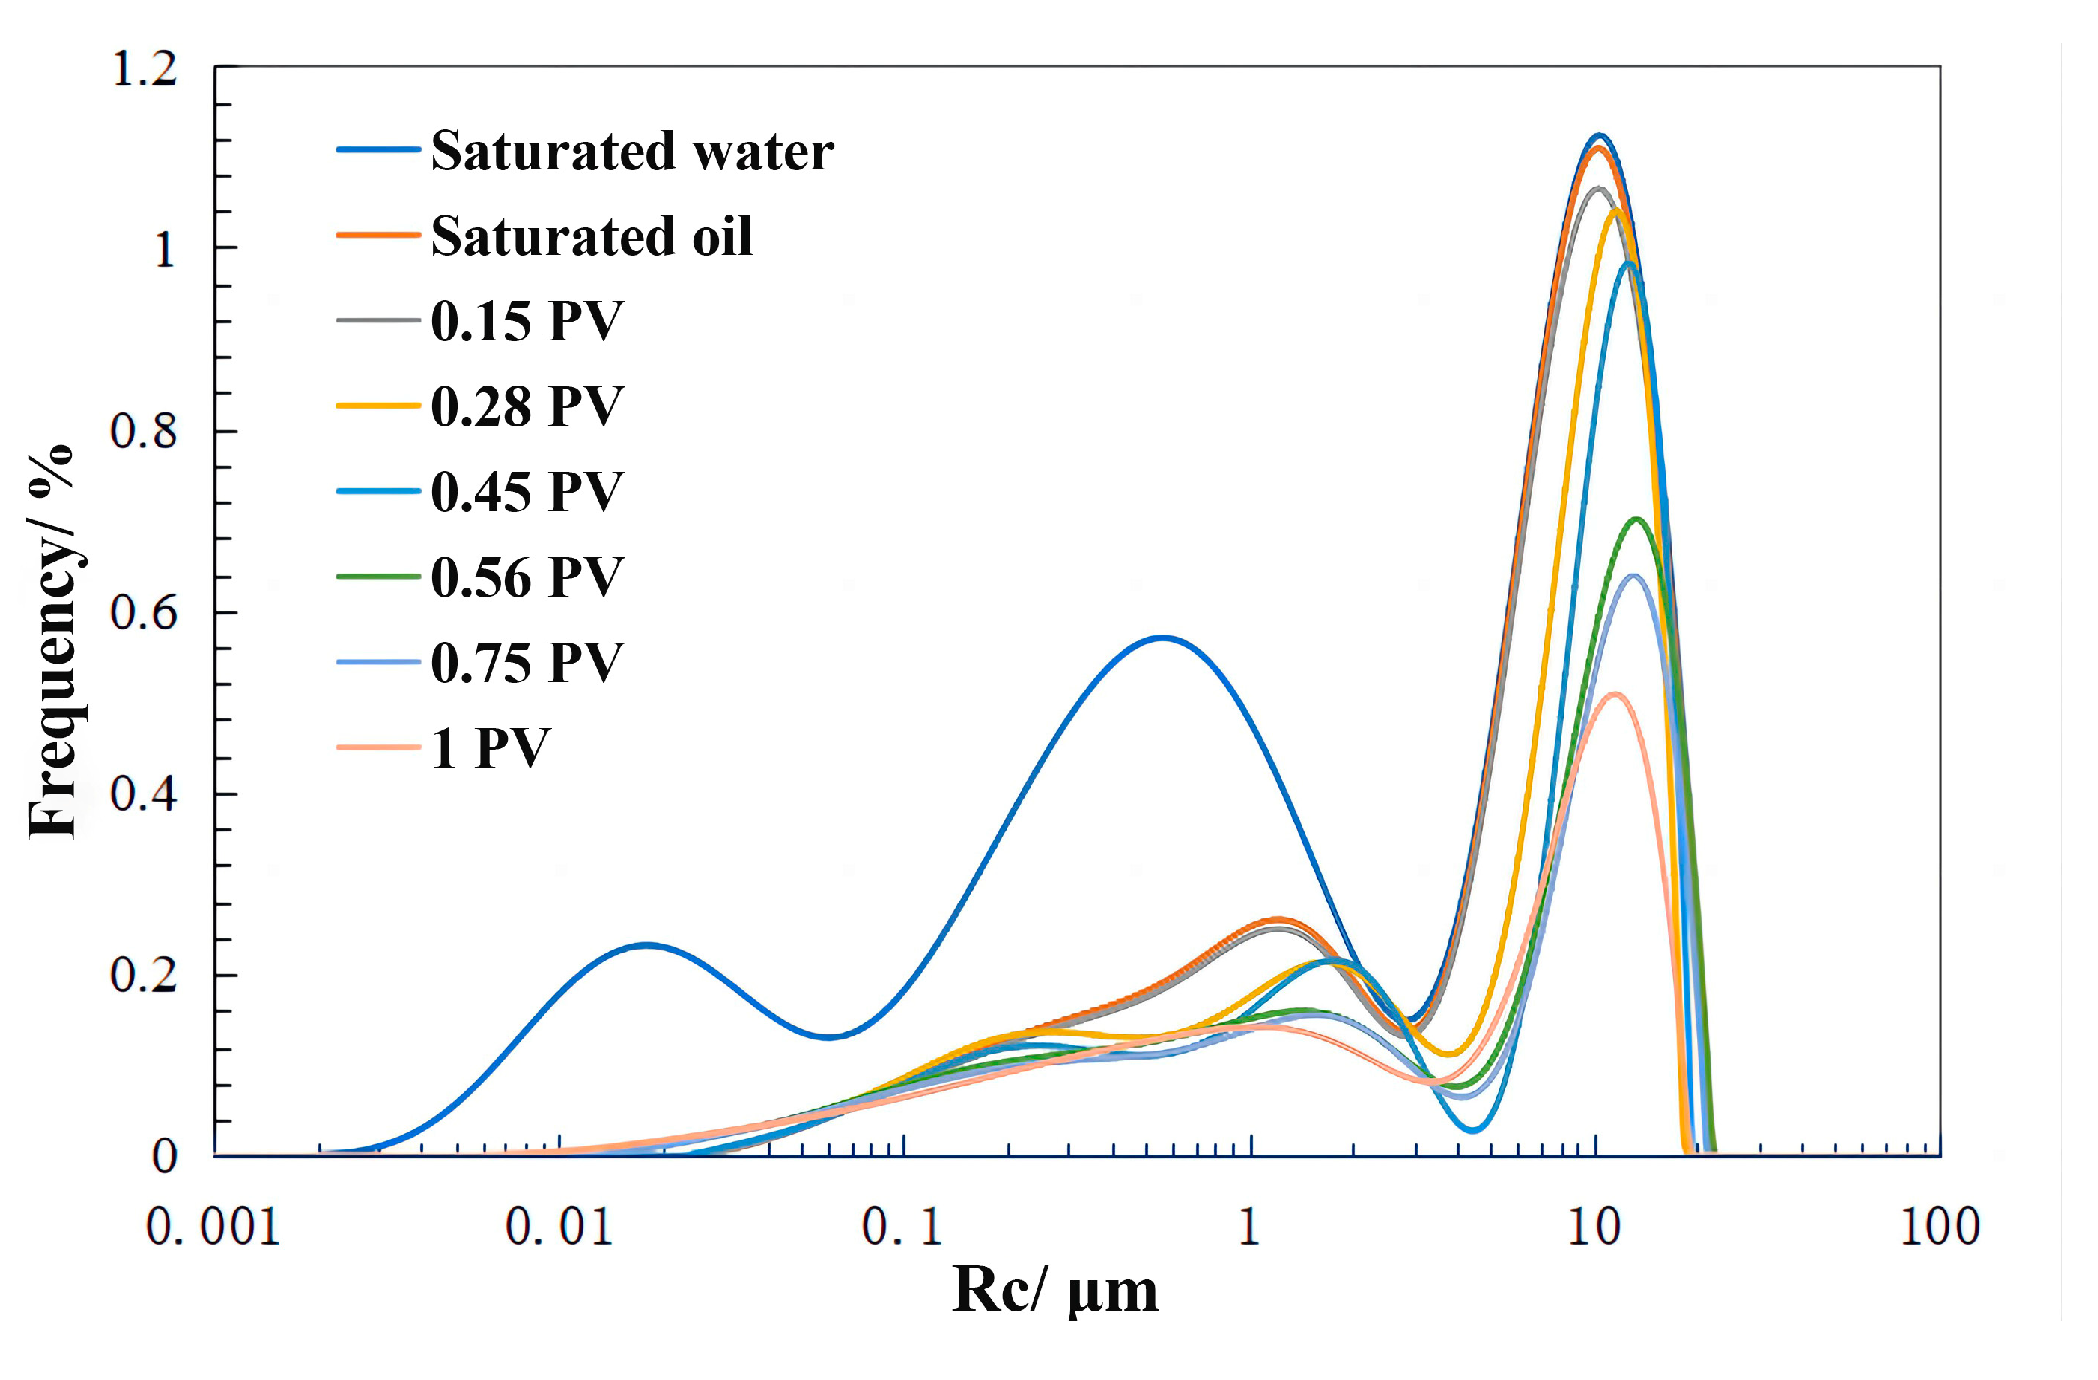
Figure 18 demonstrates the change pattern in crude oil distribution during CO2 displacement, calculated using the established conversion connection between the T2 spectrum and capillary radius in this block. In comparison, CO2 miscible displacement requires large pore throats of around 10 μm in the early stage. The left peak with a pore throat radius less than 10 μm indicates that crude oil in small and medium pores is used less during the early production stage. At the same time, it was discovered that the crude oil signal intensity in the small pores had increased slightly at this point. The investigation concluded that this was owing to the large diameter of the large pores and low CO2 injection resistance once CO2 was injected into the core, but the small holes had small diameters and sluggish pressurization, resulting in CO2 being prioritized and pressurizing big pores. At this point, a displacement pressure differential will occur between the large and tiny pores, and the CO2 in the large pores will transport some of the oil into the small pores of the core, causing friction and adhesion with the inner wall of the pores. Retention occurs during the action. As a result, the magnetic signal intensity in the microscopic pores increases during the early stage of displacement. In the middle and late stages of flooding, CO2 flooding was discovered to diminish the peak value in big pores. More crucially, CO2 flooding can extract crude oil in small and medium pores to a limited amount. This is because CO2 has a greater capacity due to its small size, strong entry, and passability. At this stage, however, CO2 can fully touch the crude oil and perform extraction activities such as dissolving, miscibility, and extraction. The CO2 gas-driving hole in this block has a minimum size of 0.3 μm.
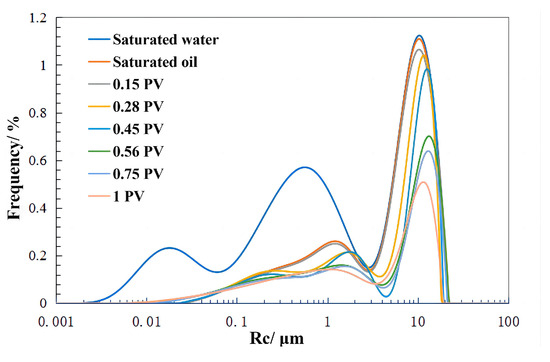
Figure 18.
Changes in crude oil distribution during CO2 flooding.
4. Conclusions
This study conducted a comprehensive and diverse experimental investigation on the features of CO2 flooding in a low-permeability sandy conglomerate. The study examined different levels of miscibility at both the slim tube and core scale. Based on the findings, the following conclusions were drawn.
- (1)
- In the case of slim tubes, breakthrough time is closely proportional to pressure changes. When the phase goes from immiscible to almost miscible, the recovery rate changes qualitatively. The specific manifestation is that after CO2 enters the near-miscible phase, it can effectively delay the time of gas release and increase the recovery effect to over 80 percent.
- (2)
- At the core size, as the pressure reaches the near-miscible phase, the displacement state might transition from being “piston-like” during the immiscible phase to the “miscible phase”. This can effectively lower interfacial tension and extraction, efficiently prolonging the gas duration. When comparing with an immiscible phase, a virtually miscible phase can enhance the recovery impact by 9.27%, and a completely miscible phase can improve it by 18.72%.
- (3)
- The variations in the constituents of the displacement products with varying levels of compatibility are mostly focused on the stages of high production and gas breakthrough. During the high-yield stage, an increase in miscibility leads to a higher proportion of heavy components in the resulting product. This means that improved miscibility can effectively enhance the ability to extract oil. During the gas breakthrough stage, an increase in miscibility leads to a higher proportion of light components in the produced material. This means that after gas breakthrough, oil is primarily produced through the combined actions of miscibility and carrying.
- (4)
- Changes in oil saturation in the core primarily occur prior to gas breakthrough. CO2 microscopic oil flooding preferentially progresses along large pores and fine flow channels, and the remaining oil after gas flooding is primarily distributed in the big pores at the margins. CO2 miscible flooding can use crude oil in small and medium pores throughout the middle and late stages, lowering the pore utilization limit to 0.3 μm.
Author Contributions
Conceptualization, Y.L. and S.Y.; methodology, Y.Z.; software, S.Z.; validation, G.K., X.W. and X.Z. (Xiangshang Zhao); formal analysis, S.Y.; investigation, X.Z. (Xing Zhang); resources, G.K.; data curation, H.C.; writing—original draft preparation, Y.L.; writing—review and editing, S.Y.; visualization, L.B. and Z.X.; supervision, Y.L.; project administration, G.K.; funding acquisition, S.Y. All authors have read and agreed to the published version of the manuscript.
Funding
The following projects are acknowledged to support our work: National Natural Science Foundation of China (No. U23B2090); National Key Research and Development Program of China (No. 2023YFB4104204).
Data Availability Statement
The raw data supporting the conclusions of this article will be made available by the authors on request.
Conflicts of Interest
Gen Kou and Lei Bai are employed by the Research Institute of Experiment and Detection, Xinjiang Oilfield Company. Zhipeng Xiao is employed by the Research Institute of Exploration and Development, Tuha Oilfield Company. The remaining authors declare that the research was conducted in the absence of any commercial or financial relationships that could be construed as a potential conflict of interest.
References
- Dziejarski, B.; Krzyżyńska, R.; Andersson, K. Current status of carbon capture, utilization, and storage technologies in the global economy: A survey of technical assessment. Fuel 2023, 342, 127776. [Google Scholar] [CrossRef]
- Nagireddi, S.; Agarwal, J.R.; Vedapuri, D. Carbon Dioxide Capture, Utilization, and Sequestration: Current Status, Challenges, and Future Prospects for Global Decarbonization. ACS Eng. Au. 2024, 4, 22–48. [Google Scholar] [CrossRef]
- Dou, L.; Sun, L.; Lyu, W.; Wang, M.; Gao, F.; Gao, M.; Jiang, H. Trend of global carbon dioxide capture, utilization and storage industry and challenges and countermeasures in China. Pet. Explor. Dev. 2023, 50, 1246–1260. [Google Scholar] [CrossRef]
- Wei, Y.; Kang, J.; Liu, L.; Li, Q.; Wang, P.; Hou, J.; Liang, Q.; Liao, H.; Huang, S.; Yu, B. A proposed global layout of carbon capture and storage in line with a 2 C climate target. Nat. Clim. Chang. 2021, 11, 112–118. [Google Scholar] [CrossRef]
- Yang, L.; Rui, W.; Qingmin, Z.; Xin, F. Status and prospects for CO2 capture, utilization and storage technology in China. Pet. Sci. Bull. 2023, 04, 391–397. [Google Scholar]
- Song, X.; Wang, F.; Ma, D.; Gao, M.; Zhang, Y. Progress and prospect of carbon dioxide capture, utilization and storage in CNPC oilfields. Pet. Explor. Dev. 2023, 50, 229–244. [Google Scholar]
- Wilberforce, T.; Olabi, A.G.; Sayed, E.T.; Elsaid, K.; Abdelkareem, M.A. Progress in carbon capture technologies. Sci. Total Environ. 2021, 761, 143203. [Google Scholar] [CrossRef]
- Friedlingstein, P.; O’Sullivan, M.; Jones, M.W.; Andrew, R.M.; Hauck, J.; Olsen, A.; Peters, G.P.; Peters, W.; Pongratz, J.; Sitch, S.; et al. Global carbon budget 2020. Earth Syst. Sci. Data 2020, 12, 3269–3340. [Google Scholar] [CrossRef]
- Bruce, H.L.; Li, C.; Wei, N. CO2-EOR in China: A comparative review. Int. J. Greenh. Gas Control 2020, 103, 103173. [Google Scholar]
- Yan, L.I.; Di, Z.; Xiaoyi, F.; Jintong, Z. EOR of CO2 flooding in low-permeability sandy conglomerate reservoirs. Xinjiang Pet. Geol. 2022, 43, 136. [Google Scholar]
- Kumar, N.; Sampaio, M.A.; Ojha, K.; Hoteit, H.; Mandal, A. Fundamental aspects, mechanisms and emerging possibilities of CO2 miscible flooding in enhanced oil recovery: A review. Fuel 2022, 330, 125633. [Google Scholar] [CrossRef]
- dos Santos Bastos, L.; da Silva Lins, I.E.; de Tarso Vieira e Rosa, P.; Costa, G.M.N.; de Melo, S.A.B.V. An experimental assessment of seawater alternating near-miscible CO2 for EOR in pre-salt carbonate reservoirs. Geoenergy Sci. Eng. 2023, 230, 212227. [Google Scholar] [CrossRef]
- Chen, H.; Zhang, X.; Chen, Y.; Tang, H.; Mei, Y.; Li, B.; Shen, X. Study on pressure interval of near-miscible flooding by production gas Re-injection in QHD offshore oilfield. J. Petrol. Sci. Eng. 2017, 157, 340–348. [Google Scholar] [CrossRef]
- Alston, R.B.; Kokolis, G.P.; James, C.F. CO2 minimum miscibility pressure: A correlation for impure CO2 streams and live oil systems. Soc. Pet. Eng. J. 1985, 25, 268–274. [Google Scholar] [CrossRef]
- Khosravi, M.; Rostami, B.; Emadi, M.; Roayaei, E. Marangoni flow: An unknown mechanism for oil recovery during near-miscible CO2 injection. J. Pet. Sci. Eng. 2015, 125, 263–268. [Google Scholar] [CrossRef]
- Lee, I.J. Effectiveness of Carbon Dioxide Displacement under Miscible And immiscible Conditions. 1979. Available online: https://www.osti.gov/etdeweb/biblio/6468594 (accessed on 9 May 2024).
- Mogensen, K.; Hood, P.; Lindeloff, N.; Frank, S.; Noman, R. Minimum miscibility pressure investigations for a gas injection EOR project in Al Shaheen field, offshore Qatar. In Proceedings of the SPE Annual Technical Conference and Exhibition, New Orleans, LA, USA, 4–7 October 2009; SPE: London, UK, 2009. [Google Scholar]
- Shakiba, M.; Ayatollahi, S.; Riazi, M. Investigation of oil recovery and CO2 storage during secondary and tertiary injection of carbonated water in an Iranian carbonate oil reservoir. J. Pet. Sci. Eng. 2016, 137, 134–143. [Google Scholar] [CrossRef]
- Yang, X. Influence factors appraisal of slim-tube simulation to determine the minimum miscibility pressure. J. Southwest Pet. Univ. (Sci. Technol. Ed.) 2004, 26, 41. [Google Scholar]
- Guo, R.; Chen, X.; Ma, X.; Ma, J.; Wang, Q.; Chen, L. Analysis of the characteristics and its influencing factors of horizontal movable fluid in the Chang 7 tight reservoir in Longdong area, Ordos basin. Nat. Gas. Geosci. 2018, 29, 665–674. [Google Scholar]
- Wang, X.; Li, H. Experimental study on pore structure of low permeability core with NMR spectra. J. Southwest Pet. Univ. (Sci. Technol. Ed.) 2010, 32, 69. [Google Scholar]
- Yang, X.; Fan, J.; Zhang, Y.; Li, W.; Du, Y.; Yang, R. Microscopic pore structure characteristics of tight limestone reservoirs: New insights from section 1 of the Permian Maokou formation, southeastern Sichuan basin, China. Unconv. Resour. 2022, 2, 31–40. [Google Scholar] [CrossRef]
- Yang, Z.; Zhang, Y.; Li, H.; Zheng, X.; Lei, Q. Application Basis of Nuclear Magnetic Resonance Technology in the Unconventional Reservoirs. Earth Sci. 2017, 42, 1333–1339. [Google Scholar]
- Zhao, Y.; Zhang, Y.; Lei, X.; Zhang, Y.; Song, Y. CO2 flooding enhanced oil recovery evaluated using magnetic resonance imaging technique. Energy 2020, 203, 117878. [Google Scholar] [CrossRef]
- Wang, H.; Lun, Z.; Lv, C.; Lang, D.; Ji, B.; Luo, M.; Pan, W.; Wang, R.; Gong, K. Measurement and visualization of tight rock exposed to CO2 using NMR relaxometry and MRI. Sci. Rep. 2017, 7, 44354. [Google Scholar] [CrossRef] [PubMed]
- Sun, H.; Wang, H.; Lun, Z. Effect of permeability and fractures on oil mobilization of unconventional resources during CO2 EOR using nuclear magnetic resonance. Sci. Rep. 2021, 11, 12660. [Google Scholar] [CrossRef] [PubMed]
- Cao, A.; Li, Z.; Zheng, L.; Bai, H.; Zhu, D.; Li, B. Nuclear magnetic resonance study of CO2 flooding in tight oil reservoirs: Effects of matrix permeability and fracture. Geoenergy Sci. Eng. 2023, 225, 211692. [Google Scholar] [CrossRef]
- Zhang, H.; Wang, Y.; Fang, T.; Wang, W.; Zhao, X.R.; Zhao, H.P.; Wu, J.L.; Wei, G.; Liu, B. First application of new generation NMR T1-T2 logging and interpretation in unconventional reservoirs in China. In Proceedings of the SPE Asia Pacific Oil and Gas Conference and Exhibition, Virtual, 17–19 November 2020; SPE: London, UK, 2020; p. D013S001R002. [Google Scholar]
- Wang, H.; Tian, L.; Chai, X.; Wang, J.; Zhang, K. Effect of pore structure on recovery of CO2 miscible flooding efficiency in low permeability reservoirs. J. Pet. Sci. Eng. 2022, 208, 109305. [Google Scholar] [CrossRef]
- Cui, X.; Zheng, L.; Liu, Z.; Cui, P.; Du, D. Determination of the minimum miscibility pressure of the CO2/oil system based on quantification of the oil droplet volume reduction behavior. Colloids Surf. A Physicochem. Eng. Asp. 2022, 653, 130058. [Google Scholar] [CrossRef]
- Ghorbani, M.; Momeni, A.; Safavi, S.; Gandomkar, A. Modified vanishing interfacial tension (VIT) test for CO2–oil minimum miscibility pressure (MMP) measurement. J. Nat. Gas Sci. Eng. 2014, 20, 92–98. [Google Scholar] [CrossRef]
- Li, X.; Wang, S.; Feng, Q.; Xue, Q. The miscible behaviors of C10H22 (C7H17N)/C3H8 system: Insights from molecular dynamics simulations. Fuel 2020, 279, 118445. [Google Scholar] [CrossRef]
- Zhou, X.; Jiang, Q.; Yuan, Q.; Zhang, L.; Feng, J.; Chu, B.; Zeng, F.; Zhu, G. Determining CO2 diffusion coefficient in heavy oil in bulk phase and in porous media using experimental and mathematical modeling methods. Fuel 2020, 263, 116205. [Google Scholar] [CrossRef]
- Zheng, S.; Yang, D. Experimental and theoretical determination of diffusion coefficients of CO2-heavy oil systems by coupling heat and mass transfer. J. Energy Resour. Technol. 2017, 139, 022901. [Google Scholar] [CrossRef]
- Fayazi, A.; Kantzas, A. Modeling of CO2 diffusion into water-shielded oil at pore scale using moving mesh technique. Chem. Eng. Sci. 2018, 179, 64–72. [Google Scholar] [CrossRef]
- Cai, M.; Su, Y.; Hao, Y.; Guo, Y.; Elsworth, D.; Li, L.; Li, D.; Li, X. Monitoring oil displacement and CO2 trapping in low-permeability media using NMR: A comparison of miscible and immiscible flooding. Fuel 2021, 305, 121606. [Google Scholar] [CrossRef]
- Zhu, C.; Li, Y.; Zhao, Q.; Gong, H.; Sang, Q.; Zou, H.; Dong, M. Experimental study and simulation of CO2 transfer processes in shale oil reservoir. Int. J. Coal Geol. 2018, 191, 24–36. [Google Scholar] [CrossRef]
- Qin, J.; Han, H.; Liu, X. Application and enlightenment of carbon dioxide flooding in the United States of America. Pet. Explor. Dev. 2015, 42, 232–240. [Google Scholar]
- Peng, X.-T.; Lyu, H.-D.; Zhang, X. Interpretation of IPCC AR6 report on carbon capture, utilization and storage (CCUS) technology development. Adv. Clim. Chang. Res. 2022, 18, 580. [Google Scholar]
- Hu, Y.; Hao, M.; Chen, G.; Sun, R.; Li, S. Technologies and practice of CO2 flooding and sequestration in China. Pet. Explor. Dev. 2019, 46, 753–766. [Google Scholar]
- Liu, J.; Zhang, Q.; Lu, W.; Li, G.; Teng, F.; Gao, Z. Research Progress and Industry Development Strategy of Integrated Carbon Capture, Utilization and Storage Technology. J. Beijing Inst. Technol. (Soc. Sci. Ed.) 2023, 25, 40–53. [Google Scholar]
- Wang, Q.; Yang, S.; Han, H.; Wang, L.; Qian, K.; Pang, J. Experimental investigation on the effects of CO2 displacement methods on petrophysical property changes of ultra-low permeability sandstone reservoirs near injection wells. Energies 2019, 12, 327. [Google Scholar] [CrossRef]
- Chen, H. Key Problems and Countermeasures in CO2 Flooding and Storage. Acta Geol. Sin. Engl. Ed. 2023, 97, 858–872. [Google Scholar] [CrossRef]


Disclaimer/Publisher’s Note: The statements, opinions and data contained in all publications are solely those of the individual author(s) and contributor(s) and not of MDPI and/or the editor(s). MDPI and/or the editor(s) disclaim responsibility for any injury to people or property resulting from any ideas, methods, instructions or products referred to in the content. |
© 2024 by the authors. Licensee MDPI, Basel, Switzerland. This article is an open access article distributed under the terms and conditions of the Creative Commons Attribution (CC BY) license (https://creativecommons.org/licenses/by/4.0/).