Article

Modeling of the Arc Characteristics inside a Thermal Laminar Plasma Torch with Different Gas Components

1
School of Mechanical Engineering, Sichuan University of Science and Engineering, Zigong 643000, China
2
Key Laboratory of Intelligent Manufacturing of Construction Machinery, Hefei 230601, China
3
Shanghai Special Equipment Inspection and Research Institute, Shanghai 200062, China
*
Author to whom correspondence should be addressed.
Processes 2024, 12(6), 1207; https://doi.org/10.3390/pr12061207
Submission received: 25 April 2024 / Revised: 9 June 2024 / Accepted: 10 June 2024 / Published: 12 June 2024
(This article belongs to the Section Manufacturing Processes and Systems)

Abstract

:
For low costs, numerical simulation is an effective method to reveal the internal mechanisms inside a thermal plasma torch. Various simulation models for studying the inside or outside characteristics of thermal plasma torches have been built and discussed. However, to reveal the inside mechanisms of thermal plasma torches under various working conditions to support the materials processing, more attention should be paid to building precise models of laminar plasma torches. Thus, based on the user-defined function (UDF) and user-defined scalar (UDS) of ANSYS Fluent software, the assumptions, governing equations, boundary conditions, and solving method were discussed in detail, and a corresponding numerical model of a homemade laminar plasma torch was first built. For verifying the effectiveness of the proposed numerical model and studying the influence of the gas components on the arc characteristics, the working conditions and experimental setups were introduced in sequence. Finally, the numerical and experimental results of the homemade laminar plasma torch were obtained and discussed in detail. The study results show that: ① The axial temperature of the plasma torch could be divided into three sections along the axis: peak temperature area (10 mm < x < 20 mm), stable temperature area (20 mm < x < 62 mm) and decrease temperature area (62 mm < x < 95 mm). Under the same input conditions, when pure argon gas was used, the peak temperature at the outlet was reached at approximately 7590 K, while for pure nitrogen and 50%Ar + 50%N2, the corresponding peak temperatures were 6785 K and 7402.2 K, respectively. ② The axial velocity of pure nitrogen is much higher than that of pure argon and 50%Ar + 50%N2, while that of pure argon and 50%Ar + 50%N2 has little difference. In addition, when nitrogen gas was used, the peak velocity at the outlet reached 185 m/s, whereas, for argon gas and 50%Ar + 50%N2, the corresponding peak velocities were 146 m/s and 169 m/s, respectively. ③ The simulated arc voltage trends under different working conditions are well in accordance with the experimental arc voltage trends.

1. Introduction

As a heat source, the thermal plasma jet has been widely used in various applications [1,2,3]. Based on thermal plasma technologies, a new thermal plasma jet with higher jet stability and controllability, larger length/diameter ratio, and lower working noise has been generated and studied for more favorable jet characteristics by some research groups in the past few decades [4,5,6,7]. With favorable jet characteristics, the new thermal plasma jet, named the laminar plasma jet, has been used in some high-precision applications, e.g., materials processing, plasma spraying, material surface modification, etc. [8,9,10,11]. However, limited by the service for improving the jet characteristics of the laminar plasma jet, various laminar plasma torches have been designed, and their jet characteristics have been studied experimentally. A laminar plasma torch with one inter-electrode was designed by Wenxia Pan et al. [12]. The influences of the arc current, gas flow rate, diameter of the inter-electrode, and property of the power source etc., on the jet characteristics have been studied experimentally [13,14,15]. For increasing the working power with a fixed arc current, the cascade laminar plasma torch was proposed by O P Solonenko and Xiuquan Cao et al. [7,16,17]. The jet characteristics of the cascade laminar plasma torch under different working conditions also have been studied experimentally [18,19,20,21]. Recently, the experimental characteristics of the laminar plasma jet with cascade structure have been studied and discussed by Senhui Liu et al. [22]. With the experimental studies on the jet characteristics of laminar plasma torches, the properties of laminar plasma torches have been improved, and the generation mechanisms of laminar plasma jets have been discussed.
However, limited by the high economic and temporal cost, the number of experiments is always limited to a certain level. In addition, it is hard to observe and reveal the generating process of the laminar plasma jet and measure the flow characteristics inside the plasma torch in the experiments. For comprehending the generation mechanisms of laminar plasma jets, numerical simulations of various laminar plasma torches have been conducted and studied. For studying the flow characteristics of the laminar plasma jet in atmosphere pressure, a model of the plasma jet, generated by a laminar plasma torch with one inter-electrode, has been built and studied to discuss the effects of the turbulent kinetic energy at the torch nozzle exit on the temperature distribution of plasma jets by Wenxia Pan et al. [12]. Moreover, the flow characteristics inside a novel plasma spray torch with a cascade structure under specified working conditions have been simulated and studied by Senhui Liu et al. [22]. Recently, Rodion Zhukovskii et al. [23] conducted and discussed a three-dimensional unsteady two-temperature simulation of an atmospheric pressure direct current electric arc inside a commercial cascaded-anode-plasma spray torch, using open-sourced computational fluid dynamics software (code_saturne) (latest v. 8.1) and coupling it with torch electrodes.
From the above analysis, numerical simulations could not only save the experimental cost but could also be beneficial for comprehending the inside mechanisms of plasma torches. Though some numerical studies on the inside or outside characteristics of thermal plasma torches have been conducted to reveal the inside mechanisms of thermal plasma torches under various working conditions to support material processing, more attention should be paid to building precise laminar plasma torch models and using these models to reveal their flow characteristics inside and outside. Thereby, a numerical model of a homemade laminar plasma torch was built and is discussed first in detail in this paper. For verifying the effectiveness of the proposed numerical model and studying the influence of the gas components on the arc characteristics, the working conditions and experimental setups are introduced in the third section. Finally, the numerical and experimental results are discussed in detail.

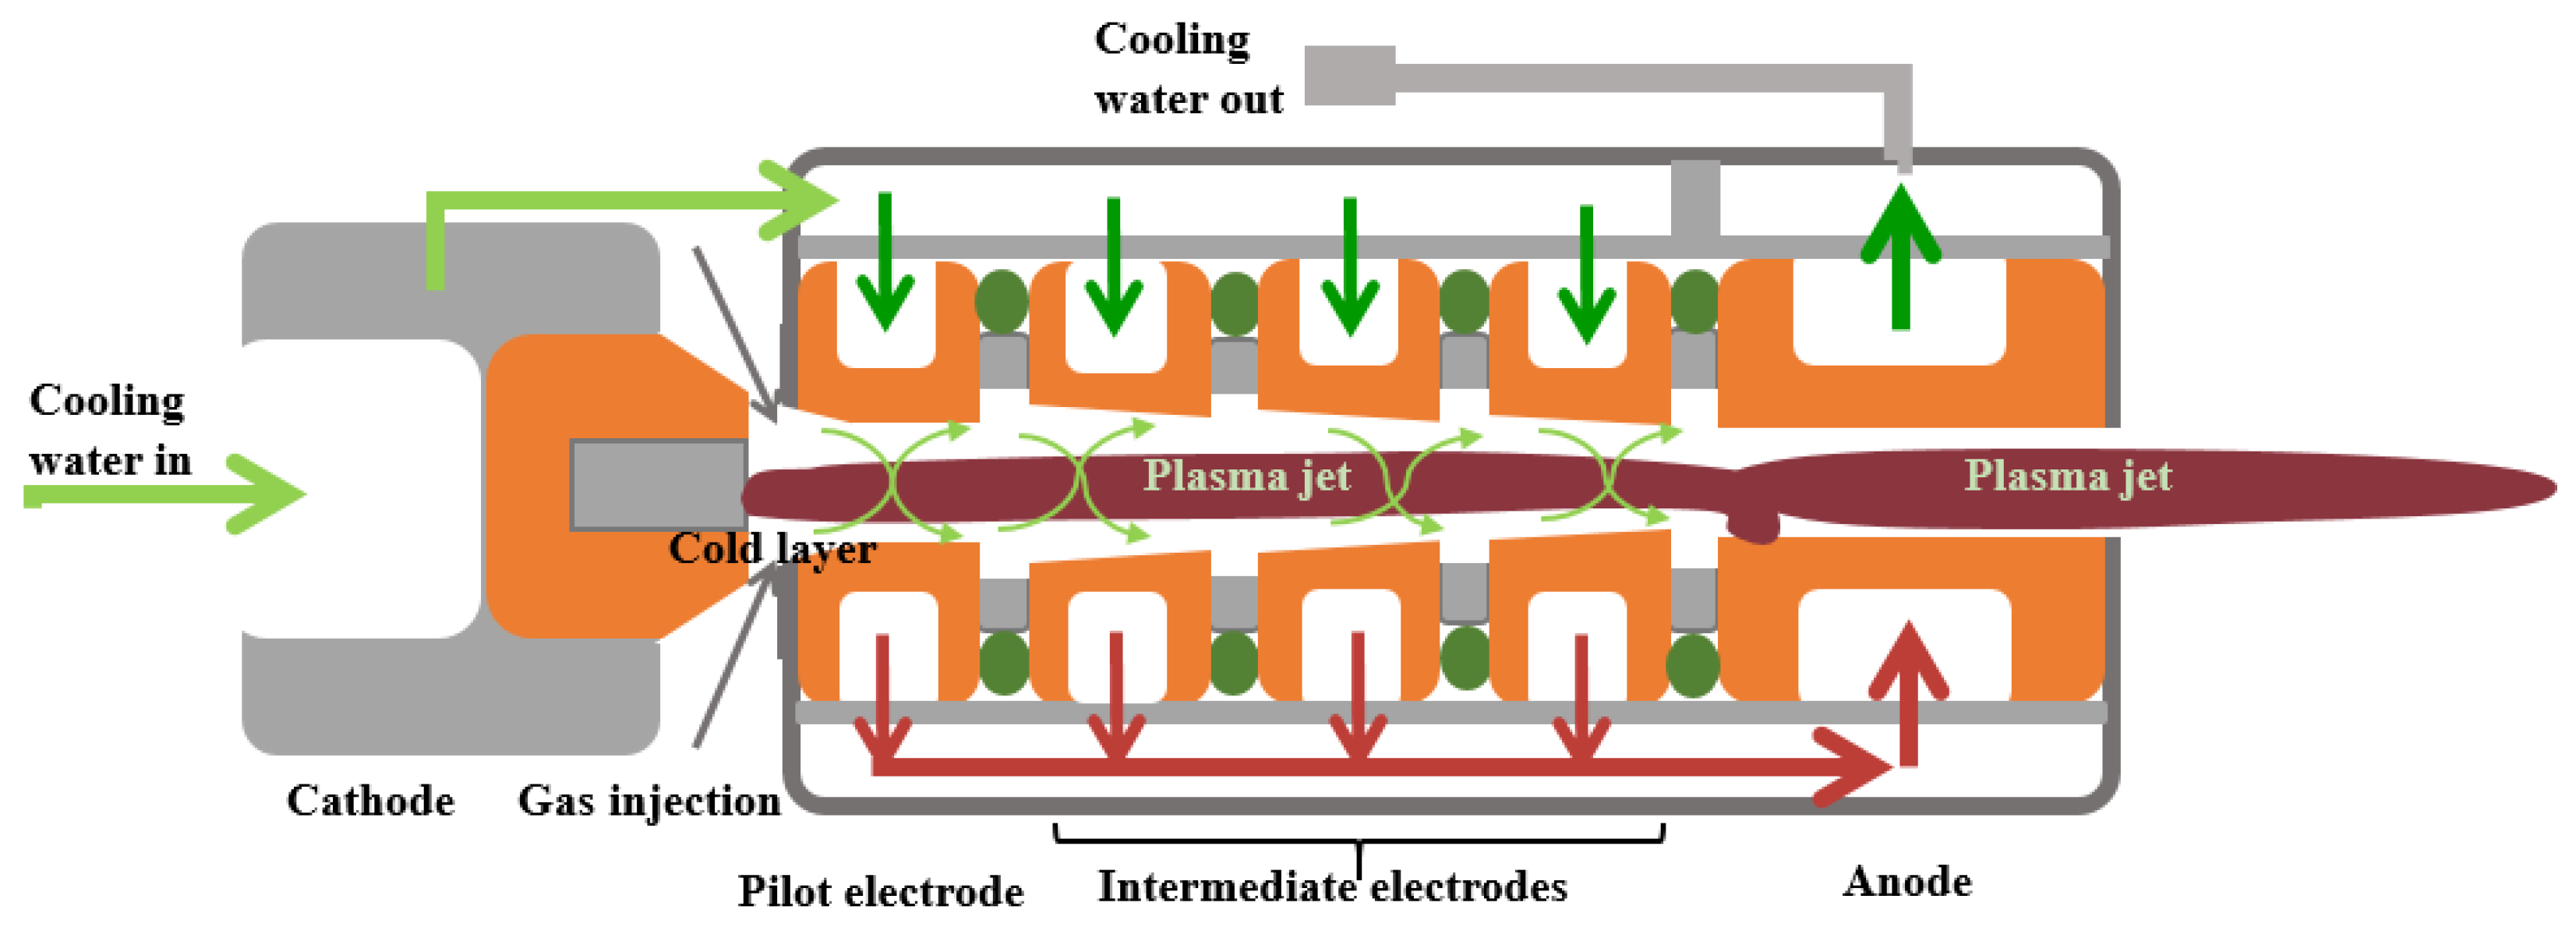
2. Modeling of the Laminar Plasma Torch

2.1. Assumptions

The internal structure of the homemade laminar plasma torch is highly symmetric. For simplicity of the simulation, the transient characteristics inside the laminar plasma torch are neglected, and a two-dimensional model is applied. The following assumptions are adopted:
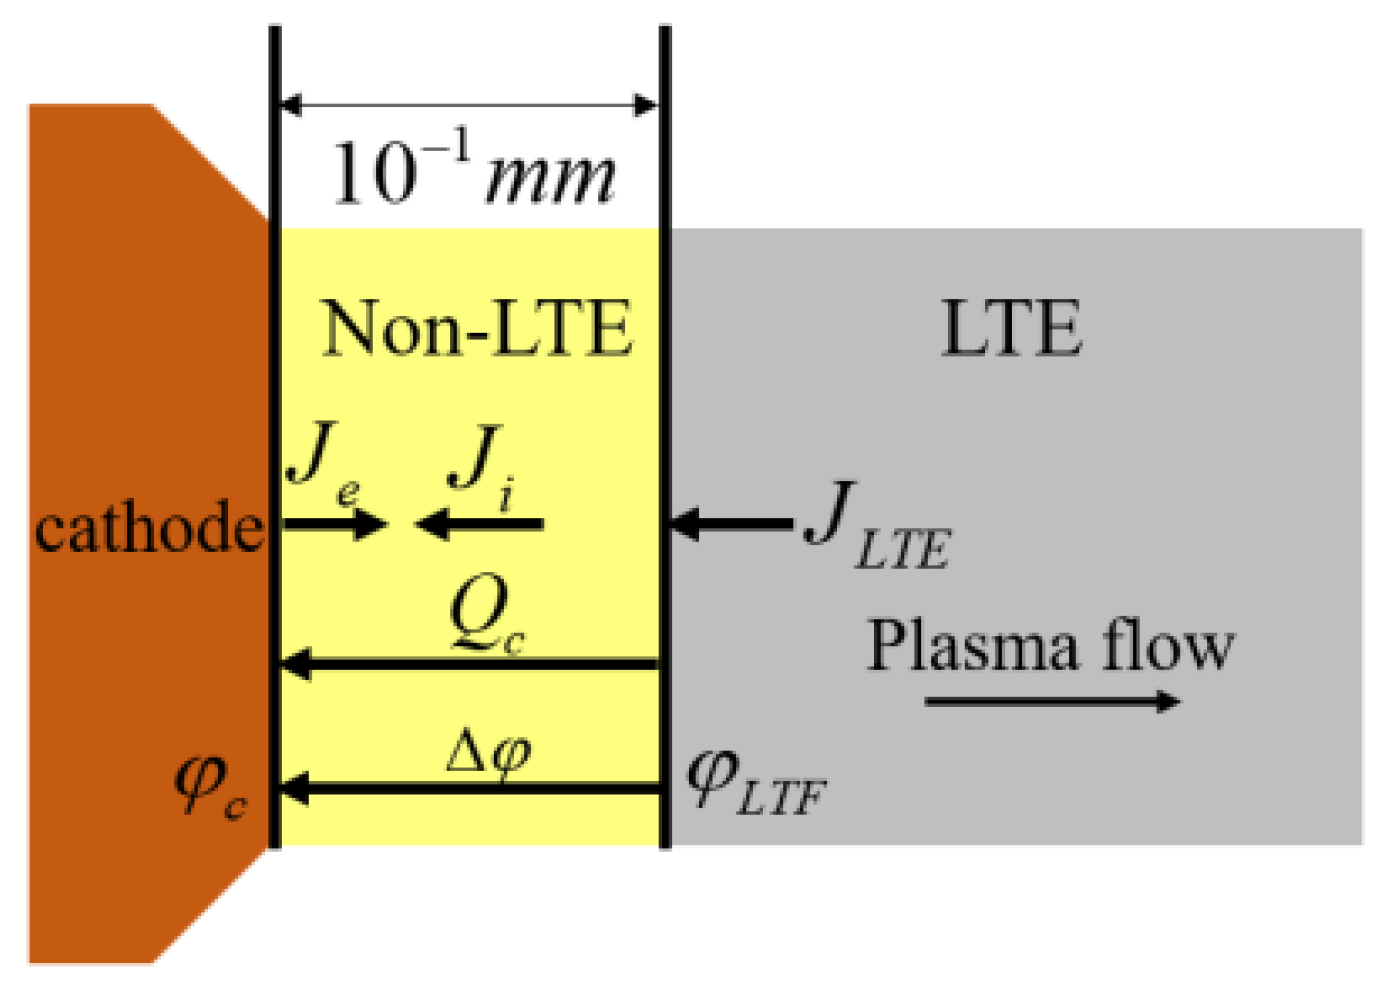
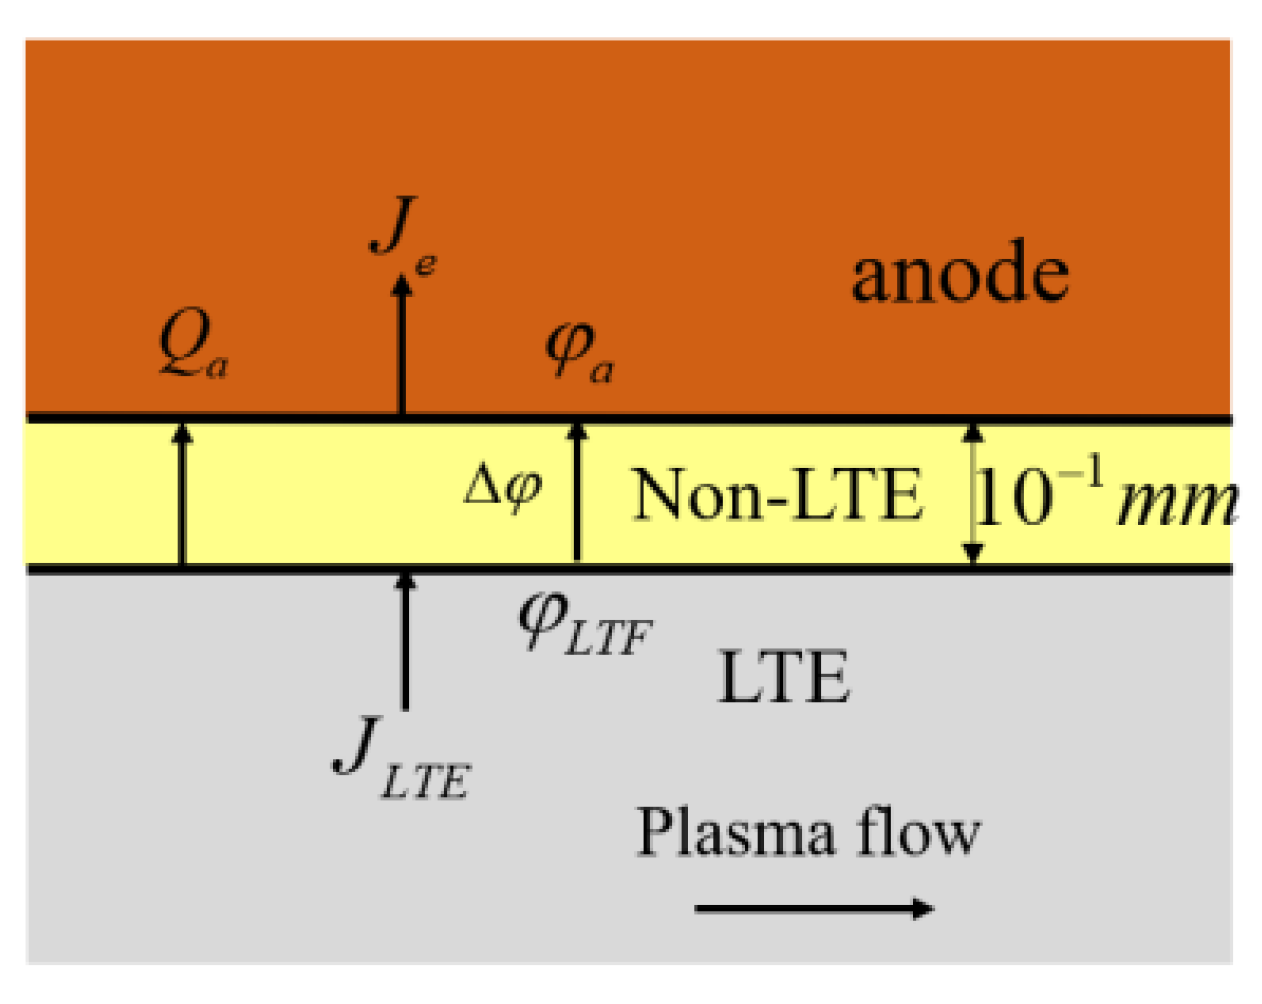
  • The plasma flow is in a local thermodynamic equilibrium (LTE) in the plasma torch except for the near-electrode region. Non-LTE in the near-electrode region is considered.
  • The effect of radiation reabsorption of the plasma flow inside the laminar plasma torch is ignored.
  • The inter-electrodes are simplified as water-cooled walls with a specified temperature.
  • Considering the small flow Mach number, which is calculated theoretically, the viscous dissipation term in the energy equation can be ignored.
  • The phase transition of the electrode material is ignored.
  • The plasma gas is treated as a monophasic continuous fluid, which is characterized by a single temperature for all species. The transport properties are functions of the temperature only.
  • The flow Mach number is about 0.5.

2.2. Governing Equations

According to the above assumptions, the governing equations for the 2D plasma flow can be written as follows:

2.2.1. Governing Equations of the Plasma Flow

(1)
Mass conservation equation:
( ρ v ) = 0
where ρ is the density of the plasma flow, kg/m3, and v is the velocity vector of the plasma flow, m/s.
(2)
The momentum conservation equation:
ρ v v + P τ = J × B + ρ g
where P is the pressure, Pa; τ is the stress tensor; J is the current density, A/m2; B is the magnetic field, T; and g is the gravity acceleration, m/s2.
(3)
The energy conservation equation:
ρ C p v T κ T = 5 κ B 2 e T J + J E 4 π ε r
where C p is the specific heat at constant pressure, J / kg × K ; T is the temperature, K; κ is the thermal conductivity, W / ( m × K ) ; κ B is the Boltzmann constant, 1.38 × 10 23 m 2 × kgs 2 K 1 ; e is the elementary charge constant, 1.6022 × 10 19 C ; E is the electric field, V/m; and ε r is the net emission coefficient, W / ( m 3 × sr ) .
(4)
The electric current conservation equation:
J = σ E = σ φ = 0
where σ is the electrical conductivity, S/m, and φ is the electric potential, V.
(5)
The Ampere–Maxwell equation:
B = 2 A = μ 0 J
where μ 0 is the vacuum permeability constant, 4 π × 10 7 N A 2 , and A is the magnetic potential, A/m.

2.2.2. Governing Equations of the Solid Regions

The solid regions of the cathode and anode are considered in the simulation. In the solid regions, the charge conservation equation and energy conservation equation are considered, which are shown as Equations (6) and (7), respectively:
J = ( σ s φ ) = 0
κ S T = J E = σ S φ 2
where κ s is the thermal conductivity of the solid materials, W / ( m × K ) , and σ s is the electrical conductivity of the solid materials, S/m.

2.2.3. Simulation Model

Compared with other simulation models, for improving the model precision, the transmission of turbulent shear stress is considered in the definition of turbulent viscosity in the SST k-ω model. It is more suitable for dealing with internal flow, jet flow, large area rate flow, separation flow, and so on. Thus, an SST k-ω model in ANSYS Fluent is adopted in the simulation. The turbulent kinetic energy k and the specific dissipation rate ω can be obtained from the following equation:
x i ρ k u i = x j Γ k k x j + G k Y k x i ρ ω u i = x j Γ ω ω x j + G ω Y ω + D ω
where Gk and Gω represent the generation of turbulent kinetic energy k and the specific dissipation rate ω, respectively; Yk and Yω represent the dissipation of k and ω caused by turbulence, respectively.
With the above governing equations, FLUENT’s user-defined memory (UDM), user-defined scalar (UDS), and user-defined functions (UDF) are used to solve these equations.

2.3. Material Properties

(1)
Thermodynamic and transport properties of plasma gases
For solving the different governing equations, the thermodynamic and transport properties of various plasma gases originate from the reference [24,25,26], and the thermodynamic and transport properties of the mixture gas (50%N2 + 50%Ar) are the average values of that of pure nitrogen and argon. In detail, the transport coefficients for the mixed gas in this study were calculated based on a 50% contribution from pure nitrogen and a 50% contribution from pure argon.
(2)
Net radiation coefficients
Due to the high temperature of the plasma flow, the effect of the thermal radiation phenomenon on energy conservation could not be ignored. According to the assumption, the radiation reabsorption is ignored. Moreover, compared with the net emission coefficient, the other radiation energy can be ignored, too. Thereby, to simplify the calculation, the net radiation coefficients of various plasma gases are considered in the simulation. The corresponding net radiation coefficients originated from the reference [25,26]. The corresponding net radiation coefficient of the mixture gas is decided by the ratio of pure nitrogen and argon: the transport coefficients for the mixed gas in this study were calculated based on a 50% contribution from pure nitrogen and a 50% contribution from pure argon.

2.4. Laminar Plasma Torch Geometry and Computational Domain

The schematic diagram of the homemade laminar plasma torch with a working power of 20 kW is shown in Figure 1. From it, the laminar plasma torch mainly consists of a button-shaped Tungsten cathode, a copper pilot electrode, three copper inter-electrodes, a copper anode, some insulator rings, and seal rings. The electrodes of the thermal plasma torch are isolated and sealed well by the insulator rings and seal rings. A compressed arc chamber is adopted in the laminar plasma torch. The evenly working gases are fed to the arc chamber through six swirl grooves between the cathode and the pilot electrode. With the specific structure and the specified characteristics of the power source, the laminar plasma jet could be generated by the proposed laminar plasma torch.
According to the laminar plasma torch geometry, a cylindrical coordinate system is used to describe it, and the corresponding computational domain is shown in Figure 2.

2.5. Mesh Generation

For balancing the calculation velocity and simulation precision, mesh independence has been considered and discussed to decide a suitable mesh quantity. Moreover, the mesh density in the boundary layer and near the cathode and anode has been increased. Finally, an unstructured mesh of the computational domain is divided by using ICEM 2021 R1, as shown in Figure 3.

2.6. Boundary Conditions

2.6.1. Near-Electrode Boundary

For improving the precision of the simulation model, Non-LTE in the near-electrode region is considered. According to the study by Lisnyak et al., the boundary conditions between the near-electrode and the plasma flow are considered for energy conservation and electric current conservation [27].
1.
Near the cathode
According to the basic theory of hot cathode electron emission, a simulation model between the plasma flow and the near-cathode is built, as shown in Figure 4 [28]. The vital parameters are discussed and decided in the following section.
(1)
Current density
According to the Richardson–Dushman law, the hot electron flux JR can be expressed as:
J e J R = A G T 2 exp e Φ w k B T
where Je is the surface electric density flux; AG = 6 × 10⁵ Am−2K−2; the surface work function of the tungsten cathode Φ w = 4.5 [eV]; k B is the Boltzmann constant; and T is the surface temperature of the cathode. Then, the current density J L T E can be expressed as:
J L T E = J i + J R
where Ji is the surface ion density flux of the cathode.
(2)
Heat flux
The surface heat flux of the cathode is decided by the surface ion density flux J i , the surface electric density flux Je, heat conduction velocity, and radiation loss. According to the Stefan–Boltzmann law, the total surface heat flux of the cathode Qc can be expressed as [29]:
Q C = J e Φ w + J i V i k T n ε α T 4
where Vi is the ionization energy of plasma gas (nitrogen: 15.6 [eV] and argon:13.6 [eV]); k is the turbulent kinetic energy; ε is the Stefan–Boltzmann constant, 5.67032 × 10⁻⁸ W/(m2·K4); and α is the radiation coefficient of electrode material.
(3)
Cathode voltage drop
According to the study of Benilov et al., the cathode voltage drop is about 14 V in the model simulation [30].
2.
Near the anode
As is the same with the cathode, according to the basic theory of energy release by hot electrons entering the anode surface, a corresponding simulation model between the plasma flow and the near-anode is built [31], as shown in Figure 5:
Compared with Je, the Ji could be ignored, so the surface heat flux of anode Qa can be expressed as:
Q a = J e Φ w a k T n ε α T 4
where the surface work function of copper anode Φ w a = 4.7 [eV].
In addition, the anode voltage drop is decided by the anode attachment mode. According to our experiments, the anode attachment mode is the diffusion mode.

2.6.2. Other Boundary Conditions

According to Figure 2, the corresponding boundary conditions are decided, as shown in Table 1. The current density and gas flow rate at the EF and AD sections are determined by the operating parameters of the proposed laminar plasma torch. The EF and AD sections represent the anode-plasma boundary and cathode-plasma boundary conditions, as described in the previous section. The IM and MN sections are the air domains where the plasma jet enters and diverges; thus, their boundary conditions are set as pressure outlets. As the laminar plasma torch is cooled by water, the remaining wall surfaces have boundary conditions defined by the convective heat transfer coefficient between the cooling water and copper walls.
The gas mass flow rate Qin and the current density Jc are decided by the working parameters of the laminar plasma torch.
J c = I i n S A D
where Iin is the working arc current of the laminar plasma torch, and the SAD is the sectional area of the cathode.

2.7. Solving Method

Based on the above analysis, the simulation model of a homemade laminar plasma torch was built. By comparing the various solving methods, the pressure-based coupled solver and second-order upwind are used to solve the simulation model in ANSYS Fluent 2021 R1.

3. Simulation and Experimental Conditions

3.1. Working Conditions

For verifying the effectiveness of the simulation model and studying the influence of the gas composition (pure N2, pure Ar, 50%Ar + 50%N2) on the flow characteristics inside the laminar plasma torch, the simulation and experimental working conditions shown in Table 2 are decided by previous studies. With these working conditions, the laminar plasma torch can work well and generate a favorable laminar plasma jet.

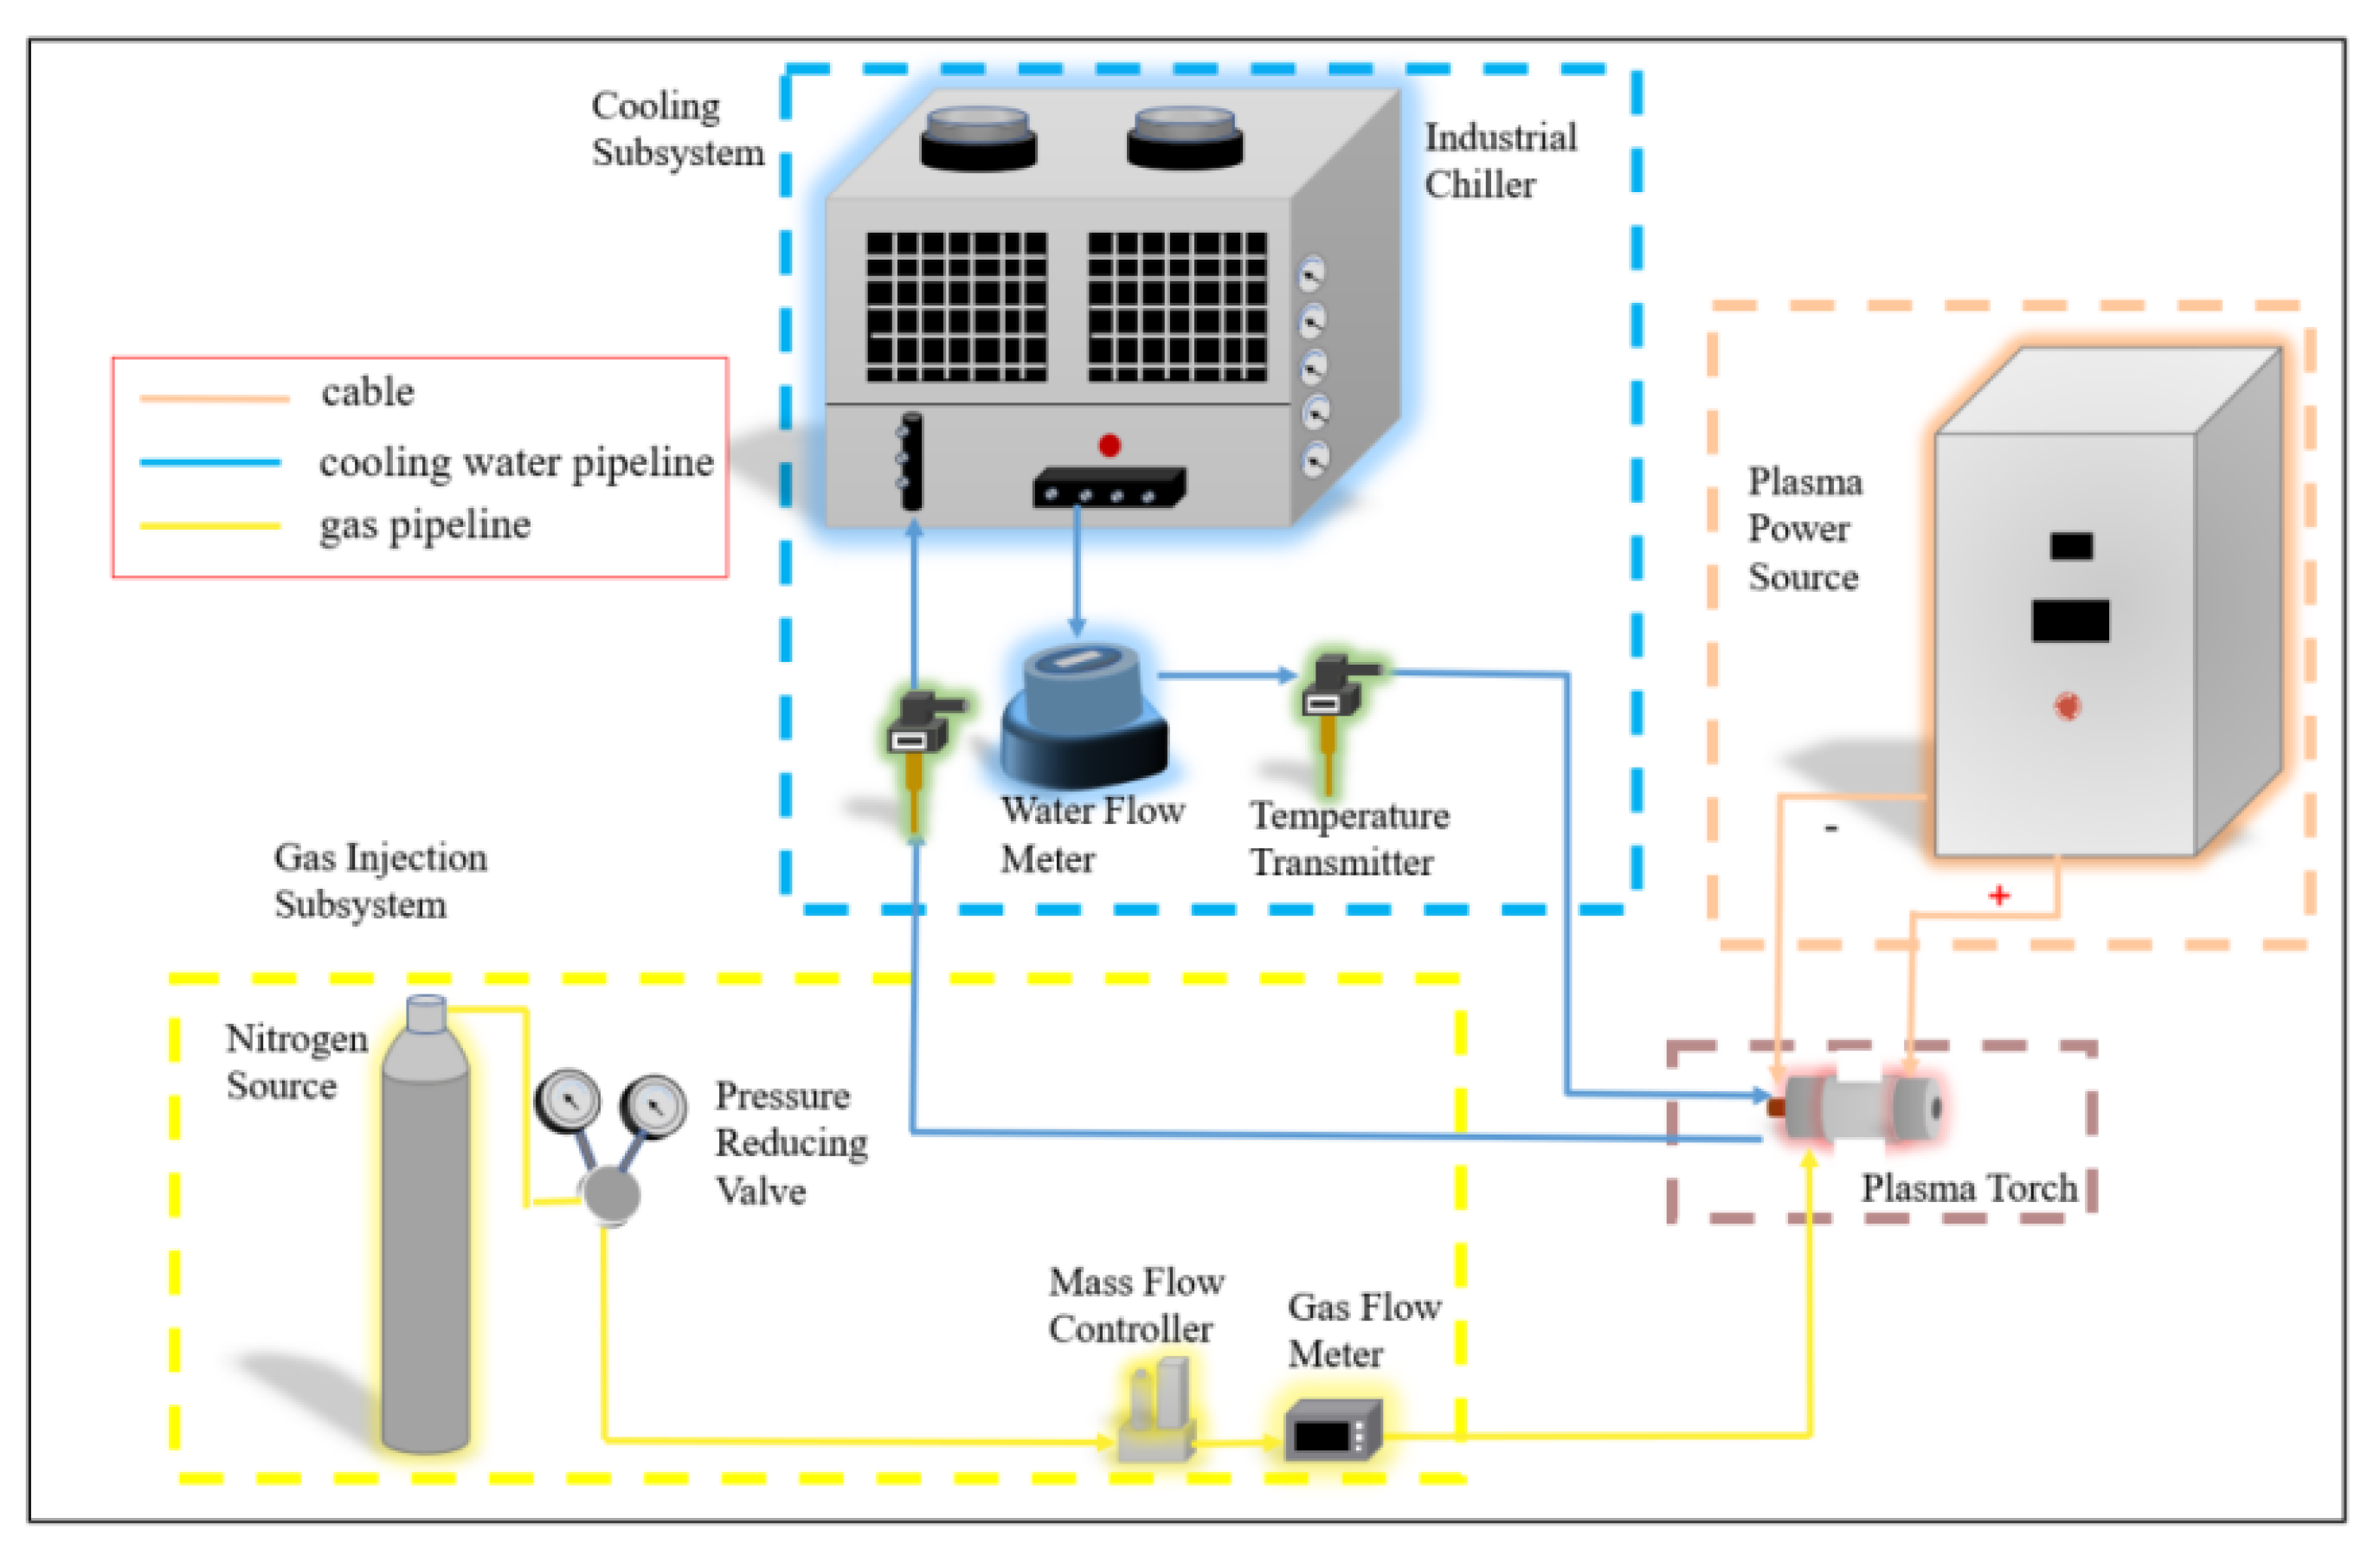
3.2. Experimental Setups

The corresponding experiments were conducted with the experimental setups shown in Figure 6. The experimental setup consists of the laminar plasma torch, a specified plasma power source, a gas injection subsystem, and a cooling subsystem. The specified plasma power source transfers the three-phase alternating current to DC power by using an insulated gate bipolar transistor module. It supplies the DC power to the thermal plasma torch with a specified arc current ranging from 50 to 200 A. The maximum working power of this specified plasma power source is 30 kW. In addition, in order to ignite the pilot arc and transfer the anode arc attachment from the pilot electrode to the anode, an automatic ignition module is integrated into the specified power source. The gas injection subsystem, which consists of a nitrogen gas cylinder and a mass flow controller, can supply the working gas to the laminar plasma torch with a specified gas flow rate. The cooling subsystem uses a 24 kW industrial chiller to supply the cooling water to the optimized plasma torch, with a specified temperature of 15 °C.

4. Results and Discussion

4.1. Simulation and Experimental Results in the Near-Electrode Regions

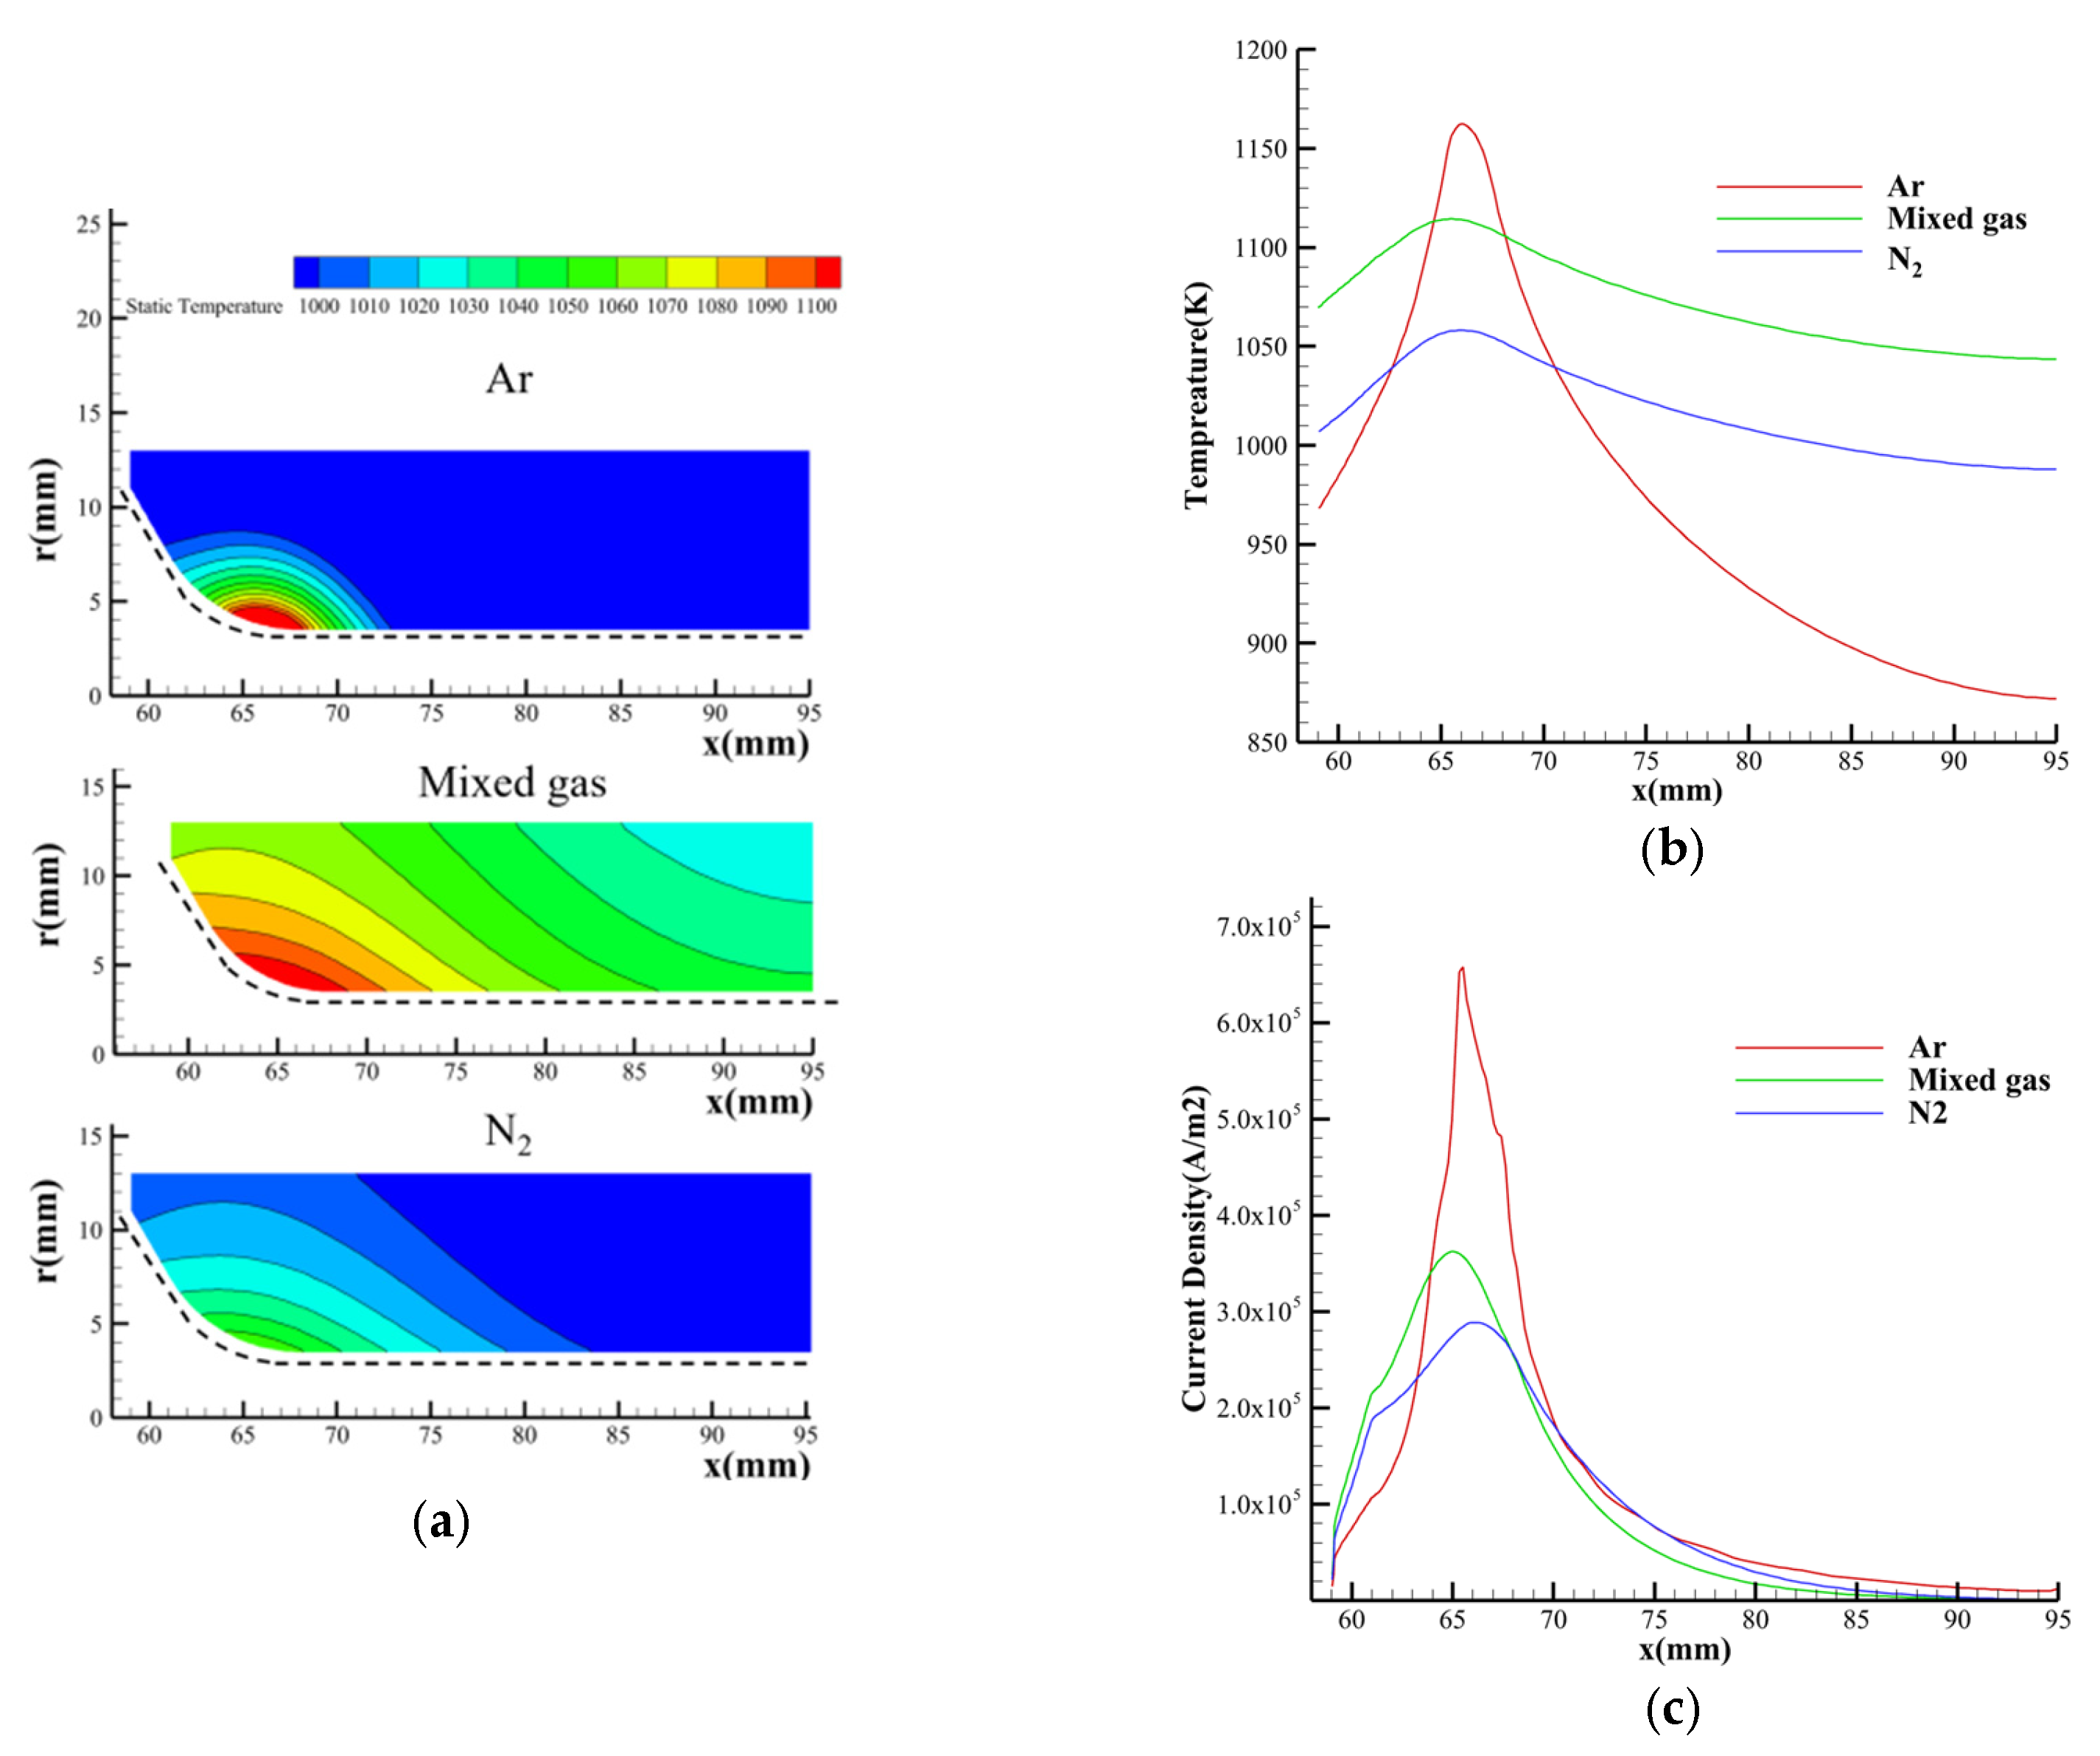
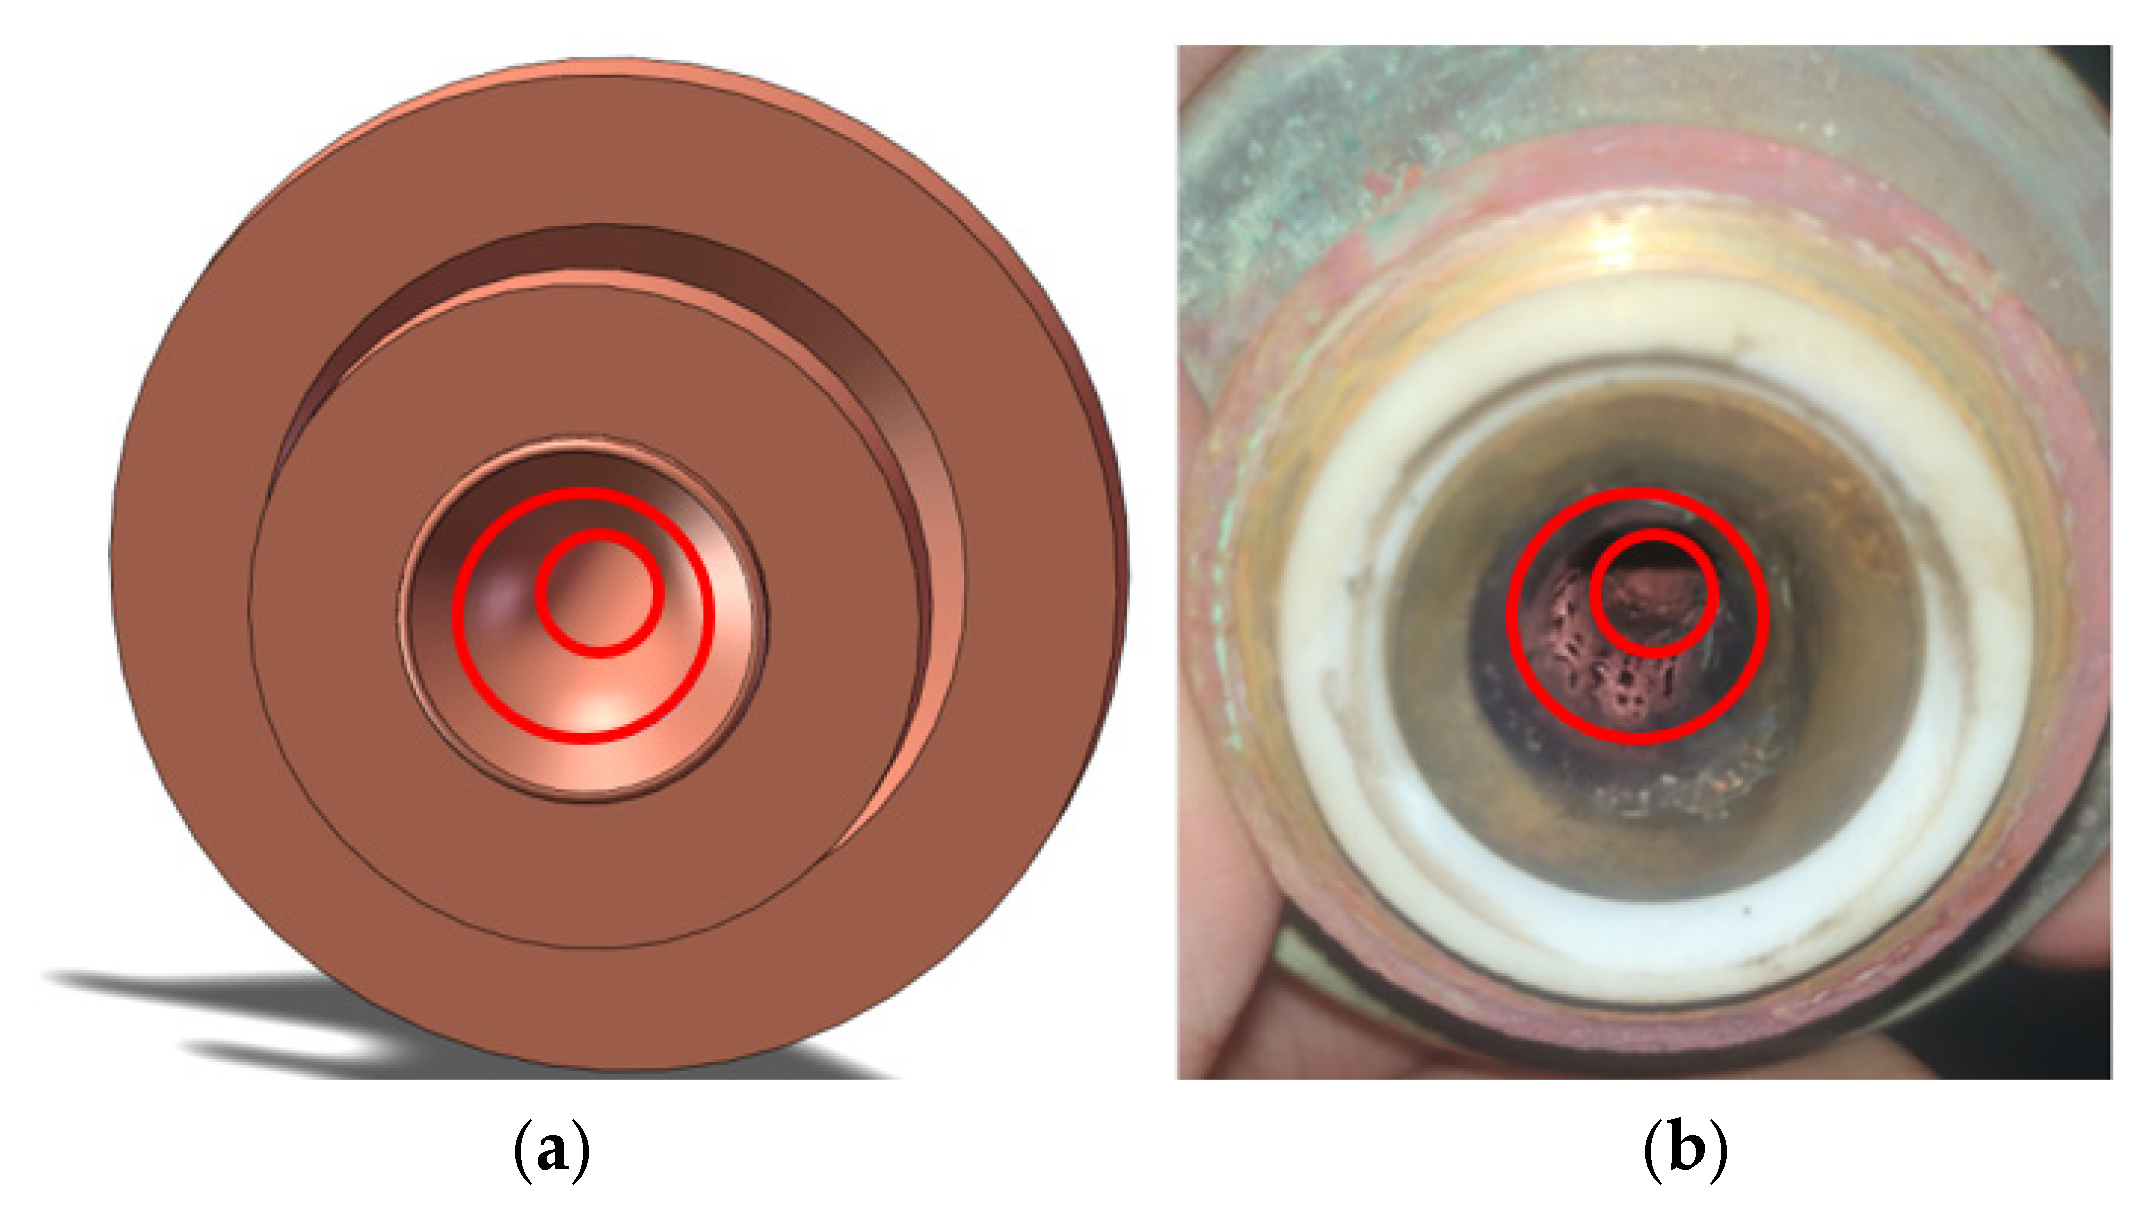
4.1.1. Results in the Near-Anode Region

With an arc current of 90 A, a gas flow rate of 9 L/min, and specified boundary conditions, the temperature and current density distributions along the dummy line on the inner surface of the anode (as shown in Figure 7a) with different gas compositions are shown in Figure 7b and Figure 7c, respectively. It should be noted that the rotation of the anode arc attachment would not be considered in the following discussion due to the limitations of a 2D numerical model.
From Figure 7a, the highest temperatures of the anode with different gas compositions are mostly located at the corner of the anode, and the anode working with pure argon has the most concentrated temperature distribution and highest temperature. According to the principle of minimum voltage and the interaction of the electromagnetic force and the aerodynamic force acting on the anode arc attachment, the anode arc attachment can always be located at the corner area of the anode, causing the highest temperature near the corner of the anode. Then, the corresponding temperature distributions along the specified dummy line of the anode are shown in Figure 7b. Moreover, with the highest temperature near the corner of the anode, the corner area of the anode could be eroded frequently, which has been verified by the experimental anode shown in Figure 8. In addition, when the temperature is lower than 10,000 K, the corresponding thermal conductivity of pure nitrogen is much higher than that of pure argon. With a much lower thermal conductivity of pure argon when pure argon is used, the temperature near the anode arc attachment can be much higher than that when pure nitrogen is used, caused by the lower heat loss transferred to the chamber. Hence, the temperature distributions shown in Figure 7b are obtained, which are also discussed in detail in the following section.
In Figure 7c, the anode current density of the pure argon presents a sharp shape, and it is much higher than that of pure nitrogen and mixed gas. As discussed in the above section, according to Figure 7a, when pure argon is used, there is a more concentrated anode arc attachment than when pure nitrogen is used, resulting in the highest anode current density. Considering the interaction of the mixture comprising nitrogen and argon, the anode current density distribution of the mixed gas can be obtained. Hence, the anode current density of the different gas compositions will be presented as shown in Figure 7c.

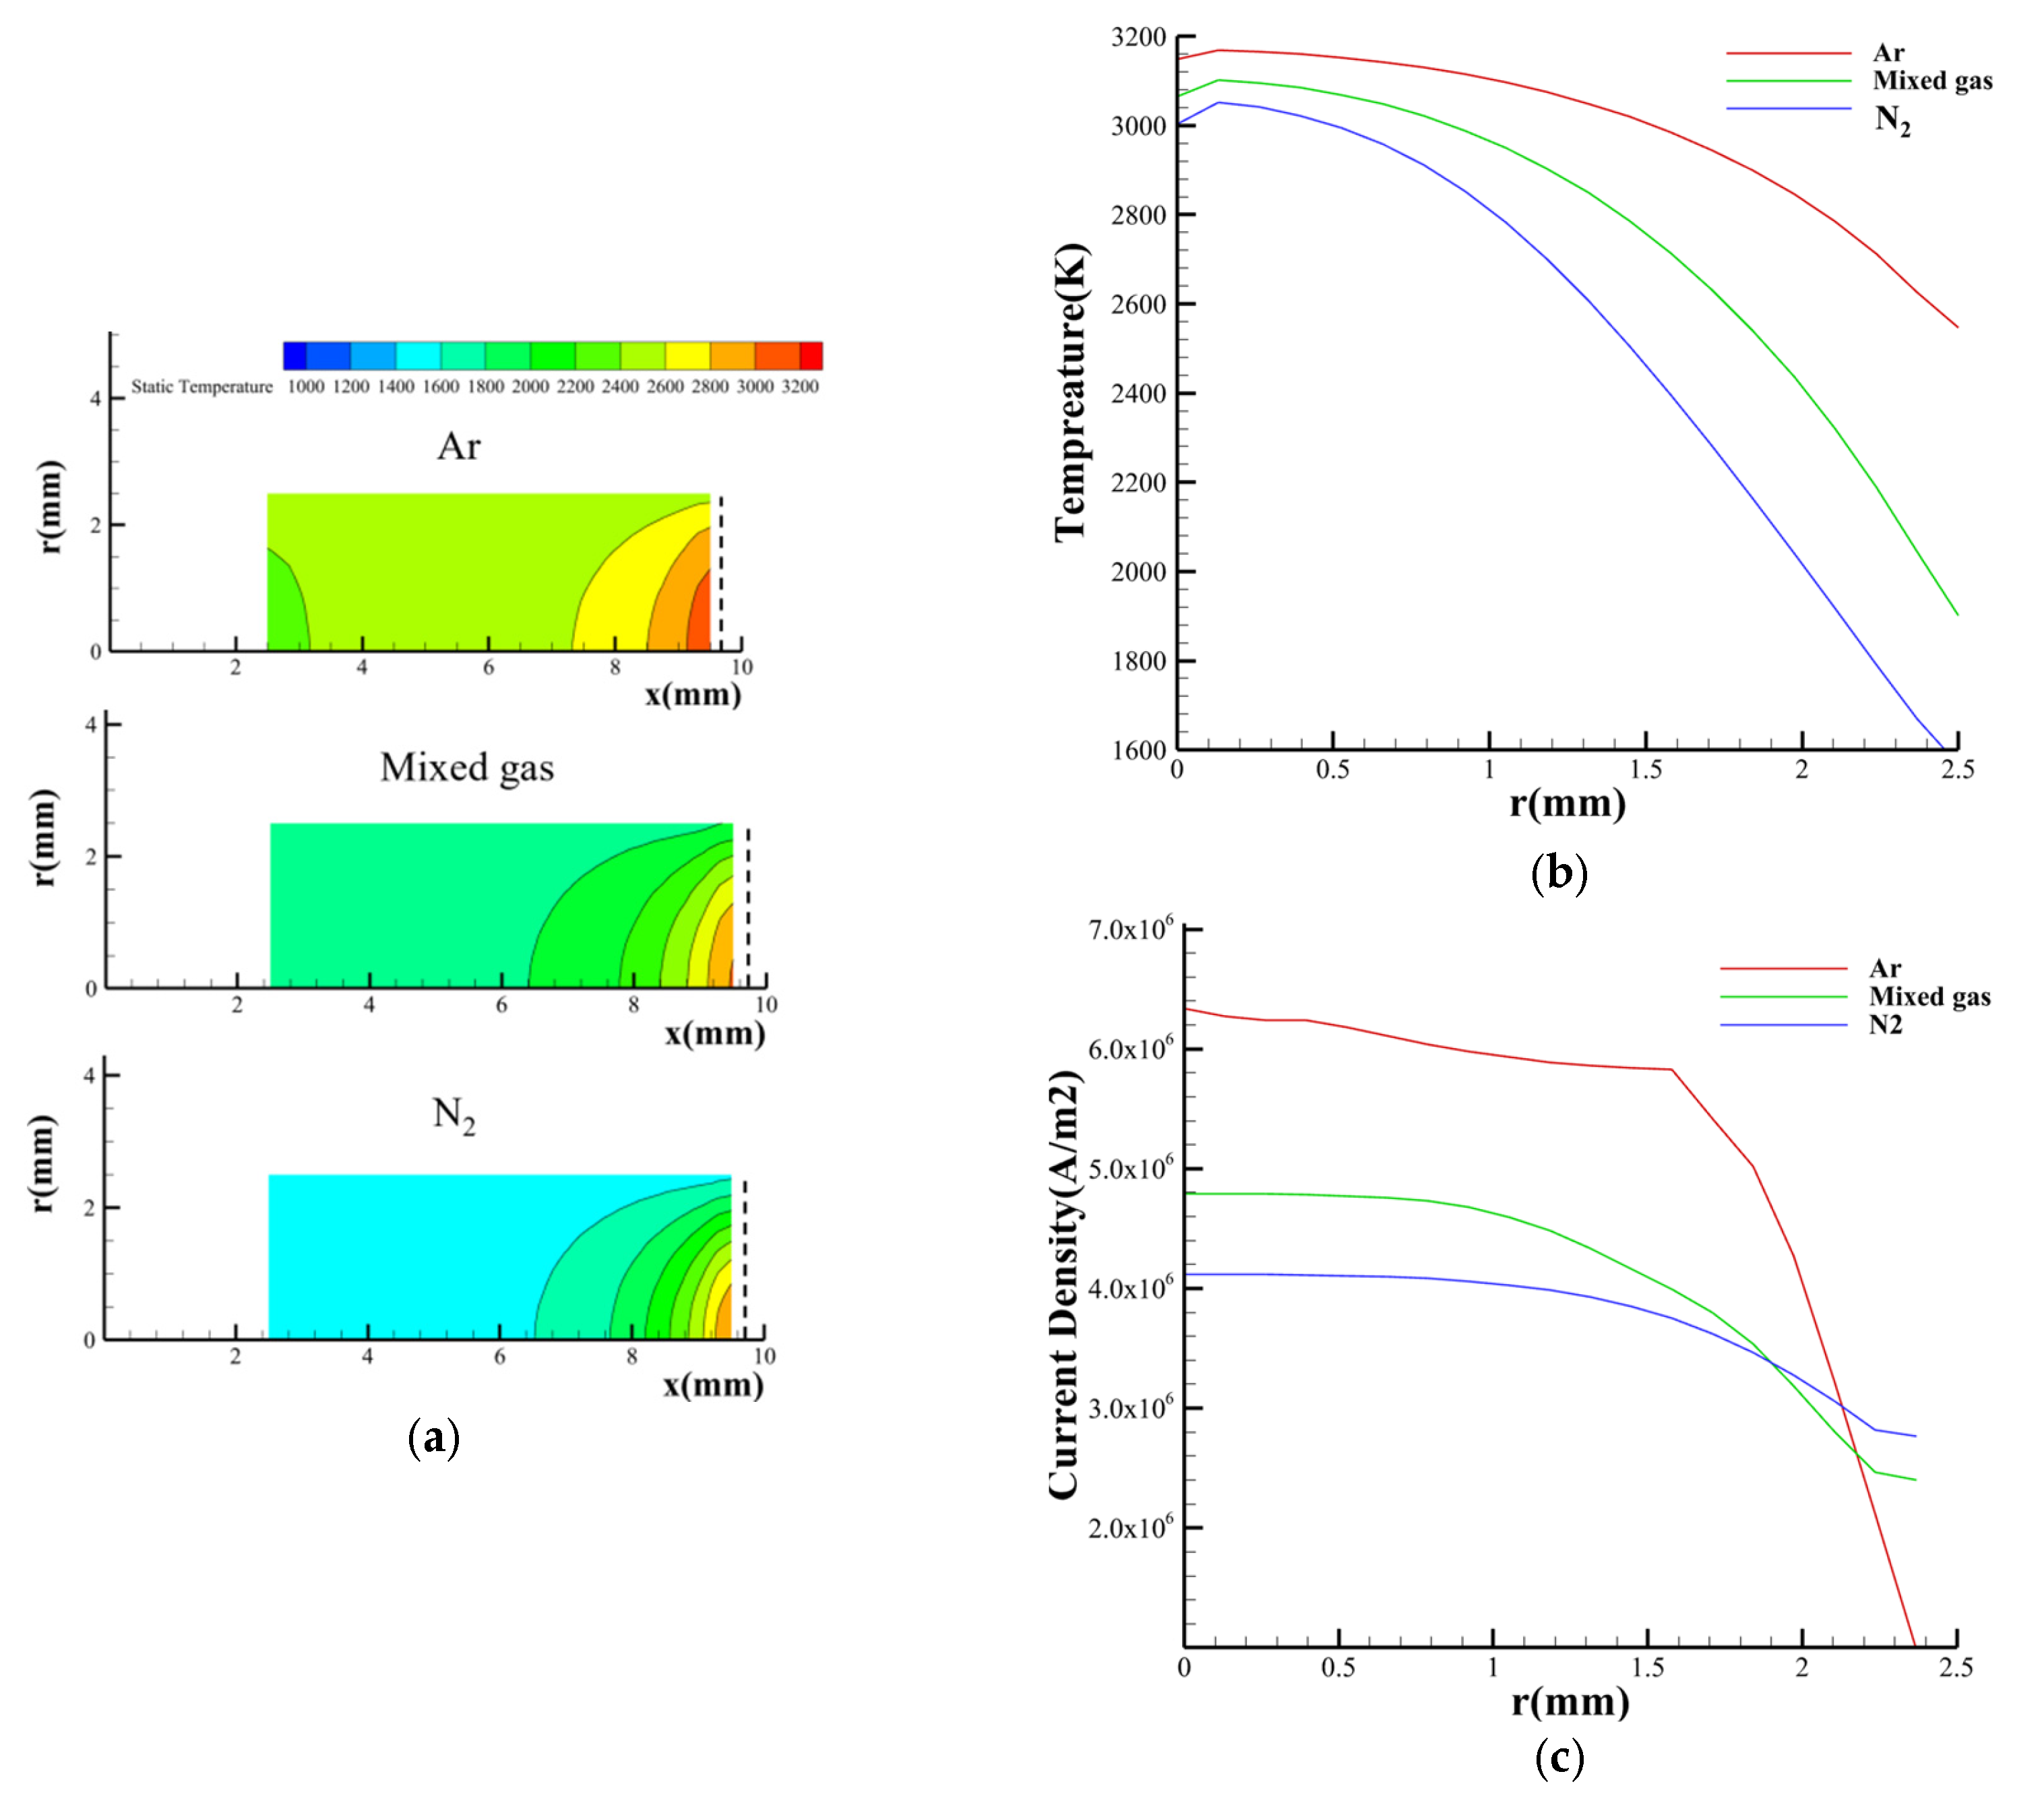
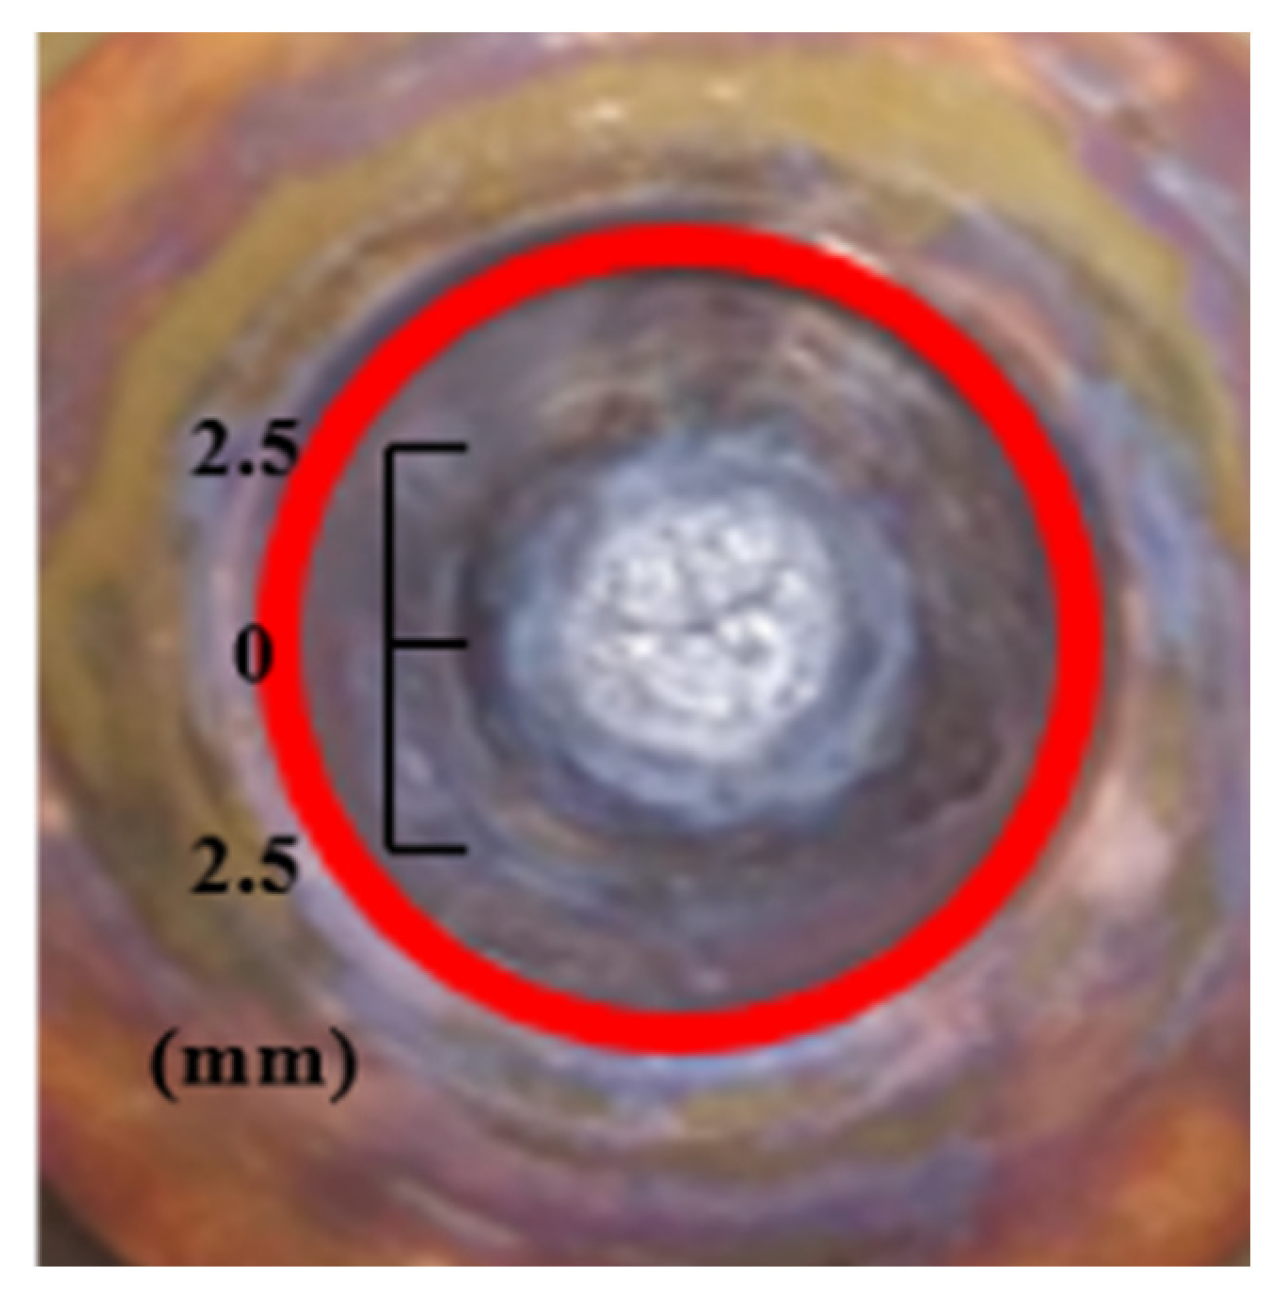
4.1.2. Results in the Near-Cathode Region

Correspondingly, the temperature and current density distributions along the dummy line on the surface of the cathode are shown in Figure 9. According to Figure 9a,b, the temperature of the cathode is much higher than that of the anode, and the cathode temperature of the pure argon is also the highest temperature. Concentrated by the working gas, the cathode arc attachment is fixed on the center area of the cathode. Further, due to the button-shaped cathode, the tungsten of the cathode is cooled indirectly through the cooper sheath, cooled by the cooling water, which can result in a decrease in temperature with an increase in the radius. Consequently, the low thermal conductivity of the tungsten and the high temperature of the cathode arc attachment will result in the high center temperature of the cathode. In addition, as per the discussion regarding the anode in Section 4.1.1, the temperature distribution along the dummy line on the surface of the cathode, shown in Figure 9b, can be obtained, which is in accordance with the erosion trace of the cathode used in the experiments, as shown in Figure 10.
In Figure 9c, the current density distributions of the cathode present a similar tendency to that of the anode, which is discussed in Section 4.1.1.

4.2. Temperature Distributions

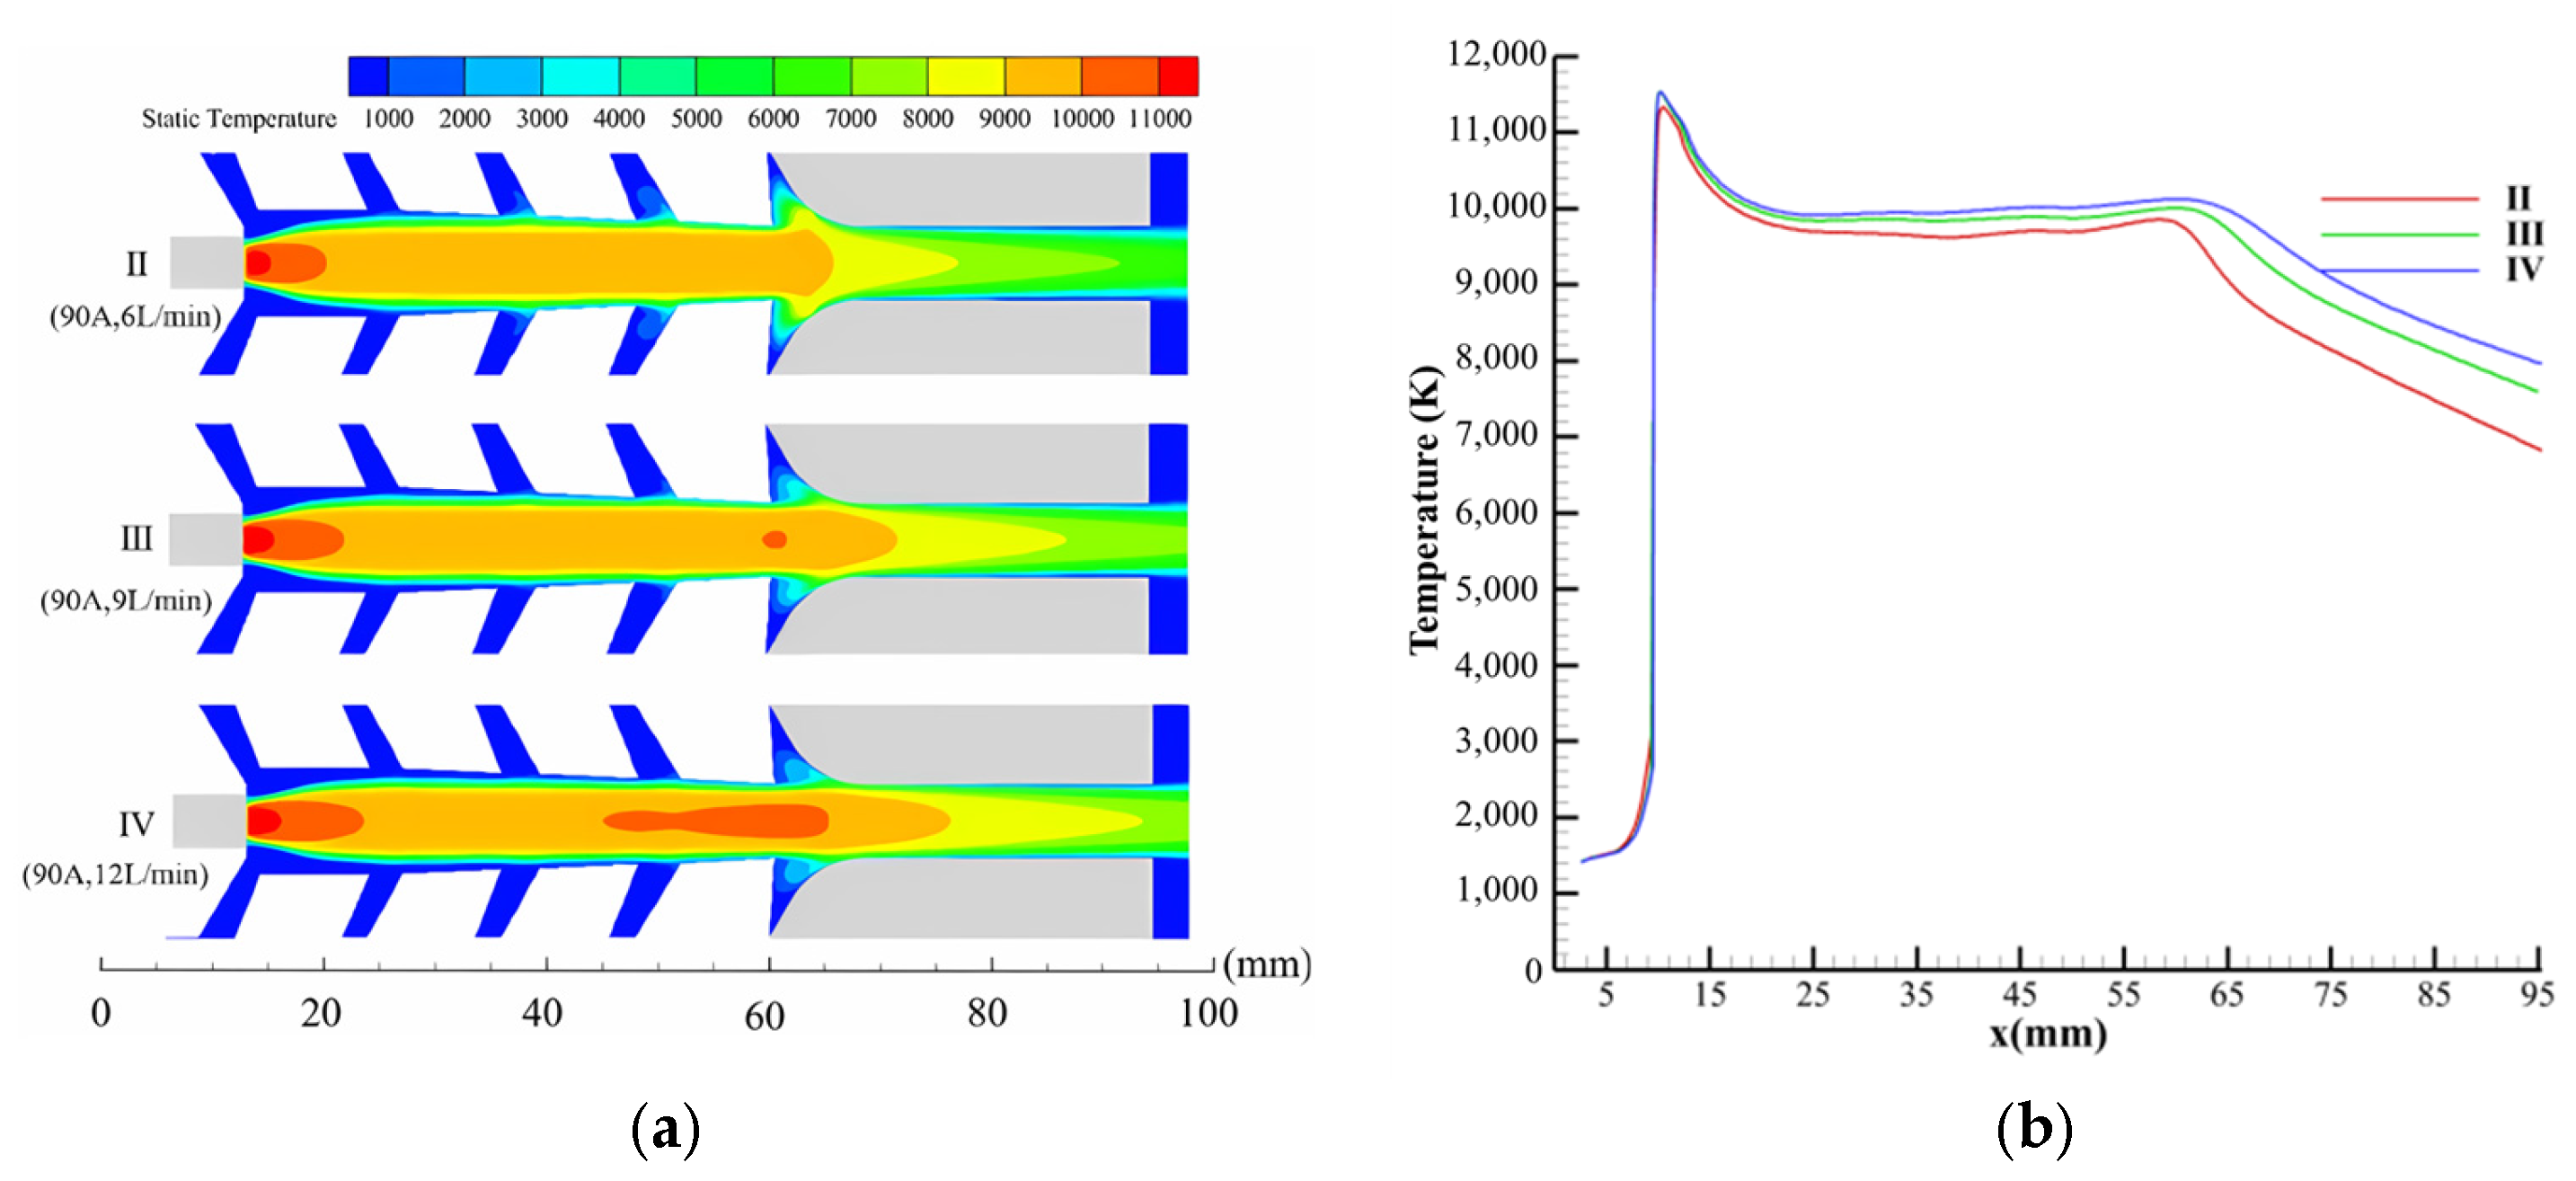
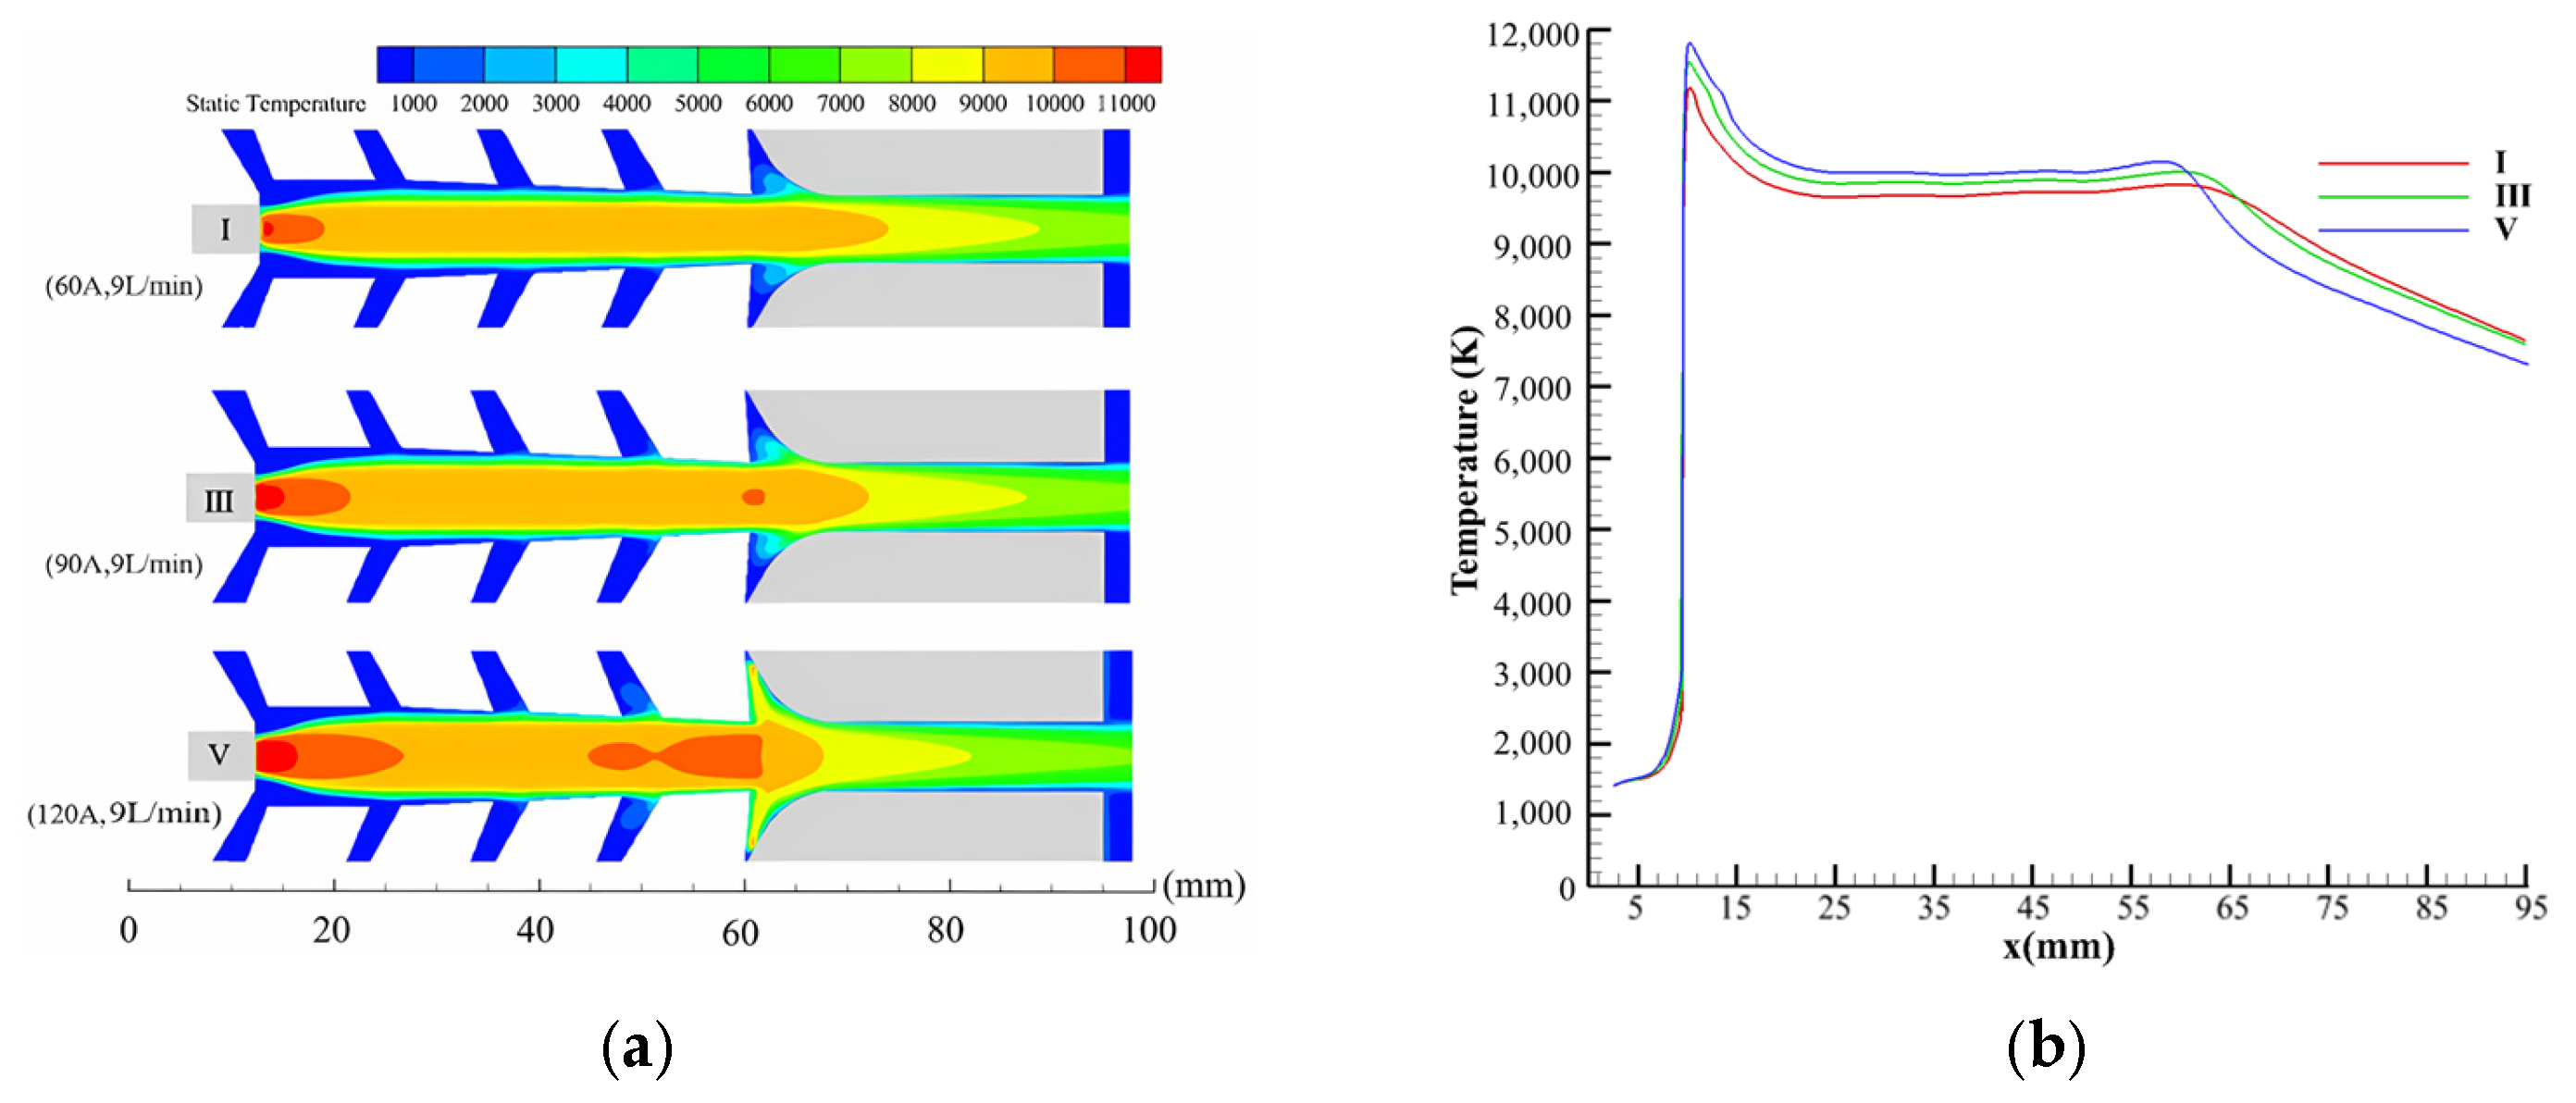
4.2.1. Temperature Distributions by Using Pure Nitrogen

When pure nitrogen is used as the working gas, the temperature distributions inside the laminar plasma torch with different gas flow rates at an arc current of 90 A are shown in Figure 11. From it, by increasing the gas flow rate, the area of high-temperature increases, and the high-temperature area moves away from the cathode slightly. By increasing the gas flow rate, the aerodynamic force increases, resulting in an increase in the thickness of the cool layer near the chamber wall. With an increase in the cool layer, the plasma arc is constricted more strictly, resulting in a slight decrease in the arc-section area. Similarly, with an increase in the aerodynamic force, the anode arc attachment moves slightly away from the cathode under the interaction of aerodynamic force and electromagnetic force. Then, according to Figure 1, the length of the plasma arc increases slightly. With a decrease in the arc-section area and an increase in the area length, the working power of the plasma arc increases, resulting in a slight increase in the arc temperature. This phenomenon is in accordance with the previous experimental studies [10,18]. In addition, due to the stricter constriction of the working gas on the plasma arc and the increased working power of the plasma arc, the axial temperature of the plasma arc also increases slightly with the increase in the gas flow rate, as shown in Figure 11b.
When pure nitrogen is used as the working gas, the temperature distributions inside the laminar plasma torch with different arc currents at a gas flow rate of 9 SLM occur, as shown in Figure 12. From it, with an increase in the arc current, the temperature and the sectional area of the arc column increase obviously. By increasing the arc current, more energy is used to ionize the working gas, resulting in an increase in the electric ions concentration. Hence, the increased electric ions concentration results in an increase in the arc total energy. Thereby, the arc temperature increases slightly with an increase in the arc current, which is in accordance with the previous studies [5,18]. Similarly, the increased electric ions concentration and the arc total energy also lead to an increase in the axial temperature with an increase in the arc current, which is shown in Figure 12b.

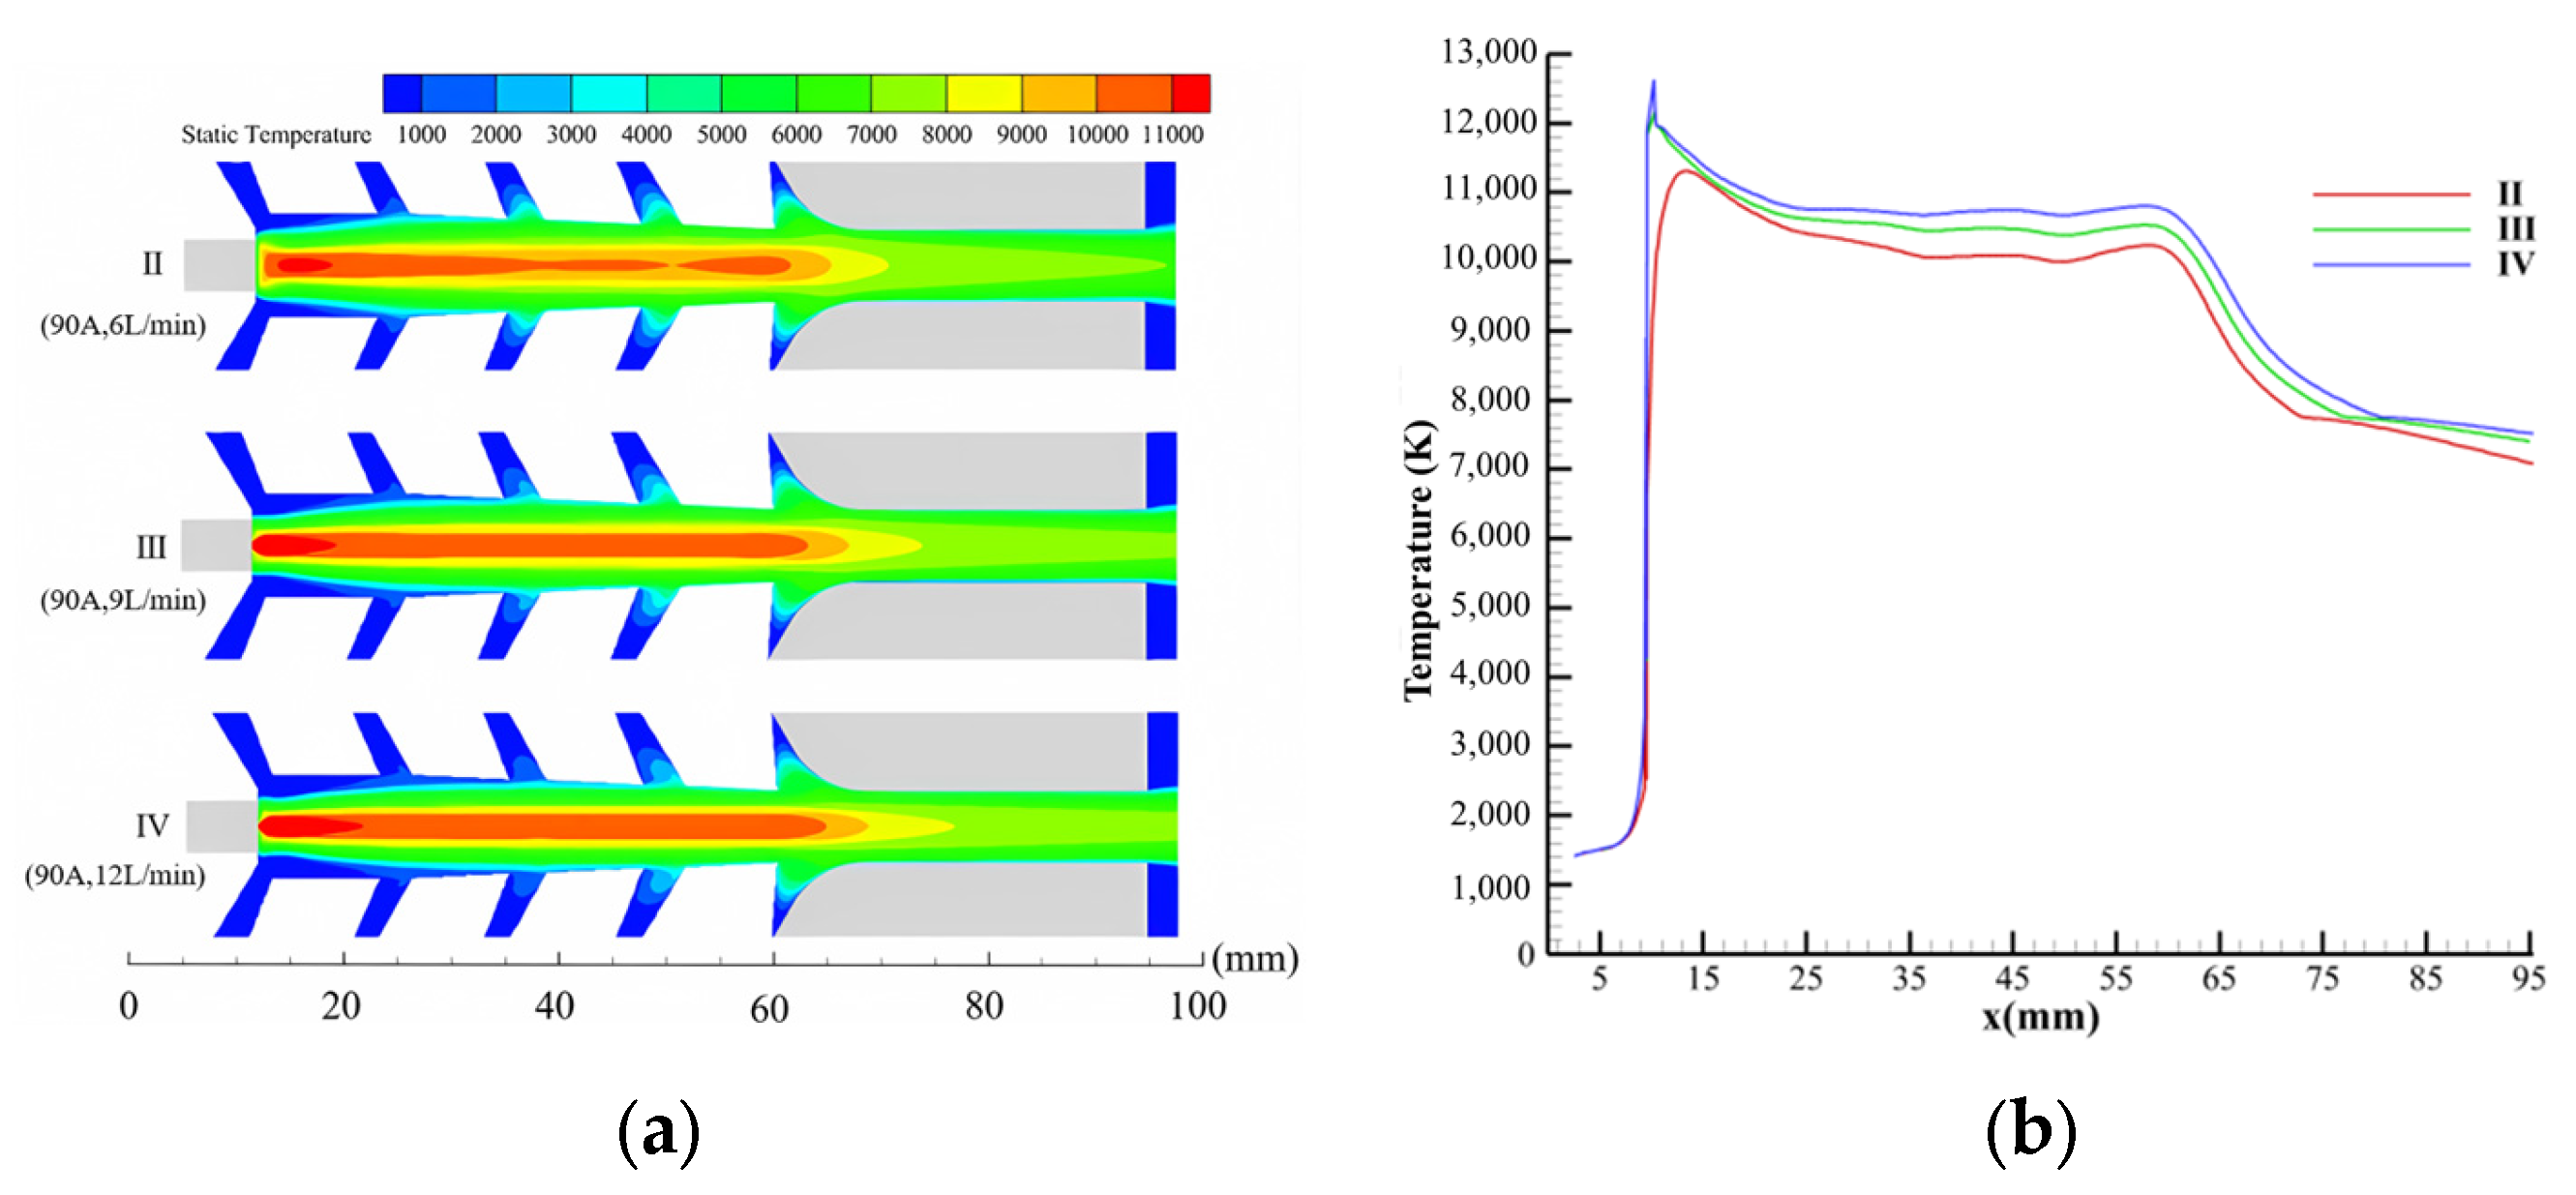
4.2.2. Temperature Distributions by Using Pure Argon

When pure argon is used as a working gas, the temperature distributions inside the laminar plasma torch with different gas flow rates occur, as shown in Figure 13. From it, as is the same as pure nitrogen, by increasing the gas flow rate, the area of high-temperature increases, and the high-temperature area moves away from the cathode slightly, which has been discussed in detail in Section 4.2.1.
When pure argon is used as a working gas, the temperature distributions inside the laminar plasma torch with different arc currents occur, as shown in Figure 14. From it, by increasing the arc current, the arc sectional area increases while the arc length decreases slightly. Moreover, the high-temperature area near the cathode and anode increases with the arc current. With an increase in the arc current, the energy used to ionize the working gas and the electromagnetic force imposed on the anode arc attachment increase slightly. The increase in the internal arc energy results in an increase in the arc temperature and the arc sectional area. At the same time, forced by the increased electromagnetic force, the anode arc attachment moves slightly close to the cathode under the interaction of aerodynamic force and electromagnetic force. Moreover, in the near regions of the cathode and anode, an increase in the arc current leads to an increased arc density of the arc attachments, resulting in the increased temperature of the arc attachment area, hence the increased arc temperature area near the cathode and anode.
In addition, as shown in Figure 14b, compared with pure nitrogen, the axial temperature in the anode area presents a contrary tendency when pure argon is used. Discussing the arc length, the anode arc attachment moves close to the cathode with an increase in the arc current. With the movement of the anode arc attachment, the cooled length of the plasma jet in the anode increases, resulting in a decrease in the plasma jet. Hence, the axial temperature in the anode area decreases with an increase in the arc current.

4.2.3. Temperature Distributions by Using 50%Ar + 50%N2.

When the mixed gas (50%Ar + 50%N2) is used, the temperature distributions inside the laminar plasma torch with different working conditions occur and are shown in Figure 15 and Figure 16, respectively. From them, when the mixed gas is used, the temperature distributions inside the laminar plasma torch under various working conditions are in accordance with the tendencies when pure nitrogen is used as a working gas, which has been discussed in detail in Section 4.2.1. Compared with the monatomic gas Ar, it is more difficult to ionize the diatomic gas N2, indicating that the diatomic gas N2 has a more prominent effect on the arc characteristics caused by the dissociation reaction of N2. Thereby, when the mixed gas is used, the total characteristics of the plasma arc are mostly decided by the characteristics of the diatomic gas N2.

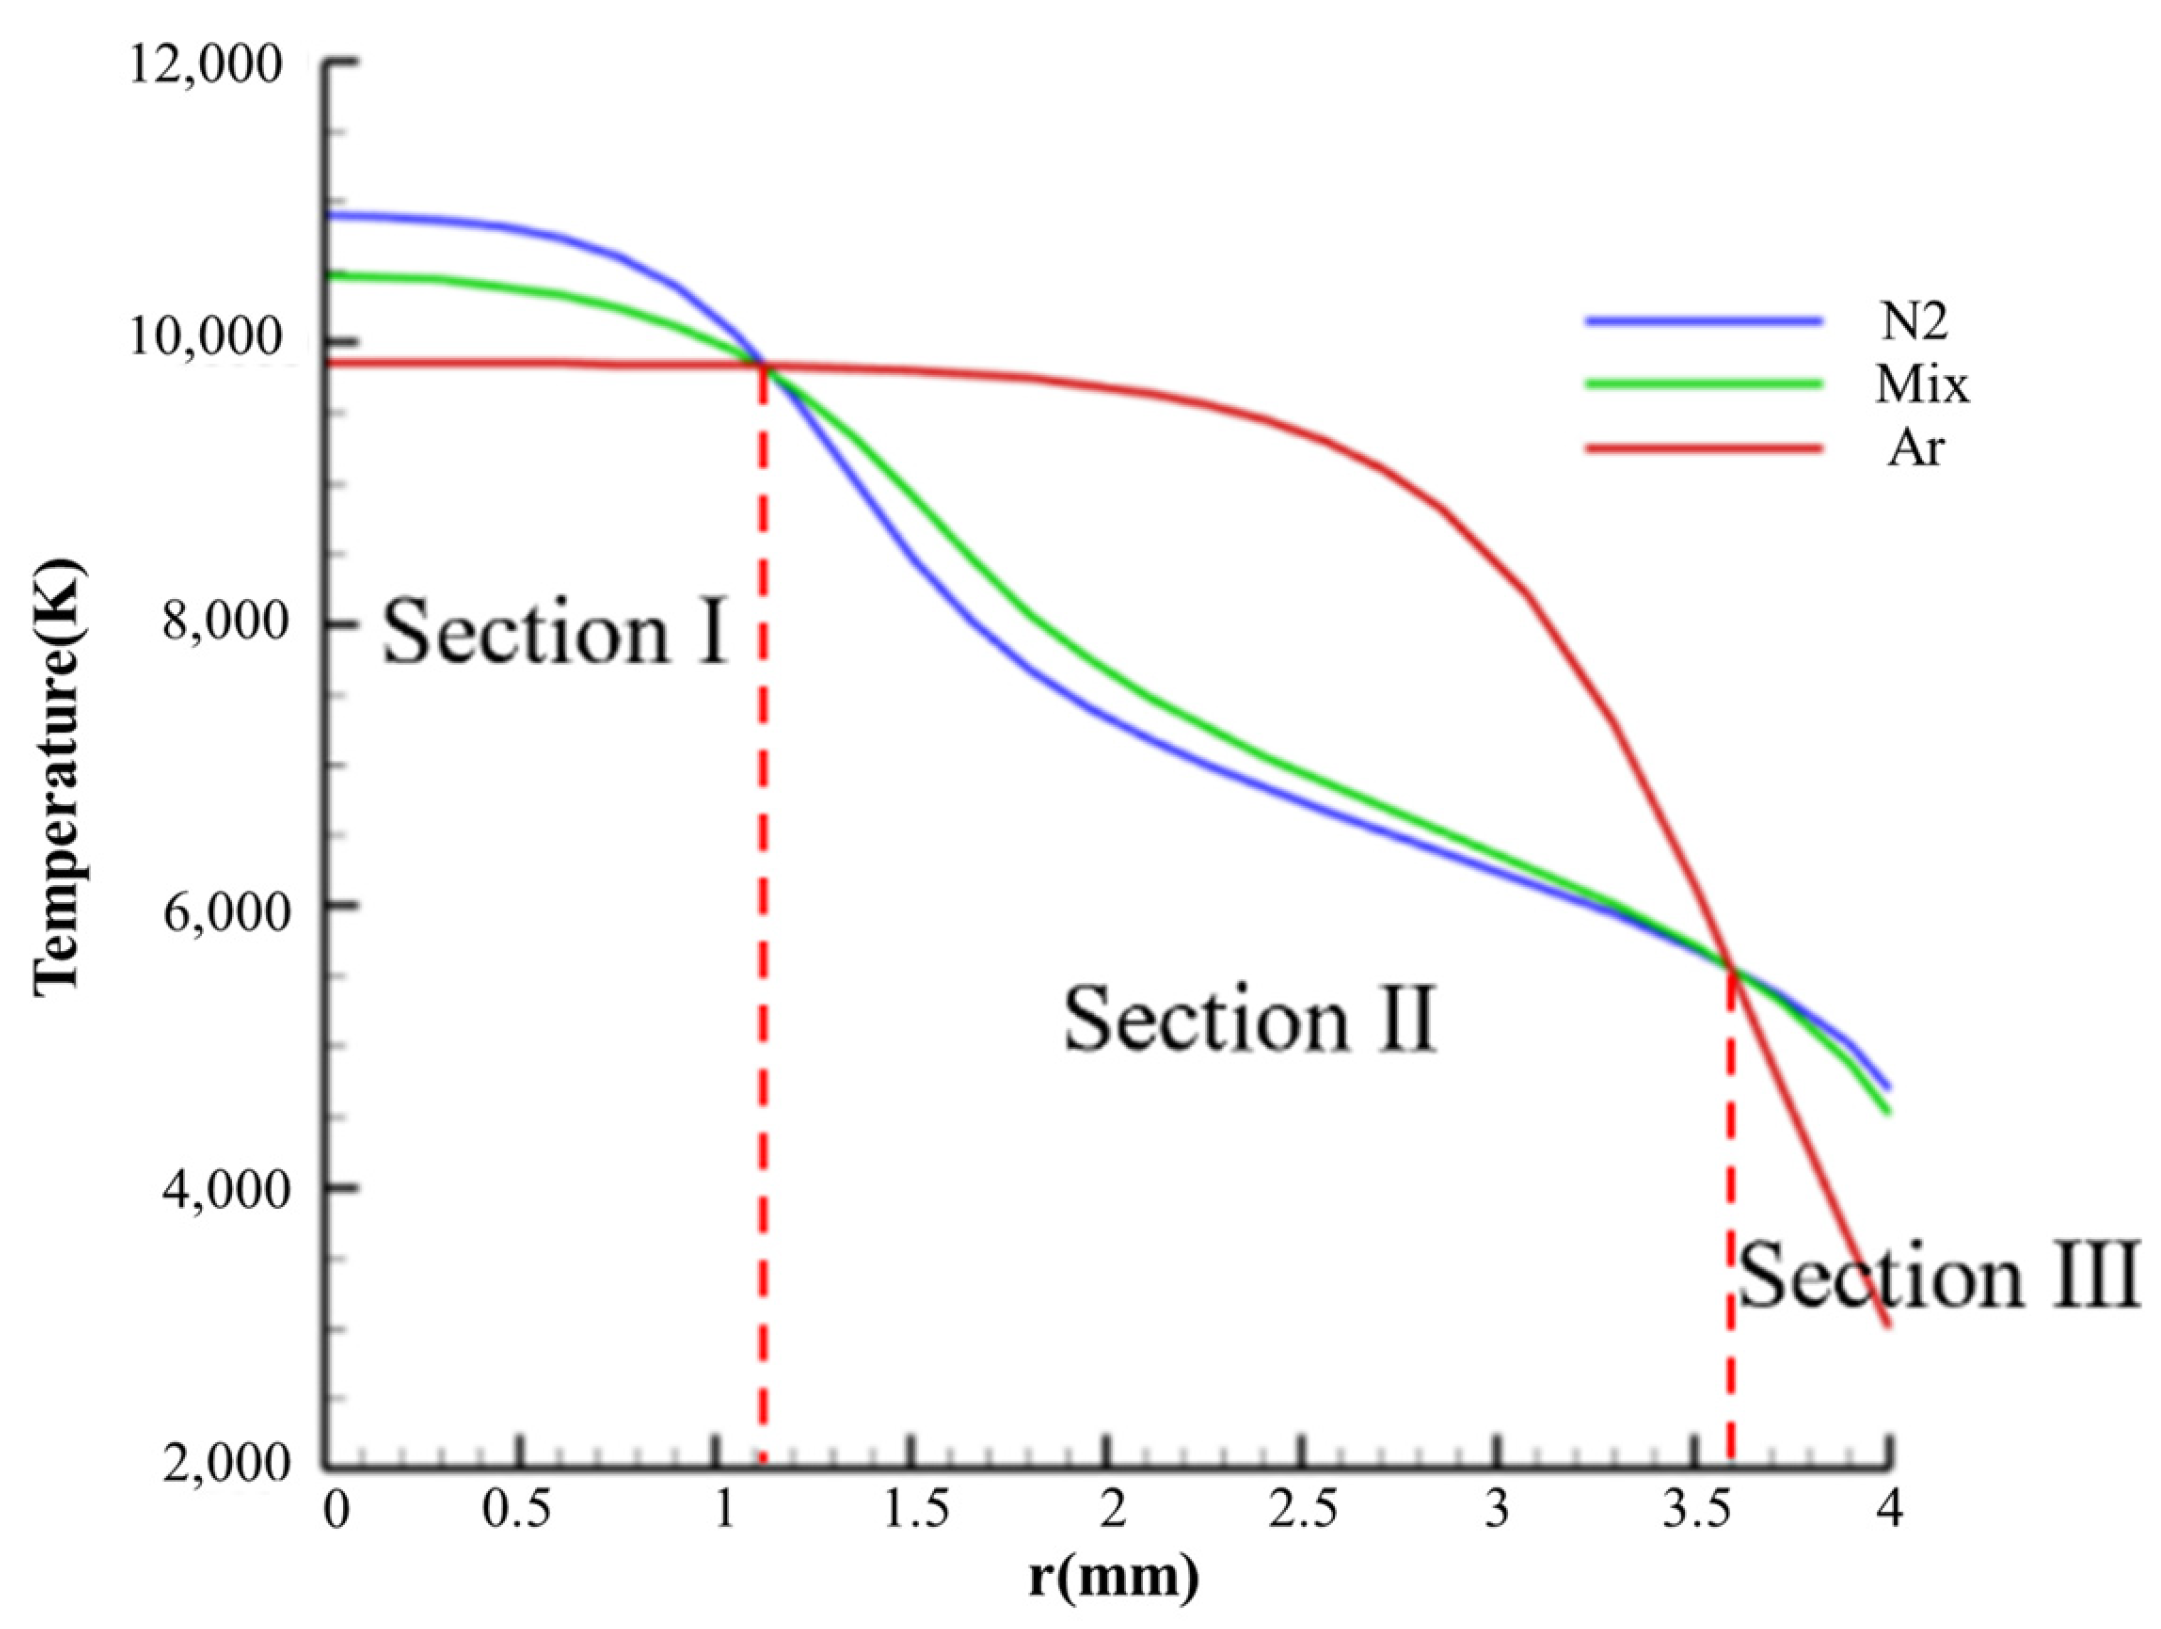
4.2.4. Comparison Analysis of Different Gas Compositions

For a clearer contrast, the axial temperature distributions inside the laminar plasma torch with different gas compositions at I = 90 A and Qin = 9 SLM are shown in Figure 17. From it, the axial temperature distributions with different gas compositions present a similar tendency on the whole. It can be divided into three sections of the axial temperature distributions along the axis as follows: peak temperature area (PA: 10 mm < x < 20 mm), stable temperature area (SA: 20 mm < x < 62 mm), and decreased temperature area (DA: 62 mm < x < 95 mm).
In the peak temperature area, the temperature increases sharply to a certain level and then decreases slightly, which should be caused by the violent collision of electrons near the cathode region. In the near region of the cathode, under the effect of the high-density cathode’s drop voltage, the working gas is ionized quickly, resulting in a sharp increase in the arc temperature. Then, with an increase in the distance away from the cathode, the voltage drop rate decreases, indicating that the transfer rate of the energy transferred to the plasma arc decreases. With a decrease in the energy transfer rate, the arc temperature decreases under the cooling effect of the cool water. Thereby, the arc temperature presents the mentioned tendency in the peak temperature area.
In the stable temperature area, as mentioned in the peak temperature, the energy transfer rate decreases to an almost constant level. The energy transferred to the plasma arc is nearly equal to the heat transferred from the plasma arc to the arc chamber, which is taken away by the cooling water. Due to the thermal equilibrium of the plasma arc, the arc temperature varies little. Thus, a nearly constant temperature area is observed. In addition, in the temperature constant area, the arc temperature of pure nitrogen is the highest, followed by that of mixed gas. With a higher ionization energy of pure nitrogen (15.6 [eV]) than that of pure argon (13.6 [eV]), more energy is transferred to the plasma arc to ionize the working gas, resulting in a higher arc temperature of pure nitrogen. Thus, the proposed tendency is observed.
In the decreased temperature area, due to the anode arc attachment attaching near the inner surface of the anode, the plasma arc disappears. With the disappearance of the plasma arc, the plasma flow cannot be heated by the plasma arc. However, the plasma flow from the anode arc attachment to the outlet of the plasma torch is still being cooled by the cooling water flowing through the anode. Hence, the axial temperature decreases. Moreover, when the temperature is lower than 10,000 K, the thermal conductivity of pure nitrogen is much higher than that of pure argon. With a higher thermal conductivity, more heat energy is transferred from the plasma flow to the chamber wall, resulting in a sharper decrease in the central temperature of the plasma flow. Thus, the axial temperature of the plasma flow decreases most sharply when pure nitrogen is used in the temperature decrease area, followed by when mixed gas is used.
The radial temperature distributions at an axial position of 40 mm inside the laminar plasma torch with different working gases are shown in Figure 18. From it, the radial temperature decreases from the center to the chamber wall with different decrease ratios. The radial temperature of pure argon decreases slightly from the center to the radius of about 2.5 mm, then decreases sharply to about 3000 K near the chamber wall. Meanwhile, the radial temperatures of pure nitrogen and 50%Ar + 50%N2 decrease smoothly to about 5000 K. As shown in Figure 1, due to the dissociation reaction, pure nitrogen has a higher specific heat and thermal conductivity than pure argon when the temperature is lower than 20,000 K. Moreover, the specific heat and thermal conductivity of pure nitrogen occur at a peak value at a temperature of about 7500 K. In addition, as mentioned in the above section, the pure nitrogen has higher ionization energy than that of pure argon. Due to a higher specific heat and ionization energy of pure nitrogen, the pure nitrogen is more difficult to ionize, resulting in a lower electric ions concentration, which could lead to a lower arc sectional area. Thus, the high-temperature area of pure nitrogen and 50%Ar + 50%N2 is lower than that of pure argon, while the center temperature of pure nitrogen and 50%Ar + 50%N2 is much higher. Further, under the cooling effect of the arc chamber, cooled by cold water, a part of the energy of the plasma arc is transferred to the cooling water, resulting in a decrease in the radial temperature of the plasma flow. Thus, the radial temperature of the plasma flow decreases with the increasing radius. Moreover, with a larger high-temperature area of pure argon, the thickness of the cool layer becomes smaller, resulting in a sharper decrease in the radial temperature of pure argon.
In addition, with the higher ionization energy of pure nitrogen, the ionized temperature of pure nitrogen is higher than that of pure argon, resulting in the highest arc temperature of pure nitrogen, followed by that of mixed gas, as shown in Figure 18 in the section I area. Then, with an increase in the radius, the arc temperature decreases in the section II area, as shown in Figure 18. With a decrease in the arc temperature, the concentration of the ionized nitrogen decreases while that of ionized argon changes little, resulting in a lower decrease in the arc temperature when the mixed gas is used than when pure nitrogen is used. Hence, the total arc temperature of the mixed gas is slightly higher than that of pure nitrogen in section II. Moreover, with the highest ionized concentration of pure argon, the arc temperature of the pure argon is much higher than others. Thus, the radial temperature tendency in section II occurs. In section III, shown in Figure 18, according to our experimental results, the temperature of the arc chamber is much lower when pure argon is used. With a lower temperature of the arc chamber, the plasma flow is cooled more strictly, resulting in a lower temperature of the plasma flow in section III. Hence, the radial temperature tendency in section III occurs. In addition, the characteristics of pure nitrogen have a predominance effect when the temperature ranges from 5000 to 20,000 K. Thereby, the tendency of the mixed gas is similar to that of pure nitrogen. Finally, the temperature tendency shown in Figure 18 occurs.

4.3. Velocity Distributions

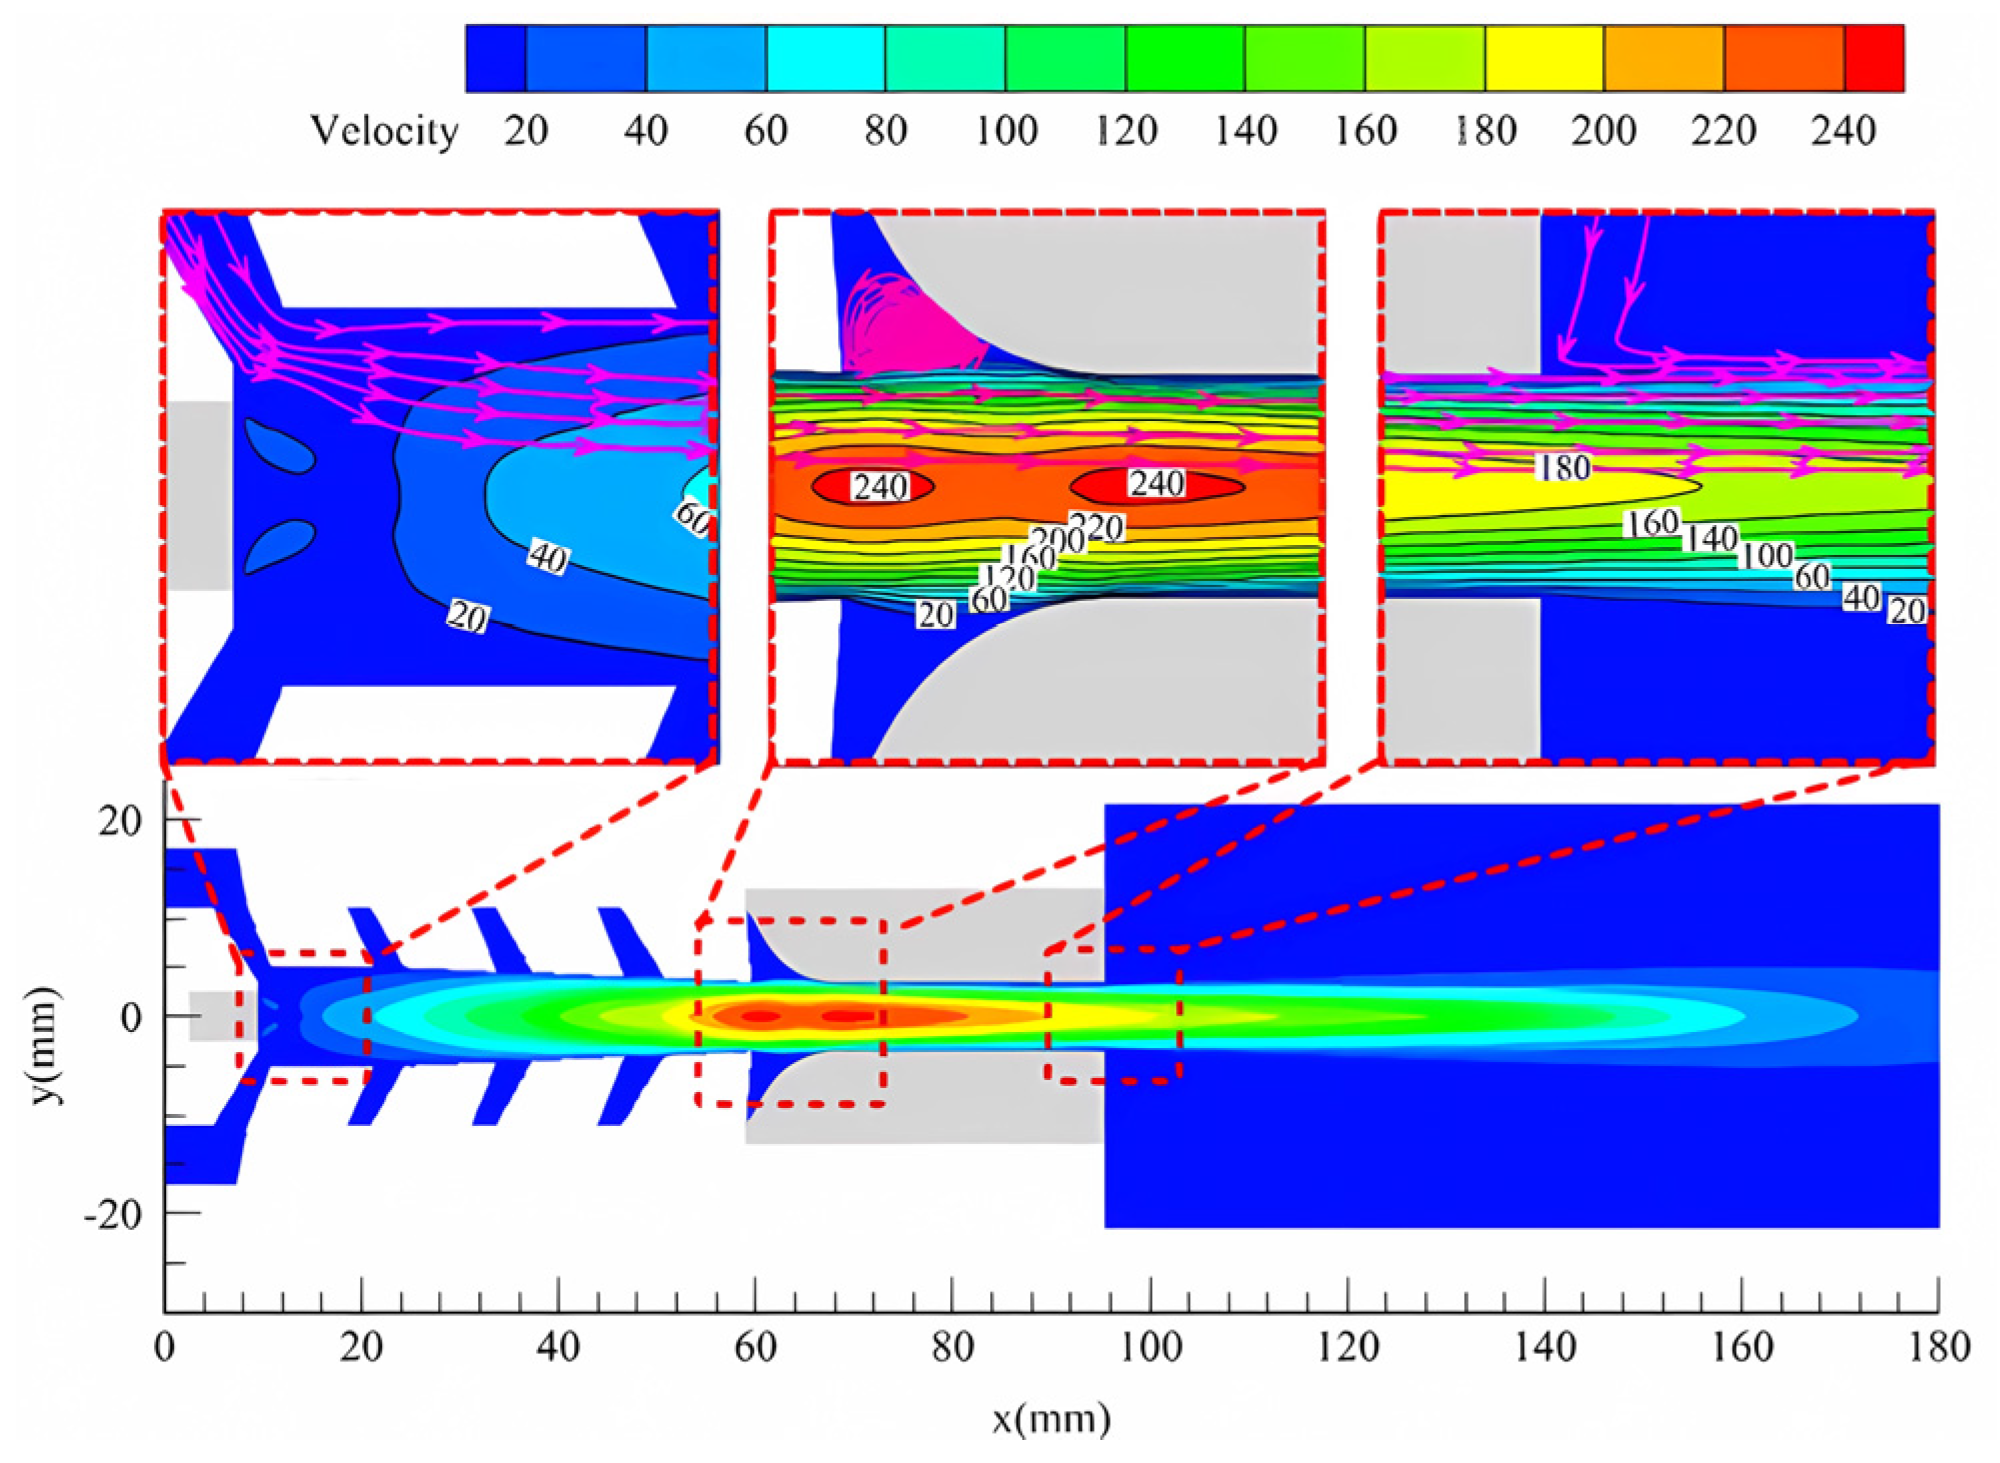
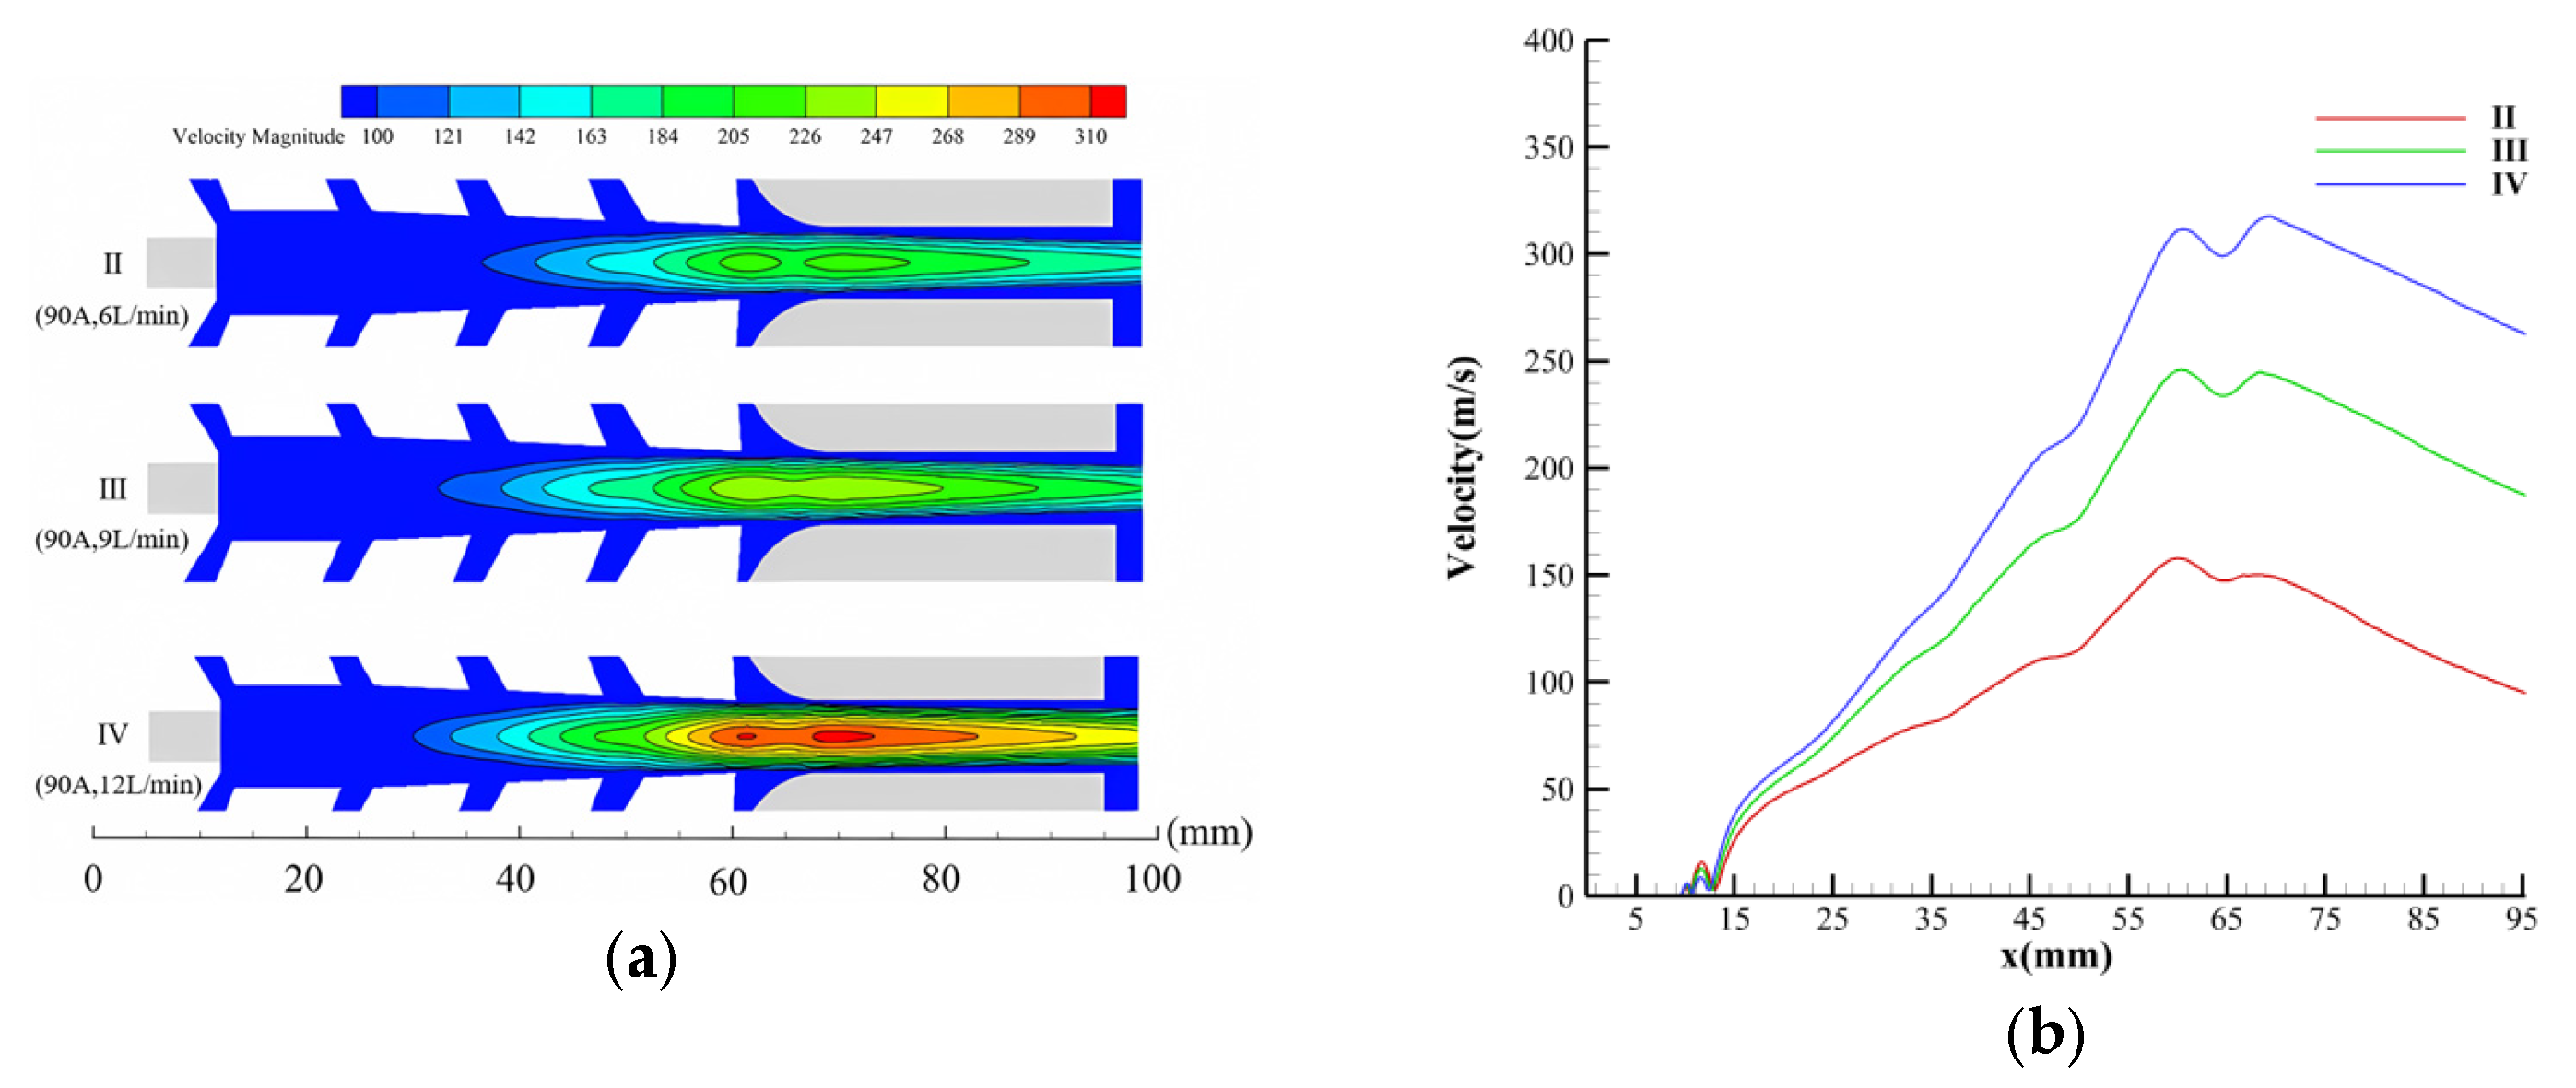
4.3.1. Velocity Distributions by Using Pure Nitrogen

The velocity distribution inside the laminar plasma torch working with pure nitrogen at an arc current of 90 A and gas flow rate of 9 L/min is shown in Figure 19. From it, due to the mechanical compression, self-magnetic compression and the Joule heating effect, the plasma flow is accelerated from the cathode to the anode. Under the interaction of the mentioned compressions, the velocity arrives at the highest level of 240 m/s near the anode arc attachment. Then, the plasma flow is cooled by the arc chamber, cooled by the cold water, resulting in a decreased plasma flow temperature. With a decreased temperature, the velocity decreases to about 180 m/s at the outlet of the anode. In addition, under the interaction of the Joule heating effect and cooling compression, two high-velocity areas have been observed, as seen in Figure 19.
The velocity distributions inside the laminar plasma torch with different gas flow rates are shown in Figure 20. From it, the velocity distributions are similar: two high-velocity areas occur near the anode arc attachment (60 mm < x < 70 mm), caused by the interaction of the Joule heating effect and cooling compression, which has been discussed in the above section. Moreover, by increasing the gas flow rate, the highest velocity increases from about 200 m/s to about 320 m/s when the gas flow rate increases from 6 slm to 12 slm. With an increase in the gas flow rate, more energy is transferred to the plasma flow, and the compression of the cool layer becomes more strict, resulting in an increase in the velocity.
In addition, from Figure 20b, the axial velocity increases to a certain level and then decreases mostly. It should be caused by the following reasons. From the cathode arc attachment to the anode arc attachment, the plasma flow is heated constantly by the plasma arc, and it is also compressed by the mechanical structure of the plasma torch—consequently, the axial velocity increases. When the plasma flow flows away from the anode arc attachment to the outlet, as discussed in the above section, the plasma flow is cooled by the arc chamber, resulting in a decrease in the axial velocity. Thereby, the tendency of the axial velocity shown in Figure 21b occurs.
The velocity distributions inside the laminar plasma torch with different arc currents are shown in Figure 21. From it, by increasing the arc current, the highest velocity increases from about 210 m/s to 270 m/s when the arc current increases from 60 A to 120 A. With an increase in the arc current, more energy is transferred to the plasma flow, resulting in an increase in the kinetic energy of the plasma flow and, thus, the velocity.

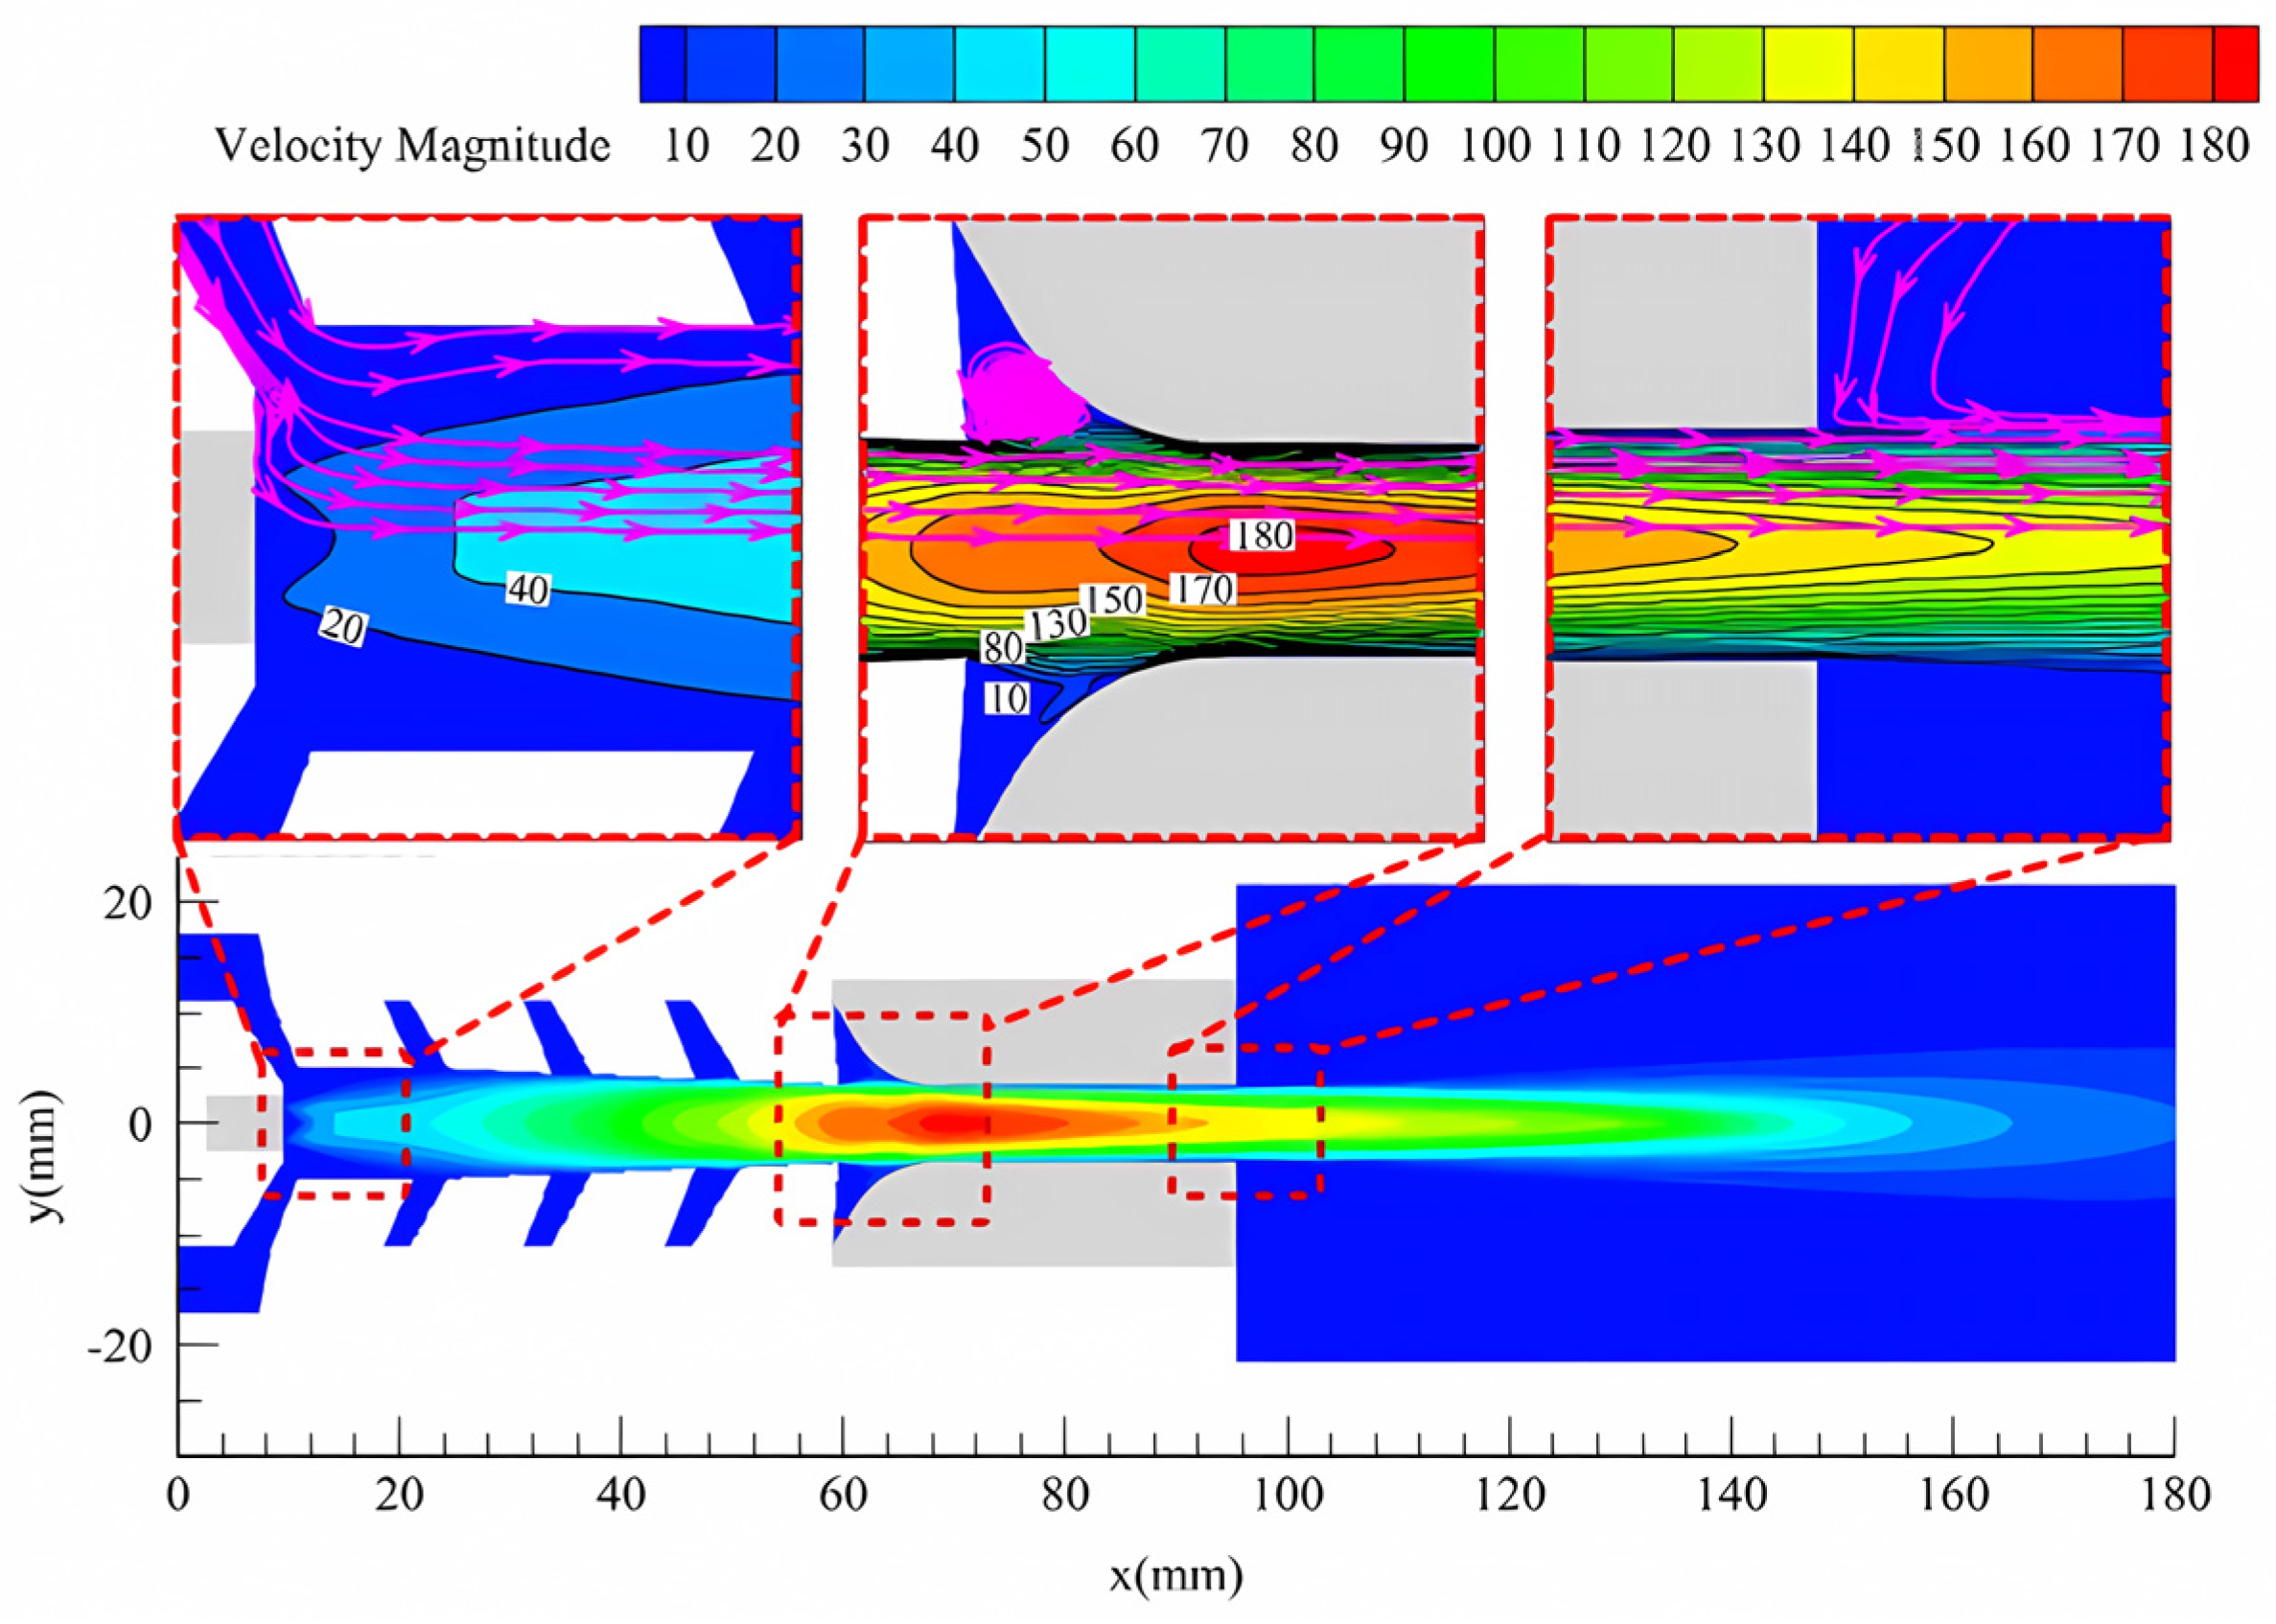
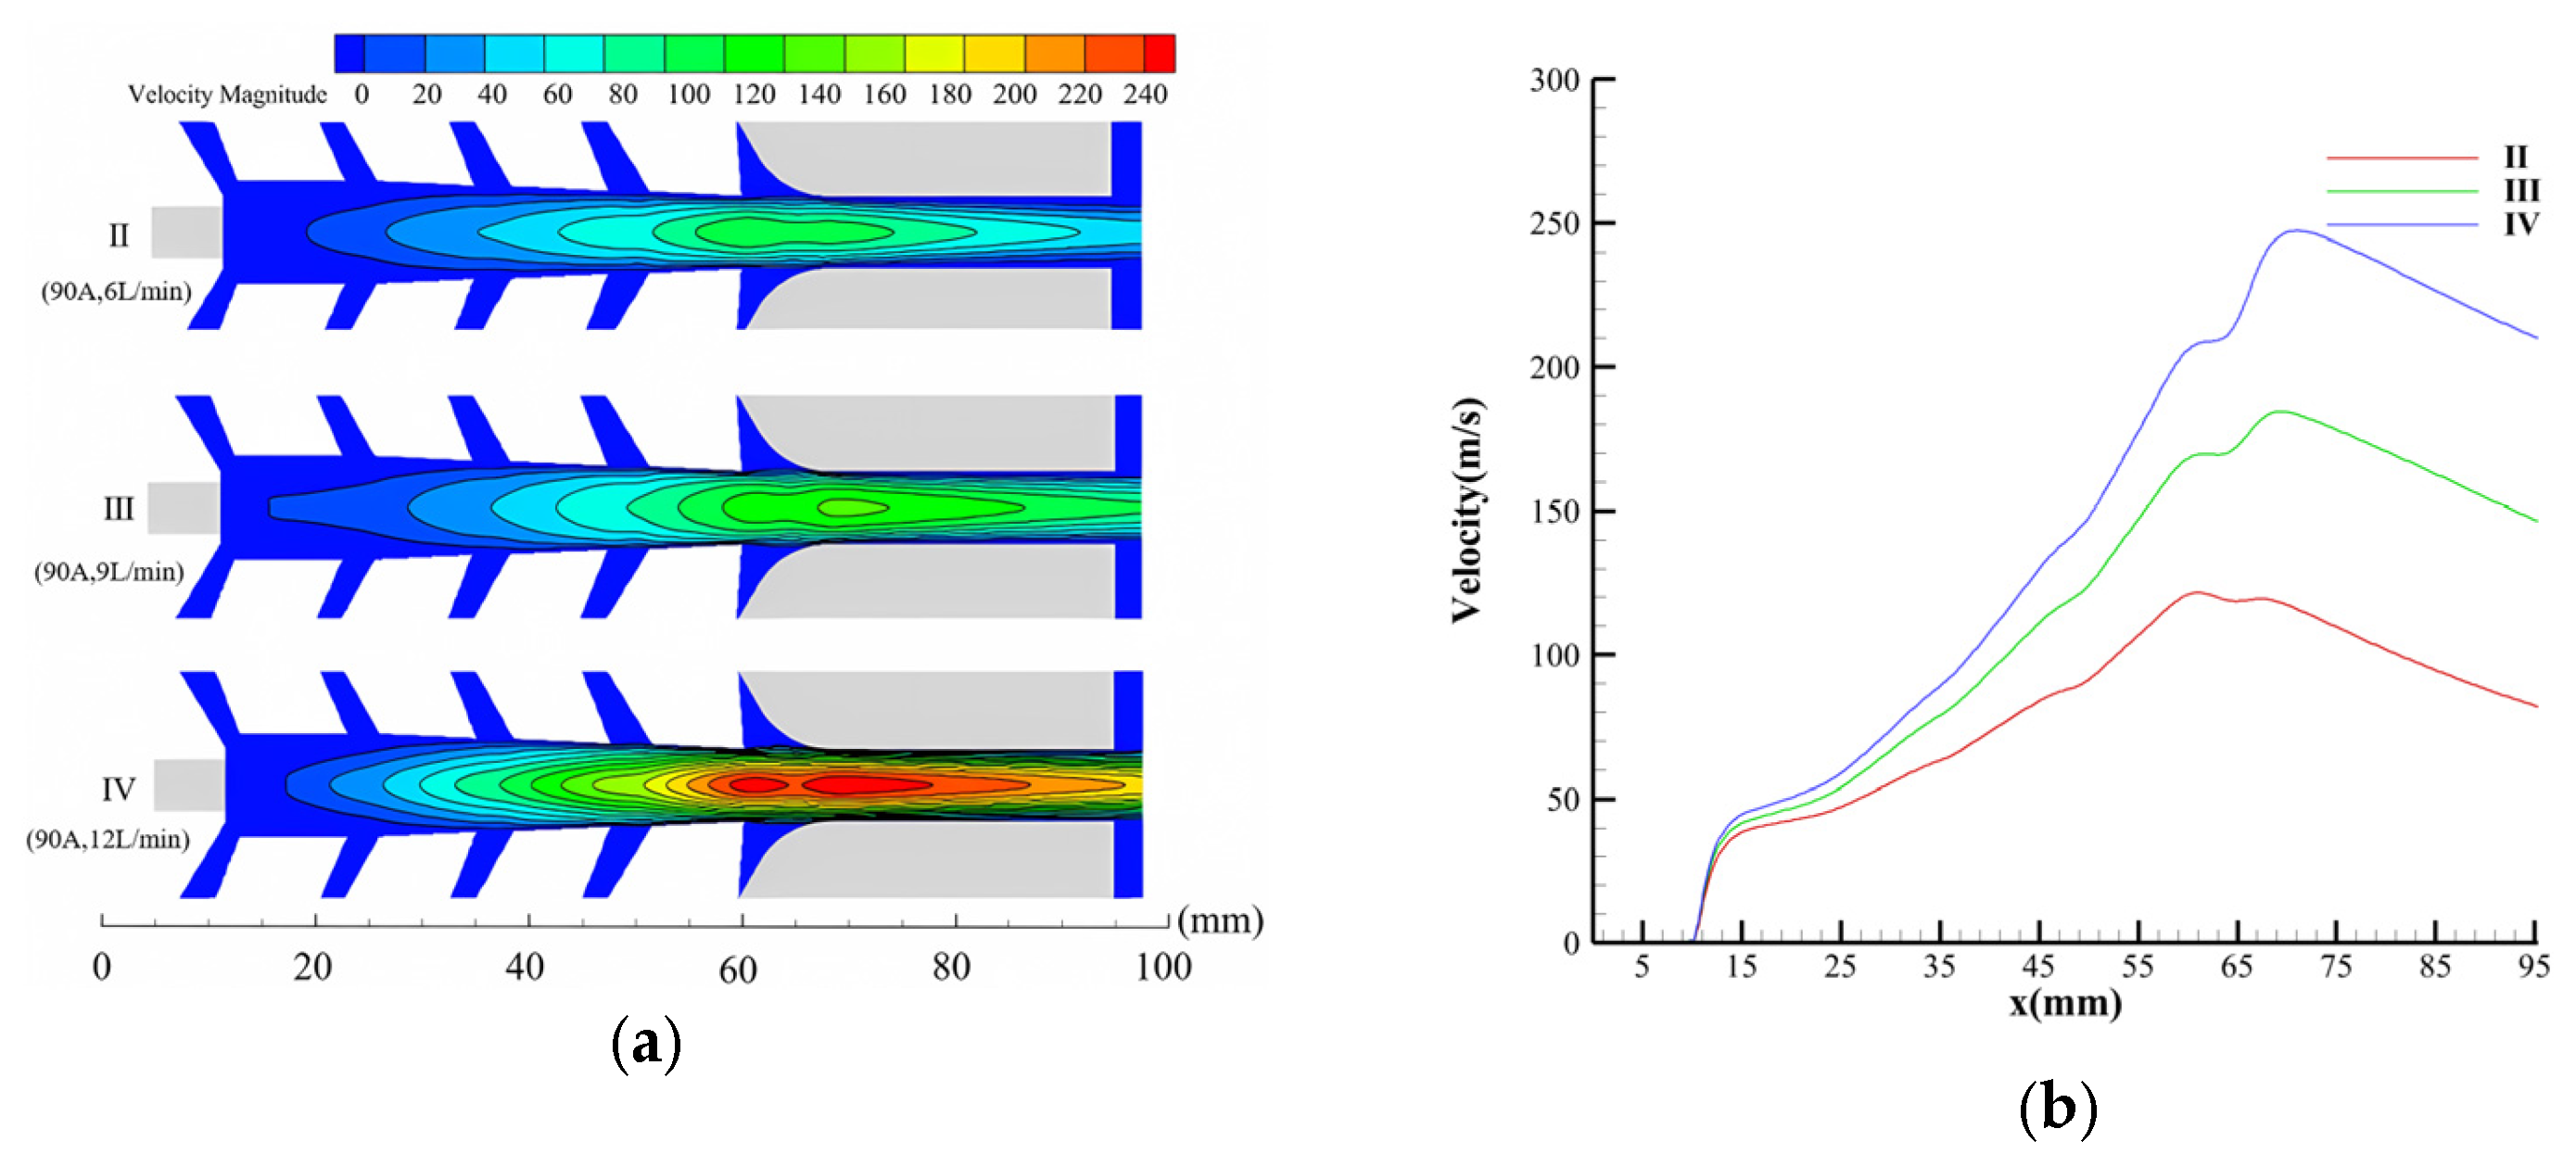
4.3.2. Velocity Distributions by Using Pure Argon

The velocity distribution inside the laminar plasma torch working with pure argon at an arc current of 90 A and gas flow rate of 9 L/min is shown in Figure 22. From it, similar to pure nitrogen, the velocity arrives at the highest velocity of 190 m/s near the anode arc attachment and then decreases to about 145 m/s at the outlet of the anode. In addition, as shown in Figure 23 and Figure 24, when pure argon is used as a working gas, the tendencies of the velocity distributions inside the laminar plasma torch with different working conditions are similar to those when pure nitrogen is used, which have been discussed in Section 4.3.1.

4.3.3. Velocity Distributions by Using 50%Ar + 50%N2

The velocity distribution inside the laminar plasma torch working with 50%Ar + 50%N2 at an arc current of 90 A and gas flow rate of 9 L/min is shown in Figure 25. From it, similar to pure argon, the velocity arrives at the highest velocity of 190 m/s near the anode arc attachment and then decreases to about 160 m/s at the outlet of the anode. As shown in Figure 26 and Figure 27, when 50%Ar + 50%N2 is used as a working gas, the tendencies of the velocity distributions inside the laminar plasma torch with different working conditions are also similar to those when pure nitrogen or argon is used.

4.3.4. Comparison Analysis of Different Gas Compositions

For a clearer comparison, the velocity distributions inside the laminar plasma torch with different gas compositions at an arc current of 90 A and gas flow rate of 9 L/min are shown in Figure 28. From it, the axial velocity increases to a certain level first, then decreases, which has been discussed in the above section. Moreover, from Figure 28b, the axial velocity of pure nitrogen is much higher than that of mixed gas and pure argon. From the discussion in the above section, the arc temperature of pure nitrogen is higher than that of other gas compositions. With a higher arc temperature and lower density of pure nitrogen, the axial velocity of pure nitrogen is much higher than that of pure argon and 50%Ar + 50%N2.

4.4. Arc Voltage Characteristics

The voltage distribution inside the laminar plasma torch with pure nitrogen at an arc current of 90 A and gas flow rate of 9 L/min is shown in Figure 29. From it, the voltage potential decreases from the anode to the cathode with an arc voltage of about 195 V. Correspondingly, the simulated arc voltages of the laminar plasma torch under different working conditions were obtained. In addition, with the experimental setups, the corresponding experimental arc voltages under the same working conditions were measured. The simulated and experimental arc voltages are shown in Figure 30. From it, the simulated arc voltage and the experimental arc voltage of the laminar plasma torch under the specified working conditions present a similar trend, indicating that the numerical model is effective. Moreover, the simulated arc voltage is higher than the corresponding experimental arc voltage. As the above introduction of the simulation model stated, the simulation model was built as a 2D model, which indicates that the plasma flow must cross through the plasma arc. Consequently, the plasma arc can be stretched by the aerodynamic force acting on the plasma arc, increasing the plasma arc length, hence the arc voltage.
According to Figure 29, the arc voltages of the plasma torch under the specified arc current all increase by increasing the gas flow rate, which is in accordance with our previous study [18]. However, by increasing the arc current, the arc voltages of the laminar plasma torch decrease when pure nitrogen is used, while the arc voltages increase slightly when pure argon and 50%Ar + 50%N2 are used. When pure argon and mixed gas are used as the working gas, the specific heat of pure argon occurs at a peak value at the temperature of about 11,000 K. Therefore, when the temperature increases with the arc current, the specific heat is decreased. Due to the specific heat decreases, the arc impedance is slightly increased, resulting in a slight increase in voltage. Moreover, due to a higher specific heat and diatomic structure, pure nitrogen is more difficult to ionize, resulting in a lower density of charged particles and a higher impedance. Thus, the arc voltage of pure nitrogen is higher than that of pure argon and 50%Ar + 50%N2, followed by that of mixed gas.

5. Conclusions

A numerical model of a homemade laminar plasma torch was built and verified, and the influence of the gas components on the arc characteristics has been discussed in this paper. The following conclusions can be drawn from this study.
(1)
Assumptions, governing equations, boundary conditions, and solving methods were discussed in detail for building a proper numerical model of a laminar plasma torch. The effectiveness of the corresponding numerical model was verified by experiments.
(2)
The axial temperature distributions inside the laminar plasma torch with different gas compositions can be divided into three sections along the axis: peak temperature area (10 mm < x < 20 mm), stable temperature area (20 mm < x < 62 mm), and decreased temperature area (62 mm < x < 95 mm). In the peak temperature area, the temperature increases sharply to a certain level and then decreases slightly. In the stable temperature area, the temperature of the arc column varies little. In the decreased temperature area, the disappearance of the heat effect of the plasma arc caused a decrease in the arc temperature.
(3)
The axial velocity distributions inside the laminar plasma torch with different gas compositions increase to a certain level first and then decrease. Moreover, the axial velocity of pure nitrogen is much higher than that of pure argon and 50%Ar + 50%N2, while that of pure argon and 50%Ar + 50%N2 has little difference.
(4)
The simulated arc voltage trend is in accordance with the corresponding experimental arc voltage trend, indicating the effectiveness of the numerical model of the homemade laminar plasma torch.
Though a numerical model of a laminar plasma torch has been built and verified, more attention should be paid to exploring the methods to improve the jet’s stability and prolong the service life of a plasma torch further by using the numerical model. Moreover, other jet characteristics of the plasma torch, such as thermal efficiency, should be considered and simulated in future model studies. Thereafter, a specified laminar plasma torch with favorable jet characteristics could be customized to meet the requirements properly.

Author Contributions

J.T. and X.C.: designed and conducted the experiments, Conducted the numerical simulation and wrote the manuscript. C.L. and S.L.: assisted the data verification and analysis. G.H. and J.W.: supervised the study. All authors have read and agreed to the published version of the manuscript.

Funding

This work was supported in part by the Fundamental Research Funds for the Central Universities, CHD 300102252502; in part by the Key Laboratory of Intelligent Manufacturing of Construction Machinery, IMCM2023KF04 and IMCM202103; in part by the Scientific Research and Innovation Team Program of Sichuan University of Science and Technology; in part by the Key Laboratory of Mechanical Structure Optimization and Material Application Technology of Luzhou, SCHYZSA-2022-02; and in part by the College Student Innovation and Entrepreneurship Program, CX2023011 and 202310622011.

Data Availability Statement

The data presented in this study are available on request from the corresponding author.

Conflicts of Interest

The authors declare no conflict of interest.

References

  1. Van, G. Applications of Thermal Plasmas for the Environment. Appl. Sci. 2022, 12, 7185. [Google Scholar] [CrossRef]
  2. Shahabuddin, K.; Riaz, K.; Shahid, H. Suitability of thermal plasma for solid waste treatment and non-thermal plasma for nano-scale high-tech plasmonic materials: A concise review. Appl. Nanosci. 2022, 12, 1–16. [Google Scholar]
  3. Boulos, M.I.; Fauchais, P.L.; Pfender, E. Handbook of Thermal Plasmas; Springer: Berlin/Heidelberg, Germany, 2020. [Google Scholar]
  4. Liu, S.; Zhang, S.; Li, C.; Li, L.; Huang, J.-H.; Trelles, J.P.; Murphy, A.B.; Li, C.-J. Generation of Long Laminar Plasma Jets: Experimental and Numerical Analyses. Plasma Chem. Plasma Process. 2019, 39, 377–394. [Google Scholar] [CrossRef]
  5. Emilie, L.; Charles, D.-I. Experimental characterization of an argon laminar plasma jet at atmospheric pressure. J. Phys. D Appl. Phys. 2011, 44, 415201. [Google Scholar]
  6. Chen, X.; Pan, W.; Meng, X.; Cheng, K.; Xu, D.-Y.; Wu, C. What do we know about long laminar plasma jets. Pure Appl. Chem. 2006, 78, 1253–1264. [Google Scholar] [CrossRef]
  7. Cao, X.; Yu, D.; Xiao, M.; Miao, J. Design and characteristics of a laminar plasma torch for materials Processing. Plasma Chem. Plasma Process. 2016, 36, 693–710. [Google Scholar] [CrossRef]
  8. Ma, Y.; Ke, W.; Yang, K.; Zhu, X.D. Investigation on spheroidization of refractory tungsten powders by laminar DC plasma torch. Mater. Res. Express 2022, 9, 116516. [Google Scholar] [CrossRef]
  9. Liu, S.-H.; Gang, J.; Li, C.-J.; Li, C.-X.; Guo, H.-B. Novel long laminar plasma sprayed hybrid structure thermal barrier coatings for high-temperature anti-sintering and volcanic ash corrosion resistance. J. Mater. Sci. Technol. 2021, 79, 141–146. [Google Scholar] [CrossRef]
  10. Guo, D.; Yu, D.; Zhang, P.; Duan, Y. Laminar plasma jet surface hardening of the U75V rail steel: Insight into the hardening mechanism and control scheme. Surf. Coat. Technol. 2020, 394, 125857. [Google Scholar] [CrossRef]
  11. Keming, P.; Deping, Y.; Peng, Z.; Wang, L.; Liao, Z.; Lu, Z.; Wu, G.; Song, C.; Li, L. Laminar plasma quenching-tempering: A rapid surface heat treatment technique for controllable modification of the rail steel. Surf. Coat. Technol. 2023, 473, 130029. [Google Scholar]
  12. Pan, W.; Zhang, W.; Zhang, W.; Wu, C. Generation of long, laminar plasma jets at atmospheric pressure and effects of flow turbulence. Plasma Chem. Plasma Process. 2001, 21, 23–35. [Google Scholar] [CrossRef]
  13. Pan, W.; Meng, X.; Chen, X.; Wu, C. Experimental study on the thermal argon plasma generation and jet length change characteristics at atmospheric pressure. Plasma Chem. Plasma Process. 2006, 26, 335–345. [Google Scholar] [CrossRef]
  14. Pan, W.; Zhang, W.; Ma, W.; Wu, C. Characteristics of argon laminar DC plasma jet at atmospheric pressure. Plasma Chem. Plasma Process. 2002, 22, 271–283. [Google Scholar] [CrossRef]
  15. Li, G.; Pan, W.; Meng, X.; Wu, C. Application of similarity theory to the characterization of non-transferred laminar plasma jet generation. Plasma Sources Sci. Technol. 2005, 14, 219–225. [Google Scholar] [CrossRef]
  16. Solonenko, O.-P.; Smirnov, A.-V. Advanced oxide powders processing based on cascade plasma. J. Phys. Conf. Ser. 2014, 550, 12–17. [Google Scholar] [CrossRef]
  17. Solonenko, O.-P.; Nishiyama, H.; Smirnov, A.-V.; Takana, H. Visualization of arc and plasma flow patterns for advanced material processing. J. Vis. 2015, 18, 221–235. [Google Scholar] [CrossRef]
  18. Cao, X.; Guo, W.; Hu, G.; Ma, Y. Design and Experimental Jet Characteristics of an Optimized DC Plasma Torch. IEEE Trans. Plasma Sci. 2022, 50, 4873–4881. [Google Scholar] [CrossRef]
  19. Cao, X.; Li, C.; He, R.; Xu, H.; Chen, L.; Huang, B. Study on the influences of the anode structures on the jet characteristics of a laminar plasma torch. Plasma Res. Express 2020, 2, 18001. [Google Scholar] [CrossRef]
  20. Cao, X.; Chen, L. Design and characteristics of a new type laminar plasma torch for materials processing. Plasma Sci. Technol. 2019, 22, 402–410. [Google Scholar] [CrossRef]
  21. Cao, X.; Yu, D.; Xiang, Y.; Yao, J. Influence of the Gas Injection Angle on the Jet Characteristics of a Non-transferred DC Plasma Torch. Plasma Chem. Plasma Process. 2016, 36, 881–889. [Google Scholar] [CrossRef]
  22. Liu, S.; Trelles, J.P.; Murphy, A.B.; Li, L. Numerical simulation of the flow characteristics inside a novel plasma spray torch. J. Phys. D Appl. Phys. 2019, 52, 335203. [Google Scholar] [CrossRef]
  23. Zhukovskii, R.; Chazelas, C.; Vardelle, A.; Rat, V. Control of the Arc Motion in DC Plasma Spray Torch with a Cascaded Anode. J. Therm. Spray Technol. 2020, 29, 3–12. [Google Scholar] [CrossRef]
  24. Murphy, A.-B.; Arundell, C.-J. Transport coefficients of argon, nitrogen, oxygen, argon-nitrogen, and argon-oxygen plasmas. Plasma Chem. Plasma Process. 1994, 14, 451–490. [Google Scholar] [CrossRef]
  25. Lowke, J.-J. Predictions of arc temperature profiles using approximate emission coefficients for radiation losses. J. Quant. Spectrosc. Radiat. Transf. 1974, 14, 111–122. [Google Scholar] [CrossRef]
  26. Murphy, A.-B.; Uhrlandt, M.-D. Foundations of High-Pressure Thermal Plasmas. Plasma Sources Sci. Technol. 2018, 27, 063001. [Google Scholar] [CrossRef]
  27. Lisnyak, M.; Cunha, M.; Bauchire, J.; Benilov, M.S. Numerical modelling of high-pressure arc discharges: Matching the LTE arc core with the electrodes. J. Phys. D Appl. Phys. 2017, 50, 315203. [Google Scholar] [CrossRef]
  28. Jüttner, B. Cathode spots of electric arcs. J. Phys. D Appl. Phys. 2001, 34, R103. [Google Scholar] [CrossRef]
  29. Murphy, A.B.; Tanaka, M.; Yamamoto, K.; Tashiro, S.; Sato, T.; Lowke, J.J. Modelling of thermal plasmas for arc welding: The role of the shielding gas properties and of metal vapour. J. Phys. D Appl. Phys. 2009, 42, 194006. [Google Scholar] [CrossRef]
  30. Benilov, M.S.; Almeida, N.A.; Baeva, M.; Cunha, M.D.; Benilova, L.G.; Uhrlandt, D. Account of near-cathode sheath in numerical models of high-pressure arc discharges. J. Phys. D Appl. Phys. 2016, 49, 215201. [Google Scholar] [CrossRef]
  31. Heberlein, J.; Mentel, J.; Pfender, E. The anode region of electric arcs: A survey. J. Phys. D Appl. Phys. 2010, 43, 23001. [Google Scholar] [CrossRef]
Figure 1. Schematic diagram of the homemade laminar plasma torch.
Processes 12 01207 g001
Figure 2. Computational domain.
Processes 12 01207 g002
Figure 3. Unstructured mesh divided by using ICEM (mesh quality: 37,970; mesh size: <0.3 mm).
Processes 12 01207 g003
Figure 4. Simple simulation model between the plasma flow and the near-cathode.
Processes 12 01207 g004
Figure 5. Simple simulation model between the plasma flow and the near-anode.
Processes 12 01207 g005
Figure 6. Diagram of the experimental setup.
Processes 12 01207 g006
Figure 7. Temperature and current density distributions along the dummy line on the inner surface of the anode. (a) Temperature distributions of anode; (b) temperature distributions along the dummy line; (c) current density distributions along the dummy line.
Processes 12 01207 g007
Figure 8. Images of the anode used in the experiments. (a) 3D geometrical model of anode; (b) anode used in the experiments.
Processes 12 01207 g008
Figure 9. Temperature and current density distributions along the dummy line on the surface of the cathode. (a) Temperature distributions of the cathode; (b) temperature distributions; (c) current density distributions.
Processes 12 01207 g009
Figure 10. Image of the cathode used in the experiments.
Processes 12 01207 g010
Figure 11. Temperature distributions inside the laminar plasma torch with different gas flow rates when pure nitrogen is used as the working gas (arc current = 90 A, GII = 6 L/min, GIII = 9 L/min, and GIV = 12 L/min). (a) Temperature distributions; (b) axial temperature distributions.
Processes 12 01207 g011
Figure 12. Temperature distributions inside the laminar plasma torch with different arc currents when pure nitrogen is used as the working gas (gas flow rate = 9 L/min, arc current: I = 60 A, III = 90 A, and V = 120 A). (a) Temperature distributions; (b) axial temperature distributions.
Processes 12 01207 g012
Figure 13. Temperature distributions inside the laminar plasma torch with different gas flow rates when pure argon is used as the working gas (arc current = 90 A, GII = 6 L/min, GIII = 9 L/min, and GIV = 12 L/min). (a) Temperature distributions; (b) axial temperature distributions.
Processes 12 01207 g013
Figure 14. Temperature distributions inside the laminar plasma torch with different arc currents when pure argon is used as the working gas (gas flow rate = 9 L/min, arc current: I = 60 A, III = 90 A, and V = 120 A). (a) Temperature distributions; (b) axial temperature distributions.
Processes 12 01207 g014
Figure 15. Temperature distributions inside the laminar plasma torch with different gas flow rates when mixed gas is used as the working gas (arc current = 90 A, GII = 6 L/min, GIII = 9 L/min, and GIV = 12 L/min). (a) Temperature distributions; (b) axial temperature distributions.
Processes 12 01207 g015
Figure 16. Temperature distributions inside the laminar plasma torch with different arc currents when mixed gas is used as the working gas (gas flow rate = 9 L/min, arc current: I = 60 A, III = 90 A, and V = 120 A). (a) Temperature distributions; (b) axial temperature distributions.
Processes 12 01207 g016
Figure 17. Axial temperature distributions inside the laminar plasma torch with different gas compositions (arc current = 90 A; gas flow rate = 9 L/min): peak temperature area (PA: 10 mm < x < 20 mm), stable temperature area (SA: 20 mm < x < 62 mm) and decreased temperature area (DA: 62 mm < x < 95 mm).
Processes 12 01207 g017
Figure 18. Radial temperature distributions at x = 40 mm inside the laminar plasma torch with different gas compositions (arc current = 90 A; gas flow rate = 9 L/min).
Processes 12 01207 g018
Figure 19. Velocity distributions inside the laminar plasma torch, working with pure nitrogen (arc current = 90; gas flow rate = 9 L/min).
Processes 12 01207 g019
Figure 20. Velocity distributions inside the laminar plasma torch with different gas flow rates (arc current = 90 A, GII = 6 L/min, GIII = 9 L/min, and GIV = 12 L/min). (a) Velocity distributions; (b) axial velocity distributions.
Processes 12 01207 g020
Figure 21. Velocity distributions inside the laminar plasma torch with different arc currents. (gas flow rate = 9 L/min, arc current: I = 60 A, III = 90 A, and V = 120 A). (a) Velocity distributions; (b) axial velocity distributions.
Processes 12 01207 g021
Figure 22. Velocity distributions inside the laminar plasma torch, working with pure argon (arc current = 90; gas flow rate = 9 L/min).
Processes 12 01207 g022
Figure 23. Velocity distributions inside the laminar plasma torch with different gas flow rates (arc current = 90 A, GII = 6 L/min, GIII = 9 L/min, and GIV = 12 L/min). (a) Velocity distributions; (b) axial velocity distributions.
Processes 12 01207 g023
Figure 24. Velocity distributions inside the laminar plasma torch with different arc currents. (gas flow rate = 9 L/min, arc current: I = 60 A, III = 90 A, and V = 120 A). (a) Velocity distributions; (b) axial velocity distributions.
Processes 12 01207 g024
Figure 25. Velocity distributions inside the laminar plasma torch working with 50%Ar + 50%N2 (arc current = 90 A; gas flow rate = 9 L/min).
Processes 12 01207 g025
Figure 26. Velocity distributions inside the laminar plasma torch with different gas flow rates (arc current = 90 A, GII = 6 L/min, GIII = 9 L/min, and GIV = 12 L/min). (a) Velocity distributions; (b) axial velocity distributions.
Processes 12 01207 g026
Figure 27. Velocity distributions inside the laminar plasma torch with different arc currents (gas flow rate = 9 L/min, Arc current: I = 60 A, III = 90 A, and V = 120 A). (a) Velocity distributions; (b) axial velocity distributions.
Processes 12 01207 g027
Figure 28. Axial velocity distributions inside the laminar plasma torch with different gas compositions (arc current = 90 A; gas flow rate = 9 L/min). (a) Velocity distributions; (b) axial velocity distributions.
Processes 12 01207 g028
Figure 29. Voltage potential distribution inside the laminar plasma torch with pure nitrogen (arc current = 90 A; gas flow rate = 9 L/min). (a) Voltage potential distribution; (b) axial voltage potential distributions.
Processes 12 01207 g029
Figure 30. Simulated and experimental arc voltages of the laminar plasma torch under different working conditions. (a) Simulated and experimental arc voltages of the laminar plasma torch under different gas flow rates. (b) Simulated and experimental arc voltages of the laminar plasma torch under different arc currents.
Processes 12 01207 g030
Table 1. Boundary conditions for simulation.
PressureGas Flow RateTemperatureElectric PotentialMagnetic PotentialThermal Conductivity
Pakg/sKVWb/mH (W/m·K)
EF2 × 105Qin300 V n = 0 A = 0/
AD//300 V n = J c A n = 0 1 × 10⁴
BC//Qc V n = 0 A n = 0 /
GK//Qa0 A n = 0 1 × 10⁴
IM0/300 V n = 0 A n = 0 /
MN0/300 V n = 0 A n = 0 /
Other walls//300 V n = 0 A n = 0 1 × 10⁴
Table 2. Simulation and experimental working conditions.
No.Arc CurrentGas Flow Rate
I60 A9 L/min
II90 A6 L/min
III90 A9 L/min
IV90 A12 L/min
V120 A9 L/min
Disclaimer/Publisher’s Note: The statements, opinions and data contained in all publications are solely those of the individual author(s) and contributor(s) and not of MDPI and/or the editor(s). MDPI and/or the editor(s) disclaim responsibility for any injury to people or property resulting from any ideas, methods, instructions or products referred to in the content.

