Article

Characterization of the Byproducts of Myrciaria dubia and Psidium guajava and Optimization of the Extraction of Their Bioactive Compounds by Ultrasound-Assisted Extraction and Mechanical Agitation

by
Luz C. Carranza Carranza
1,*,
Segundo G. Chavez
2 and
Cristina dos Santos Ferreira
3
1
Facultad de Ingeniería y Ciencias Agrarias, Universidad Nacional Toribio Rodríguez de Mendoza de Amazonas, Chachapoyas 01001, Peru
2
Instituto de Investigación para el Desarrollo Sustentable-Ceja de Selva, Universidad Nacional Toribio Rodríguez de Mendoza de Amazonas, Chachapoyas 01001, Peru
3
Departamento de Química Orgánica, Facultad de Ciencias Exactas Universidad de Buenos Aires, Buenos Aires C1428EGA, Argentina
*
Author to whom correspondence should be addressed.
Processes 2024, 12(6), 1228; https://doi.org/10.3390/pr12061228
Submission received: 13 May 2024 / Revised: 6 June 2024 / Accepted: 6 June 2024 / Published: 15 June 2024
(This article belongs to the Section Food Process Engineering)

Abstract

:
The food industry generates considerable byproducts that are often discarded and have high contents of usable bioactive compounds. The aim of this study was to characterize the byproducts of camu-camu (Myrciaria dubia) (shell and seed) and guava (Psidium guajava) (shell) production. The extraction and stabilization of the bioactive compounds of camu-camu and guava were also optimized. The variables of ultrasound-assisted extraction (UAE) (shaking time, sonication time and volume–mass ratio) and mechanical shaking-based extraction (MS) (shaking speed, volume–mass ratio and shaking time) were optimized with the surface response method and a Box–Behnken design. The responses studied were total phenolic content (TPC) and antioxidant capacity (AC) evaluated by the degradation of the radical 2,2-diphenyl-1-picrylhydrazyl (DPPH) technique and by the ferric reducing antioxidant powder (FRAP) test. For ultrasound-assisted extraction, the optimal sonication time was 15 min for both the M. dubia and P. guajava shells, and the volume–mass ratios were 50 mL/g for the M. dubia shell and 60 mL/g for the P. guajava shell. However, for M. dubia seeds, there was an agitation time of 3 h, a sonication time of 4.4 min and a volume–mass ratio of 50 mL/g. During extraction by mechanical stirring, the optimal volume–mass ratio for both M. dubia seeds and P. guajava shells was 60 mL/g, while for M. dubia shells, it was 50 mL/g. For the shells and seeds of M. dubia and the shells of P. guajava, the optimal stirring times were 2, 6.4 and 7.7 h, respectively, and the optimal stirring speeds were 172.2, 250 and 256.3 rpm, respectively. Under these optimal conditions, the highest total phenolic content (TPC) results were acquired from the cuma-cuma peel (CCP) extract (26.2 mg gallic acid equivalent (GAE)/g sample) obtained by UAE and from guava peel (GP) extract (27.9 mg GAE/g sample) obtained by MS. The optimized models showed that MS was more efficient than UAE for obtaining bioactive compounds from byproducts of M. dubia and P. guajava. However, UAE required much shorter extraction times than MS. In conclusion, the models obtained for the recovery of bioactive compounds could be applied in large-scale industries to fully exploit the byproducts studied.

1. Introduction

The production and processing of food generate large amounts of byproducts and waste, which are considered organic waste products that are generally not used and cause environmental pollution [1]. Globally, the industry that generates the third greatest amount of waste is the agricultural industry, which is dedicated to the production and processing of fruits and vegetables; therefore, the search for adequate management of agricultural byproducts is an emerging trend [2,3].
Camu-camu (Myrciaria dubia) and guava (Psidium guajava) are tropical fruits recognized for their high nutritional values and bioactive compound contents, which are associated with factors that promote human health, such as antiparasitic, anticancer, antihyperglycemic, antihypertensive and antimicrobial properties [4,5,6]; however, the amount of waste in crops of both M. dubia and P. guajava is approximately 30 wt.% after processing, and these fruits consist mainly of seeds and husks. The shells and seeds of M. dubia plants are richer in bioactive compounds than their pulp [7,8,9]. The byproducts of discarded P. guajava, such as the shell, have nutraceutical properties, are a source of various nutritional components, including polysaccharides, vitamins, phenols and carotenoids, and have a wide range of bioactive and functional properties [10].
Conversely, current changes in consumption habits tend to prioritize the replacement of synthetic food additives with natural additives. This replacement has motivated an increase in the interest of researchers to consider waste as a source of renewable bioactive compounds, thus seeking to optimize the use of economic resources for the agricultural, food and pharmaceutical industries [11]. However, the extraction of compounds of interest has certain technical difficulties. The extraction efficiency depends on several factors, such as the type of solvent and its concentration, time, temperature and extraction method [12,13,14]. Furthermore, the extracted compounds are often sensitive to degradation and require different techniques for their stabilization.
There are a wide variety of techniques for obtaining bioactive compounds from plant sources, which can include processes that improve extraction, such as homogenization, sonication, temperature changes, shaking water baths, electrical pulses, enzymatic processes and supercritical fluid use. Each of these methods has different applications and efficiencies depending on the material undergoing treatment [15,16]. Therefore, the choice of method is essential in the processing of new products. Due to the interest in developing efficient and safe techniques for the environment, green technologies have advanced due to their beneficial effects, since they use little to no toxic solvents and are suitable for such processes; moreover, the time and economic costs of extraction are reduced, thereby increasing the performance, precision and quality of bioactive extraction [17,18].
Ultrasound-assisted extraction (UAE) is considered a green, clean and environmentally friendly technology that has the advantages of ease of use, low cost and good efficiency. With this technique, the energy of the ultrasonic waves generates cavitation forces that improve the contact between the solvent and the plant material, thus increasing the mass transfer of the target compounds to the solvent. During the use of UAE, the factors that may interfere with the extraction effectiveness are the ultrasonic source, the frequency and intensity of operation, the time, the temperature, the type of solvent and the relationship between the solvent and the material [19,20,21,22]. However, mechanical shaking-based extraction (MS) can minimize the degradation of natural compounds sensitive to heat. MS is an economical process that consumes little energy, which is advantageous for large-scale natural processes. The parameters that might affect the efficiency of this method are the stirring speed, the extraction time, the temperature and the solvent-to-material ratio. Refs [23,24,25,26] reported that the combined use of sonication and shaking greatly decreases the particle sizes, hence increasing the extraction yields of the components relative to conventional methods.
There are experimental design methodologies that help determine the most favorable operating conditions to achieve the desired results, such as response surface optimization. For this technique, it is essential to determine which parameters should be fixed or varied. Optimizing one variable at a time requires multiple experiments, which can be timely and expensive; therefore, a proper optimization method is important. The response surface methodology (RSM) is frequently applied in optimization studies with minimal tests to identify and quantify the numerous relationships between different factors; in turn, RSM is used to plan experiments, generate models, evaluate variable effects and determine the optimal parameters that create the desired results [27,28,29,30].
Consequently, the objectives of this research were to characterize and optimize the parameters of the bioactive extraction process from byproducts of P. guajava and M. dubia by UAE and MS. Optimization was performed based on three parameters for both UAE (liquid–solid ratio, sonication time and stirring time) and MS (liquid–solid ratio, stirring speed and stirring time).

2. Materials and Methods

2.1. Chemicals and Reagents

The reagents sodium chloride, sodium carbonate, sodium hydroxide, sodium acetate, gallic acid, 2,2-diphenyl-1-picrylhydrazyl (DPPH), Folin–Ciocalteu, 2,4,6-tris(2-pyridyl)-s-triazine (TPTZ) and iron(III) chloride were purchased from Sigma-Aldrich (France). Sodium hypochlorite (3%), ethanol (96%) and analytical grade hexane were obtained from Merck (Lima, Peru).

2.2. Preparation of Materials and Samples

Fruits of M. dubia were obtained from the city of Tarapoto, San Martín region, and those of P. guajava were obtained from the Mariscal Benavides district of the Amazon region—Peru. A total of 15 kg of each fruit was collected and disinfected by immersion in sodium hypochlorite under a force of 0.1 N for 15 min. Then, the seeds and shells were separated manually. The byproducts were dried in an oven at 55 °C for 8 h following the methodology described by [7]. The dehydrated material was crushed in a Willye-type mill (model TE-650/1), and the obtained powder was stored in hermetic bags protected with aluminum foil at room temperature until later use.

2.3. Byproduct Characterization

All physicochemical characterization analyses were performed in triplicate for each byproduct.

2.3.1. Humidity

The moisture contents of the dehydrated byproducts were evaluated by drying following the procedure of the Association of Official Analytical Chemists [31]. Approximately 5.0 g of each byproduct was dried in an oven (VENTICELL LSI-B2V/VC 55 L) at 105 ± 0.4 °C and checked every 2 h until a constant weight was reached. The humidity was expressed as a percentage calculated with Equation (1):
%   Wetness = ( weight   loss   in   g   / sample   loss   in   g ) ×   100

2.3.2. pH

The pH levels of the byproducts were measured with a portable digital potentiometer (HANNA HI 98130) via the 981.12 method of the Association of Official Analytical Chemist [31]. Approximately 1.0 g of each sample was dissolved in 10.0 mL of distilled water, after which the value was recorded.

2.3.3. Density

To measure the apparent density, the powder sample was placed in a 15 mL cylinder, and the volume and weight were recorded. Then, the apparent density was calculated. The compacted density was calculated by striking the specimen for 5 min at a rate of 32 strokes per minute, and the final volume was recorded to calculate the compacted density [32]. The Hausner index (IH) is a value related to the fluidity of a powder, and it was calculated according to Equation (2):
I H = ( c o m p a c t   d e n s i t y ) / ( a p p a r e n t   d e n s i t y )

2.3.4. Hygroscopicity

To measure hygroscopicity, the method described by [33] was used with some modifications. Approximately 1.0 g of each sample was weighed in plastic plates and then placed in a desiccator at 25 °C with a saturated solution of NaCl (75.29% relative humidity (RH)). The samples were weighed every 2 h until a constant weight was obtained, and hygroscopicity was expressed as grams of water added per 100.0 g of dry matter.

2.3.5. Solubility

To determine the solubility, approximately 0.25 g of each powdered byproduct was weighed and mixed in approximately 250.0 mL of distilled water on a shaker at 1550 rpm for 5 min. Then, the mixture was centrifuged at 3000 rpm for 5 min and left to rest for 30 min. Afterward, 4.00 mL of the supernatant was transferred to previously tared Petri dishes. The plates with the solubilized product were placed in a 105 °C oven for 5 h. Solubility was determined according to the weight difference between the empty plate and the dehydrated plate with the powder in solution [34].

2.3.6. Water Activity

The water activity (aw) was determined with a water activity meter (AquaLab Series 3).

2.3.7. Carotenoid Content

To determine the carotenoid contents, the powders were diluted with hexane to a mass–volume ratio of 40 mg/3 mL (m/v) and then stirred for 4 min, after which the absorbance values were recorded with a spectrophotometer (PEAK INSTRUMENTS Model T-9200) in the range of 400–550 nm [35].

2.3.8. Morphology and Microstructure

The morphologies and microstructures of the sample particles were evaluated using scanning electron microscopy (SEM) (QUANTA FEG 250; Carl Zeiss, Jena, Germany). The samples were placed on aluminum plates with double-adhesive tape and vacuum coated with a thin layer of platinum before viewing at 20,000× magnification. The observations were carried out with a voltage acceleration of 3 kV, and the images were recorded at magnifications ranging from 250 to 10,000× [36,37,38].

2.4. Optimization of the Extraction of Bioactive Compounds

The extractions were carried out in aqueous solutions to optimize the variables of the two extraction methods, and Box–Behnken experimental designs of the surface response were created.

2.4.1. Ultrasound-Assisted Extraction

In this method, 3 input parameters were considered at 3 levels with 5 midpoints, as shown in Table 1. The optimized parameters were stirring time (h), sonication time (min) and volume–mass ratio (mL). To determine the values of each parameter, the previous tests carried out by [39,40] were considered as references. The extraction procedure was carried out in 50.0 mL plastic tubes, the dry sample was weighed, and double-distilled water was added in each experiment according to the volume–mass ratio determined by the experimental design. The tubes were placed in an ice bath at 0 °C, and each tube was sonicated in ultrasonication equipment (UP100H, Hielscher Ultrasonics GmbH, Germany) for the time indicated by the design. Each sample was stirred with a magnetic stirrer at room temperature according to its specific treatment. The extracts were stored in a refrigerator at 8 °C for 24 h until subsequent analysis.

2.4.2. Extraction by Mechanical Stirring

With this method, 3 input parameters were considered at 3 levels with 5 midpoints, as shown in Table 2. The parameters to be optimized in the experimental design were the stirring speed (rpm), volume–mass ratio (mL/g) and stirring time (h). To determine the values of each parameter, the previous tests by [41,42] were considered as references. The samples were weighed in 50 mL plastic tubes, and double-distilled water was added according to the volume–mass ratio indicated by the design of each system. Each tube was shaken in an orbital shaker for the specified time at a certain speed. The systems were then stored in a refrigerator at 8 °C for 24 h until subsequent analysis [43,44].

2.4.3. Characterization of the Extracts

To characterize the bioactivity levels of the extracts obtained from UAE and MS, the supernatants were separated from the precipitates. Briefly, 1.50 mL of each extract was added to 2.0 mL Eppendorf tubes, which were centrifuged at 4000 rpm for 20 min. Then, the supernatant of each tube was separated, filtered and stored in a refrigerator until analysis. The antioxidant capacity (AC) and total phenolic content (TPC) were determined in triplicate.

Antioxidant Capacity (DPPH)

The antioxidant capacity was analyzed through degradation of the radical DPPH following the methodology described by [45], with some modifications. The reagent used was prepared from a 1 mg/mL solution of DPPH in 96% v/v ethanol; thus, the initial absorbance at 517 nm was 0.9–1.0. The technique applied for the measurement of the samples was as follows: A total of 50 µL of the DPPH solution was added to 50 µL of sample, which was then stirred, and the absorbance at 517 nm was measured after 30 min. The results were expressed as milligrams of gallic acid equivalents per gram of sample (mg GAE/g) obtained through a standard gallic acid curve (R2 = 0.99432).

Total Phenolic Content

The TPC was determined using the Folin–Ciccalt UAE technique [46,47]. Briefly, 50 µL of extract, 800 µL of double-distilled water, 125 µL of Na2CO3 solution (20% w/w in 0.1 N NaOH) and 125 µL of Folin were placed in Eppendorf tubes in this order. After 30 min in the dark, the absorbance was recorded at 765 nm with a spectrophotometer. All reagents without sample were used as a blank. The total phenolic content was expressed in mg GAE/g of sample obtained through a standard curve (R2 = 0.9989).

Ferric Reducing Antioxidant Powder

The antioxidant capacity of a sample could also be inferred by evaluating its reducing power. In this work, the reducing power of the extracts was evaluated with the ferric reducing antioxidant powder (FRAP) test [48,49,50]. The FRAP reagent was prepared by mixing 25.0 mL of sodium acetate buffer (0.3 mM; pH 3.6) with 2.50 mL of a 10 mM solution of TPTZ and 2.50 mL of a 20 mM solution of FeCl3. The reaction of the sample with the reagent was carried out by adding 60 µL of the sample to 840 µL of the prepared FRAP reagent. After shaking, the absorbance at 595 nm was recorded using 840 µL of FRAP reagent with 69 µL of water as a blank. The calculations were performed using a calibration curve created with gallic acid (R2 = 0.9998), and the results were expressed as mg GAE/g.

2.5. Statistical Analysis

The data were subjected to analysis of variance and Tukey’s tests of multiple comparisons with a significance level of 0.05 to compare the properties of the powders to be used in the extracts using the statistical package Statistical Product and Service Solutions (SPSS) V.26. To optimize the bioactive extraction process, design and response surface analyses were carried out via Box–Behnken using Design Expert 11 software. All AC, TPC and FRAP determinations were performed in triplicate.

3. Results and Discussions

3.1. Byproduct Characterization

3.1.1. Humidity and pH

The drying process of a plant material is important since it facilitates the release of bioactive compounds at the time of extraction and is also associated with the preservation of food; drying reduces the amount of free water and the number of microbiological reactions [51]. The moisture content of the M. dubia shell was 8.73 ± 0.100%, while that of the seed was 13.72 ± 0.300%, which are values similar to those reported by [6] for M. dubia powder (7.94–13.95%).
The shell moisture content of P. guajava was 10.79 ± 0.030%, which was close to the value of 13.8% reported by [52,53].
The shell of M. dubia presented a lower pH than did the seed (3.09 ± 0.018 and 6.57 ± 0.012). The pH of the shell of M. dubia was very close to the values reported by [39,54] (3.24 and 3.09, respectively); they also reported that the pH of the seed was greater than that of the pulp and shell. The shell of P. guajava had a pH of 3.71 ± 0.016, which was identical to that reported by [53] (3.55). Low pH could help prevent the degradation of phenolic compounds [55].
Figure 1 shows that the moisture contents of the studied materials were directly related to the pH since the pH increased when the humidity increased. Furthermore, the moisture content and pH levels of the shell of P. guajava were greater than those of the shell of M. dubia and lower than those of the seed of M. dubia.

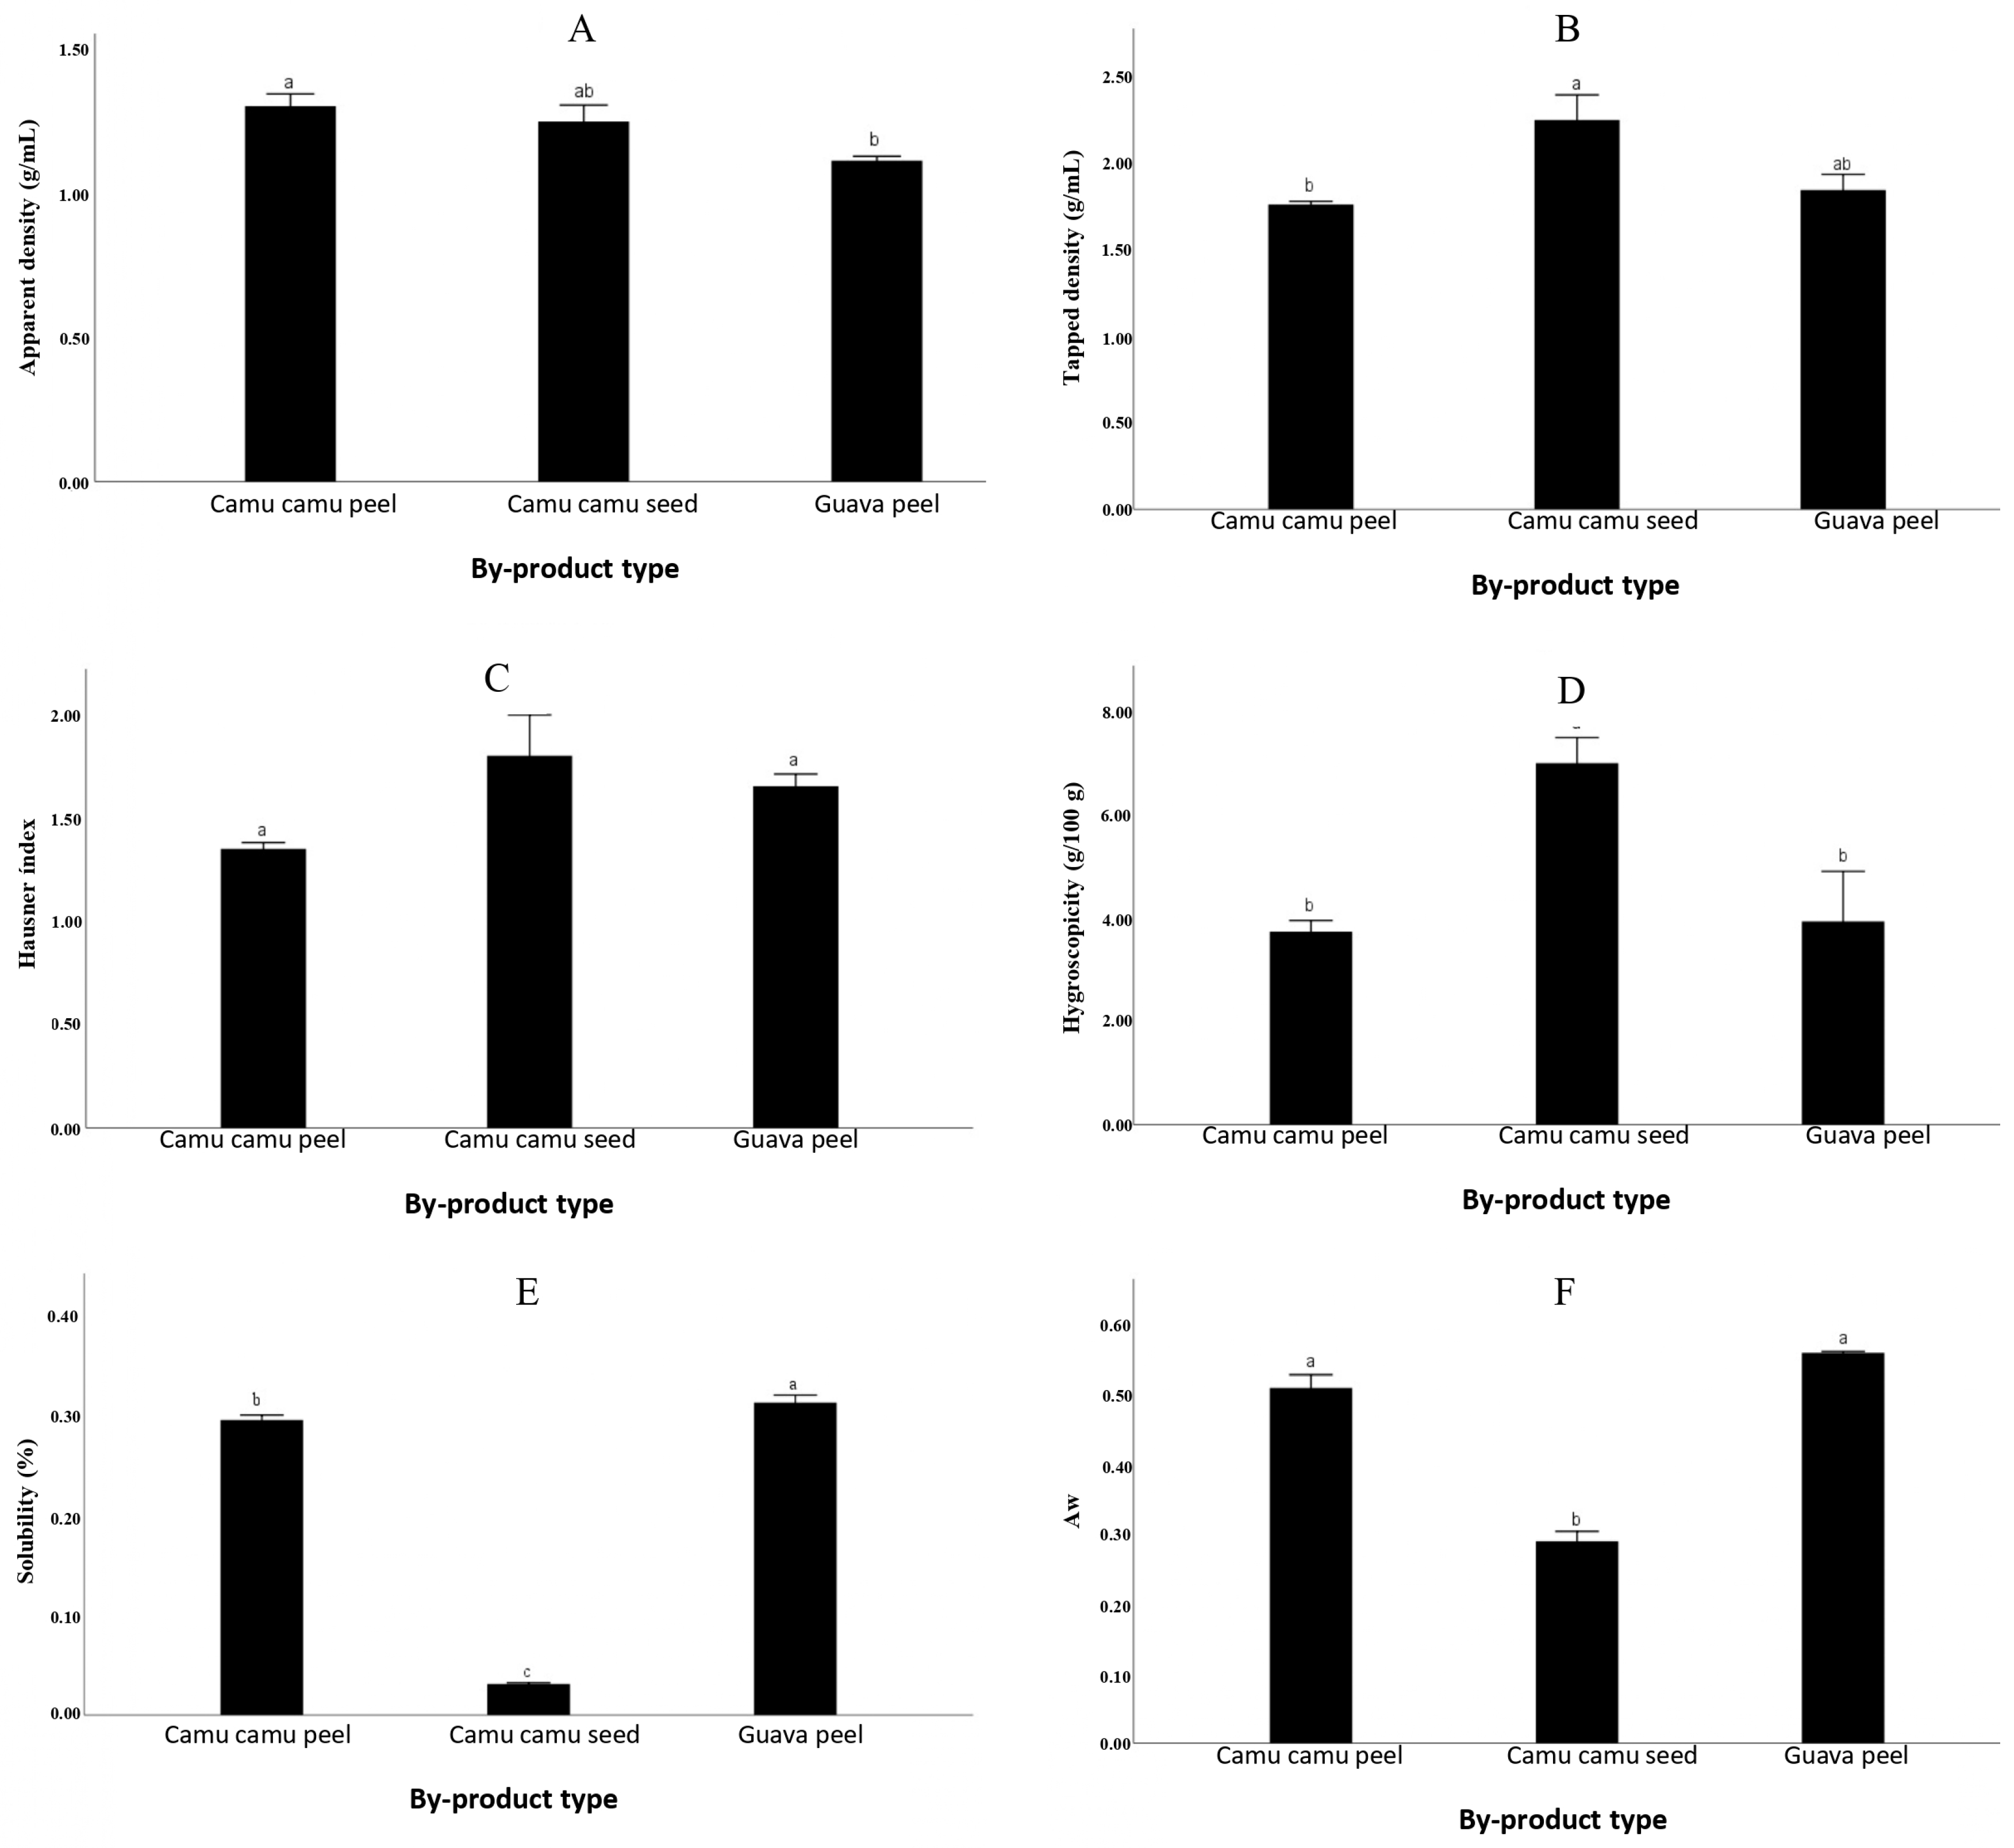
3.1.2. Density, Hausner Index, Hygroscopicity, Solubility and Water Activity

Figure 2 shows that the apparent densities of the byproducts of M. dubia were 1.3 ± 0.04 and 1.25 ± 0.06, while the tapped densities were 1.76 ± 0.02 and 2.25 ± 0.15 (shell and seed, respectively). Conversely, the apparent and tapped densities of the shell of P. guajava were 1.11 ± 0.02 and 1.84 ± 0.09, respectively. The determination of apparent and tapped density is important for predicting the disposition of the particles and dispersion of the material [56]. The heavier the material is, the better the spaces between the particles could be accommodated; thus, the material occupies less space, resulting in a high apparent density [34].
The Hausner index (HI) values of the shell and seed of M. dubia were 1.35 ± 0.030 and 1.80 ± 0.190, respectively. The HI of the shell of P. guajava was 1.65 ± 0.06. Materials with HI values below 1.25 are considered poorly cohesive (Figure 2). Cohesion determines consistency and fluidity properties; specifically, the lower the cohesion is, the better the fluidity [34,57,58]. Therefore, the plant materials studied in this research were considered to have high cohesiveness and low fluidity.
The hygroscopicity values of the shell and seed of M. dubia were 3.73 ± 0.220 and 7.10 ± 0.490 (absorbed water/100 g), respectively, while that of the shell of P. guajava was 3.93 ± 0.970 (absorbed water/100 g). According to previous studies on hygroscopicity, the drying temperature had a great influence since high temperatures resulted in high hygroscopicity [59]. However, hygroscopicity values could also be directly related to moisture content since these values increased when the moisture content increased.
The shell and seed of M. dubia had solubilities of 0.290 ± 0.005% and 0.030 ± 0.001%, respectively, while the shell of P. guajava had a solubility of 0.310 ± 0.560%. The low solubility values of the studied materials could indicate that a low temperature was used for drying [34,60].
Low water activity in materials reduces the likelihood of deterioration caused by microorganisms and increases their shelf life [61], whereas higher water activity values mean more free water available for biochemical or microbiological reactions and, therefore, a shorter shelf life [62]. All the plant materials studied in this research had a water activity below 0.6, indicating that they could be considered biochemically or microbiologically stable.

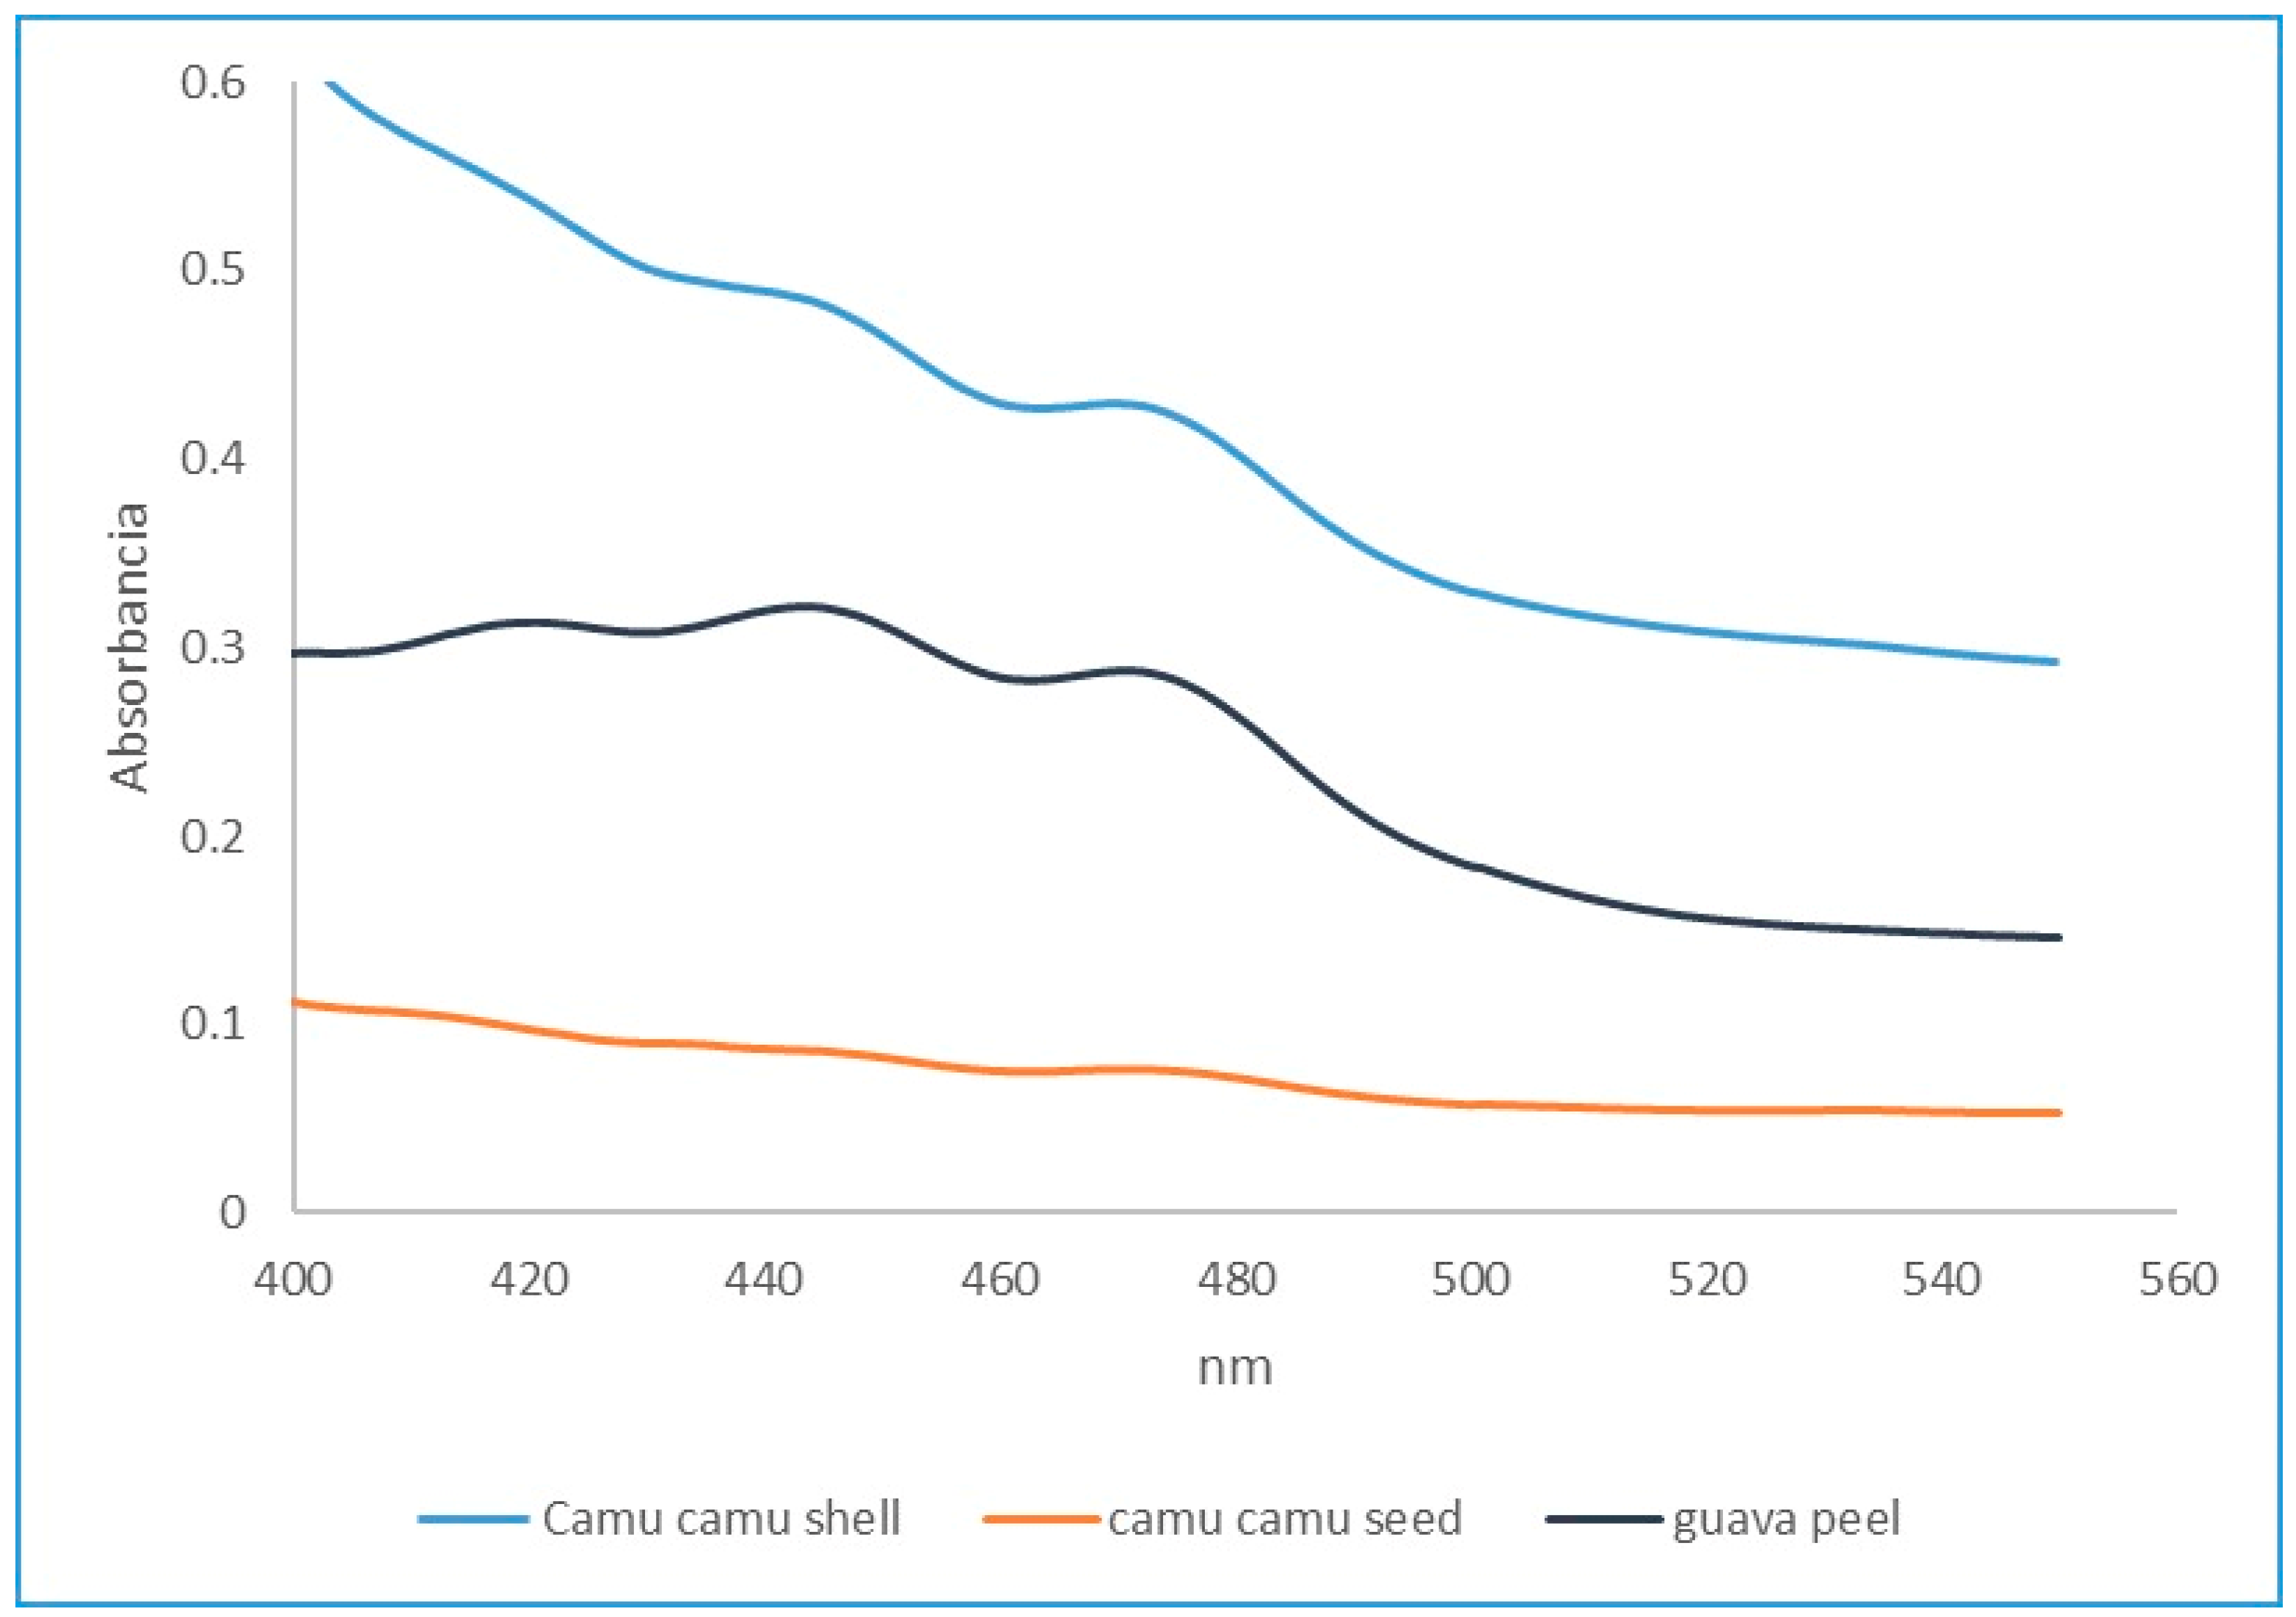
3.1.3. Pigment Content

Anthocyanins, which have antioxidant activity and are considered bioactive compounds, are a group of water-soluble phytopigments with diverse colors depending on the pH [63]. Carotenoids are natural pigments, and many of the fruits of the Amazon region, such as those of M. dubia and P. guajava, have a color between yellow and red, especially in the shell [64].
Figure 3 shows that the peak absorbance of the M. dubia shell represents the content of carotenoids; lycopene is potentially present since it is a carotenoid that gives food a red color [65]. The presence of carotenoids in the seeds of M. dubia is almost nonexistent.
P. guajava contains high amounts of carotenoids and phenol compounds, such as anthocyanins, aurones and chalcones, which may be responsible for the yellow color of the shell; flavones and flavanols are also present in the peel, since they are colorless or very pale yellow in color [66]. Graph 3 presents the absorbance peaks for the peel of P. guajava, which confirms the presence of pigment.

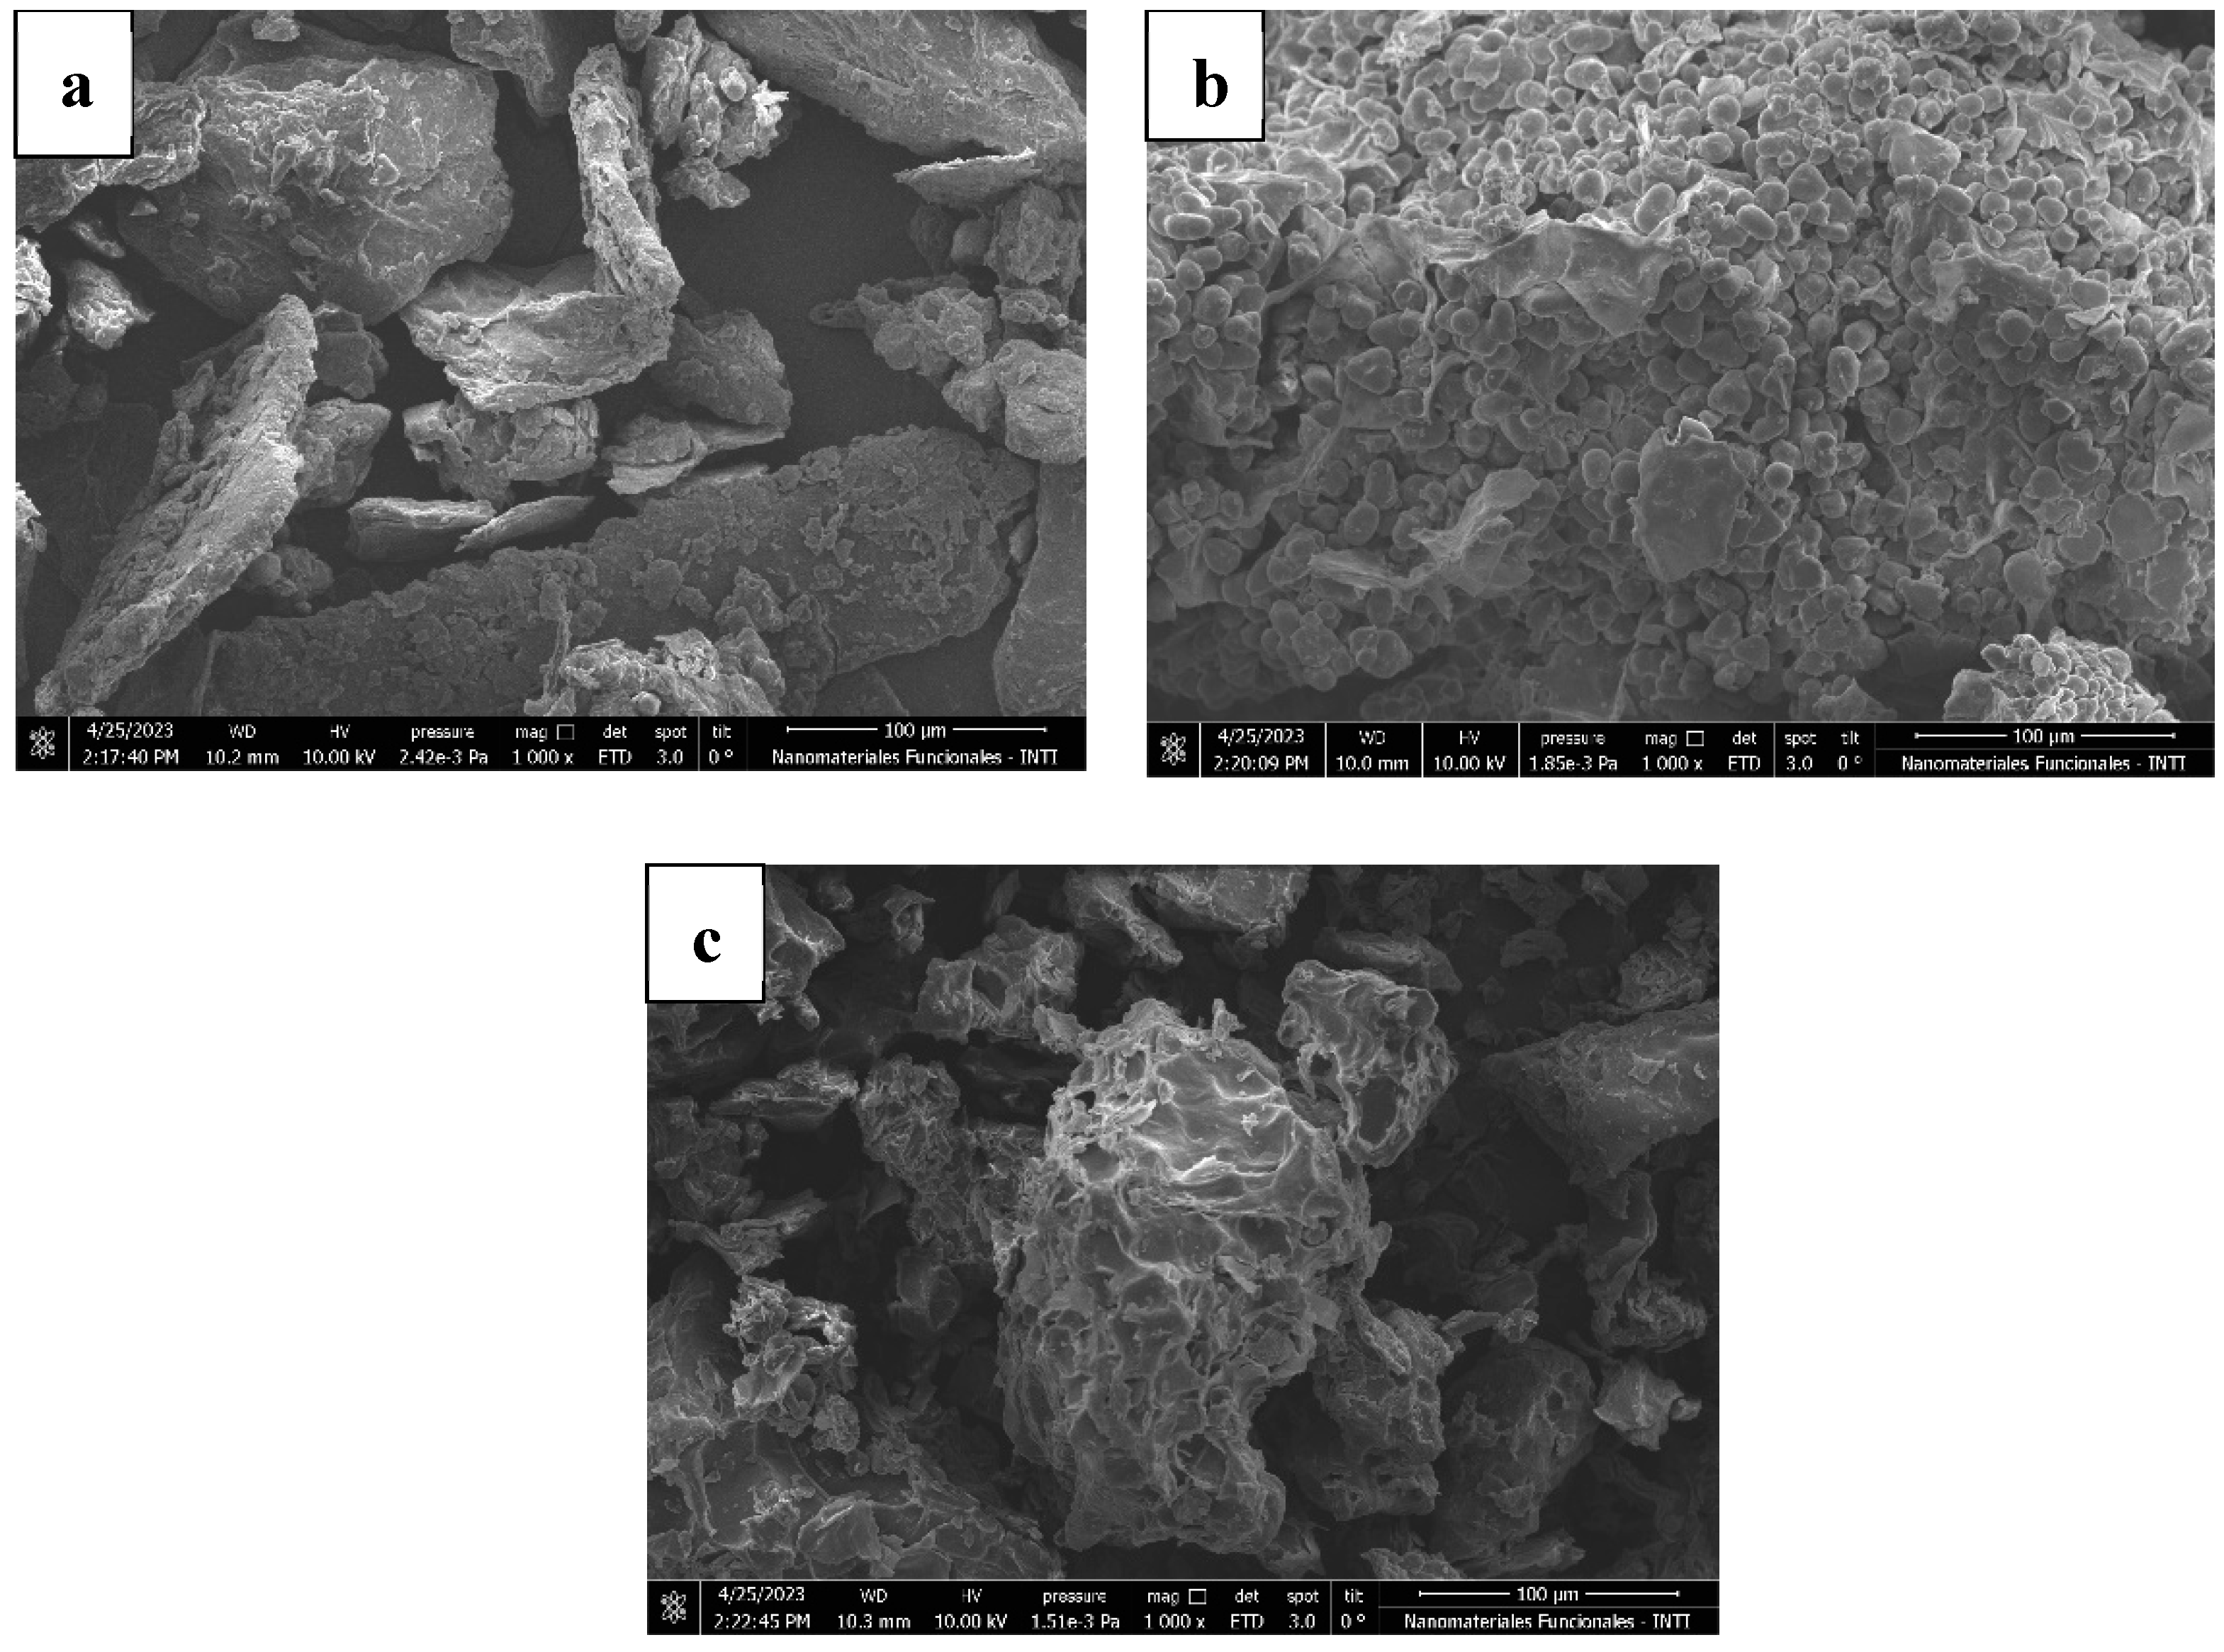
3.1.4. Morphology and Microstructure

Figure 4 shows that the morphological microstructure of the M. dubia shell consisted of flat, long and porous chips, which could be due to the presence of components such as quercetin derivatives, ellagic acid and myricithin [67]. The seeds of M. dubia were oval in shape with smooth surfaces; this product could be considered a dicotyledon since they contained organized structures and surrounding subcellular organelles, such as protein and oil bodies [68]. The shell of P. guajava had an amorphous shape with a porous and rough surface, which could be due to the presence of polar compounds, such as cinnamoyl hexoxide, abscisic acid, phenolic compounds and kaempferol flavonoids [69,70].

3.2. Optimization of Bioactive Extracts

The results of the model fit and analysis of variance (ANOVA) for UAE and MS are presented in Table 3 and Table 4, respectively. A value of p < 0.05 indicates that the model is significant and well-adjusted, and high R2 values support the suitability of the model.
As shown in Table 3 and Table 4, the models for both the TPC and AC (DPPH and FRAP) of the bioactive products of M. dubia and P. guajava after UAE and MS had values of p < 0.050, and the R2 values were greater than 0.8361, which confirmed the adequacy of the models. These results suggested that a quadratic model would be the most appropriate for predicting the performance of TPC and AC under the experimental conditions used.
As shown in Table 3, the shaking time (A) and sonication time (B) were not significant in most of the models; moreover, the mass–volume ratio (C) was not significant for the TPC and AC (FRAP) of the M. dubia and P. guajava shells, respectively. The effect of the AB interaction was not significant on any of the models, and AC had a significant effect only on the TPC of the shell. M. dubia and BC were significant in most of the models. However, quadratic effects were significant in most models. The volume–mass relationship was considered the most important factor for the extraction of compounds from plant samples since the yield increased as the amount of solvent increased, potentially due to the increase in viscosity due to the high amount of solid, which prevented the extraction of the compounds by the extraction medium [71,72,73]. The extraction efficiency of phenolic compounds depended on the stirring times of the three sources studied, and for the M. dubia shell, the sonication time was also a determining factor (p < 0.05). Refs. [72,74] also demonstrated that the extraction time is essential for the extraction of TPC, which could affect the bioactivity of the extract [75].
Table 4 shows that the agitation speed (A) was significant in four models, the volume–mass relationship (B) was not significant in two models (TPC and AC-FRAP of seeds of M. dubia), and the stirring time (C) was significant in most of the models. The effects of linear interactions (AB, AC and BC) were not significant in most models. Conversely, quadratic effects (A2 and B2) were significant in almost all the models; however, C 2 had a significant effect only on the AC (FRAP) of the peel of M. dubia. In the present study, via MS extraction, the volume–mass relationship was determined to be the most influential factor in the extraction of bioactive components (AC and TPC), which was corroborated with the studies carried out by [76,77]. Interestingly, the time and speed of stirring were factors that played important roles in the extraction of compounds. A long agitation time and fast agitation speed increased the yield of compounds due to the high convective mass transfer [27,78,79].

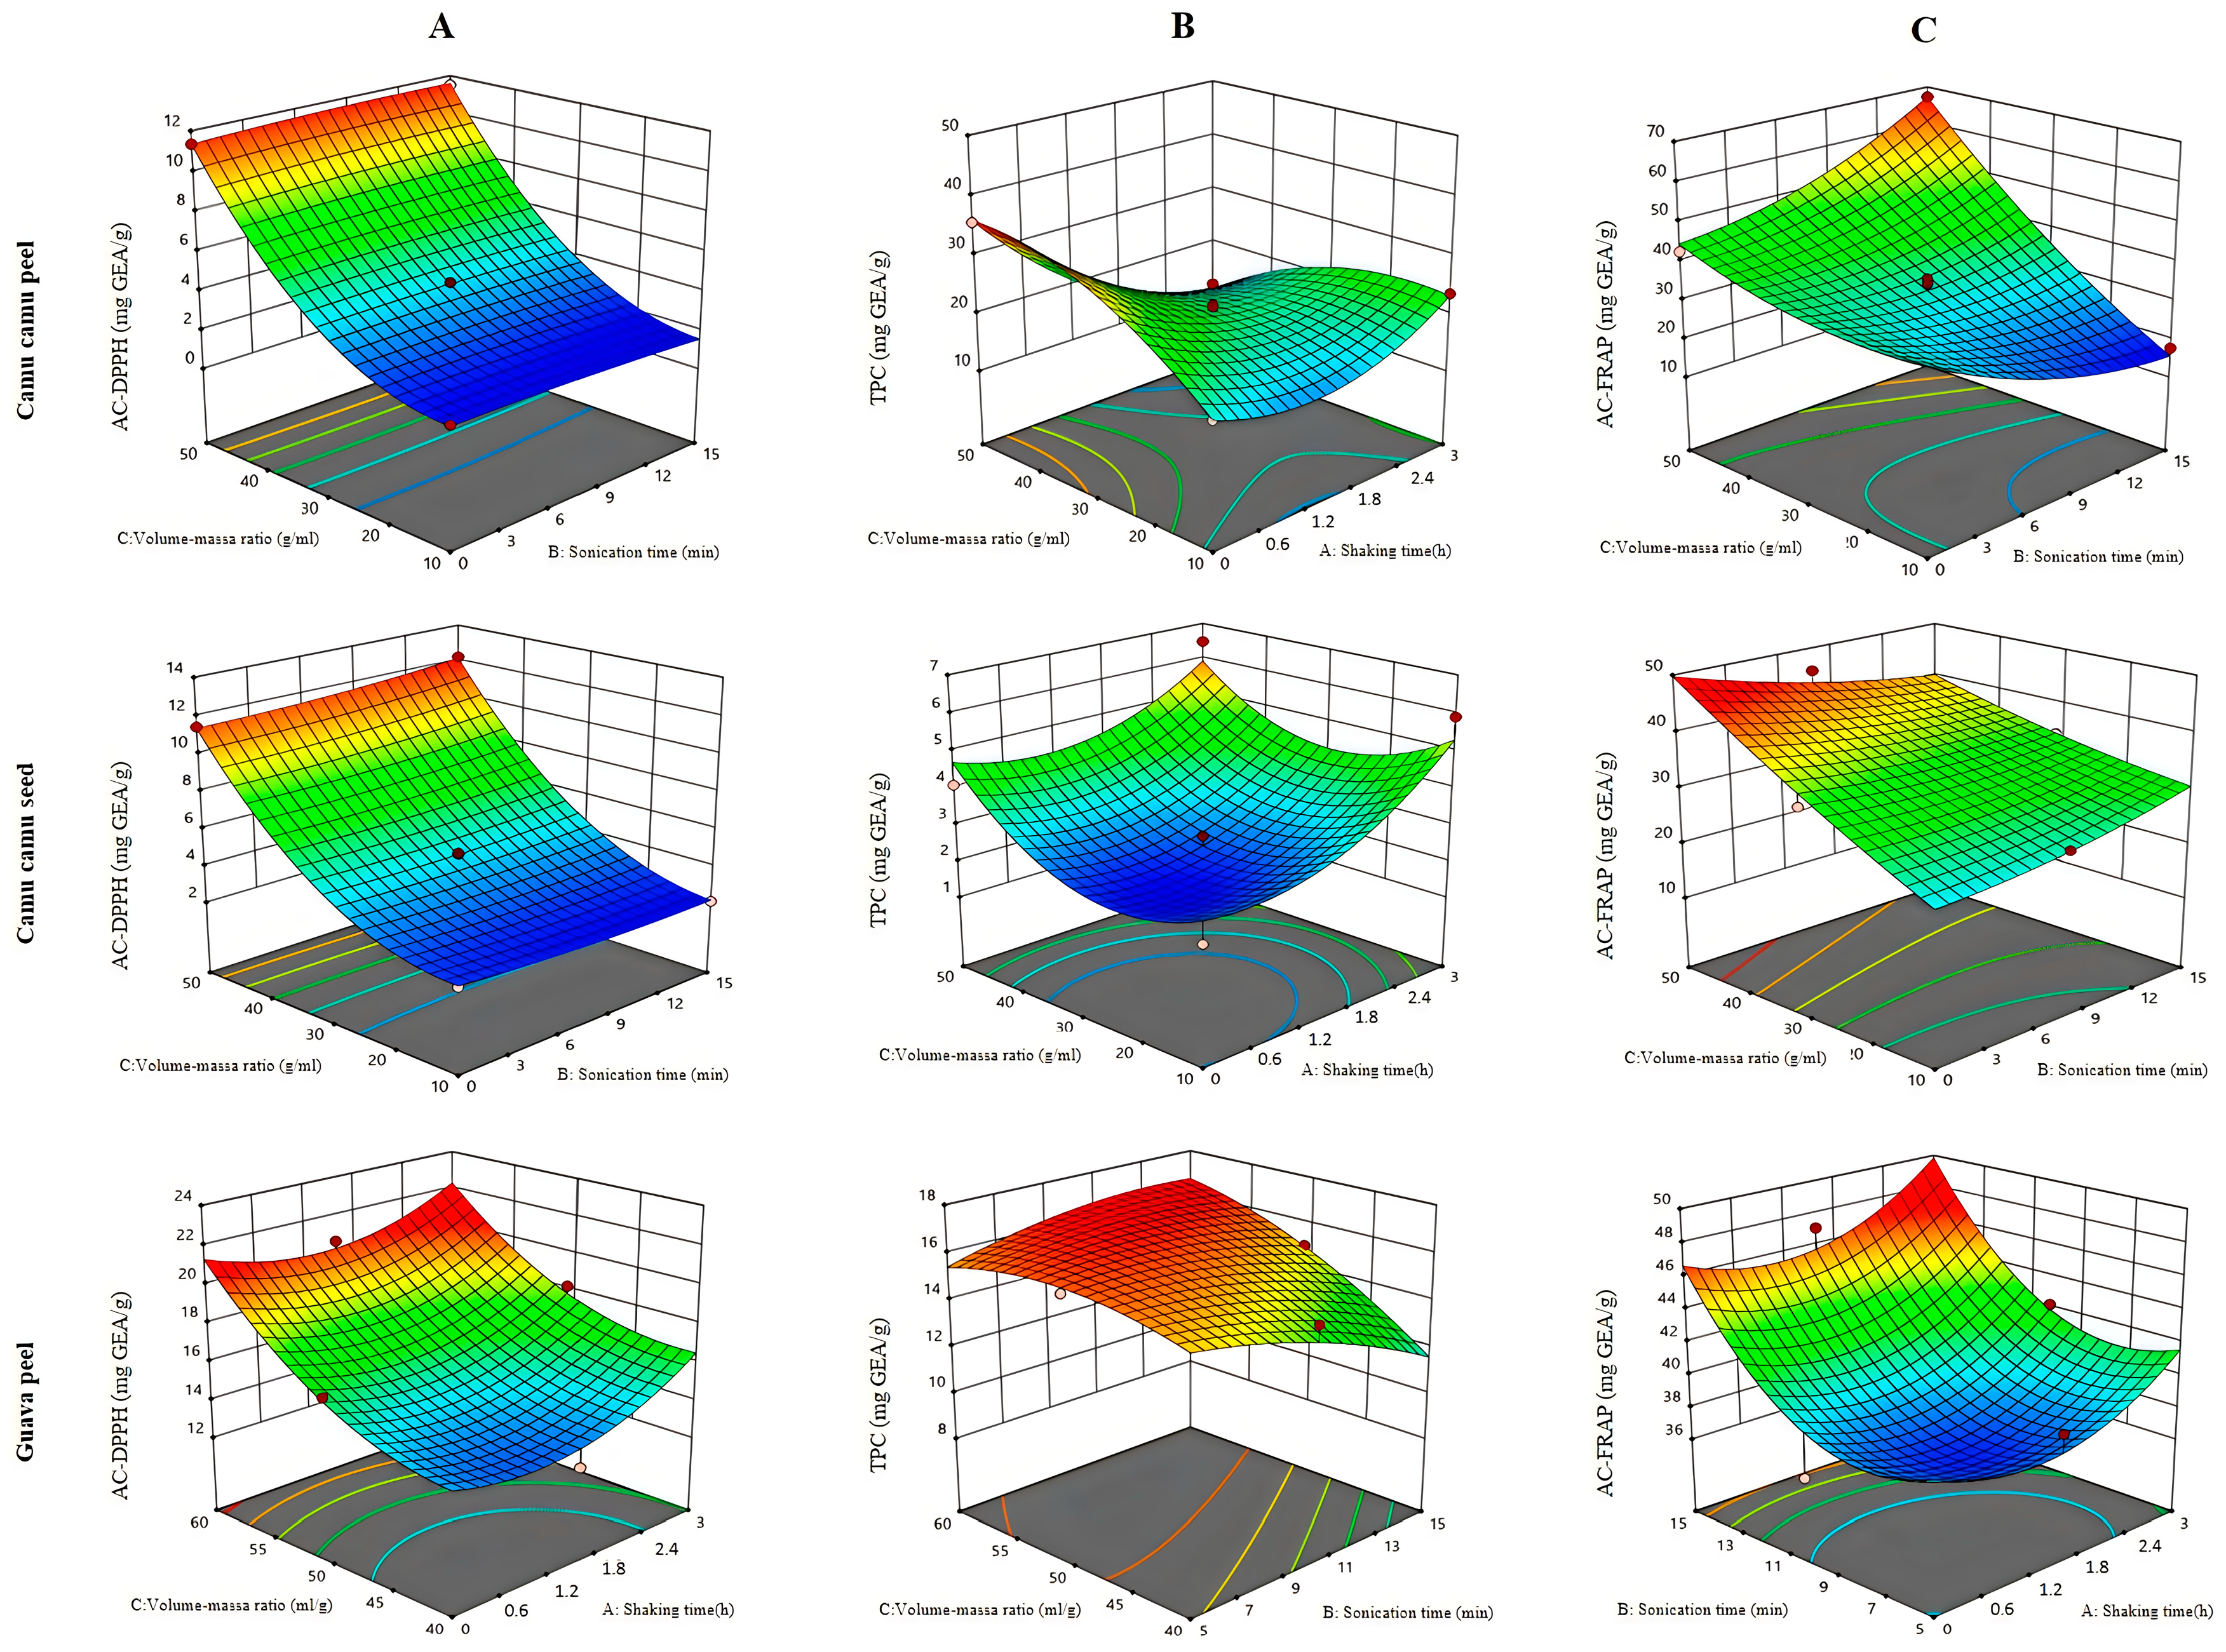
3.2.1. Ultrasound-Assisted Extraction

Figure 5 shows the interactions of the factors that were significant (p < 0.05). The antioxidant capacities (DPPH and FRAP) of M. dubia shells and seeds were significantly affected by the volume–mass ratio and sonication time. An increase in sonication time negatively affected the antioxidant capacity according to the FRAP technique, while the values determined by the DPPH technique were kept constant. This could be due to the mechanisms of action of the techniques in addition to the fact that, in some cases, FRAP is more sensitive, and the polarity of the sample may impact the effectiveness of each technique. [80,81].
A solution with a high concentration of solid material limited the action of the solvent and could not extract all the compounds present from the material; consequently, low levels of antioxidant capacity were obtained [82,83]. In addition, sonication ruptured the cell membrane, thereby increasing the availability of bioactive compounds in the plant environment. However, prolonged sonication could increase the number of free radicals; therefore, the antioxidant compounds could become oxidized [84,85,86,87]. In the extraction of phenolic compounds from the M. dubia shell, by decreasing the amount of solvent in the solid and increasing the stirring time, the TPC decreased; however, the effect of the interaction of both factors led to an initial increase and then a slight decrease. Conversely, when using M. dubia seeds, an increase in the TPC was observed as the amount of solvent increased, and a relatively long stirring time was favorable for the extraction of phenolic compounds. The effect of the interaction of both factors showed an initial instantaneous decrease and a subsequent increase in the response (upward curvature) (Figure 5).
A high volume–mass ratio and long stirring time also favored the breakdown of the cell wall, increasing the contact surface between the solvent and the plant material, which resulted in increased extraction [71,83,88]. However, long extraction times would not necessarily improve the extraction of compounds and could even lead to their degradation.
Figure 2 shows that, to obtain P. guajava shell extracts, increasing the amount of solvent and enhancing its interaction with stirring time increased the antioxidant capacity obtained by the DPPH method. The high antioxidant capacity was attributed to the fact that, when more solvent was available, the compounds were more easily solubilized and extracted [89]. However, the TPC decreased with increasing sonication time, and it first increased and then decreased slightly with increasing solvent amount. Moreover, the interaction of both factors led to an increase in the TPC. Phenolic compounds are usually bound to traces of pectin, cellulose, hemicellulose and lignin in the cell wall, and sonication increases their release through the collapse of the particles [90,91].
The application of sonication and agitation and their interaction allow for the initial reduction in the antioxidant activity measured by the FRAP method to later increase (Figure 5). During the first stage of extraction, compounds such as anthocyanins are resistant to diffusion, which is conducive to their extraction [92].

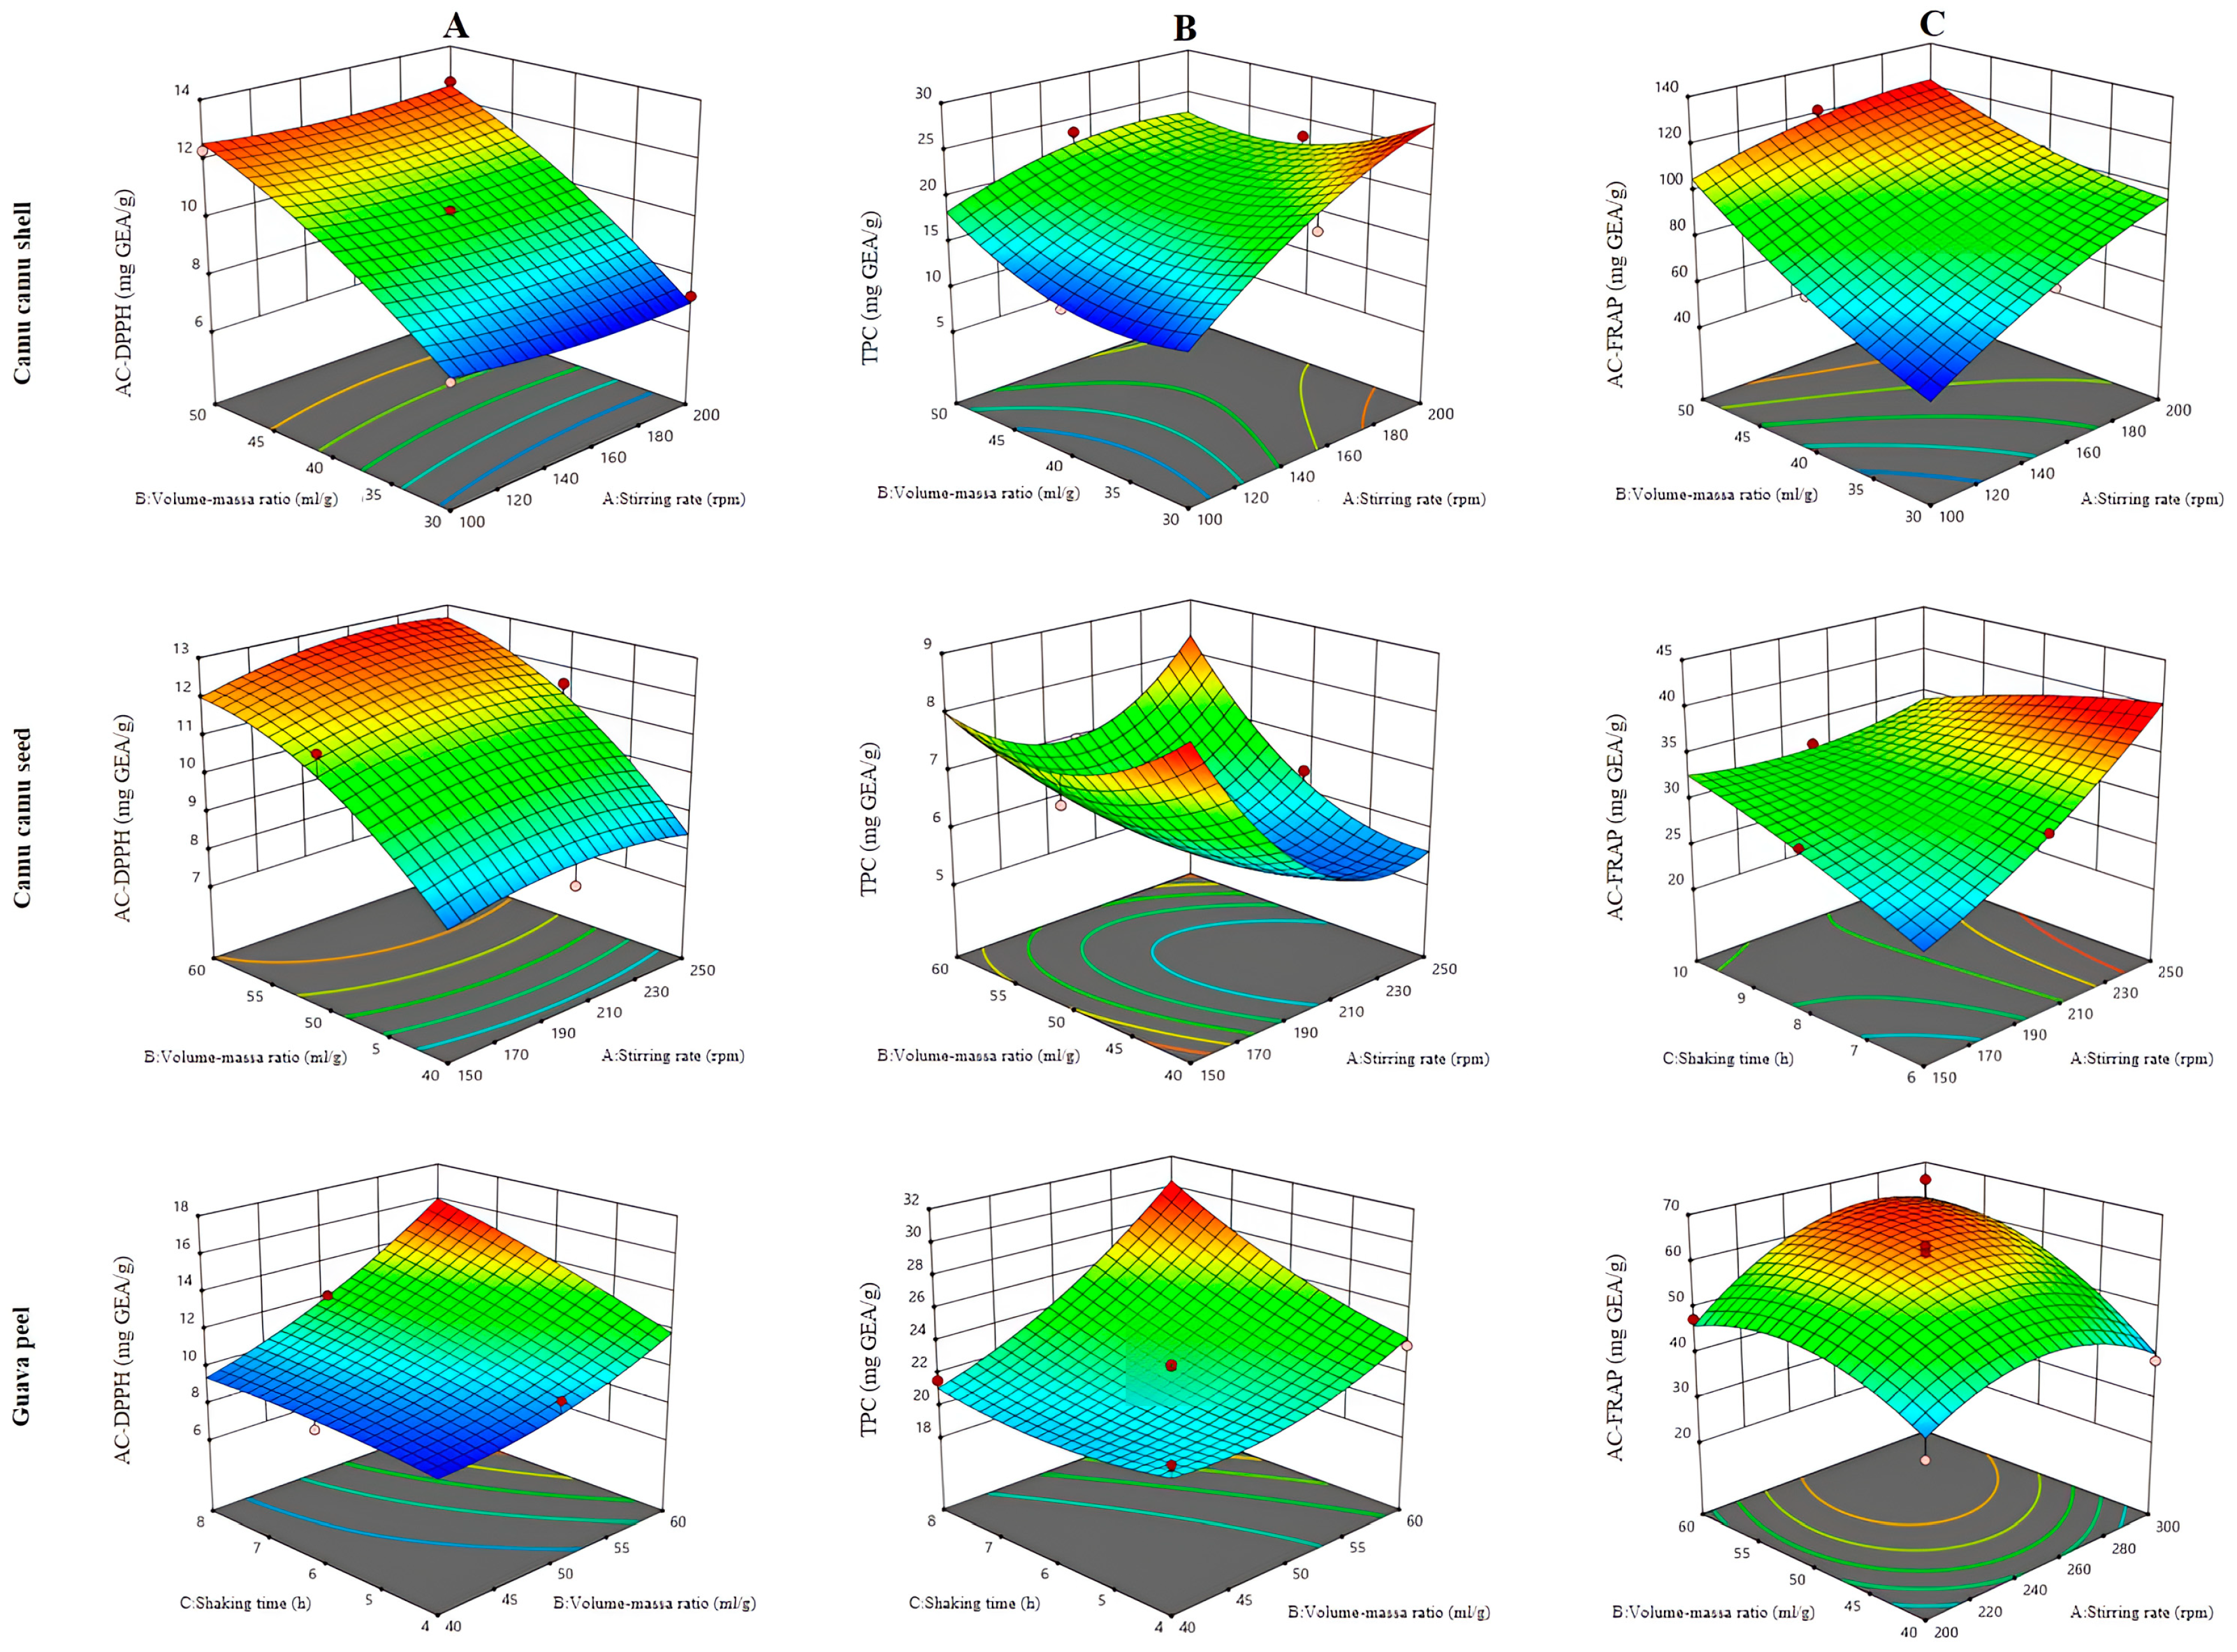
3.2.2. Extraction by Mechanical Stirring

Figure 6 shows the interactions of the factors that were significant (p < 0.05). With respect to the M. dubia shell extracts, increasing the stirring speed positively affected the TPC and antioxidant capacity, as measured by FRAP; however, the antioxidant capacity, as measured by DPPH, remained constant. The addition of solvent and the interaction of both factors increased the antioxidant capacity (DPPH and FRAP) and TPC. The solvent and the plant material had relatively great cohesion at long extraction times, which facilitated the diffusion of the compounds. The stirring speed also affected the mass transfer between the material and the solvent due to the alteration of the cell walls, facilitating the introduction of the solvent into the material and the extraction of compounds [83,93].
During the extraction of bioactive compounds from M. dubia seeds, the antioxidant capacity measured by DPPH remained constant with increasing stirring speed and increased with increasing solvent and interaction between the two factors. As the stirring speed increased, the TPC decreased, while it increased for treatments with additional solvent and with the interaction of the factors. Conversely, the time, stirring speed and interaction between both factors were favorable parameters for the antioxidant capacity when evaluated by FRAP (Figure 3). The results obtained corroborated those reported by [83].
As shown in Figure 6, the stirring time did not affect the antioxidant capacity, as determined by the DPPH and TPC of the P. guajava shell extracts. Stirring at high speeds improved the values of these parameters. There was a prominent initial increase and subsequent decrease in the antioxidant capacity measured by the FRAP method due to the interaction of the addition of the solvent with the stirring speed. A high amount of available solvent was favorable for extraction, although after a certain concentration, saturation could occur [82].

3.2.3. Optimized Extract Collection Models

The results in Table 5 present the optimal factors for each response variable and their predicted values for each extraction method. The results indicated that all the models could obtain optimal values, except for the TPC of CCS for UAE and the AC-DPPH of CCP for MS. The desirability of the UAE models was greater than 0.83, while for the MS models, it was greater than 0.99, indicating that the MS models were better than the UAE models.
The antioxidant capacities determined by means of DPPH and FRAP of the M. dubia husk extract obtained by UAE were lower than those of the extract obtained by MS, although the opposite trend was observed for the TPC. The antioxidant capacity measured by DPPH and TPC (12.1 and 6.2 mg GAE/g, respectively) of the M. dubia seed extract obtained by UAE was lower than that of the extract obtained by MS (12.8 and 8.5 mg GAE/g, respectively); however, the antioxidant capacity measured by FRAP for UAE was greater than that of MS. The TPC and FRAP antioxidant capacities determined for the P. guajava shell extract obtained by UAE were lower than those of the extract obtained by MS, which differed from the trend of the antioxidant capacity determined by DPPH.
According to Tungmunnithum et al. [94], in terms of extraction time, in this study, it was evidenced that UAE (<15 min) is more efficient to extract bioactive compounds compared to other extraction methods (>2 h). However, Abd-Elsalam et al. [95] showed that, in terms of yield and extraction time, the UAE method (60 min) is less efficient than the microwave-assisted extraction method (1 min).

3.2.4. Prediction Model Validation

For both extraction methods, experiments were carried out to validate the extraction parameters optimized for the antioxidant activity and total phenolic content of the extracts of three byproducts (Table 6 and Table 7). The experimental results for the extraction carried out according to the optimal conditions were close to those predicted by the optimization models. Furthermore, the values of compound desirability were close to 1 (>0.88), indicating that the models could be used to optimize the extraction factors.
Table 6 indicates the optimal parameters for the UAE process. To extract compounds from M. dubia and P. guajava shell extracts, no agitation was needed; however, prolonged sonication (15 min) and a high solvent content (50 and 60 mL/g, respectively) were necessary. Conversely, a high solvent content (50 mL/g), a short sonication time (4.4 min) and a long stirring time (3 h) were needed for M. dubia seed extracts. These methods could be effective due to the action of ultrasonic waves, the amount of solvent and agitation on the cell membrane leading to the release of compounds [75,93,96].
Table 7 indicates the optimal factors for the MS compound extraction process. To extract compounds from M. dubia and P. guajava shell extracts, a short stirring time (2 h), a high solvent content (50 mL/g) and a moderate stirring speed (172.24 rpm) were needed. For M. dubia seed and P. guajava shell extracts, prolonged agitation (6.39 and 7.72 h, respectively), a high solvent content (60 mL/g) and a high agitation speed (250 and 256 rpm, respectively) were needed. These factors could be effective for extracting bioactives because the speed and time of agitation influenced the rupture of the membrane of the material; together with the content of the solvent, these parameters improved the contact between the plant material and the solvent, facilitating the diffusion of compounds [83,93,97].
The use of UAE for extraction of bioactive compounds could be comparable to microwave-assisted extraction systems [98,99], obtaining times and a solvent-to-material ratio similar to those found in this research.
In this study, the models optimized for the MS method yielded better results than those optimized for the UAE method for the three plant sources; however, the UAE method yielded better results for AC, as determined by the P. guajava shell DPPH AC, M. dubia shell TPC and FRAP AC and M. dubia seed FRAP AC. Therefore, the plant source, extraction method and compound determination technique influenced the values observed and were specific to the extraction of certain compounds.

4. Conclusions

In the present investigation, the bioactive extraction of byproducts of M. dubia and P. guajava through ultrasound-assisted extraction and mechanical agitation techniques was successfully optimized using response surface methodology with a Box–Behnken design. The extraction parameters were optimized to achieve the highest yield of total phenolic content and antioxidant capacity. The values of p < 0.05 and high values of R2 (>0.8361) confirmed the reliability of the models. The optimized designs demonstrated that mechanical agitation was more efficient than ultrasound-assisted extraction. For both extraction methods, the optimal volume–mass ratio was the highest for all the materials studied. The optimal shaking and sonication times using the ultrasound-assisted extraction method were 0 h and 15 min, respectively, for the camu-camu peel and guava peel, while for camu-camu seed, the optimal shaking and sonication times were 3 h and 4.42 min, respectively. Conversely, for the mechanical agitation method, the optimal stirring times for camu-camu peel, camu-camu seed and guava peel were 2.00, 6.39 and 7.72 h, respectively, and the ideal stirring speeds were 172.2, 250.0 and 256.3 rpm, respectively. Under the abovementioned conditions, most of the highest values of total phenolic content and antioxidant capacity (DPPH and FRAP) were of the bioactive extracts obtained by mechanical agitation. Furthermore, the validation experiments supported the models proposed for both extraction methods. In the present study, the studied materials were shown to be promising sources of bioactive compounds. In addition, these models could serve as efficient and ecological strategies for the use of bioactive compounds from plant sources on an industrial scale. Similarly, the reuse of waste from the food industry as a bioactive source could reduce its environmental impact.

Author Contributions

L.C.C.C.: Conceptualization, investigation, Methodology, Data curation, Writing-original draft, Writing—review and editing and funding acquisition; S.G.C.: Conceptualization, Methodology, Data curation, Review and editing and Software; C.d.S.F.: Methodology, Data curation, Review and editing and Software. All authors have read and agreed to the published version of the manuscript.

Funding

This research and the APC were funded by the National Program for Scientific Research and Advanced Studies (PROCIENCIA) grant number PE501081779-2022_01.

Data Availability Statement

Data supporting the findings of this study are available from the corresponding author upon reasonable request.

Acknowledgments

The authors wish to thank the Programa Nacional de Investigación Científica y de Estudios Avanzados (PROCIENCIA), Peru, for the financial support and APC of this research under contract number PE501081779-2022_01, in the framework of the competition E074-2022-01 “Thesis and Internships in Science, Technology and Innovation”.

Conflicts of Interest

The authors declare that they have no conflicts of interest.

References

  1. Ueda, J.M.; Pedrosa, M.C.; Heleno, S.A.; Carocho, M.; Ferreira, I.C.F.R.; Barros, L. Food Additives from Fruit and Vegetable By-Products and Bio-Residues: A Comprehensive Review Focused on Sustainability. Sustainability 2022, 14, 5212. [Google Scholar] [CrossRef]
  2. Sagar, N.A.; Pareek, S.; Sharma, S.; Yahia, E.M.; Lobo, M.G. Fruit and Vegetable Waste: Bioactive Compounds, Their Extraction, and Possible Utilization. Compr. Rev. Food Sci. Food Saf. 2018, 17, 512–531. [Google Scholar] [CrossRef] [PubMed]
  3. Oliver-Simancas, R.; Labrador-Fernández, L.; Díaz-Maroto, M.C.; Pérez-Coello, M.S.; Alañón, M.E. Comprehensive research on mango by-products applications in food industry. Trends Food Sci. Technol. 2021, 118, 179–188. [Google Scholar] [CrossRef]
  4. De Souza Schmidt Gonçalves, A.E.; Lajolo, F.M.; Genovese, M.I. Chemical composition and antioxidant/antidiabetic potential of brazilian native fruits and commercial frozen pulps. J. Agric. Food Chem. 2010, 58, 4666–4674. [Google Scholar] [CrossRef] [PubMed]
  5. Alvarez-Suarez, J.M.; Giampieri, F.; Gasparrini, M.; Mazzoni, L.; Forbes-Hernández, T.Y.; Afrin, S.; Battino, M. Guava (Psidium guajava L. cv. Red Suprema) Crude Extract Protect Human Dermal Fibroblasts against Cytotoxic Damage Mediated by Oxidative Stress. Plant Foods Hum. Human. Nutr. 2018, 73, 18–24. [Google Scholar] [CrossRef]
  6. Santos, I.L.; Miranda, L.C.F.; da Cruz Rodrigues, A.M.; da Silva, L.H.M.; Amante, E.R. Camu-camu [Myrciaria dubia (HBK) McVaugh]: A review of properties and proposals of products for integral valorization of raw material. Food Chem. 2022, 372, 131290. [Google Scholar] [CrossRef] [PubMed]
  7. Chagas, E.G.L.D.; Vanin, F.M.; Garcia, V.A.D.S.; Yoshida, C.M.P.; de Carvalho, R.A. Enrichment of antioxidants compounds in cookies produced with camu-camu (Myrciaria dubia) coproducts powders. LWT 2021, 137, 110472. [Google Scholar] [CrossRef]
  8. Fidelis, M.; do Carmo, M.A.V.; da Cruz, T.M.; Azevedo, L.; Myoda, T.; Furtado, M.M.; Marques, M.B.; Sant’Ana, A.S.; Genovese, M.I.; Oh, W.Y.; et al. Camu-camu seed (Myrciaria dubia)–From side stream to an antioxidant, antihyperglycemic, antiproliferative, antimicrobial, antihemolytic, anti-inflammatory, and antihypertensive ingredient. Food Chem. 2020, 310, 125909. [Google Scholar] [CrossRef] [PubMed]
  9. Neves, L.C.; da Silva, V.X.; Pontis, J.A.; Flach, A.; Roberto, S.R. Bioactive compounds and antioxidant activity in pre-harvest camu-camu [Myrciaria dubia (H.B.K.) Mc Vaugh] fruits. Sci. Hortic. 2015, 186, 223–229. [Google Scholar] [CrossRef]
  10. Darmasiwi, S.; Herawati, O.; Retnaningrum, E. Edible biofilm formation from guava seed waste fermentation. Digit. Press. Phys. Sci. Eng. 2018, 1, 00005. [Google Scholar] [CrossRef]
  11. Gullón, B.; Muñiz-Mouro, A.; Lú-Chau, T.A.; Moreira, M.T.; Lema, J.M.; Eibes, G. Green approaches for the extraction of antioxidants from eucalyptus leaves. Ind. Crops Prod. 2019, 138, 111473. [Google Scholar] [CrossRef]
  12. Belwal, T.; Ezzat, S.M.; Rastrelli, L.; Bhatt, I.D.; Daglia, M.; Baldi, A.; Devkota, H.P.; Orhan, I.E.; Patra, J.K.; Das, G. A critical analysis of extraction techniques used for botanicals: Trends, priorities, industrial uses and optimization strategies. TrAC Trends Anal. Chem. 2018, 100, 82–102. [Google Scholar] [CrossRef]
  13. Hadidi, M.; Ibarz, A.; Pouramin, S. Optimization of extraction and deamidation of edible protein from evening primrose (Oenothera biennis L.) oil processing by-products and its effect on structural and techno-functional properties. Food Chem. 2021, 334, 127613. [Google Scholar] [CrossRef] [PubMed]
  14. Wu, W.; Zhao, S.; Chen, C.; Ge, F.; Liu, D.; He, X. Optimization of production conditions for antioxidant peptides from walnut protein meal using solid-state fermentation. Food Sci. Biotechnol. 2014, 23, 1941–1949. [Google Scholar] [CrossRef]
  15. Hadidi, M.; Tan, C.; Assadpour, E.; Jafari, S.M. Oilseed meal proteins: From novel extraction methods to nanocarriers of bioactive compounds. Food Chem. 2024, 438, 137971. [Google Scholar] [CrossRef] [PubMed]
  16. Khan, M.K.; Abert-Vian, M.; Fabiano-Tixier, A.S.; Dangles, O.; Chemat, F. Ultrasound-assisted extraction of polyphenols (flavanone glycosides) from orange (Citrus sinensis L.) peel. Food Chem. 2010, 119, 851–858. [Google Scholar] [CrossRef]
  17. Soquetta, M.B.; Terra, L.D.M.; Bastos, C.P. Green technologies for the extraction of bioactive compounds in fruits and vegetables. CyTA-J. Food 2018, 16, 400–412. [Google Scholar] [CrossRef]
  18. Picot-Allain, C.; Mahomoodally, M.F.; Ak, G.; Zengin, G. Conventional versus green extraction techniques—A comparative perspective. Curr. Opin. Food Sci. 2021, 40, 144–156. [Google Scholar] [CrossRef]
  19. Adetunji, L.R.; Adekunle, A.; Orsat, V.; Raghavan, V. Advances in the pectin production process using novel extraction techniques: A review. Food Hydrocoll. 2017, 62, 239–250. [Google Scholar] [CrossRef]
  20. Tiwari, B.K. Ultrasound: A clean, green extraction technology. TrAC Trends Anal. Chem. 2015, 71, 100–109. [Google Scholar] [CrossRef]
  21. Palma, A.; Ruiz-Montoya, M.; Díaz, M.J.; Giráldez, I.; Morales, E. Optimization of bioactive compounds by ultrasound extraction and gas chromatography-mass spectrometry in fast-growing leaves. Microchem. J. 2023, 193, 109231. [Google Scholar] [CrossRef]
  22. Moorthy, I.G.; Maran, J.P.; Ilakya, S.; Anitha, S.L.; Sabarima, S.P.; Priya, B. Ultrasound assisted extraction of pectin from waste Artocarpus heterophyllus fruit peel. Ultrason. Sonochem 2017, 34, 525–530. [Google Scholar] [CrossRef] [PubMed]
  23. Ghafoor, K.; Al Juhaimi, F.; Özcan, M.M.; Uslu, N.; Babiker, E.E.; Ahmed, I.A.M. Bioactive properties and phenolic compounds in bud, sprout, and fruit of Capparis spp. plants. J. Food Process Preserv. 2020, 44, e14357. [Google Scholar] [CrossRef]
  24. Sultana, B.; Anwar, F.; Ashraf, M. Effect of Extraction Solvent/Technique on the Antioxidant Activity of Selected Medicinal Plant Extracts. Molecules 2009, 14, 2167–2180. [Google Scholar] [CrossRef] [PubMed]
  25. Kim, M.K.; Park, G.; Ji, Y.; Lee, Y.G.; Choi, M.; Go, S.H.; Son, M.; Jang, Y.P. Design of Experiments-Based Optimization of Flavonoids Extraction from Daphne genkwa Flower Buds and Flavonoids Contents at Different Blooming Stages. Plants 2022, 11, 925. [Google Scholar] [CrossRef] [PubMed]
  26. Das, P.R.; Eun, J.B. A comparative study of ultra-sonication and agitation extraction techniques on bioactive metabolites of green tea extract. Food Chem. 2018, 253, 22–29. [Google Scholar] [CrossRef] [PubMed]
  27. Zainol, N.; Aziz, N.H.; Baharudin, A.S. Influence of agitation and solvent percentage on the extraction of phytochemical compound from Asystasia gangetica. Food Chem. Adv. 2023, 3, 100538. [Google Scholar] [CrossRef]
  28. Zamboi, A.; Garofalo, S.F.; Tommasi, T.; Fino, D. Optimization of ultrasounds assisted extraction of polysaccharides from cladodes of Opuntia ficus-indica using response surface methodology. Sustain. Chem. Pharm. 2024, 37, 101348. [Google Scholar] [CrossRef]
  29. Paneerselvam, P.; Panithasan, M.S.; Venkadesan, G. RSM optimization of ultrasound-assisted melia dubia oil extraction with green solvents and their suitability for diesel engine applications. Renew. Energy 2024, 222, 119925. [Google Scholar] [CrossRef]
  30. Mariappan, M.; Panithasan, M.S.; Venkadesan, G. Pyrolysis plastic oil production and optimisation followed by maximum possible replacement of diesel with bio-oil/methanol blends in a CRDI engine. J. Clean. Prod. 2021, 312, 127687. [Google Scholar] [CrossRef]
  31. Principle, A.; Apparatus, B. 49.2.19A AOAC Official Method 994.08 Aflatoxins in Corn, Almonds, Brazil Nuts, Peanuts, and Pistachio Nuts; AOAC: Rockville, MD, USA, 2000; pp. 4–5. Available online: https://www.researchgate.net/publication/292783651_AOAC_2005 (accessed on 12 May 2023).
  32. Jangam, S.V.; Thorat, B.N. Optimization of Spray Drying of Ginger Extract. Dry. Technol. 2010, 28, 1426–1434. [Google Scholar] [CrossRef]
  33. Cai, Y.Z.; Corke, H. Production and properties of spray-dried Amaranthus betacyanin pigments. J. Food Sci. 2000, 65, 1248–1252. [Google Scholar] [CrossRef]
  34. Santhalakshmy, S.; Bosco, S.J.D.; Francis, S.; Sabeena, M. Effect of inlet temperature on physicochemical properties of spray-dried jamun fruit juice powder. Powder Technol. 2015, 274, 37–43. [Google Scholar] [CrossRef]
  35. Nowicka, P.; Wojdyło, A.; Tkacz, K.; Turkiewicz, I.P. Quantitative and qualitative determination of carotenoids and polyphenolics compounds in selected cultivars of Prunus persica L. and their ability to in vitro inhibit lipoxygenase, cholinoesterase, α-amylase, α-glucosidase and pancreatic lipase. Food Chem X 2023, 17, 100619. [Google Scholar] [CrossRef] [PubMed]
  36. Rosales-Chimal, S.; Navarro-Cortez, R.O.; Bello-Perez, L.A.; Vargas-Torres, A.; Palma-Rodríguez, H.M. Optimal conditions for anthocyanin extract microencapsulation in taro starch: Physicochemical characterization and bioaccessibility in gastrointestinal conditions. Int. J. Biol. Macromol. 2023, 227, 83–92. [Google Scholar] [CrossRef]
  37. Mu, H.; Song, Z.; Wang, X.; Wang, D.; Zheng, X.; Li, X. Microencapsulation of algae oil by complex coacervation of chitosan and modified starch: Characterization and oxidative stability. Int. J. Biol. Macromol. 2022, 194, 66–73. [Google Scholar] [CrossRef] [PubMed]
  38. Cortez-Trejo, M.C.; Wall-Medrano, A.; Gaytán-Martínez, M.; Mendoza, S. Microencapsulation of pomegranate seed oil using a succinylated taro starch: Characterization and bioaccessibility study. Food Biosci. 2021, 41, 100929. [Google Scholar] [CrossRef]
  39. Rodrigues, L.M.; Romanini, E.B.; Silva, E.; Pilau, E.J.; da Costa, S.C.; Madrona, G.S. Camu-camu bioactive compounds extraction by ecofriendly sequential processes (ultrasound assisted extraction and reverse osmosis). Ultrason. Sonochem 2020, 64, 105017. [Google Scholar] [CrossRef] [PubMed]
  40. Ferreira, B.L.; Junior, T.K.; Block, J.M.; Granato, D.; Nunes, I.L. Innovative approach for obtaining phenolic compounds from guava (Psidium guajava L.) coproduct using ionic liquid ultrasound-assisted extraction (IL-UAE). Biocatal. Agric. Biotechnol. 2021, 38, 102196. [Google Scholar] [CrossRef]
  41. Wang, Z.; Mei, X.; Chen, X.; Rao, S.; Ju, T.; Li, J.; Yang, Z. Extraction and recovery of bioactive soluble phenolic compounds from brocade orange (Citrus sinensis) peels: Effect of different extraction methods thereon. LWT 2023, 173, 114337. [Google Scholar] [CrossRef]
  42. Gualberto, N.C.; de Oliveira, C.S.; Nogueira, J.P.; de Jesus, M.S.; Araujo, H.C.S.; Rajan, M.; Neta, M.T.S.L.; Narain, N. Bioactive compounds and antioxidant activities in the agro-industrial residues of acerola (Malpighia emarginata L.), guava (Psidium guajava L.), genipap (Genipa americana L.) and umbu (Spondias tuberosa L.) fruits assisted by ultrasonic or shaker extraction. Food Res. Int. 2021, 147, 110538. [Google Scholar] [CrossRef] [PubMed]
  43. De Carrasco, R.R.; René, C.; Zelada, E. Determinación de la capacidad antioxidante y compuestos bioactivos de frutas nativas peruanas. Rev. De. La. Soc. Química Del. Perú 2008, 74, 108–124. Available online: http://www.scielo.org.pe/scielo.php?script=sci_arttext&pid=S1810-634X2008000200004&lng=es&nrm=iso&tlng=es (accessed on 13 October 2022).
  44. da Silva, M.R.; Bragagnolo, F.S.; Carneiro, R.L.; Pereira, I.D.O.C.; Ribeiro, J.A.A.; Rodrigues, C.M.; Jelley, R.E.; Fedrizzi, B.; Funari, C.S. Metabolite characterization of fifteen by-products of the coffee production chain: From farm to factory. Food Chem. 2022, 369, 130753. [Google Scholar] [CrossRef] [PubMed]
  45. Chaillou, L.L.; Nazareno, M.A. New Method to Determine Antioxidant Activity of Polyphenols. J. Agric. Food Chem. 2006, 54, 8397–8402. [Google Scholar] [CrossRef] [PubMed]
  46. Singleton, V.L.; Rossi, J.A. Colorimetry of Total Phenolics with Phosphomolybdic-Phosphotungstic Acid Reagents. Am. J. Enol. Vitic. 1965, 16, 144–158. [Google Scholar] [CrossRef]
  47. Dos Santos Ferreira, C.I.; Pereyra, A.; Patriarca, A.R.; Mazzobre, M.F.; Polak, T.; Abram, V.; Buera, M.D.P.; Poklar Ulrih, N. Phenolic Compounds in Extracts from Eucalyptus globulus Leaves and Calendula officinalis Flowers. J. Nat. Prod. Resour. 2016, 2, 53–57. Available online: http://www.jacsdirectory.com/jnpr (accessed on 16 May 2023).
  48. Saura-Calixto, F.; Goñi, I. Antioxidant capacity of the Spanish Mediterranean diet. Food Chem. 2006, 94, 442–447. [Google Scholar] [CrossRef]
  49. Pulido, R.; Bravo, L.; Saura-Calixto, F. Antioxidant Activity of Dietary Polyphenols as Determined by a Modified Ferric Reducing/Antioxidant Power Assay. J. Agric. Food Chem. 2000, 48, 3396–3402. [Google Scholar] [CrossRef] [PubMed]
  50. Benzie, I.F.F.; Strain, J.J. The Ferric Reducing Ability of Plasma (FRAP) as a Measure of ‘Antioxidant Power’: The FRAP Assay. Anal. Biochem. 1996, 239, 70–76. [Google Scholar] [CrossRef] [PubMed]
  51. Ahmad-Qasem, M.H.; Barrajón-Catalán, E.; Micol, V.; Mulet, A.; García-Pérez, J.V. Influence of freezing and dehydration of olive leaves (var. Serrana) on extract composition and antioxidant potential. Food Res. Int. 2013, 50, 189–196. [Google Scholar] [CrossRef]
  52. Casarotti, S.N.; Borgonovi, T.F.; Batista, C.L.F.M.; Penna, A.L.B. Guava, orange and passion fruit by-products: Characterization and its impacts on kinetics of acidification and properties of probiotic fermented products. LWT 2018, 98, 69–76. [Google Scholar] [CrossRef]
  53. Muniz, C.E.S.; Santiago, Â.M.; Gusmão, T.A.S.; Oliveira, H.M.L.; de Sousa Conrado, L.; de Gusmão, R.P. Solid-state fermentation for single-cell protein enrichment of guava and cashew by-products and inclusion on cereal bars. Biocatal. Agric. Biotechnol. 2020, 25, 101576. [Google Scholar] [CrossRef]
  54. Grigio, M.L.; Chagas, E.A.; Rathinasabapathi, B.; Chagas, P.C.; da Silva AR, V.; Sobral ST, M.; de Oliveira, R.R. Qualitative evaluation and biocompounds present in different parts of camu-camu (Myrciaria dubia) fruit. Afr. J. Food Sci. 2017, 11, 124–129. [Google Scholar] [CrossRef]
  55. da Silveira, J.S.; Durand, N.; Lacour, S.; Belleville, M.P.; Perez, A.; Loiseau, G.; Dornier, M. Solid-state fermentation as a sustainable method for coffee pulp treatment and production of an extract rich in chlorogenic acids. Food Bioprod. Process. 2019, 115, 175–184. [Google Scholar] [CrossRef]
  56. Buljat, A.M.; Jurina, T.; Tušek, A.J.; Valinger, D.; Kljusuric, J.G.; Benkovic, M. Applicability of foam mat drying process for production of instant cocoa powder enriched with lavender extract. Food Technol. Biotechnol. 2019, 57, 159–170. [Google Scholar] [CrossRef] [PubMed]
  57. Domian, E.; Poszytek, K. Wheat flour flow ability as affected by water activity, storage time and consolidation. Int. Agrophys. 2005, 19. [Google Scholar]
  58. Geldart, D.; Harnby, N.; Wong, A.C. Fluidization of cohesive powders. Powder Technol. 1984, 37, 25–37. [Google Scholar] [CrossRef]
  59. Rodríguez-Hernández, G.R.; González-García, R.; Grajales-Lagunes, A.; Ruiz-Cabrera, M.A.; Abud-Archila, M. Spray-drying of cactus pear juice (Opuntia streptacantha): Effect on the physicochemical properties of powder and reconstituted product. Dry. Technol. 2005, 23, 955–973. [Google Scholar] [CrossRef]
  60. Phoungchandang, S.; Sertwasana, A. Spray-drying of ginger juice and physicochemical properties of ginger powders. ScienceAsia 2010, 36, 40–45. [Google Scholar] [CrossRef]
  61. Bonazzi, C.; Dumoulin, E. Quality Changes in Food Materials as Influenced by Drying Processes. Mod. Dry. Technol. 2011, 3, 1–20. [Google Scholar] [CrossRef]
  62. Quek, S.Y.; Chok, N.K.; Swedlund, P. The physicochemical properties of spray-dried watermelon powders. Chem. Eng. Process. Process Intensif. 2007, 46, 386–392. [Google Scholar] [CrossRef]
  63. Tarone, A.G.; Cazarin, C.B.B.; Junior, M.R.M. Anthocyanins: New techniques and challenges in microencapsulation. Food Res. Int. 2020, 133, 109092. [Google Scholar] [CrossRef] [PubMed]
  64. Miranda, P.H.S.; Santos, A.C.D.; de Freitas, B.C.B.; dos Santos, A.C.; de Freitas, B.C.B.; Damiani, C. A scientific approach to extraction methods and stability of pigments from Amazonian fruits. Trends Food Sci. Technol. 2021, 113, 335–345. [Google Scholar] [CrossRef]
  65. Sigurdson, G.T.; Tang, P.; Giusti, M.M. Natural Colorants: Food Colorants from Natural Sources. Annu. Rev. Food Sci. Technol. 2017, 8, 261–280. [Google Scholar] [CrossRef] [PubMed]
  66. Zheng, B.; Zhao, Q.; Wu, H.; Ma, X.; Xu, W.; Li, L.; Liang, Q.; Wang, S. Metabolomics and transcriptomics analyses reveal the potential molecular mechanisms of flavonoids and carotenoids in guava pulp with different colors. Sci. Hortic. 2022, 305, 111384. [Google Scholar] [CrossRef]
  67. Fracassetti, D.; Costa, C.; Moulay, L.; Tomás-Barberán, F.A. Ellagic acid derivatives, ellagitannins, proanthocyanidins and other phenolics, vitamin C and antioxidant capacity of two powder products from camu-camu fruit (Myrciaria dubia). Food Chem. 2013, 139, 578–588. [Google Scholar] [CrossRef] [PubMed]
  68. Wood, J.A.; Knights, E.J.; Chocty, M. Morphology of Chickpea Seeds (Cicer arietinum L.): Comparison of desi and kabuli Types. Int. J. Plant Sci. 2011, 172, 632–643. [Google Scholar] [CrossRef]
  69. Musa, K.H.; Abdullah, A.; Subramaniam, V. Flavonoid profile and antioxidant activity of pink guava. ScienceAsia 2015, 41, 149–154. [Google Scholar] [CrossRef]
  70. Rojas-Garbanzo, C.; Zimmermann, B.F.; Schulze-Kaysers, N.; Schieber, A. Characterization of phenolic and other polar compounds in peel and flesh of pink guava (Psidium guajava L. cv. ‘Criolla’) by ultra-high performance liquid chromatography with diode array and mass spectrometric detection. Food Res. Int. 2017, 100, 445–453. [Google Scholar] [CrossRef] [PubMed]
  71. Mali, P.S.; Kumar, P. Optimization of microwave assisted extraction of bioactive compounds from black bean waste and evaluation of its antioxidant and antidiabetic potential in vitro. Food Chem. Adv. 2023, 3, 100543. [Google Scholar] [CrossRef]
  72. Jovanović, A.A.; Đorđević, V.B.; Zdunić, G.M.; Pljevljakušić, D.S.; Šavikin, K.P.; Gođevac, D.M.; Bugarski, B.M. Optimization of the extraction process of polyphenols from Thymus serpyllum L. herb using maceration, heat- and ultrasound-assisted techniques. Sep. Purif. Technol. 2017, 179, 369–380. [Google Scholar] [CrossRef]
  73. Paz, J.E.W.; Márquez, D.B.M.; Ávila, G.C.G.M.; Cerda, R.E.B.; Aguilar, C.N. Ultrasound-assisted extraction of polyphenols from native plants in the Mexican desert. Ultrason. Sonochem 2015, 22, 474–481. [Google Scholar] [CrossRef] [PubMed]
  74. Nayak, B.; Dahmoune, F.; Moussi, K.; Remini, H.; Dairi, S.; Aoun, O.; Khodir, M. Comparison of microwave, ultrasound and accelerated-assisted solvent extraction for recovery of polyphenols from Citrus sinensis peels. Food Chem. 2015, 187, 507–516. [Google Scholar] [CrossRef] [PubMed]
  75. Dubey, A.; Tripathy, P.P. Ultrasound-mediated hydration of finger millet: Effects on antinutrients, techno-functional and bioactive properties, with evaluation of ANN-PSO and RSM optimization methods. Food Chem. 2024, 435, 137516. [Google Scholar] [CrossRef] [PubMed]
  76. Jovanović, M.S.; Milutinović, M.; Lazarević, Z.; Mudrić, J.; Matejić, J.; Kitić, D.; Šavikin, K. Heat- and microwave-assisted extraction of bioactive compounds from Gentiana asclepiadea L. underground parts: Optimization and comparative assessment using response surface methodology. J. Appl. Res. Med. Aromat. Plants 2023, 34, 100483. [Google Scholar] [CrossRef]
  77. Koyu, H.; Demir, S. Subcritical water extraction of red cabbage regarding cholinesterase and tyrosinase inhibitory activity. Microchem. J. 2024, 199, 109953. [Google Scholar] [CrossRef]
  78. Muhamad, N.; Muhmed, S.A.; Yusoff, M.M.; Gimbun, J. Influence of Solvent Polarity and Conditions on Extraction of Antioxidant, Flavonoids and Phenolic Content from Averrhoa bilimbi. J. Food Sci. Eng. 2014, 4, 255–260. [Google Scholar] [CrossRef]
  79. Tagliazucchi, D.; Verzelloni, E.; Bertolini, D.; Conte, A. In vitro bio-accessibility and antioxidant activity of grape polyphenols. Food Chem. 2010, 120, 599–606. [Google Scholar] [CrossRef]
  80. Mercado-Mercado, G.; Rosa Carrillo, L.D.L.; Wall-Medrano, A.; Díaz, J.A.L.; Álvarez-Parrilla, E. Compuestos polifenólicos y capacidad antioxidante de especias típicas consumidas en México. Nutr. Hosp. 2013, 28, 36–46. [Google Scholar] [CrossRef] [PubMed]
  81. Thaipong, K.; Boonprakob, U.; Crosby, K.; Cisneros-Zevallos, L.; Byrne, D.H. Comparison of ABTS, DPPH, FRAP, and ORAC assays for estimating antioxidant activity from guava fruit extracts. J. Food Compos. Anal. 2006, 19, 669–675. [Google Scholar] [CrossRef]
  82. Pinelo, M.; Sineiro, J.; Núñez, M.J. Mass transfer during continuous solid–liquid extraction of antioxidants from grape byproducts. J. Food Eng. 2006, 77, 57–63. [Google Scholar] [CrossRef]
  83. Ali, S.; Ahmed, D. Comparing DES-mediated ultrasound- and heat-assisted extraction of bioactive metabolites from Saussurea lappa and optimization by RSM and validation studies. Green. Anal. Chem. 2023, 7, 100080. [Google Scholar] [CrossRef]
  84. del Socorro Cruz-Cansino, N.; Ramírez-Moreno, E.; León-Rivera, J.E.; Delgado-Olivares, L.; Alanís-García, E.; Ariza-Ortega, J.A.; de Jesús Manríquez-Torres, J.; Jaramillo-Bustos, D.P. Shelf life, physicochemical, microbiological and antioxidant properties of purple cactus pear (Opuntia ficus indica) juice after thermoultrasound treatment. Ultrason. Sonochem 2015, 27, 277–286. [Google Scholar] [CrossRef] [PubMed]
  85. Aguilar, K.; Garvín, A.; Ibarz, A.; Augusto, P.E.D. Ascorbic acid stability in fruit juices during thermosonication. Ultrason. Sonochem. 2017, 37, 375–381. [Google Scholar] [CrossRef] [PubMed]
  86. Rojas, M.L.; Leite, T.S.; Cristianini, M.; Alvim, I.D.; Augusto, P.E.D. Peach juice processed by the ultrasound technology: Changes in its microstructure improve its physical properties and stability. Food Res. Int. 2016, 82, 22–33. [Google Scholar] [CrossRef]
  87. do Amaral Souza, F.D.C.; Moura, L.G.S.; de Oliveira Bezerra, K.; Aguiar, J.P.L.; Mar, J.M.; Sanches, E.A.; Dos Santos, F.F.; Bakry, A.M.; Paulino, B.N.; Campelo, P.H. Thermosonication applied on camu–camu nectars processing: Effect on bioactive compounds and quality parameters. Food Bioprod. Process. 2019, 116, 212–218. [Google Scholar] [CrossRef]
  88. Younas, U.; Iqbal, S.; Bashir, R.; Sajjad, N.; Saeed, Z.; Pervaiz, M.; Hassan, F.; Ali, F.; Ibrahim, S.; Batool, F.; et al. An Eco-Friendly Approach for the Extraction of Antioxidant Components from Artemisia Annua Leaves Using Response Surface Methodology. Pol. J. Env. Environ. Stud. 2021, 30, 4827–4833. [Google Scholar] [CrossRef]
  89. Wong, B.Y.; Tan, C.P.; Ho, C.W. Effect of solid-to-solvent ratio on phenolic content and antioxidant capacities of ‘Dukung Anak’ (Phyllanthus niruri). Int. Food Res. J. 2013, 20, 325–330. [Google Scholar]
  90. Mason, T.J.; Paniwnyk, L.; Lorimer, J.P. The uses of ultrasound in food technology. Ultrason Sonochem. 1996, 3, S253–S260. [Google Scholar] [CrossRef]
  91. Cheng, L.H.; Soh, C.Y.; Liew, S.C.; Teh, F.F. Effects of sonication and carbonation on guava juice quality. Food Chem. 2007, 104, 1396–1401. [Google Scholar] [CrossRef]
  92. Xue, H.; Tan, J.; Li, Q.; Tang, J.; Cai, X. Optimization Ultrasound-Assisted Deep Eutectic Solvent Extraction of Anthocyanins from Raspberry Using Response Surface Methodology Coupled with Genetic Algorithm. Foods 2020, 9, 1409. [Google Scholar] [CrossRef] [PubMed]
  93. Sampath, M. Optimization of the Extraction Process of Phenolic Antioxidant from Polyalthia Longifolia (Sonn.) Thawaites. J. Appl. Pharm. Sci. 2013, 3, 148–152. [Google Scholar] [CrossRef]
  94. Tungmunnithum, D.; Garros, L.; Drouet, S.; Renouard, S.; Lainé, E.; Hano, C. Green Ultrasound Assisted Extraction of trans Rosmarinic Acid from Plectranthus scutellarioides (L.) R.Br. Leaves. Plants 2019, 8, 50. [Google Scholar] [CrossRef] [PubMed]
  95. Abd-Elsalam, H.A.H.; Gamal, M.; Naguib, I.A.; Al-Ghobashy, M.A.; Zaazaa, H.E.; Abdelkawy, M. Development of Green and Efficient Extraction Methods of Quercetin from Red Onion Scales Wastes Using Factorial Design for Method Optimization: A Comparative Study. Separations 2021, 8, 137. [Google Scholar] [CrossRef]
  96. Zahari, N.A.A.R.; Chong, G.H.; Abdullah, L.C.; Chua, B.L. Ultrasonic-Assisted Extraction (UAE) Process on Thymol Concentration from Plectranthus Amboinicus Leaves: Kinetic Modeling and Optimization. Processes 2020, 8, 322. [Google Scholar] [CrossRef]
  97. Luo, Z.Y.; Liu, H.Y.; Shi, Z.G. Novel mode of liquid-phase microextraction: A magnetic stirrer as the extractant phase holder. J. Sep. Sci. 2016, 39, 399–404. [Google Scholar] [CrossRef] [PubMed]
  98. Cao, D.; Qiao, X.; Guo, Y.; Liu, P. Valorization of pawpaw (Carica papaya L.) leaves as a source of polyphenols by ionic liquid-based microwave-assisted extraction: Comparison with other extraction methods and bioactivity evaluation. Food Chem. X 2024, 22, 101500. [Google Scholar] [CrossRef]
  99. Jiang, X.Y.; Wang, C.W.; Zhang, J.; Xu, P.P.; Xue, Y.T.; Wang, Q. Effects of different extraction methods on physicochemical characteristics and bioactivities of fig (Ficus carica L.) leaves polysaccharides. Arab. J. Chem. 2023, 16, 105319. [Google Scholar] [CrossRef]
Figure 1. Moisture and pH levels of M. dubia shell (CCP), M. dubia seed (CCS), and P. guajava shell (GP). Measured values (n = 3) and standard deviations.
Processes 12 01228 g001
Figure 2. (A): Apparent Density, (B): Tapped density, (C): Hausner index, (D): Hygroscopicity, (E): Solubility and (F): Water activity. Mean values (n = 3), standard deviations and Tukey statistics. Different letters indicate significantly different groups (p ≤ 0.05).
Processes 12 01228 g002
Figure 3. Differences in the pigment contents of M. dubia shells, M. dubia seeds and P. guajava shells (ultraviolet (UV)–visible (Vis) spectrum of 400–550 nm).
Processes 12 01228 g003
Figure 4. SEM images depicting the morphologies of the M. dubia shell (a), M. dubia seed (b) and P. guajava shell (c) at a magnification of 1× 10³×.
Processes 12 01228 g004
Figure 5. Surface response diagrams showing the effects of the ultrasound-assisted extraction variables on the bioactive compounds of three byproducts. (A): antioxidant capacity (DPPH); (B): total phenolic content; and (C): antioxidant capacity (FRAP).
Processes 12 01228 g005
Figure 6. Response surface diagrams showing the effects of the MS variables on the bioactive compounds of the three byproducts. (A): antioxidant capacity (DPPH); (B): total phenolic content; and (C): antioxidant capacity (FRAP).
Processes 12 01228 g006
Table 1. RSM of the Box–Behnken design matrix.
Shell of
M. dubia
Seed of
M. dubia
Shell of
P. guajava
No. of ExperimentsABCABCABC
11.50501.505001550
21.57.5301.57.53031040
307.51007.51031550
41.57.5301.57.5300550
51.57.5301.57.53031060
631530315301.51560
71.50101.501001040
807.55007.55001060
901530015301.5540
10303030301.51050
11003000303550
121.515501.515501.51050
1337.55037.5501.5560
141.57.5301.57.5301.51050
151.57.5301.57.5301.51050
1637.51037.5101.51050
171.515101.515101.51540
A: stirring time (h); B: sonication time (min); and C: m/v ratio (mL/g).
Table 2. RSM of the Box–Behnken design matrix.
Shell of
M. dubia
Seed of
M. dubia
Shell of
P. guajava
No. of ExperimentsABCABCABC
1150502150408250506
2150506150608300406
3200304200406300606
4100504200508300508
5150404200508250506
6100406200508200504
7200406200606250408
8200402250506200606
91504042004010250608
10150404200508250604
11150302250608250404
12100402150506250506
13150306250408250506
14200504200508200508
151504041505010300504
161504042505010200406
171003042006010250506
A: stirring speed (rpm); B: v/m ratio (mL/g); and C: stirring time (h).
Table 3. Results of the model fit and ANOVA for UAE.
Shell of M. dubiaSeed of M. dubiaShell of P. guajava
SourceAC-DPPH (mg GAE/g)TPC (mg GAE/g)AC-FRAP (mg GAE/g)AC-DPPH (mg GAE/g)TPC (mg GAE/g)AC-FRAP (mg GAE/g)AC-DPPH (mg GAE/g)TPC (mg GAE/g)AC-FRAP (mg GAE/g)
Model<0.00010.01030.0001<0.00010.03860.00310.00130.00370.0414
Stirring time (A)0.44860.00570.10620.51250.01100.00070.85540.97650.4049
Sonication time (B)0.16380.01460.59830.22860.32180.75860.69950.06630.0161
Volume–mass ratio (C)<0.00010.2079<0.0001<0.00010.04800.0005<0.00010.00020.4480
AB0.80460.15170.76450.71720.70520.81790.07940.88360.8517
AC0.44120.00150.18870.46200.39480.14560.45160.39150.5180
BC0.03050.12480.00150.00570.49630.02920.26010.00810.1876
A20.02920.00850.05920.22060.04920.02970.00750.02060.0463
B20.06890.01800.02860.04520.86520.40670.15440.15970.0080
C2<0.00010.02220.0431<0.00010.01080.49930.00660.04920.4209
R20.99980.92210.98250.99920.87320.92730.94410.92380.8361
Note: Bold values represent that the models are significant (p < 0.05).
Table 4. Results of the model fit and ANOVA for MS.
Shell of M. dubiaSeed of M. dubiaShell of P. guajava
SourceAC-DPPH (mg GAE/g)TPC (mg GAE/g)AC-FRAP (mg GAE/g)AC-DPPH (mg GAE/g)TPC (mg GAE/g)AC-FRAP (mg GAE/g)AC-DPPH (mg GAE/g)TPC (mg GAE/g)AC-FRAP (mg GAE/g)
Model<0.00010.0092<0.00010.00140.03090.00070.00040.00140.0129
Stirring speed (A)0.24830.00120.04090.11850.3793<0.00010.01500.98540.0979
Volume–mass ratio (B)<0.00010.0208<0.0001<0.00010.21590.2140<0.0001<0.00010.0106
Stirring time (C)0.37470.37610.04090.32170.22420.00790.01030.00390.0074
AB0.39660.03260.00260.64550.02420.12290.38150.51450.1997
AC0.01040.30960.49410.59270.14450.00030.09400.33610.7668
BC0.63610.08520.00060.98880.50490.20220.01390.01760.0690
A20.21290.10180.02690.20130.00500.03500.04290.03710.0189
B20.03190.01870.01770.02740.03640.61500.03780.06040.0486
C20.12400.49490.04700.42940.51680.28170.42570.18720.1650
R20.98480.89890.98350.94370.85130.95370.96180.94340.8877
Note: Bold values represent that the models are significant (p < 0.05).
Table 5. Optimized models for each response variable for both extraction methods (UAE and MS).
UAEMS
VariablePlant Source *Optimal Factors **Value (mg GAE/g)DesirabilityOptimal Factors **Value (mg GAE/g)Desirability
ABCDEF
AC-DPPHCCP311.25011.80.9915050212.81
CCS0.99155012.10.99221.5601012.80.99
GP0.0710.459.720.81200.0658.97.9615.51
TPCCCP0.15.544.436.61196.630.052.127.31
CCS315506.20.95249.9859.987.88.51
GP2.811.157.116.81232.859.37.929.91
AC-FRAPCCP1.814.9949.967.80.83194.249.82.03122.11
CCS2.91.447.946.31249.844.36.238.981
GP2.514.9540.547.81266.553.67.0266.041
* CCP: M. dubia shell, CCS: M. dubia seed, GP: P. guajava shell. ** A: stirring time (h); B: sonication time (min); C: volume–mass ratio (mL/g); D: stirring speed (rpm); E: volume–mass ratio (mL/g); and F: stirring time (h).
Table 6. Validation of predicted values with experimental data in the UAE process for the combination of all responses. The experimental data are presented as the mean ± standard deviation (SD) (n = 3).
Plant Source *Optimal Factors **AC-DPPH (mg GAE/g)TPC (mg GAE/g)AC-FRAP (mg GAE/g)Compound Desirability
ABC
Predicted values CCP 0155011.6731.1159.500.88
CCS 34.425011.245.7345.820.91
GP 0156022.2616.7346.190.97
Observed values CCP 0155011.19 ± 0.19 b26.15± 01 a67.57 ± 1.37 a-
CCS 34,55011.14 ± 0.005 b7.67 ± 0.378 c44.67 ± 4.46 b-
GP 0156020.06 ± 0.06 a14.78 ± 0.02 b49.9 ± 0.77 b-
* CCP: M. dubia shell, CCS: M. dubia seed, and GP: P. guajava shell. ** A: stirring time (h), B: sonication time (min), C: volume–mass ratio (mL/g). Different letters mean that the averages are statistically different.
Table 7. Validation of the predicted and observed values under the optimal conditions of the independent factors based on a combination of responses for MS extraction. The experimental data are presented as the means ± SDs (n = 3).
Plant Source *Optimal Factors **AC-DPPH (mg GAE/g)TPC (mg GAE/g)AC-FRAP (mg GAE/g)Compound Desirability
ABC
Predicted values CCP 172.2450212.5922.97121.650.89
CCS 250 60 6.39 12.47 8.41 35.53 0.90
GP 256.26 60 7.72 14.93 29.66 61.17 0.92
Observed values CCP 172 50 2 13.16 ± 0.16 b27.92 ± 2.07 a126.93 ± 2.53 a -
CCS 250 60 6.4 9.96 ±0.09 c10.58 ± 0.22 c28.21 ± 0.47 c -
GP 256 60 6.7 14.28 ± 0.07 a20.68 ± 0.09 b67 ± 0.13 b -
* CCP: M. dubia shell, CCS: M. dubia seed, and GP: P. guajava shell. ** A: stirring speed (rpm), B: volume–mass ratio (mL/g), and C: stirring time (h). Different letters mean that the averages are statistically different.
Disclaimer/Publisher’s Note: The statements, opinions and data contained in all publications are solely those of the individual author(s) and contributor(s) and not of MDPI and/or the editor(s). MDPI and/or the editor(s) disclaim responsibility for any injury to people or property resulting from any ideas, methods, instructions or products referred to in the content.

