Article

Inverse Method-Based Kinetic Modelling and Process Optimization of Reverse-Phase Chromatography for Molnupiravir Synthesis

Engineering Research Center for Structured Organic Particulate Systems (C-SOPS), Department of Chemical & Biochemical Engineering, Rutgers, The State University of New Jersey, Piscataway, NJ 08854, USA
*
Authors to whom correspondence should be addressed.
Processes 2024, 12(6), 1273; https://doi.org/10.3390/pr12061273
Submission received: 25 May 2024 / Revised: 15 June 2024 / Accepted: 16 June 2024 / Published: 20 June 2024

Abstract

:
Our research addresses the shift towards continuous manufacturing in the pharmaceutical industry, focusing on optimizing chromatographic separation for the synthesis of molnupiravir. Using an inverse method with six different inlet concentrations for a single objective function, we systematically evaluated the adsorption of key intermediates, i.e., hydroxylamine and isobutyrate, in an isocratic solvent, determining the relevant isotherm constants. The study systematically evaluates the effects of operational variables, including flowrate, column geometry, dispersivity coefficient, and injection volume, on chromatographic performance. Findings reveal that specific operational adjustments, such as reducing flowrates or altering column dimensions, significantly influence retention times and peak profiles, thus potentially impacting the efficiency of molnupiravir production. Utilizing the inverse method, we efficiently determined equilibrium isotherms by integrating a nonlinear chromatography model and adjusting isotherm parameters to match the observed band profiles. Our research offers critical insights into optimizing chromatographic separation performance through precise operational control, leveraging computational tools for rapid and adaptable drug development.

1. Introduction

The potential emergence of a worldwide health crisis presents substantial obstacles to healthcare systems on a global scale. An occurrence of this nature has the potential to result in a significant number of cases and a considerable loss of life on a global scale [1,2]. Molnupiravir is a compound which suppresses SARS-CoV-2 replication by lethal mutagenesis, and has been approved for Emergency Use Authorization (EUA) in the United States [3]. This critical situation has propelled the pharmaceutical industry to optimize the synthesis of molnupiravir. Molnupiravir was first synthesized using five processes with a total yield of less than 17% from uridine, which was mostly due to the introduction of the triazole group with a low yield. Later, by rearranging the reaction sequences and using continuous flow technology, an optimized synthesis with an overall yield of up to 61% was reported [4]. Beyond specific optimizations, there is a pressing need for new benchmarks in rapid and adaptable drug development during global health emergencies, leveraging advanced computational tools.
The production of molnupiravir acetonide is a multi–step procedure that includes functional group protection and deprotection as well as purifying stages to eliminate contaminants [5]. Molnupiravir is synthesized via the reduction of ribose to a 5′-isobutyrate ester, followed by the ester’s interaction with hydroxylamine to produce the matching hydroxamic acid intermediate [6]. The 5′–isobutyrate ester and hydroxylamine intermediate can generate undesirable compounds such as N–isobutyryl hydroxylamine, diisobutyrylhydrazine and acetic acid during the production of molnupiravir [7,8]. Due to the breakdown of the 5′–isobutyrate ester or the replacement of hydroxyamino with hydroxyl at the C4 location of molnupiravir and the deprotection of the acetonide group with a powerful acid, these two contaminants can be introduced [9,10]. Separation of the 5′-isobutyrate ester and the hydroxylamine intermediate (Figure 1) has to be adequate to avoid contamination during deprotection of the acetonide group throughout the manufacturing of molnupiravir.
Reversephase chromatography (RPC) is a potent separation technique utilized extensively in the biopharmaceutical industry for the separation and purification of a vast array of compounds, including isobutyrate esters and hydroxylamine intermediates [11]. RPC’s ability to distinguish non–polar and moderately polar compounds based on distinctions in their hydrophobicity is one of its primary advantages [12]. Isobutyrate esters are nonpolar compounds that can be difficult to separate using other chromatography methods, such as ion–exchange chromatography [13]. In contrast, RPC columns, which typically employ hydrophobic stationary phases such as C18, C8, or C4, are especially effective at separating non-polar compounds [14]. On the other hand, hydroxylamine intermediates are moderately polar compounds that can be difficult to separate using conventional normal–phase chromatography due to their low volatility and strong hydrogen bonding [15]. Utilizing their hydrophobic properties, RPC columns can effectively separate moderately polar compounds such as hydroxylamine intermediates. Dipole–dipole interactions, van der Waals forces, and hydrophobic interactions allow moderately polar compounds to interact with the hydrophobic stationary phase [16]. The high resolution of RPC enables the separation of closely related compounds, such as isobutyrate esters and hydroxylamine intermediates [17]. Overall, RPC is an effective method for the separation of isobutyrate esters and hydroxylamine intermediates due to its ability to separate non–polar and moderately polar compounds while maintaining a high degree of resolution and adaptability to a wide spectrum of operating conditions [18].
Numerous approaches have been proposed for the collecting of liquid–solid equilibrium data, including frontal analysis, the inverse method, perturbation peak analysis, and elution by characteristic points (ECP) and perturbation (injection on a plateau, PM) [19]. The frontal analysis (FA) technique is widely used to determine adsorption isotherms [20]. FA, however, requires a large number of compounds and is time–consuming as it requires the accumulation of a large number of equilibrium isotherm data points over a wide concentration range. Furthermore, FA can only be used to estimate single–component isotherms and cannot be used to estimate competitive isotherms [21]. The elution by characteristic point (ECP) method is another frequently used technique for determining kinetic parameters in RPC columns [22]. ECP calculates the mass transfer coefficient by analyzing the diffusion component of the elution chromatogram of a large pulse [23]. ECP has limitations and cannot be used to estimate competitive isotherms [24]. ECP can only be used with high–efficiency columns, even for single–component isotherms.
Among the many available techniques for determining kinetic parameters and optimizing the operating conditions of an RPC column, the inverse method stands out for its adaptability and efficiency [25]. The equilibrium isotherms are calculated numerically by integrating a suitable nonlinear chromatography model and modifying the isotherm parameters to minimize the difference between the estimated and observed band profiles [26]. For solutes with moderate diffusivities, the inverse method can estimate a wide variety of kinetic parameters, including competitive isotherms and mass transfer coefficients [27]. The technique is time– and resource–efficient since it involves fitting a mathematical model of the chromatographic process to a small number of experimental data points [28]. In addition, the inverse method permits the prediction of column performance under various operating conditions, enabling more informed process development decisions [29].
The objective of this study is to determine the isotherm parameters for a number of nonlinear separations using the inverse method of isotherm determination. This is accomplished by selecting an isotherm model, computing overloaded band profiles utilizing the proper nonlinear chromatographic model, and comparing measured and computed band profiles to define the isotherms. The equilibrium–dispersive model of chromatography is employed in this work in combination with the Stoke–Einstein and van Deemter equations. The Langmuir constants obtained via the inverse method are validated by confirming that they correspond to experimental data for a range of inlet concentrations for both components. This investigation explored the effects of flowrate, column geometry, dispersivity coefficient, and injection volume on chromatographic peaks. The results revealed that the flowrate, column length and diameter, dispersivity coefficient, and injection volume have a significant impact on the retention time, peak shape, peak width, and separation efficiency of chromatographic peaks. The findings of this study provide important insights into the optimization of chromatographic separation performance between the 5′–isobutyrate ester and the hydroxylamine intermediate.

2. Materials and Methods

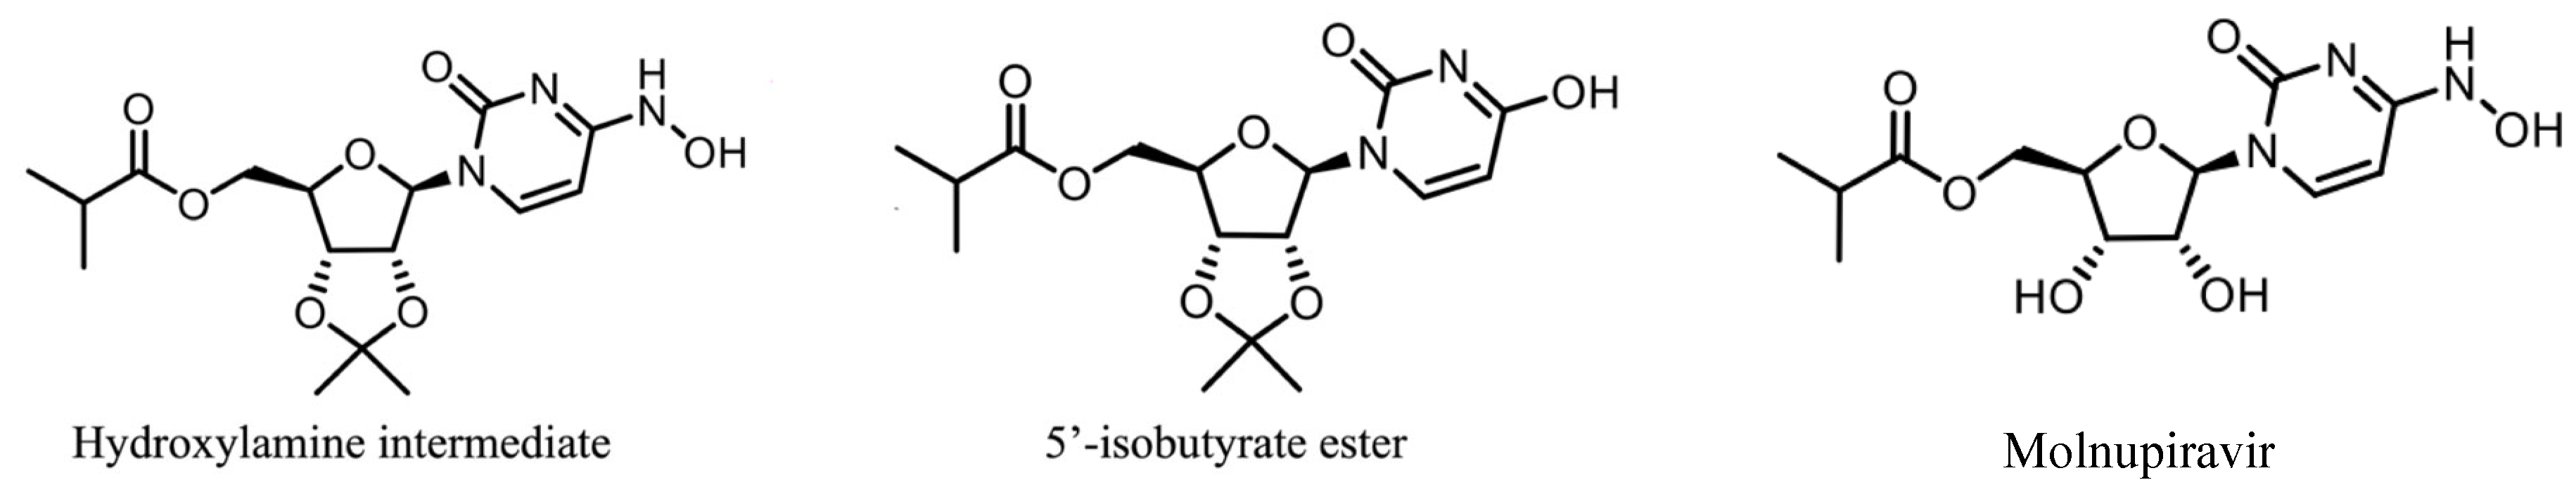
2.1. Process Description

The molnupiravir (Merck & Co., Inc., Rahway, NJ, USA) production process showcases advanced pharmaceutical manufacturing through the integration of multiple unit operations. Precision dosing pumps deliver APIs and solvents into a mixer, achieving exact stoichiometry and a consistent reaction mix. The mixture is thermally conditioned prior to entering a reactor module where molnupiravir synthesis is closely regulated via inline sensors. Post–synthesis, the solution undergoes detailed analysis with FTIR and LC–MS in an analytical module to accurately identify and quantify the molnupiravir. Crucially, the mixture is processed through a chromatographic column, which meticulously separates the 5′–isobutyrate ester (Sigma-Aldrich, St. Louis, MO, USA) and the hydroxylamine intermediate (Thermo Fisher Scientific, Waltham, MA, USA) to avoid byproducts in the final reaction step. Quality control throughout molnupiravir production is strictly enforced using Process Analytical Technology (PAT) instruments, ensuring high standards and showcasing the scalability and precision of this advanced system. This meticulous oversight bolsters continuous flow chemistry, optimizing molnupiravir manufacturing. Software, COMSOL, Version 6.2, COMSOL Inc., Burlington, MA, USA.

2.2. Experimental Setup

In order to gather experimental chromatographic data for the hydroxylamine and isobutyrate products in an isocratic acetonitrile and formic acid aqueous stationary phase, the following experimental set up was utilized. A column with diameter of ID = 2.1 mm and length of L = 50 mm, packed with the stationary phase Xterra MS C18 OBD (Waters Corporation, Milford, MA, USA), was used. This stationary phase is designed to be compatible with mass spectrometry detection. The designation “C18” refers to the type of bonded phase employed in the column. C18 is a common stationary phase employed in reversed–phase liquid chromatography, consisting of a hydrophobic alkyl chain bonded to a silica support. The silica particles in this stationary phase have a particle size of 5 µm, a pore size of 125 Å, and a surface area of 175 m2/g [30]. The “OBD” abbreviation refers to the “Optimized for Broad Design” feature of the Xterra MS C18 column, which is designed to provide high resolution and sensitivity for a wide variety of compounds, including small molecules, peptides, and proteins [31]. The OBD characteristic includes a narrower particle size distribution, resulting in enhanced separation efficiency and diminished band broadening. The liquid inputs were pumped into the column at a total flowrate of 4.876 mL/min using a Teledyne LS Class High Performance Isocratic Pump (Teledyne ISCO, Lincoln, NE, USA). The adsorbate breakthrough of various concentrations was detected in real time by detecting the solute of interest at various wavelengths using a UV detector. Using a Vanquish UHPLC system (Thermo Fisher Scientific, Waltham, MA, USA), the products of interest were collected and quantified.

2.3. Adsorption Isotherm Determination

The following methodology in Figure 2 was applied to determine the adsorption isotherm constants. Firstly, raw data were collected by passing single–component solutions of the two products through the stationary phase and detecting the resulting peaks. Secondly, a baseline correction was performed to eliminate any extraneous signals that could compromise the accuracy of peak integration. Next, peak fitting was performed by fitting a suitable model, like Gaussian distribution, to the original data in order to derive the peak shape parameters, including peak height, FWHM, and center. Peak integration was then performed using the peak shape parameters obtained from peak fitting. Normalization was accomplished by dividing the peak area by the respective product’s concentration.
The constants of the adsorption isotherm were determined using the inverse method as the concluding phase. The normalized peak area was plotted against the concentration of the respective product, and the rectangular pulse Langmuir isotherm model was used to fit the data. The Langmuir model employs a monolayer adsorption mechanism and reveals the maximal adsorption capacity and equilibrium constant of the adsorbate–adsorbent interaction. By minimizing the difference between the experimental data and the prediction of the Langmuir model, the inverse method enabled the estimation of these isotherm constants. By carrying out this procedure for various concentrations of hydroxylamine and isobutyrate, the Langmuir constants that best suit the experimental data were determined.
Using the following procedure, the inverse method of isotherm determination estimates the isotherm parameters. Initially, an isotherm model is chosen and initial estimates for its numerical parameters are calculated. These initial estimates may be improved by the outcomes of an analytical injection. Then, overloaded band profiles are computed using the appropriate nonlinear chromatographic model. The measured and computed band profiles are used to define the isotherms, and they are compared by assessing the following objective for single component isotherms:
m i n i = 1 6 r i 2 = m i n i = 1 6 ( C i s i m u l a t i o n C i m e a s u r e m e n t ) 2
where C i s i m u l a t i o n and C i m e a s u r e m e n t are the concentration calculated by the simulation and the concentration of the experimental measurement at point i and ri is their difference. Using an optimization approach, the isotherm parameters are modified to minimize the objective function.
The approach of exploring multiple concentrations for each component, combined with the use of the BOBYQA optimization technique within the inverse method, represents a significant advancement in chromatographic parameter estimation. By investigating six different concentrations for each component simultaneously, this method provides a more detailed understanding of the interactions between solute concentrations and the stationary phase, which traditional approaches often neglect. This approach offers a robust foundation for subsequent optimization using BOBYQA and enhances our comprehension of chromatographic behavior.
BOBYQA, which stands for Bound Optimization by Quadratic Approximation, enhances optimization methods by eliminating the need for gradients and using quadratic models within a trust region framework. This technique avoids the computational cost associated with gradient calculations, allowing for efficient exploration of the parameter space. BOBYQA dynamically and iteratively refines isotherm parameters to minimize objective function discrepancies, resulting in accurate estimations even with complex, nonlinear chromatographic data. The combined use of multi–concentration exploration and BOBYQA optimization advances chromatographic research by providing an effective framework for addressing analytical complexities.

2.4. Chromatographic Model Simulation

In this model, we assume continuous equilibrium between the stationary and mobile phases and utilize an apparent dispersion component to account for the band–widening effects of both axial dispersion and the finite mass transfer kinetics rate. For every component of the sample, the following mass balance equation is used [32,33]:
ε p c i t R a t e   o f   a c c u m u l a t i o n   o f   t h e   s p e c i e s   i   i n   t h e   l i q u i d   + ρ c P , i t R a t e   o f   t h e   s p e c i e s   i   a d s o r b e d   t o   s o l i d   p a r t i c l e s   + · J i T o t a l   m a s s   t r a n s f e r   f l u x + u · c i R a t e   o f   s p e c i e s   i   d u e   t o   c o n v e n c t i o n = 0
J i = ( D f , i D i f f u s i o n   c o e f f i c i e n t + D e , i ( a L , a T ) D i s p e r s i o n   c o e f f i c i e n t ) c i
ρ c P , i t = ρ k P , i c t c P , i ρ 1 + ε p ε p t
k P , i , L = k L , i C p m a x , i c i 1 + k L , i c i
For the mass transfer Equation (3), the adsorption term of the solute species adsorbed on the surface of the particles is in equilibrium with the solute species of the column. Equation (4) represents the rate of change in the mass of the adsorbed species i per unit volume of the porous medium with respect to time. The k P , i , L is the adsorption equilibrium constant for species i in the liquid using the Langmuir isotherm. In Equation (5), KL is the Langmuir equilibrium constant and Cp,max the maximum adsorption capacity. On the Table 1, the initial and boundary conditions that have been used are listed.

3. Results and Discussions

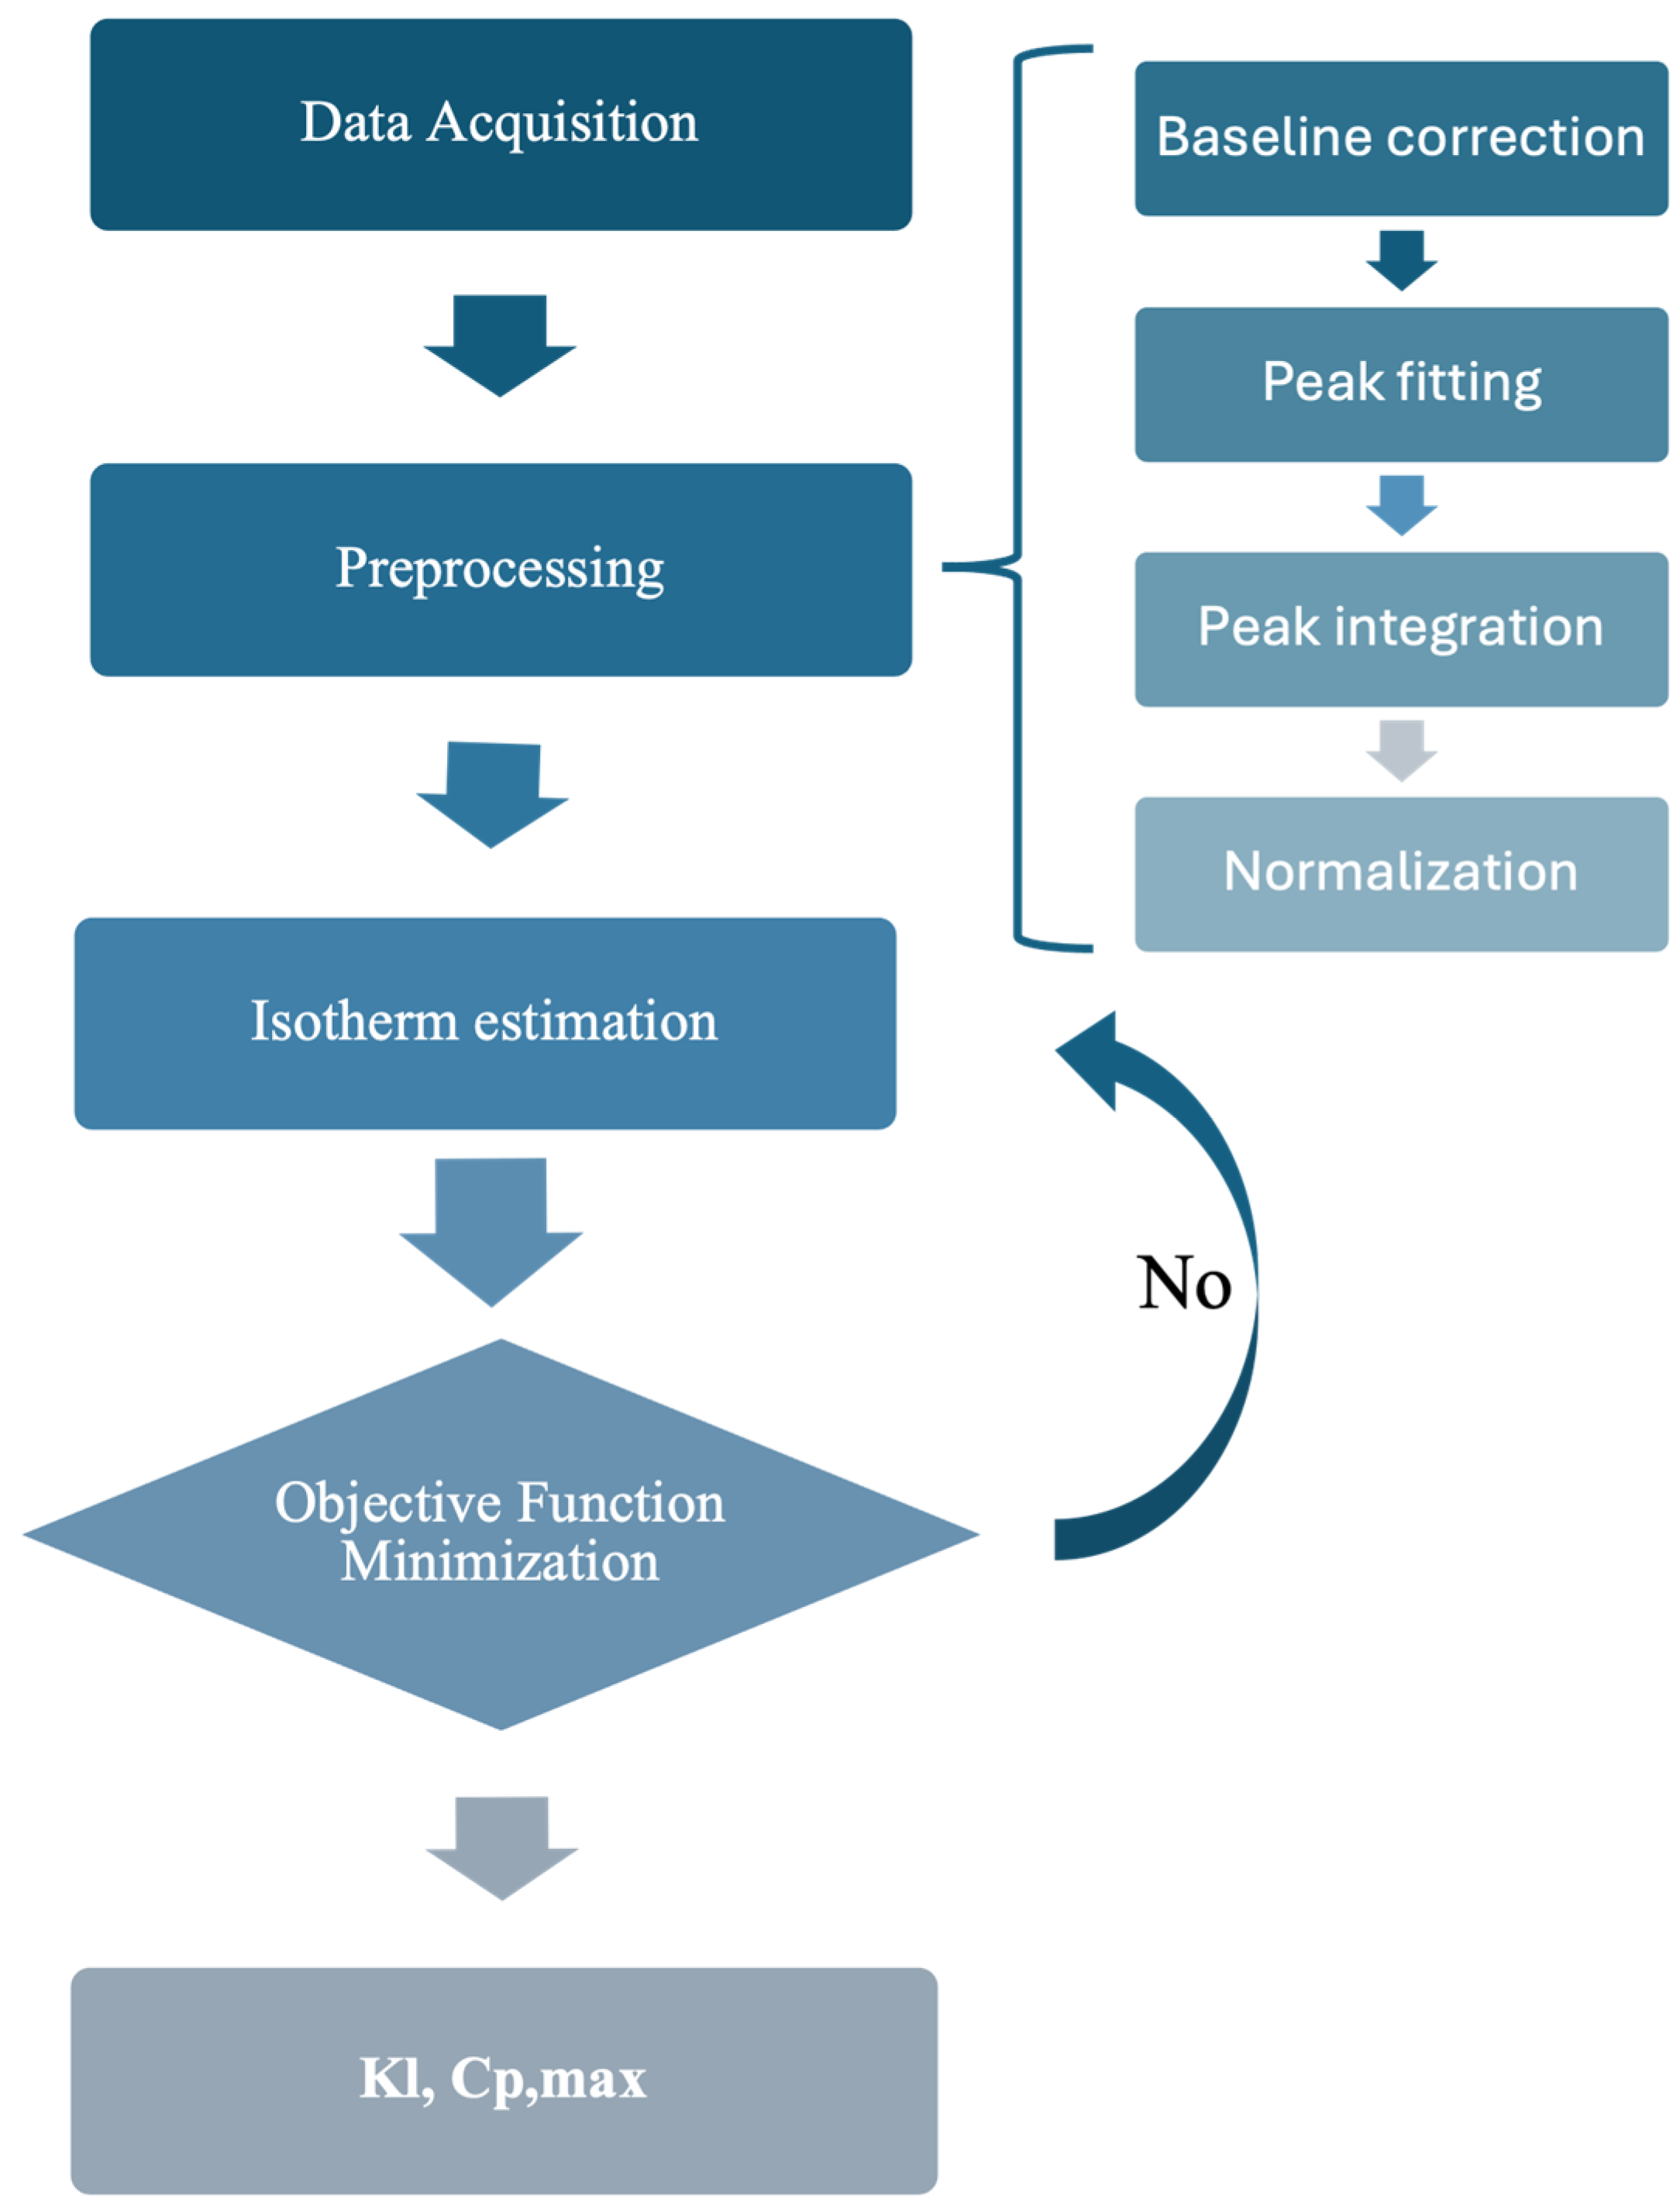
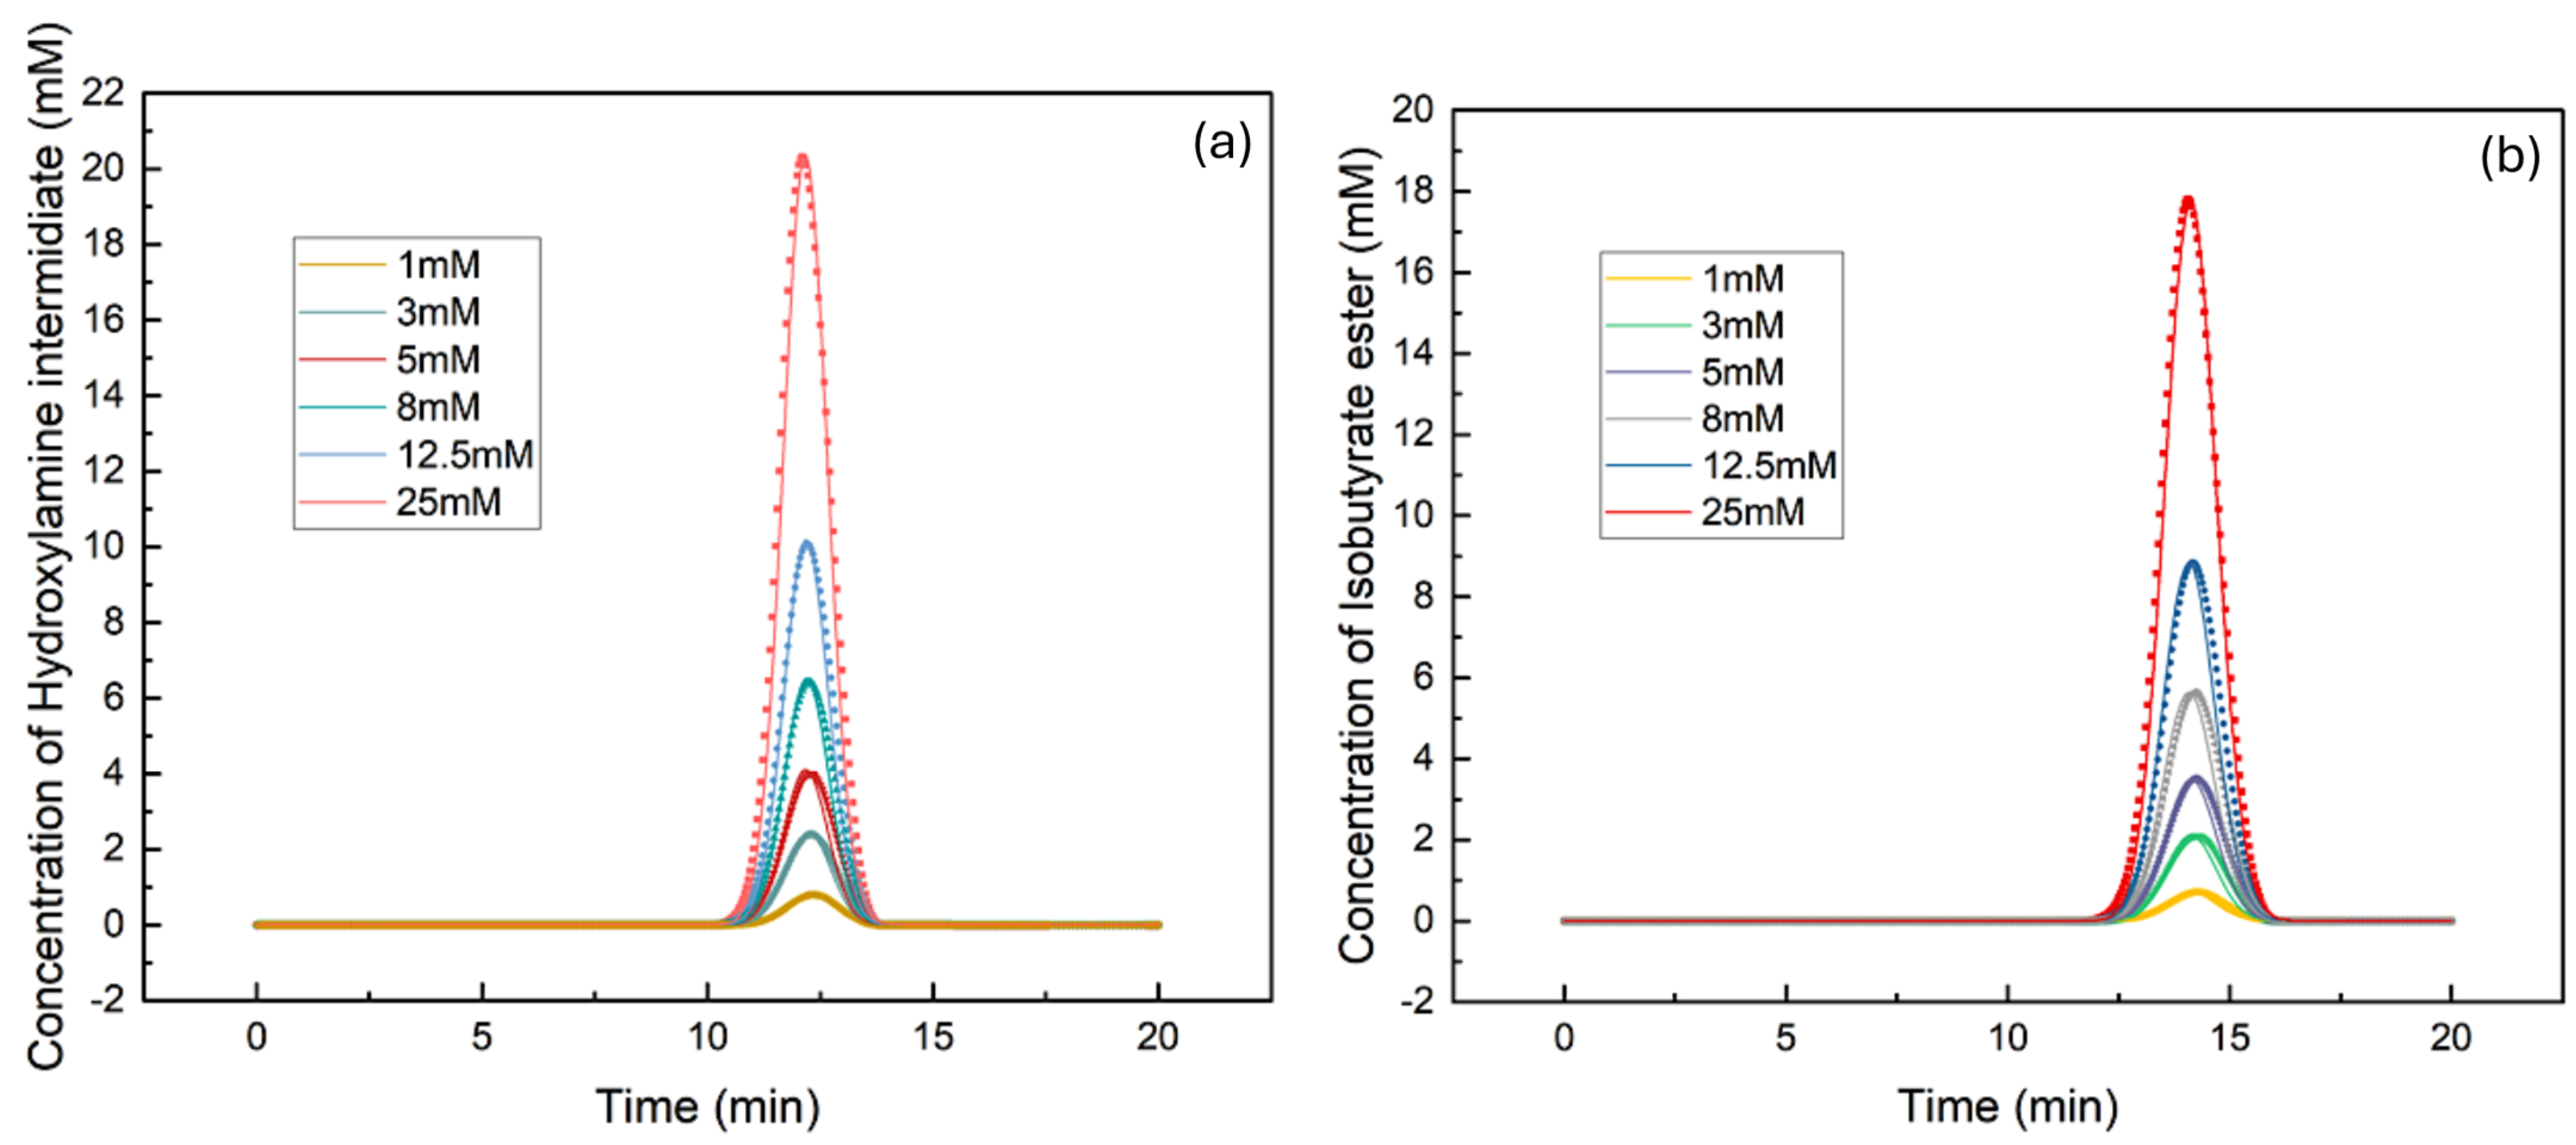
3.1. Determination of Isotherm Constants for the Single–Component Data Using the Inverse Method

Utilizing the inverse method, the isotherm constants for the adsorption of hydroxylamine and isobutyrate products on our solvent were determined. The method was validated by confirming that the Langmuir constants obtained through the method matched the experimental data for six different inlet concentrations on a concentration range of 1 mM to 25 mM for both components. The use of a rectangle pulse was determined to be suitable for the determination of the isotherm constants. The Langmuir constants provide information regarding the maximum adsorption capacity of the stationary phase and the solutes’ affinity for the stationary phase.
Prior to determining the isotherm parameters, baseline correction, peak fitting with a 92% R–squared Gaussian equation, and normalization were performed on the experimental chromatography data in this study. These pretreatment steps are essential for the precise determination of the isotherm parameters, as they ensure that the chromatogram peaks are well defined and comparable across a variety of samples and experimental conditions. The peak fitting’s high R–square value suggests that the Gaussian equation is a reasonable fit for the experimental data and that the peaks are symmetrical. The Langmuir isotherm model is commonly used to characterize the behavior of molecules during the adsorption process, and the Langmuir constants (KL and Cp,max) are essential parameters of this model. According to Table 2, the Langmuir constants for the hydroxylamine intermediate and 5–isobutyrate ester were found to be 0.00063409 and 0.00075756, respectively. These values are comparatively similar, suggesting that the two components have similar affinity for the stationary phase. Cp,max values of 645.24 and 752.25 for the hydroxylamine intermediate and 5–isobutyrate ester, respectively, indicate that the maximal amounts of these substances that can be adsorbed onto the stationary phase are comparable.
Looking at Figure 3, these isotherm constants are reasonable since the peak of the hydroxylamine compound is around 12 min while for the isobutyrate ester it is around 14 min.
The high values of the FSSR (fraction of sum of squares owing to residuals) indicate a superior fit between experimental data and the Langmuir model. The high FSSR values obtained in this investigation, 0.9894 for hydroxylamine and 0.9941 for isobutyrate ester, indicate that the Langmuir isotherm model accurately characterizes the adsorption behavior of these components on the stationary phase. The high FSSR values obtained in this study provide strong support for the accuracy of the Langmuir isotherm model, and the close accord between the Langmuir constants for the two components validates the inverse method used to determine the constants. This finding validates the ability of the Langmuir isotherm model to reliably predict the behavior of adsorption processes for a wide variety of components and experimental conditions. The validation of the Langmuir constants for hydroxylamine and isobutyrate ester for multiple concentrations with the experimental data is also a crucial step in evaluating the accuracy and dependability of this model. Different concentrations of these two components result in the same retention time, indicating that the interaction between the component and stationary phase remains constant throughout the concentration range. This is advantageous for chromatographic separations because it permits consistent elution of the component, making it easier to optimize separation conditions.

3.2. Effects of Dispersivity Coefficient on Chromatography Profile

The dispersivity coefficient (D) is a quantitative measure utilized in chromatographic systems to assess the relative effects of hydrodynamic dispersion and molecular diffusion on solute transport within the matrix of the column. The variation in the elution profiles of a 25 mM hydroxylamine intermediate at various values of D is illustrated in Figure 4. With a D value of 10−9, the resulting peak is sharply defined, with a steep rise and fall that indicates a highly efficient chromatographic separation where band broadening is minimal. The observed widening of the peak as D approaches 10−8 and 10−7 indicates an intensification of the interaction between diffusive and dispersive phenomena, resulting in prolonged retention times and improved peak dispersion. At the highest value, when D is equal to 10−6, the peak shows significant widening, with the longest retention time and the smallest relative peak height among the range that was examined. At a dispersivity coefficient of 10−6, the heightened interaction between solute molecules and the stationary phase substantially increases peak tailing, directly affecting the separation’s selectivity and analytical resolution. This condition emphasizes the importance of fine–tuning the dispersivity coefficient to maintain the balance between peak efficiency and resolution, which is essential for achieving the stringent purification standards required for the production of high–purity hydroxylamine intermediates in molnupiravir synthesis.

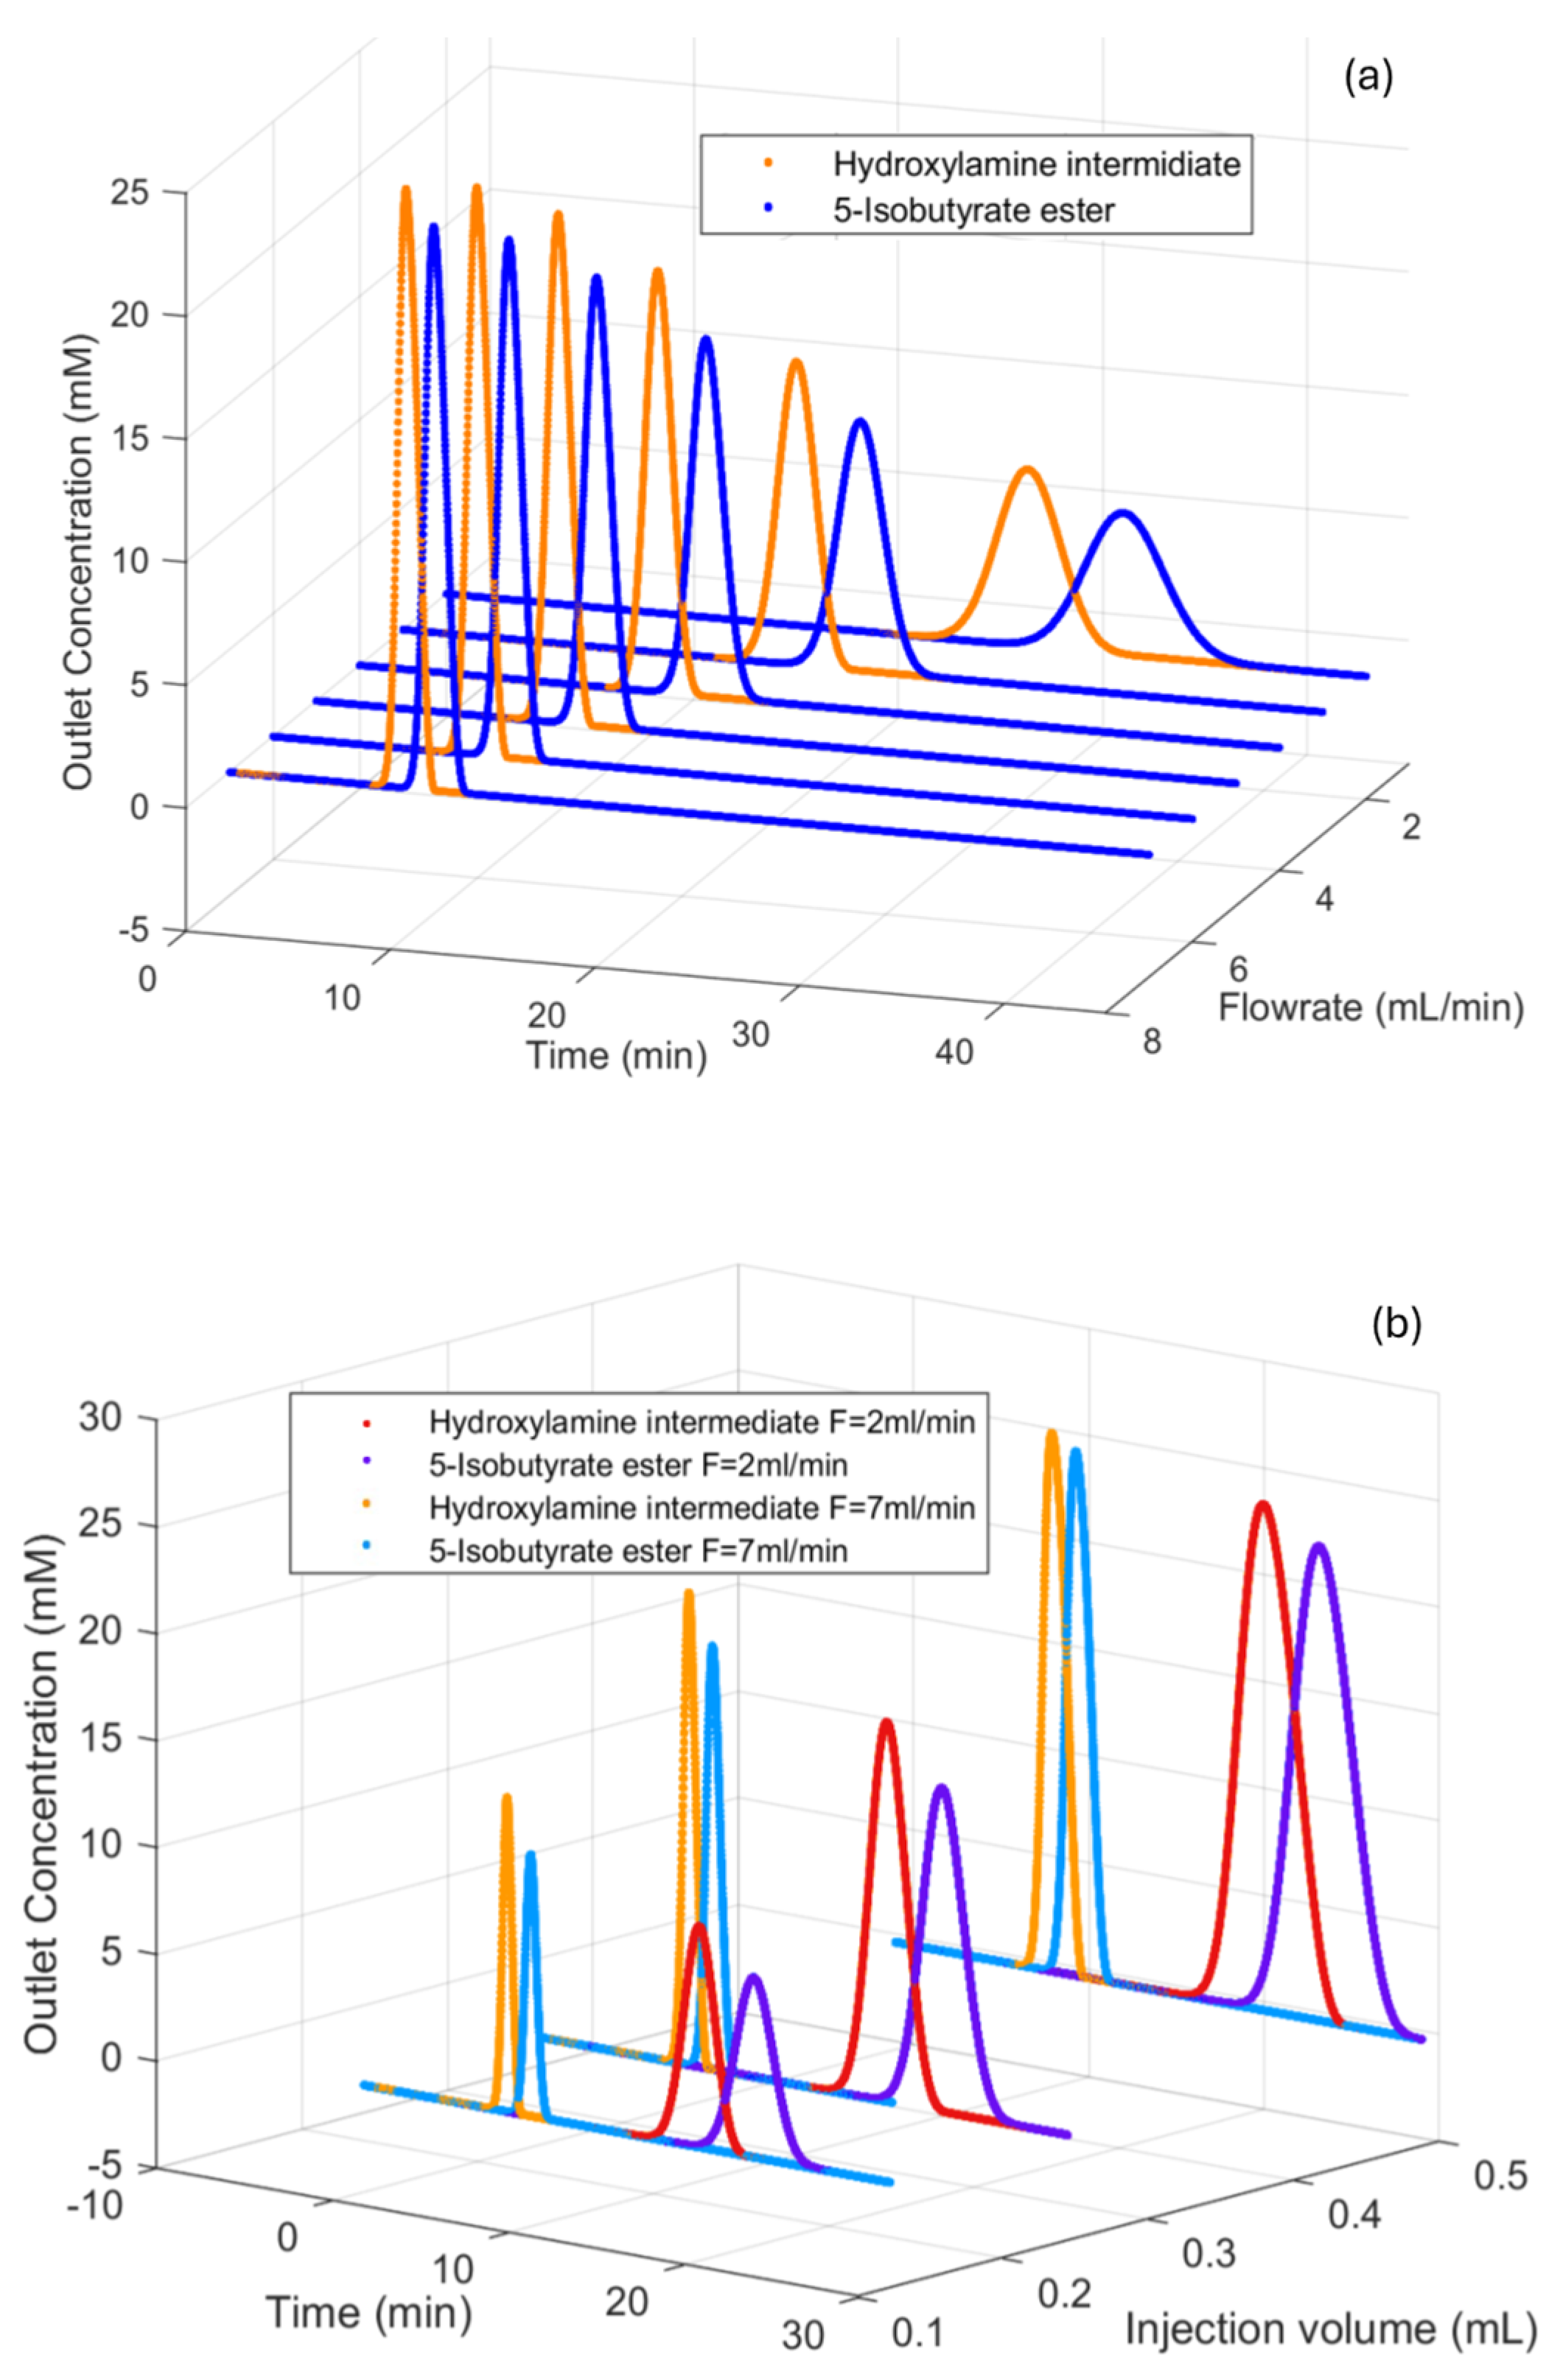
3.3. Effects of Injection Volume on Chromatography Profile

In the optimization of chromatographic methods, the injection volume plays a pivotal role, as demonstrated in the chromatograms of a 25 mM hydroxylamine intermediate depicted in Figure 5. With an increase in the injection volume from 0.06095 mL to 0.9752 mL, a trend is observed where larger volumes lead to an elongation of retention times and an expansion of peak widths. This expansion indicates a more pronounced engagement of the solute with the stationary phase, a consequence of providing a greater quantity of the sample for adsorption–desorption processes within the column. The smallest volume, 0.06095 mL, is associated with the narrowest peak, suggesting that the solute band is tightly constrained with minimal longitudinal and transverse diffusion. As the volume increase, the peak broadens due to enhanced longitudinal diffusion, and the retention time extends, attributable to the increased mass of solute interacting with the stationary phase. The largest volume, 0.9752 mL, presents the most extended elution profile, which signifies a heightened solute–stationary phase interaction time and a greater degree of band spreading. These phenomena collectively underscore the sensitivity of the chromatographic system to injection volumes, emphasizing that precise control over this parameter is essential for maintaining the desired selectivity and resolution within the chromatographic separation. This sensitivity is well documented in the literature, with studies by Ren et al. (2013) and Boonen et al. (2013) highlighting the critical role of injection volume in chromatographic performance [34,35]. Our findings further confirm the necessity of precise injection volume control for achieving optimal chromatographic outcomes.

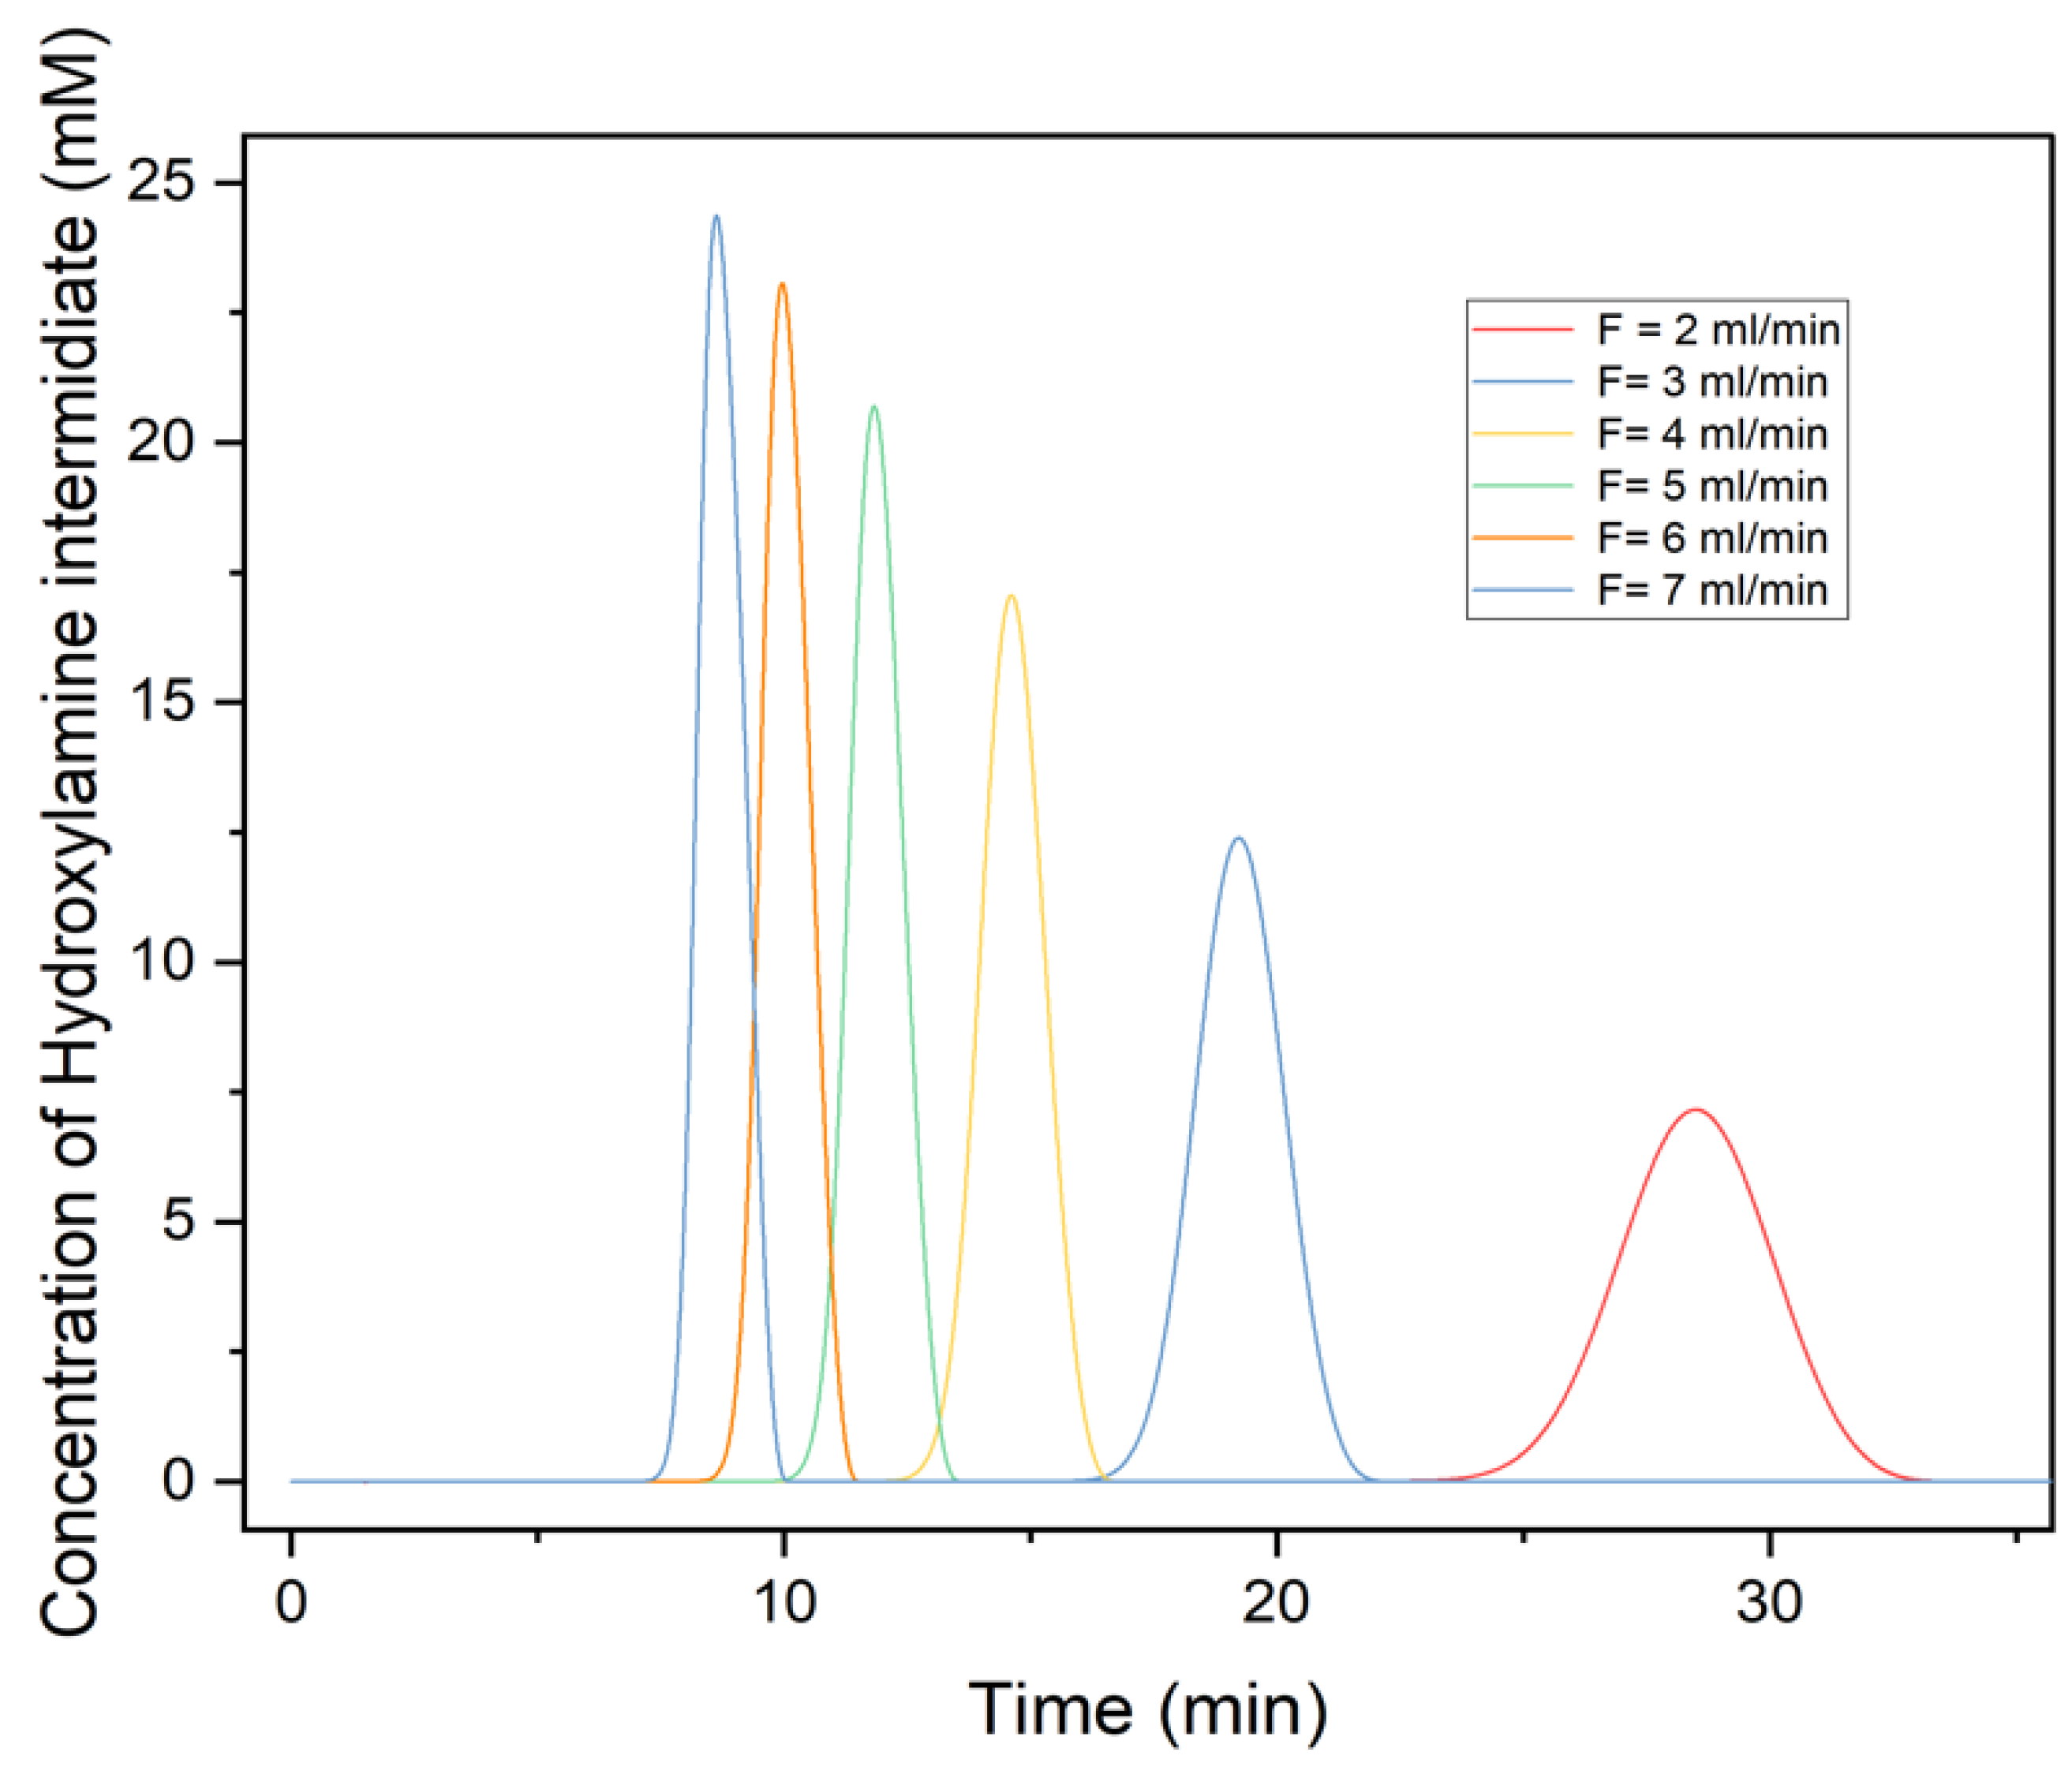
3.4. Effects of Flowrate on Chromatography Profile

The inlet flowrate is a pivotal parameter in chromatographic separations, as it directly influences the interaction between the analyte and the stationary phase, as well as the transit time of the analyte through the column. Figure 6 provides a detailed examination of how varying the flowrate impacts the elution profile of a 25 mM hydroxylamine intermediate. At the lower end of the studied range, a flowrate of 2 mL/min results in a pronounced retention time and notable peak broadening, signifying a more extensive engagement between the analyte and the stationary phase. This can be attributed to the slower passage of the mobile phase, which allows for increased solute diffusion both longitudinally along the column and transversely across the column’s width, resulting in a heightened probability of solute interaction with the stationary phase and consequent band spreading. As the flowrate escalates to 7 mL/min, a decrement in both peak width and height is observable, which reflects a reduction in the analyte’s retention time and a contraction in band spreading. At this elevated flowrate, the analyte’s residence time within the column is significantly reduced, diminishing the opportunity for diffusive spread and resulting in a more efficient elution profile. However, the acceleration of the mobile phase may also curtail the solute–stationary phase interactions essential for achieving optimal resolution. The intricate interplay between flowrate and chromatographic output is exemplified by the transition from broad, dilated peaks at low flowrates to constrained, attenuated peaks at higher flowrates. These observations substantiate the necessity of meticulously balancing flowrate to optimize chromatographic resolution and throughput.

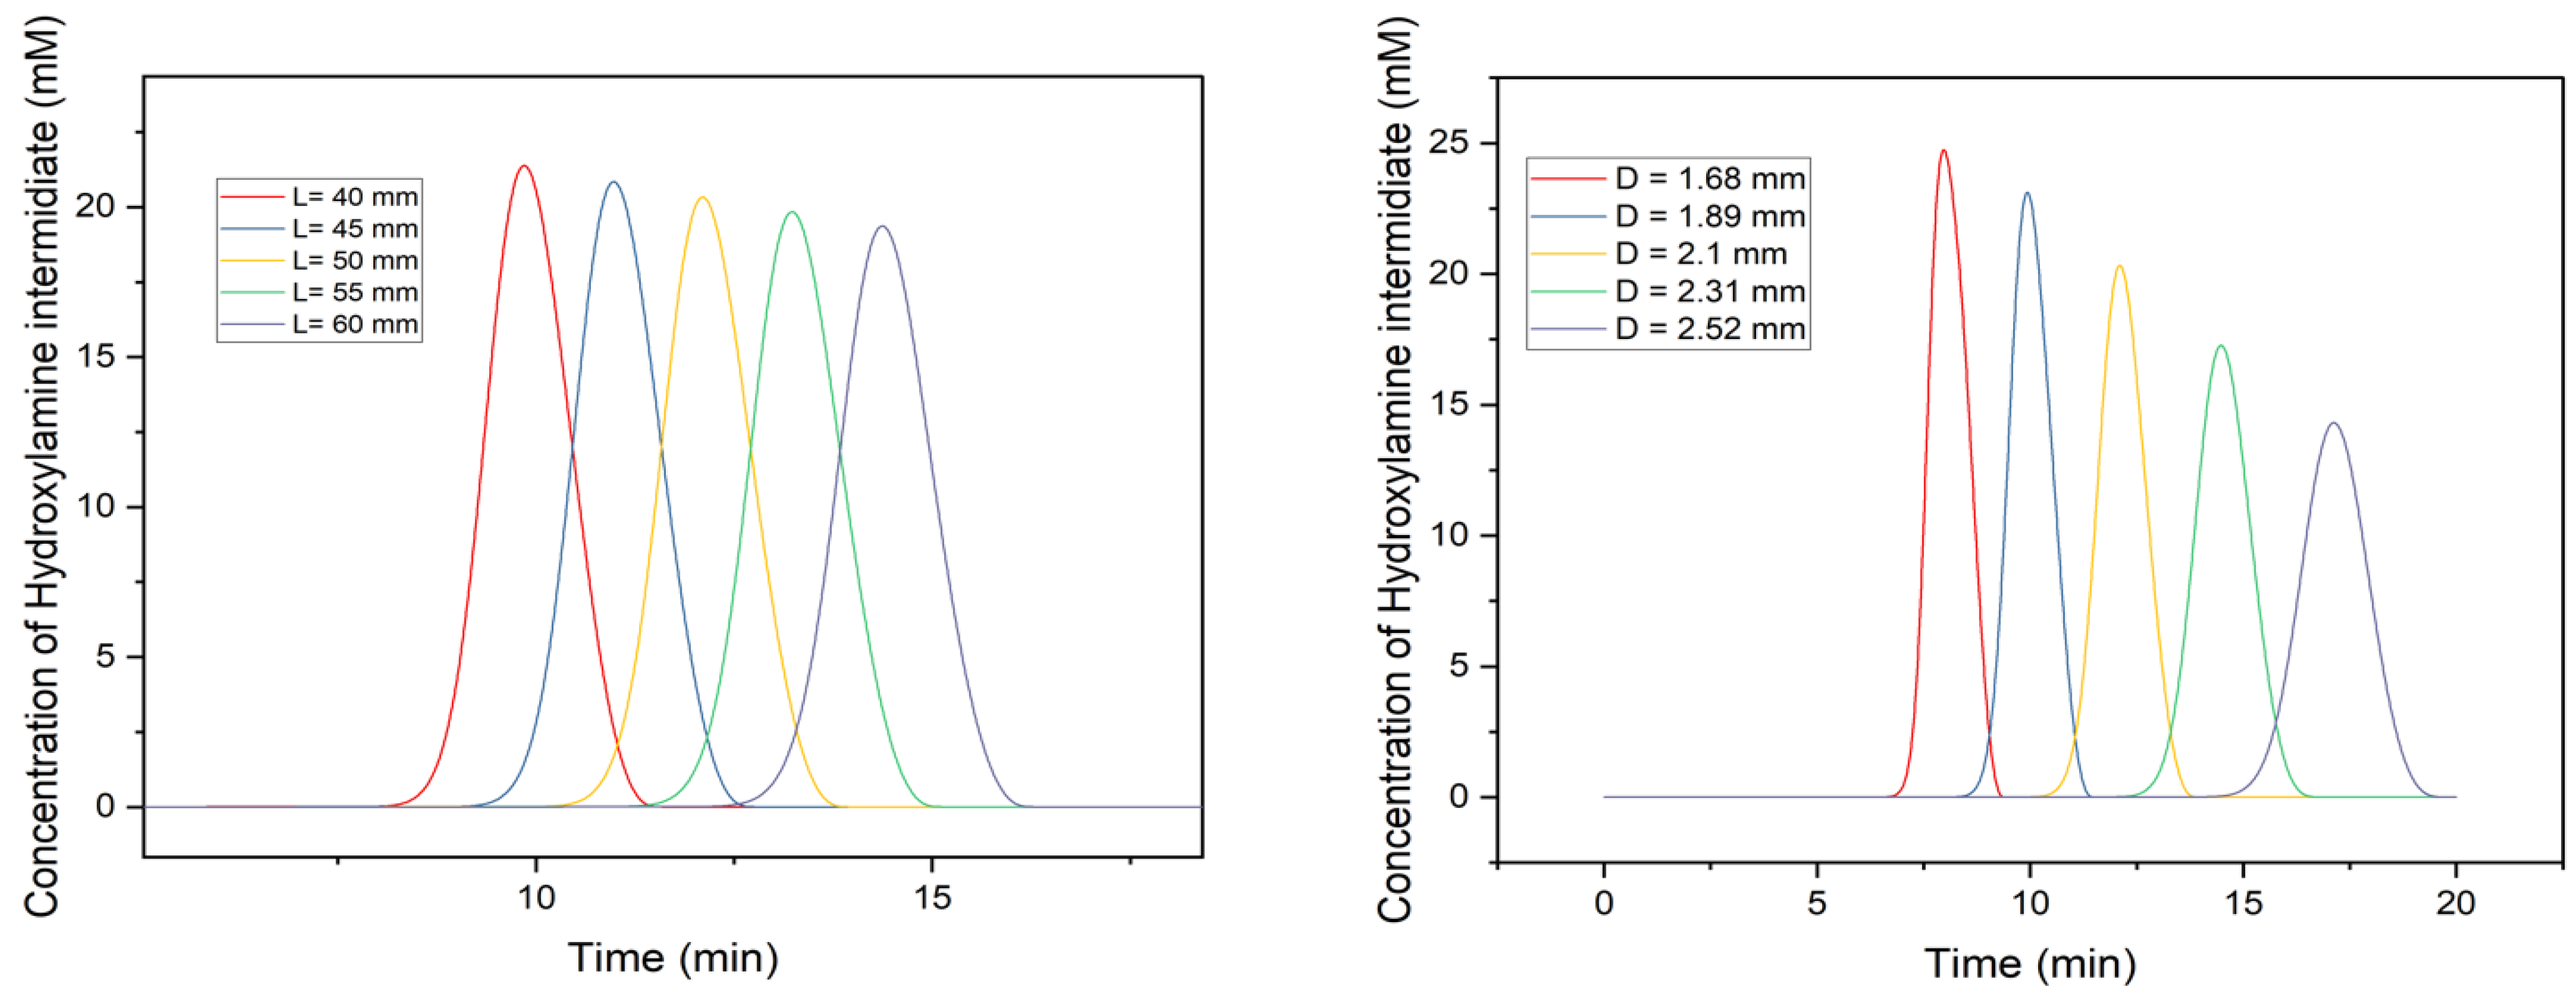
3.5. Effects of Column’s Geometry on Chromatography Profile

The length and diameter of the column play crucial roles in chromatographic separation performance. A longer column length provides a greater surface area for interaction between the analyte and stationary phase, thereby enhancing separation efficiency. However, shorter columns are more susceptible to band broadening due to factors such as longitudinal diffusion and extra–column effects. A larger diameter column will have a larger cross–sectional area, which can result in a slower linear velocity of the mobile phase. Consequently, this can impact the flow of the solute through the column. For instance, hydroxylamine may have a longer retention time in a column with a larger diameter if it interacts more with the stationary phase. In contrast, a column with a smaller diameter will have a smaller cross–sectional area, resulting in a greater linear velocity and a shorter retention time. However, a diameter that is too small can result in high pressure drops, which may cause column damage or a reduction in separation efficiency. According to Figure 7, a 10% to 20% change in column length did not significantly affect the peak height when the column length varied from 40 to 60 mm, while it mainly affected the retention time. On the other hand, the change in column diameter from 1.68 mm to 2.52 mm had a greater impact on the height of the peak. This result may indicate that the diameter of the column has a greater effect on separation performance than column length.

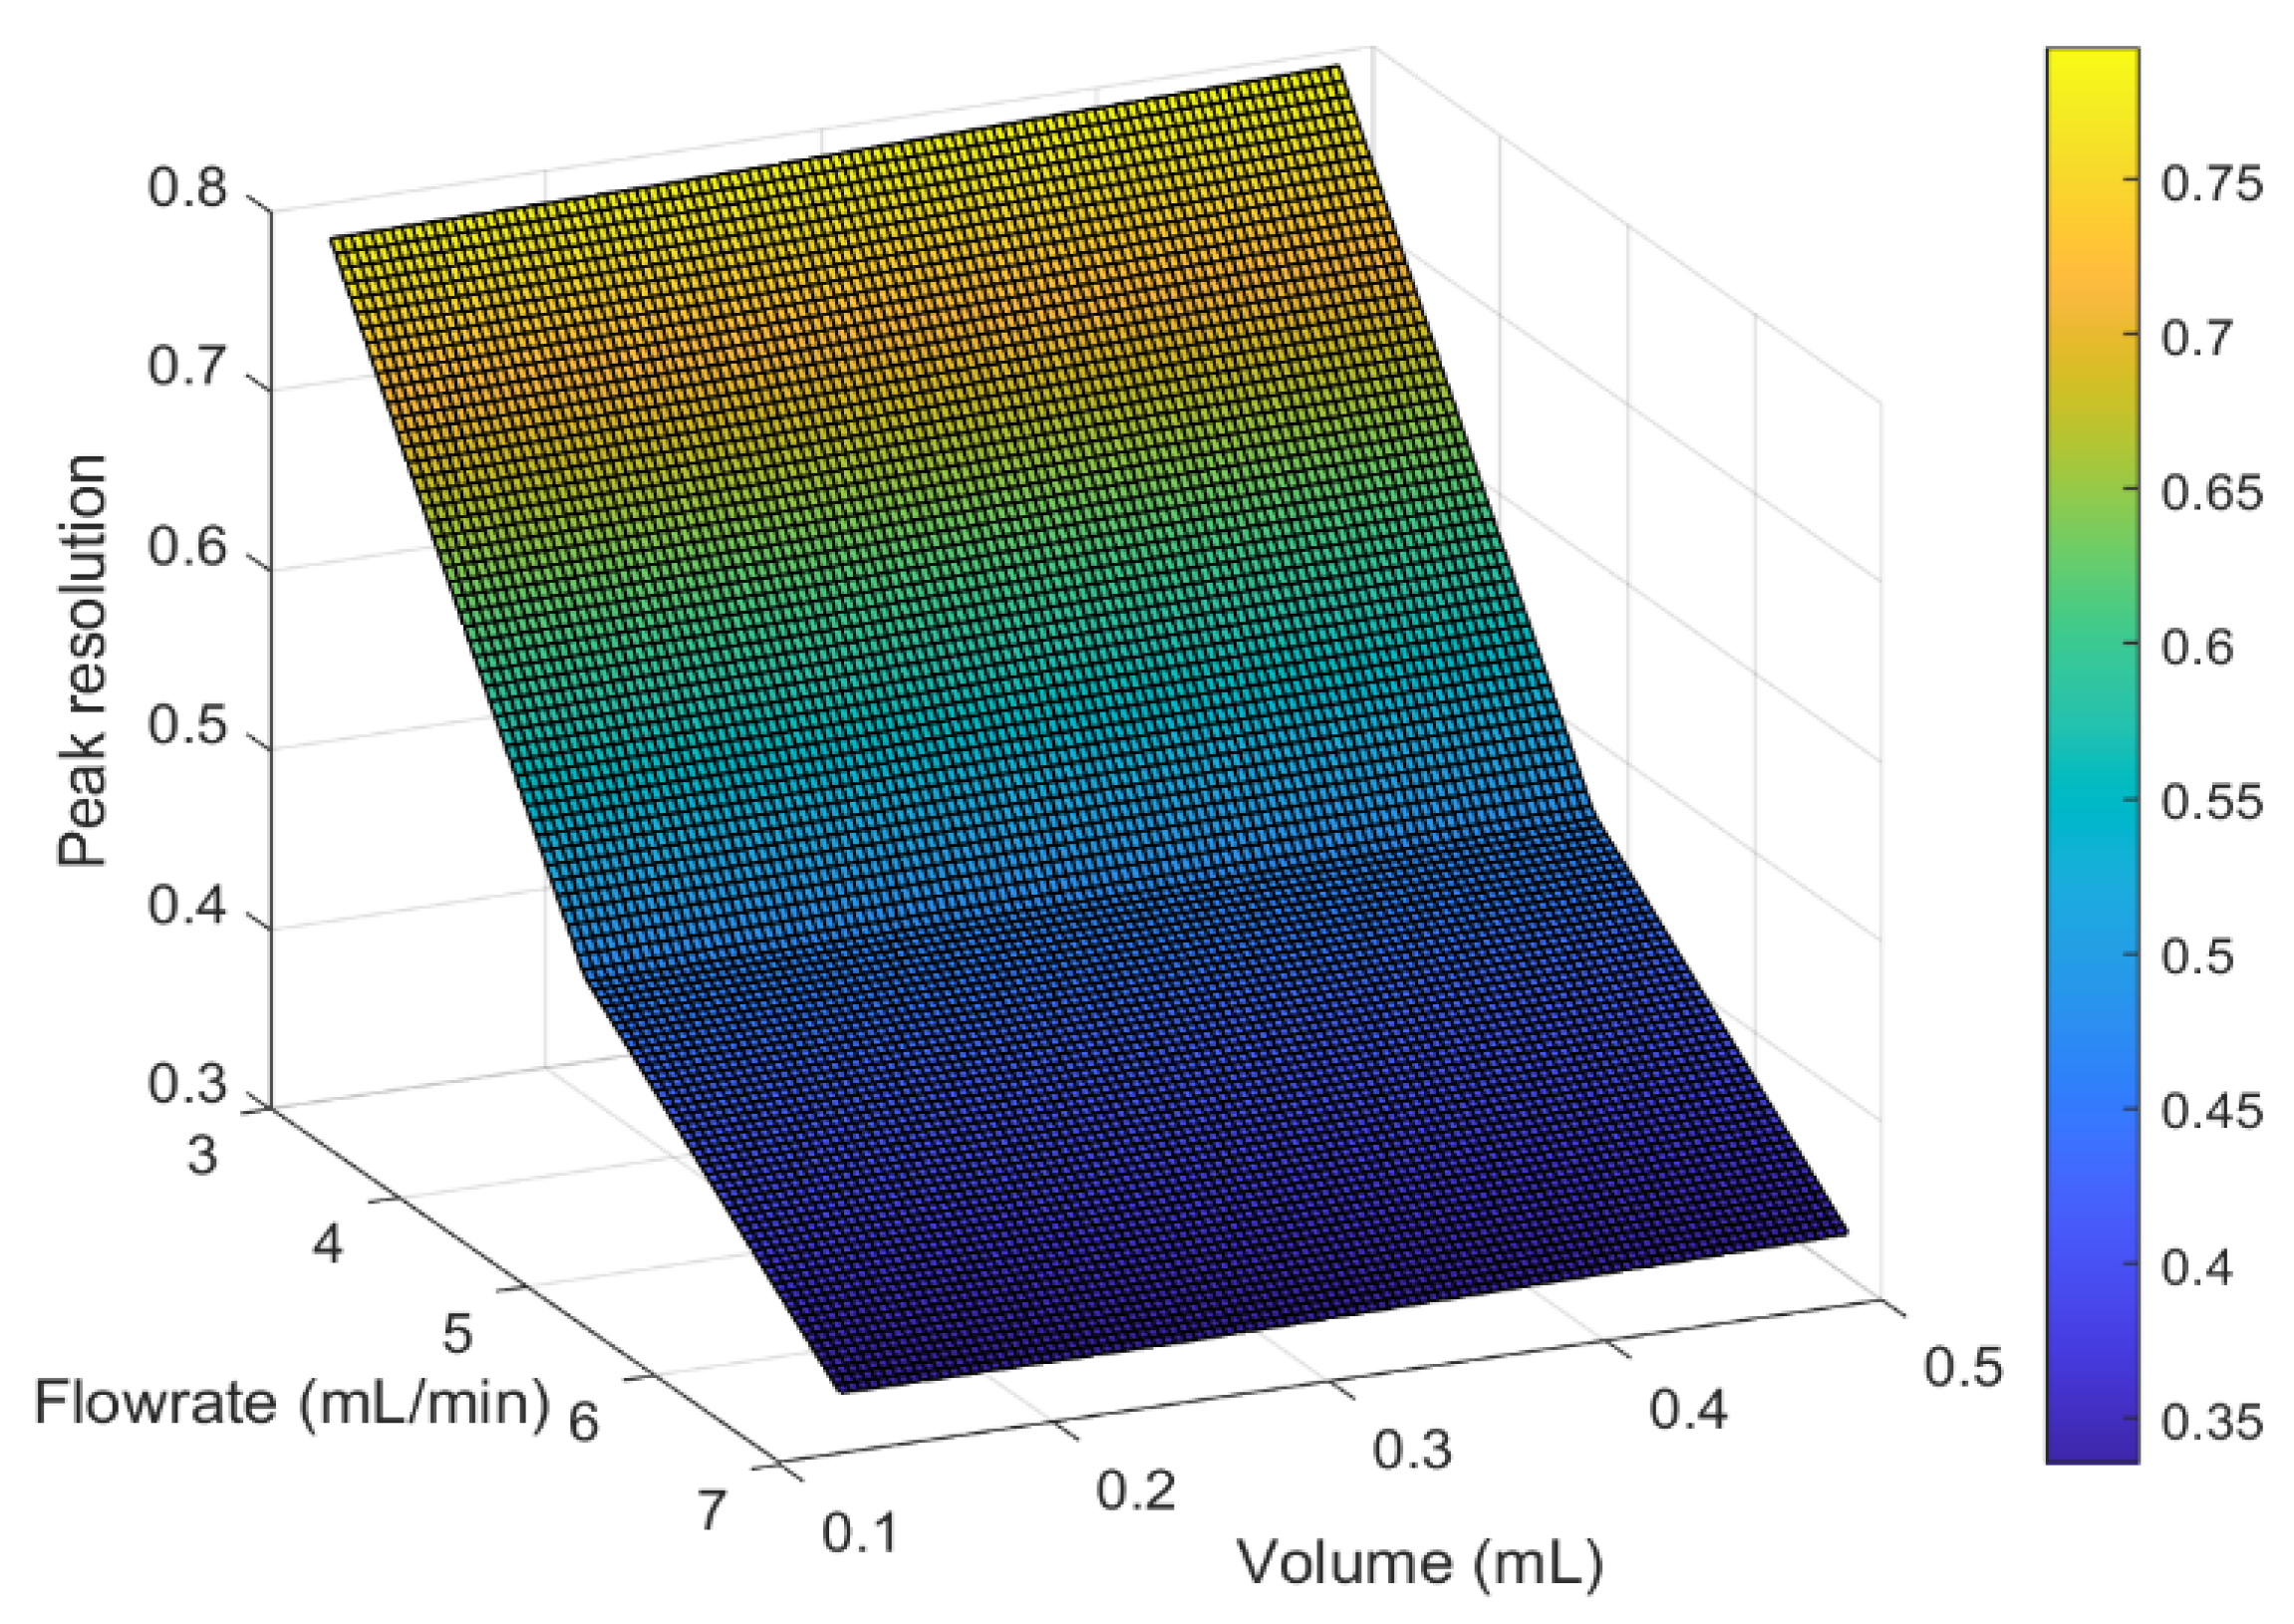
3.6. Investigating the Effect of Operational Conditions on Peak Resolution

In this study, the influence of flowrate and injection volume on the chromatographic separation of hydroxylamine and isobutyrate ester was investigated. Flowrate and injection volume are crucial parameters that can influence the separation efficiency of a chromatographic column. Resolution, the degree to which two adjacent peaks in a chromatogram can be distinguished, is a crucial chromatographic parameter.
It quantifies the separation performance of a column; the greater the resolution between two peaks, the greater the column’s separation performance. R is the resolution factor, t1 and t2 are the retention durations of the two adjacent peaks, and w1 and w2 are the baseline peak widths.
R = t 2 t 1 w 1 + w 2
Our findings demonstrated that the flowrate of the mobile phase significantly affected the chromatographic separation of these two components. According to Figure 8, changing the flowrate from 3 mL/min to 7 mL/min significantly altered the resolution and separation efficacy. At higher flowrates, the analyte retention time was shorter, resulting in a lower resolution, whereas at lower flowrates, the analyte retention time was prolonged, resulting in a higher resolution. Up until 7 mL/min, there was no separation and the resolution was around 0.8. Ideally, it has to be more than 1.5 for the species to be separated. Optimizing the flowrate is, therefore, essential for attaining the desired separation efficiency and resolution.
Another variable that can affect the separation efficacy of a column is the injection volume. According to our findings, the effect of variation in the injection volume on resolution is minimal. Changing the injection volume from 0.1219 mL to 0.4876 mL did result in peak broadening but the resolution remained low. According to Figure 9, even for different flowrates like 2 mL/min and 7 mL/min, the resolution remains similar. Finally, calculating the peak resolution by varying the volume injected and the flowrate can guide us through the effects of these two parameters and how they contribute to the separation of the two components.

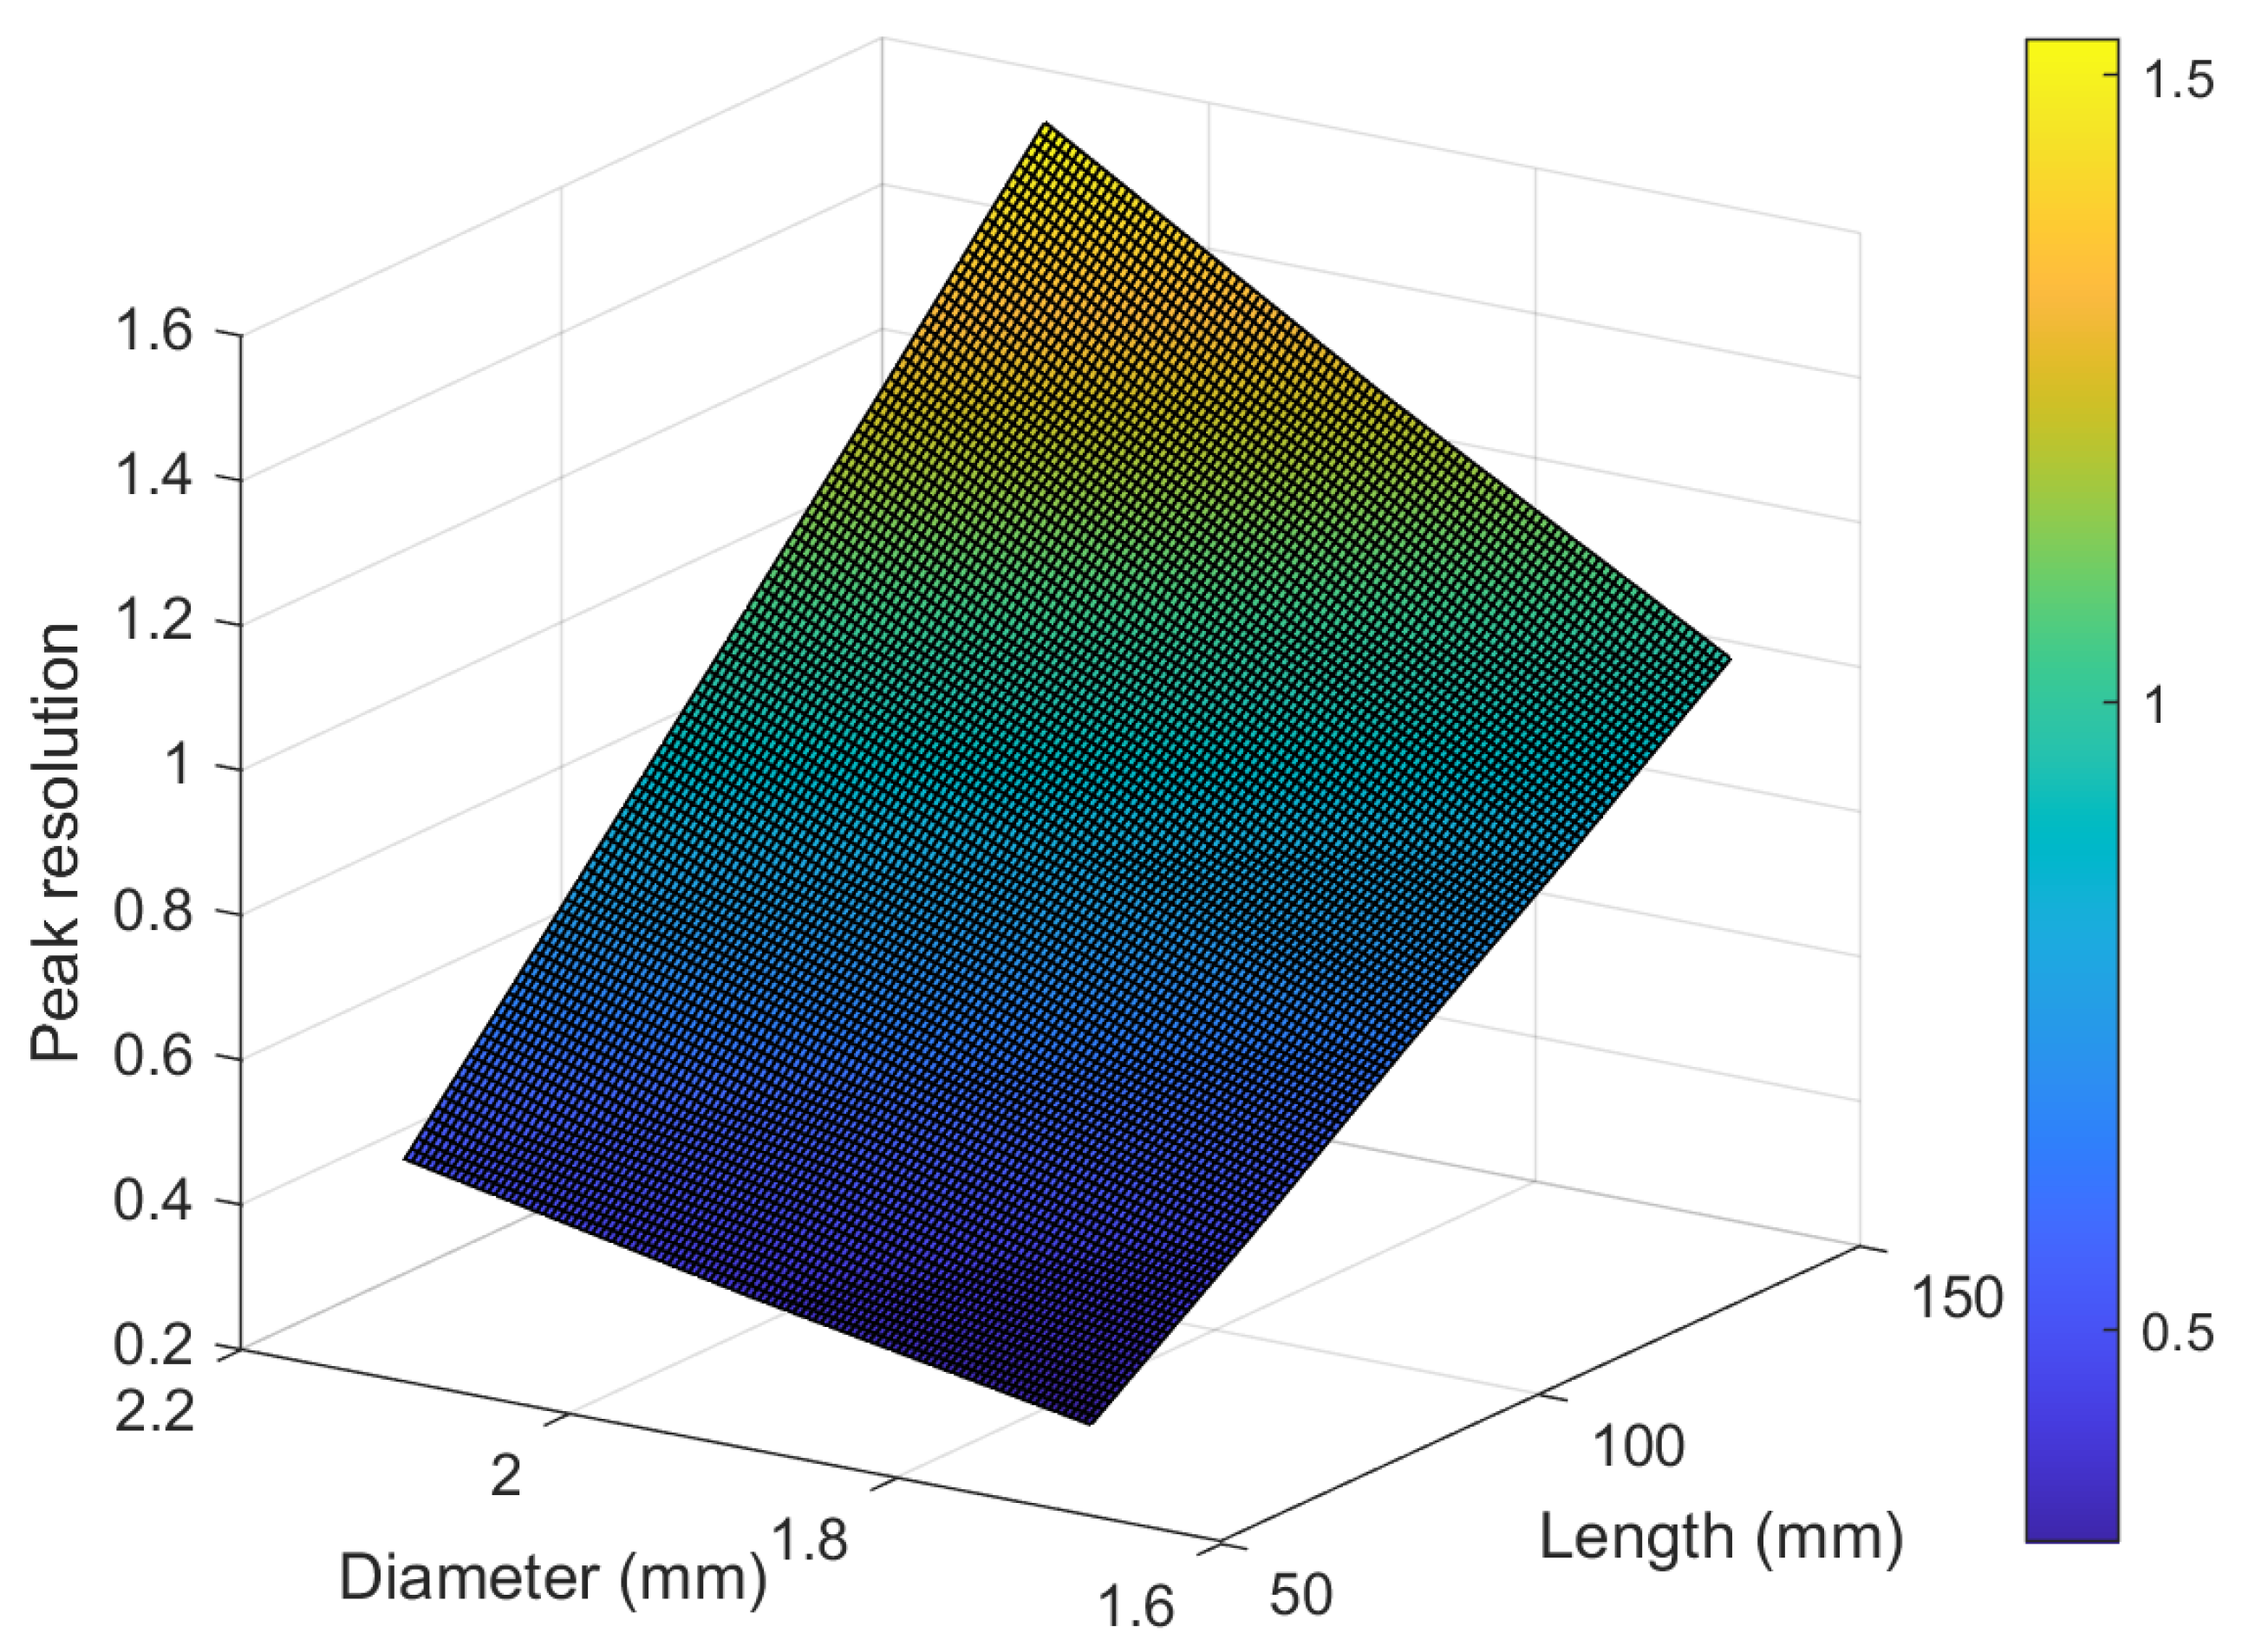
3.7. Investigating the Effect of Geometry on Peak Resolution

In this study, the influence of column geometry on the peak resolution of hydroxylamine and isobutyrate ester during reverse–phase chromatographic separation was investigated. To accomplish this, we varied the chromatography column’s length and diameter to determine the optimal separation parameters. The length of the column had a substantial effect on the separation efficacy, whereas the diameter had a diminished effect. Specifically on Figure 10, we discovered that tripling the length of the column, from 50 mm to 150 mm, resulted in the complete separation of the two components. This was confirmed by calculating the resolution between the two peaks, which demonstrated a significant increase in separation efficacy. The increased contact time between the stationary and mobile phases, which permits greater interaction and adsorption of the solutes, contributes to the increased separation efficiency with increasing column length. This results in a longer retention period and a higher peak resolution.
In contrast, a 20% change in the diameter of the column did not significantly enhance peak resolution. In our 50 mm geometry, the 20% increase in separation efficacy was insufficient to accomplish complete separation of the two components. This is likely because increasing the column diameter reduces the linear velocity of the mobile phase, resulting in extended retention durations for both components. In addition, increasing the diameter of the column can reduce the number of theoretical plates. The number of theoretical plates is a measure of separation efficacy and represents the number of equilibrium stages required for complete component separation. Due to changes in mass transfer kinetics or flow patterns, increasing the diameter of a column could theoretically result in a reduction in the number of notional plates. This indicates that for this particular separation, the column length is a more important factor than the diameter.
The resolution between the two peaks for various column geometries is depicted in Figure 11. As anticipated, resolution increases with increasing column length. For instance, the resolution between the two peaks is substantially greater in the 150 mm column than in the 50 mm and 100 mm columns. This demonstrates the significance of optimizing column length to attain the desired separation performance. In addition, it suggests that further increases in column length could result in an even higher resolution between the two peaks.
Figure 11 demonstrates that the effect of column diameter on resolution is less significant. Although a 20% increase in column diameter resulted in a modest enhancement in resolution for the 50 mm column, the effect was not as significant as the effect of column length. Once the optimal diameter has been determined, further increases in diameter may not have a significant effect on separation efficacy.

4. Conclusions

The inverse method was applied to determine the isotherm constants for the adsorption of hydroxylamine and isobutyrate products in an isocratic acetonitrile and formic acid aqueous solvent. The method was validated using six different inlet concentrations for both components, and the method’s calculated Langmuir constants matched the experimental data. The high FSSR values indicated an excellent model fit. This study examined the effects of flowrate, column geometry, the dispersivity coefficient, and injection volume on the chromatographic profile of the peaks. The results demonstrated that the flowrate, column length and diameter, dispersivity coefficient, and injection volume have a substantial effect on the retention time, peak shape, peak width, and separation efficiency of the two components and their chromatographic peaks. A slower flowrate and longer column length generate broader peaks and longer retention times, whereas a larger column diameter slows the linear velocity of the mobile phase, thereby extending the retention time. A greater dispersivity coefficient and injection volume can cause solute bands to expand and interact more with the stationary phase, thereby altering the shape and retention time of the peak. The effects of column geometry and operating conditions on the performance of chromatographic separation were studied. It was shown that the length and diameter of the column play significant roles in separation efficiency, with column length having a greater effect than diameter. Flowrate had a greater influence than injection volume on separation efficiency and resolution. The results indicate that optimizing column length and flowrate is essential for attaining the separation efficiency and resolution desired. The findings of this study provide important insights into the optimization of chromatographic separation performance of the 5′–isobutyrate ester and the hydroxylamine intermediate. Future perspectives in chromatographic separation include validating obtained results with experimental data, evaluating isotherm equations, comparing the inverse method to other techniques, examining solvent effects, and refining knowledge to contribute to the production of molnupiravir and the efficient development of a COVID–19 antiviral drug.

Supplementary Materials

The following supporting information can be downloaded at: https://www.mdpi.com/article/10.3390/pr12061273/s1, Figure S1: Ion intensity of hydroxylamine intermediate at various concentrations over time. Figure S2: Ion intensity of isobutyrate ester at various concentrations over time.

Author Contributions

Methodology, A.K.; Data curation, A.K. and G.T.; Writing—original draft, A.K.; Writing—review & editing, R.S. and G.T.; Supervision, R.S., F.M. and G.T.; Project administration, R.S., F.M. and G.T.; Funding acquisition, R.S. and F.M. All authors have read and agreed to the published version of the manuscript.

Funding

This work is supported by the US Food and Drug Administration (FDA) under contract number 75F40121C00106.

Data Availability Statement

The original contributions presented in the study are included in the article, further inquiries can be directed to the corresponding authors.

Acknowledgments

SRI International for providing the experimental data to verify the model.

Conflicts of Interest

The authors declare no conflict of interest.

Nomenclature

SymbolVariableUnits
Cp,maxMaximum adsorption capacity of species i on the adsorbentmol/m3
ciConcentration of species i in the liquidmol/L
DEffective dispersion coefficient m2/s
Df,iDiffusion coefficient of species i in the liquid phasem2/s
εpPorosity of the porous medium-
JiTotal mass transfer flux of species imol/(s·m2)
kBBoltzmann constantJ/K
KL,iLangmuir adsorption equilibrium constant for species iL/mol
LColumn lengthm
NNumber of theoretical plates-
nOutward normal vector at the column wall-
riResidual between simulation and measurement for species i-
ρDensity of the solid particleskg/m3
RColumn radiusm
rHydrodynamic radius of particlem
tRPeak retention times
TTemperatureK
tTimes
uVelocity of the liquidm/s
wBase peak widths
zAxial coordinate along the column lengthm
ηSolvent viscosityPa·s
AbbreviationsVariable
APIActive pharmaceutical ingredient
C18A type of bonded phase employed in the column
C4Butyl silica
C8Octyl silica
CMContinuous manufacturing
ECPElution by characteristic point
EDEquilibrium-dispersive model
EUAEmergency Use Authorization
FAFrontal analysis
GRGeneral Rate model
MSMass spectrometry
OBDOptimized for Broad Design
PMPerturbation
PORLumped pore diffusion model
RPCReversephase chromatography
RPLCReversed-phase liquid chromatography
TDTransport-dispersive model
UHPLCUltra-high-performance liquid chromatography
UVUltraviolet

References

  1. Saxena, S.K.; Kumar, S.; Ansari, S.; Paweska, J.T.; Maurya, V.K.; Tripathi, A.K.; Abdel-Moneim, A.S. Transmission dynamics and mutational prevalence of the novel Severe acute respiratory syndrome coronavirus-2 Omicron Variant of Concern. J. Med. Virol. 2022, 94, 2160–2166. [Google Scholar] [CrossRef] [PubMed]
  2. Al Meslamani, A.Z. Advancing towards a worldwide healthcare system in the post-COVID-19 era: Benefits and barriers to international collaboration in healthcare. J. Med. Econ. 2023, 26, 679–681. [Google Scholar] [CrossRef] [PubMed]
  3. Fischer, W.A., 2nd; Eron, J.J., Jr.; Holman, W.; Cohen, M.S.; Fang, L.; Szewczyk, L.J.; Sheahan, T.P.; Baric, R.; Mollan, K.R.; Wolfe, C.R.; et al. A phase 2a clinical trial of molnupiravir in patients with COVID-19 shows accelerated SARS-CoV-2 RNA clearance and elimination of infectious virus. Sci. Transl. Med. 2022, 14, eabl7430. [Google Scholar] [CrossRef] [PubMed]
  4. Hu, T.; Xie, Y.; Zhu, F.; Gong, X.; Liu, Y.; Xue, H.; Aisa, H.A.; Shen, J. “One-Pot” Synthesis of Molnupiravir from Cytidine. Org. Process Res. Dev. 2022, 26, 358–364. [Google Scholar] [CrossRef]
  5. Zarenezhad, E.; Marzi, M. Review on molnupiravir as a promising oral drug for the treatment of COVID-19. Med. Chem. Res. 2022, 31, 232–243. [Google Scholar] [CrossRef] [PubMed]
  6. Dey, R.; Nayak, S.; Das, P.; Yadav, S. Short Synthesis of Molnupiravir (EIDD-2801) via a Thionated Uridine Intermediate. ACS Omega 2021, 6, 28366–28372. [Google Scholar] [CrossRef] [PubMed]
  7. Cruz, G.; Acosta, J.; Del Arco, J.; Clemente-Suarez, V.J.; Deroncele, V.; Fernández-Lucas, J. Enzyme-mediated synthesis of Molnupiravir: Paving the way for the application of biocatalysis in pharmaceutical industry. ChemCatChem 2022, 14, e202200140. [Google Scholar] [CrossRef]
  8. Paymode, D.J.; Vasudevan, N.; Ahmad, S.; Kadam, A.L.; Cardoso, F.S.P.; Burns, J.M.; Cook, D.W.; Stringham, R.W.; Snead, D.R. Toward a Practical, Two-Step Process for Molnupiravir: Direct Hydroxamination of Cytidine Followed by Selective Esterification. Org. Process Res. Dev. 2021, 25, 1822–1830. [Google Scholar] [CrossRef]
  9. Steiner, A.; Znidar, D.; Otvos, S.B.; Snead, D.R.; Dallinger, D.; Kappe, C.O. A High-Yielding Synthesis of EIDD-2801 from Uridine. Eur. J. Org. Chem. 2020, 2020, 6736–6739. [Google Scholar] [CrossRef]
  10. Vasudevan, N.; Ahlqvist, G.P.; McGeough, C.P.; Paymode, D.J.; Cardoso, F.S.P.; Lucas, T.; Dietz, J.P.; Opatz, T.; Jamison, T.F.; Gupton, F.B.; et al. A concise route to MK-4482 (EIDD-2801) from cytidine. Chem. Commun. 2020, 56, 13363–13364. [Google Scholar] [CrossRef]
  11. Dyr, J.E.; Suttnar, J. Separation used for purification of recombinant proteins. J. Chromatogr. B Biomed. Sci. Appl. 1997, 699, 383–401. [Google Scholar] [CrossRef]
  12. Pesek, J.J.; Matyska, M.T.; Boysen, R.I.; Yang, Y.; Hearn, M.T. Aqueous normal-phase chromatography using silica-hydride-based stationary phases. TrAC Trends Anal. Chem. 2013, 42, 64–73. [Google Scholar] [CrossRef]
  13. Rogers, L.A.; Crews, K.E.; Long, S.G.; Patterson, K.M.; McCune, J.E. Evaluation of chromatographic methods for drug products containing polar and non-polar molecules using reversed phase, hydrophilic interaction, and ion exchange chromatography. J. Liq. Chromatogr. Relat. Technol. 2009, 32, 2246–2264. [Google Scholar] [CrossRef]
  14. Kirkland, J. Development of some stationary phases for reversed-phase HPLC. J. Chromatogr. A 2004, 1060, 9–21. [Google Scholar] [CrossRef] [PubMed]
  15. Dettmer, K.; Aronov, P.A.; Hammock, B.D. Mass spectrometry-based metabolomics. Mass Spectrom. Rev. 2007, 26, 51–78. [Google Scholar] [CrossRef] [PubMed]
  16. Jandera, P.; Janás, P.; Škeříková, V.; Urban, J. Effect of water on the retention on diol and amide columns in hydrophilic interaction liquid chromatography. J. Sep. Sci. 2017, 40, 1434–1448. [Google Scholar] [CrossRef] [PubMed]
  17. Fausnaugh, J.; Kennedy, L.; Regnier, F. Comparison of hydrophobic-interaction and reversed-phase chromatography of proteins. J. Chromatogr. A 1984, 317, 141–155. [Google Scholar] [CrossRef] [PubMed]
  18. Vailaya, A. Fundamentals of reversed phase chromatography: Thermodynamic and exothermodynamic treatment. J. Liq. Chromatogr. Relat. Technol. 2005, 28, 965–1054. [Google Scholar] [CrossRef]
  19. Andrzejewska, A.; Kaczmarski, K.; Guiochon, G. Theoretical study of the accuracy of the pulse method, frontal analysis, and frontal analysis by characteristic points for the determination of single component adsorption isotherms. J. Chromatogr. A 2009, 1216, 1067–1083. [Google Scholar] [CrossRef]
  20. Lisec, O.; Hugo, P.; Seidel-Morgenstern, A. Frontal analysis method to determine competitive adsorption isotherms. J. Chromatogr. A 2001, 908, 19–34. [Google Scholar] [CrossRef]
  21. Jacobson, J.; Frenz, J.; Horváth, C. Measurement of adsorption isotherms by liquid chromatography. J. Chromatogr. A 1984, 316, 53–68. [Google Scholar] [CrossRef] [PubMed]
  22. Chung, P.-L. Design, Modeling, and Optimization of a Multicomponent Separation Process for Insulin Purification Using Reversed Phase Chromatography. Ph.D. Thesis, Purdue University, West Lafayette, IN, USA, 2008. [Google Scholar]
  23. Samuelsson, J.; Undin, T.; Fornstedt, T. Expanding the elution by characteristic point method for determination of various types of adsorption isotherms. J. Chromatogr. A 2011, 1218, 3737–3742. [Google Scholar] [CrossRef] [PubMed]
  24. Guan, H.; Stanley, B.J.; Guiochon, G. Theoretical study of the accuracy and precision of the measurement of single-component isotherms by the elution by characteristic point method. J. Chromatogr. A 1994, 659, 27–41. [Google Scholar] [CrossRef]
  25. De Luca, C.; Felletti, S.; Macis, M.; Cabri, W.; Lievore, G.; Chenet, T.; Pasti, L.; Morbidelli, M.; Cavazzini, A.; Catani, M. Modeling the nonlinear behavior of a bioactive peptide in reversed-phase gradient elution chromatography. J. Chromatogr. A 2020, 1616, 460789. [Google Scholar] [CrossRef]
  26. Felinger, A.; Cavazzini, A.; Guiochon, G. Numerical determination of the competitive isotherm of enantiomers. J. Chromatogr. A 2003, 986, 207–225. [Google Scholar] [CrossRef] [PubMed]
  27. Xu, J.; Zhu, L.; Xu, G.; Yu, W.; Ray, A.K. Determination of competitive adsorption isotherm of enantiomers on preparative chromatographic columns using inverse method. J. Chromatogr. A 2013, 1273, 49–56. [Google Scholar] [CrossRef]
  28. Arnell, R.; Forssén, P.; Fornstedt, T. Accurate and rapid estimation of adsorption isotherms in liquid chromatography using the inverse method on plateaus. J. Chromatogr. A 2005, 1099, 167–174. [Google Scholar] [CrossRef] [PubMed]
  29. Gritti, F. Perspective on the future approaches to predict retention in liquid chromatography. Anal. Chem. 2021, 93, 5653–5664. [Google Scholar] [CrossRef] [PubMed]
  30. Chen, L.; Yu, B.; Zhang, Y.; Gao, X.; Zhu, L.; Ma, T.; Yang, H. Bioactivity-Guided Fractionation of an Antidiarrheal Chinese Herb Rhodiola kirilowii (Regel) Maxim Reveals (-)–Epicatechin-3-Gallate and (-)–Epigallocatechin-3-Gallate as Inhibitors of Cystic Fibrosis Transmembrane Conductance Regulator. PLoS ONE 2015, 10, e0119122. [Google Scholar] [CrossRef]
  31. Arafah, R.S.; Ribeiro, A.E.; Rodrigues, A.E.; Pais, L.S. Separation of nadolol racemates by high pH reversed-phase preparative chromatography. Sep. Purif. Technol. 2020, 233, 116018. [Google Scholar] [CrossRef]
  32. Dutta, B.K. Principles of Mass Transfer and Seperation Processes; PHI Learning Pvt. Ltd.: Delhi, India, 2007. [Google Scholar]
  33. Islam, M.A.; Chowdhury, M.A.; Mozumder, M.S.I.; Uddin, M.T. Langmuir adsorption kinetics in liquid media: Interface reaction model. ACS Omega 2021, 6, 14481–14492. [Google Scholar] [CrossRef] [PubMed]
  34. Boonen, J.; D’Hondt, M.; Veryser, L.; Peremans, K.; Burvenich, C.; Spiegeleer, B.D. A critical quality parameter in quantitative fused-core chromatography: The injection volume. J. Pharm. Anal. 2013, 3, 330–334. [Google Scholar] [CrossRef] [PubMed]
  35. Ren, D.; Yang, Z.; Liang, Y.; Fan, W.; Ding, Q. Effects of injection volume on chromatographic features and resolution in the process of counter-current chromatography. J. Chromatogr. A 2013, 1277, 7–14. [Google Scholar] [CrossRef] [PubMed]
Figure 1. The components that should be separated to avoid undesirable byproducts: hydroxylamine intermediate and 5′–isobutyrate ester and the final product, molnupiravir.
Processes 12 01273 g001
Figure 2. Methodology for the estimation of the adsorption kinetics.
Processes 12 01273 g002
Figure 3. Model fitting for a set of Langmuir isotherm constants. (a) Hydroxylamine intermediate and (b) Isobutyrate ester.
Processes 12 01273 g003
Figure 4. Effects of dispersivity coefficient on the injected 25 mM hydroxylamine compound outlet chromatography profile.
Processes 12 01273 g004
Figure 5. Effects of injection volume on the injected 25 mM hydroxylamine compound outlet chromatography profile.
Processes 12 01273 g005
Figure 6. Flowrate effects on the injected 25 mM hydroxylamine compound outlet chromatography profile.
Processes 12 01273 g006
Figure 7. Column length and diameter effects on the injected 25 mM hydroxylamine compound outlet chromatography profile.
Processes 12 01273 g007
Figure 8. Impact of Flowrate and Injection Volume on Outlet Concentration: (a) Outlet concentration profiles at varying flowrates, (b) Outlet concentration profiles at varying injection volumes and flowrates.
Processes 12 01273 g008
Figure 9. Effects of Injection Profile on Peak Resolution for various flowrate and injection volumes.
Processes 12 01273 g009
Figure 10. Impact of Column Geometry on Outlet Concentration: (a) Variation with column length. (b) Variation with column diameter for lengths of 50 mm and 150 mm.
Processes 12 01273 g010
Figure 11. Column geometry effects on peak resolution.
Processes 12 01273 g011
Table 1. Initial and boundary conditions.
PhysicsInlet (z = 0)Outlet
(L = 50 mm)
Adsorber Wall
(R = 0.0465 in)
Initial Condition
Mass transferc(t, z = 0) = u(t) n D i c i = 0 No flux
n · J = 0
ci = 0
Where u(t) is the rectangle pulse injection function. Comprehensive descriptions of the solvent system used, along with detailed calculations for the diffusion and dispersion coefficients of the hydroxylamine intermediate and isobutyrate ester, are available in the Supporting Information.
Table 2. Isotherm constants and fitting of the Statistical Sum of Squares Ratio (FSSR) using the inverse method.
On ComponentKL (m3/mol)Cp,max (mol/kg)FSSR
Hydroxylamine intermediate0.00063409645.240.9894
5-Isobutyrate ester0.00063756752.250.9941
Disclaimer/Publisher’s Note: The statements, opinions and data contained in all publications are solely those of the individual author(s) and contributor(s) and not of MDPI and/or the editor(s). MDPI and/or the editor(s) disclaim responsibility for any injury to people or property resulting from any ideas, methods, instructions or products referred to in the content.

