

Monitoring, Control and Optimization of Laser Micro-Perforation Process for Automotive Synthetic Leather Parts


Abstract
:1. Introduction
1.1. Literature Review
1.2. Objectives and Scope of the Study
- Uniform and precise perforations: The optimization of the laser parameters and rigorous control implementation should lead to uniform and precise perforations across the entire surfaces of synthetic leather parts.
- Reduction in defects and waste: Real-time process monitoring should enable the immediate detection and correction of any issues, thus reducing the quantity of damaged material and minimizing waste.
- Increase in efficiency and consistency: Through parameter optimization and continuous process control, a significant increase in operational efficiency and improved consistency in the quality of end products is anticipated.
2. Materials and Methods
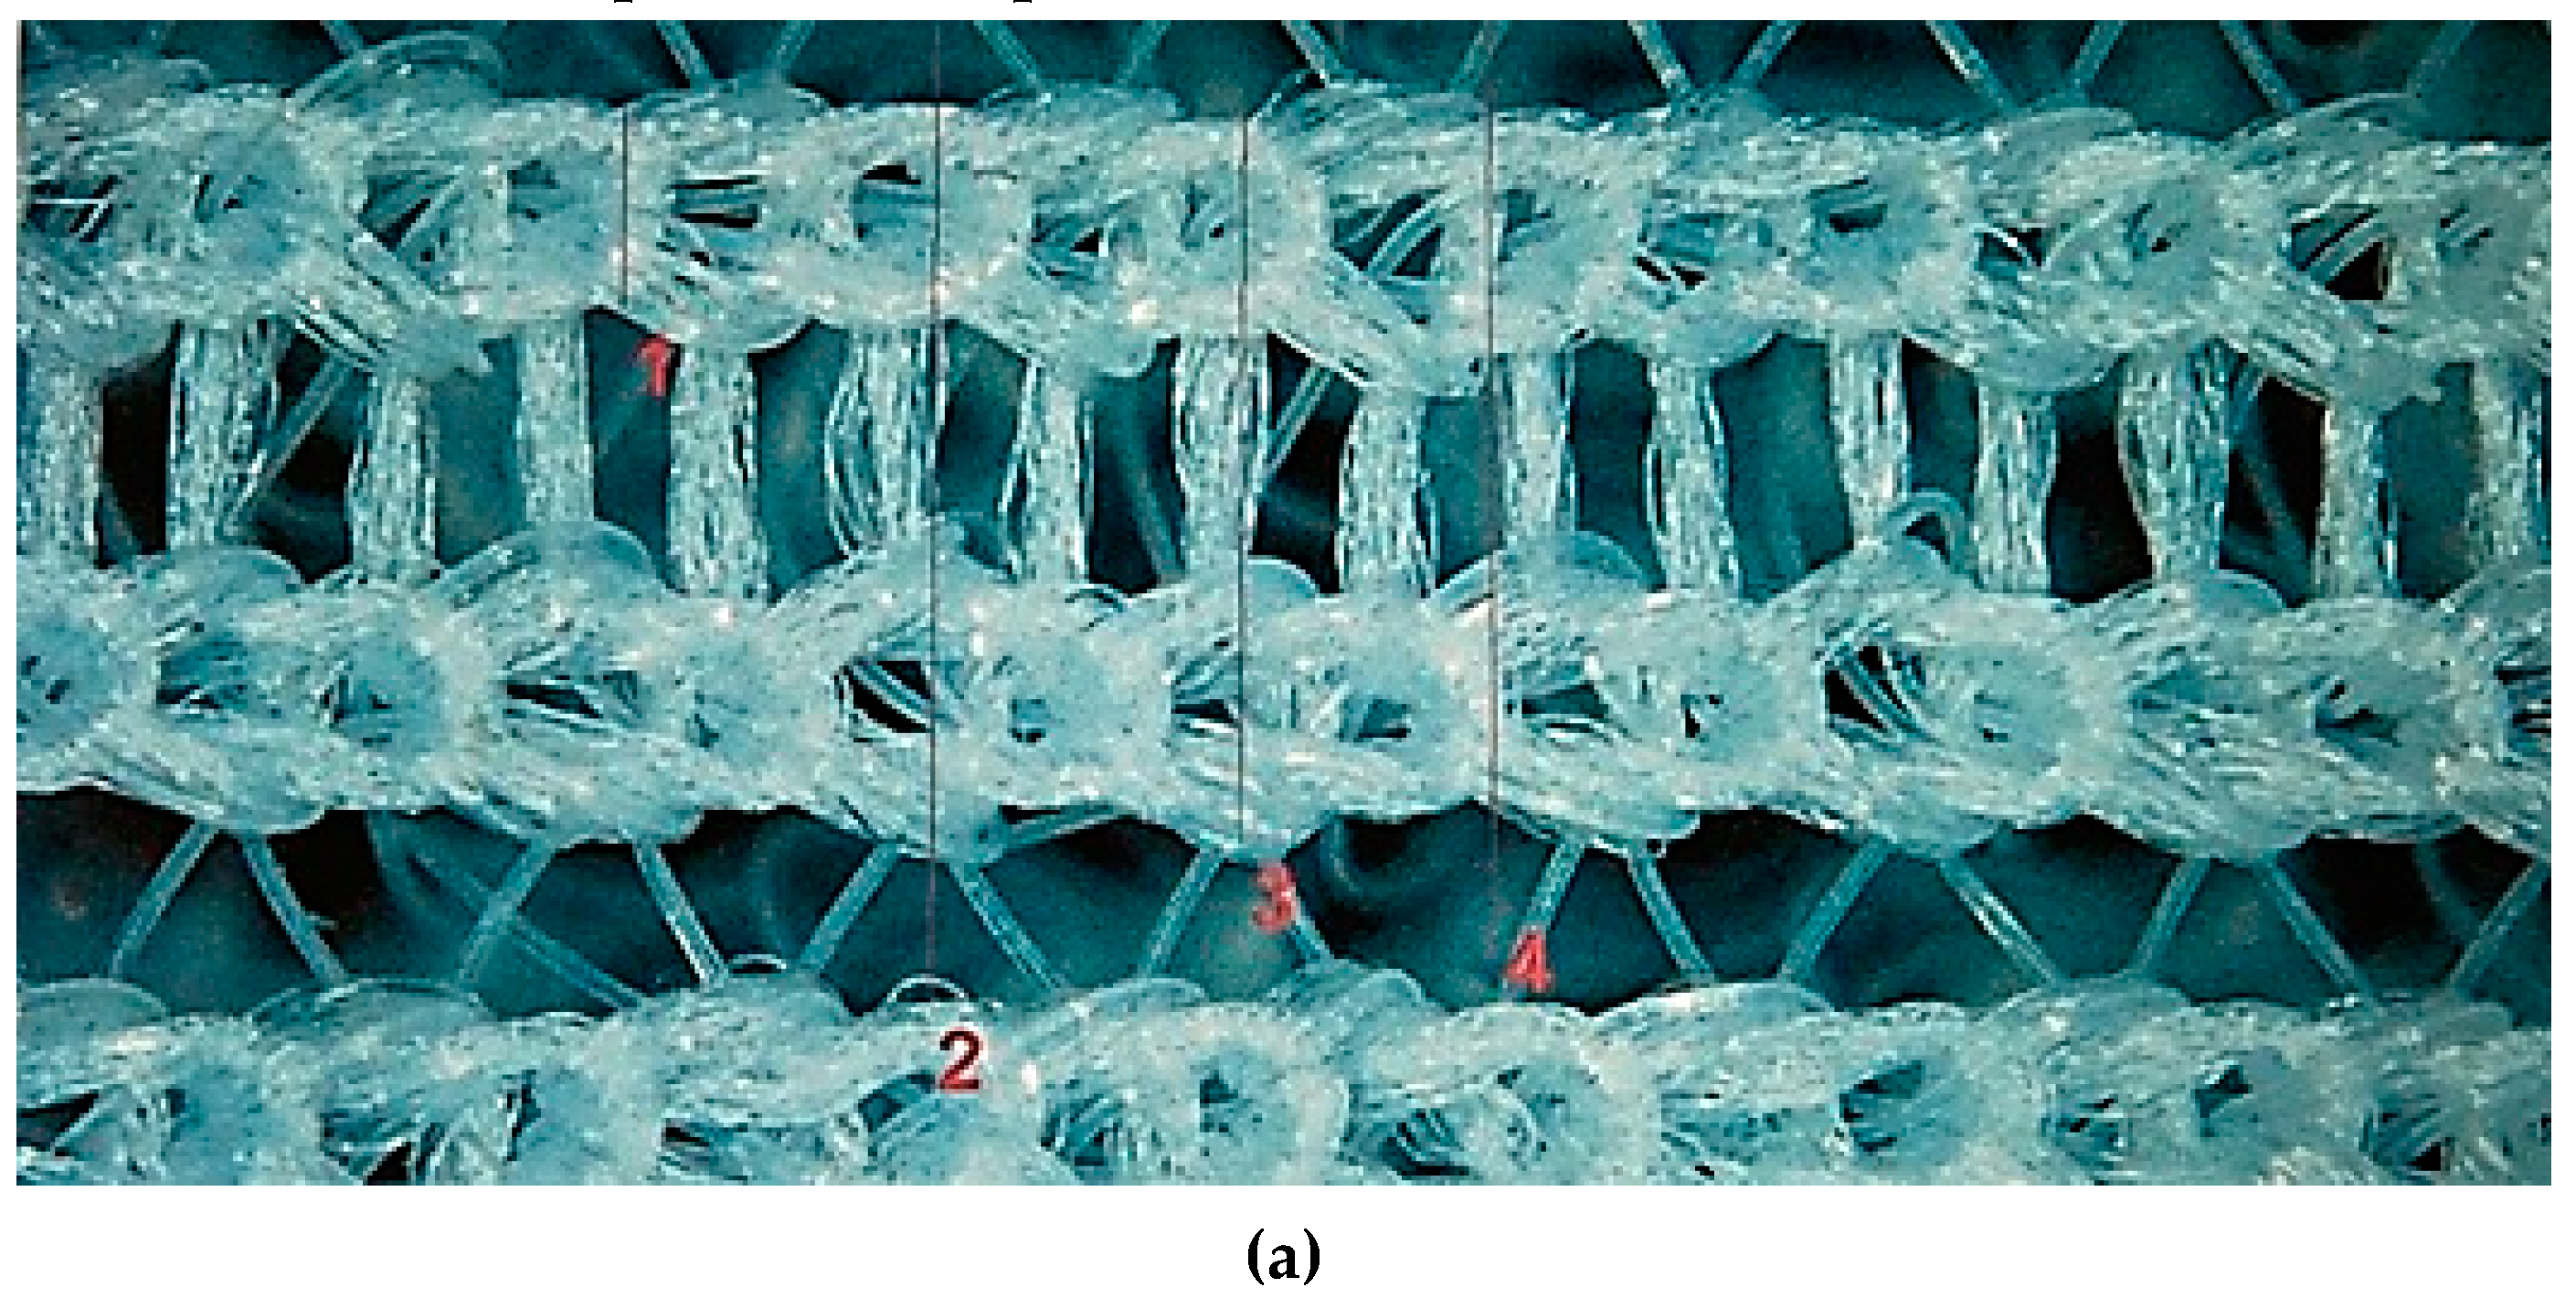
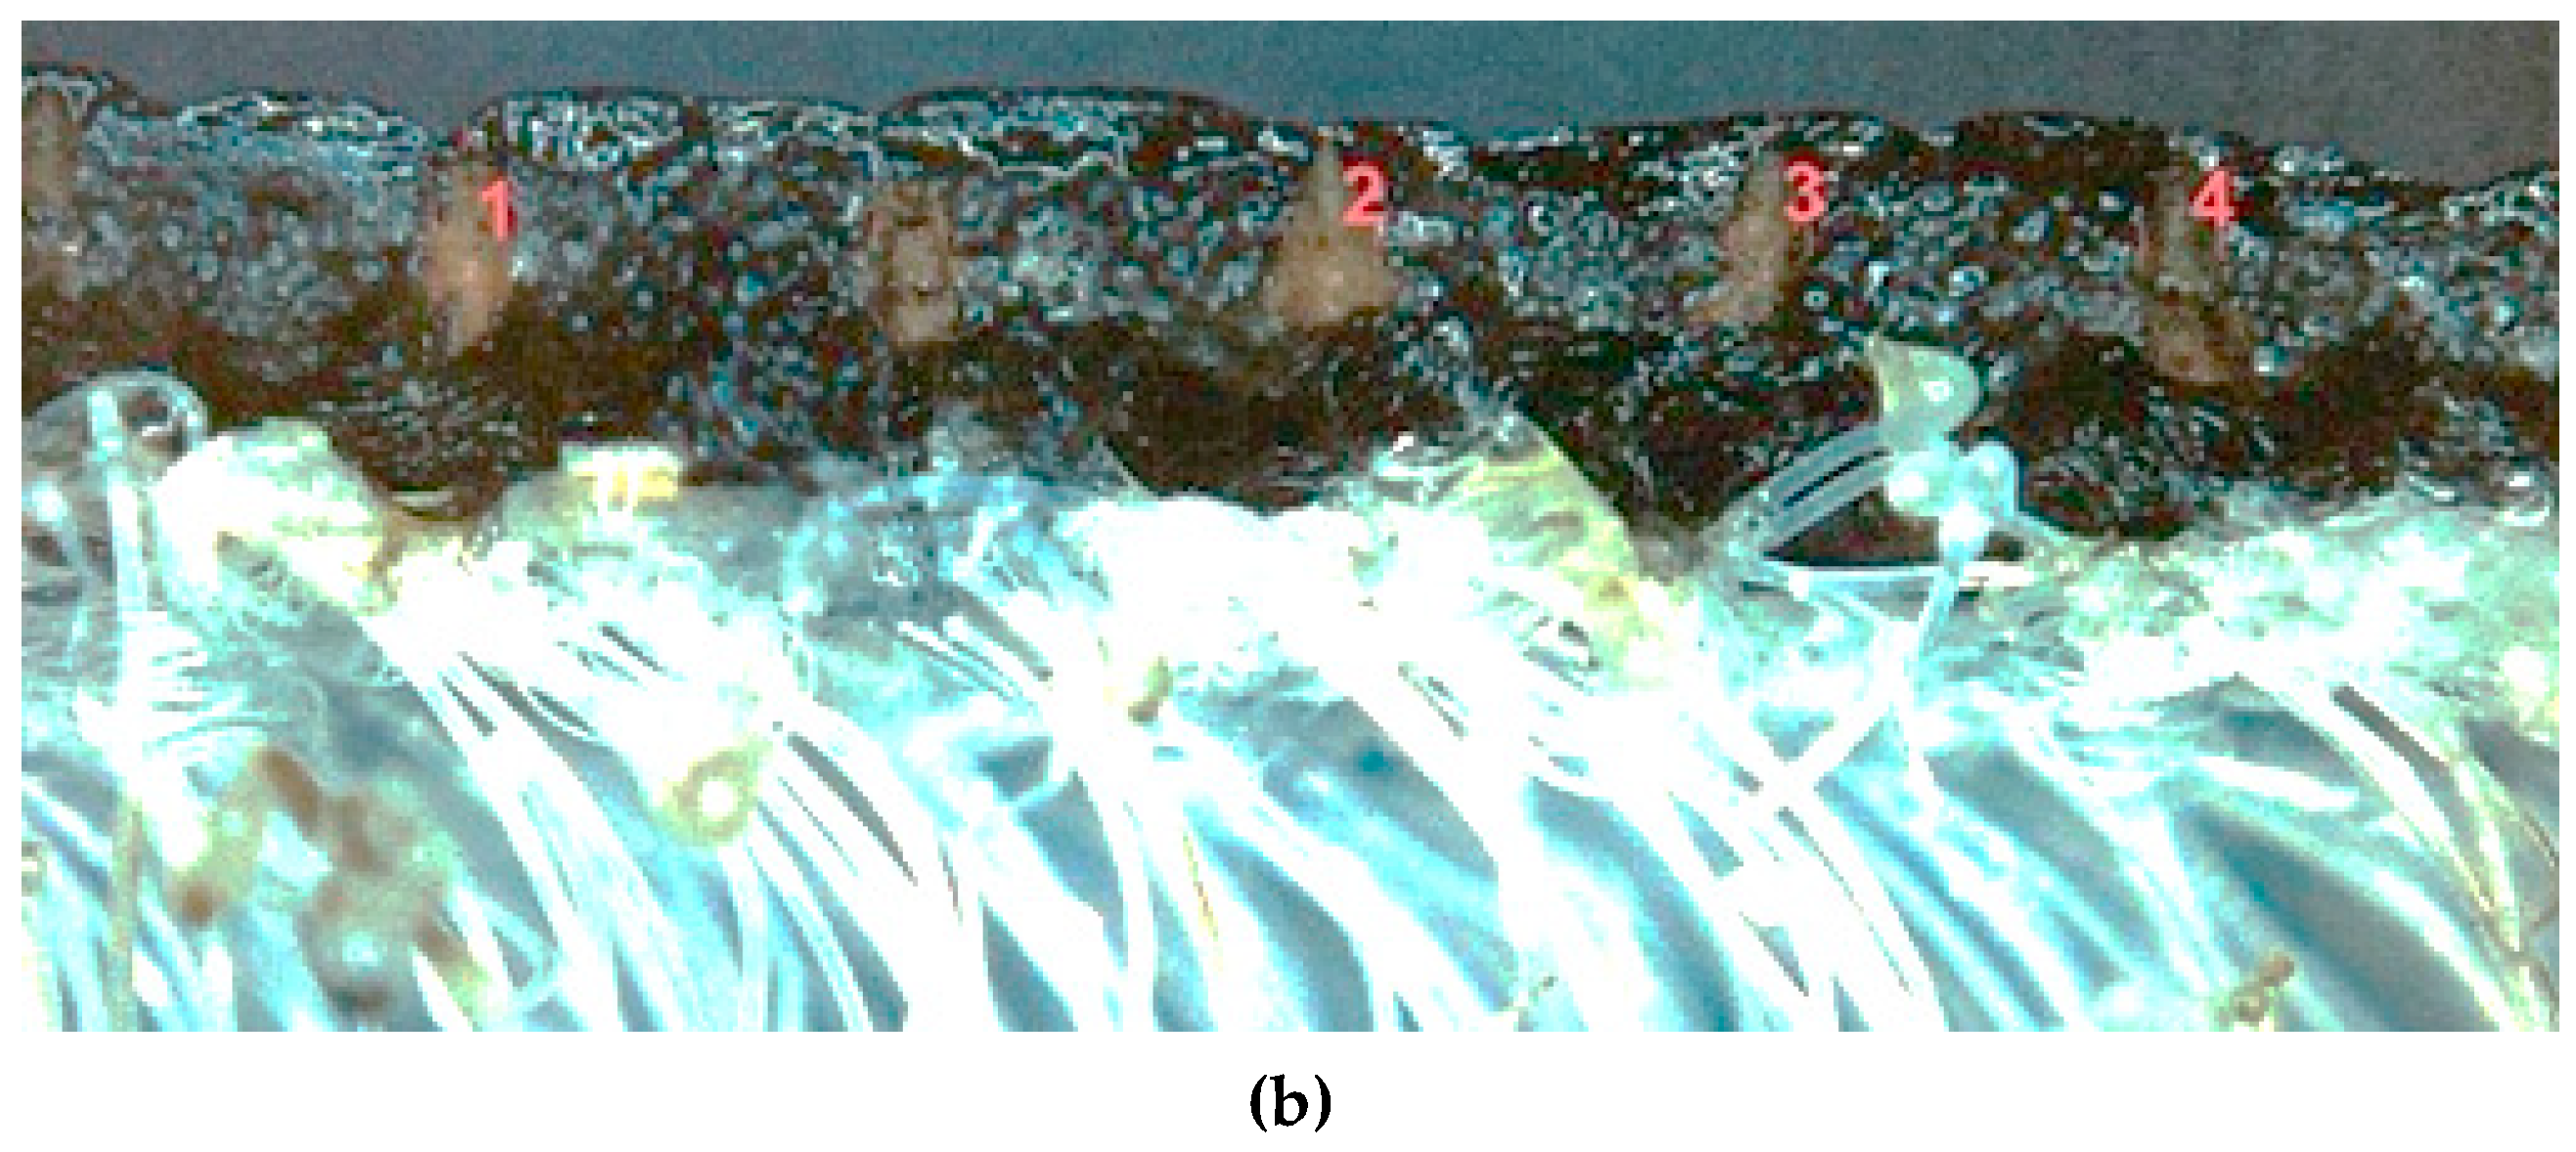
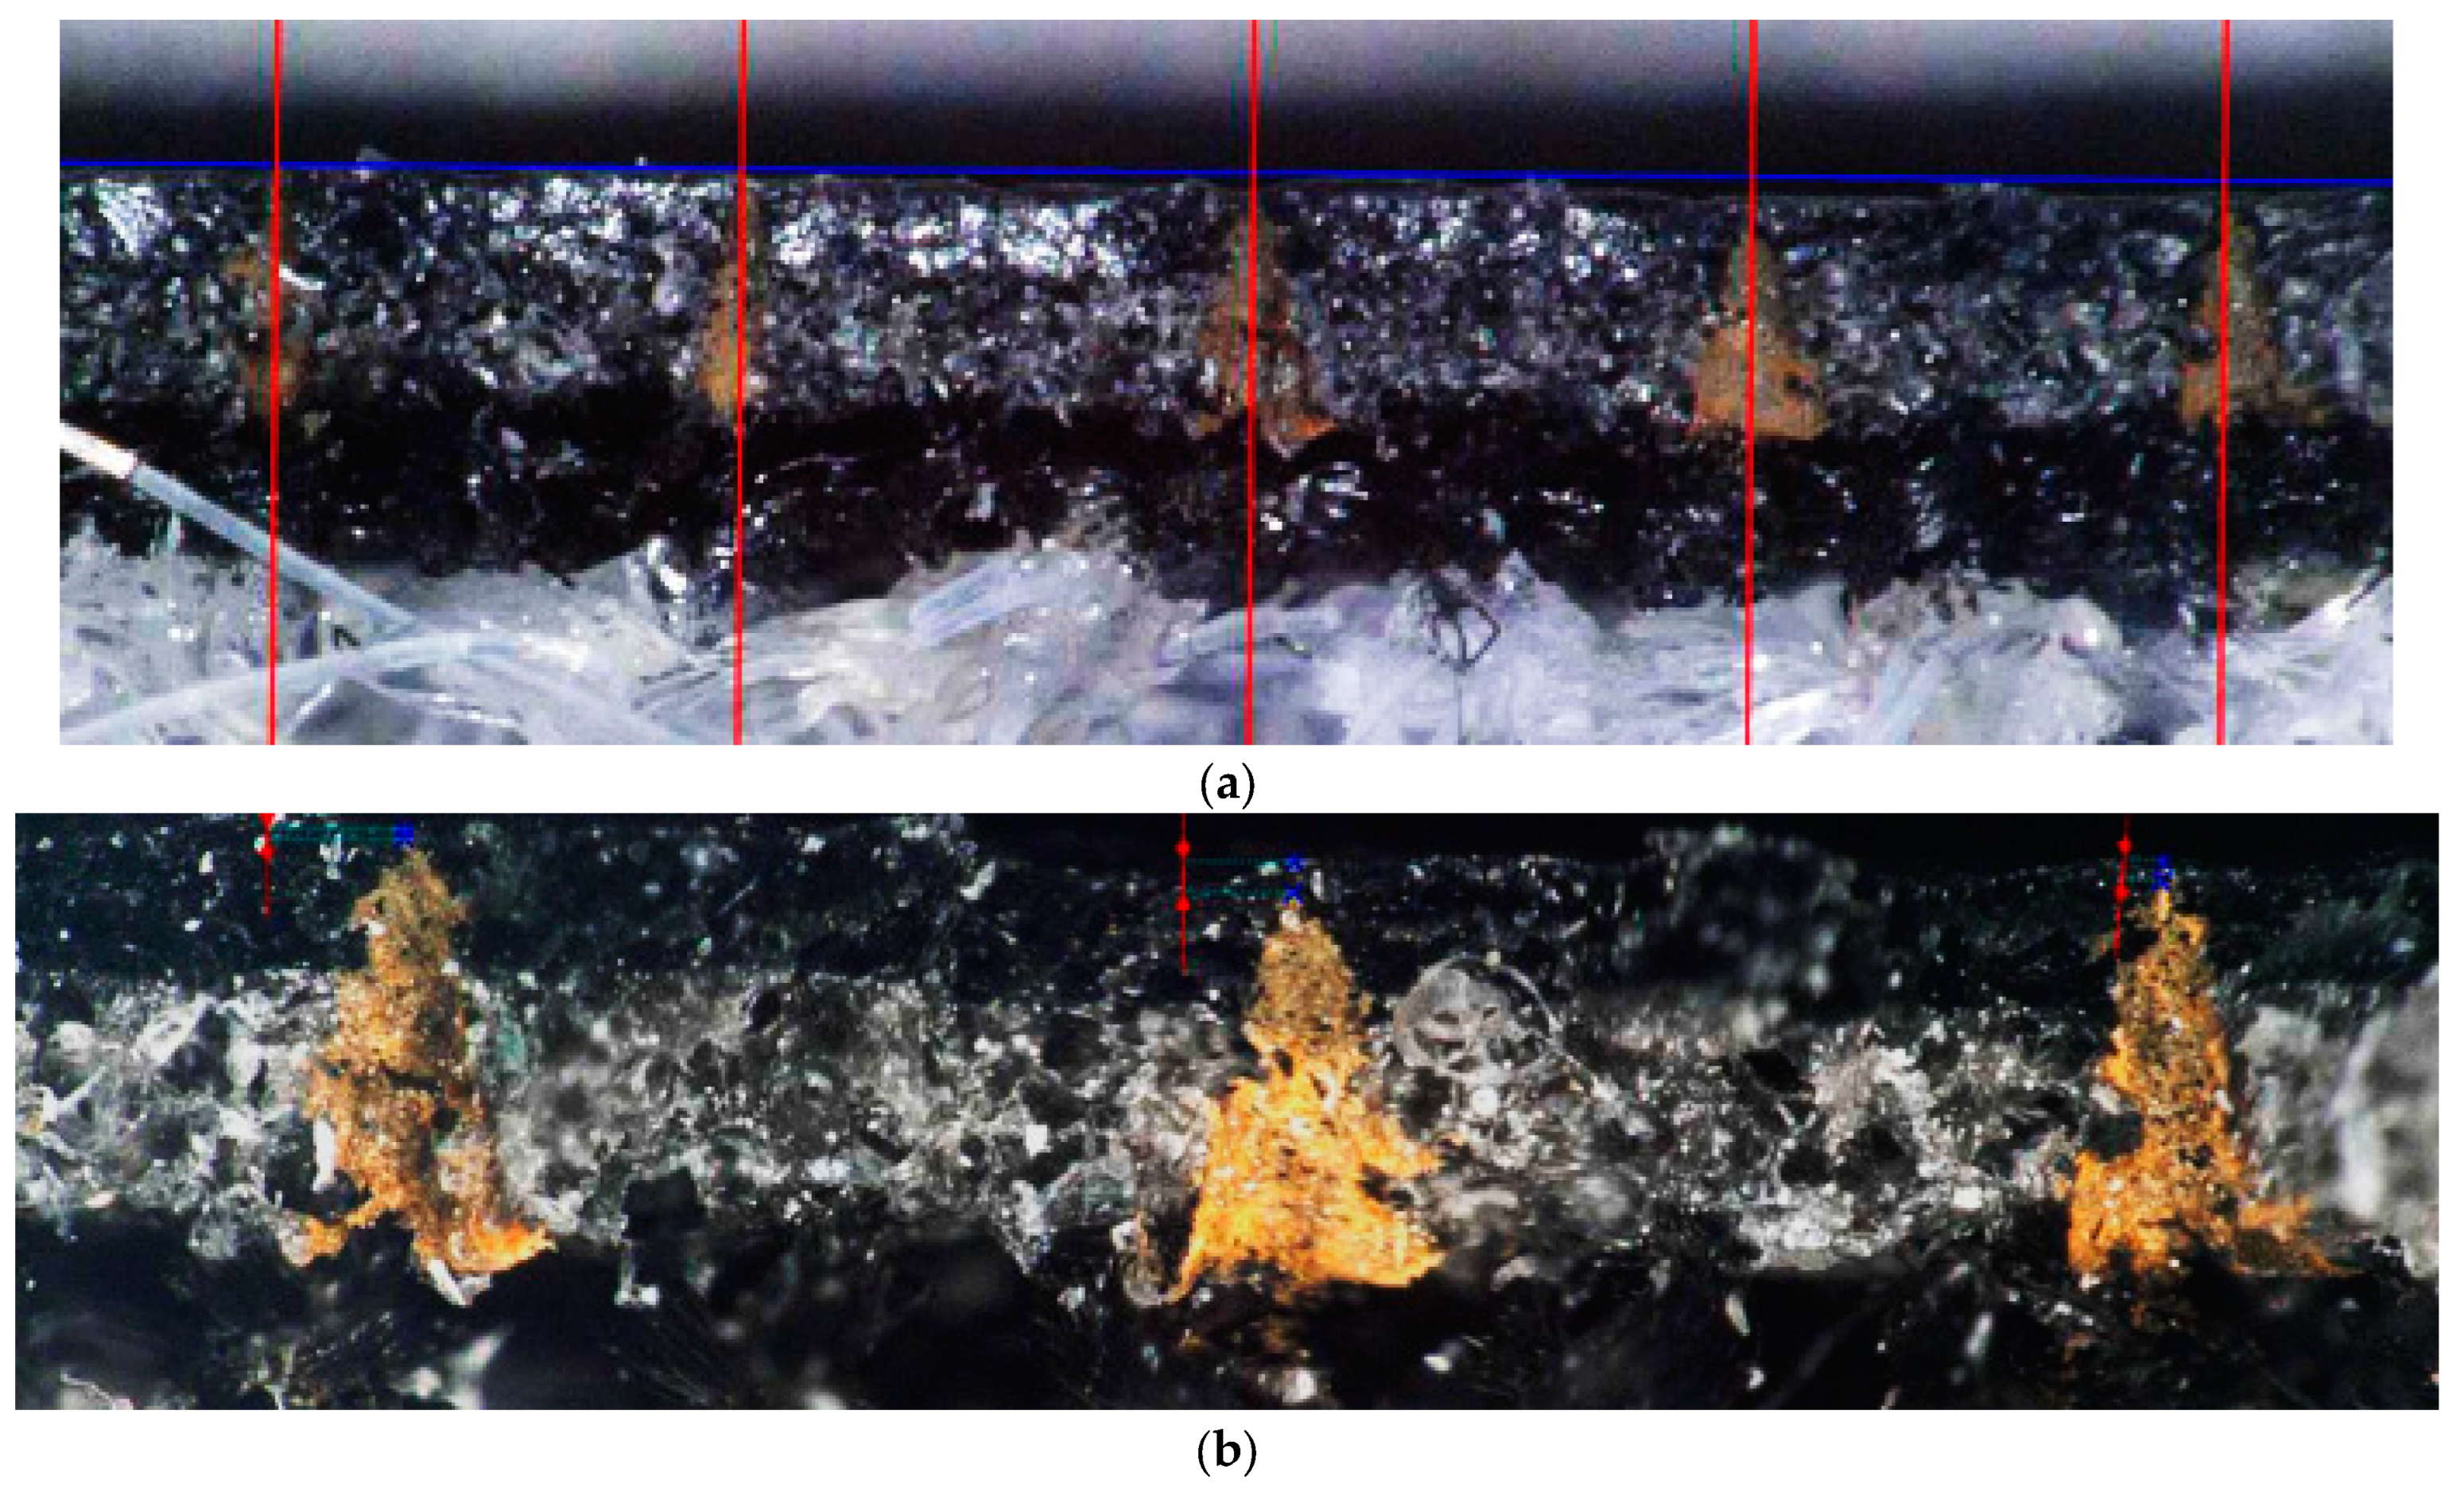
- Synthetic leather: The synthetic leather parts used in this study were selected to represent common materials utilized in the automotive component manufacturing industry for airbag production (Figure 2). The sample size was 50 parts for each analyzed parameter: the laser power and material thickness. For the factorial analysis, 950 samples were considered. The material used consisted of synthetic leather produced from polyvinyl chloride (PVC) with a nominal thickness of 1.2 mm. This was laminated with a spacer fabric with a nominal thickness of 2.99 mm, with a specified tolerance of ±0.3 mm.
- Laser process: The micro-perforation process was conducted using a high-precision laser system, enabling precise control of the perforation parameters, such as the power and operating speed (Figure 3).
- Material characterization: Preliminary tests were conducted to characterize the material properties, including the thickness, texture and temperature resistance, before commencing the micro-perforation process.
- Laser parameter setting: Critical parameters of the laser process, including the power, frequency and beam traversal speed, were optimized to ensure efficient and uniform material perforation.
- Real-time monitoring and control: During the micro-perforation process, monitoring and control systems were implemented to detect and rectify any deviations in the operating parameters, thereby maintaining the quality and consistency of the perforations.
2.1. Methodology
2.2. Laser Processing Investigation
2.3. Experimental Design and Setup
2.4. Collection and Statistical Analysis
3. Statistical Analysis of Experimental Data
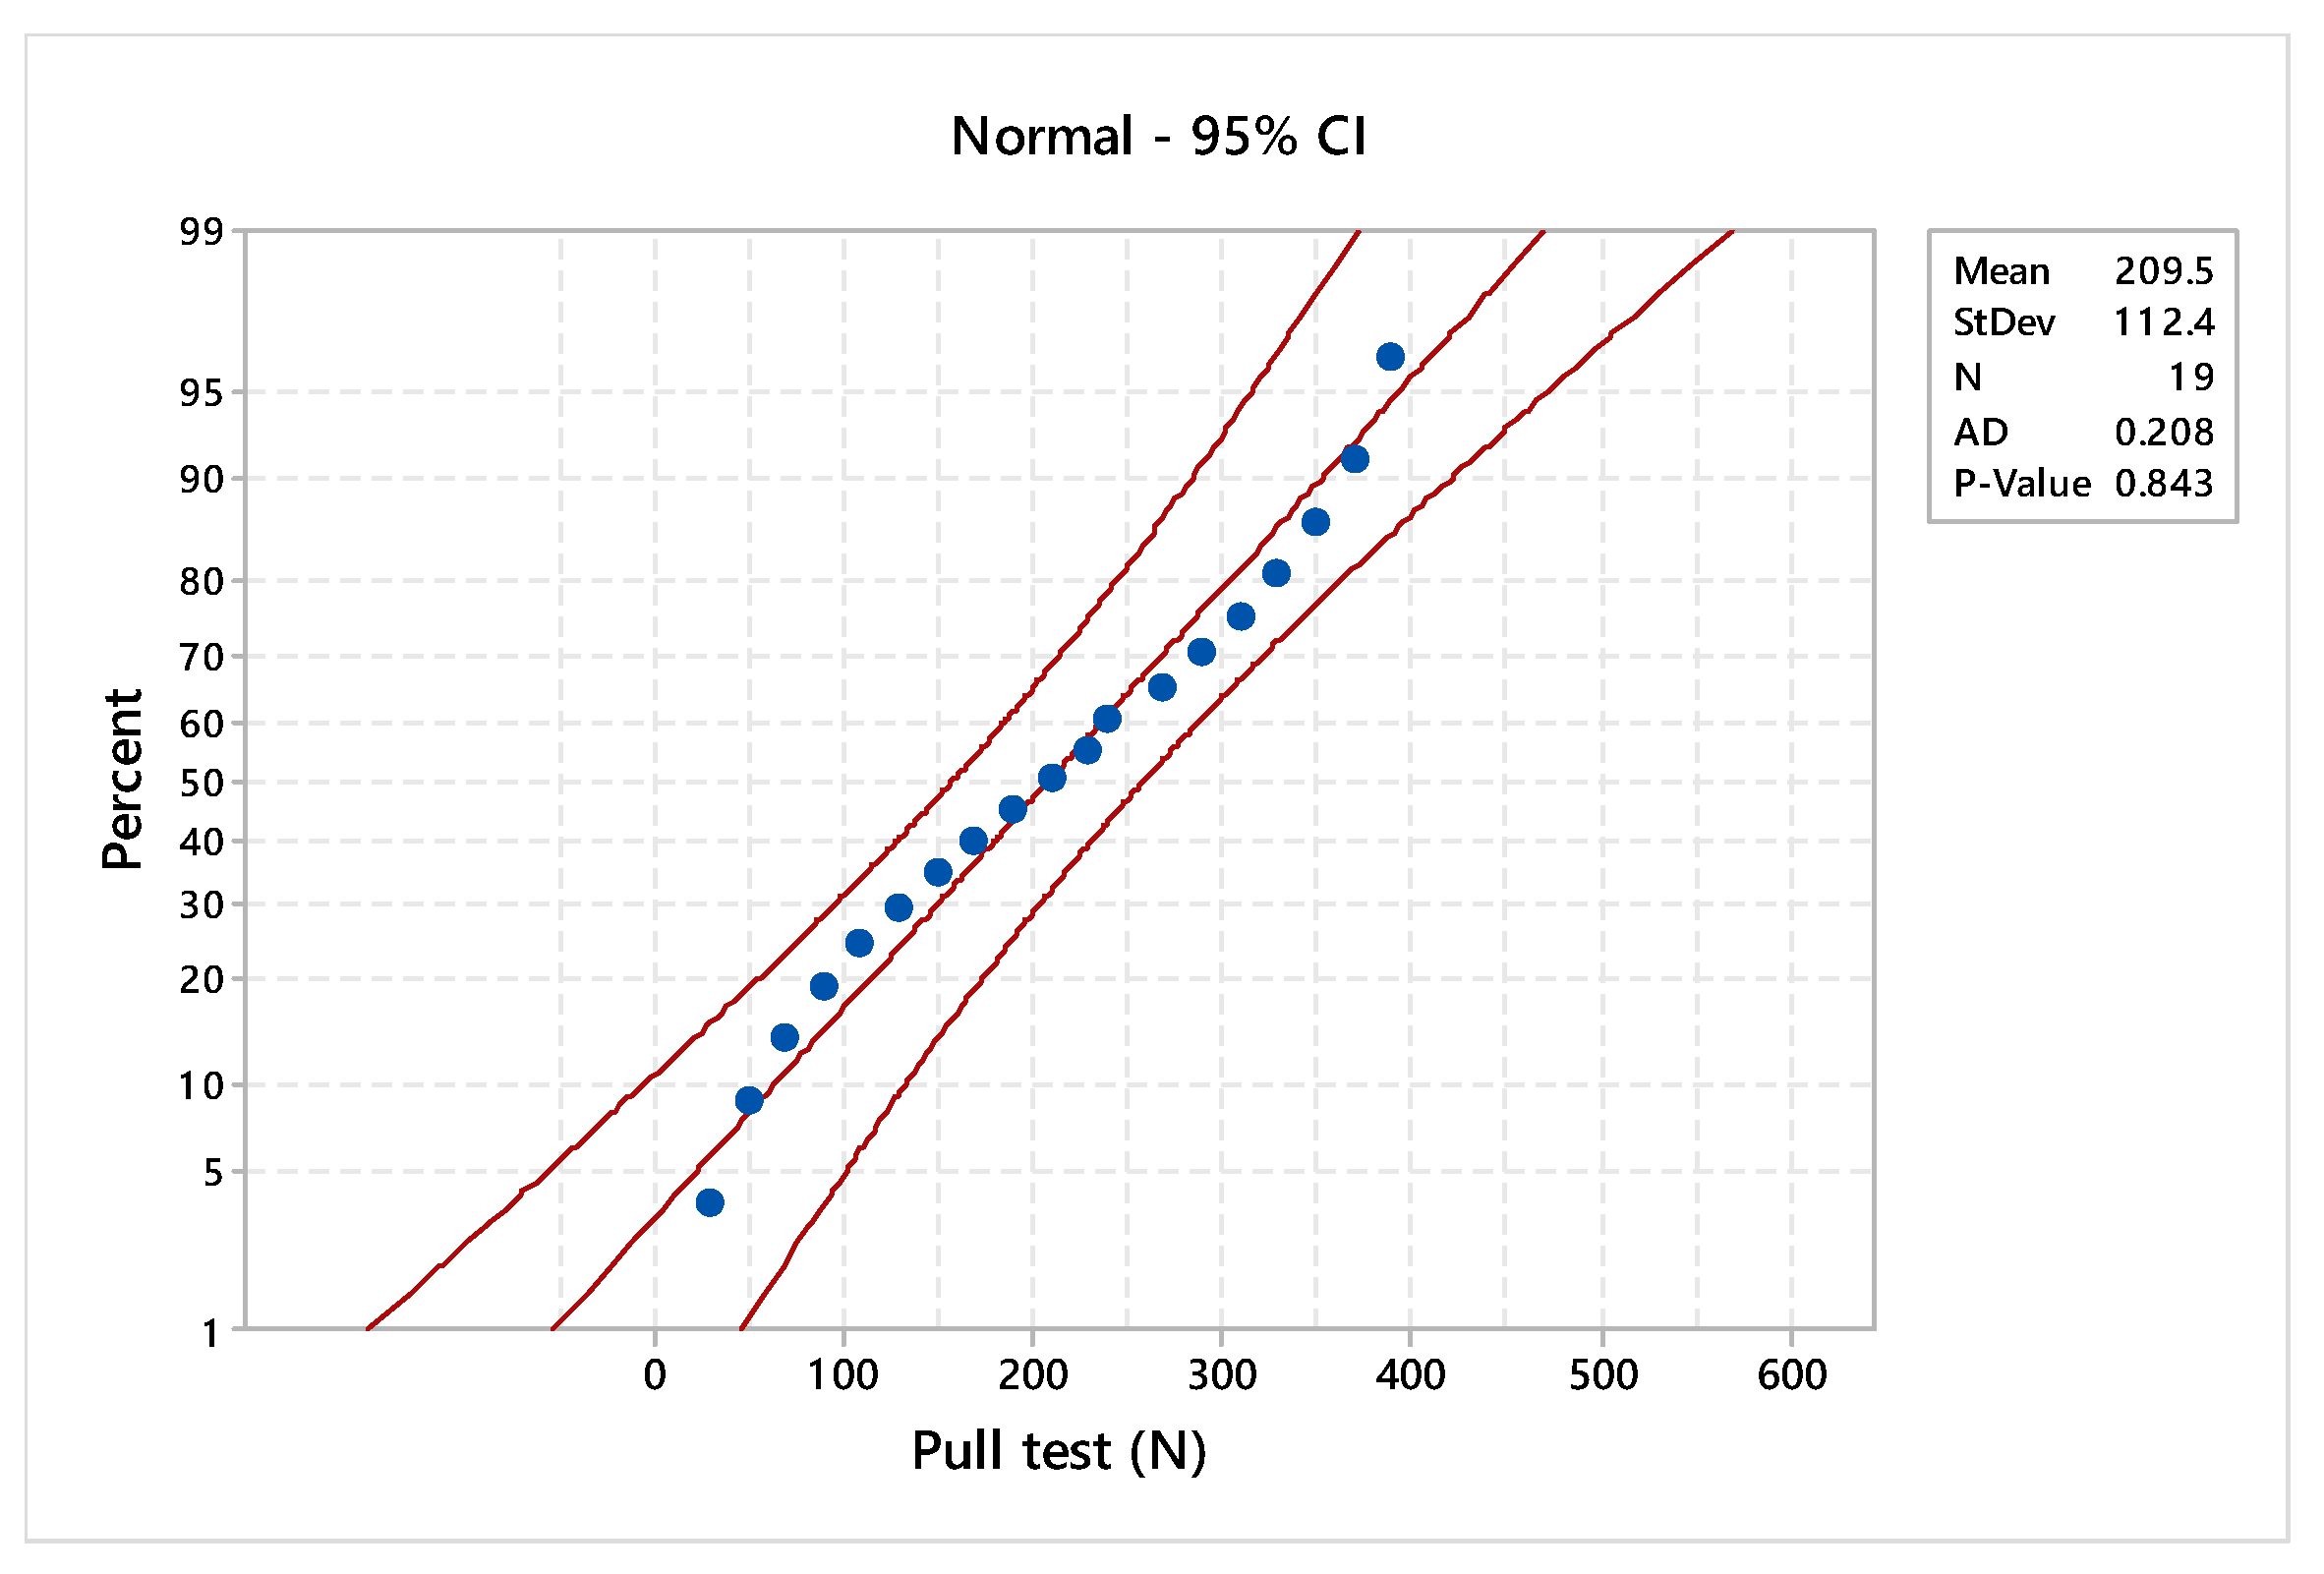
3.1. Goodness-of-Fit Test of Experimental Data
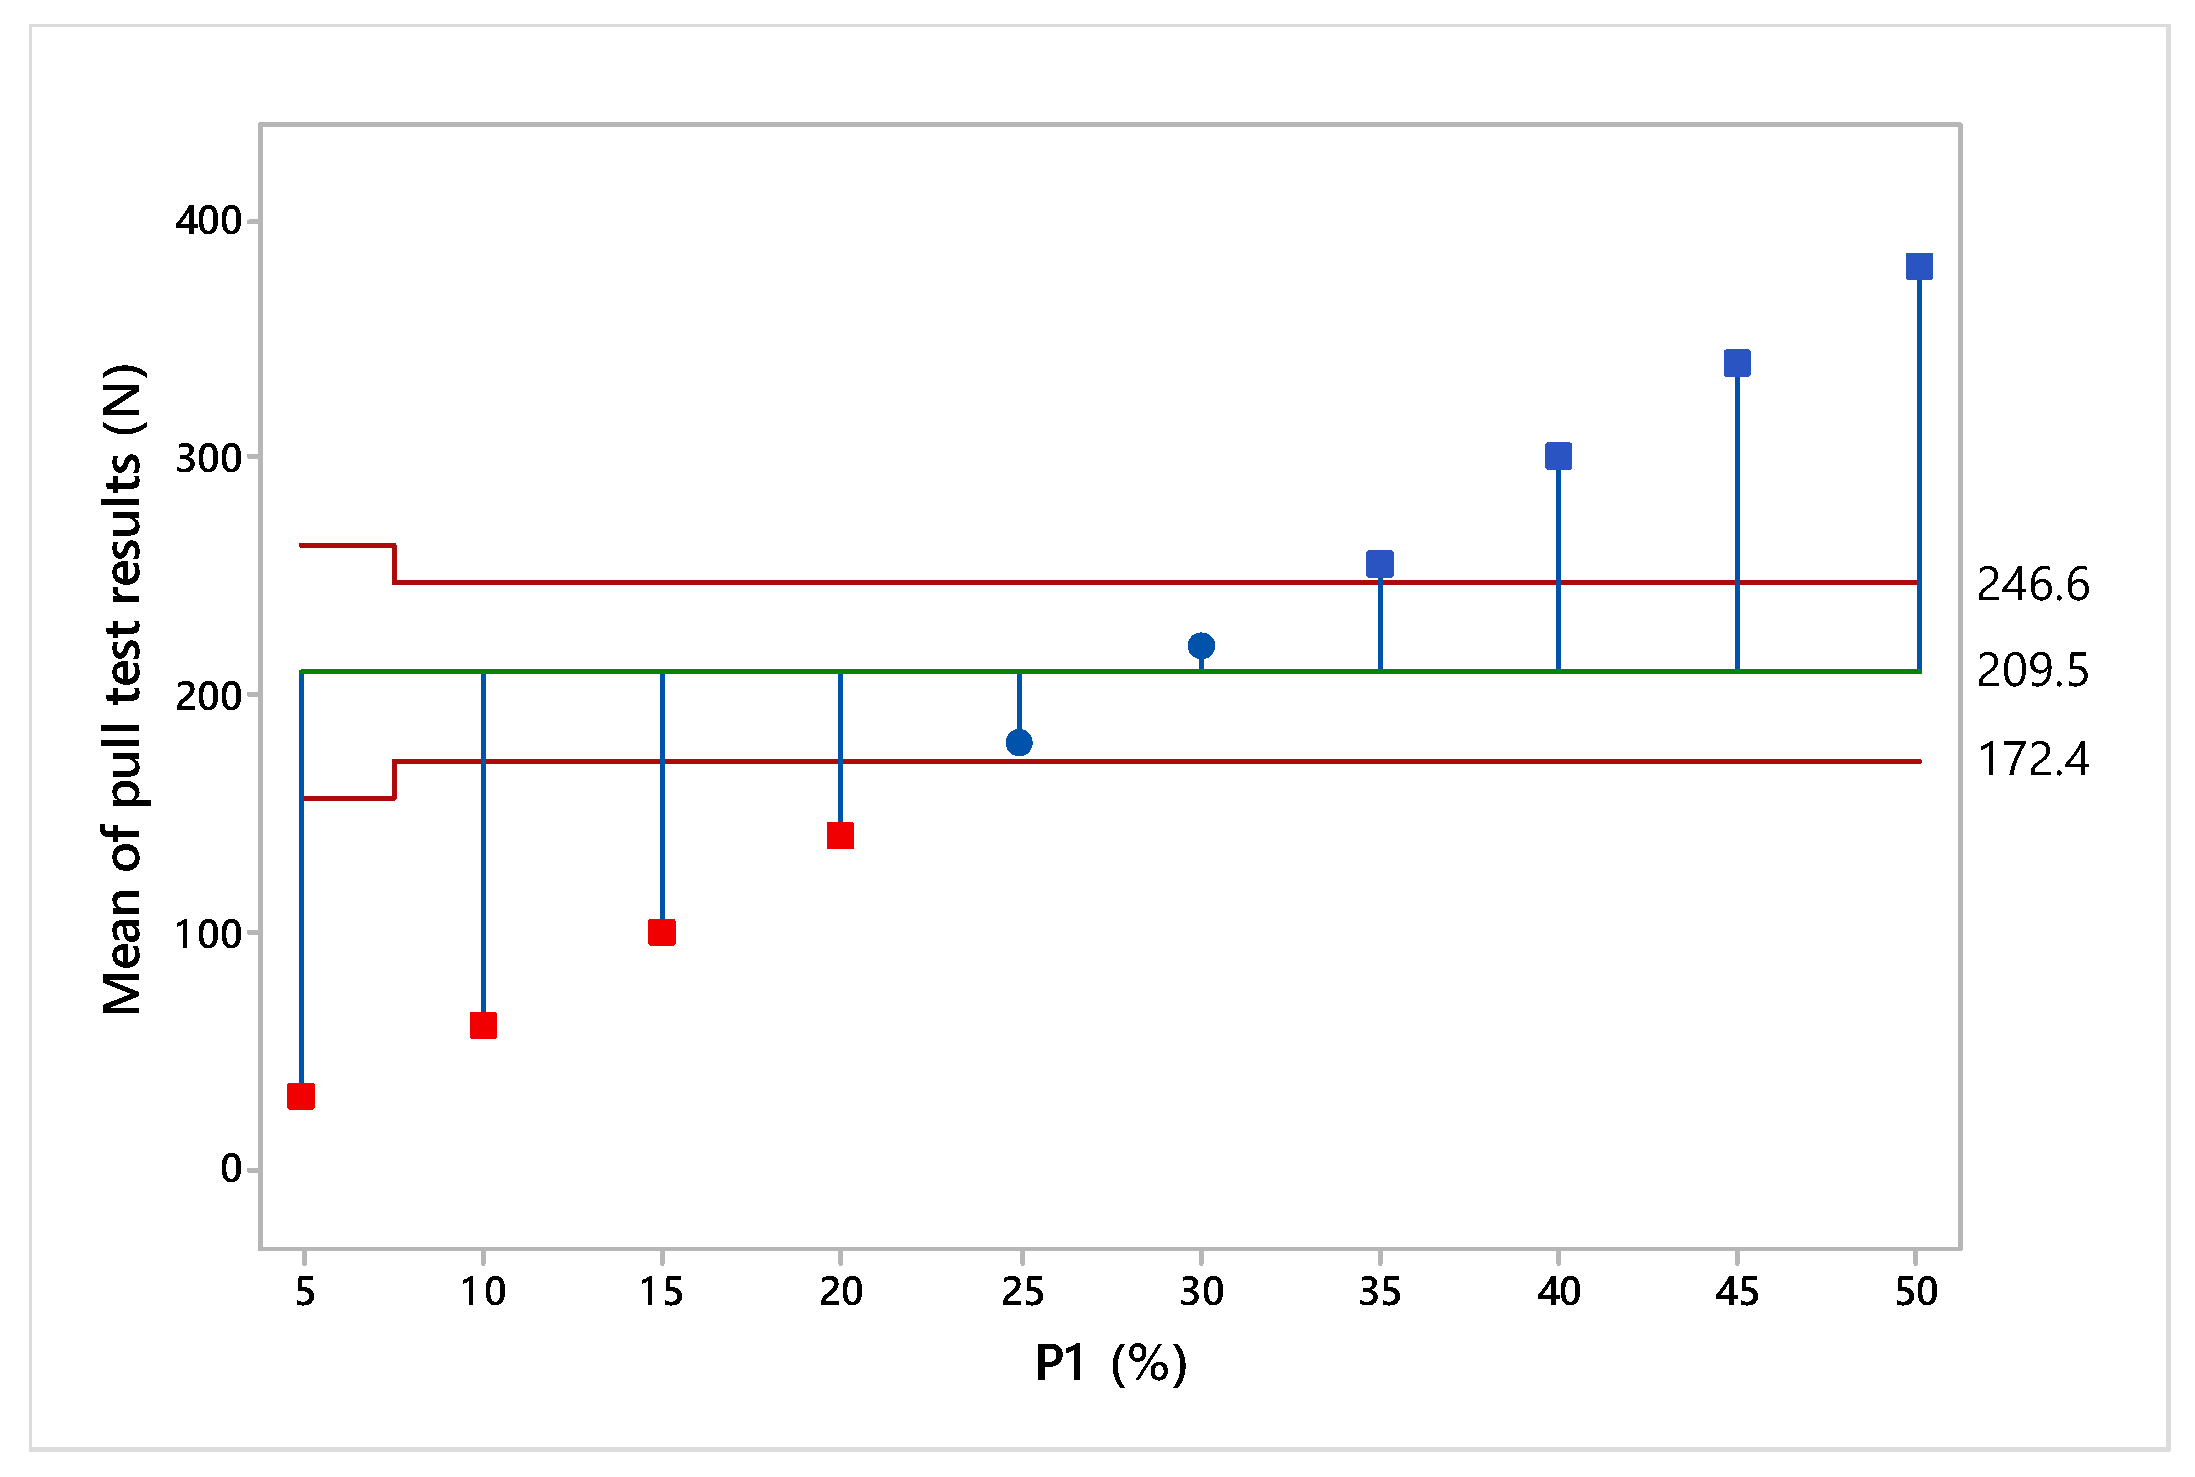
3.2. Analysis of the Main Factors in the Laser Micro-Perforation Process
4. Results and Discussion
4.1. Results and Summary
4.2. Proposed Measures and Next Steps
4.3. Detailed Analysis
4.4. Proposed Enhancements
4.5. Discussion
5. Conclusions
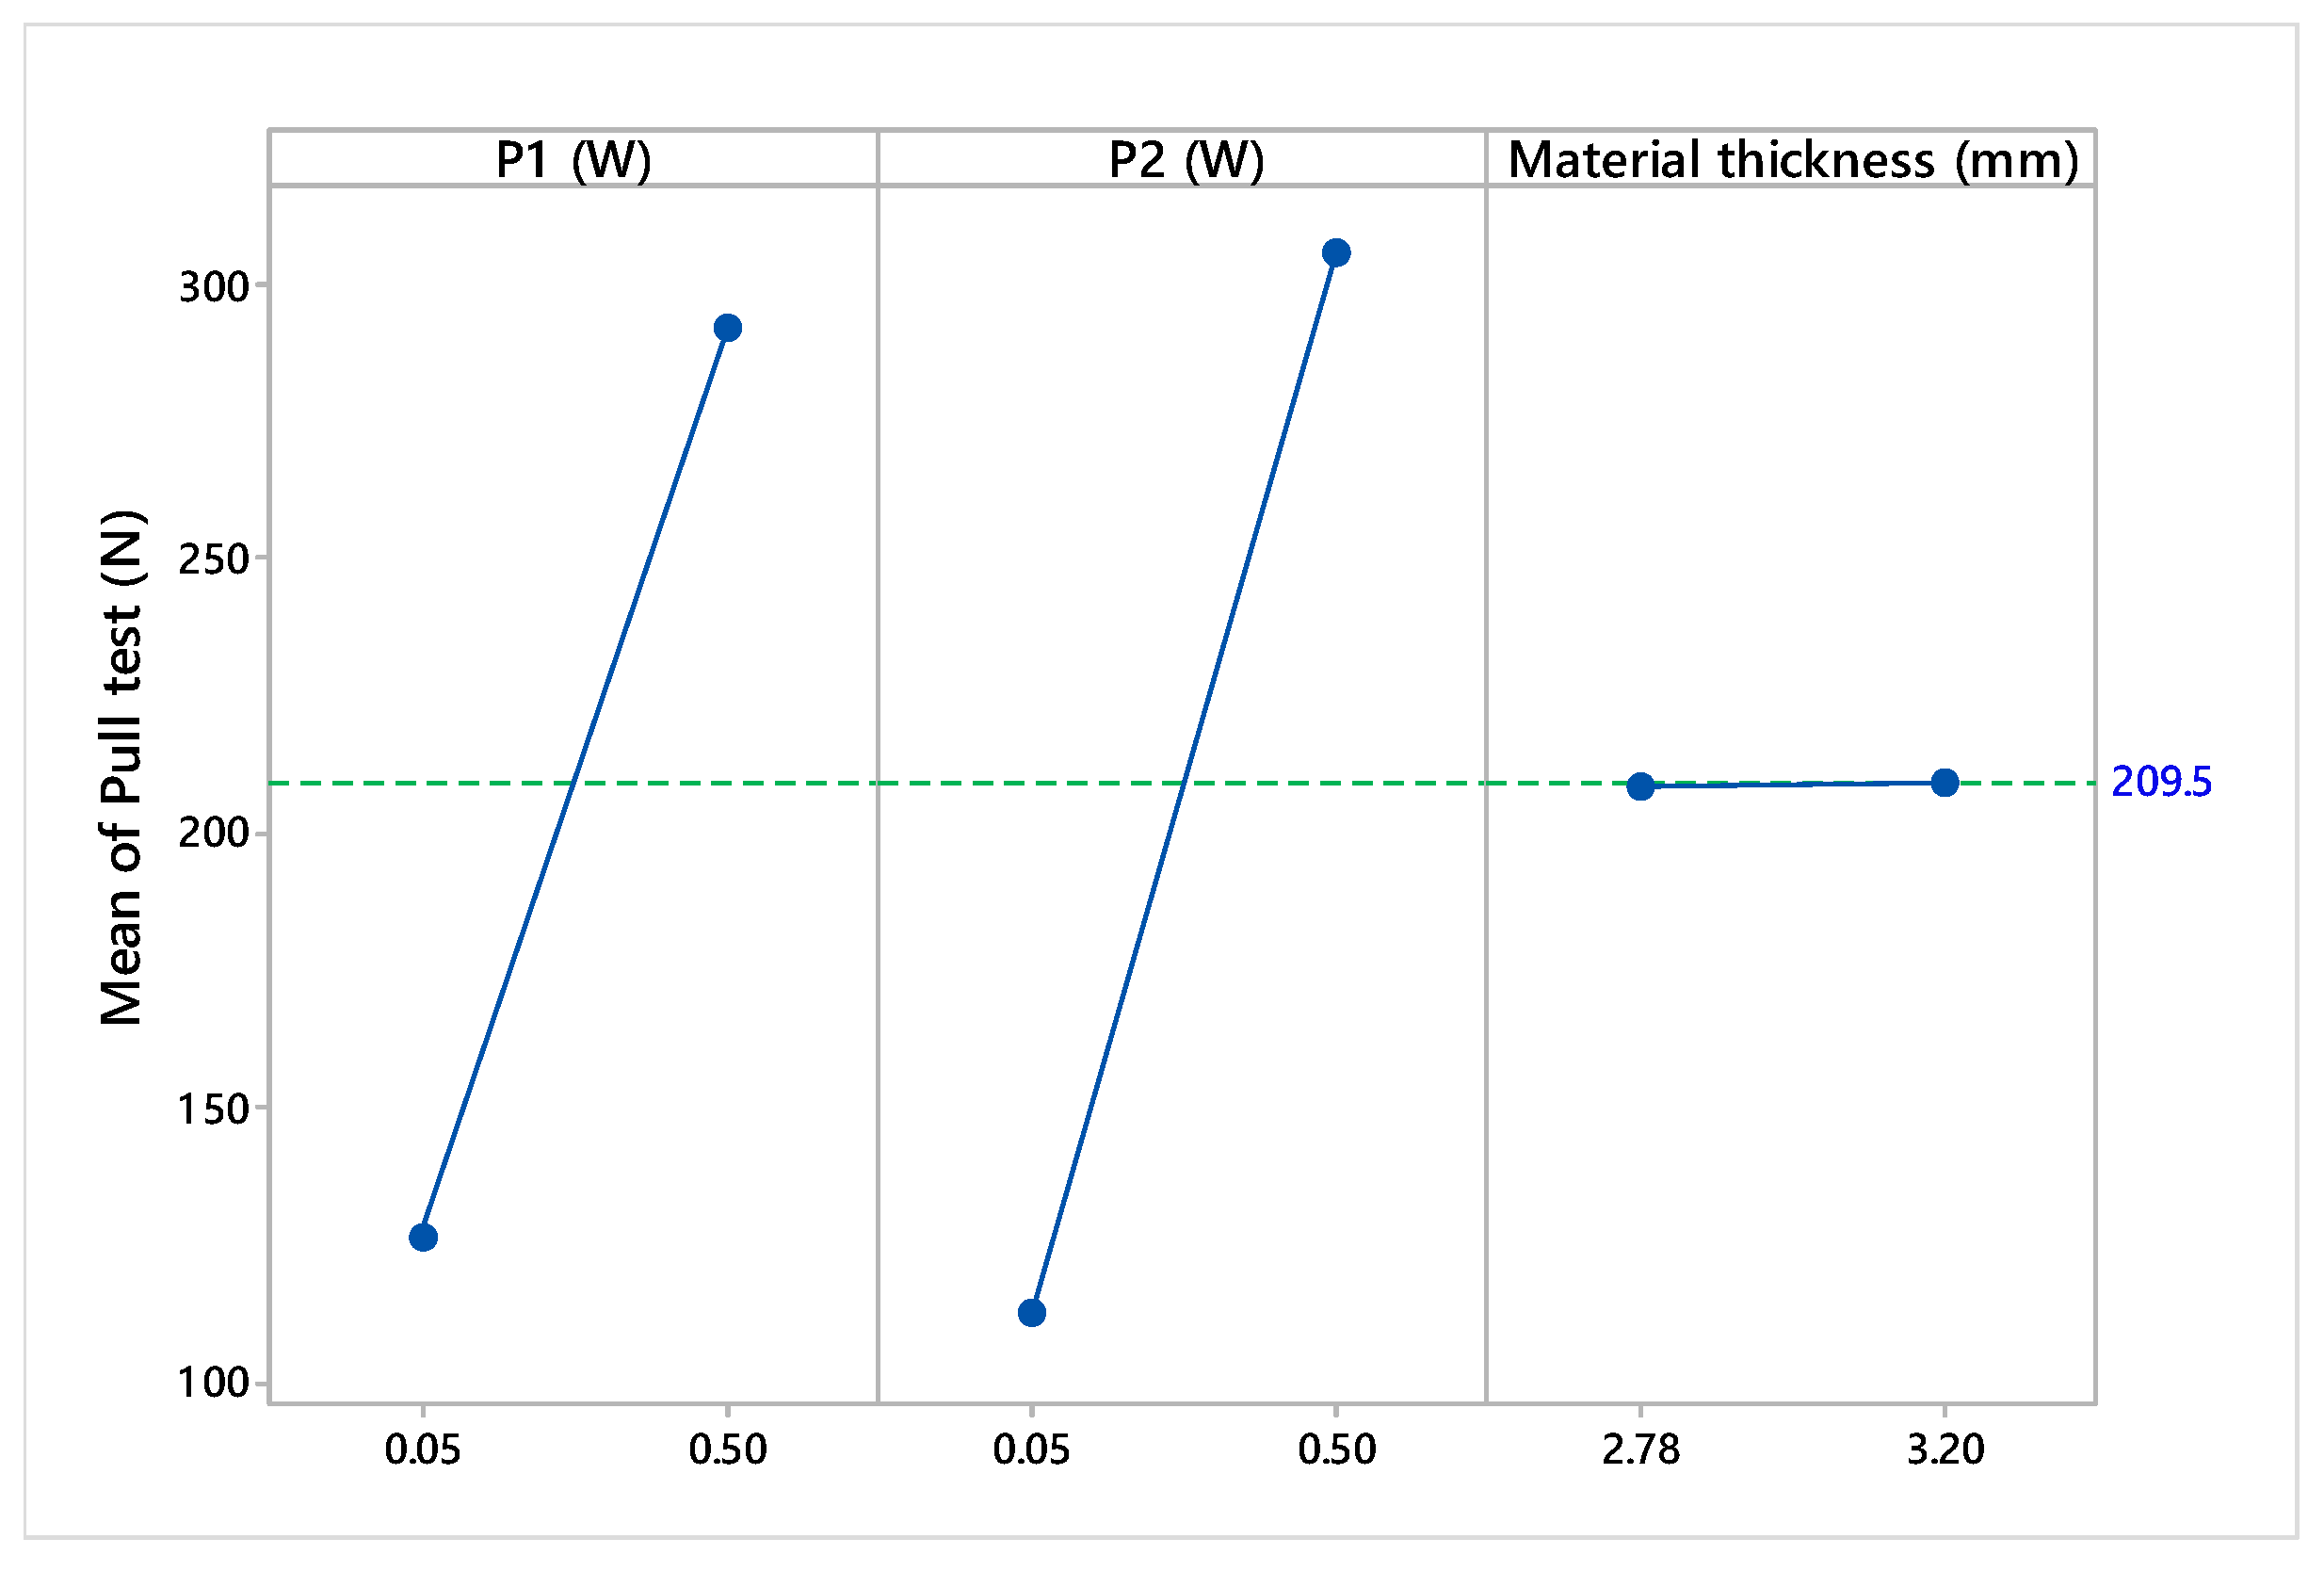
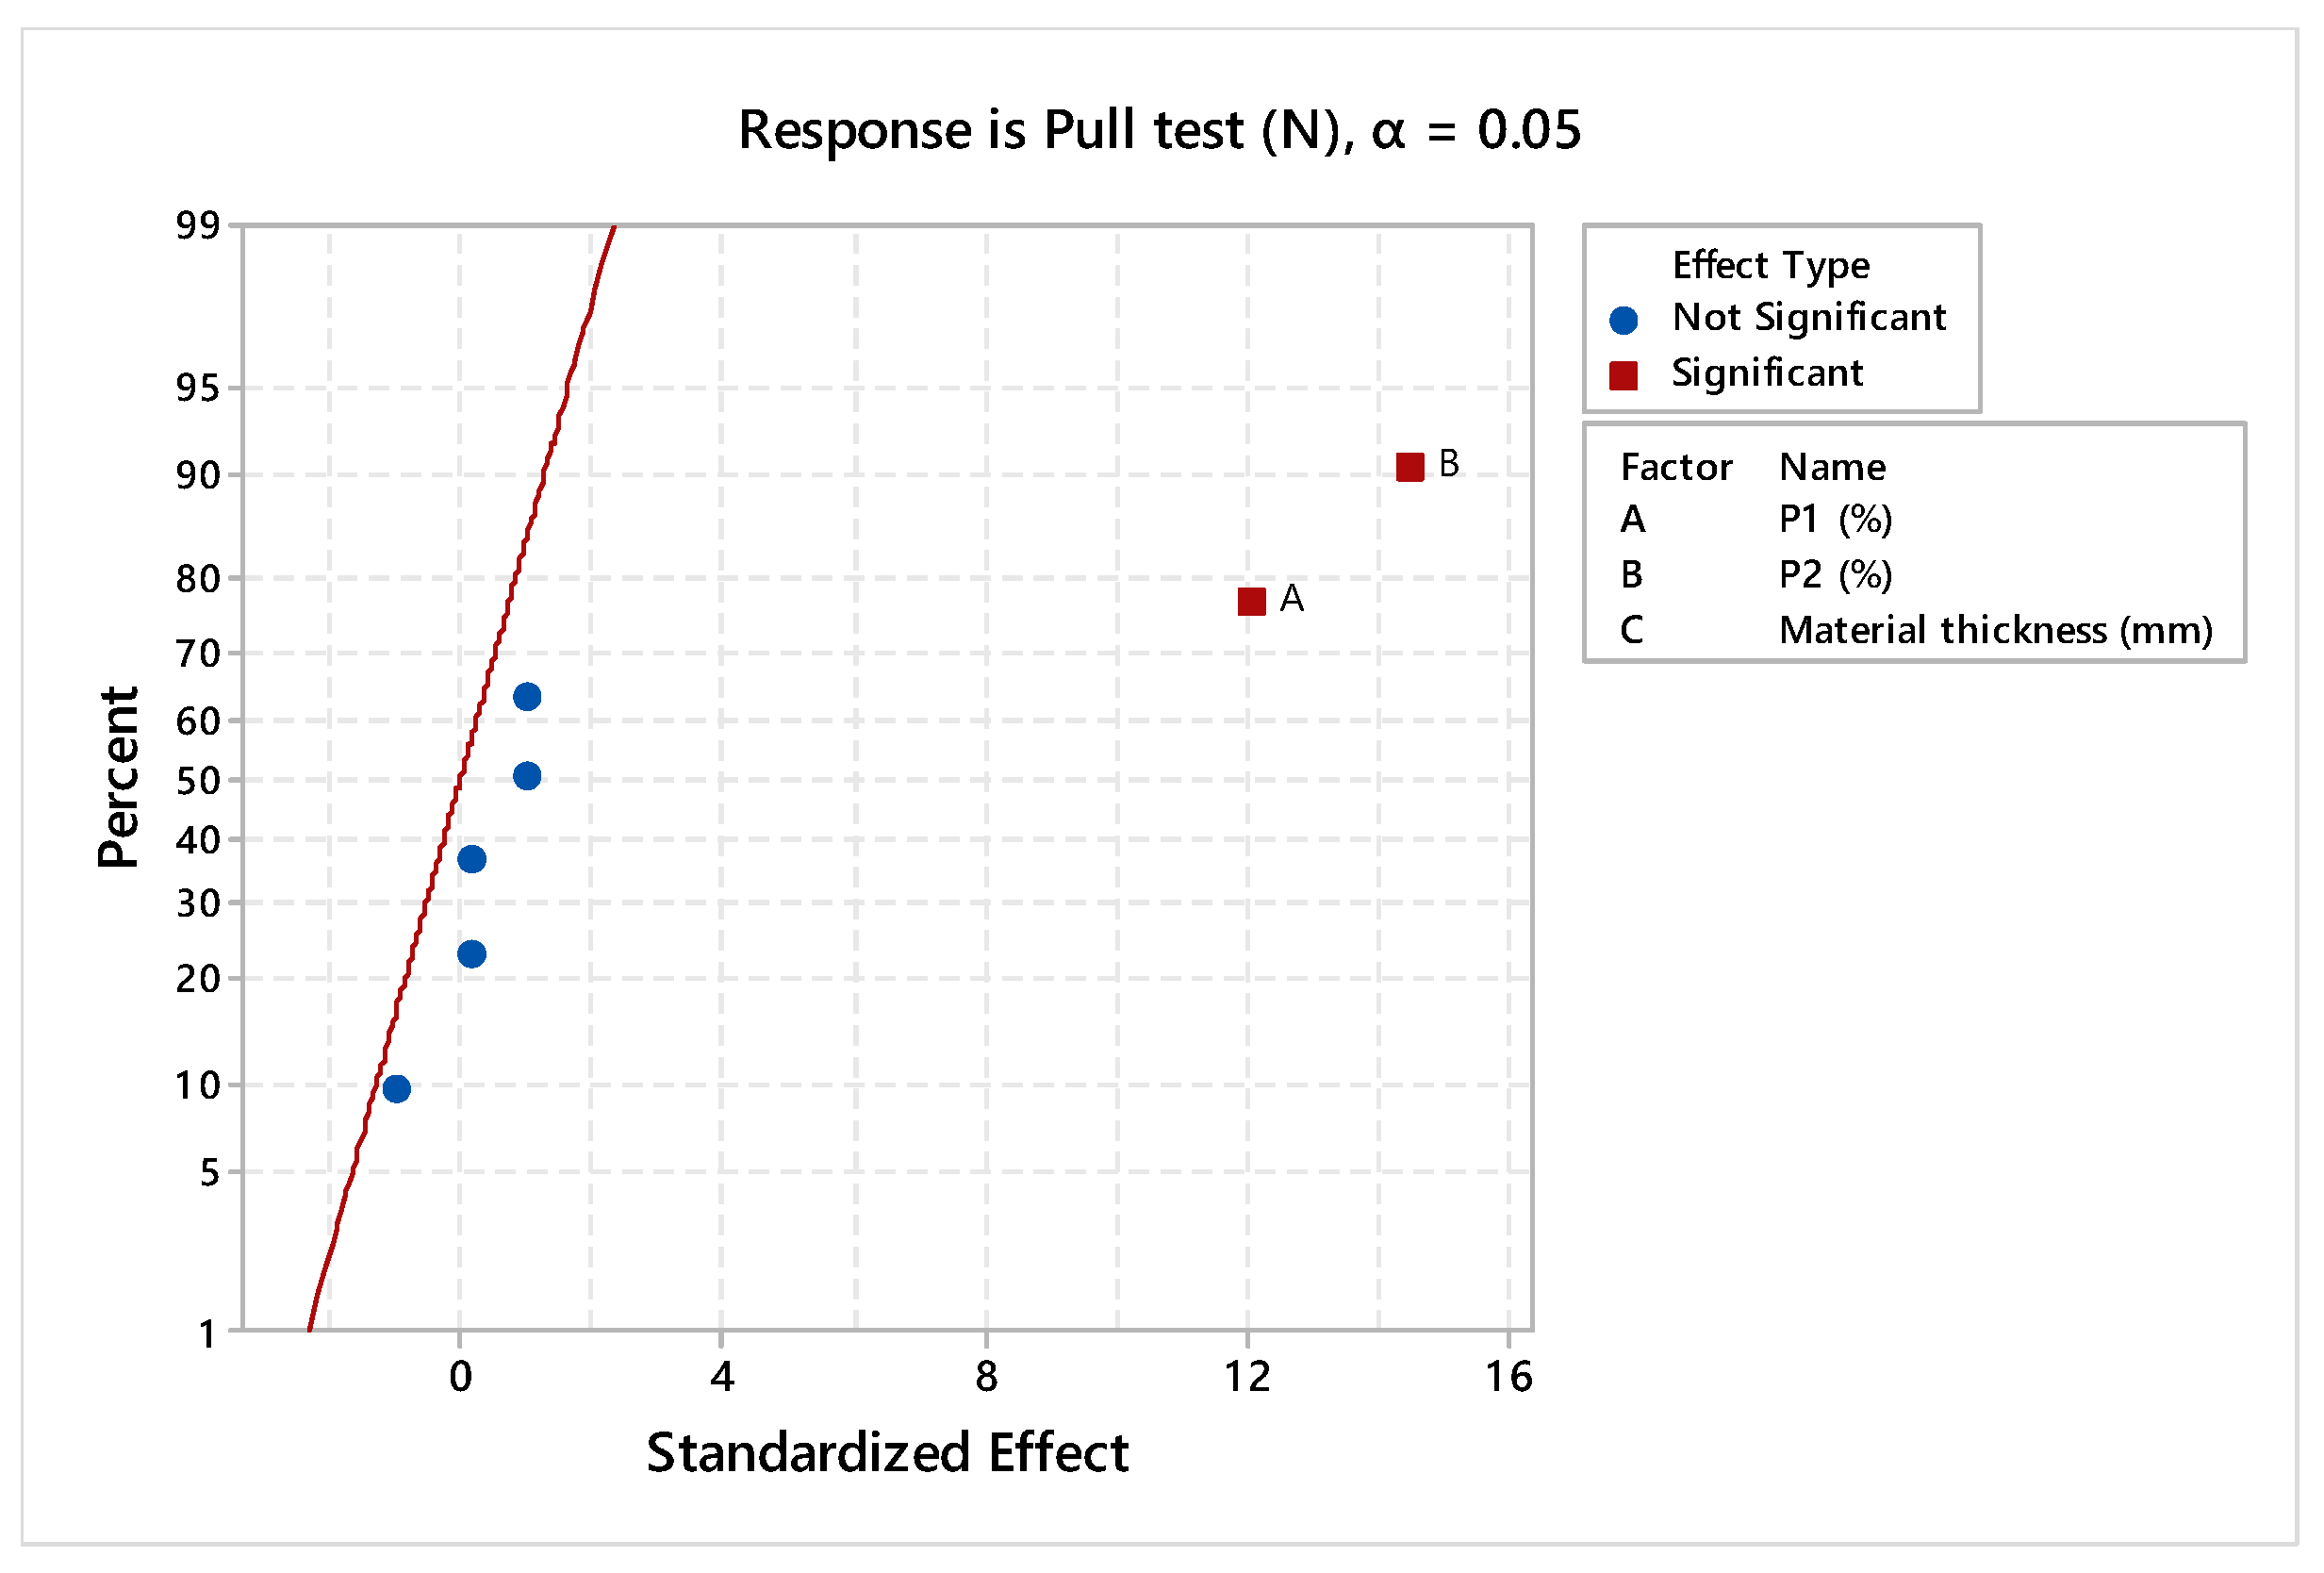
- The overall conclusion of the presented study is that the level of the laser power has a significant influence on the micro-perforation process.
- The analysis of the micro-perforation factors provides significant evidence for an interaction. The effect of one laser power factor depends upon the level of the other laser power. Moreover, the statistically significant difference is highlighted by the design of experiments analysis and main effects plots.
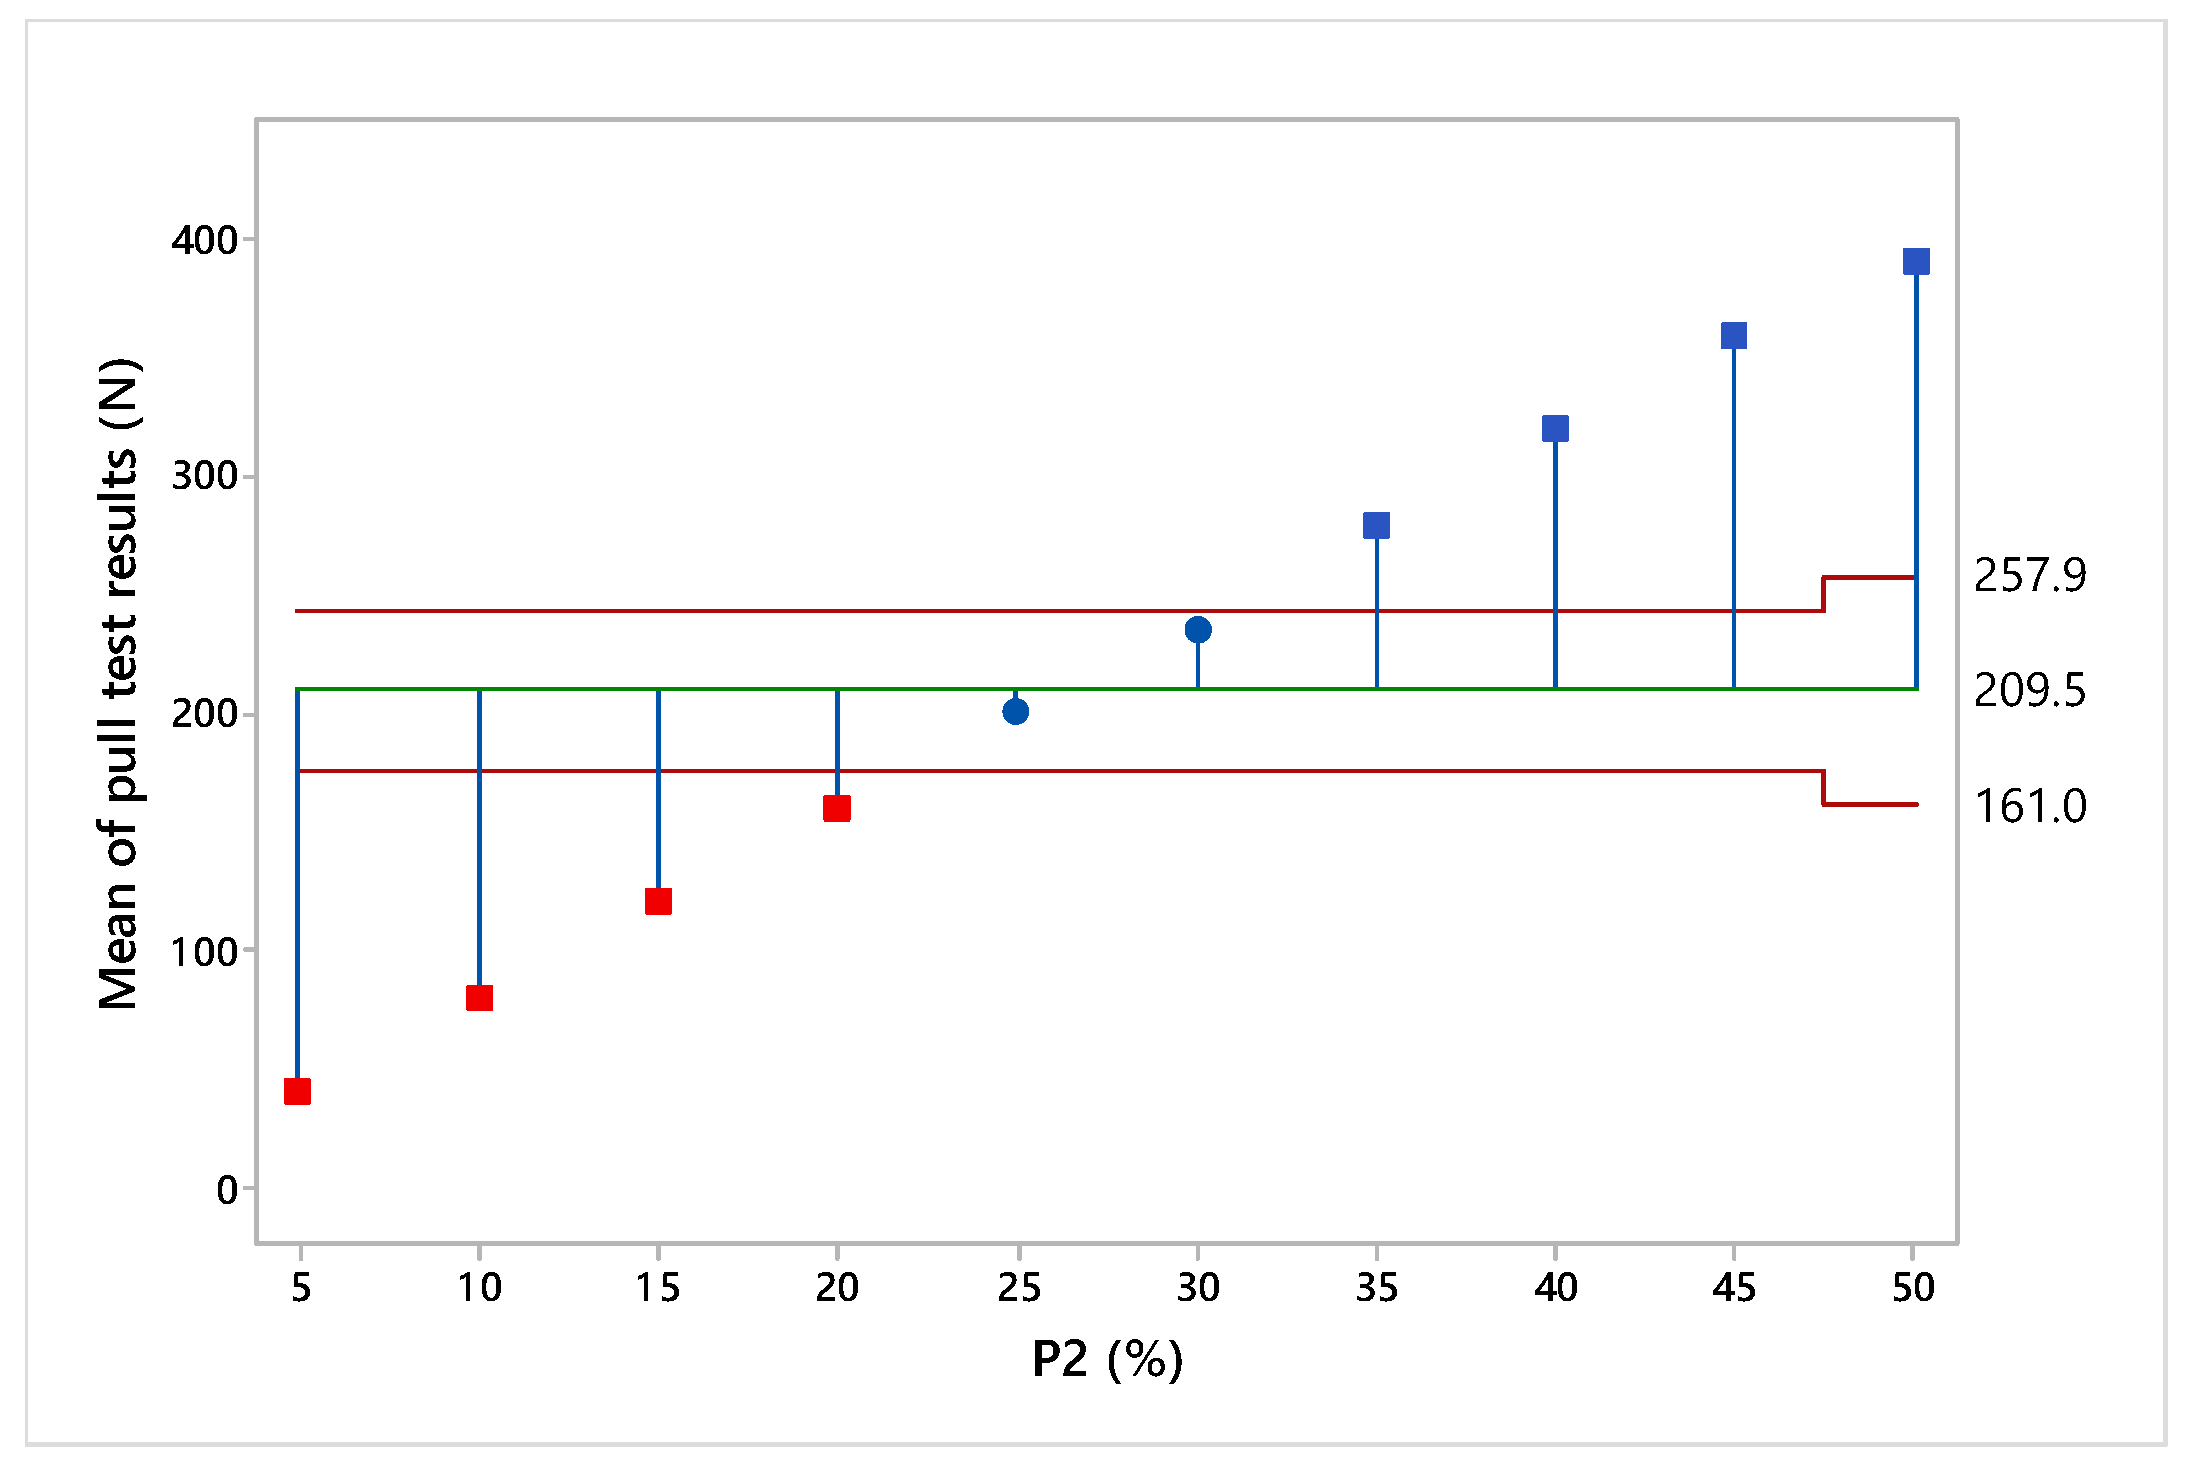
- The laser micro-perforation process is optimal for a percentage of at least 25% of the laser power, with upper limits above 25% beneficial for both process stability and the material’s resistance to the pull test. The analyzed parameters for the laser process, including the power (W) and material rupture resistance (N), are of paramount importance due to their critical characteristics (CC), significantly influencing the efficiency and quality of the process.
- The analyses of the experimental results provide valuable insights into the factors influencing the airbag cutout laser processing outcomes. The inappropriate use of LHD parameters for RHD components significantly contributed to process variability, resulting in nonconforming outcomes during pull testing. The correlations between the processing parameters and product quality underscore the importance of parameter optimization for consistent outcomes. To address this, standardized parameter sets tailored to specific component configurations are recommended, alongside enhanced quality control protocols including real-time monitoring. Future research may explore advanced laser processing techniques, like adaptive process control and machine learning algorithms, to optimize the efficiency and quality.
Author Contributions
Funding
Data Availability Statement
Acknowledgments
Conflicts of Interest
References
- Kannatey-Asibu, E. Principles and Laser Materials Processing. Developments and Applications, 2nd ed.; John Wiley & Sons, Inc.: Hoboken, NJ, USA, 2023. [Google Scholar]
- Anming, H. Laser Micro-Nano-Manufacturing and 3D Microprinting; Springer Series in Materials Science; Springer Nature Switzerland AG: Cham, Switzerland, 2020; Volume 309. [Google Scholar]
- Caristan, C.L. Laser Cutting Guide for Manufacturing; Society of Manufacturing Engineering: Dearborn, MI, USA, 2004. [Google Scholar]
- Fischer, F.; Romoli, L.; Kling, R. Laser-based repair of carbon fiber reinforced plastics. CIRP Ann. Manuf. Technol. 2010, 59, 203–206. [Google Scholar] [CrossRef]
- Hypsh, S. Femtosecond laser processing overcomes barriers for use in medical device manufacturing. Adv. Mater. Process. 2014, 172, 26–29. [Google Scholar] [CrossRef]
- Huang, H.; Yang, L.-M.; Liu, J. Micro-hole drilling and cutting using femtosecond fiber laser. Opt. Eng. 2014, 53, 051513. [Google Scholar] [CrossRef]
- Feng, G.; Li, G.; Wang, Z. Xiao Micro-hole Arrays and Net-like Structure Fabrication via Femtosecond Laser Pulses. In Laser Micro-Nano-Manufacturing and 3D Microprinting; Hu, A., Ed.; Springer Series in Materials Science; Springer Nature Switzerland AG: Cham, Switzerland, 2020; Volume 309, pp. 211–246. [Google Scholar]
- Freitag, C.; Wiedenmann, M.; Negel, J.P.; Loescher, A.; Onuseit, V.; Weber, R.; Ahmed, M.A.; Graf, T. High-quality processing of CFRP with a 1.1-kW picosecond laser. Appl. Phys. A 2015, 119, 1237–1243. [Google Scholar] [CrossRef]
- Onuseit, V.; Freitag, C.; Wiedenmann, M.; Weber, T.; Negel, J.P.; Löscher, A.; Ahmed, A.; Graf, T. Efficient processing of CFRP with a picosecond laser with up to 1.4 kW average power. In Laser Applications in Microelectronic and Optoelectronic Manufacturing (LAMOM) XX; SPIE: Bellingham, WA, USA, 2015; Volume 9350, pp. 107–113. [Google Scholar]
- Weber, R.; Freitag, C.; Kononenko, T.V.; Hafner, M.; Onuseit, V.; Berger, P.; Graf, T. Short-pulse laser processing of CFRP. Phys. Procedia 2012, 39, 137–146. [Google Scholar] [CrossRef]
- Lu, M.; Zhang, M.; Zhang, K.; Meng, Q.; Zhang, X. Femtosecond UV Laser Ablation Characteristics of Polymers Used as the Matrix of Astronautic Composite Material. Materials 2022, 15, 6771. [Google Scholar] [CrossRef]
- Shehryar Khan, M.; Shahabad, S.I.; Yavuz, M.; Duley, W.W.; Biro, E.; Zhou, Y. Numerical modelling and experimental validation of the effect of laser beam defocusing on process optimization during fiber laser welding of automotive press-hardened steels. J. Manuf. Process 2021, 67, 535–544. [Google Scholar] [CrossRef]
- Zhang, Y.Q.; Li, Z.; Yan, H.T. Damage characterization of carbon fiber/epoxy composite under laser irradiation and tangential flow. High Power Laser Part. Beams 2015, 27, 071014. [Google Scholar]
- Riveiro, A.; Quintero, F.; Lusquiños, F.; Val, J.; Comesaña, R.; Boutinguiza, M.; Pou, J. Laser cutting of carbon fiber composite materials. Procedia Manuf. 2017, 13, 388–395. [Google Scholar] [CrossRef]
- Yuki, H.; Sakai, K.; Shizuka, H. The effect of fiber laser machining parameters on thermal-affected zone of carbon fiber reinforced plastic. In Advanced Materials Research; Trans Tech Publications Ltd.: Bäch, Switzerland, 2016; Volume 1136, pp. 377–383. [Google Scholar]
- Wang, J.X.; Wu, Y.W.; Zhang, G.Y.; Chao, Y.; Zhang, W.W. Experimental Research of CFRP Cutting by Using Water Jet Guided Laser Processing. China Mech. Eng. 2021, 32, 1608–1616. [Google Scholar]
- Zhang, C.; Yuan, G.F.; Cong, Q.D.; Guo, B.C. Study of the water jet assisted laser cutting carbon fiber reinforced plastic (CFRP) composites. Laser J. 2018, 39, 68–71. [Google Scholar]
- Gibra Isaac, N. Probability and Statistical Inference for Scientists and Engineers, 1st ed.; Prentice-Hall: Hoboken, NJ, USA, 1973. [Google Scholar]
- Taeger, D.; Kuhnt, S. Statistical Hypothesis Testing with SAS and R; John Wiley & Sons: Hoboken, NJ, USA, 2014. [Google Scholar] [CrossRef]
- NIST/SEMATECH. e-Handbook of Statistical Methods. Available online: https://www.itl.nist.gov/div898/handbook/ (accessed on 27 April 2024).
- Mason, R.L.; Gunst, R.F.; Balding, D.J. Statistical Design and Analysis of Experiments with Applications to Engineering Science; John Wiley & Sons: Hoboken, NJ, USA, 2003. [Google Scholar]
- Montgomery, D.C.; Runger, G.C. Applied Statistics Probability Engineers, 5th ed.; John Wiley & Sons: Hoboken, NJ, USA, 2011. [Google Scholar]


| Characteristic | AD | A-Squared | Correlation Coefficient | p-Value |
|---|---|---|---|---|
| Pull test (N) | 0.208 | 0.21 | 0.990 | 0.843 |
| Material thickness (mm) | 0.192 | 0.19 | 0.992 | 0.883 |
| Statistical Parameter | Pull Test (N) | Material Thickness (mm) |
|---|---|---|
| Mean | 209.5 | 3.003 |
| Standard Deviation | 112.4 | 0.107 |
| Minimum | 30 | 2.78 |
| 1st Quartile | 110 | 2.95 |
| Median | 210 | 2.99 |
| 3rd Quartile | 310 | 3.10 |
| Maximum | 390 | 3.20 |
| Skewness | 0.014 | −0.12 |
| Kurtosis | −1.185 | −0.27 |
Disclaimer/Publisher’s Note: The statements, opinions and data contained in all publications are solely those of the individual author(s) and contributor(s) and not of MDPI and/or the editor(s). MDPI and/or the editor(s) disclaim responsibility for any injury to people or property resulting from any ideas, methods, instructions or products referred to in the content. |
© 2024 by the authors. Licensee MDPI, Basel, Switzerland. This article is an open access article distributed under the terms and conditions of the Creative Commons Attribution (CC BY) license (https://creativecommons.org/licenses/by/4.0/).
Share and Cite
Rusu, A.-N.; Dumitrascu, D.-I.; Dumitrascu, A.-E. Monitoring, Control and Optimization of Laser Micro-Perforation Process for Automotive Synthetic Leather Parts. Processes 2024, 12, 1275. https://doi.org/10.3390/pr12061275
Rusu A-N, Dumitrascu D-I, Dumitrascu A-E. Monitoring, Control and Optimization of Laser Micro-Perforation Process for Automotive Synthetic Leather Parts. Processes. 2024; 12(6):1275. https://doi.org/10.3390/pr12061275
Chicago/Turabian StyleRusu, Alexandru-Nicolae, Dorin-Ion Dumitrascu, and Adela-Eliza Dumitrascu. 2024. "Monitoring, Control and Optimization of Laser Micro-Perforation Process for Automotive Synthetic Leather Parts" Processes 12, no. 6: 1275. https://doi.org/10.3390/pr12061275
APA StyleRusu, A.-N., Dumitrascu, D.-I., & Dumitrascu, A.-E. (2024). Monitoring, Control and Optimization of Laser Micro-Perforation Process for Automotive Synthetic Leather Parts. Processes, 12(6), 1275. https://doi.org/10.3390/pr12061275