
Simultaneous Life Cycle Assessment and Process Simulation for Sustainable Process Design


Abstract
:1. Introduction
2. Methodology
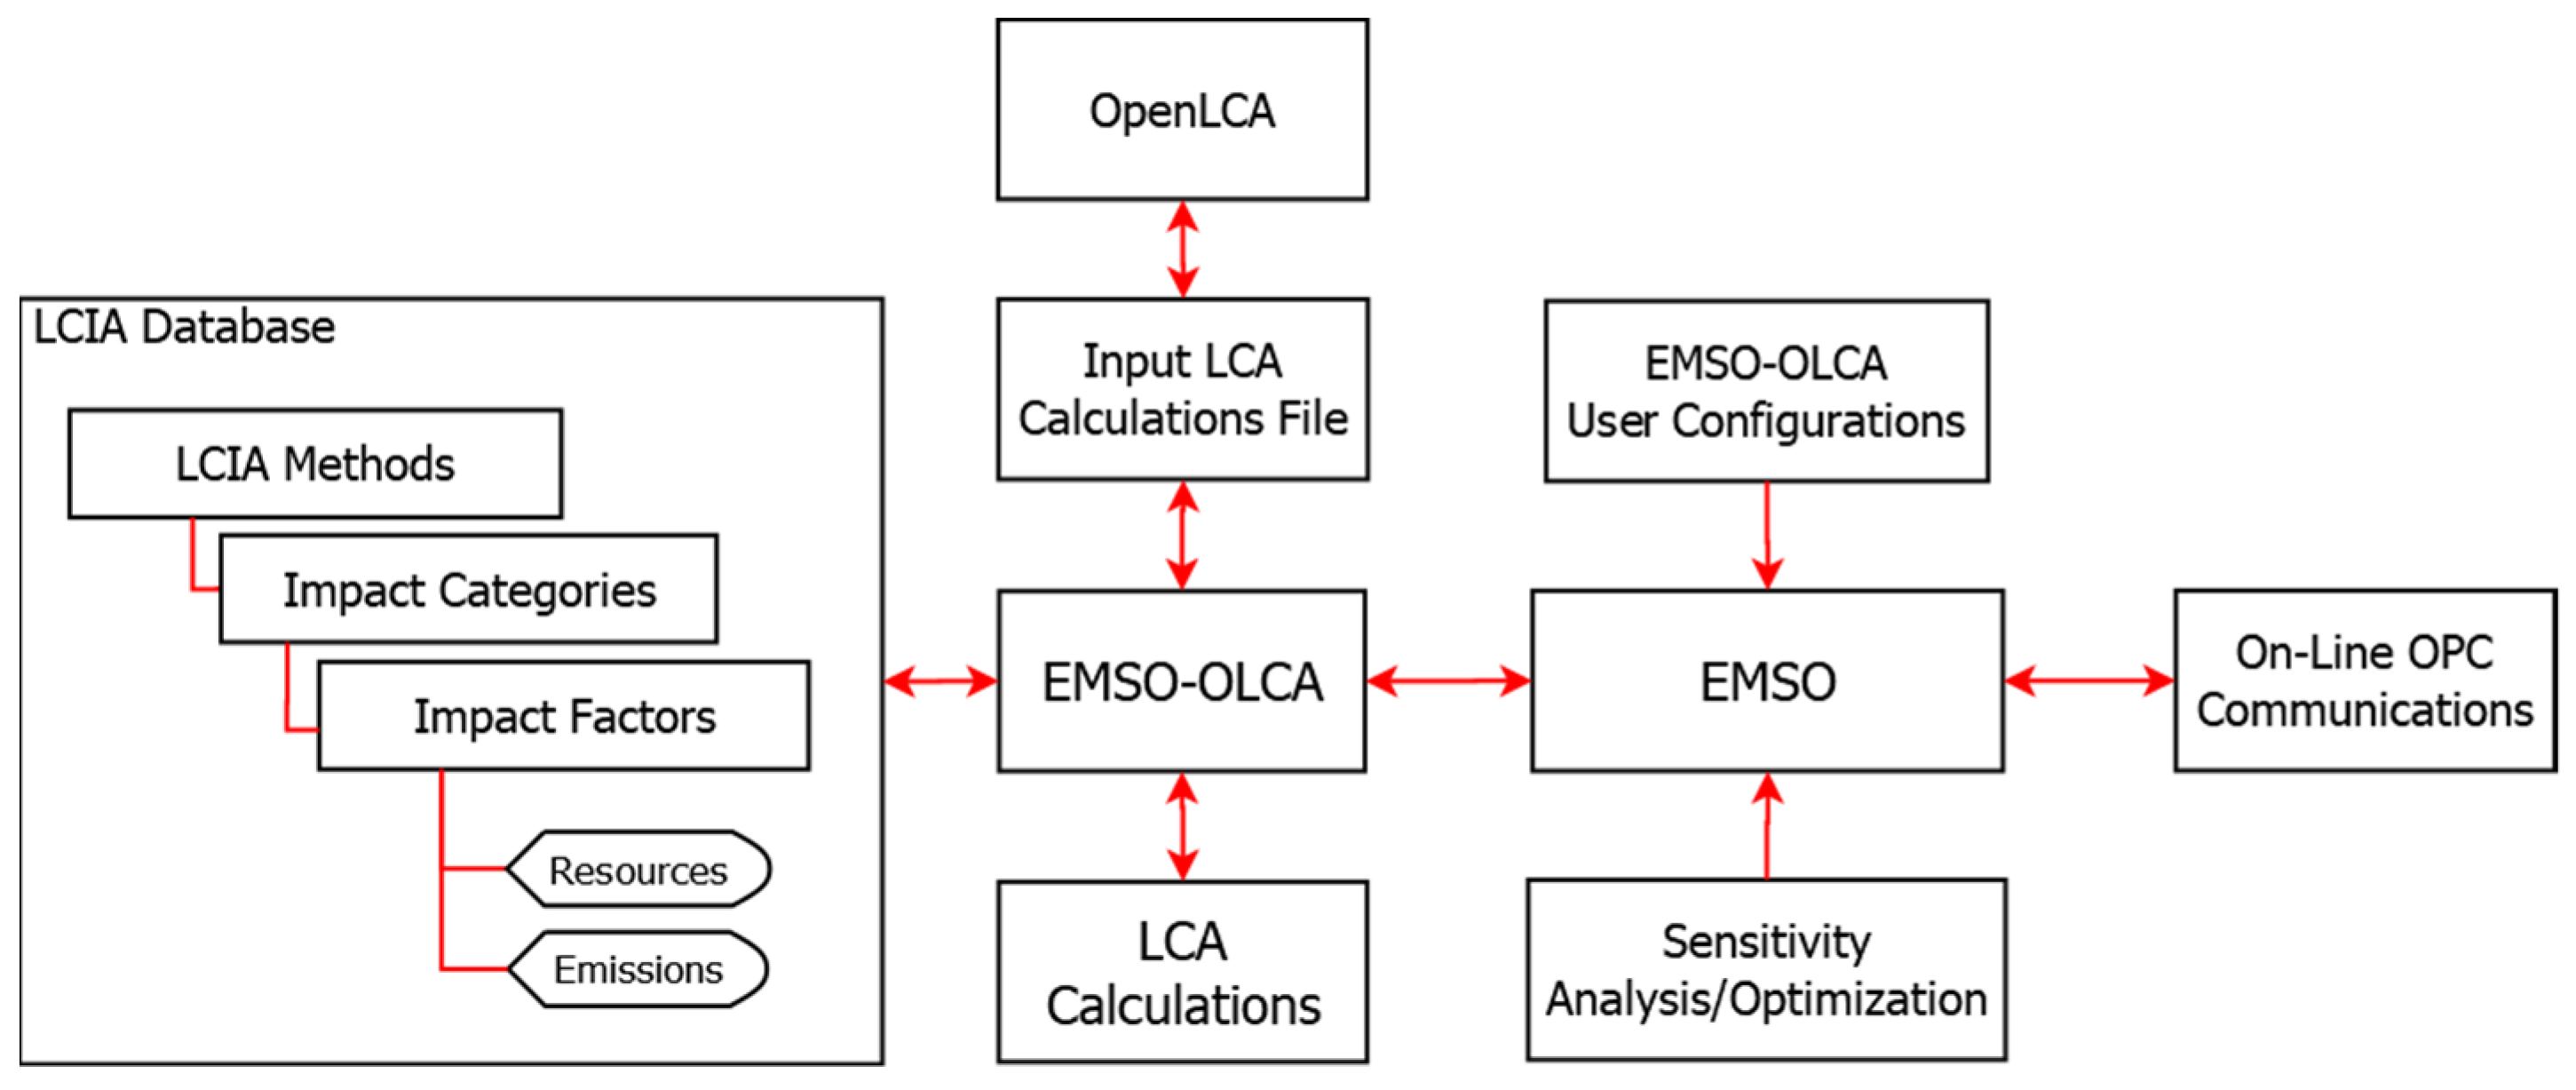
2.1. EMSO_OLCA
- Obtain the LCIA methods from the OpenLCA Nexus website. These files are proprietary to OpenLCA, but are available free of charge.
- Select and export the impacts of process inputs in OpenLCA 1.10.1 to a .csv file using the provided export functionality.
2.2. Validation and Process System Application Examples
2.2.1. Validation of EMSO_OLCA Compared to OpenLCA
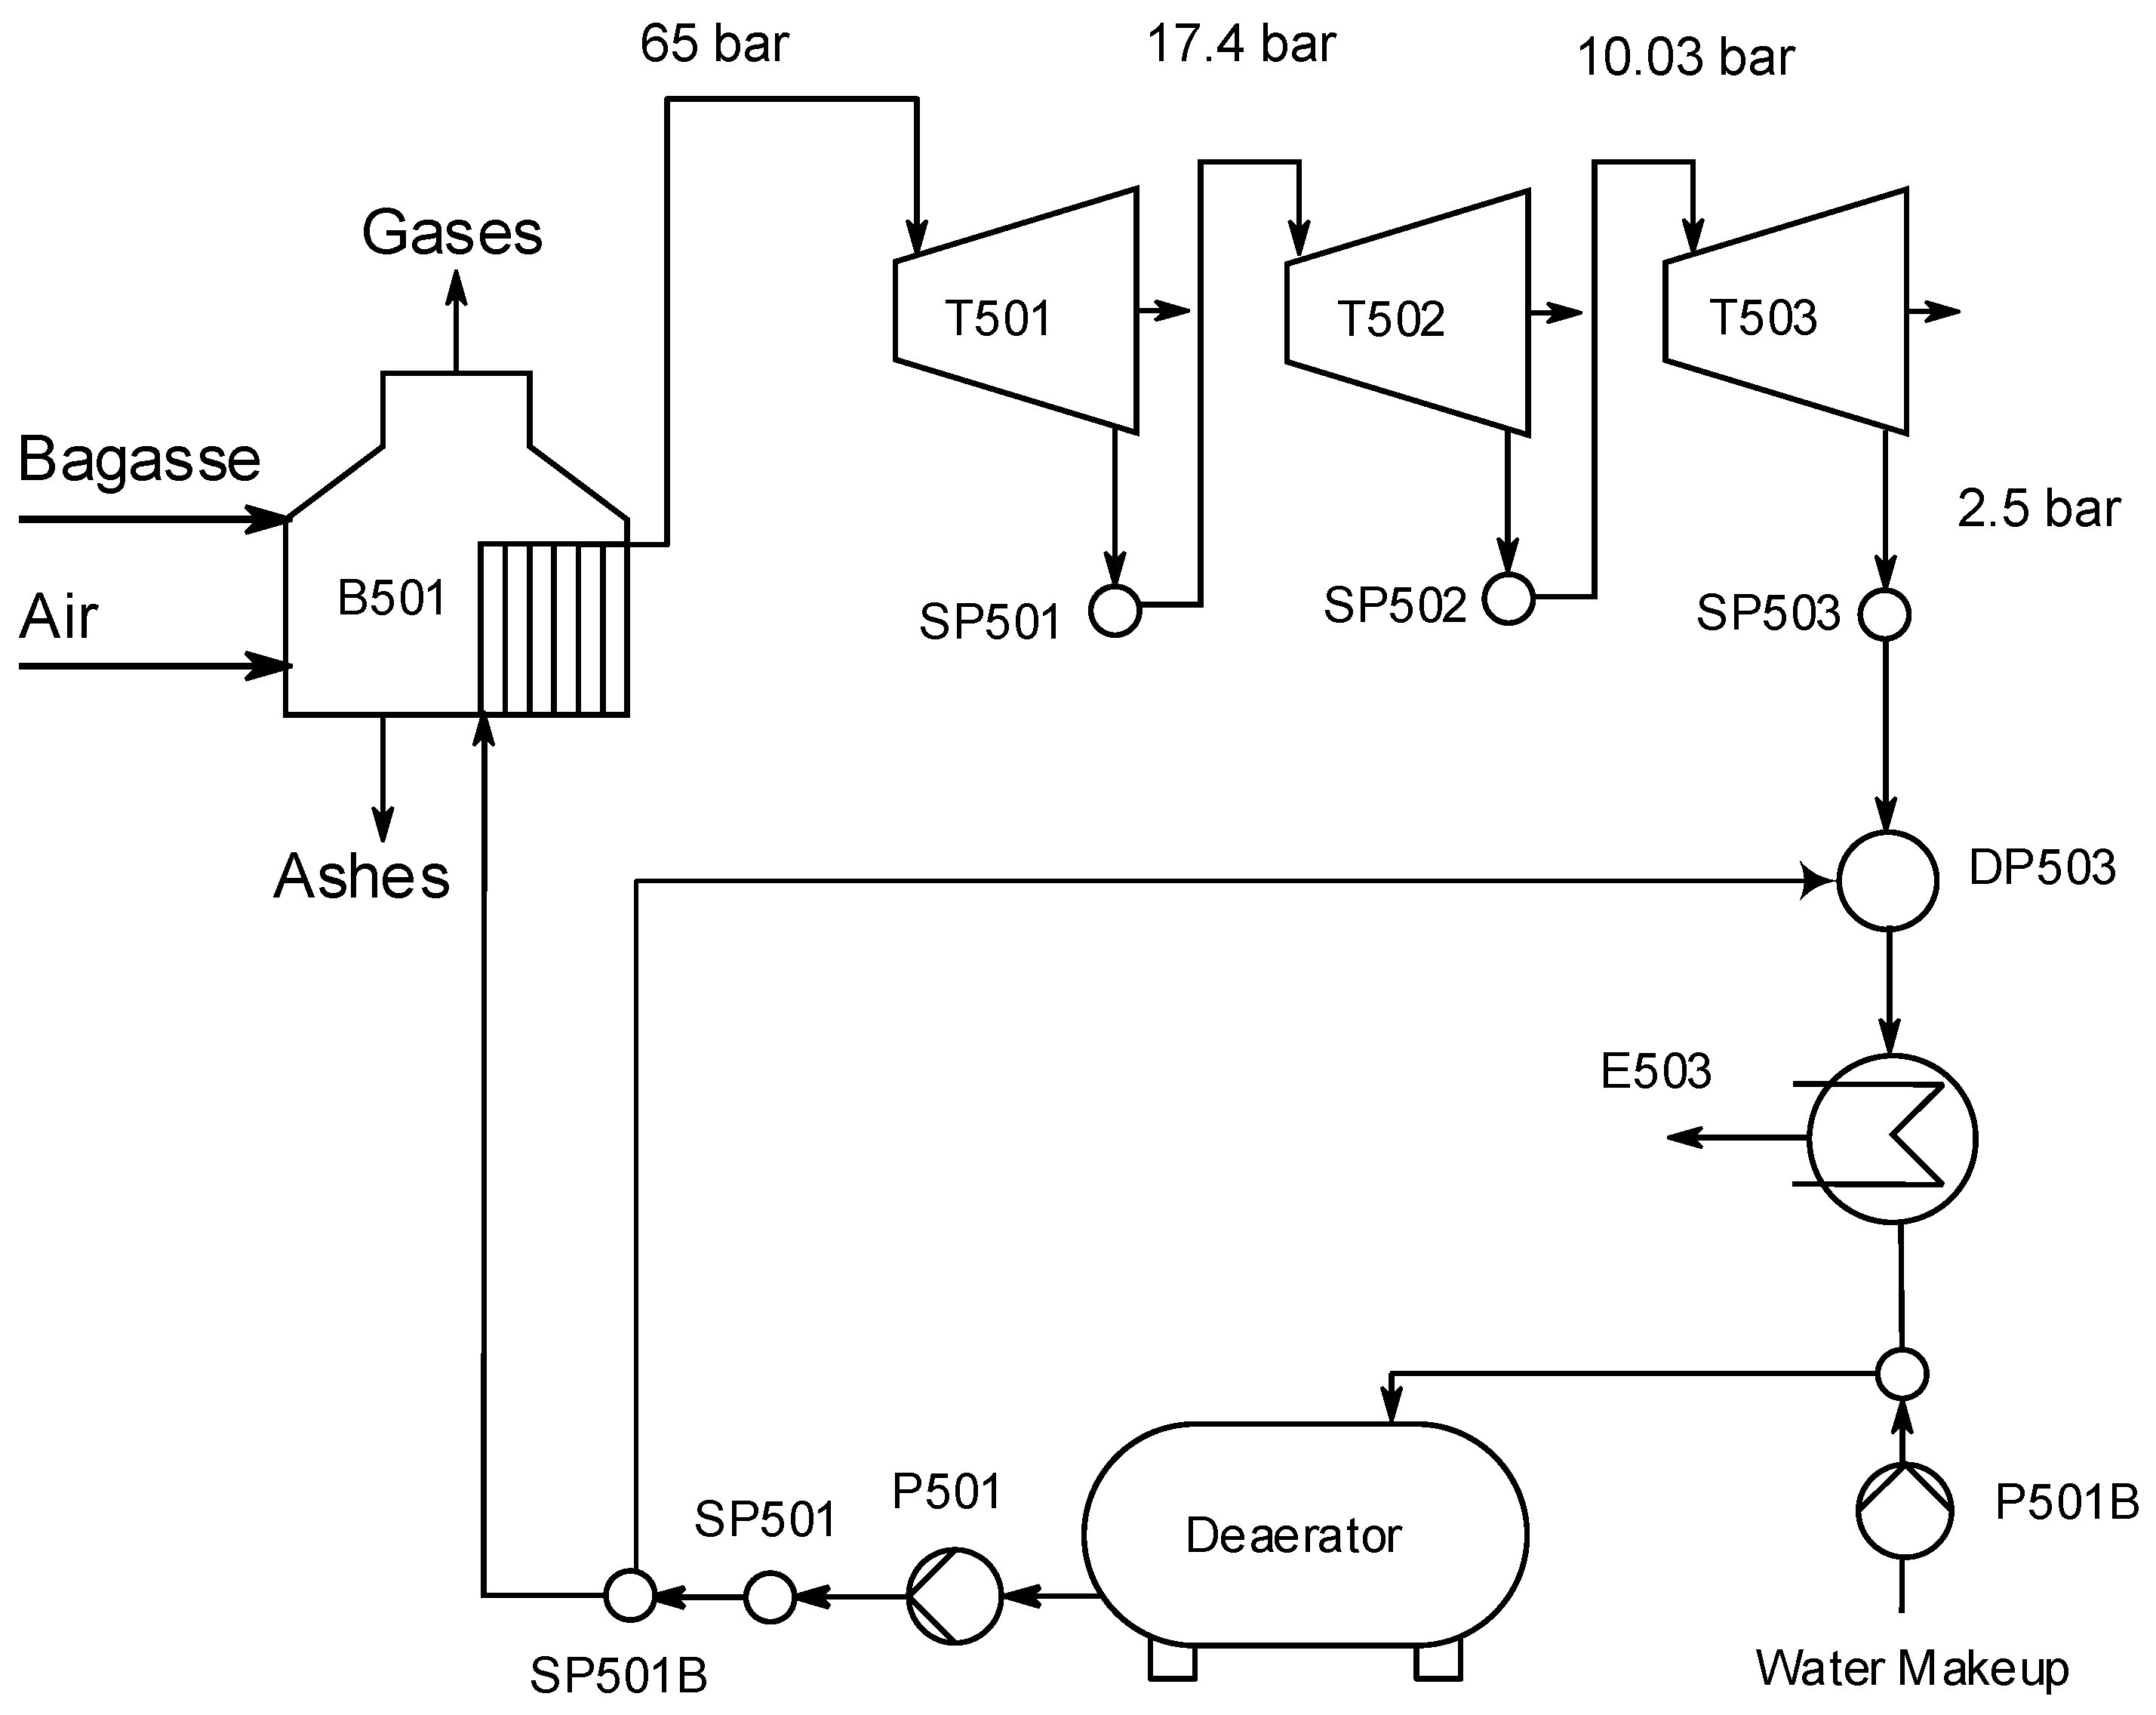
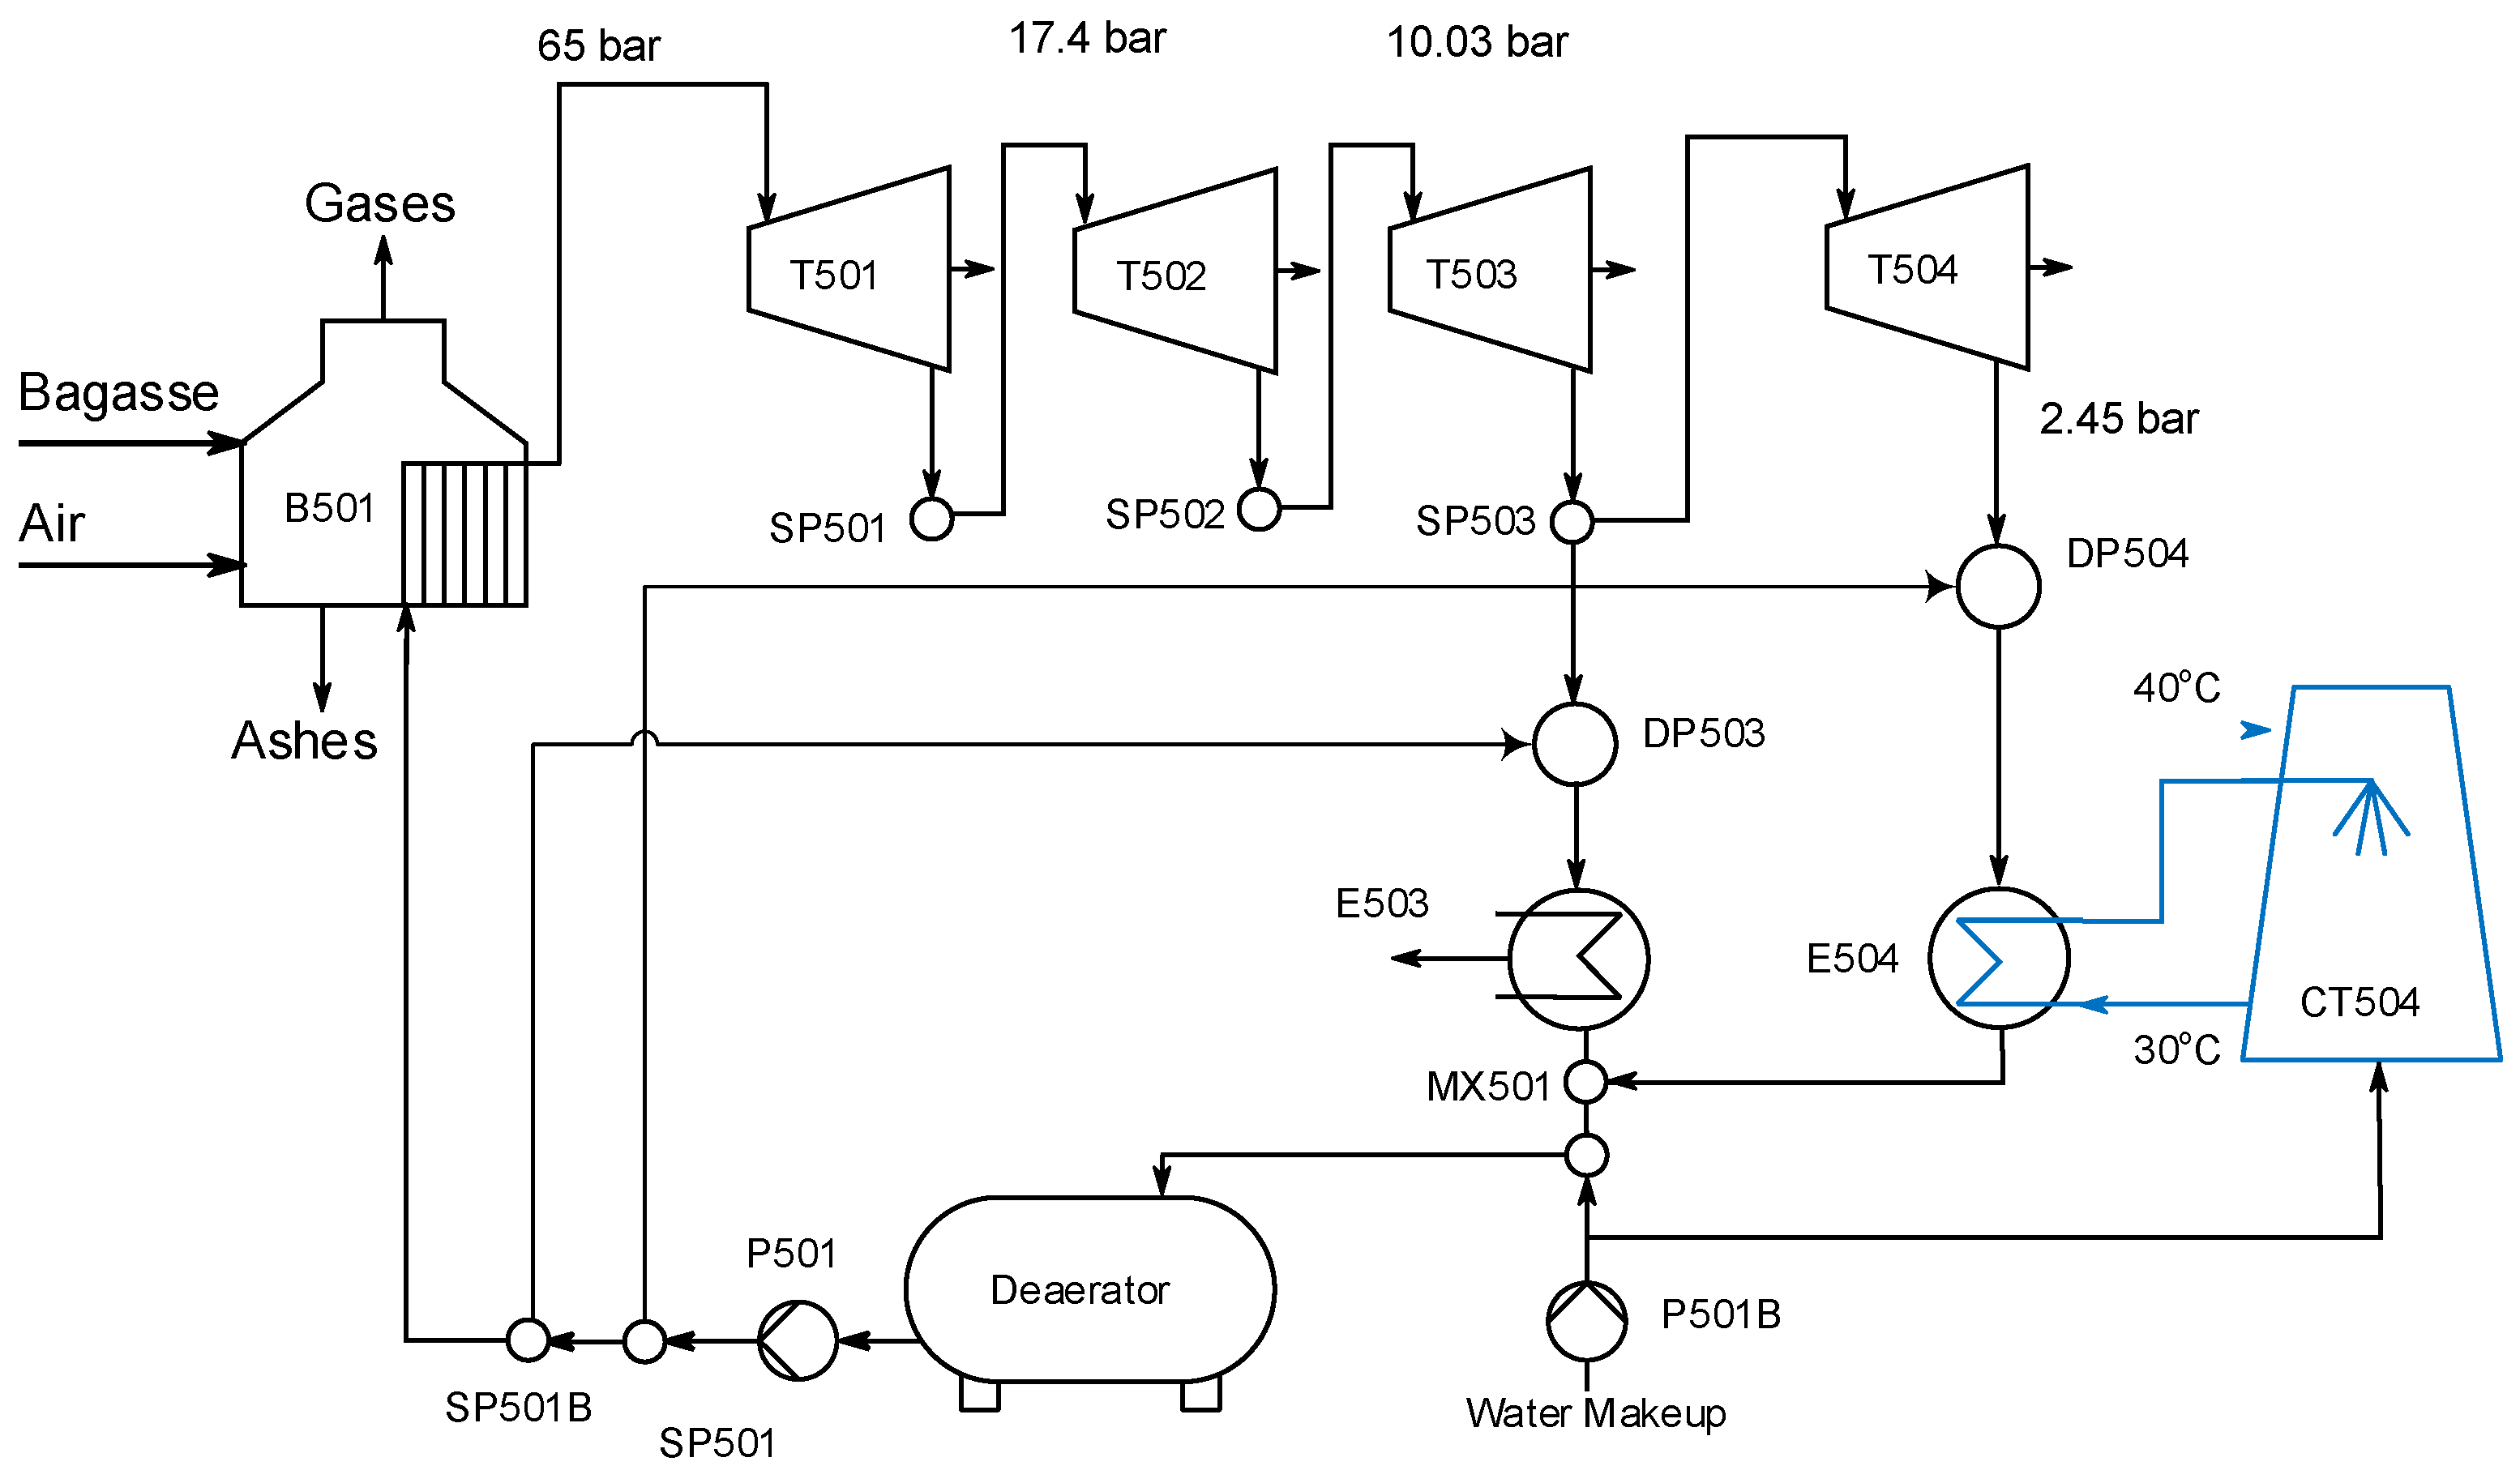
2.2.2. Combined Heat and Power (CHP) Study Case
3. Results and Discussion
3.1. Validation of EMSO_OLCA Compared to OpenLCA
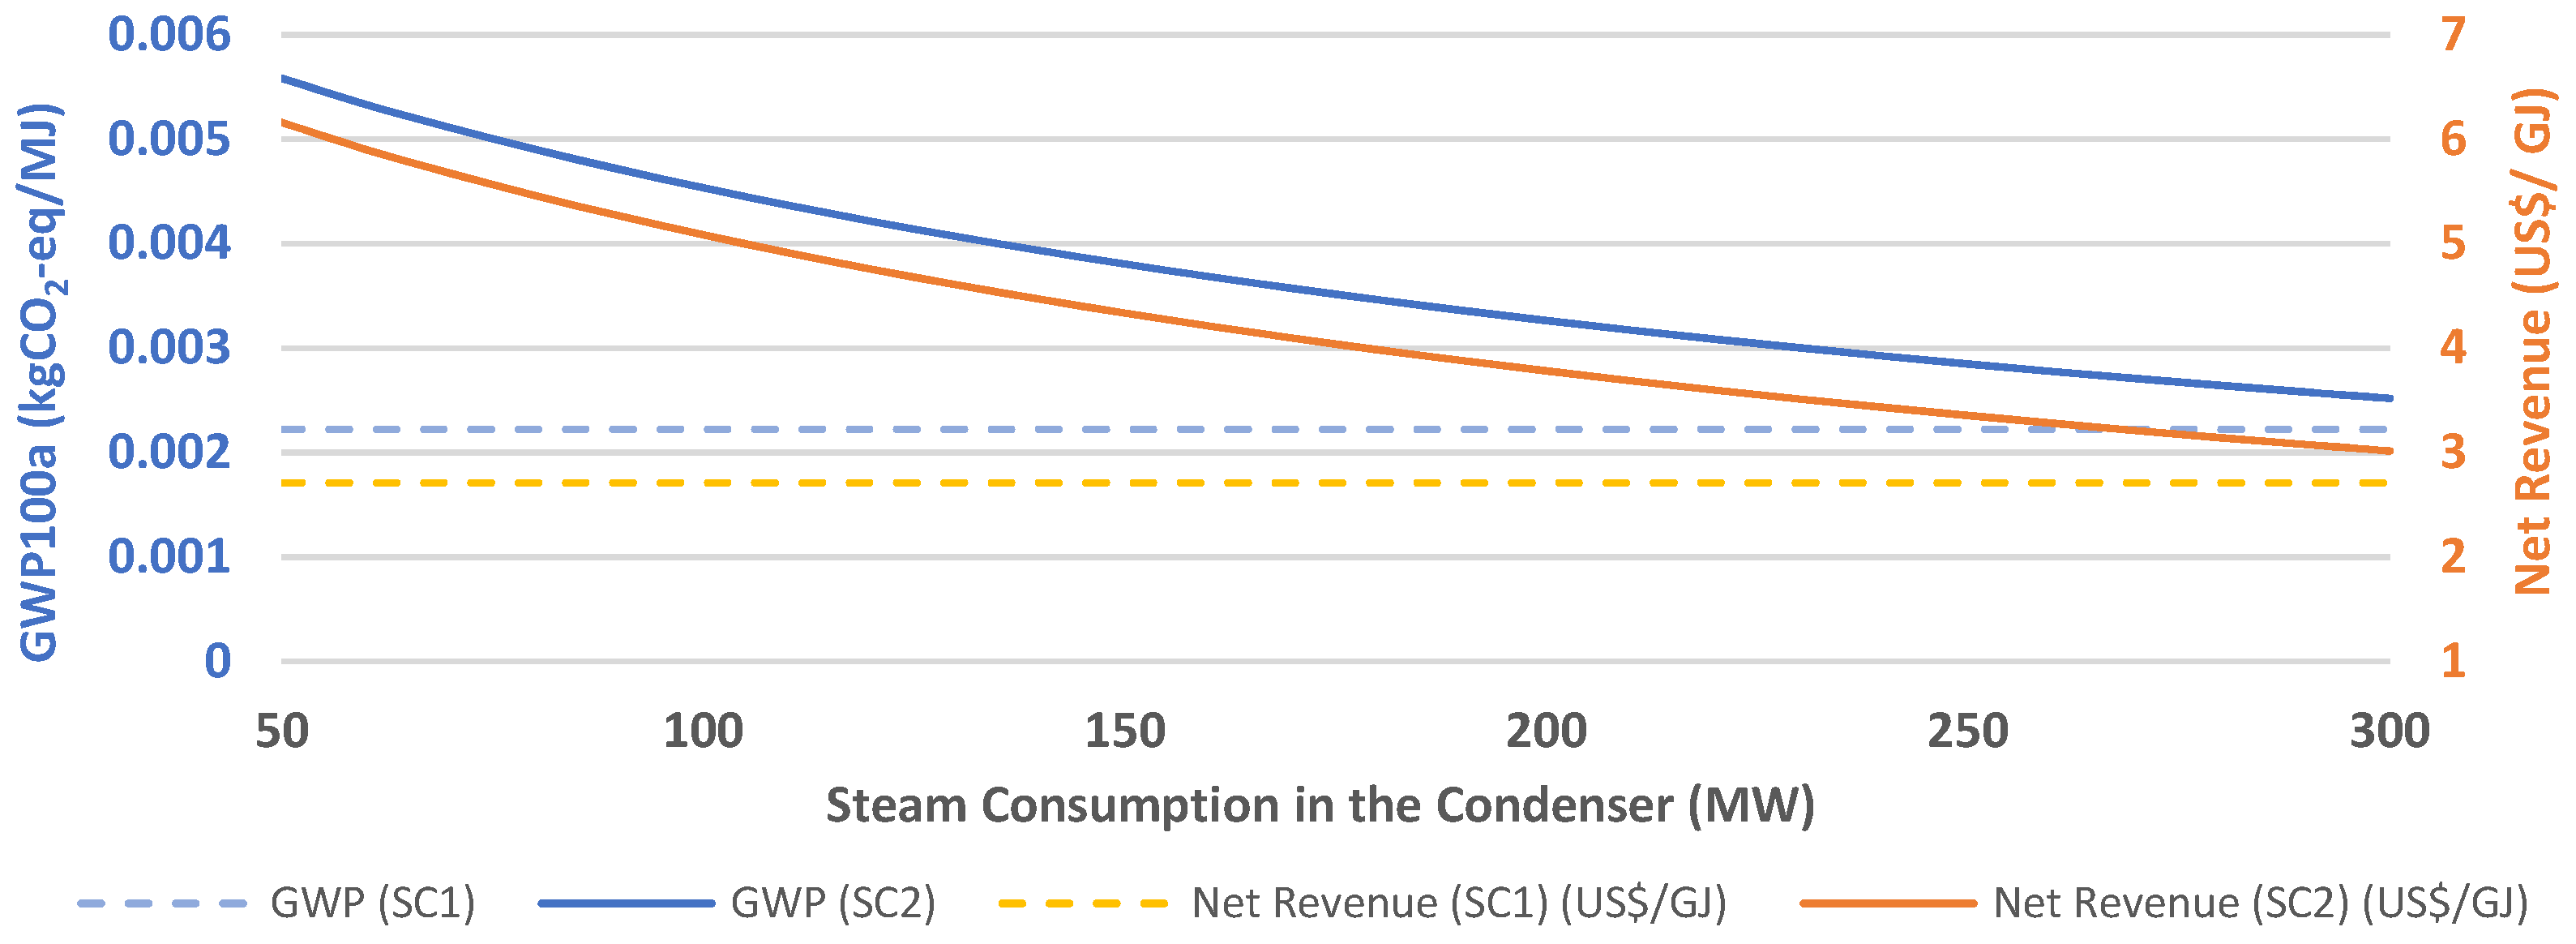
3.2. Combined Heat and Power (CHP) Study Case
4. Conclusions
Author Contributions
Funding
Data Availability Statement
Conflicts of Interest
References
- ISO 14040; Environmental Management—Life Cycle Assessment—Principles and Framework. International Standard Organization: Geneva, Switzerland, 2006. Available online: https://www.iso.org/standard/37456.html (accessed on 1 January 2022).
- OpenLCA. Available online: https://www.openlca.org/ (accessed on 1 January 2022).
- Simapro. Available online: https://simapro.com/ (accessed on 1 January 2022).
- LCA for Experts. Available online: https://sphera.com/solutions/product-stewardship/life-cycle-assessment-software-and-data/lca-for-experts/ (accessed on 12 June 2024).
- Potrich, E.; Miyoshi, S.C.; Machado, P.F.S.; Furlan, F.F.; Ribeiro, M.P.A.; Tardioli, P.W.; Giordano, R.L.C.; Cruz, A.J.G.; Giordano, R.C. Replacing hexane by ethanol for soybean oil extraction: Modeling, simulation, and techno-economic-environmental analysis. J. Clean. Prod. 2020, 244, 118660. [Google Scholar] [CrossRef]
- Carpio, R.R.; Miyoshi, S.C.; Elias, A.M.; Furlan, F.F.; Giordano, R.C.; Secchi, A.R. Multi-objective optimization of a 1G-2G biorefinery: A tool towards economic and environmental viability. J. Clean. Prod. 2021, 284, 125431. [Google Scholar] [CrossRef]
- Ferdous, J.; Bensebaa, F.; Pelletier, N. Integration of LCA, TEA, Process Simulation and Optimization: A systematic review of current practices and scope to propose a framework for pulse processing pathways. J. Clean. Prod. 2023, 402, 136804. [Google Scholar] [CrossRef]
- Kalakul, S.; Pomthong, M.; Kitipat, S.; Rafiqul, G. Integration of life cycle assessment software with tools for economic and sustainability analyses and process simulation for sustainable process design. J. Clean. Prod. 2014, 71, 98–109. [Google Scholar] [CrossRef]
- Guinée, J.B.; Gorrée, M.; Heijungs, R.; Huppes, G.; Kleijn, R.; de Koning, A.; van Oers, L.; Wegener Sleeswijk, A.; Suh, S.; Udo de Haes, H.A.; et al. Handbook on life cycle assessment. In Operational Guide to the ISO Standards. I: LCA in Perspective. IIa: Guide. IIb: Operational Annex. III: Scientific Background; Kluwer Academic Publishers: Dordrecht, The Nederland, 2002; p. 692. ISBN 1-4020-0228-9. [Google Scholar] [CrossRef]
- Huijbregts, M.A.J.; Steinmann, Z.J.N.; Elshout, P.M.F.; Stam, G.; Verones, F.; Vieira, M.; Zijp, M.; Hollander, A.; Zelm, R.V. ReCiPe2016: A harmonized life cycle impact assessment method at midpoint and endpoint level. Int. J. Life Cycle Assess. 2017, 22, 138–147. [Google Scholar] [CrossRef]
- Soares, R.P.; Secchi, A.R. EMSO: A New Environment for Modelling, Simulation and Optimisation. Comput. Aided Chem. Eng. 2003, 14, 947–952. [Google Scholar] [CrossRef]
- OPC. Available online: https://opcfoundation.org/ (accessed on 12 June 2024).
- Python 3.0. Available online: https://www.python.org/download/releases/3.0/ (accessed on 12 June 2024).
- Matlab. Available online: https://www.mathworks.com/products/matlab.html (accessed on 12 June 2024).
- Scilab. Available online: https://www.scilab.org/ (accessed on 12 June 2024).
- Excel. Available online: https://www.microsoft.com/pt-br/microsoft-365/excel (accessed on 12 June 2024).
- LibreOffice. Available online: https://www.libreoffice.org/discover/libreoffice/ (accessed on 12 June 2024).
- ISO 14044; Environmental Management—Life Cycle Assessment—Requirements and Guidelines. International Standard Organization: Geneva, Switzerland, 2006. Available online: https://www.iso.org/standard/38498.html (accessed on 1 January 2022).
- Jolliet, O.; Saadé, M.; Crettaz, P. Analyse du Cycle de Vie: Comprendre et Réaliser un Écobilan; PPUR Presses Polytechniques: Geneva, Switzerland, 2010; Volume 23. [Google Scholar]
- Agarwal, N.K.; Kumar, M.; Pattnaik, F.; Kumari, P.; Vijay, V.K.; Kumar, V. Exploring the Valorization Potential of Sugarcane Bagasse Pith: A Review. BioEnergy Res. 2023, 16, 1280–1295. [Google Scholar] [CrossRef]
- Ungureanu, N.; Vlăduț, V.; Biriș, S.Ș. Sustainable valorization of waste and by-products from sugarcane processing. Sustainability 2022, 14, 11089. [Google Scholar] [CrossRef]
- Wernet, G.; Bauer, C.; Steubing, B.; Reinhard, J.; Moreno-Ruiz, E.; Weidema, B. The ecoinvent database version 3 (part I): Overview and methodology. Int. J. Life Cycle Assess. 2016, 21, 1218–1230. [Google Scholar] [CrossRef]
- CML-IA 2016. Available online: https://www.universiteitleiden.nl/en/research/research-output/science/cml-ia-characterisation-factors (accessed on 1 January 2022).
- Rocha, G.J.M.; Nascimento, V.M.; Goncalves, A.R.; Silva, V.F.N.; Martín, C. Influence of mixed sugarcane bagasse samples evaluated by elemental and physical–chemical composition. Ind. Crops Prod. 2015, 64, 52–58. [Google Scholar] [CrossRef]
- Bonomi, A.; Mariano, A.P.; Jesus, C.D.F.; Franco, H.C.J.; Cunha, M.P.; Dias, M.O.S.; Chagas, M.F.; Cavalett, O.; Mantelatto, P.E.; Maciel Filho, R.; et al. The Virtual Sugarcane Biorefinery (VSB); Technological Assessment Program (PAT), Internal Report; Brazilian Bioethanol Science and Technology Laboratory (CTBE): Campinas/São Paulo, Brazil, 2012. [Google Scholar]
- Oliveira, R.A.; Barros, R.R.O.; Ferreira-Leitão, V.S.; Freitas, S.P.; Bon, E.P.S. Energy supply design for the integrated production of 1G + 2G ethanol from sugarcane. Renew. Energy Focus. 2020, 35, 171–177. [Google Scholar] [CrossRef]
- Dias, M.O.S. Development and Optimization of First and Second Generation Ethanol and Electricity Production Processes from Sugar Cane. Ph.D. Thesis, Chemical Engineering Faculty, Universidade Estadual de Campinas, Campinas, Brazil, 2011. (In Portuguese). [Google Scholar]
- Dias, M.O.; Junqueira, T.L.; Cavalett, O.; Cunha, M.P.; Jesus, C.D.; Mantelatto, P.E.; Rossel, C.E.V.; Maciel Filho, R.; Bonomi, A. Cogeneration in integrated first and second generation ethanol from sugarcane. Chem. Eng. Res. Des. 2013, 91, 1411–1417. [Google Scholar] [CrossRef]
- Furlan, F.F.; Filho, R.T.; Pinto, F.H.; Costa, C.B.; Cruz, A.J.; Giordano, R.L.; Giordano, R.C. Bioelectricity versus bioethanol from sugarcane bagasse: Is it worth being flexible? Biotechnol. Biofuels 2013, 6, 142. [Google Scholar] [CrossRef]
- Wang, M.; Elgowainy, A.; Lu, Z.; Bafana, A.; Benavides, P.; Burnham, A.; Cai, H.; Dai, Q.; Gracida, U.; Hawkins, T.; et al. Greenhouse Gases, Regulated Emissions, and Energy Use in Technologies Model® (2020.Net); Argonne National Laboratory (ANL): Argonne, IL, USA, 2020. [CrossRef]
- CEDAE. Tariff Structure. 2022. Available online: https://cedae.com.br/estruturatarifaria (accessed on 15 May 2024). (In Portuguese).
- Águas do Rio. Legislation and Tariffs. 2023. Available online: https://aguasdorio.com.br/legislacao-e-tarifas/ (accessed on 15 May 2024). (In Portuguese).
- ANEEL. National Electric Energy Agency. 2023. Available online: https://www.gov.br/aneel/pt-br (accessed on 15 May 2024). (In Portuguese)
- MDIC. Ministry of Development, Industry, Commerce and Services COMEXSTAT. 2023. Available online: http://comexstat.mdic.gov.br/pt/home (accessed on 1 January 2023).


| Impact Category (Baseline Charact. Factor) | Impacts and Effects | Main Impact Substances | Unit |
|---|---|---|---|
| Global warming (GWP 100a) | Impact of human emissions on the radiative forcing on atmosphere. Adverse impacts on ecosystem and human health. | CO2, N2O, CH4 | kg CO2-eq |
| Ozone layer depletion (ODP∞) | Reduction of the stratospheric ozone layer, increasing the UV-B radiation to earth surface. Potential harms to human, animal health and terrestrial and aquatic ecosystems. | Trichlorofluoromethane (CFC-11), Halon 1301, Halon 1211 | kg CFC-11-eq |
| Eutrophication (EP) | Emissions of excessively high level of macronutrients as nitrogen(N), phosphorous (P) and carbon (C) to the environment. Algal Blooms, oxygen depletion. | NH3, P, PO4, NO3, organic matter | kg PO4-eq |
| Acidification (AP) | Damages to the soil, groundwater, surface waters, ecosystems and materials as buildings. | SOx, NHx, NOx | kg SO2-eq |
| Photochemical oxidation (PCOP) | Emission of photo-oxidant substances. Damage to human health, ecosystems and to agricultural crops. | VOC, CO, NOx | kg C2H4-eq |
| Human Toxicity (HTP∞,global) | Impacts acute and chronic toxicity to human health. | Benzene, Cupper, Lead | kg 1,4-DB-eq (1,4-dichlorobenzene) |
| Ecotoxicity | Impact of toxic substances on aquatic, terrestrial and sediment ecosystems. | 1,4-dichlorobenzene, Mercury, Arsenic | kg 1,4-DB-eq (1,4-dichlorobenzene) |
| Emission | Elementary Flow 2 | Type of Elementary Flow 2 | Value 1 | Unit |
|---|---|---|---|---|
| VOC | NMVOC, non-methane volatile organic compounds, unspecified origin | Emission to air | 0.61499 | g/MMBtu |
| CO | Carbon monoxide | Emission to air | 9.7514 | g/MMBtu |
| NOx | Nitrogen oxides | Emission to air | 64.213 | g/MMBtu |
| PM2.5 | Particulates, <2.5 μm | Emission to air | 1.2671 | g/MMBtu |
| PM10 | Particulates, <10 μm | Emission to air | 1.4347 | g/MMBtu |
| SOx | Sulfur oxides | Emission to air | 58.923 | g/MMBtu |
| BC | Black Carbon | Emission to air | 0.17486 | g/MMBtu |
| OC | Organic Carbon | Emission to air | 0.41308 | g/MMBtu |
| CH4 | Methane | Emission to air | 9.8650 | g/MMBtu |
| N2O | Dinitrogen monoxide | Emission to air | 6.1070 | g/MMBtu |
| CO2 | Carbon dioxide, biogenic | Emission to air | from simulation | - |
| Product/Raw Material | Price | Unit | Source |
|---|---|---|---|
| Water () | 0.005235 | USD/kg | [31,32] |
| Electricity () | 59.50 | USD/MWh | [33] |
| Low Sugarcane Bagasse Price () | 14.58 | USD/t | [5] |
| High Sugarcane Bagasse Price () | 158.75 | USD/t | [34] |
| Impact Category | Unit | OpenLCA Results | EMSO_OLCA Results | Relative Error (%) |
|---|---|---|---|---|
| Photochemical oxidation | kg C2H4-eq | 0.00169 | 0.00169359 | 0.2124% |
| Human toxicity | kg 1,4-DB-eq | 0.25019 | 0.250187 | 0.0012% |
| Abiotic depletion | kg Sb-eq | 4.29159·10−6 | 4.29155·10−6 | 0.0009% |
| Eutrophication | kg PO4-eq | 0.00741 | 0.00740821 | 0.0242% |
| Abiotic depletion (fossil fuels) | MJ | 3.28619 | 3.28619 | 0.0000% |
| Marine aquatic ecotoxicity | kg 1,4-DB-eq | 257.255 | 257.255 | 0.0000% |
| Ozone layer depletion (ODP) | kg CFC-11-eq | 1.9625·10−8 | 1.9625·10−8 | 0.0000% |
| Terrestrial ecotoxicity | kg 1,4-DB-eq | 0.00109 | 0.0010923 | 0.2110% |
| Acidification | kg SO2-eq | 0.01395 | 0.0139457 | 0.0308% |
| Fresh water aquatic ecotoxicity | kg 1,4-DB-eq | 0.13882 | 0.138824 | 0.0029% |
| Global Warming (GWP 100a) | kg CO2-eq | 0.06515 | 0.0651403 | 0.0149% |
| Description | Unit | Scenario 1 | Scenario 2 | Δ% |
|---|---|---|---|---|
| Inputs | ||||
| Bagasse/Straw | t/h | 37.40 | 117.33 | 214% |
| Water | t/h | 7.46 | 429.11 | 5656% |
| Emissions | ||||
| VOC | kg/h | 0.36 | 1.13 | 214% |
| CO | kg/h | 5.69 | 17.84 | 214% |
| NO | kg/h | 37.45 | 117.50 | 214% |
| Particulate M., <2.5 μm | kg/h | 0.74 | 2.32 | 214% |
| Particulate M., <10 μm | kg/h | 0.84 | 2.63 | 214% |
| SOx | kg/h | 34.37 | 107.82 | 214% |
| BC | kg/h | 0.10 | 0.32 | 214% |
| OC | kg/h | 0.24 | 0.76 | 214% |
| CH4 | kg/h | 5.75 | 18.05 | 214% |
| NO2 | kg/h | 3.56 | 11.17 | 214% |
| CO2, biogenic | t/h | 60.53 | 189.88 | 214% |
| Products | ||||
| Vapor | MW | 113.50 | 113.50 | 0% |
| Surplus Electricity, Liq. | MWh | 34.02 | 141.52 | 316% |
| Impact Categories | Unit | Scenario 1 | Scenario 2 | Δ% |
|---|---|---|---|---|
| Global warming (GWP 100a) | kg CO2-eq/MJ | 2.221·10−3 | 4.317·10−3 | 94% |
| Photochemical oxidation | kg C2H4-eq/MJ | 2.759·10−6 | 5.125·10−6 | 86% |
| Human toxicity | kg 1,4-DB-eq/MJ | 5.112·10−4 | 1.510·10−3 | 195% |
| Abiotic depletion | kg Sb-eq/MJ | 7.155·10−9 | 2.629·10−8 | 267% |
| Eutrophication | kg PO4-eq/MJ | 2.272·10−5 | 4.182·10−5 | 84% |
| Abiotic depletion (fossil fuels) | MJ/MJ | 5.881·10−3 | 1.378·10−2 | 134% |
| Marine aquatic ecotoxicity | kg 1,4-DB-eq/MJ | 4.399·10−1 | 1.453 | 230% |
| Ozone layer depletion (ODP) | kg CFC-11-eq/MJ | 3.500·10−11 | 8.786·10−11 | 151% |
| Terrestrial ecotoxicity | kg 1,4-DB-eq/MJ | 1.925·10−6 | 7.324·10−6 | 281% |
| Acidification | kg SO2-eq/MJ | 5.731·10−5 | 1.060·10−4 | 85% |
| Fresh water aquatic ecotox. | kg 1,4-DB-eq/MJ | 2.373·10−4 | 8.324·10−4 | 251% |
Disclaimer/Publisher’s Note: The statements, opinions and data contained in all publications are solely those of the individual author(s) and contributor(s) and not of MDPI and/or the editor(s). MDPI and/or the editor(s) disclaim responsibility for any injury to people or property resulting from any ideas, methods, instructions or products referred to in the content. |
© 2024 by the authors. Licensee MDPI, Basel, Switzerland. This article is an open access article distributed under the terms and conditions of the Creative Commons Attribution (CC BY) license (https://creativecommons.org/licenses/by/4.0/).
Share and Cite
Miyoshi, S.C.; Secchi, A.R. Simultaneous Life Cycle Assessment and Process Simulation for Sustainable Process Design. Processes 2024, 12, 1285. https://doi.org/10.3390/pr12071285
Miyoshi SC, Secchi AR. Simultaneous Life Cycle Assessment and Process Simulation for Sustainable Process Design. Processes. 2024; 12(7):1285. https://doi.org/10.3390/pr12071285
Chicago/Turabian StyleMiyoshi, Simone C., and Argimiro R. Secchi. 2024. "Simultaneous Life Cycle Assessment and Process Simulation for Sustainable Process Design" Processes 12, no. 7: 1285. https://doi.org/10.3390/pr12071285