Article

Evolution Characteristics of Strain and Displacement Fields in Double-Hole Short-Delay Blasting Based on DIC

1
Faculty of Land Resources Engineering, Kunming University of Science and Technology, Kunming 650093, China
2
Advanced Blasting Technology Engineering Research Center of Yunnan Provincial Department of Education, Kunming 650093, China
3
School of Civil and Recourses Engineering, University of Science and Technology Beijing, Beijing 100083, China
*
Author to whom correspondence should be addressed.
These authors contributed equally to this work.
Processes 2024, 12(7), 1291; https://doi.org/10.3390/pr12071291
Submission received: 6 June 2024 / Revised: 19 June 2024 / Accepted: 19 June 2024 / Published: 21 June 2024
(This article belongs to the Section Energy Systems)

Abstract

:
In the process of porous blasting excavation in engineering projects such as mining, hydropower stations, and tunnels, the delay time between adjacent blast holes significantly influences the characteristics of rock fracture and fragmentation. In order to visually explore the changing characteristics of strain and displacement between adjacent blast holes under different delay times, polymethyl methacrylate (PMMA) plates were used to simulate rock materials, and 2D digital image correlation (2D-DIC) testing methods were employed to measure the explosive strain field with different delay times (0 µs, 5 µs, 15 µs, 40 µs, 70 µs) for dual holes. Full-field principal strain cloud maps and displacement fields of PMMA boards in two-dimensional spatial coordinates were obtained, and the representative monitoring points were analyzed. The experimental results show that the maximum values of the first compressive principal strain peak and the first tensile principal strain peak at the connecting center of the two holes exist at a delay time of 0~40 µs under blasting conditions with the same hole distance and single hole charge. At the center point of the connection between the two holes, the interval time between the two principal strain peaks decreases with the increase in delay time. The maximum principal strain on the central vertical line of the connection line decreases exponentially with the increase in hole distance, and the attenuation trend increases first and then decreases with the delay time between 0 and 40 µs. At the peak of strain, the maximum average displacement of the connecting center of the two holes exists in the delay time between 0 and 40 µs. With the increase in delay time, the displacement trend between the two explosion holes gradually changes from shear to tension, and the vulnerable damage area increases, which makes the communication between the two explosion holes easier. This study can provide a basis for the precise selection of delay times between blasting holes in engineering.

1. Introduction

Drilling and blasting are commonly used excavation methods in mining, tunneling, and road construction processes. Inappropriate blasting parameters can not only lead to poor blasting effects but also pose serious safety hazards [1]. Research has shown that the delay time of explosives is one of the important factors affecting rock fragmentation [2]. An explosion is an ultra-dynamic phenomenon that causes intense destruction in an extremely short period of time. The strain field caused by material damage during an explosion exhibits high-speed and nonlinear complex variation characteristics [3]. According to field experience, an inappropriate blasting delay time can lead to severe ground vibrations, poor rock fragmentation effects [4,5], and low explosive utilization rates, resulting in resource waste.
With the increasing popularity of digital electronic detonators [6], adjusting the delay time to improve rock fragmentation has become a research hotspot, and scholars in this field have conducted a large amount of research [7,8]. Han et al. [9] employed the time-frequency energy density method of the wavelet transform to identify and determine the actual delay time in millisecond blasting and proposed measures to reduce the effect of blasting vibration. Zhang et al. [10] explored the effects of different delay times on explosion induction (mainly referring to the peak particle velocity (PPV)) through double-hole and multihole delayed blasting experiments. Choi [11] investigated the impact of 50 different delay times on ground vibration and derived a predictive equation for blasting vibration. Li Qing et al. [12] investigated the mechanism of improving blasting vibration and rock fragmentation effects in precise control blasting processes in subway tunnels using electronic detonators and proposed an optimized calculation method for inter-hole delay time related to multiple factors. Xu et al. [13] used genetic algorithms to study the phenomenon of vibration superposition caused by delay errors in detonators, obtaining the maximum possible amplification factor of vibration due to delay errors in detonators. Sharma et al. [14] found that a 92 ms delay between rows generates less backbreak compared to 42 ms and 67 ms delays. Rossmanith [15,16] found through large-scale experimental analysis that the optimal delay time is short, and short delays can promote the mutual superposition of explosive stress waves, thereby improving the effectiveness of rock fragmentation. The blasting stress wave propagates from the blast hole in the form of a circular wave after blasting [17]; however, there is still controversy over how to enhance blasting effects by promoting stress wave superposition through delay time [18,19]. Thus, it is necessary to explore the impact of delay time on blasting effects.
According to current research, the influence of delay time on blasting effects can be considered from several aspects: (1) measuring the PPV caused by different delay times; (2) calculating the crack propagation velocity and its crack tip stress intensity factor under different delay times; (3) fitting the superposition of stress waves under different delay times; and (4) exploring the evolution of the full-field strain field under different delay times. The dynamic fragmentation process of rock and the evolution of the full-field strain field during this process can intuitively evaluate the blasting effect. Digital image correlation (DIC) technology was first proposed by Yamaguchi [20] in the 1980s. It is a noncontact optical strain measurement method that was initially used for dynamic strain measurements of composite materials and alloy materials. Over the past few decades, DIC technology has made significant advancements in both software and hardware. Cameras now support millions to tens of millions of pixels, enabling deformation measurement, displacement tracking, and trajectory measurement of rock materials at high speeds. When coupled with high-magnification microscopy, this approach can meet the demand for micron-level precision measurements. In recent years, DIC measurement technology has gradually been applied to experiments such as compression [21], tension [22], crack propagation [23], explosion [24], dynamic fracture [25], and penetration [26] of rock-like materials. Ding et al. [27] investigated the effect of stress wave superposition between two neighboring boreholes using a digital image correlation system and concluded that these stress enhancements are not sufficient to cause crack initiation in the stress wave superposition region among the boreholes. In explosion load experiments, Kakogiannis et al. [28] used DIC technology to measure the instantaneous strain field of 0.8 mm thick plates. Chen et al. [29] captured the deformation and fracture process of precracked semicircular explosive simulants in situ using a high-speed camera and obtained the full displacement and strain fields through DIC software. Xu et al. [30] used the 3D-DIC method to analyze the full-field three-dimensional deformation characteristics during the splitting process of specimens to explore the control methods for the secondary fragmentation morphology of open-pit blasting. They concluded that the shape and distribution of the main strain concentration zone determine the path and trend of crack propagation. Aune used 2D-DIC technology to measure the transient deformation field of thin ductile plates under explosion loads to study their dynamic response. Aune [31] used 2D-DIC technology to measure the transient deformation field of thin ductile plates under explosion loads to study their dynamic response. Arora et al. [32] used a high-speed photography and laser thickness measurement system with digital image correlation (DIC) to monitor the deformation of composite sandwich panels during an explosion. Takahashi et al. [33] used the DIC technique to measure stress wave propagation and crack initiation in concrete under blast loading.
According to previous numerical simulations and field test experiences, there exists an optimal delay time that can enhance the superposition of explosion stress waves and improve rock crushing efficiency. This study conducted explosion tests based on 2D-DIC technology using a relatively tough polymethyl methacrylate (PMMA) plate to simulate fractured rock materials. To prevent computational failure caused by the material fracture, the PMMA plate must not produce cracks or fractures after the explosion. Due to the small size of this test model, the delay time of the previous millisecond level is shortened, and then the evolution of the total strain field and displacement field around the explosion hole of the PMMA plate under different delay times is studied.

2. DIC Technology System

The 2D-DIC system consists of hardware and software components. The hardware part, mainly includes a high-speed camera, camera mount, computer, and two stable and uniform high-brightness LED light sources. The camera used is the MEMRECAM ACS series high-speed camera (Zhongchuanglianda Co., Ltd, Wuhan, China), featuring a high-sensitivity 1.14 M pixel CMOS chip with a resolution of 1280 pixels × 896 pixels and a frame rate of 20,000 fps (the minimum interval between adjacent photos is 5 µs), delivering exceptional image quality primarily for impact tests, material tests, and other applications. The data analysis software used was virtual image correlation 2D (Vic-2D Digital Image Correlation, Version 6.2.2) technology (Correlated Solutions, lnc., Columbia, SC, USA), with the interface shown in Figure 1. Various factors influence the processing speed of the software, including computer hardware configuration, the selected image processing area of the software, and pre- and post-image deformation size. The processing time for each dataset in this experiment ranges from approximately 1 to 2 min. Figure 2a shows the testing system, and Figure 2b shows the testing procedure. The variables for calculating the overall displacement and strain include (1) the coordinates of the feature points and their displacement in the horizontal and vertical directions, and (2) the longitudinal strain (exx), axial strain (eyy), shear strain (exy), and principal strains (e1). [34].

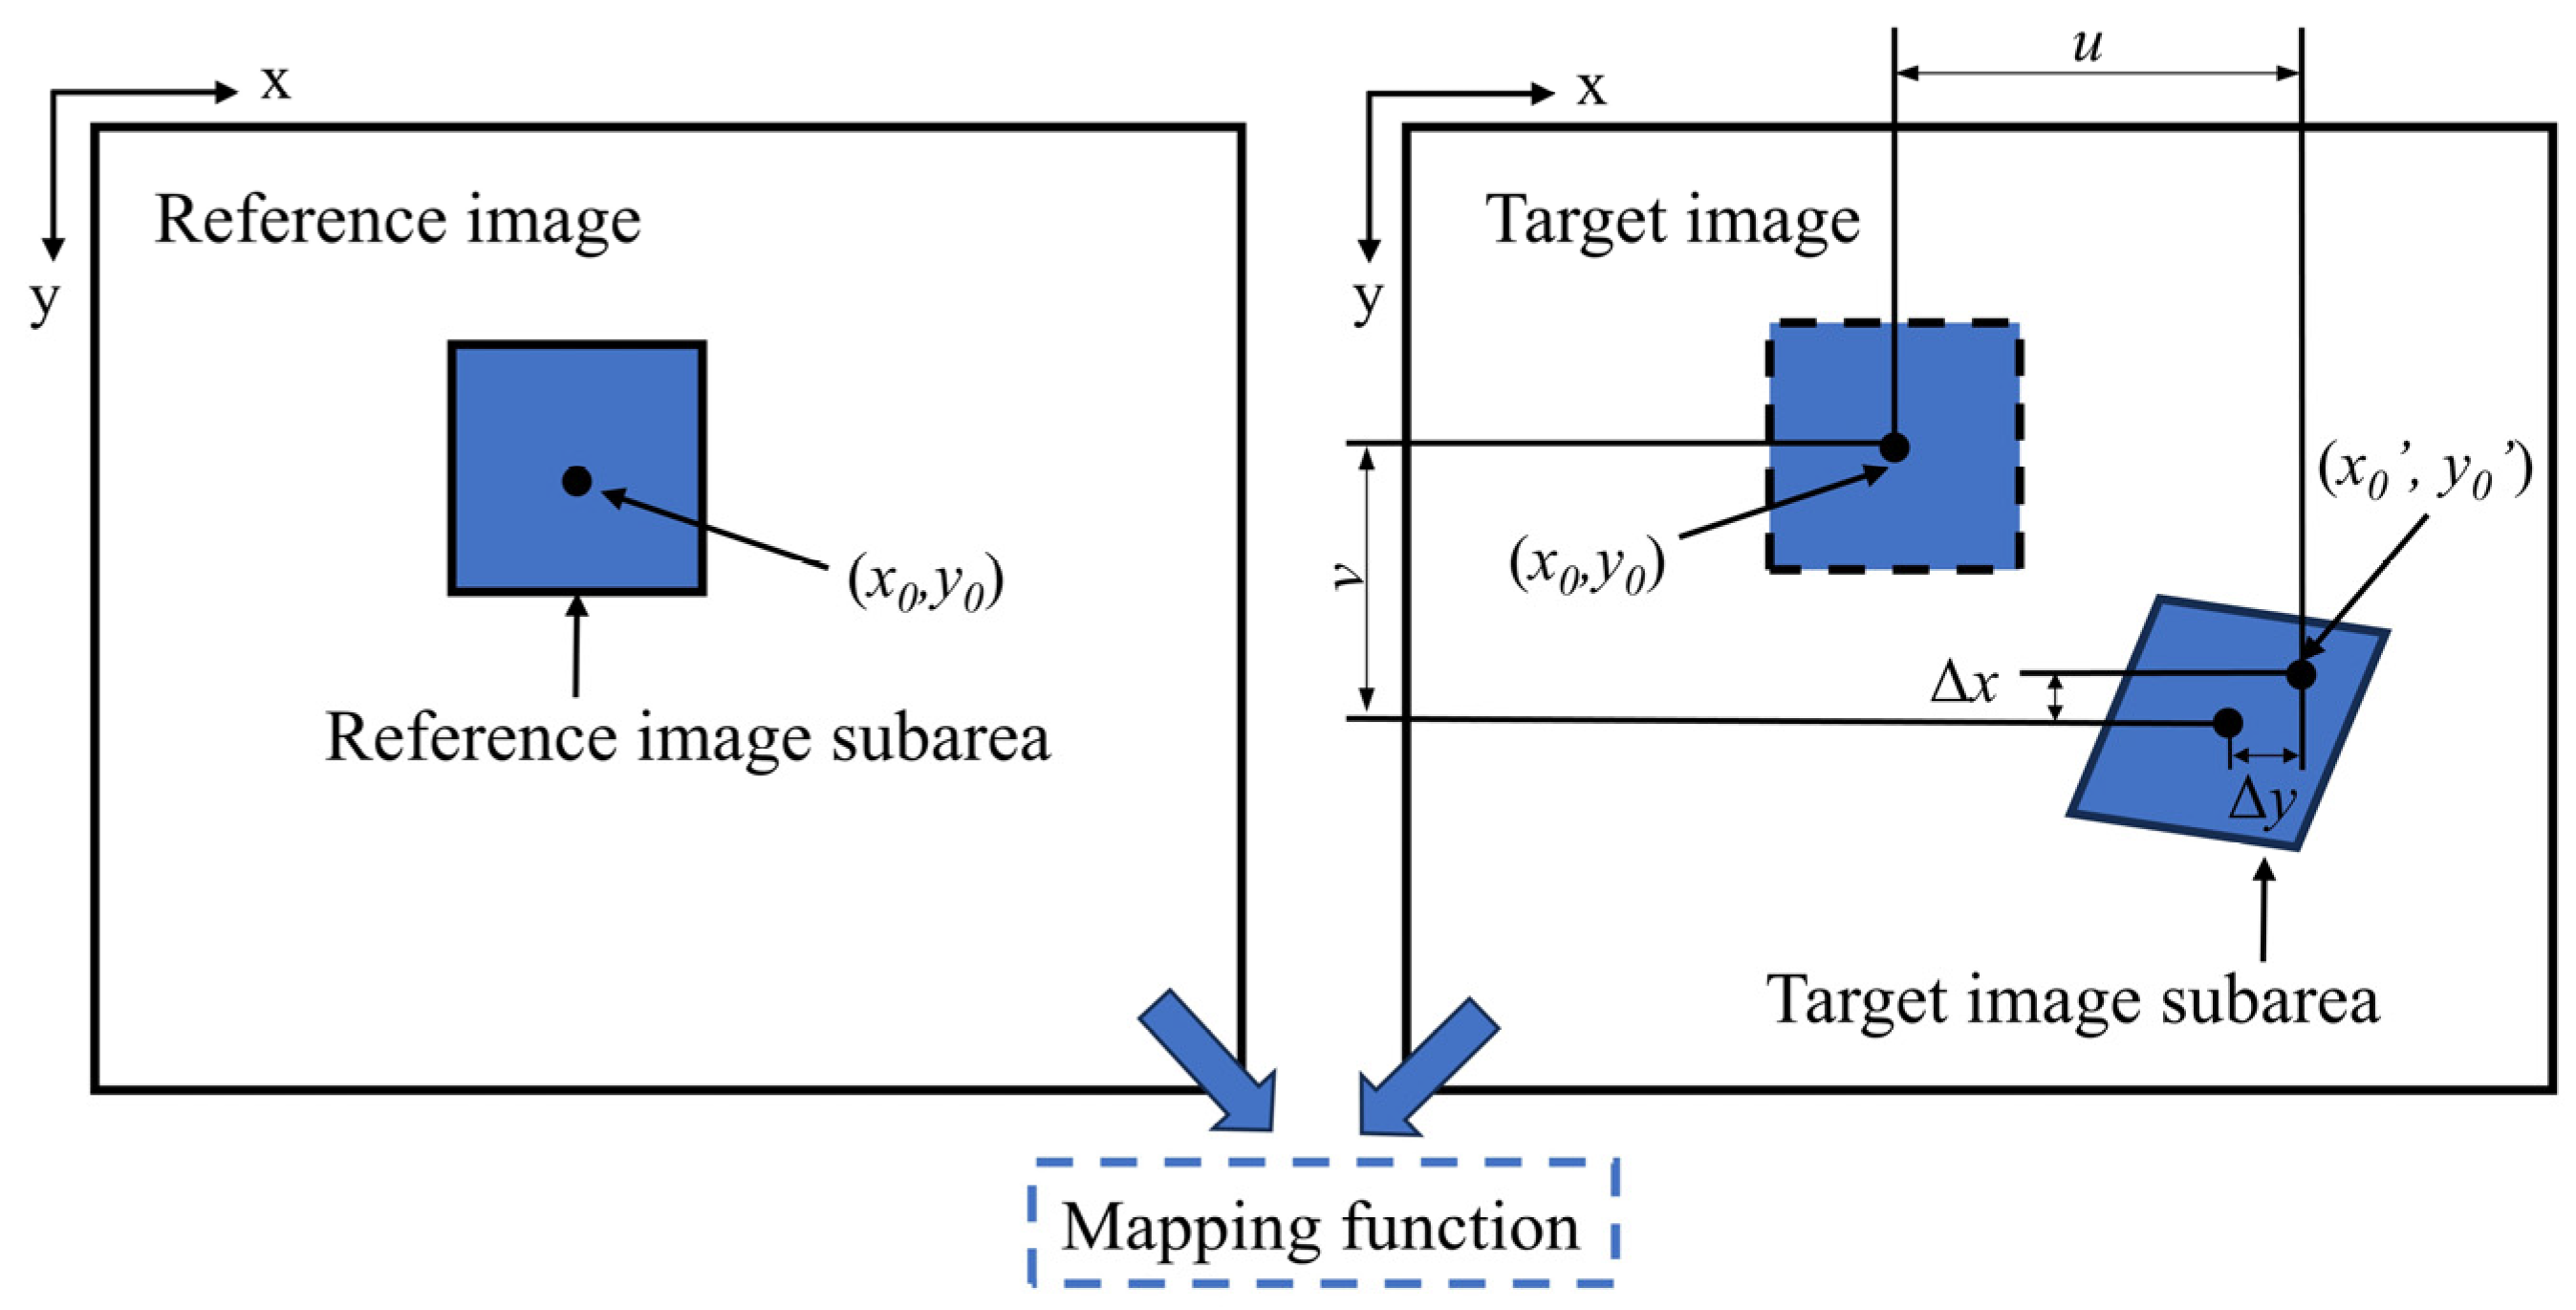
3. The Basic Principles of DIC
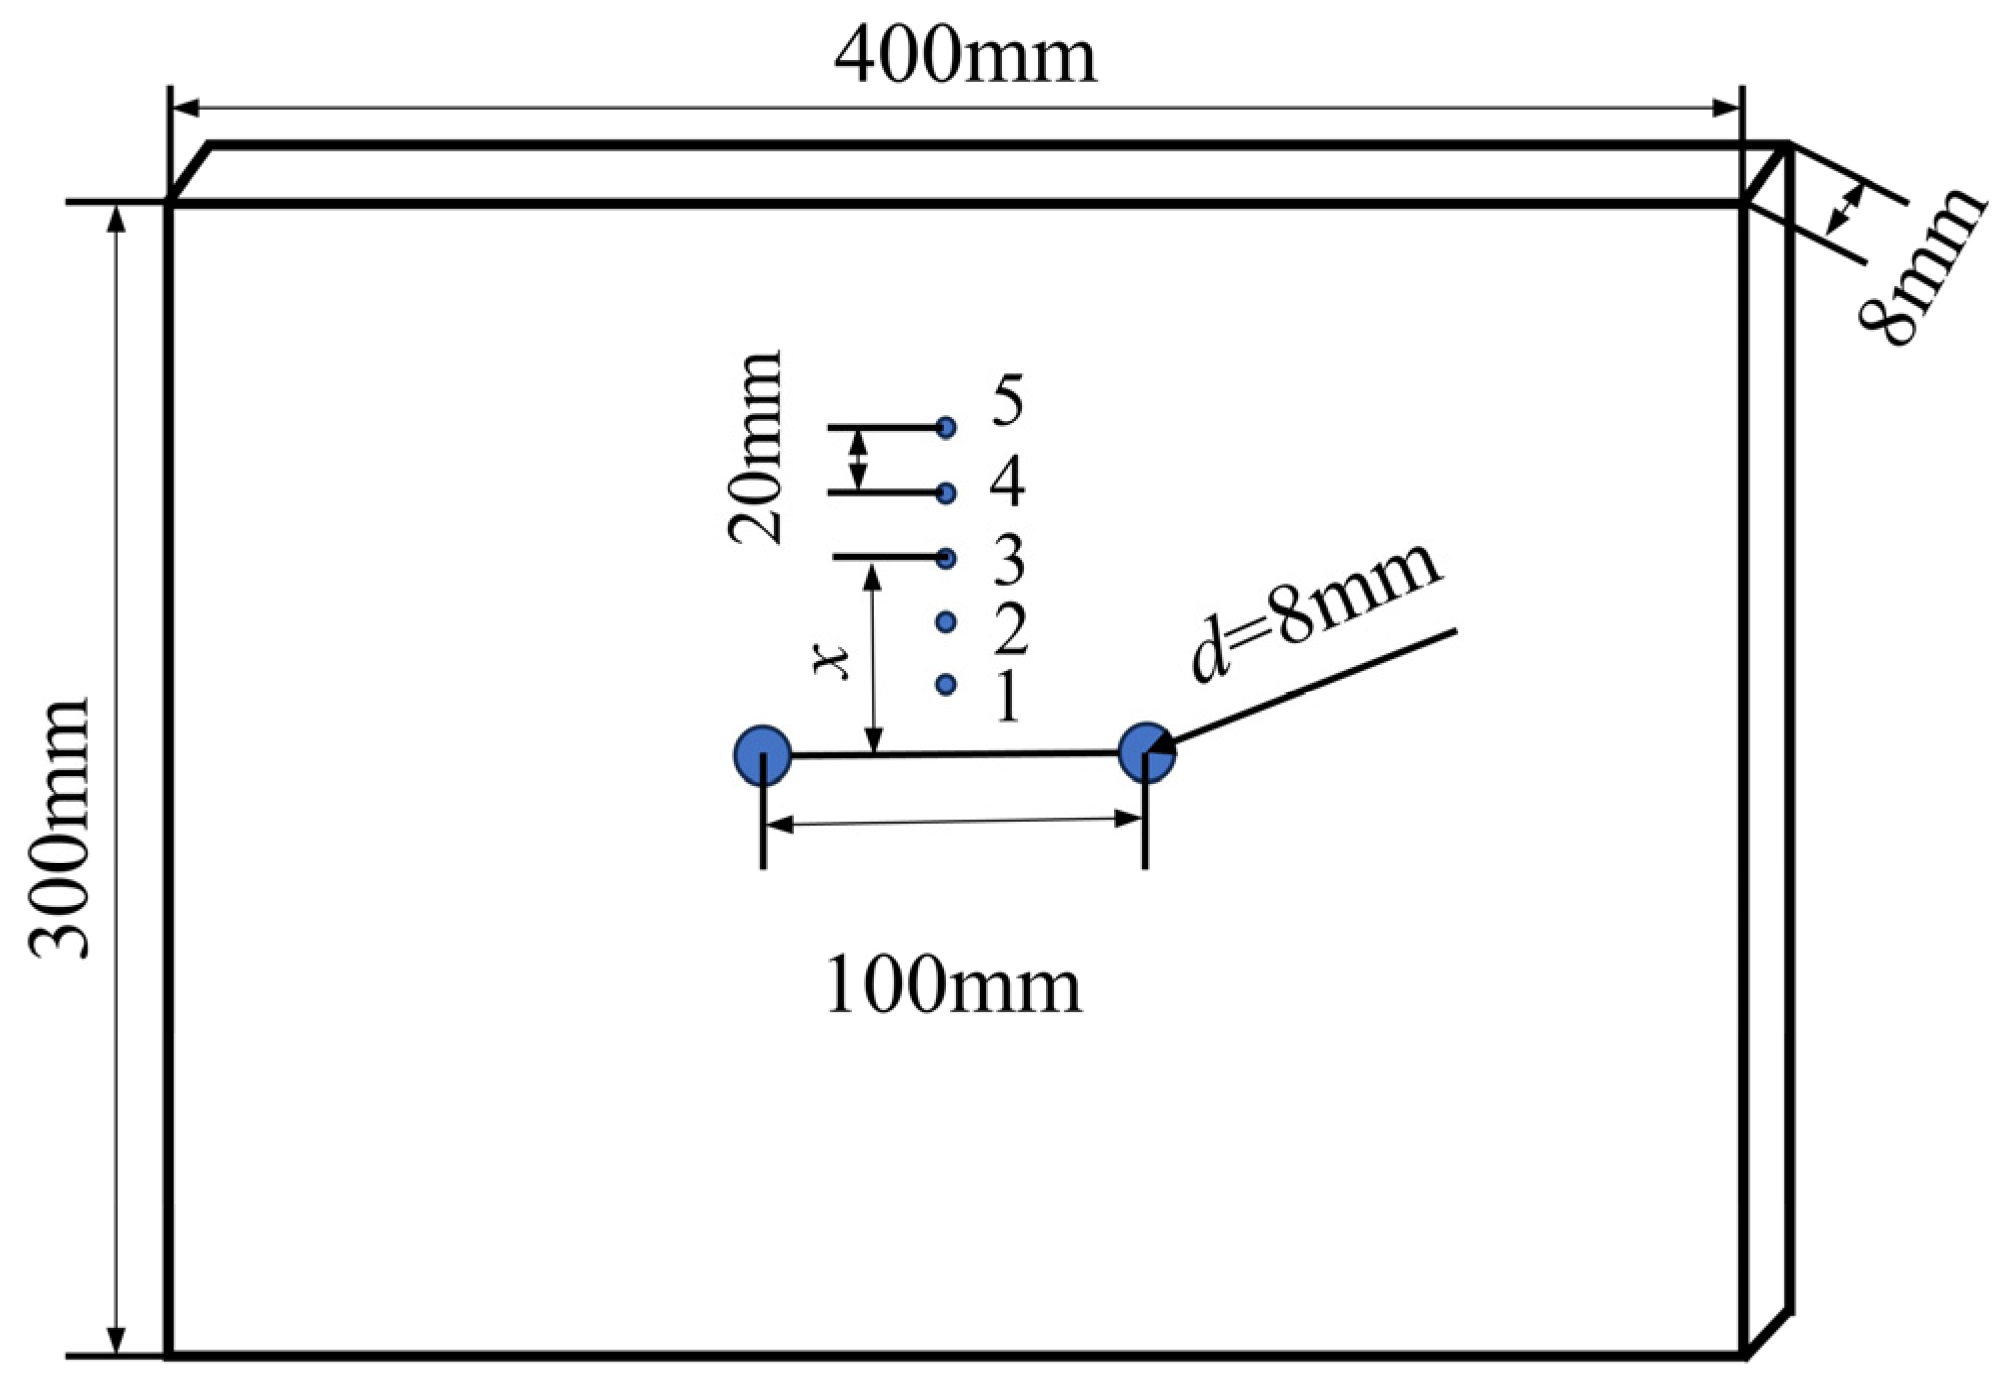
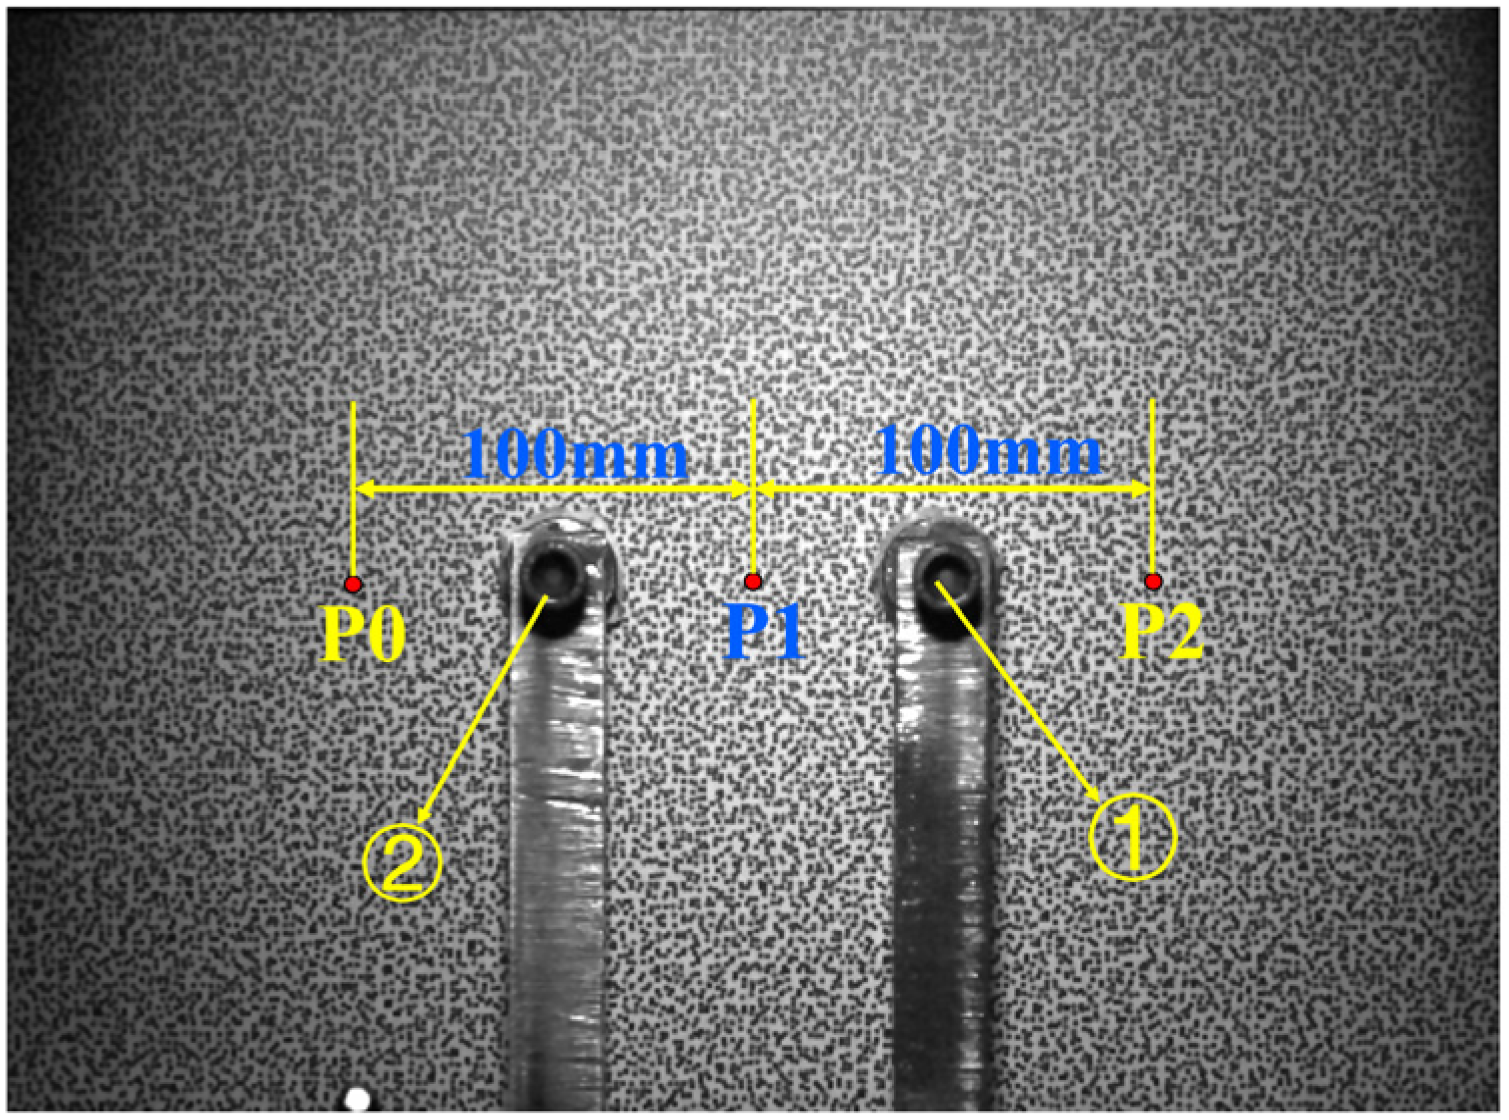
The 2D-DIC method mainly measures the surface of specimens with a flat surface and no distortion, surface tilt, or obvious lateral sample movement during the test. The 3D-DIC system is used for three-dimensional measurement of components, round rod samples, etc. This system requires special hardware and software. Since the study in this paper mainly focuses on plane problems, 2D DIC analysis is sufficient. Before conducting formal explosive simulation experiments, it is necessary to create speckles on the surface of the test piece. During the experiment, the speckle images on the surface of the test piece will also change before and after deformation. DIC calculates the correlation coefficient of the grayscale values to characterize this change, thereby obtaining the spatial position and displacement of calculation points before and after deformation and subsequently obtaining strain data for the selected zone.
The basic principle of DIC is shown in Figure 3, which usually uses the image before deformation as the reference image and the image after deformation as the target image [32]. The small block zone image selected on the reference image is called the reference subregion, and the corresponding zone on the target image is called the target subregion. First, the image of a fixed pixel zone before deformation (the reference image) is divided into a grid [35]. Then, high-precision subpixel-level displacement tracking is performed on the image data in each subregion of this zone in the time domain. Subsequently, calculations are performed using some search method according to a predefined correlation function, and the maximum value of the correlation coefficient is found after deformation to determine the correspondence between the reference and target subregions. The concept of shape functions is introduced in DIC, in which the displacement of pixel points in the subregion is correlated, usually using a first-order shape function form (1):
x * = x 0 + u + u x Δ x + u y Δ y y * = y 0 + v + v x Δ x + v y Δ y
where u and v are the horizontal and vertical displacement of the center point of the reference subset; Δ x and Δ y are the horizontal and vertical offset of point ( x 0 , y 0 ) relative to the center point of the reference subset; and u x , u y , v x and v y are the first-order partial derivatives of the displacement of the reference subset.
First-order shape functions can describe translation, rotation, normal strain, and shear strain. If the deformation is highly complex, first-order shape functions may not accurately describe the true deformation of the subset. Lu et al. [36] proposed second-order shape functions to improve the computational accuracy:
x = x 0 + u + ( 1 + u x ) Δ x + u y Δ y + 1 2 u x x Δ x 2 + u x y Δ x Δ y + 1 2 u y y Δ y 2 y = y 0 + v + ( 1 + v y ) Δ y + v x Δ x + 1 2 v x x Δ x 2 + v x y Δ x Δ y + 1 2 v y y Δ y 2
ξ = x y + u v + u x u y v x v y Δ x Δ y + 2 u x y 2 v x y Δ x Δ y + 2 u x 2 2 u y 2 2 v x 2 2 v y 2 + ( Δ x ) 2 ( Δ y ) 2
where u x x , u y y , u x y , u x x , v x x , v y y and v x y are parameters of the second-order shape functions. The second-order shape function adds second-order deformation terms on top of the first-order shape function, enabling a more accurate description of complex deformations. However, it is also more sensitive to noise interference.

4. Pilot Program

The mechanical parameters [37] of the PMMA plate used in this study are shown in Table 1. Figure 4 illustrates the model dimensions of the PMMA plate used in the experiment, which measured 400 mm×300 mm×8 mm. Two 8 mm diameter blast holes are machined horizontally in the middle of the PMMA plate, with a hole spacing of 100 mm. Five double-hole explosive loading tests were conducted with different delays (0 µs, 5 µs, 15 µs, 40 µs, and 70 µs). The explosive used was lead azide (Pb(N3)2), with a charge of 120 mg per hole. This explosive is characterized by its high detonation energy, rapid detonation growth, resistance to decomposition, moisture resistance, and stability. The parameters of the explosive [38] are shown in Table 2. The detonating device is a multi-channel trigger customized by Dalian Hav Technology Company. The number of output channels is 16, the output signal is 5V, the delay of the output signal is 0.1–2000 us, and the accuracy is 5 ns. The triggering time can be set, respectively. When the multiple channels are set to the same time, the output is synchronized. The priming wire quickly generates a lot of heat, which then causes the explosive to explode.
Prior to the experiment, speckle preparation was necessary, with the following steps: (1) To enhance the brightness contrast, a layer of white matte paint was uniformly sprayed on the PMMA plate; (2) DIC software was used to generate speckle points of varying sizes in a disordered manner. The pixel value of each speckle point should be controlled between 5 and 7, according to the recommendation of Park J. [39]. Then, they were printed onto the PMMA plate to maintain good contrast. The prepared speckle is shown in Figure 5.
During the experiment, the PMMA plate was tightly secured with a fixture to prevent the specimen from shaking due to the shock wave generated by the explosion, thereby reducing experimental errors. After the explosion test concluded, the speckle images captured by the high-speed camera were automatically saved and then analyzed using software.

5. Test Results and Analysis

In rock mechanics experiments, strain compression is usually defined as positive and tension is defined as negative; however, in DIC, the opposite occurs, where strain compression is negative and tension is positive. This paper focuses on the analysis of the full-field strain and performs statistical analysis by taking the absolute values of both the positive and negative strains. The direction of the lines connecting the two blast holes is defined as the y direction, with the x direction perpendicular to it, and the displacement is positive to the left and negative to the right.

5.1. Static Calibration of Speckle Quality

The accuracy of the ultra-high-speed dynamic strain measurement system mainly depends on the image resolution of the high-speed camera and the quality of the spray speckles. Therefore, it is necessary to perform static calibration on the sprayed speckle quality before conducting the experiment. Figure 6 shows a set of static calibration strain–time curves. Figure 6 shows that the measurement errors of DIC strains in the exx and eyy directions are relatively small, ranging from ±26 με to ±9 με, respectively. Therefore, static calibration can enhance the accuracy of full-field strain measurements during explosions.

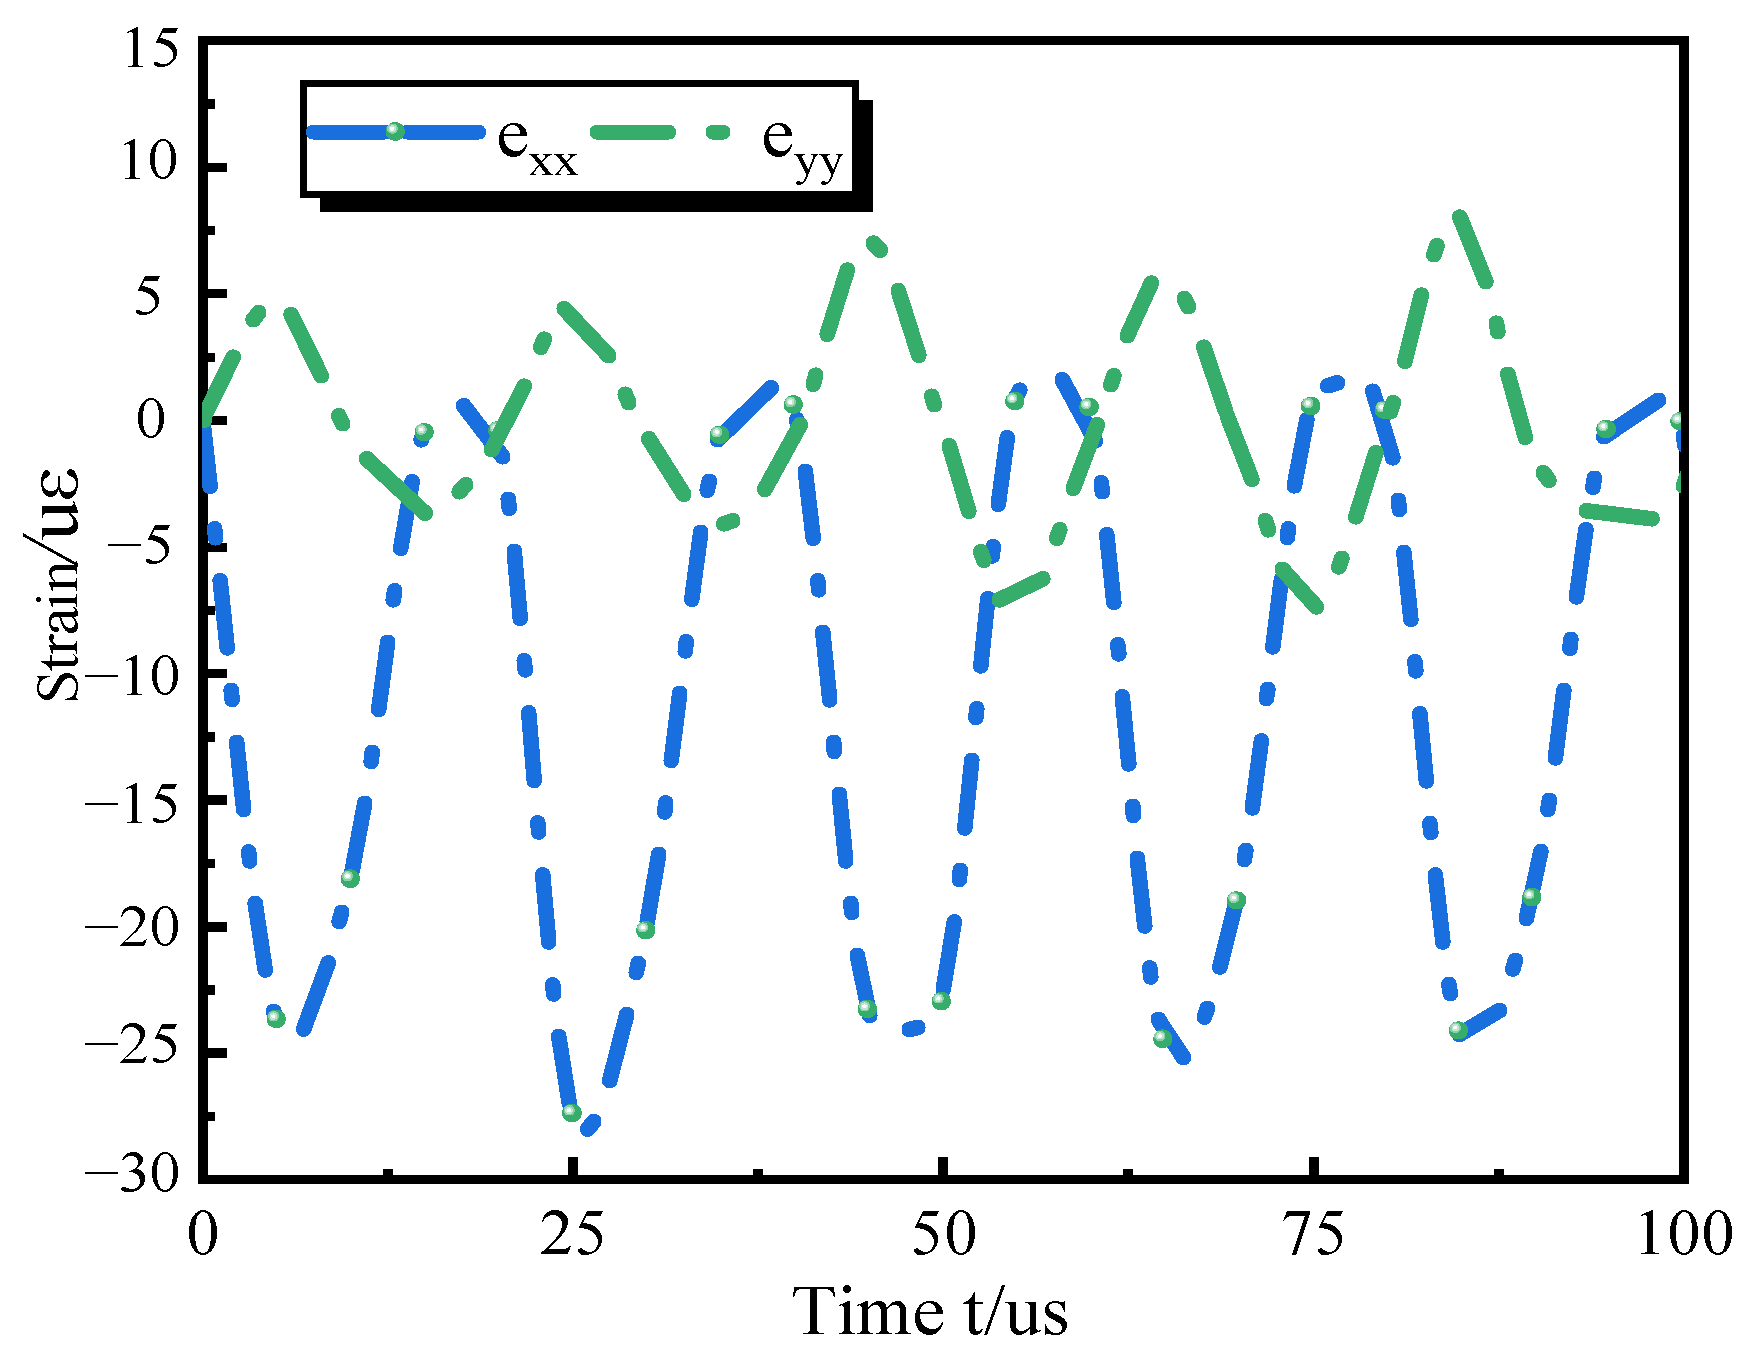
5.2. Evolution of the Principal Strain with Various Delay Times

The distribution characteristics of the strain field around the blast holes within the PMMA plate under explosive loading are determined using 2D-DIC technology. Figure 7 shows the full-field evolution contour maps of the principal strain (e1) under double-hole explosion loading with five delay times (0 µs, 5 µs, 15 µs, 40 µs, and 70 µs). In the figure, the purple zone denotes the compressed region, while the other colored zones represent the tensile region. The arrangement of three monitoring points, P0, P1, and P2, is shown in Figure 5. The strain history reproduced the variation law of the principal strain well through DIC analysis. Figure 8 shows the temporal evolution curves of the principal strain (e1) at monitoring points P0, P1, and P2 under five different delay times. To determine the principal strain, make two to three attempts for each delay.
Figure 7a shows the evolution cloud map of the principal strain of the PMMA plate under a delay of 0 µs. Two symmetric circular compression zones are generated around the blast holes at the instant of detonation in blast holes 1 and 2. Simultaneously, the principal strains at three monitoring points instantly reached their first peak (the first compression principal strain peak), as shown in Figure 8a, with the peaks at points P0, P1, and P2 being 0.001, 0.0024, and 0.00098, respectively. At t = 20 µs, the region around the two blast holes rapidly transitions from compression to tension. By t = 30 µs, due to the impact of the explosion, the energy of the shock wave primarily transfers between the two blast holes, forming symmetrical “barbell”-shaped tensile regions along the line connecting the two blast holes and subsequently extending along the y direction in a “barbell” shape. Until t = 40 µs, the energy of the shock wave begins to diminish, and the tensile principal strain gradually shifts from the y direction to the x direction. By t = 60 µs, the principal strains are concentrated in the region below the line connecting the blast holes, eventually spreading to the edge of the PMMA plate. Throughout this period, the principal strains at the three monitoring points exhibit a consistent, periodic decrease. At t = 170 µs, the principal strains at the three monitoring points exhibit a second peak (the first tensile principal strain peak), with values of 0.0015, 0.0022, and 0.00012, respectively. Compared to the first peak, the principal strain at point P1 decreases, while those at points P0 and P2 increase.
Figure 7b shows the evolution cloud map of the principal strain of the PMMA plate under a delay of 5 µs, where the first blast hole detonated ahead of the second one by 5 µs. Following a brief compression change, the PMMA plate rapidly transitioned to a tensile state. At t = 25 µs, a “barbell”-shaped elongation zone is formed along the connecting lines of the two blasting holes, characterized by a larger left side and a smaller right side, and expands outward in this configuration. At t = 30 µs, the principal strain at the three monitoring points reached its first peak, as shown in Figure 8b, with peak values of 0.00075, 0.0018, and 0.001 at points P0, P1, and P2, respectively. As the principal strain spread across the entire plate, its dominance gradually shifted from the y direction to the x direction. At t = 65 µs, tensile strain predominated and spread across the entire zone, with its intensity gradually decreasing. It was not until t = 80 µs that the tensile strains across the entire zone reached their minimum and then began to gradually increase. At t = 175 µs, the second peak of the principal strain appeared, with values of 0.00115, 0.002, and 0.00108. Compared to those at the first peak, the peak values at points P0 and P1 increased significantly, while the peak value at point P2 remained almost unchanged. Comparing the time intervals between the appearance of the two principal strain peaks at point P1 under 0 µs and 5 µs delays, it was observed that under the 5 µs delay, there was a slight reduction in the time interval between the two principal strain peaks at point P1.
Figure 7c shows the evolution cloud map of the principal strain of the PMMA plate under a delay of 15 µs, where the first blast hole detonated ahead of the second one by 15 µs. Under this delay, the compression state of the first blast hole lasts for 20 µs, which is significantly longer than that of the first and second blast holes under delays of 0 µs and 5 µs, respectively. The first peak values of the principal strain at the three monitoring points are shown in Figure 8c, with peak values of 0.00089, 0.002, and 0.00087 at points P0, P1, and P2, respectively. After being compressed, the PMMA plate immediately transitions to a tensile state, and the tensile region on both sides of the blast holes extends closely behind the compression region. The fundamental reason for this phenomenon is the release of elastic strain energy in the previously compressed region, leading to the formation of a tensile strain region. A “barbell”-shaped tensile region did not form along the line connecting the two blast holes; rather, the tensile region dominated by the first blast hole transitioned to the tensile region dominated by the second blast hole. At t = 125 µs, the principal strain at points P0 and P2 reached a second peak, with values of 0.0027 and 0.0022, respectively. At t = 175 µs, the principal strain at point P1 also reached a second peak, with a value of 0.0022. Under this delay, there was a noticeable difference in the time intervals between the peak values of the principal strain at the three monitoring points, and the second peak value of the principal strain at all three monitoring points increased. Comparing the time intervals between the occurrence of two principal strain peaks at point P1 under 5 µs and 15 µs delays, it was observed that the time interval decreases significantly under the 15 µs delay.
Figure 7d shows the evolution cloud map of the principal strain of the PMMA plate under a delay of 40 µs, where the first blast hole detonated ahead of the second one by 40 µs. Upon detonation of the first blast hole, compression occurs around the hole, and the second blast hole detonates only after the compression state ends and the tensile state begins. Under this delay condition, the superposition effect of strain significantly diminishes. The first peak values of the principal strain at three monitoring points are shown in Figure 8d, with peak values of 0.00063, 0.0012, and 0.001 at points P0, P1, and P2, respectively, under this delay condition. The periods of principal strain at the three monitoring points show significant differences, and the peak values of the principal strain also noticeably decrease. The explosive effect resembles that of a single blast hole detonation. The second peak values of the principal strain at points P1 and P2 are 0.0011 and 0.0012, respectively, while the time of occurrence of the second peak value at point P0 exceeds 200 µs. Under this delay condition, the time interval between the appearance of the two principal strain peaks at point P1 is less than that under the 15 µs delay condition. Figure 7e and Figure 8d show the cloud maps and evolution curves of the principal strain for the double-hole setup under a 70 µs delay. However, the superposition effect of the principal strain e1 is not significant and has minimal mutual influence; thus, no further elaboration is provided here.
Figure 9 shows the relationship between the first compression principal strain peak (ec) and the first tensile principal strain peak (et) at point P1 in the PMMA plate under various delays. The first compression and tensile principal strain peaks exhibit consistent trends as the delay time increases, characterized by an initial decrease, followed by an increase, and then another decrease before increasing again.
From the perspective of the ease of fragmentation between the two blast holes, the magnitudes of the principal strain peaks at point P1 serve as indicators. Under five deferments, the magnitudes of the principal strain peaks are largest at a delay of 0 µs. However, the magnitudes of the principal strain peaks at a 15 µs delay are comparable to those at a 0 µs delay. This indicates the presence of an optimal delay time between 0 µs and 40 µs, during which the magnitudes of the principal strain peaks are comparable to or even larger than those at a delay of 0 µs. (When the delay time exceeds 40 µs, the superposition effect of the strains significantly decreases and is thus not considered.) Additionally, as mentioned earlier, the time interval between the two principal strain peaks at point P1 decreases with increasing delay time, leading to more frequent deformations between the two blast holes. Considering the variations in the magnitudes of the principal strain peaks and the time intervals between them at different delay times, it can be concluded that there is an optimal delay time between 0 µs and 40 µs, which facilitates easier fragmentation between the two blast holes.

5.3. Maximum Principal Strain Law

The maximum principal strains (emax) of five measuring points were extracted under different delays (0 µs, 5 µs, 15 µs, 40 µs, and 70 µs) of double-hole detonation. Figure 4 shows the spatial relationship between the measuring points, with measurements taken at 20 mm intervals along the vertical direction from the centerline between the blast holes. The extracted data were fitted using an exponential function ( ε = A x B ) [40], and Figure 10 shows the variation in the maximum principal strains with distance (x) for the 5 measuring points. The fitting revealed an exponential decay relationship between them, with correlation coefficients (R2) exceeding 0.95, indicating a strong fit. From Figure 10, it can be observed that the attenuation coefficient (A) initially increases, then decreases, and increases again with prolonged delay time, while the attenuation index (B) exhibits the opposite trend. Between 0 and 40 µs, the attenuation velocity of the maximum principal strain first increases and then decreases with the increase in the delay time, and the maximum principal stress at monitoring point No. 1 (near the two holes) is very large at a 0 µs, 5 µs, and 15 µs delay (which is conducive to penetration between the two holes), but the maximum principal strain at monitoring point No. 5 (the far point from the two holes) is significantly reduced at 15 µs delay (reducing disturbance to the far zone). Therefore, in the process of tunnel blasting, there is an optimal delay time of 0~40 µs, which can not only make the surrounding holes well penetrated (the maximum principal stress is large), but also reduce the disturbance to the surrounding rock. The effect of a reasonable delay time of the surrounding holes on the blasting process of the tunnel is shown in Figure 11.

5.4. Trends in Displacement under Different Delay Times

Figure 12 shows the displacement field characteristics of double-hole detonations under different delays, depicting the displacement vector field obtained from DIC measurements at the peak strain state. The densely distributed small arrows in the figure represent the displacement vector field, while the large arrows indicate the overall displacement trend of the PMMA plate (the rigid body displacement of the specimen was removed during calculations to accurately assess the microdeformation displacements at each point on the PMMA plate surface). The displacement field enables the determination of the tensile, compressive, and shear situations experienced by the PMMA plate.
Figure 12a shows the overall displacement trend of the PMMA plate under a 0 μs delay, revealing an almost mirrored relationship between the upper and lower parts of the overall displacement. In the region between the two blast holes, the displacement trend is downward in the upper part, while at the left and right ends of the lower part, the displacement trends are upward and downward, respectively. A distinct boundary line forms in the vertical direction between the two blast holes, where shear failure is prone to occur. From Figure 13, the average displacement (V) at monitoring points P0, P1, and P2 is determined to be 0.0062 mm, 0.015 mm, and 0.0035 mm, respectively.
Figure 12b shows the overall displacement trend of the PMMA plate under a 5 μs delay, where the upper and lower parts of the overall displacement still exhibit a mirrored relationship. In the vertical direction along the line connecting the two blast holes, there is a slight stretching motion in a small zone at the right end of blast hole 2, which is prone to tensile failure. Conversely, at the left end of blast hole 1, a majority of the zone experiences opposing compression motion. According to Figure 13, the average displacement at monitoring points P0, P1, and P2 is determined to be 0.0018 mm, 0.02 mm, and 0.0051 mm, respectively.
Figure 12c shows the overall displacement trend of the PMMA plate under a 15 μs delay, where the differentiation between the upper and lower parts of the overall displacement becomes more pronounced. To the left of blast hole 1, there is a leftward movement, whereas a substantial stretching motion is observed on the right side of blast hole 2, and the stretching area becomes larger, making the area prone to tensile failure. According to Figure 13, the average displacement at monitoring points P0, P1, and P2 is determined to be 0.0044 mm, 0.0062 mm, and 0.011 mm, respectively.
Figure 12d depicts the displacement trend of the PMMA plate under a 40 μs delay, where the region between the two blast holes is primarily under tensile motion, making this zone highly prone to tensile failure. According to Figure 13, the average displacement at monitoring points P0, P1, and P2 is determined to be 0.016 mm, 0.0163 mm, and 0.009 mm, respectively. The displacement trend of the PMMA plate with a 70 μs delay closely resembles that with a 40 μs delay, exhibiting smaller average displacements compared to the preceding four delays, which will not be described further.
Generally, rocks exhibit significantly lower shear and tensile strengths than compressive strengths, making them prone to tensile and shear failures. It can be seen from the above analysis that with the extension of the delay time, the shear state between the two holes gradually changes to the tensile state, and the area prone to tensile failure increases. When the delay time exceeds 40 μs, the effect of stress superposition becomes insignificant and is therefore not considered. Comparing the average displacement of point P1 under different delay times, it is observed that under deferments of 5 μs and 40 μs, the average displacement of P1 is significantly larger than that under a delay of 0 μs, and the average displacements of points P0 and P2 are also larger under a delay of 40 μs. Considering the size of the zone prone to damage between the two blast holes and the average displacement of point P1 under different delay times, it is further demonstrated that there exists an optimal delay time between 0 μs and 40 μs, leading to better blasting effects.

6. Conclusions

The 2D DIC technique was used to measure the double hole blast simulation tests in PMMA plates at different delay times to obtain the full field strain maps, principal strains, and displacement, and the following conclusions were drawn:
(1)
The propagation speed of explosion stress waves in the PMMA board is extremely fast, with an explosion process occurring on the order of microseconds. Combined with a high-speed camera with a frame rate of 20,000 fps, the DIC system enables full-surface visualization of the explosive deformation of a 400 × 300 mm PMMA board.
(2)
There is an optimal delay time between 0 µs and 40 µs, which makes the compressive and tensile principal strain peaks between the two holes larger, and the time interval between the two principal strain peaks shorter (more frequent deformation), thus making the penetration fracture between the two holes more likely.
(3)
The maximum principal strain at different points on the vertical line between two blasting holes decreases exponentially with the increase in distance from the blasting center. In the delay time between 0 µs and 40 µs, there is a delay time that can not only ensure a good penetrating fracture between two blasting holes, but also reduce the impact on other areas.
(4)
In the delay time of 0~40 µs, with the extension of the delay time, the displacement trend between the two holes changes from shear to tensile, and the vulnerable damage area gradually becomes larger, thus making the damage between the two holes more likely to occur.
(5)
In the blasting process, choosing a reasonable delay time can not only improve the crushing effect of rock, but also reduce the damage to other areas to a certain extent.

Author Contributions

Methodology, data curation, writing—original draft preparation, Z.Z. and J.M.; experimental supervisor, J.W. and S.G.; theoretical analysis, Y.Y. and X.Z.; formal analysis and writing—review and edit, all authors. All authors have read and agreed to the published version of the manuscript.

Funding

This work was supported by the National Natural Science Foundation of China, the Yunnan Provincial Basic Research Program, and the Major Science and Technology Special Program in Yunnan Province (Nos. 52274083, 202201AT070178, and 202202AG050014).

Data Availability Statement

Data are contained within the article.

Conflicts of Interest

The authors declare no conflicts of interest.

References

  1. Yang, H.G.; Kim, S.J.; Min, A.J. Advancement of blast effect by inducing drill jumbo on automatic drilling system. Explos. Blasting 2016, 34, 10–17. [Google Scholar]
  2. Zhang, Z.; Hosseini, S.; Monjezi, M.; Yari, M. Extension of reliability information of Z-numbers and fuzzy cognitive map: Development of causality-weighted rock engineering system to predict and risk assessment of blast-induced rock size distribution. Int. J. Rock Mech. Min. Sci. 2024, 178, 105779. [Google Scholar] [CrossRef]
  3. Sun, Q.; Wang, Q.; Yang, L. Explosion loading model experiment system based on DlC and its application. Res. Explor. Lab. 2018, 37, 87–91. [Google Scholar]
  4. Ylitalo, R.M.; Zhang, Z.-X.; Pekka, B. Effect of detonator position on rock fragmentation: Full-scale field tests at Kevitsa open pit mine. Int. J. Rock Mech. Min. Sci. 2021, 147, 104918. [Google Scholar] [CrossRef]
  5. Zhang, Z.-X.; Ouchterlony, F. Energy requirement for rock breakage in laboratory experiments and engineering operations: A review. Rock Mech. Rock Eng. 2022, 55, 629–667. [Google Scholar] [CrossRef]
  6. Johansson, D.; Ouchterlony, F. Shock wave interactions in rock blasting: The use of short delays to improve fragmentation in model-scale. Rock Mech. Rock Eng. 2013, 46, 1–18. [Google Scholar] [CrossRef]
  7. Hashemi, S.A.; Katsabanis, P. The effect of stress wave interaction and delay timing on blast-induced rock damage and fragmentation. Rock Mech. Rock Eng. 2020, 53, 2327–2346. [Google Scholar] [CrossRef]
  8. Ding, W.; Liu, D. Blasting-induced peak particle velocity prediction of hole-by-hole blasting operation using digital electronic detonator in open-pit mine. Earth Sci. 2023, 48, 2000–2010. [Google Scholar]
  9. Han, B.; Ma, Q. Research on testing and controlling techniques of millisecond delay blasting vibration in coal mine rock roadway. J. China Coal Soc. 2013, 38, 209–214. [Google Scholar]
  10. Zhang, X.; Yan, P.; He, H.; Zhang, X.; Lu, W.; Liu, B.; Zhu, J.; Wang, X.; Cheng, Y. Experimental investigations of the effect of millisecond-delay time on the blast vibration reduction with electronic detonators. J. Vib. Control 2023, 29, 17–18. [Google Scholar] [CrossRef]
  11. Choi, S.-O. A Study on Delay Time Control for Lowering Grounding Vibration and Noise Induced by Blasting. Explos. Blasting 2014, 32, 18–25. [Google Scholar]
  12. Li, Q.; Yu, Q.; Zhang, D.; Cheng, Y.; Peng, Y.; Feng, D. Metro tunnel precisely controlled blasting’s delay time optimization and its application. J. Vib. Shock 2018, 37, 135–140+170. [Google Scholar]
  13. Xu, H.; Lu, W.; Chen, M.; Li, R. Study on superposition effect of blasting vibration induced by delay error of detonators using genetic algorithm. Rock Soil Mech. 2008, 29, 1900–1904. [Google Scholar]
  14. Sharma, M.; Choudhary, B.S.; Kumar, H.; Agrawal, H. Optimization of delay sequencing in multi-row blast using single hole blast concepts. J. Inst. Eng. (India) Ser. D 2021, 102, 453–460. [Google Scholar] [CrossRef]
  15. Rossmanith, H.P.; Kouzniak, N. Supersonic detonation in rock mass-part 2: Particle displacements and velocity fields for single and multiple non-delayed and delayed detonating blastholes. Fragblast 2004, 8, 95–117. [Google Scholar] [CrossRef]
  16. Rossmanith, H.P. The use of Lagrange diagrams in precise initiation blasting. Part I: Two interacting blastholes. Fragblast 2002, 6, 104–136. [Google Scholar] [CrossRef]
  17. Liang, X.; Ding, C.; Zhu, X.; Zhou, J.; Chen, C.; Guo, X. Visualization study on stress evolution and crack propagation of jointed rock mass under blasting load. Eng. Fract. Mech. 2024, 296, 109833. [Google Scholar] [CrossRef]
  18. Tang, H.-L.; Liu, X.; Yang, J.; Yu, Q. V Experimental study on the influence of delay time on rock fragmentation in bench blasting. Appl. Sci. 2023, 13, 85. [Google Scholar] [CrossRef]
  19. Li, C.; Yang, R.; Wang, Y.; Kang, Y.; Zhang, Y.; Xie, B. Theoretical and numerical simulation investigation of deep hole dispersed charge cut blasting. Int. J. Coal Sci. Technol. 2023, 10, 15. [Google Scholar] [CrossRef]
  20. Yamaguchi, I. A laser-speckle strain gauge. J. Phys. E Sci. Instrum. 1981, 14, 1270–1273. [Google Scholar] [CrossRef]
  21. Yuan, Y.; Pan, P.; Zhao, S.; Wang, B.; Song, G. The failure process of marble with filled crack under uniaxial compression based on digital image correlation. Chin. J. Rock Mech. Eng. 2018, 37, 339–351. [Google Scholar]
  22. Zhao, S.; Tian, J.; Matsuda, H.; Zhao, C.; Bao, C. Crack propagation and damage of rock under uniaxial compression based on global strain field analysis. Chin. J. Rock Mech. Eng. 2015, 34, 763–769. [Google Scholar]
  23. Zhu, X.; Fan, J.; He, C.; Tang, Y. Identification of crack initiation and damage thresholds in sandstone using 3D digital image correlation. Theor. Appl. Fract. Mech. Eng. 2022, 122, 103653. [Google Scholar] [CrossRef]
  24. Qiao, Y.; Guan, X.-B.; Zhang, Z.-X. Experimental study on crack propagation pattern and fracture process zone evolution based on far-field displacement by using DIC. Sci. Rep. 2023, 13, 19523. [Google Scholar] [CrossRef] [PubMed]
  25. Liu, X.; Yang, J.; Xu, Z.; Guo, L.; Tang, H. Experimental investigations on crack propagation characteristics of granite rectangle plate with a crack (GRPC) under different blast loading rates. Shock Vib. 2020, 2020, 1–18. [Google Scholar] [CrossRef]
  26. Xing, H.; Zhao, J.; Wu, G.; Ruan, D.; Dehkhoda, S.; Lu, G.; Zhang, Q. Perforation model of thin rock slab subjected to rigid projectile impact at an intermediate velocity. J. Impact Eng. 2020, 139, 103536. [Google Scholar] [CrossRef]
  27. Ding, C.; Yang, R.; Feng, C.; Tang, Y. Stress wave superposition effect and crack initiation mechanism between two adjacent boreholes. Int. J. Rock Mech. Min. Sci. 2021, 138, 104622. [Google Scholar] [CrossRef]
  28. Kakogiannis, D.; Verleysen, P.; Belkassem, B.; Coghe, F.; Rabet, L. Multiscale modelling of the response of Ti-6AI-4V sheets under explosive loading. J. Impact Eng. 2018, 119, 1–13. [Google Scholar] [CrossRef]
  29. Chen, P.; Zhou, Z.; Ma, S.; Ma, Q.; Huang, F. Measurement of dynamic fracture toughness and failure behavior for explosive mock materials. Front. Mech. Eng. 2011, 6, 292–295. [Google Scholar] [CrossRef]
  30. Xu, Z.; Yang, J.; Guo, L. Study of the splitting crack propagation morphology using high-speed 3D DIC. Explos. Shock Waves 2016, 36, 400–406. [Google Scholar]
  31. Aune, V.; Fagerholt, E.; Hauge, K.O.; Langseth, M.; Borvik, T. Experimental study on the response of thin aluminium and steel plates subjected to airblast loading. J. Impact Eng. 2016, 90, 106–121. [Google Scholar] [CrossRef]
  32. Arora, H.; Del Linz, P.; Dear, J.P. Damage and deformation in composite sandwich panels exposed to multiple and single explosive blasts. Int. J. Impact Eng. 2017, 104, 95–106. [Google Scholar] [CrossRef]
  33. Takahashi, Y.; Kubota, S.; Saburi, T. Influence of partially dense regions near free surface on stress wave interference and crack propagation in laboratory blasting tests. Sci. Technol. Energ. Mater. 2022, 84, 103–110. [Google Scholar]
  34. Sun, Q.; Wang, Q.; Liu, G.; Li, X. Proximity side blasting based on ultra-high speed DIC method strain field analysis of subway tunnels. J. Min. Sci. Technol. 2018, 3, 39–45. [Google Scholar]
  35. Cheng, B.; Li, D. Full-field dynamic measurement method for fatigue cracks based on decorrelation DIC. Chin. J. Theor. Appl. Eng. 2022, 54, 1040–1050. [Google Scholar]
  36. Lu, H.; Cary, P.D. Deformation measurements by digital image correlation: Implementation of a second-order displacement gradient. Exp. Mech. 2000, 40, 393–400. [Google Scholar] [CrossRef]
  37. Yue, Z.; Zhang, S.; Qiu, P.; Song, Y.; Lu, Y.; Sun, Y. Mechanism of explosive crack propagation with slotted cartridge millisecond blasting. J. China Coal Soc. 2018, 43, 638–645. [Google Scholar]
  38. Yang, R.; Ding, C.; Yang, L.; Lei, Z.; Zheng, C. Study of decoupled charge blasting based on high-speed digital image correlation method. Tunn. Undergr. Space Technol. 2019, 83, 51–59. [Google Scholar] [CrossRef]
  39. Park, J.; Yoon, S.; Kwon, T.-H.; Park, K. Assessment of speckle-pattern quality in digital image correlation based on gray intensity and speckle morphology. Opt. Lasers Eng. 2017, 91, 62–72. [Google Scholar] [CrossRef]
  40. Wu, X.; Gong, M.; Wu, H.; Hu, G.; Wang, S. Vibration reduction technology and the mechanisms of surrounding rock damage from blasting in neighborhood tunnels with small clearance. Int. J. Min. Sci. Technol. 2003, 33, 625–637. [Google Scholar] [CrossRef]
Figure 1. Software interface schematic.
Processes 12 01291 g001
Figure 2. The DIC test system and test procedure. (a) Test system; (b) Test procedure.
Processes 12 01291 g002
Figure 3. The basic schematic of the DIC.
Processes 12 01291 g003
Figure 4. Size parameters of the PMMA plate.
Processes 12 01291 g004
Figure 5. Speckles on the PMMA plate.
Processes 12 01291 g005
Figure 6. Static calibration of DIC measurement.
Processes 12 01291 g006
Figure 7. Evolution cloud map of the principal strain under different delay times. (a) The evolution cloud map of the principal under a delay of 0 µs; (b) The evolution cloud map of the principal under a delay of 5 µs; (c) The evolution cloud map of the principal under a delay of 15 µs; (d) The evolution cloud map of the principal under a delay of 40 µs; (e) The evolution cloud map of the principal under a delay of 15 µs.
Processes 12 01291 g007aProcesses 12 01291 g007b
Figure 8. Time-history evolution curves of the principal strain at three monitoring points under different delay times. (a) The change in the principal strain time history under a 0 μs delay time; (b) The change in the principal strain time history under a 5 μs delay time; (c) The change in the principal strain time history under a 15 μs delay time; (d) The change in the principal strain time history under a 40μs delay time; (e) The change in the principal strain time history under a 70 μs delay time.
Processes 12 01291 g008
Figure 9. Variation of the first compressive principal strain peak and the first tensile principal strain peak under different delay times.
Processes 12 01291 g009
Figure 10. Decay pattern of maximum principal strains with measurement distance for five monitoring points.
Processes 12 01291 g010
Figure 11. The blasting diagram of the tunnel blasting surrounding the hole under reasonable delay time.
Processes 12 01291 g011
Figure 12. Displacement change trend under different delay times. (a) The displacement trend under a 0 μs delay; (b) The displacement trend under a 5 μs delay; (c) The displacement trend under a 15 μs delay; (d) The displacement trend under a 40 μs delay; (e) The displacement trend under a 70 μs delay.
Processes 12 01291 g012aProcesses 12 01291 g012b
Figure 13. The average displacement V of three monitoring points under different delay times.
Processes 12 01291 g013
Table 1. Dynamic mechanical parameters of PMMA material.
Longitudinal Wave Velocity/(m·s−1)Shear Wave Speed/(m·s−1)Elastic Modulus/GPaPoisson RatioOptical Constant/(m2·N−1)
232012606.10.280.85 × 10−10
Table 2. Relevant detonation parameters of Pb(N3)2.
Charge Density/g·cm−3Critical capacity/L·kg−1Explosion heat/°CExplosive Velocity/m·s−1Explosive Pressure/GPa
2.51308305044789.31
Disclaimer/Publisher’s Note: The statements, opinions and data contained in all publications are solely those of the individual author(s) and contributor(s) and not of MDPI and/or the editor(s). MDPI and/or the editor(s) disclaim responsibility for any injury to people or property resulting from any ideas, methods, instructions or products referred to in the content.

