Article

Influence Factors of Pressure Swing Adsorption for Oxygen Production by the Orthogonal Method and the Response Surface Method

School of Mechanical and Electrical Engineering, Anhui Jianzhu University, Hefei 230009, China
*
Author to whom correspondence should be addressed.
Processes 2024, 12(7), 1306; https://doi.org/10.3390/pr12071306
Submission received: 8 May 2024 / Revised: 4 June 2024 / Accepted: 17 June 2024 / Published: 24 June 2024
(This article belongs to the Section Separation Processes)

Abstract

:
Adsorption pressure is one of the important factors affecting oxygen production in the process of pressure swing adsorption oxygen production. Three important factors, namely, the adsorption period, pressure equalisation time, and outlet flow rate, determine the variation in the adsorption pressure. In this study, the effects of the adsorption period, pressure equalisation time, and outlet flow rate on oxygen concentration were investigated through orthogonal experiments and response surface analysis. The experiments verified that three factors including the adsorption period, pressure equalisation time, and outlet flow rate have optimal values in the oxygen production process. Response surface analysis showed that the adsorption period had the greatest effect on the oxygen concentration, followed by the equalisation time, and the outlet flow rate had the least effect. The optimum process conditions are an adsorption time of 7.88 s, a pressure equalisation time of 0.9 s, an outlet flow rate of 2.31 L/min, and an oxygen concentration of 96.7%.

1. Introduction

Oxygen is an essential life element for the human body, while oxygen is necessary for our survival [1]. Normally, the oxygen content in the air is about 21%, and the human body is able to live normally within an oxygen concentration range of 19.5% to 23.5% [2]. However, when the oxygen concentration exceeds this range, becoming either too low or too high, it may pose some risk to human and production safety. The human body may experience a variety of symptoms when exposed to thin air or oxygen-deprived environments. When an aircraft is in flight, the atmospheric pressure gradually decreases as the altitude rises, resulting in a decrease in the partial pressure of the oxygen in the indoor and outdoor air, and members of an onboard crew may not be able to obtain sufficient oxygen to meet their physiological needs [3]. Similarly, hypoxia may occur in highland areas because of increasing altitude, decreasing atmospheric pressure, and decreasing partial pressure of oxygen in indoor and outdoor air. In addition, closed environments have restricted gas flows and relatively low oxygen levels, increasing the risk of hypoxia. Oxygen deprivation can cause damage to the functioning of various body systems, and in serious cases can even endanger life, so effective measures must be taken to protect health [4]. In such cases, supplemental oxygen is the best treatment, so the cost-effective separation of high-purity oxygen from air is critical to the oxygen industry. At present, oxygen production is divided into physical and chemical methods, but chemical methods have certain safety hazards. Therefore, the development of oxygen technology tends to be more towards physical methods, of which the most commonly used is air separation technology [5]. At home and abroad, a variety of air separation oxygen production processes have been developed, such as low-temperature deep-cooling oxygen production, membrane separation oxygen production, pressure swing absorption oxygen production, and coupled air separation oxygen production. Among them, pressure swing adsorption (PSA) oxygen generation has the following advantages over other oxygen generation methods: 1. Low energy consumption. PSA oxygen production is generally operated at room temperature, which can save energy consumption for heating or cooling, the main energy consumption in the compressor. 2. The process is simple and can be fully automated. 3. The oxygen concentration produced is high. The PSA oxygen production process can make the oxygen concentration as high as 90%, and the oxygen concentration can be adjusted.
Pressure swing adsorption is a widely used oxygen generation technology that separates oxygen from air by alternating adsorption and desorption between high and low pressures [6]. In the pressure swing adsorption cycle, the weakly adsorbed or slowly diffusing components in the air can be highly concentrated, while the strongly adsorbed or rapidly diffusing components are adsorbed by molecular sieves and collected as by-product gases in the desorption process. The concentration and flow rate of the oxygen produced from the experimental setup varies with time. The oxygen concentration is generally the primary indicator in real industrial production, so whether the oxygen concentration can meet the target requirements is the first condition to judge the production performance of the plant. However, the purity of oxygen in the PSA oxygen production process is affected by many factors. These are mainly the nature of the adsorbent, adsorption pressure, adsorption tower structure, and other process parameters during operation, among which adsorption pressure is one of the important factors affecting oxygen production [7]. However, when the number of molecular sieves and the compressor power are certain in the cyclic oxygen production process of adsorption at elevated pressures, pressure equalisation, and desorption at reduced pressures, three important factors, namely, the adsorption cycle, pressure equalisation time, and outlet flow rate, determine the variation in the adsorption pressure, which, in turn, affects the yield and purity of oxygen. Therefore, for pressure swing adsorption oxygen generation systems, it is very important to study the correspondence between the operating parameters and the oxygen production concentration and optimise the operating parameters.
Pressure swing adsorption (PSA) oxygen technology has a wide range of applications in healthcare, plateau oxygen supplementation, home oxygen therapy, etc. It has been favoured by many scholars, and many researchers have carried out many studies on the PSA oxygen process. A research institute in Tianjin [7] analysed the effects of altitude, adsorption time, and pressure equalisation time on oxygen production using the response surface method. It was found that the effect of altitude was the largest, adsorption time was the second largest, and pressure equalisation time was the smallest. The effect of altitude on oxygen production can be slowed down by prolonging the adsorption time and pressure equalisation time. A research institute in Beijing [8,9,10,11,12,13] explored the effects of adsorption time, pressure equalisation time, cleaning time, and product gas flow rate on oxygen production at different altitudes. The discharge gas pressurisation process of rapid PSA oxygen production was studied. The results showed that prolonging the adsorption time and pressure equalisation time could effectively increase the oxygen concentration and oxygen production. It was found that the oxygen concentration could be increased using the combined pressurisation process of the discharge gas and raw gas. However, the oxygen recovery rate was low. A research institute in Prague [14,15] studied the process characteristics of oxygen separation from air in a two-bed variable pressure adsorption oxygen plant. The adsorption pressure and adsorption cycle were analysed. A research institute in the United States [16] investigated the effects of the duration of the adsorption step and the purge flow rate on the performance of a variable pressure adsorption unit. The performance was tracked by three key performance indicators including purity, recovery, and total productivity. A Russian research institute [17] focused on the optimisation and analysis of a pressure swing adsorption process for the production of oxygen from air under uncertain conditions. Their optimisation method helped determine the optimal adsorbent bed pressure swing period, feed flow control strategy, and other operating parameters. Additionally, the authors proposed a method that balanced yield and purity to make more informed decisions under uncertain conditions. A research institute in India [18] systematically explored the effects of various parameters on oxygen yield and purity during the PSA process through a parametric study. These parameters included adsorbent selectivity, pressure swing cycle, and feed gas flow rate. Both experimental and simulation studies were conducted under different conditions to understand the relationship between these parameters and oxygen yield and purity. These research efforts have explored the impact of individual operating parameters on the performance of the PSA process in oxygen production. However, most of these studies are experimental and focus on individual parameters. The interrelationships among these parameters and the extent of their respective influences on oxygen concentration remain unclear. It is challenging to quantitatively analyse the interactions and influence patterns between these parameters.
In this paper, we focus on oxygen concentration as the primary research objective and investigate the process characteristics of oxygen production via pressure swing adsorption. Through orthogonal experiments, we obtain the change rules of oxygen concentration concerning the adsorption cycle, equalisation time, and outlet flow rate. Furthermore, we employ multiple regression analysis to analyse the data systematically, uncovering the interrelationships between oxygen concentration and each operating parameter, as well as the synergistic effects of these parameters on the comprehensive impact of the PSA oxygen production process. This study provides valuable insights into improving the PSA process for oxygen production and offers a new perspective for future research and application of pressure swing adsorption in oxygen generation.

2. Principle

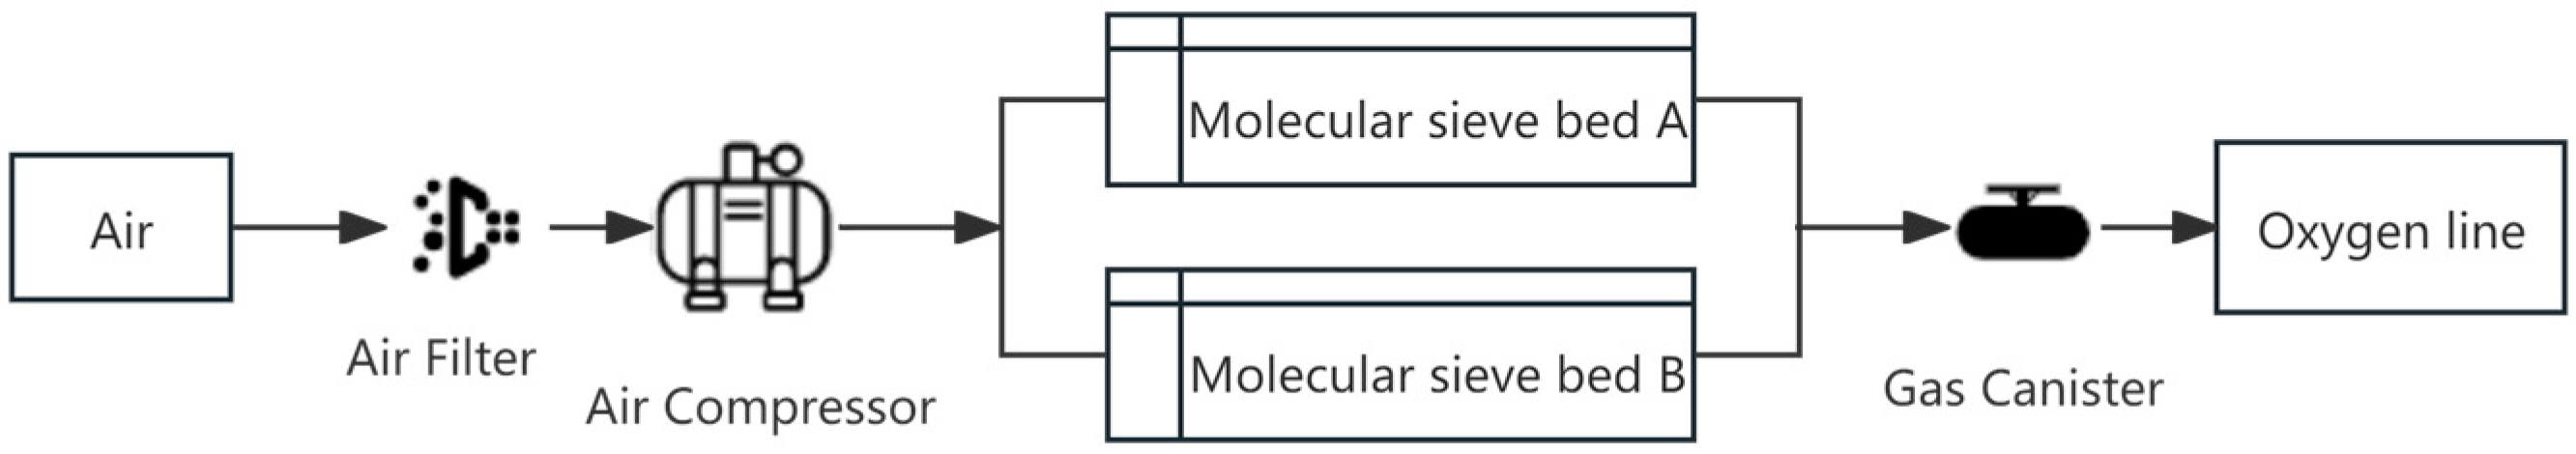
2.1. PSA Oxygen Process Analysis

The PSA oxygen generation system studied in this paper consists of air filters, air compressors, molecular sieve beds, storage tanks, and other components. It operates on the principle of pressure swing adsorption to produce oxygen. Two molecular sieve beds are used to alternate between pressure adsorption of oxygen and decompression desorption of nitrogen in a continuous cycle, resulting in the continuous output of oxygen-rich product gas. The system workflow is illustrated in Figure 1. The air compressor draws in air from the surroundings, compressing it before it passes through the system’s filters and into a pressure reducer. The low-pressure compressed gas is then directed through a distribution valve into one of the molecular sieve beds. Within the molecular sieve bed, nitrogen is largely adsorbed, while oxygen is minimally adsorbed, leading to the production of oxygen-enriched product gas. This oxygen-enriched gas flows through a check valve into a storage tank. Simultaneously, a portion of the gas flows through a flushing orifice to the second molecular sieve bed, aiding in nitrogen discharge. Once the first molecular sieve bed becomes saturated with nitrogen, it ceases to receive air supply. Nitrogen is then desorbed and discharged to the atmosphere via an exhaust port, facilitated by the distribution valve. During this desorption phase, the second molecular sieve bed is supplied with low-pressure gas and begins producing oxygen-enriched product gas. This gas flows into the storage tank through a check valve, and in reverse through the rinsing orifice, flushing out nitrogen from the first molecular sieve bed to complete its regeneration. This continuous cycle allows the PSA system to produce a steady supply of oxygen-rich product gas. The use of two molecular sieve beds working in tandem, along with the gas storage tank, ensures the system operates efficiently and consistently.
Based on the Skarstrom cycle, which employs a two-bed, five-step PSA oxygen production process, including steps such as pressurised adsorption, equal pressure drop, desorption, backwash, and equal pressure rise, this process can effectively improve both oxygen recovery and production efficiency [19]. Taking molecular sieve bed A as an example, the cycle adsorption process is described as follows:
(1)
Pressurised Adsorption: The feed gas is introduced into molecular sieve bed A for pressurisation. During this phase, the molecular sieve adsorbs nitrogen, and the oxygen-enriched product gas is discharged from the top of the adsorption tower;
(2)
Equalisation of the Pressure Drop: Upon completion of the adsorption step, the high-pressure gas in molecular sieve bed A is transferred to adsorption tower group B for pressure equalisation, effectively utilising the remaining gas and pressure energy in molecular sieve bed A;
(3)
Desorption: Following the equal pressure drop phase, the pressure in the tower decreases, initiating desorption. The nitrogen adsorbed by the molecular sieve is expelled from the bottom of the tower;
(4)
Blowback Rinsing: A portion of the product gas from molecular sieve bed B enters molecular sieve bed A through its outlet end to perform blowback rinsing. This step helps release the nitrogen adsorbed in molecular sieve bed A, enhancing the nitrogen adsorption capacity of the molecular sieve for the next cycle;
(5)
Pressure Equalisation: The high-pressure gas in molecular sieve bed B is introduced into molecular sieve bed A to equalise the pressure, rapidly increasing the pressure in adsorption tower group A.

2.2. PSA Oxygen Performance Characterisation

In the industrial production of PSA oxygen, the following three key parameters are used to describe the production performance of an oxygen plant:
(1)
Oxygen Concentration: In the PSA oxygen cycle, components of the air are separated according to their adsorption capacity and diffusion rate. Components with weaker adsorption capacity or slower diffusion rates achieve higher concentrations. Conversely, components with higher adsorption capacity or faster diffusion rates are adsorbed by the molecular sieve and expelled as by-product gases during the desorption process. The oxygen concentration refers to the average volume fraction of oxygen. Since the concentration and flow rate of oxygen produced from an experimental setup vary over time, the oxygen concentration is a primary indicator in actual industrial production. Achieving the target concentration is crucial for assessing the unit’s production performance.
(2)
Recovery Rate: The recovery rate is the ratio of the oxygen content in the product gas to that in the feed gas. In the PSA oxygen production process, the recovery rate can be enhanced by incorporating additional steps (e.g., the pressure equalisation step) or by increasing the number of beds. Typically, the oxygen recovery rate reflects the energy consumption—an increase in recovery correlates with a decrease in energy usage. Therefore, the recovery rate significantly influences the economic value of the separation process and is a key factor in assessing whether the process is economically efficient.
(3)
Production Capacity of the Molecular Sieve: This parameter refers to the flow rate of the product gas or the amount of pure oxygen produced per unit weight of the molecular sieve per unit time. For a given separation process, the product concentration is usually predetermined. Energy consumption is generally proportional to the recovery rate. However, the production capacity per unit of the molecular sieve directly reflects the plant’s production performance. A higher capacity implies that less molecular sieve is required to meet a given product gas flow requirement, thereby reducing the bed size in the production unit. Consequently, the capacity of the molecular sieve is a determining factor for the equipment cost in the separation process.
In this paper, oxygen concentration is used as a key performance metric. A detailed analysis of this parameter provides insights into the production performance of the PSA oxygen generation system.

3. Experiment

3.1. Qualitative Analysis of the Oxygen Production Process on the Effectiveness of Oxygen Production

The nature of the adsorbent, adsorption pressure, adsorption tower structure, and other operational process parameters are the main factors influencing the effectiveness of variable pressure adsorption for oxygen production. Among these factors, adsorption pressure is particularly crucial [20,21]. In the oxygen production process, the cycles of boost adsorption, pressure equalisation, and pressure reduction are pivotal. When the molecular sieve dosage and compressor power are kept constant, the variation in adsorption pressure is influenced by three key factors as follows: the variable pressure adsorption cycle, the equalisation time, and the outlet flow rate. Optimising the interaction among these factors is essential for maintaining the oxygen generator at its optimal adsorption pressure [22], thus achieving effective adsorption separation. Therefore, through orthogonal experiments, the levels of these relevant parameters were systematically adjusted. The effects on the oxygen production concentration were assessed under various conditions of adsorption cycles, equalisation times, and outlet flow rate conditions. This study is significant as it further enhances the adsorption process and performance of the oxygen generator.

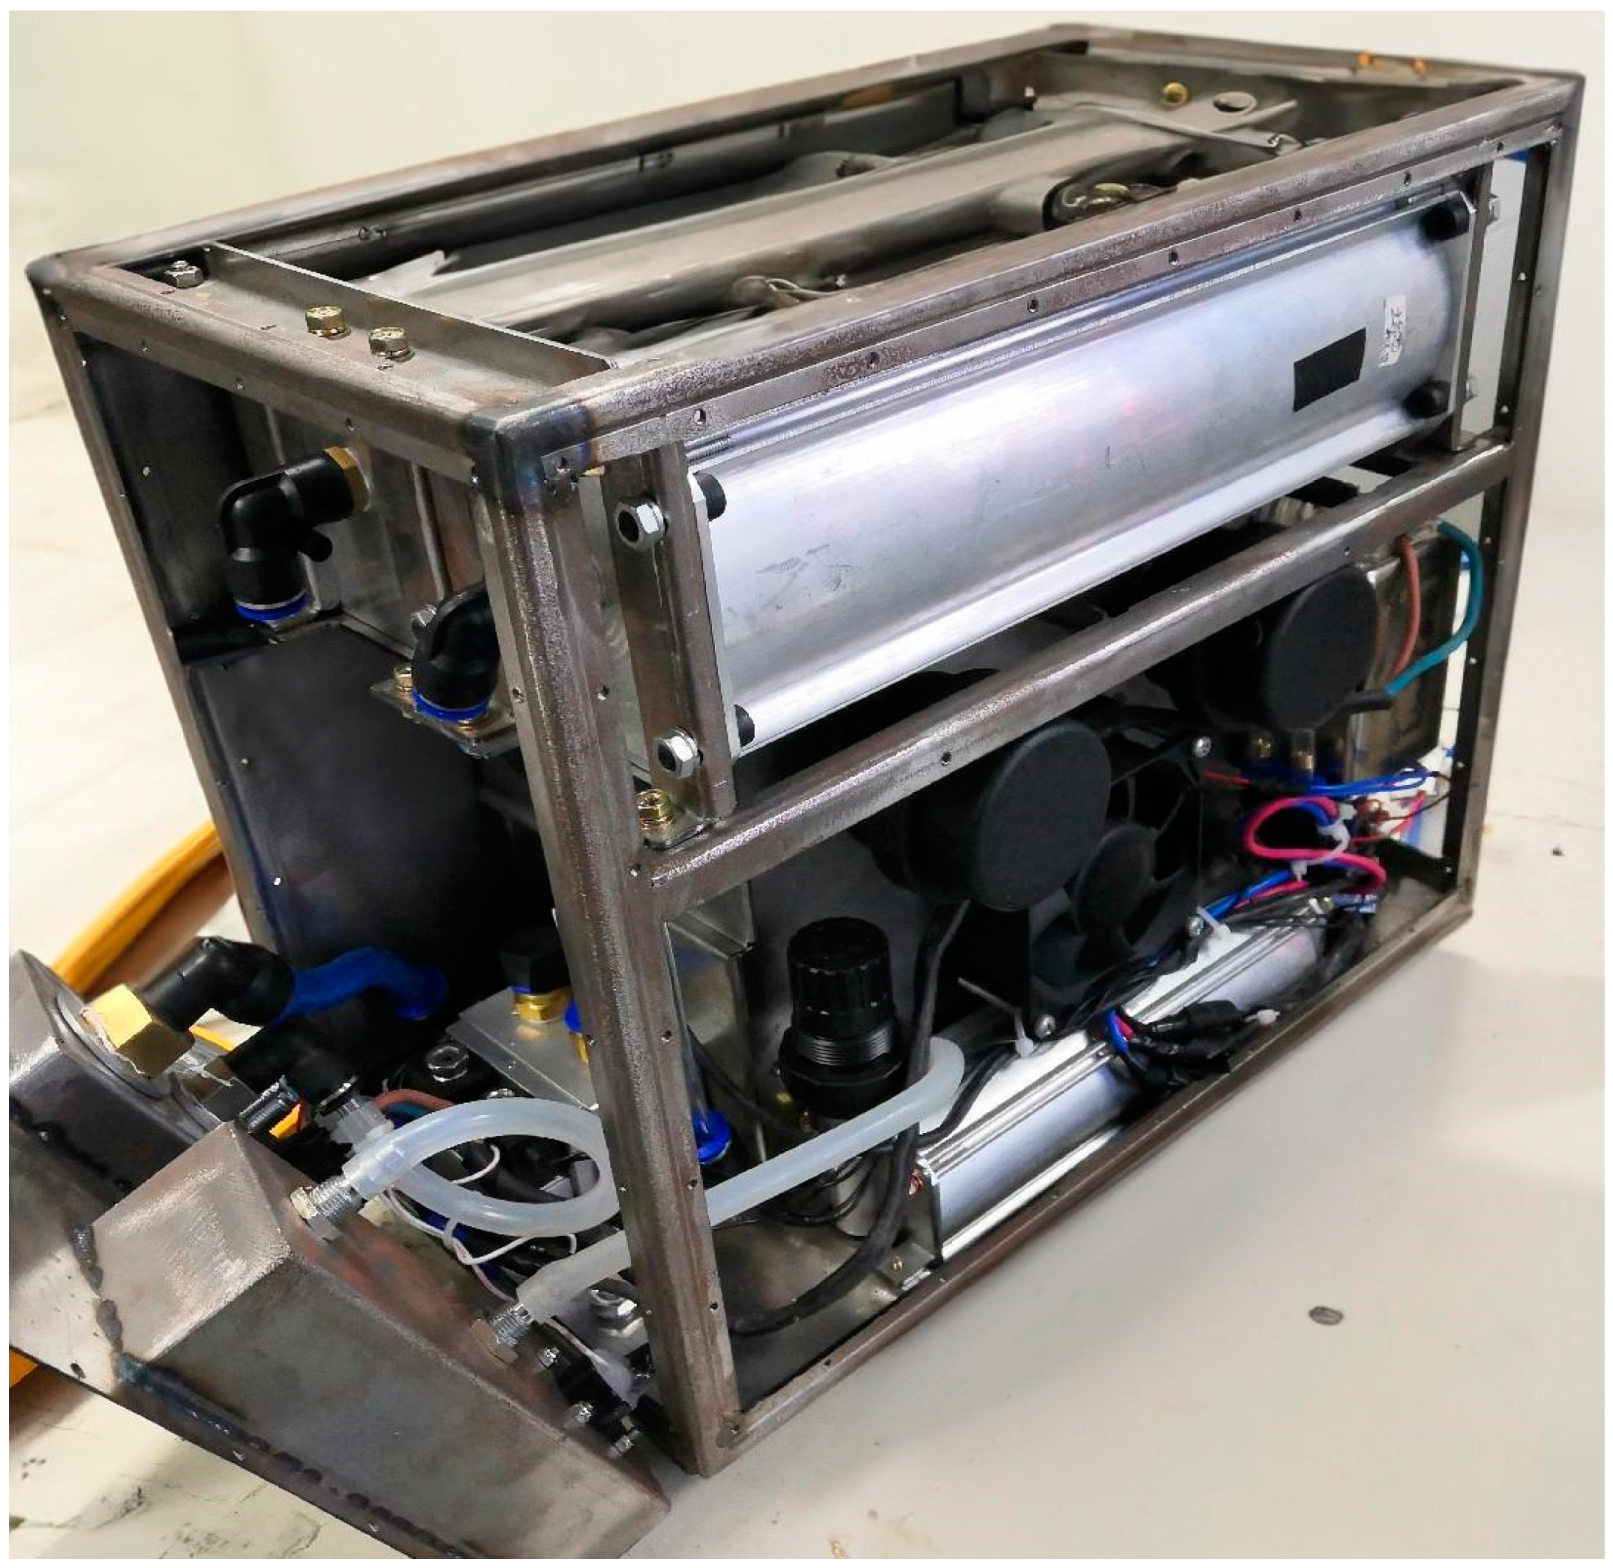
3.2. Experimental Platform and Experimental Content

The materials and instruments used in the PSA oxygen system tests are shown in Table 1.
The experiment setup is illustrated in Figure 2. Compressed air is directed into the adsorption tower via a solenoid valve, which is controlled by a pre-programmed system. The solenoid valve regulates the flow to allow for the entry of air and the expulsion of nitrogen. When the gas pressure reaches a specified level, the molecular sieve begins to adsorb nitrogen while simultaneously separating oxygen. The separated oxygen is then routed through a pipeline to the oxygen storage tank, where its concentration is monitored by an oxygen meter. During the pressure reduction phase of the adsorption cycle, the molecular sieve undergoes desorption and releases nitrogen, which is vented out through a muffler to achieve regeneration. This cycle is continuously repeated to ensure the consistent production of oxygen. Additionally, a portion of the oxygen produced in one adsorption tower is directed into another tower through a sizing orifice. This process, known as equal pressure transfer, increases the gas content in the receiving tower, allowing it to reach the desired adsorption pressure quickly. Simultaneously, the molecular sieve in the receiving tower can be backwashed, aiding in its regeneration.
The experiment was conducted at ambient temperature and atmospheric pressure. The oxygen concentration was selected as the primary variable for this study. An orthogonal experimental design was utilised to investigate the effects of the adsorption cycle duration, pressure equalisation time, and outlet flow rate on the oxygen concentration produced by the PSA oxygen generation system during cyclic production. The experimental steps are detailed as follows:
(1)
Turn on the air compressor and operate it until the output oxygen concentration stabilises. Adjust the oxygen outlet flowmeter and activate the oxygen meter.
(2)
With the oxygen outlet flowmeter set to 1 L/min, vary the adsorption cycle duration to 5 s, 6 s, 7 s, 8 s, 9 s, 11 s, and 13 s and record the oxygen concentration.
(3)
Maintain the oxygen outlet flowmeter at 1 L/min and adjust the pressure equalisation time to 0 s (no pressure equalisation), 0.3 s, 0.5 s, 0.7 s, 0.9 s, 1.1 s, 1.3 s, and 1.5 s. Record the corresponding oxygen concentration.
(4)
Sequentially adjust the outlet flow rate to 2 L/min, 3 L/min, 4 L/min, and 5 L/min. Repeat the experimental procedures outlined in steps (2) and (3) for each flow rate setting, and record the resulting oxygen concentration.

4. Results and Discussion

4.1. Influence of the Adsorption Cycle on the Effectiveness of PSA Oxygen Production

The adsorption step is a critical phase in the PSA oxygen generation process [23]. During this phase, the pressure inside the adsorption tower increases as feed air enters. Simultaneously, the molecular sieve adsorbs and separates the feed air components, resulting in the discharge of oxygen-enriched product gas from the air outlet. Once the pressurised adsorption step is completed, the feed air is switched to another adsorption tower to continue the cycle. In the experiment, the adsorption cycle on the experimental platform was systematically adjusted. The effects of different pressure equalisation times and outlet flow rates on the oxygen concentration were investigated. Figure 3 illustrates the variation curve of the adsorption cycle’s impact on the oxygen concentration.
According to the experimental results in Figure 3, the concentration of oxygen produced achieves its highest value when the adsorption cycle is 8 s. As the adsorption cycle increases, the oxygen production concentration initially rises, reaching a peak, and then begins to decline. This trend can be attributed to the impact of the adsorption period on the oxygen production concentration. When the adsorption cycle is short, the adsorption pressure is relatively low, leading to insufficient adsorption of nitrogen by the molecular sieve, resulting in a low amount of oxygen produced. Furthermore, a shorter adsorption cycle shortens both the adsorption and desorption times. Consequently, the adsorption and desorption processes of the molecular sieve are not fully completed, further reducing the oxygen production concentration. Therefore, under conditions of a short adsorption cycle, the oxygen production concentration tends to be lower. As the adsorption cycle lengthens and the adsorption pressure increases, the molecular sieve is afforded adequate time to effectively complete the adsorption and desorption of nitrogen. This leads to a more thorough adsorption process, resulting in a gradual increase in the oxygen production concentration. However, an extended adsorption cycle does not always correlate with higher oxygen production. When the adsorption cycle is prolonged beyond an optimal point, nitrogen begins to penetrate the adsorbent, disrupting the adsorption equilibrium, which in turn causes the oxygen production concentration to decline. Therefore, there exists an optimal adsorption cycle where the oxygen concentration is maximised.

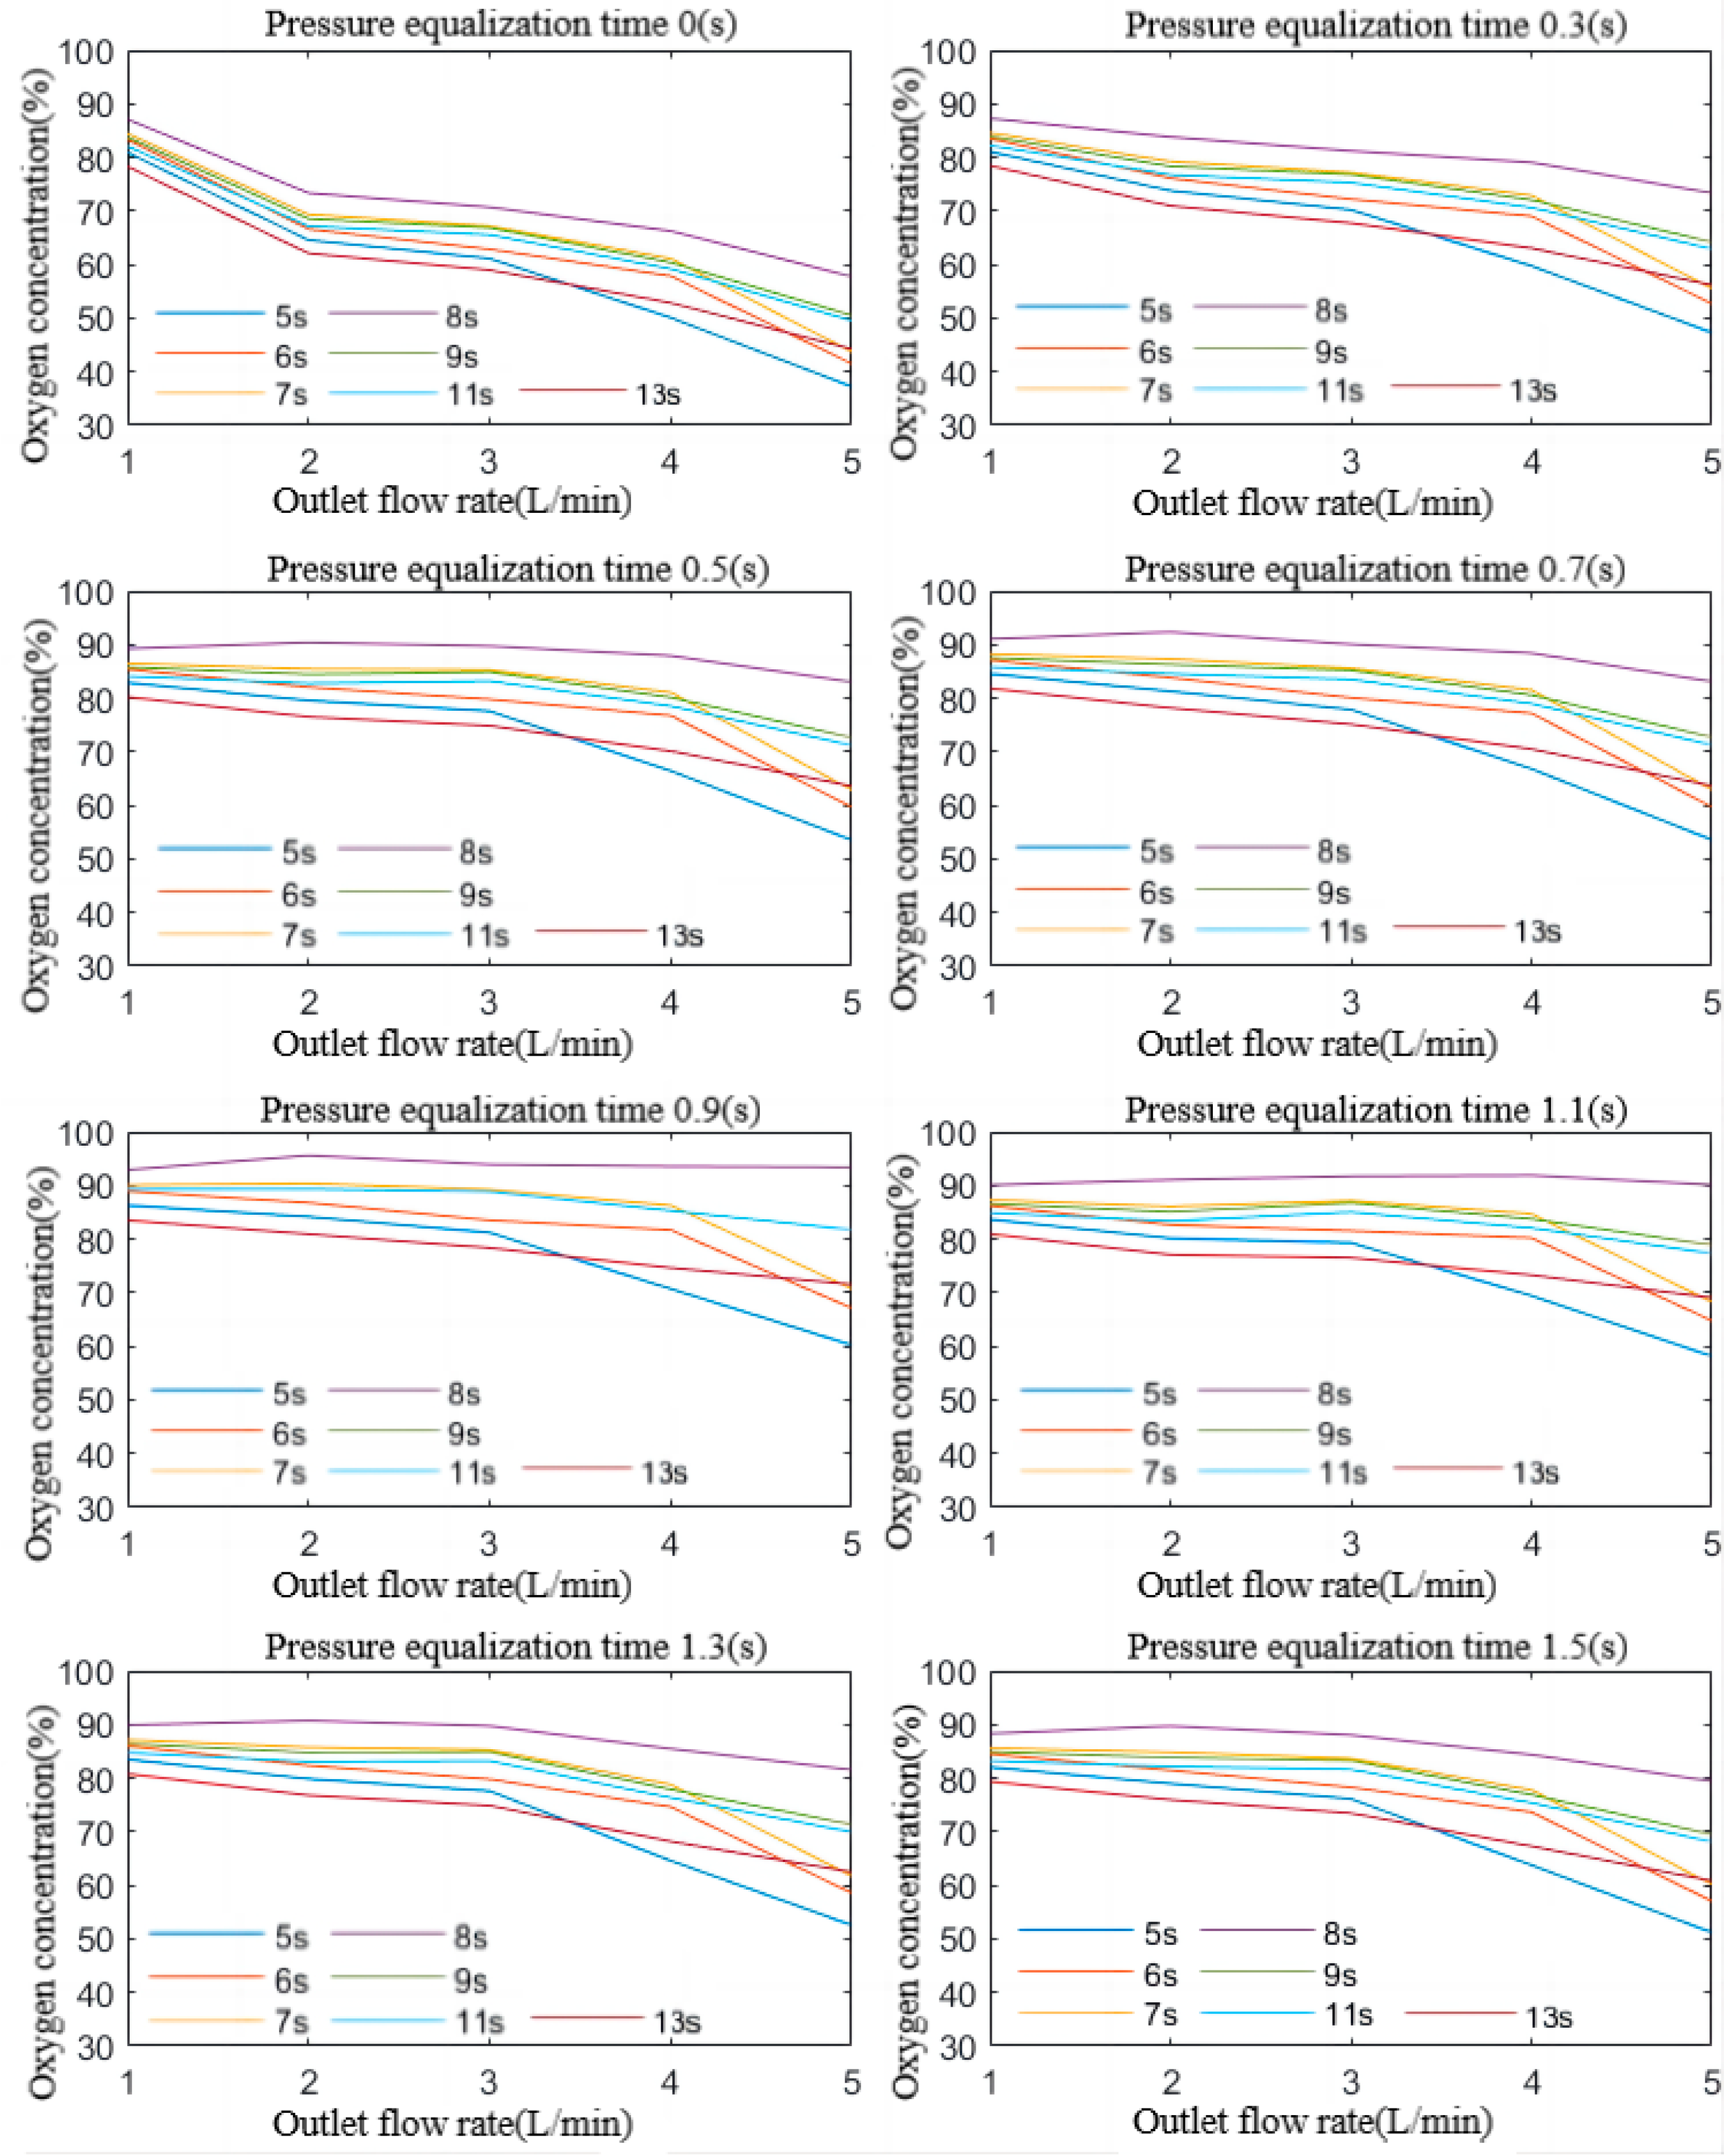
4.2. Influence of Pressure Equalisation Time on the Effectiveness of PSA Oxygen Production

In the PSA oxygen production process, the pressure equalisation phase effectively utilises the pressure energy within the adsorption tower [24]. This efficient utilisation significantly reduces the overall energy consumption of the PSA process. Moreover, during the pressure equalisation stage, the unadsorbed high-pressure air at the inlet end of the equalised adsorption tower is directed into the equalised adsorption tower itself. Instead of being vented directly, this air undergoes a second adsorption and separation process, which enhances the oxygen yield. Furthermore, as the pressure equalises, the pressure within the adsorption tower under equalisation rapidly increases, leading to a higher oxygen concentration in the product gas. To explore this phenomenon, experiments were conducted by adjusting the pressure equalisation time on the experimental platform. The oxygen concentration in the product gas was measured at various adsorption cycles and outlet flow rates. The resulting curve, illustrating the impact of pressure equalisation time on the oxygen concentration in the PSA oxygen generation system, is shown in Figure 4.
As shown in the experimental results in Figure 4, the oxygen concentration reaches its highest value when the equalisation time is 0.9 s. The oxygen concentration during the equalisation process is significantly higher than that in the process without equalisation. As the equalisation time increases, the oxygen concentration first increases rapidly and then decreases slowly, reaching an optimum point. This phenomenon occurs because the gas at the outlet end of the molecular sieve adsorption tower has a high oxygen content. When the adsorption is completed and the adsorption tower is switched, the upper part of the adsorption tower, which is the adsorption zone, contains oxygen-rich air. During the pressure equalisation process, the mechanical energy of the gas in the adsorption tower that has completed adsorption is transferred to the other adsorption tower. Simultaneously, the highly concentrated oxygen that has not yet entered the gas storage tank is also pressed into the other adsorption tower. Thus, both the mechanical energy from the compressor and the oxygen from the lower part of the adsorption tower are recovered. This results in a significant increase in oxygen concentration and recovery compared with processes without equalisation. Additionally, the blowdown is enhanced when the excess oxygen is pressed into the other adsorption tower. This process improves the desorption efficiency of the molecular sieves in the second adsorption tower and further enhances the oxygen production efficiency. However, since the amount of excess oxygen in the oxygen discharge section is limited, the oxygen production concentration does not increase further when the pressure equalisation time exceeds a certain value. If the equalisation time continues to increase, it is equivalent to the compressor continuing to press air into the system. At this point, the molecular sieve, which has not been fully regenerated, becomes saturated. The excess nitrogen then reduces the oxygen concentration of the product gas.

4.3. Influence of the Outlet Flow Rate on the Effectiveness of PSA Oxygen Production

From the experimental results in Figure 3, it is evident that the highest oxygen concentration is achieved at an outlet flow rate of 2 L/min. During an adsorption cycle of 8 s, the equalisation time of 0.9 s corresponds to a decreasing trend on the curve at 2 L/min. This phenomenon can be attributed to the fact that the outlet of the molecular sieve adsorption tower in the PSA oxygen generation unit is connected by a three-way pipe. Consequently, the adsorption pressure in the tower is determined by the flow difference between the inlet and outlet gas flows. Reducing the outlet flow rate increases the pressure within the adsorption tower. Under a fixed adsorption period and equalisation time, the adsorption pressure approaches its optimal point as the outlet flow decreases, provided it has not already reached this point. As a result, the oxygen production concentration increases. However, as shown in Figure 4, when the outlet flow rate decreases beyond a certain point, the oxygen production concentration starts to decline. This decline occurs because the high-concentration oxygen product gas does not exit the molecular sieve adsorption tower promptly. Consequently, the incoming air is not effectively adsorbed, and the excess nitrogen leads to a decrease in oxygen concentration.
When the outlet flow rate is progressively reduced, the data and curve characteristics for equalisation times of 0.3 s and 1.5 s remain largely consistent, indicating a similar sensitivity to changes in the outlet flow rate. Even when the outlet flow rate drops below 1L/min, the oxygen concentration shows a slowly increasing trend. This suggests that the equalisation time is not at its optimum value; thus, reducing the outlet flow rate can still enhance the oxygen concentration produced.

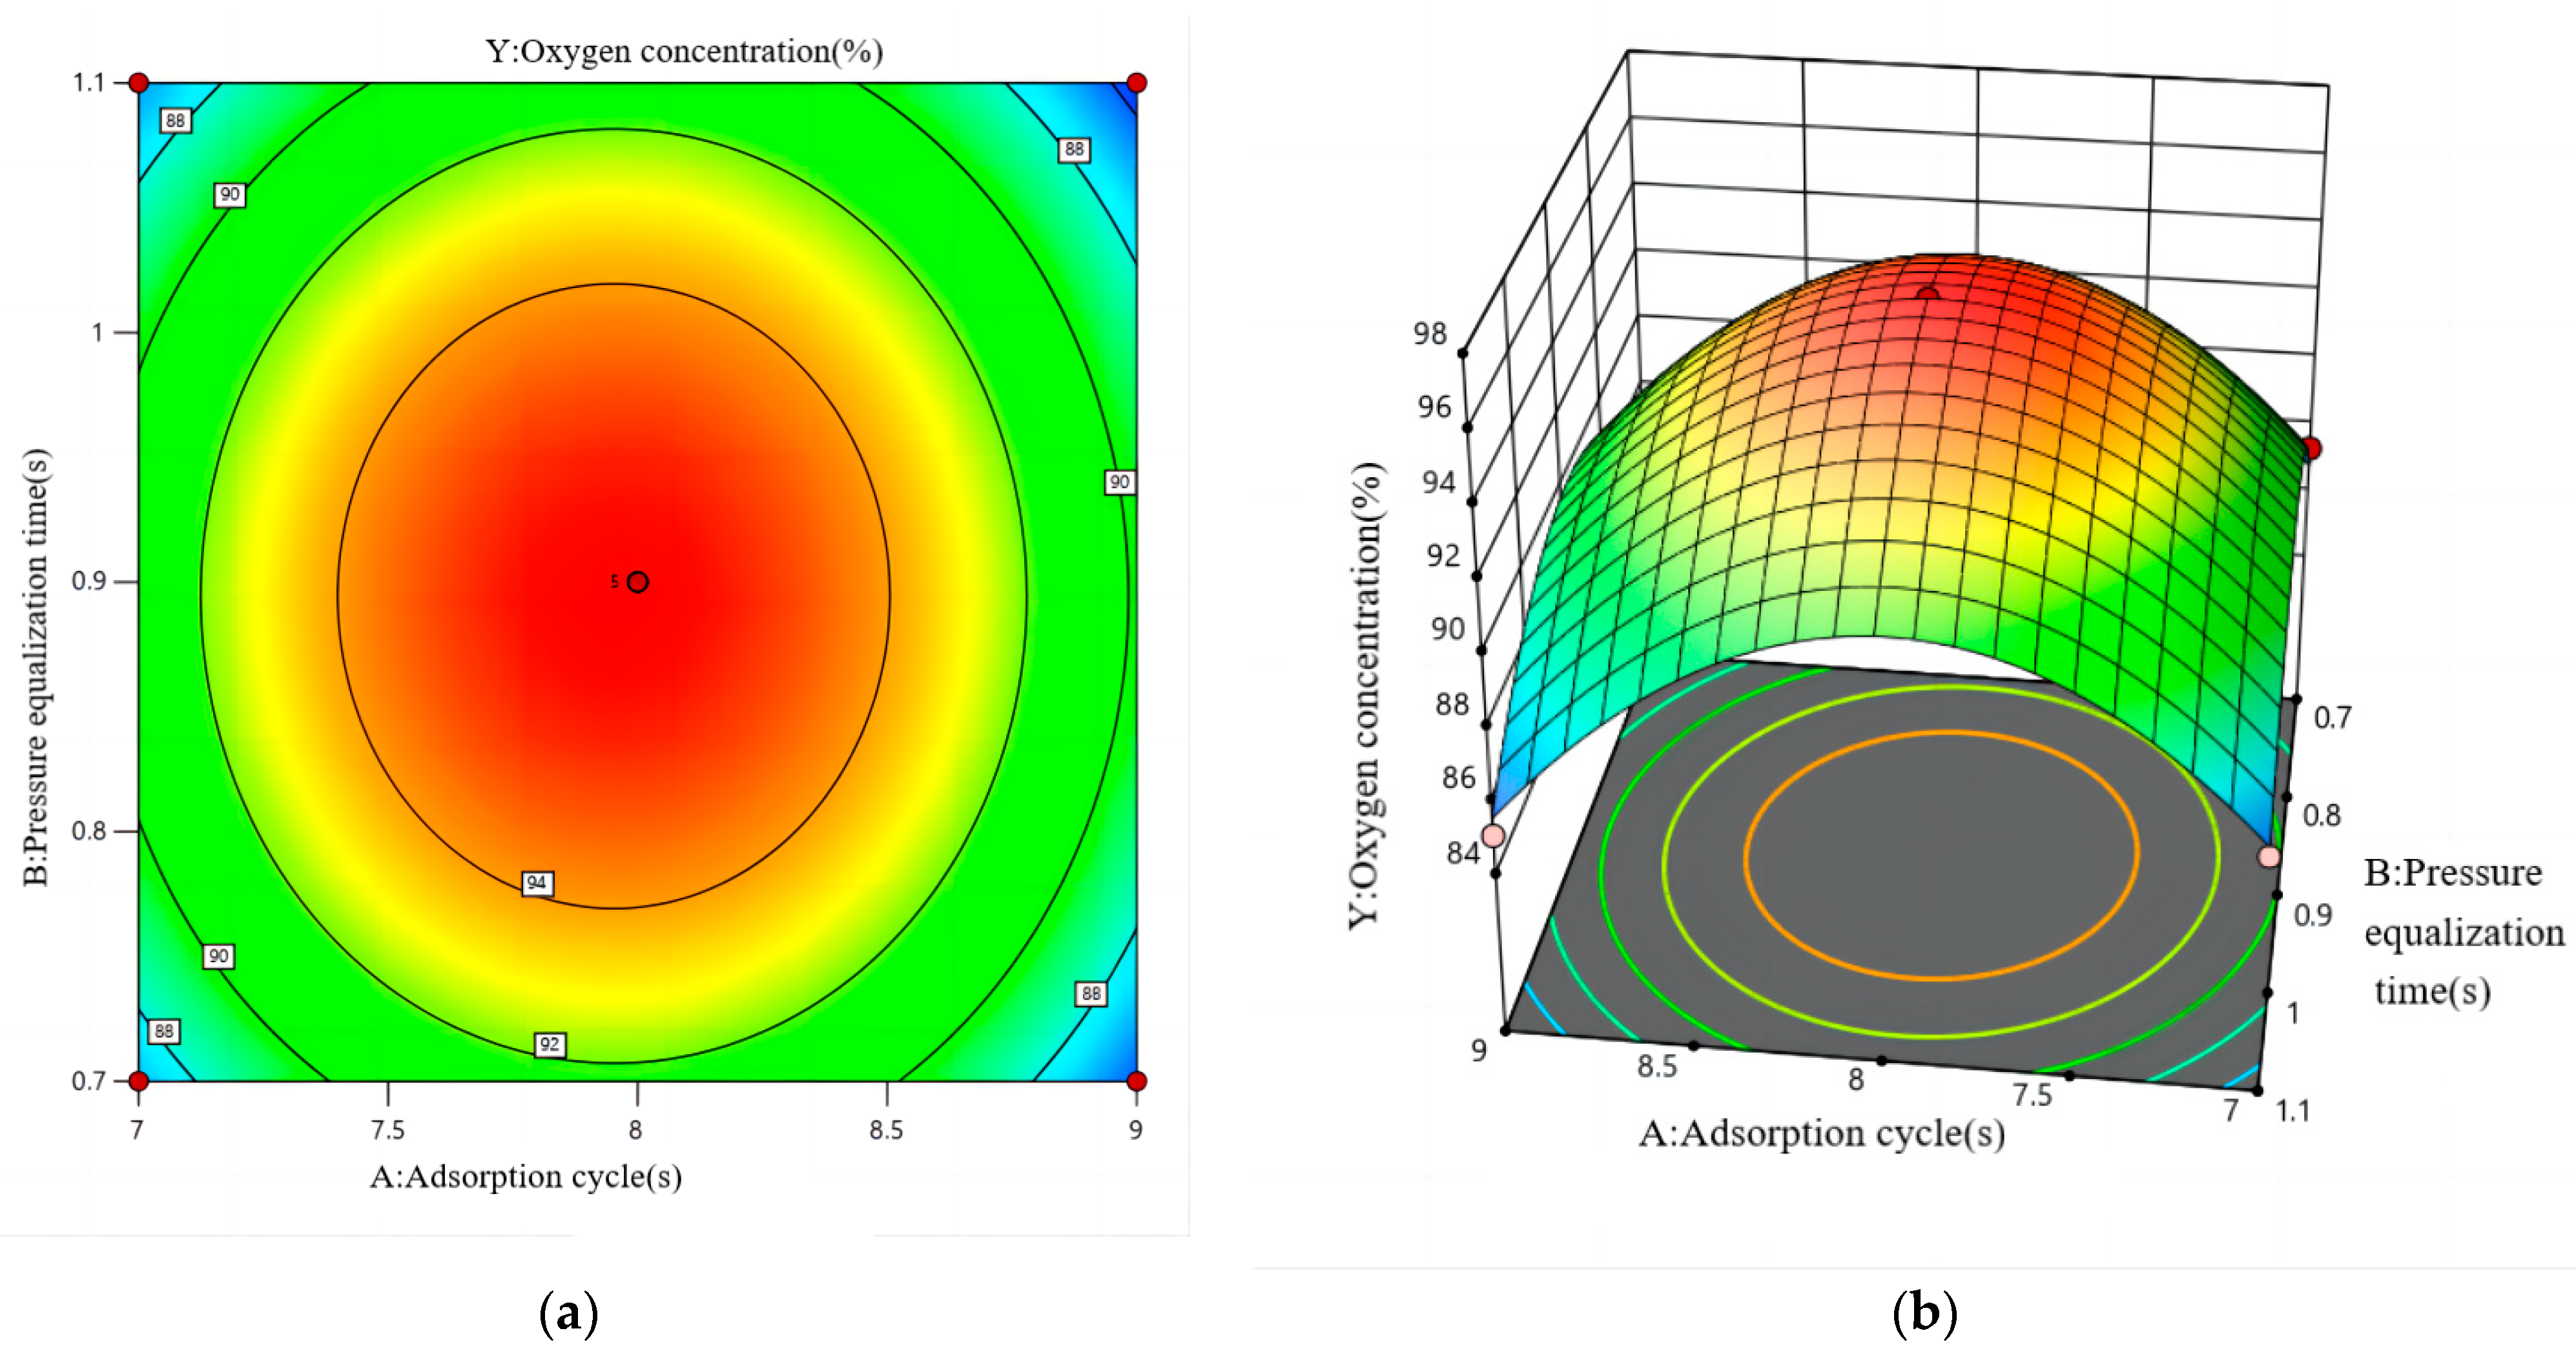
4.4. Response Surface Method Analysis

4.4.1. Modelling and Analysis

In the previous paper, the effects of three parameters—namely, adsorption cycle, pressure equalisation time, and outlet flow rate—on the oxygen concentration of the PSA oxygen generation system were discussed individually. However, in practice, these parameters are interrelated and coupled with each other [25]. To investigate the combined influence of these parameters on oxygen concentration, this study further analysed the experimental data using multiple regression analysis under integrated variables [26,27]. The adsorption period was designated as the first control variable, the pressure equalisation time as the second, and the outlet flow rate as the third. The oxygen production concentration was set as the dependent variable. The major independent variables of the composite variable system X were recorded as X1, X2, and X3, while the dependent variable, oxygen production concentration, was represented as Y. A quadratic polynomial stepwise regression was fitted to the preceding data to derive the following regression equation:
Y = 92.683 + 0.6X1 + 0.4X2 − 0.05X3 + 0.005X1X2 + 0.085X1X3 + 0.6550X2X3
From Equation (1), the degree of influence on oxygen concentration, in descending order, is as follows: adsorption cycle, pressure equalisation time, and outlet flow rate. The optimum process conditions were calculated as an adsorption cycle of 7.88 s, an equalisation time of 0.9 s, an outlet flow rate of 2.31 L/min, and an oxygen concentration of 96.7%. To validate the equation, the model was subjected to an Analysis of Variance (ANOVA). The partial regression coefficients for each factor were tested, and the results are presented in Table 2.
As can be seen in Table 2, the partial regression coefficients of the primary terms are highly significant for X1 and X2 and significant for X3. This indicates that the adsorption period, pressure equalisation time, and outlet flow rate have a significant effect on the oxygen concentration. In the crossover term, the p-values of X1X2, X1X3, and X2X3 are all less than 0.05, demonstrating that the interaction among these variables significantly affects the oxygen concentration. The absolute values of the coefficients for X1X2, X1X3, and X2X3 in the fitting equation are 0.005, 0.085, and 0.655, respectively. It is evident that the interaction between the equalisation time and outlet flow rate has the greatest effect on the oxygen concentration, while the interaction between the adsorption period and outlet flow rate has the least effect. The adjusted R2adj and R2 values for oxygen concentration are 0.9807 and 0.9915, respectively, which are very close to each other. This indicates that the regression equations are well-fitted to the actual data. As shown in the plot of the predicted values of the regression model versus the experimental measurements (shown in Figure 5), the distribution of the experimental values and predicted values is close to a straight line. This demonstrates that the regression model has a good fit and that the model is stable and reliable.

4.4.2. Analysis of the Effectiveness of PSA Oxygen Generation

As can be seen in Figure 6, under a fixed equalising pressure time, the oxygen concentration initially increases and then decreases with the length of the adsorption cycle. This effect is particularly noticeable. Similarly, under a fixed adsorption cycle, the oxygen concentration first rises and then falls as the pressure equalisation time is extended. The contour trends illustrate that the influence of the adsorption cycle on the oxygen concentration is more significant than that of the pressure equalisation time. At an adsorption cycle of 7.0 s, the oxygen concentration changes significantly with increasing pressure equalisation time. However, at an adsorption cycle of 9.0 s, the variation in the oxygen concentration with pressure equalisation time becomes less pronounced. This phenomenon can be attributed to the dynamic nature of the adsorption and pressure equalisation processes. The adsorption cycle has a greater impact on oxygen concentration than the pressure equalisation time. This is because the adsorption cycle directly influences the capacity and efficiency of the molecular sieve to adsorb nitrogen. In contrast, the pressure equalisation time primarily affects the pressure equilibrium of the system and has a less direct impact on the adsorption process. When the adsorption cycle is short, the volume of inlet gas is smaller. During pressure equalisation, the intercommunicating gas increases the gas volume within the adsorption tower, which benefits the adsorption process in the next cycle, leading to an increase in the oxygen concentration. Conversely, with a longer adsorption cycle, the volume of inlet gas is larger. During pressure equalisation, the influence of the intercommunicating gas on the adsorption tower is relatively reduced, resulting in a slower increase in the oxygen concentration.
As can be seen in Figure 7, when the outlet flow rate is constant, the oxygen concentration increases and then decreases with the lengthening of the adsorption cycle, with this effect being particularly noticeable. Conversely, when the adsorption period remains unchanged, the oxygen concentration does not vary significantly with changes in the outlet flow rate. The contour trends clearly show that the effect of the adsorption cycle on oxygen concentration is greater than that of the outlet flow rate. This phenomenon can be attributed to the dynamics of adsorption and the role of the outlet flow rate. The adsorption cycle directly determines the capacity and efficiency of the molecular sieve to adsorb nitrogen. In contrast, the outlet flow rate mainly influences the overall gas flow rate within the system and has a lesser impact on the adsorption process of the molecular sieve. When the adsorption cycle is fixed, a moderate increase in the outlet flow rate can enhance the system’s cycle efficiency. However, if the flow rate becomes too high, it can lead to the mixing of oxygen and nitrogen, thereby reducing the oxygen concentration.
As can be seen in Figure 8, when the outlet flow rate is constant, the oxygen concentration initially increases and then decreases with the increase in the equalisation time, with this effect being particularly noticeable. Conversely, when the equalisation time remains unchanged, the oxygen concentration does not vary significantly with changes in the outlet flow rate. The contour trends clearly show that the influence of the equalisation time on the oxygen concentration is greater than that of the outlet flow rate. This phenomenon can be attributed to the roles of the pressure equalisation time and outlet flow rate in the adsorption process. The equalisation time affects the pressure balance within the system. Shorter equalisation times lead to inadequate pressure balance, resulting in a lower oxygen concentration. As the equalisation time increases, the pressure gradually balances, enhancing adsorption efficiency and thus raising the oxygen concentration. However, excessively long equalisation times reduce the overall cycle efficiency of the system. They decrease the effective adsorption and desorption time, leading to lower oxygen concentrations. The outlet flow rate primarily impacts the gas flow rate and has less direct influence on the adsorption process of the molecular sieve. Appropriately increasing the outlet flow rate can improve gas exchange efficiency, but too high a flow rate can cause the mixing of oxygen and nitrogen, reducing the oxygen concentration.
Taking into account the relevant literature, it can be observed that the interrelationship among the adsorption period, pressure equalisation time, and outlet flow rate, as well as the degree of their respective influences on the oxygen concentration, remains unclear. Quantitative analysis of the interrelationships and influence patterns between these parameters has been challenging. In this study, through response surface analysis, it is evident that the adsorption period and pressure equalisation time have a greater influence on oxygen concentration, whereas the outlet flow rate has the least impact. The interaction among the adsorption period, pressure equalisation time, and outlet flow rate significantly affects the oxygen concentration. Among these, the interaction between pressure equalisation time and outlet flow rate has the largest effect, while the interaction between the adsorption period and outlet flow rate has the least effect on oxygen concentration.

5. Conclusions

(1)
Three factors—adsorption cycle, pressure equalisation time, and outlet flow rate—have a significant impact on oxygen concentration. Each factor has an optimum value in the oxygen production process. When any two of these factors are held constant as covariates, observing the curve of the third factor on the oxygen concentration reveals a cluster of curves with a similar trend.
(2)
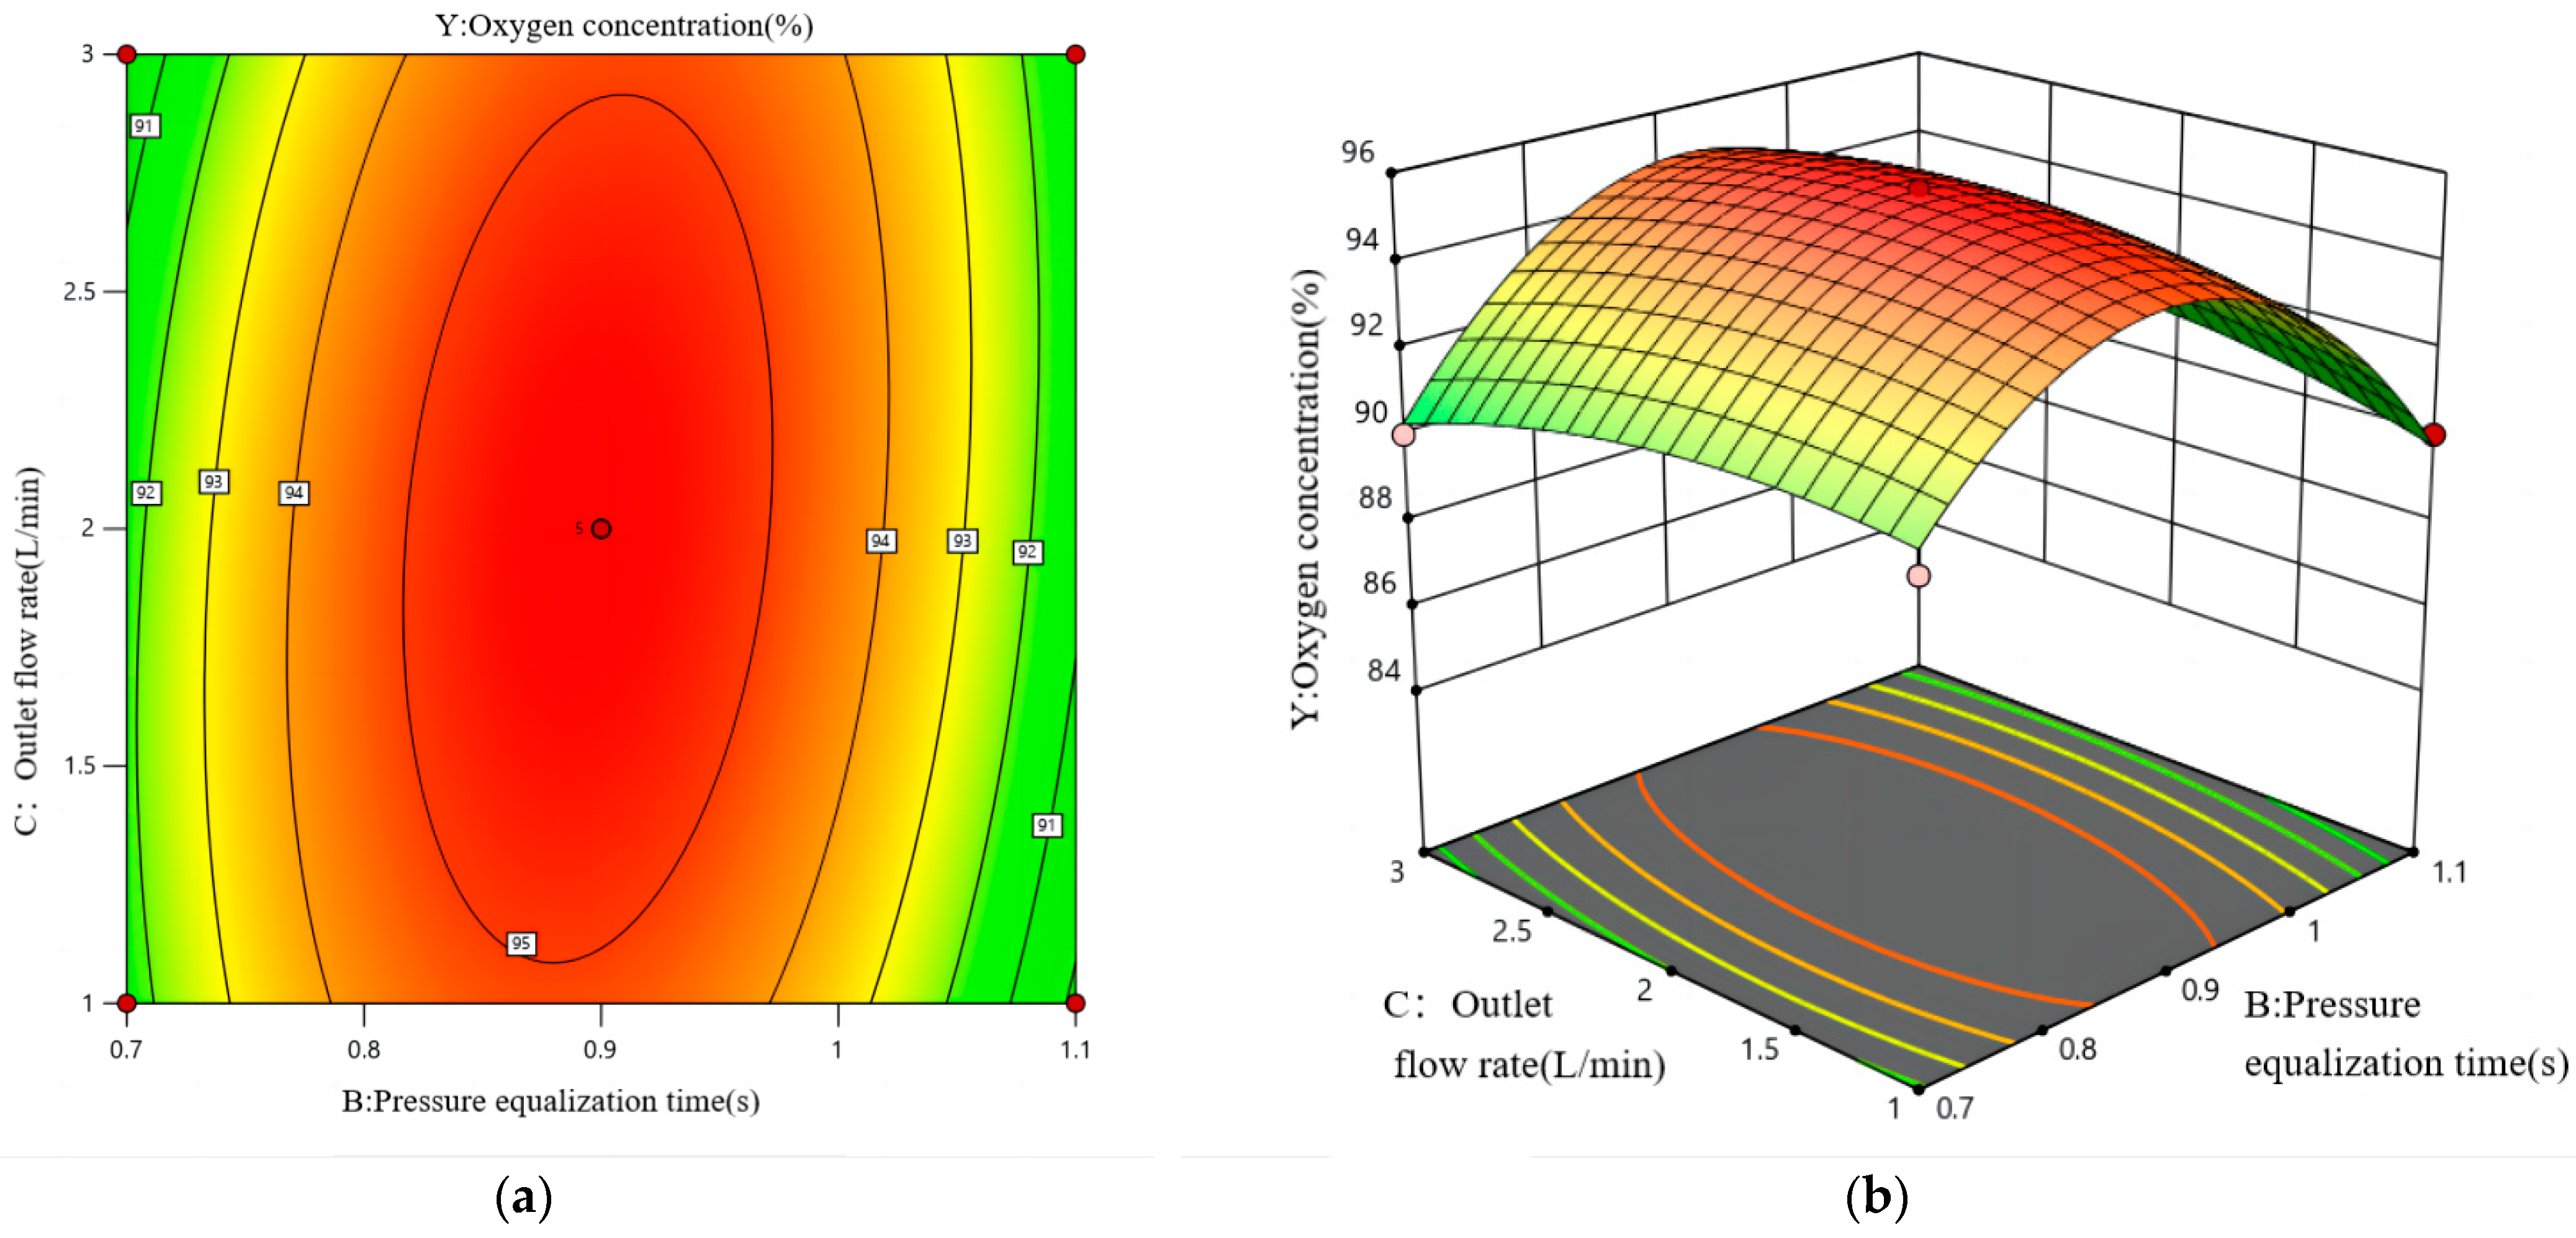
The oxygen production concentration in a pressure equalisation process is significantly higher than in a process without pressure equalisation. As the pressure equalisation time increases, the oxygen concentration rises rapidly before decreasing slowly, reaching an optimum point. This optimum point remains stable regardless of changes in the adsorption period. The sensitivity of the oxygen concentration to the equalisation time is higher when the difference between the adsorption cycle and the optimal adsorption cycle is larger at a given outlet flow rate. At a specific pressure equalisation time, the effect curves of the outlet flow rate on the oxygen concentration corresponding to the optimal adsorption cycle differ significantly from those corresponding to non-optimal cycles. The effect curves of the outlet flow rate on the oxygen concentration for different non-optimal cycles show similar characteristics, though the underlying reasons for these patterns vary.
(3)
Based on multiple regression analysis of the combined variables, the influence of the factors on oxygen concentration is ranked as follows: adsorption cycle > pressure equalisation time > outlet flow rate. The interaction among these three factors also significantly affects the oxygen concentration. The interaction between the pressure equalisation time and outlet flow rate has the greatest impact, while the interaction between the adsorption cycle and outlet flow rate has the least effect on oxygen concentration.

Author Contributions

Conceptualisation, D.J. and F.H.; methodology, D.J.; software, F.H.; validation, F.H.; investigation, F.H.; resources, D.J.; writing—original draft preparation, F.H.; writing—review and editing, D.J. All authors have read and agreed to the published version of the manuscript.

Funding

This research was funded by the Department of Education Anhui Province, grant numbers 2022sdxx007 and 2022tsxwd044.

Data Availability Statement

The data are available from the corresponding author upon reasonable request.

Conflicts of Interest

The authors declare no conflicts of interest.

References

  1. Qadir, S.; Li, D.; Gu, Y.; Yuan, Z.; Zhao, Y.; Wang, S.; Wang, S. Experimental and numerical analysis on the enhanced separation performance of a medical oxygen concentrator through two-bed rapid pressure swing adsorption. Ind. Eng. Chem. Res. 2021, 60, 5903–5913. [Google Scholar] [CrossRef]
  2. Aljaghoub, H.; Alasad, S.; Alashkar, A.; AlMallahi, M.; Hasan, R.; Obaideen, K.; Alami, A.H. Comparative analysis of various oxygen production techniques using multi-criteria decision-making methods. Int. J. Thermofluids 2023, 17, 100261. [Google Scholar] [CrossRef]
  3. Bahari, Y.; Agustina, S.; Kurniawan, T. Design and Construction of Portable Oxygen Concentrator using Pressure Swing Adsorption Technology. ASEAN J. Sci. Eng. Mater. 2024, 3, 43–50. [Google Scholar]
  4. Canevesi, R.; Grande, C.A. Biogas upgrading by pressure swing adsorption using zeolite 4A. Effect of purge on process performance. Sep. Purif. Technol. 2023, 309, 123015. [Google Scholar] [CrossRef]
  5. Chin, C.; Kamin, Z.; Bahrun, M.H.V.; Bono, A. The production of industrial-grade oxygen from air by pressure swing adsorption. Int. J. Chem. Eng. 2023, 2023, 2308227. [Google Scholar] [CrossRef]
  6. Kong, D.; Zhang, Y.; Wu, W.; Ma, J.; Song, Z.; Zhang, D.; Zhang, Y. Simulation and analysis of oxygen production process by six-bed pressure swing adsorption process. CIESC J. 2023, 74, 4934. [Google Scholar]
  7. Lv, A.; Deng, C.; Zhu, M.; Yu, D.; Shi, M.S.; Ma, J.; Gao, W. Analyzing the PSA process of oxygen generation in plateau environment using response surface method. Appl. Chem. Ind. 2018, 47, 1175–1178. [Google Scholar]
  8. Zhu, X.; Liu, Y.; Yang, R.T. Effects of operating temperature on the performance of small scale rapid cycle pressure swing adsorption air separation process. Adsorption 2021, 27, 205–212. [Google Scholar] [CrossRef]
  9. Zhu, X.; Sun, Y.; Dong, L.; Sun, X.; Li, S.; Chen, H.; Zhang, J.; Chen, J. Comprehensive performance and numerical analysis of pressure swing adsorption process-based medical oxygen concentrators under various operating conditions. Sep. Sci. Technol. 2023, 58, 2241–2253. [Google Scholar] [CrossRef]
  10. Zhu, X.; Sun, Y.; Liu, Y.; Li, Z.; Feng, F.; Ma, J.; Li, S. Correlation analysis between working conditions and the performance of a small-scale pressure swing adsorption oxygen production process. Ind. Eng. Chem. Res. 2022, 61, 14962–14970. [Google Scholar] [CrossRef]
  11. Zhu, X.; Sun, Y.; Liu, Y.; Sun, X.; Shi, J. Experimental performance analysis of vacuum pressure swing adsorption air separation process under plateau special conditions. Sep. Sci. Technol. 2022, 57, 2885–2893. [Google Scholar] [CrossRef]
  12. Zhu, X.; Sun, Y.; Zhou, S.; Feng, F.; Liu, J.; Ma, J.; Li, S.; Niu, Z. Comparative performance of industrial-scale oxygen production by pressure swing adsorption and vacuum pressure swing adsorption under plateau environment. Adsorption 2023, 1–7. [Google Scholar] [CrossRef]
  13. Zhu, X.; Wang, X. Experimental study of a rotary valve multi-bed rapid cycle pressure swing adsorption process based medical oxygen concentrator. Adsorption 2020, 26, 1267–1274. [Google Scholar] [CrossRef]
  14. Šulc, R.; Kos, M. Experimental Study of Oxygen Separation in Oxygen-Pressure Swing Adsorption Unit. Chem. Eng. Trans. 2022, 94, 481–486. [Google Scholar]
  15. Sulc, R.; Kos, M. Experimental Performance of Pilot-Oxygen-Pressure Swing Adsorption Unit. Chem. Eng. Trans. 2023, 100, 223–228. [Google Scholar]
  16. De Witte, N.; Denayer, J.F.; Van Assche, T.R. Effect of adsorption duration and purge flowrate on pressure swing adsorption performance. Ind. Eng. Chem. Res. 2021, 60, 13684–13691. [Google Scholar] [CrossRef]
  17. Akulinin, E.; Golubyatnikov, O.; Dvoretsky, D.; Dvoretsky, S. Optimization and analysis of pressure swing adsorption process for oxygen production from air under uncertainty. Chem. Ind. Chem. Eng. Q. 2020, 26, 89–104. [Google Scholar] [CrossRef]
  18. Beeyani, A.; Singh, K.; Vyas, R.; Kumar, S.; Kumar, S. Parametric studies and simulation of PSA process for oxygen production from air. Pol. J. Chem. Technol. 2010, 12, 18–28. [Google Scholar] [CrossRef]
  19. Fakhari-Kisomi, B.; Erden, L.; Ebner, A.D.; Ritter, J.A. Equilibrium theory analysis of pressure equalization steps in pressure swing adsorption. Ind. Eng. Chem. Res. 2021, 60, 9928–9939. [Google Scholar] [CrossRef]
  20. Fu, Y.; Liu, Y.; Zhang, Q.; Cao, X.; Zhao, C. Study on PSA Oxygen producing process under plateau region: Effect of purging flow rate on oxygen concentration and recovery. In Proceedings of the IOP Conference Series: Earth and Environmental Science, 3rd International Conference on Air Pollution and Environmental Engineering, Xi’an, China, 28–29 September 2020; p. 012083. [Google Scholar]
  21. Liu, Y.; Zhang, Q.; Cao, Y.; Yang, X.; Li, Z.; Liu, W.; Habyarimana, J.B.; Cui, Y.; Wang, H.; Yang, R.T. Effect of intermittent purge on O2 production with rapid pressure swing adsorption technology. Adsorption 2021, 27, 181–189. [Google Scholar] [CrossRef]
  22. Marcinek, A.; Guderian, J.; Bathen, D. Process intensification of the high-purity nitrogen production in twin-bed pressure swing adsorption plants. Adsorption 2021, 27, 937–952. [Google Scholar] [CrossRef]
  23. Rumbo Morales, J.Y.; Ortiz-Torres, G.; García, R.O.D.; Cantero, C.A.T.; Rodriguez, M.C.; Sarmiento-Bustos, E.; Oceguera-Contreras, E.; Hernández, A.A.F.; Cerda, J.C.R.; Molina, Y.A. Review of the Pressure Swing Adsorption Process for the Production of Biofuels and Medical Oxygen: Separation and Purification Technology. Adsorpt. Sci. Technol. 2022, 2022. [Google Scholar] [CrossRef]
  24. Zhang, R.; Shen, Y.; Tang, Z.; Li, W.; Zhang, D. A review of numerical research on the pressure swing adsorption process. Processes 2022, 10, 812. [Google Scholar] [CrossRef]
  25. Madankar, T.; Deshpande, Y. Development of Portable Oxygen Concentrator-A Review. In Proceedings of the E3S Web of Conferences, 15th International Conference on Materials Processing and Characterization (ICMPC 2023), Newcastle, UK, 5–8 September 2023; p. 01265. [Google Scholar]
  26. Sharma, P. Prediction-optimization of the effects of di-tert butyl peroxide-biodiesel blends on engine performance and emissions using multi-objective response surface methodology. J. Energy Resour. Technol. 2022, 144, 072301. [Google Scholar] [CrossRef]
  27. Tsai, C.-Y.; Kim, J.; Jin, F.; Jun, M.; Cheong, M.; Yammarino, F.J. Polynomial regression analysis and response surface methodology in leadership research. Leadersh. Q. 2022, 33, 101592. [Google Scholar] [CrossRef]
Figure 1. Flow diagram of the variable pressure adsorption oxygen generation system.
Processes 12 01306 g001
Figure 2. PSA oxygen generation experimental platform.
Processes 12 01306 g002
Figure 3. Variation in the adsorption cycle on oxygen concentration.
Processes 12 01306 g003
Figure 4. Variation in the pressure equalisation time on oxygen concentration.
Processes 12 01306 g004
Figure 5. Predicted vs. experimental values of oxygen concentration.
Processes 12 01306 g005
Figure 6. Contour (a) and response surface (b) of the oxygen concentration under the interaction between the adsorption cycle and pressure equalisation time.
Processes 12 01306 g006
Figure 7. Contour (a) and response surface (b) of the oxygen concentration under the interaction between the adsorption cycle and outlet flow rate.
Processes 12 01306 g007
Figure 8. Contours (a) and response surfaces (b) of the oxygen concentration for the interaction between the pressure equalisation time and outlet flow rate.
Processes 12 01306 g008
Table 1. Materials and instruments.
Material and InstrumentsSpecificationManufacture
1Air compressorBST300/1.5-80DC26VShanghai Ingersoll Rand Compressor.
2Molecular sieveSXSDMShanghai EasySorb Molecular Sieve Co.
3Cooling fansDF8038B12H DC12VMOUSER ELECTRONICS.
4Filter4100-725Hangzhou Cobalt Filter Material Co.
5Oxygen concentration sensorGASboard-7500Sifang Optoelectronics Co.
6Electronic flow meterLZM-6TO2(0–9 L/min)Yuyao Jintai Instrument Co.
7Gas storage tankØ48X220CLW GROUP
8Distribution valveJEL-MP-08--DC12V-1.5 WNingbo Jiaerling Pneumatic Machinery Co.
9Check valveDCV1603CVL.01Ningbo Jiaerling Pneumatic Machinery Co.
10Pressure stabilising valveNZYR-10XDZhejiang Yongsheng Technology Co.
Table 2. ANOVA results for regression equations.
Source of VarianceSum of SquareDegrees of FreedomMean SquareF-Valuep-Value
Model211.27923.4791.15<0.0001
X1121.531121.53471.89<0.0001
X268.13168.13264.53<0.0001
X33.0613.0611.880.0107
X1X20.000110.00010.00040.03848
X1X30.028910.02890.11220.006
X2X31.7211.726.660.0264
Residual1.870.2575
Lack of fit1.830.6
Pure error0.0640.08
Sum213.0816
R2adj = 0.9807 R2 = 0.9915
Disclaimer/Publisher’s Note: The statements, opinions and data contained in all publications are solely those of the individual author(s) and contributor(s) and not of MDPI and/or the editor(s). MDPI and/or the editor(s) disclaim responsibility for any injury to people or property resulting from any ideas, methods, instructions or products referred to in the content.

