Article

Impact of Drying Processes for Camellia Seeds on the Volatile Compounds of Camellia Seed Oil

1
Hunan Academy of Forestry, Shao Shan South Road, No. 658, Changsha 410004, China
2
National Engineering Research Center of Oiltea Camellia, Shao Shan South Road, No. 658, Changsha 410004, China
3
Hunan Key Laboratory of Economic Crops Genetic Improvement and Integrated Utilization, School of Life and Health Sciences, Hunan University of Science and Technology, Xiangtan 411201, China
*
Authors to whom correspondence should be addressed.
These authors contributed equally to this work.
Processes 2024, 12(7), 1332; https://doi.org/10.3390/pr12071332
Submission received: 20 May 2024 / Revised: 14 June 2024 / Accepted: 19 June 2024 / Published: 27 June 2024
(This article belongs to the Special Issue Advanced Drying Technologies in Food Processing)

Abstract

:
The drying process employed for camellia seeds has a significant impact on the quality of camellia seed oil (CO), but research on its influence on the flavor of CO is limited. This study investigated the effects of two typical drying processes, sun-drying and hot-air-drying, on the volatile composition of CO using Gas Chromatography-Ion Mobility Spectrometry (GC-IMS) technology. The results revealed that the CO obtained from hot-air-drying seeds exhibited a higher content of saturated fatty acids, while the levels of unsaturated fatty acids decreased. Additionally, the acid value and peroxide value of the CO obtained from hot-air-drying seeds were also elevated. GC-IMS analysis detected a total of 53 volatile compounds (including monomers and dimers) in the CO. Notably, aldehyde compounds exhibited the highest relative content (38.56–40.75%), followed by alcohols (32.14–38.01%), acids (4.86–14.58%), and esters (3.61–17.73%), while ketones exhibited relatively lower content (2.33–3.75%). The fingerprint profiles indicated that most of the flavor compounds exhibited differences in their content between the two samples. Specifically, the relative abundance of complex aldehyde and ester compounds was higher in the hot-air-dried sample compared to the sun-dried one, while the relative content of acid compounds decreased significantly. The relative odor activity value (ROAV) method identified hexanal as the most important key aroma component in both oil samples. The fingerprint profiles combined with principal component analysis (PCA) demonstrated that GC-IMS can effectively distinguish samples obtained from different drying treatments. Therefore, through the adjustment of drying methods, CO with various flavor characteristics can be obtained. This study provides valuable theoretical and technical references for CO production and flavor research.

1. Introduction

Oil tea camellia (Camellia oleifera Abel.), an important woody oil crop in China, is predominantly cultivated in provinces such as Hunan, Jiangxi, Guangxi, Zhejiang, Fujian, and Hainan, with a long history of cultivation and utilization [1]. Camellia seed oil (CO) is extracted from the seeds of C. oleifera [2]. The fatty acid composition of CO is similar to that of olive oil, primarily composed of the monounsaturated fatty acid, oleic acid [2]. CO also contains specific physiologically active substances, such as tea polyphenols and camellia saponins, which are not found in olive oil [3,4]. Comprehensive research substantiates its anti-inflammatory, anti-tumor, and antioxidant activities, underscoring its substantial nutritional and therapeutic benefits [5,6]. Furthermore, the distinctive flavor of CO garners considerable appreciation among consumers in China’s southern regions [1]. The Chinese government have recently developed a plan to expand the planting area of C. oleifera to 6 million hectares by 2025, accompanied by a camellia seed oil production capacity of 2 million tons (https://www.forestry.gov.cn/c/www/ggjjlcy/90980.jhtml, accessed on 25 April 2024), which represents nearly a 3-fold increase compared to the CO production of 720,000 tons in 2020 [2].
Following harvest, camellia seeds undergo processes like drying and composting to increase oil content and decrease moisture level [2]. The rapid expansion of camellia seed production poses a significant challenge to the existing primary processing capacity in the short term. Drying constitutes a vital post-harvest procedure for camellia seeds, encompassing both conventional sun-drying and contemporary mechanical hot-air-drying practices in actual production. Traditional sun-drying methods are susceptible to weather conditions and exhibit a sluggish processing rate. As a substitute for these traditional methods, hot-air-drying has experienced widespread adoption. This technique boasts higher processing efficiency, enabling effective management of large quantities of camellia seeds within a condensed timeframe. Nonetheless, it necessitates supplementary expenses for fuel and equipment [7]. Other drying methods, such as microwaving and infrared, are mainly at the laboratory level and are less commonly used in actual production [7]. The quality of CO is intricately associated with post-harvest treatment. Such treatments exert intricate influences on the quality of both camellia seeds and their resultant oil. Notably, post-harvest processing significantly affects the fatty acid composition, acid value, and active components of CO [8,9,10]. However, there is limited research on the impact of different drying processes on the volatile components of CO.
Gas Chromatography-Ion Mobility Spectrometry (GC-IMS) has become extensively utilized for analyzing volatile compounds across various sectors, including flavor and fragrance, food flavor characterization, and the processing of fats and oils [11,12]. The use of GC-IMS for volatile compound analysis eliminates the need for sample pretreatment, facilitates swift detection, and ensures high sensitivity. In comparison to the widely employed Gas Chromatography-Mass Spectrometry (GC-MS), GC-IMS provides marked benefits in identifying low-molecular-weight aromatic compounds [13].
In this study, camellia seeds were obtained through two drying processes. The volatile components of CO were measured and analyzed using GC-IMS technology. Comparative analysis was conducted by employing fingerprinting and principal component analysis (PCA). The key aroma components were also identified.

2. Materials and Methods

2.1. Preparation of Oil Samples

Fresh camellia fruits were collected from the forestry station of the Hunan Academy of Forestry in October 2023. Some of the harvested fruits were spread out in the sun for 5 days until the fruits cracked open naturally, and the moisture content of the camellia seeds was about 25%. If any fruits did not crack open naturally, the seeds and peels were separated manually. The collected seeds were spread out in the sun for another 6 days until their moisture content was between 7% and 8% to facilitate the extraction of oils [14,15] and so that organic substances such as starch and soluble sugars were converted into oil thoroughly. The sun-drying period lasted from approximately 8:00 to 17:30. The highest temperatures ranged from 16 to 25 °C. Hot-air-drying was employed as an alternative, in which mature camellia fruits were dried at a temperature of 60 °C for 12 h to facilitate fruit cracking, and the moisture content of the camellia seeds was about 25%. Following manual selection, the seeds underwent hot-air-drying at 60 °C for another 12 h so that their moisture content is between 7% and 8%. Subsequently, the camellia seeds treated with the aforementioned drying processes were extracted, resulting in the production of oil samples y1 (sun-drying) and y2 (hot-air-drying).

2.2. Determination of Oil Contents and Quality Parameters

The fatty acid composition of the CO was analyzed through methyl esterification. The oil was converted into methyl esters using potassium hydroxide-methanol, extracted using n-hexane, and analyzed following the method described before [1,6]. The content of the tocopherols was analyzed following the previously described method using a Shimadzu (Kyoto, Japan) LC20A high-performance liquid chromatograph equipped with a Waters (Milford, MA, USA) Spherisorb ODS2 column (particle size 5 μm, 4.6–150 mm) [1]. Acid value determination was conducted according to GB/T 5530—2005 and peroxide value determination was conducted according to GB/T 5538—2005 [16].

2.3. Gas Chromatography-Ion Mobility Spectrometry Analysis

Sample preparation: An amount of 2 g of a CO sample was weighed and placed in a 20-mL headspace vial (Shandong Haineng Scientific Instrument Co., Ltd., Dezhou, China). Subsequently, the vial was incubated at 60 °C for 30 min before injection. Each sample was analyzed in triplicate to ensure accuracy and reliability.
Headspace injection conditions: The CTC-PAL 3 static headspace autosampler (CTC Analytics AG, Zwingen, Switzerland) was utilized. An incubation temperature of 60 °C, a duration of 30 min, an injection volume of 500 µL without splitting, an incubation speed of 500 r/min, and an injection needle temperature of 85 °C were used.
Gas chromatography (GC) analysis: The GC analysis was performed using an FlavourSpec ion mobility spectrometer (GAS mbH, Dortmund, Germany). The chromatographic separation was performed on an MXT-5 capillary column (15 m × 0.53 mm × 1 μm, Restek, Beijing, China). The column temperature was maintained at 60 °C, and high-purity nitrogen (purity ≥ 99.999%) was used as the carrier gas. The pressure program consisted of an initial flow rate of 2.00 mL/min for 2 min, followed by a linear increase to 10.00 mL/min over 8 min and a subsequent linear increase to 100.00 mL/min within 10 min, with a hold time of 10 min. The total chromatographic run time was 40 min, and the injection port temperature was set to 80 °C.
Ion Mobility Spectrometry (IMS) conditions: The ionization source used was tritium (3H). The length of the drift tube was 53 mm, and the electric field strength was set at 500 V/cm. The drift tube temperature was maintained at 45 °C. High-purity nitrogen gas (purity ≥ 99.999%) was used as the drift gas, with a flow rate of 75 mL/min. The IMS analysis was operated in positive ion mode.

2.4. Qualitative and Quantitative Analysis of GC-IMS

The mixed standard solution, comprising six ketones (2-butanone, 2-pentanone, 2-hexanone, 2-heptanone, 2-octanone, and 2-nonanone) (Aladdin Biochemical Technology Co., Ltd., Shanghai, China), was subjected to analysis. Calibration curves were established for retention time and retention index. The retention index of each individual ketone was calculated based on its corresponding retention time. The VOCal software (version 0.4.03), equipped with the GC retention index database (NIST 2020) and IMS migration time database, was employed for retrieval and comparison of the target substances. Qualitative analysis of the target compounds was conducted. The relative content (Ci) of various volatile organic compounds was determined using the peak volume normalization method and computed as (Ai/AT) × 100%; Ai/AT represented the volume ratio of any signal peak to the sum of all signal peaks. The VOCal data processing software (version 0.4.03) was employed, incorporating plugins such as Reporter, Gallery Plot, and Dynamic PCA, to generate three-dimensional spectra, two-dimensional spectra, differential spectra, fingerprint spectra, and PCA plots for the volatile components. These analytical tools facilitated the comparison of volatile components among different samples.

2.5. Determination of Key Aroma Compounds

The relative odor activity value (ROAV) is utilized to assess the contribution of each aroma component to the overall aroma of the sample [17,18]. Initially, the ROAVmax is defined as 100 for the aroma compound that has the greatest influence on the overall aroma of the sample (i.e., the compound with the highest C/T value). Subsequently, the ROAVi for each compound is computed as (Ci/Cmax)/(Ti/Tmax) × 100, where Cmax and Tmax represent the relative percentage content and sensory threshold of the compound that contributes the most to the overall aroma and Ci and Ti denote the relative percentage content and sensory threshold of the other compounds. Ci is the calculated mass concentration of any compound in µg/L, and it is computed as (Cis × Ai)/AIS. Cis is the mass concentration of the internal standard used in µg/L, and Ai/AIS is the volume ratio of any signal peak to the signal peak of the internal standard. It is worth noting that the ROAV value falls within the range of 0 to 100, with higher values indicating a more substantial contribution of the compound to the overall aroma of the sample. Compounds with ROAV values greater than or equal to 1 are generally recognized as the key aroma compounds of the sample, while compounds with ROAV values in the range of 0.1 to 1 also make a relatively significant contribution to the overall aroma.

2.6. Statistical Analysis

All experiments were replicated thrice, and the results were expressed as means ± standard deviation. The data were subjected to statistical analyses using IBM SPSS Statistics version 17.0 software (IBM SPSS Inc., Armonk, NY, USA). A p-value less than 0.05 was deemed statistically significant.

3. Results and Discussion

3.1. Fatty Acid Composition and Quality Parameters of CO Samples

The present study investigated the impact of two different drying processes on the fatty acid composition and quality parameters of CO (Table 1). Camellia seeds were dried using hot-air-drying and sun-drying, and the oil was subsequently extracted using solvent extraction. The results revealed that the major fatty acids in CO were palmitic, stearic, oleic, linoleic, linolenic, and arachidonic acid, which is consistent with the previous research results [1,2,6].
Drying had a significant influence on the fatty acid profile of CO. Specifically, the oil extracted from seeds dried using hot-air exhibited higher levels of saturated fatty acids, particularly palmitic and stearic acid, compared to the oil derived from sun-dried seeds. Conversely, the content of unsaturated fatty acids, especially oleic and linoleic acid, decreased in the oil from hot-air-dried seeds. This can be attributed to the higher temperatures during hot-air-drying, which accelerated the hydrolysis and decomposition of unstable unsaturated fatty acids [19,20].
Interestingly, the two processing methods had a negligible effect on the content of the primary antioxidant, vitamin E, in CO. However, the oil obtained from hot-air-dried seeds displayed a higher acid value and peroxide value, consistent with previous reports [8]. This suggests that the elevated processing temperatures during hot-air-drying accelerate the hydrolysis and oxidation of triglycerides, leading to reduced oil quality. It should be pointed out that the acid and peroxide values of both samples are significantly lower than the national standard for crude CO (acid value, ≤4.0 mg/g; peroxide value, ≤0.25 g/100 g) [21]. These results indicate that both drying methods are capable of producing CO that meets the requirements.

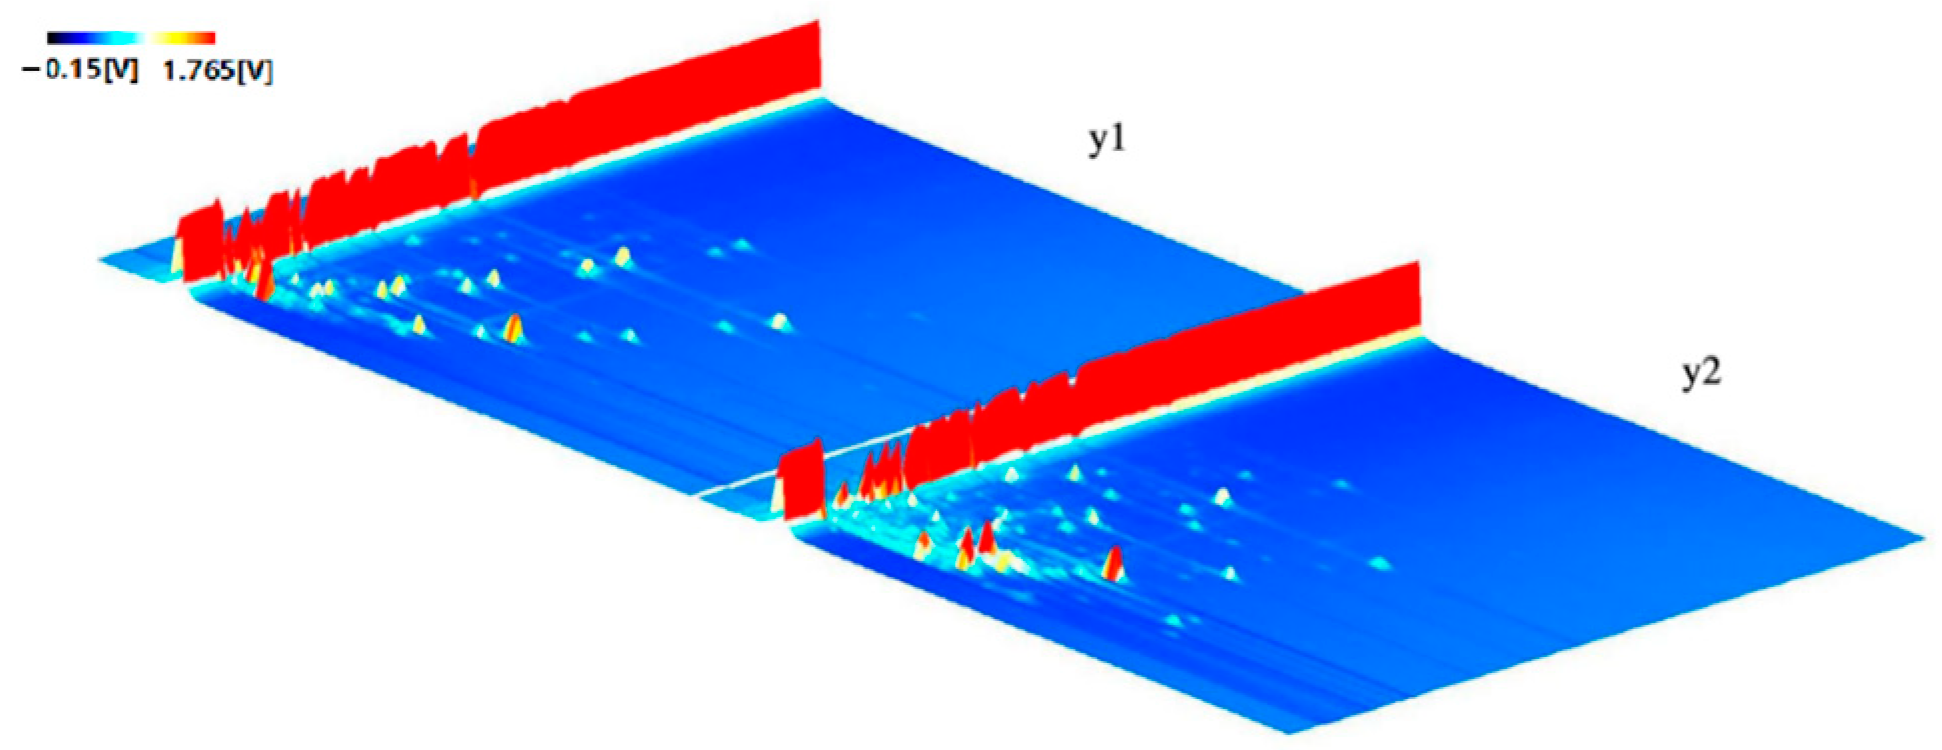
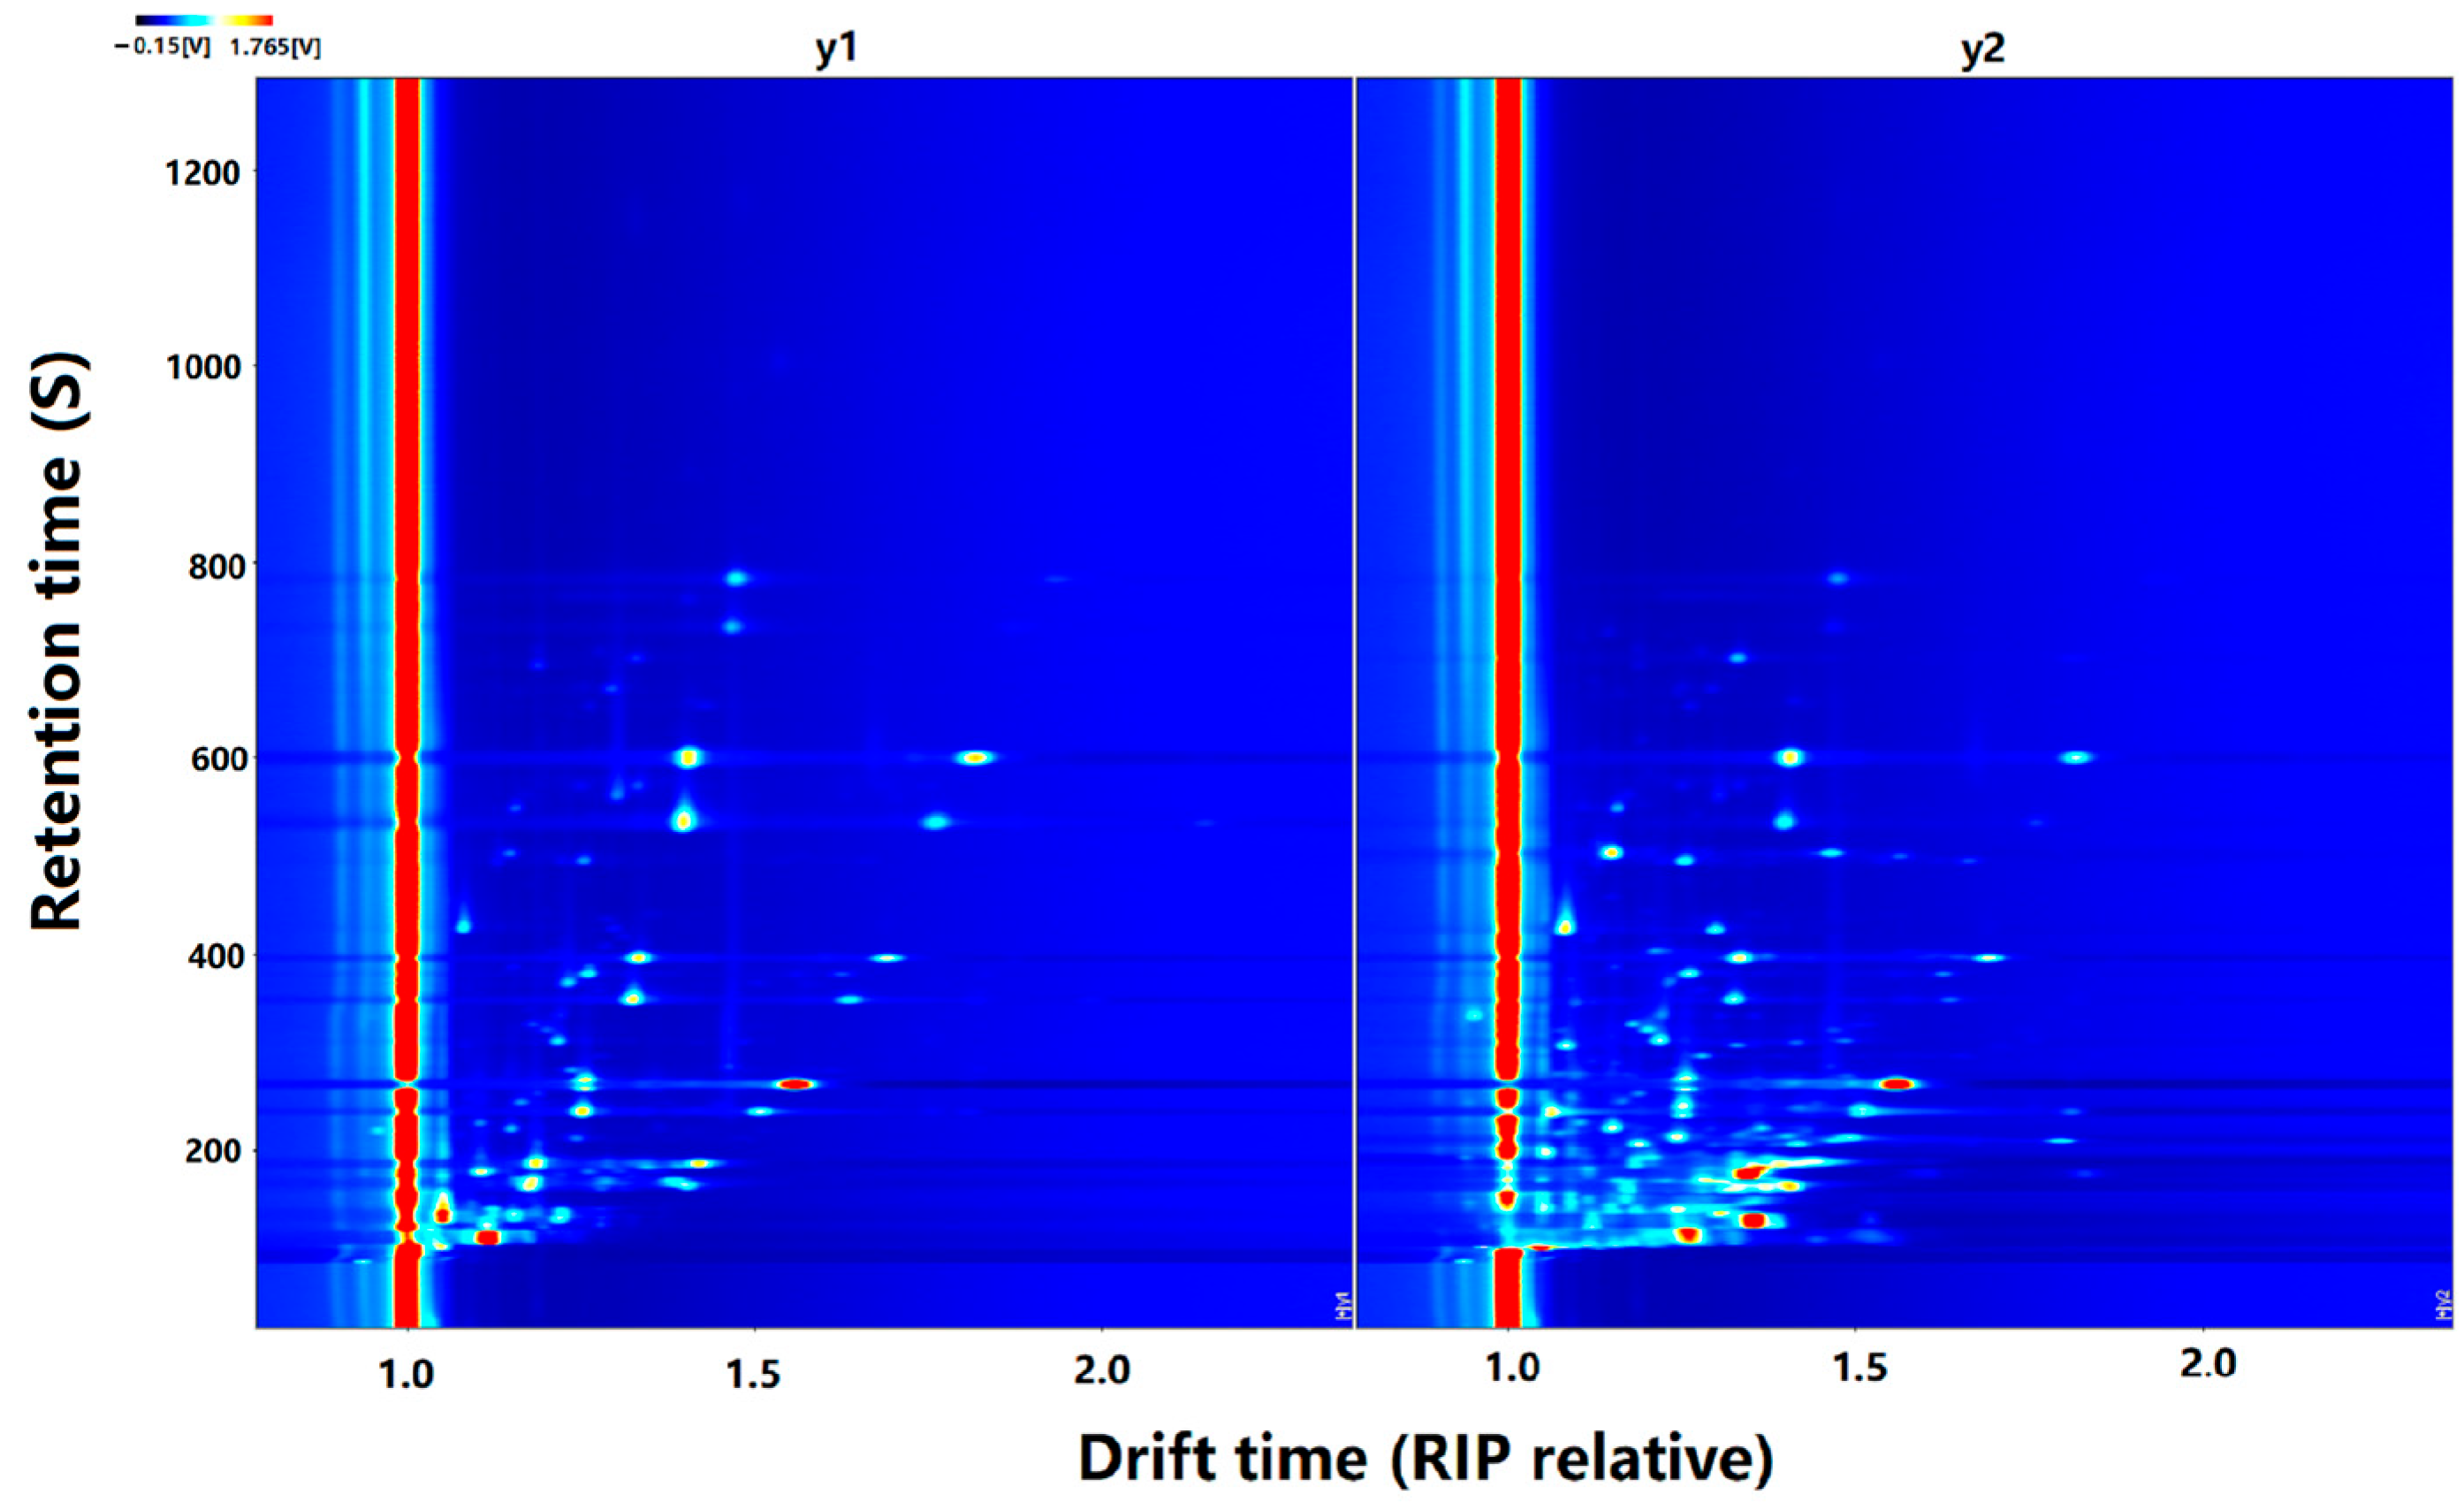
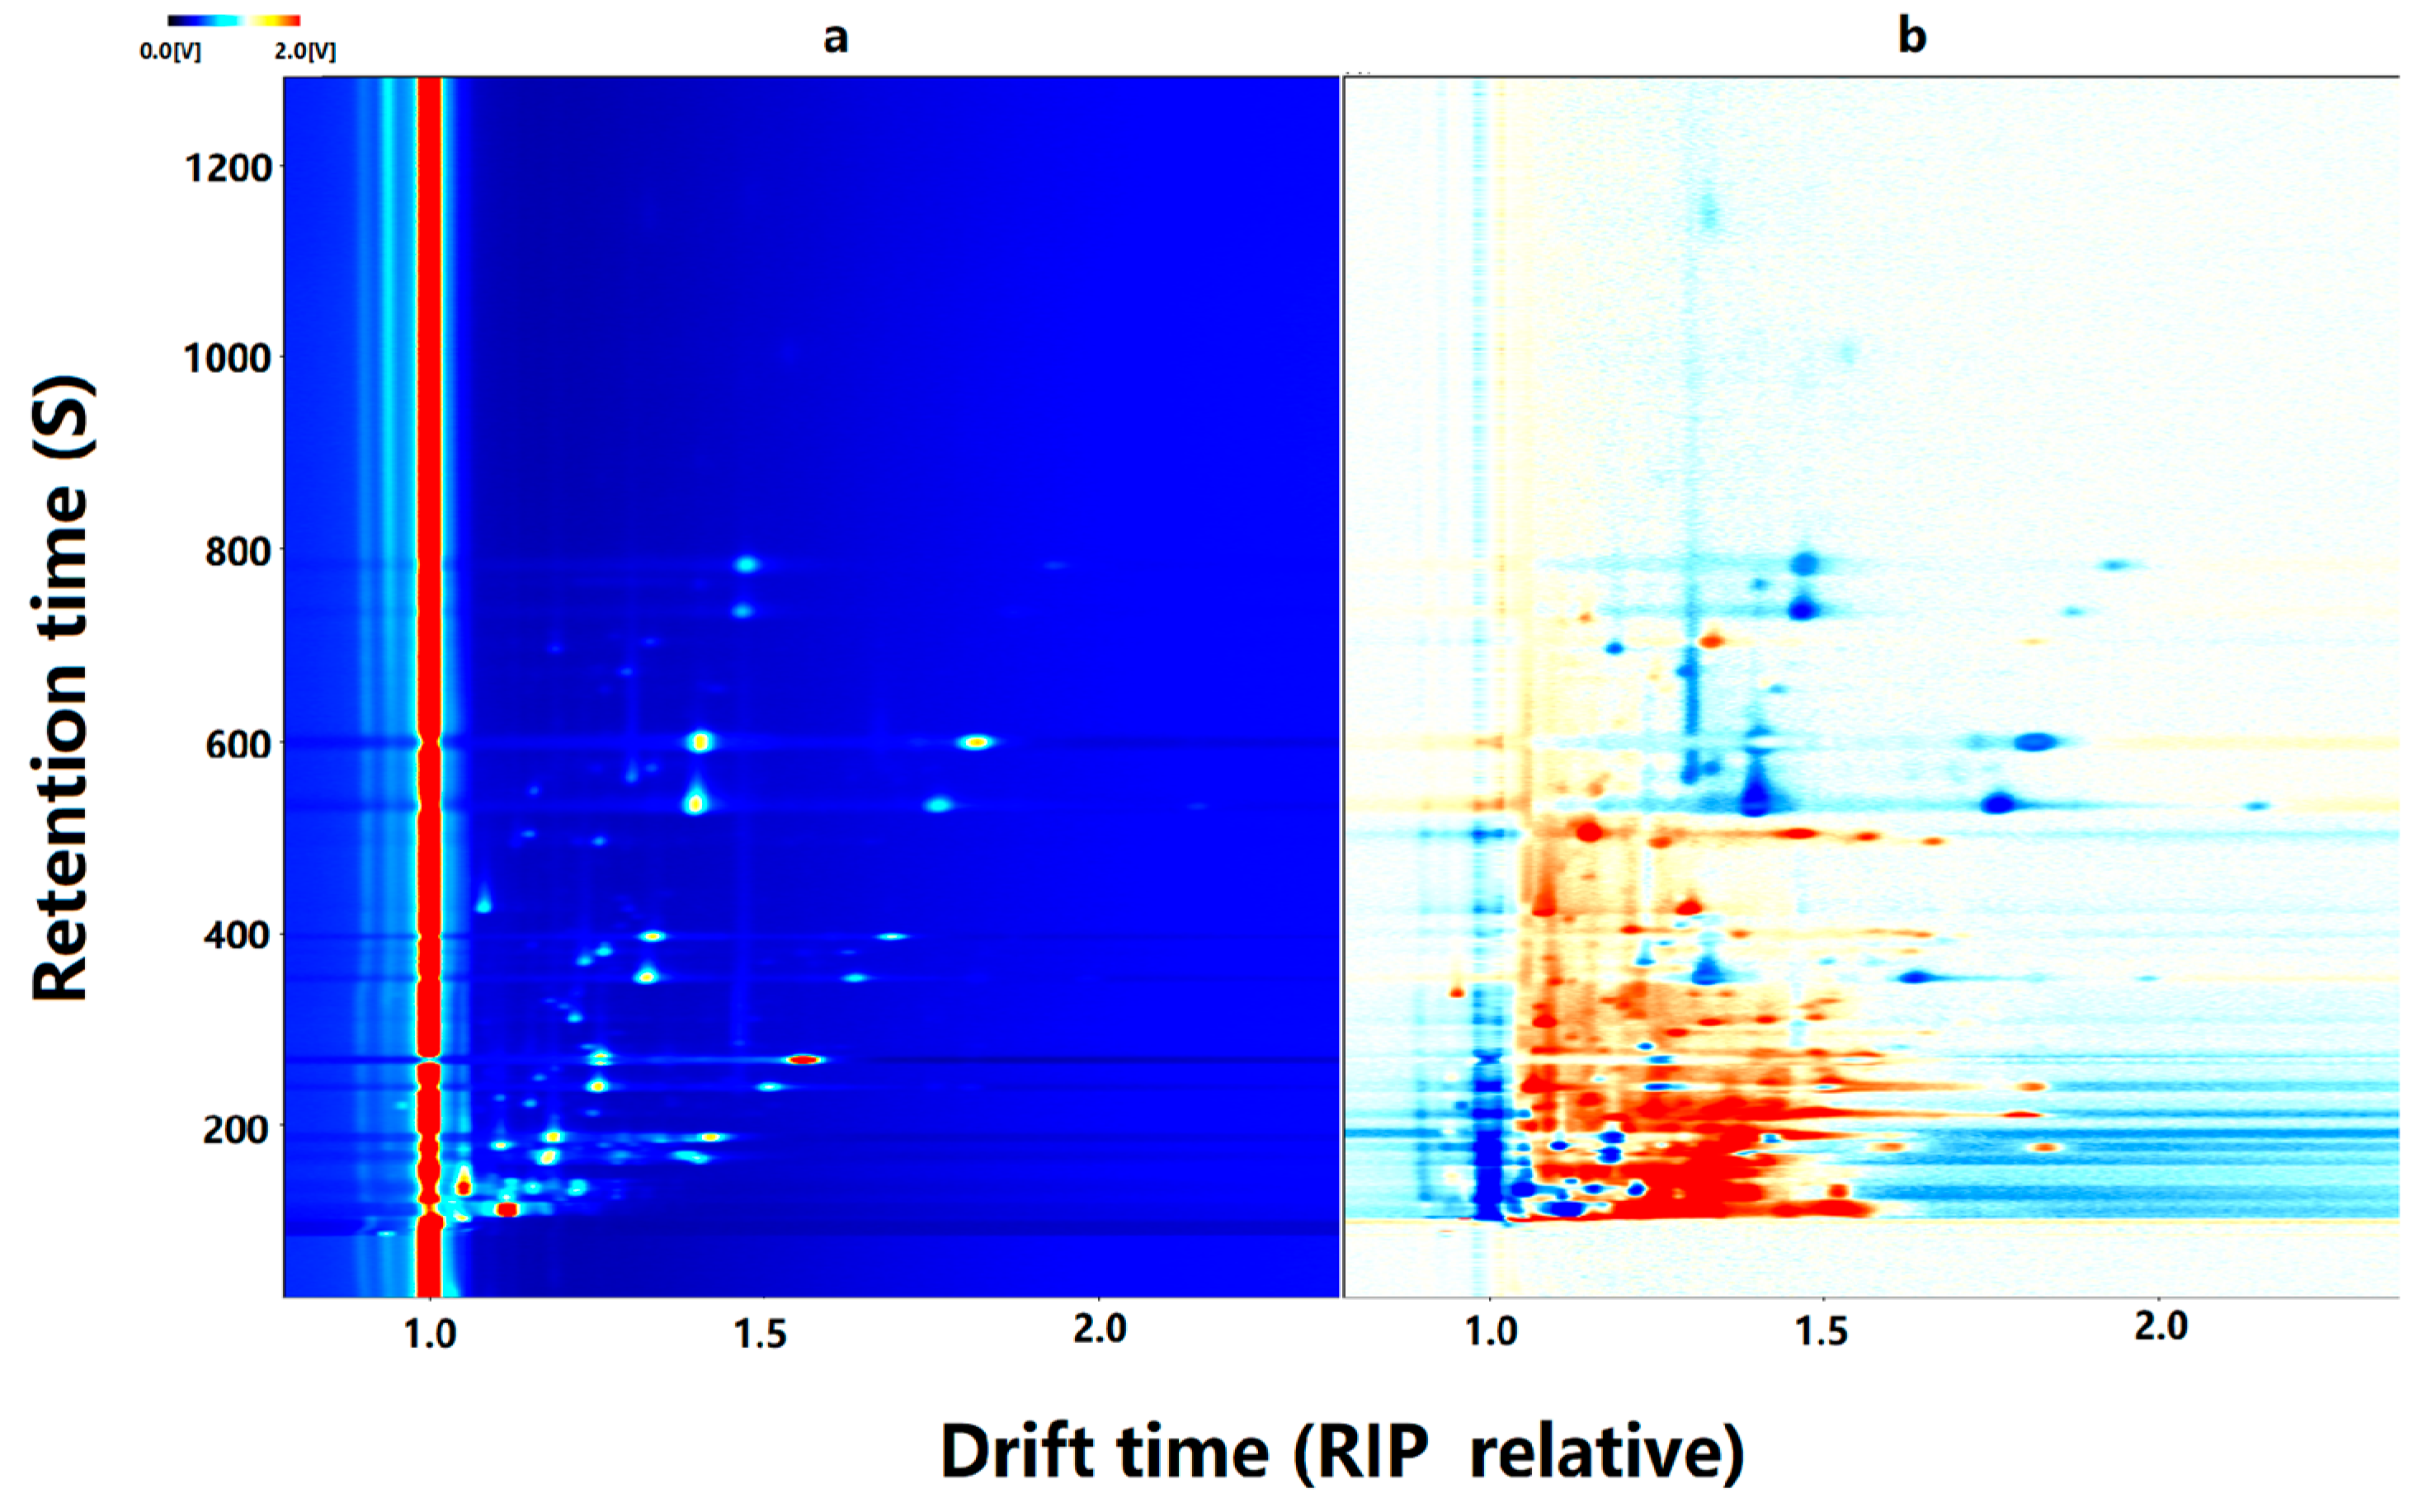
3.2. GC-IMS Topography of CO Samples

Figure 1 delineates the three-dimensional spectra of GC-IMS, wherein the axes portray relative migration time (x-axis, normalized), gas chromatography retention time (y-axis, in seconds), and signal peak intensity (z-axis). Figure 2 offers a bird’s-eye view of the three-dimensional spectra. Within Figure 1 and Figure 2, the red vertical line positioned at coordinate 1.0 signifies the reaction ion peak (RIP), denoting the reaction ion peak post-normalization. The points flanking the RIP peak denote volatile compounds, with color coding representing peak intensity, ranging from blue to red, with deeper hues indicating greater peak intensities.
The results depicted in Figure 1 and Figure 2 demonstrate the successful separation of volatile compounds in the oil extracted from camellia seeds processed using different drying processes through GC-IMS technology. Although the flavor compounds in the oils from both processing methods exhibit similarity, there are noteworthy variations in signal intensity. Specifically, the peak intensities of select volatile compounds in the oil sample obtained from hot-air-dried seeds are significantly higher compared to those in the oil sample obtained from sun-dried seeds, suggesting a higher concentration of these volatile compounds in the oil obtained from hot-air-dried seeds.
To conduct a more comprehensive comparison of volatile compounds among various samples, the differential contrast spectrum was derived by subtracting the spectral map of y2 from the spectral map of y1, as demonstrated in Figure 3. In this figure, red spots indicate substances with concentrations higher in the target sample than the y2 sample, while blue denotes substances with concentrations lower in the target sample compared to the y1 sample. The depth of color signifies the magnitude of differences.
Analysis of Figure 3 reveals numerous red spots and a few blue spots on the differential contrast spectrum. This observation suggests that the concentration of the most volatile compounds in the oil sample obtained from hot-air-dried seeds surpasses that in the oil sample obtained from sun-dried seeds. Nevertheless, some volatile compounds exhibit relatively lower concentrations in the oil sample obtained from hot-air-dried seeds compared to the sun-dried ones. These findings underscore significant disparities in volatile compound content between the oil samples from the two drying processes, implying that heat drying facilitates the extraction of oil from camellia seeds with discernible flavor profiles.

3.3. Fingerprint Study of VOCs in CO Samples

The volatile compounds in the oil samples extracted from camellia seeds were analyzed using GC-IMS. The ion peaks were then consolidated to generate a fingerprint spectrum of the volatile compounds, as illustrated in Figure 4. In this figure, each row corresponds to the signal peaks selected from a particular sample, while each column depicts the signal peaks of the same volatile compound across different samples. Brighter spots on the spectrum indicate higher concentrations of compounds.
Figure 4 illustrates the detection of a total of 53 volatile compounds (including monomers and dimers) in the oil samples extracted from camellia seeds subjected to two different drying processes, as analyzed using GC-IMS. These compounds consist of 19 aldehydes, 17 alcohols, 7 acids, 4 esters, 4 ketones, and 2 unidentified substances. Due to the limitations of current research methods, we did not find any specific substances unique to CO. However, considering that two volatile substances were not identified, the possibility of the presence of specific volatile compounds in CO cannot be ruled out.
The two oil samples are visually discernible, and they are denoted by regions A and B in the figure. Region A corresponds to the higher concentration of 19 volatile compounds identified in the oil sample obtained from sun-dried camellia seeds, including nonanal (monomer and dimer), octanal (monomer and dimer), 1-heptanol (monomer and dimer), propionic acid, acetic acid (monomer and dimer), 1-hexanol (monomer and dimer), pentanal (monomer), n-pentanal (dimer), 1-pentanol (monomer and dimer), 1-octanol (monomer and dimer), and hexanoic acid (monomer and dimer).
Region B comprises 28 volatile compounds detected in the oil sample obtained from camellia seeds dried using hot air, exhibiting higher concentrations. These compounds encompass benzaldehyde (monomer and dimer), butyrolactone (monomer and dimer), 3-methylbutanoic acid (monomer and dimer), methyl butyrate, 3-methyl-1-butanol (monomer and dimer), 2-methylbutanal, ethyl acetate, 1-propanol (dimer), 2-butanone, (E)-2-octenal (monomer and dimer), 2-octanone (monomer and dimer), furfural (monomer and dimer), 1-butanol (dimer), 2-methyl-1-propanol (monomer and dimer), 3-hydroxy-2-butanone, (E)-2-octen-1-al (monomer and dimer), 1-penten-3-ol, and two unidentified volatile compounds. Moreover, four volatile compounds, namely hexanal (monomer and dimer) and heptanal (monomer and dimer), exhibited comparable concentrations in both samples. These results signify notable disparities in the concentrations of the majority of volatile compounds between the two oil samples.

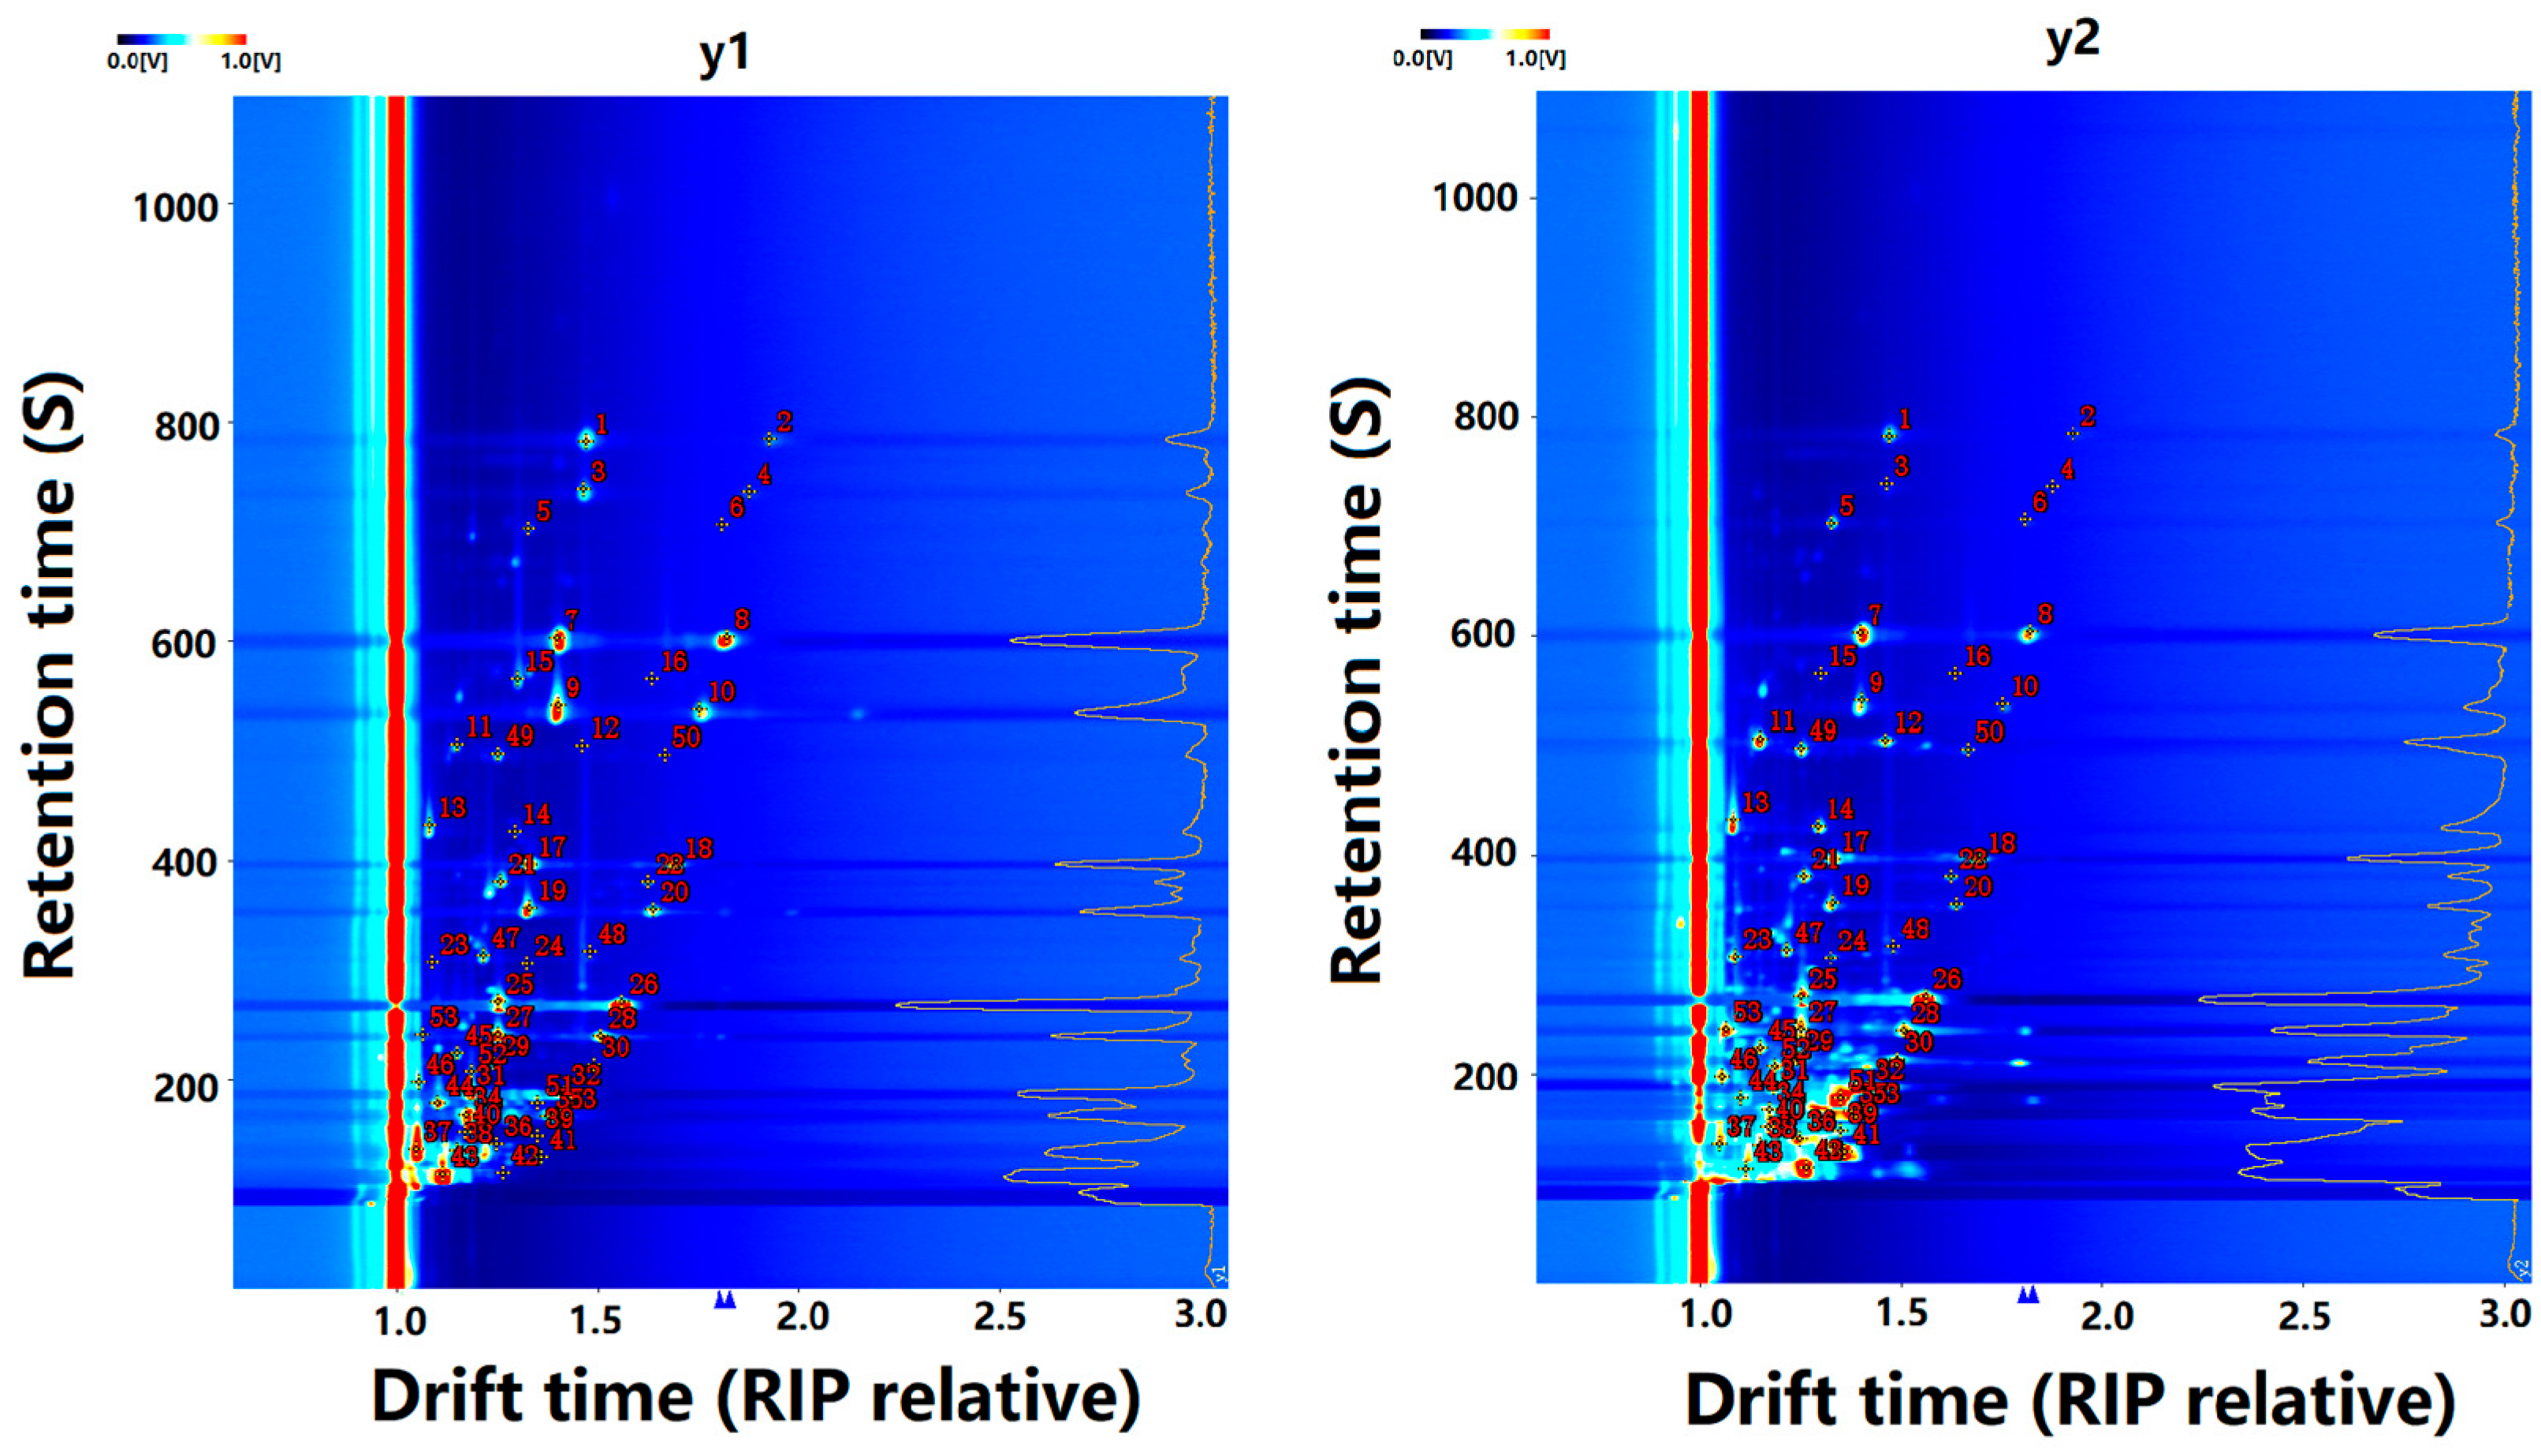
3.4. Identification of VOCs in CO Samples

The GC-IMS qualitative spectra of volatile compounds in oil samples from camellia seeds dried using two distinct methods are presented in Figure 5, indicating signals corresponding to 53 volatile compounds detected in both samples. As depicted, these volatile compounds primarily manifest within the retention time range of 100–800 s and the drift time range of 1.0–2.0 ms. Notably, compounds exhibit a concentration peak within a retention time of 300 s, while dispersion is evident between 300–800 s.
Table 2 presents the specific names and relative contents of the substances. It is observed that certain compounds exist in dimeric forms, exhibiting comparable retention times to monomers but distinct drift times, as indicated in Table 2. Notably, aldehyde compounds exhibit the highest relative content (38.56–40.75%), followed by alcohols (32.14–38.01%), acids (4.86–14.58%), and esters (3.61–17.73%), while ketones exhibit relatively lower content (2.33–3.75%).
Aldehyde compounds dominate as the most abundant volatile constituents in the two CO samples, with a total of 19 aldehydes (monomers and dimers) being detected. In the sun-dried sample, hexanal (12.63%), octanal (10.35%), and heptanal (5.31%) exhibit comparatively higher concentrations among the aldehydes. Similarly, in the hot-air-dried sample, hexanal (11.39%) and octanal (6.54%) also show relatively higher concentrations among the aldehydes. The formation of aldehyde compounds arises from various chemical reactions, including the oxidative degradation of fatty acids, Maillard reactions, or Strecker degradation of amino acids [17,22,23]. Predominantly, aldehydes stem from the breakdown of hydroperoxides formed during the decomposition of oleic acid, linoleic acid, and linolenic acid [24]. Hexanal is synthesized via the lipoxygenase (LOX) pathway from linoleic acid, contributing to the characteristic grassy aroma of CO and olive oil [17,25,26,27,28,29]. Studies have shown that hexanal content significantly varies with the increasing roasting temperature of camellia seeds, initially rising then declining, possibly due to the enhanced preservation of LOX activity at lower temperatures [30]. Octanal and heptanal primarily result from the oxidative degradation of oleic acid [31,32,33,34].
In the oil sample obtained from hot-air-dried camellia seeds, the relative concentrations of benzaldehyde, furfural, and 2-methylbutanal are higher compared to those in the oil sample obtained from sun-dried camellia seeds. This discrepancy can be attributed to the higher drying temperature employed during the hot-air-drying process, which facilitates reactions occurring at elevated temperatures and leads to the formation of more complex aldehyde compounds. For example, benzaldehyde is a product of the Strecker degradation of tyrosine and is primarily associated with aromatic and popcorn-like aromas [35]. Furfural, on the other hand, is a characteristic product of the Maillard reaction and is mainly linked to the aromas of bread, almonds, and sweetness [36]. Studies have also indicated that furfural is the primary contributor to the nutty aroma in oil derived from camellia seeds after microwave pretreatment [17]. The traditional steaming and roasting methods applied to camellia seeds involve prolonged exposure to high temperatures and humidity, which promote the Maillard reactions in the camellia seeds. However, it is important to note that furfural compounds pose potential safety concerns, as the absorption of certain doses of furfural may have adverse effects on human health [37].
A total of 17 alcohol compounds were identified as volatile compounds in the two oil samples, and their overall concentration was relatively high. In the oil sample obtained from sun-dried camellia seeds, 1-propanol (11.84%), 1-octanol (9.52%), and 1-pentanol (5.08%) exhibited higher relative concentrations among the alcohols. Notably, 1-propanol accounted for the highest relative concentration (11.09%) as a monomer in this oil sample. In the oil sample obtained from hot-air-dried camellia seeds, the alcohols with higher relative concentrations were 1-propanol (9.04%), 1-octen-3-ol (6.35%), and 1-pentanol (5.08%). Alcohols are typically formed through the oxidation of fatty acids or the reduction in aldehydes [38]. A comparison revealed that, in the oil sample obtained from hot-air-dried camellia seeds, 1-propanol was predominantly present as a dimer, accounting for 7.06% of the volatile compounds. This concentration was significantly higher than that of the monomer, which differed from the situation in the oil sample obtained from sun-dried camellia seeds. A similar trend was observed for 1-butanol and 1-pentanol. The specific mechanisms underlying their formation warrant further investigation. Furthermore, the relative concentration of 1-octanol in the oil sample obtained from hot-air-dried camellia seeds was significantly lower, at 2.97%, compared to that in the oil sample obtained from sun-dried camellia seeds. Conversely, the relative concentration of 1-octen-3-ol was noticeably higher at 1.02% in the oil sample obtained from hot-air-dried camellia seeds compared to its concentration in the oil sample obtained from sun-dried camellia seeds. Alcohols are typically associated with fruity and fresh flavors. Notably, 1-Pentanol, a volatile compound commonly found in edible oils, exhibits characteristics of both a fatty and fruity aroma. Jia et al. also detected the presence of 1-octen-3-ol and 1-pentanol in virgin CO, and their odor descriptions were similar to the sensory attributes observed in virgin olive oil [39]. These compounds are generated through the LOX pathway from linoleic acid and linolenic acid, respectively [40,41].
There is a notable divergence in the relative proportions of acidic compounds among the volatile constituents in the oil samples despite only seven types being detected. In the oil sample obtained from sun-dried camellia seeds, acetic acid (9.33%) displayed the highest relative concentration among the acidic compounds. Similarly, in the oil sample obtained from hot-air-dried camellia seeds, acetic acid (2.90%) also exhibited the highest relative concentration among the acids, although it was significantly lower compared to the sun-dried camellia seeds. Acetic acid typically arises from lipid hydrolysis and oxidation and is prevalent in vegetable oils, contributing to an unpleasant aroma of vinegar [42]. Neugebauer et al. demonstrated that acidification in olive oil correlates with elevated concentrations of carboxylic acids compared to extra virgin olive oil [43].
There is a considerable disparity in the relative proportions of ester compounds among the volatile constituents in the oil samples, with only four types being detected. In the oil sample obtained from hot-air-dried camellia seeds, ethyl acetate comprised 10.46%, making it the compound with the highest relative concentration in this sample, while it was only 0.20% in the sun-dried CO sample. The relative concentration of butyl acetate was only 2.81% in the sun-dried CO sample, but it increased to 5.67% in the hot-air-dried sample. Ester compounds typically confer distinct fruity aromas to oils, primarily originating from the LOX pathway (the alcoholic portion of ester compounds is synthesized through the LOX pathway) and non-LOX pathways (the alcoholic portion of ester compounds is not synthesized through the LOX pathway) [41]. Ethyl acetate is typically formed by the esterification reaction of acetic acid, derived from fatty acids via β-oxidation, with ethanol. It is also a major fruity-aroma ester-compound in extra virgin olive oil [30]. Following hot-air-drying, there is a notable decrease in the relative concentration of acidic compounds and a significant increase in ester compounds compared to sun-drying. This could be attributed to the generation of more ester compounds through the esterification of acids and alcohols during the hot-air-drying process.
Ketones are typically derived from the Maillard reaction or the further oxidation of aldehydes. In the volatile compounds of the oil samples in this study, ketone compounds exhibited relatively low concentrations, which can be attributed to the low temperatures used in the drying and oil extraction processes. Most ketone compounds are known for their aromatic and creamy flavors, but they have high thresholds and make minimal contributions to the overall flavor profile [35]. However, ketone compounds can still interact synergistically with other flavor compounds, enhancing the overall richness of the flavor [31]. Lin et al. also detected 2-butanone, presenting fruity aromas, in oolong tea, primarily formed through lipid degradation [44]. In the study conducted by He et al., it was found that 3-hydroxy-2-butanone is an aroma compound responsible for the buttery and creamy odors in CO samples extracted by microwave-assisted methods, primarily originating from the Maillard reaction [34,45].

3.5. Identification of Key Aroma Compounds

The odor detection thresholds of volatile compounds and sensory descriptions of some key compounds (with ROAV ≥ 0.1) were found by consulting the relevant books [46], literature [30], and websites [47]. The ROAV values were calculated, and the results are presented in Table 3.
Aldehydes are known to possess aromas characterized by fatty, grassy, and fruity notes [48]. In comparison to their isomeric counterparts, ketones, aldehydes exhibit lower odor thresholds, resulting in a more pronounced impact on the flavor profile of CO [49]. The analysis presented in Table 3 reveals that octanal emerges as the most significant key aroma compound in both oil samples, contributing primarily to a fatty, lemony, and grassy aroma, thereby making the most substantial overall contribution to the aroma profile. Another noteworthy aroma compound with an ROAV ≥ 1 is decanal, which also imparts grassy and fatty aromas. Kesen et al. observed that octanal is one of the prominent aroma compounds in Memecik olive oil, imparting citrus and lemon aromas to the oil [30]. Decanal has likewise been identified as a major aroma compound in the majority of European olive oils [50,51]. Furthermore, the oil samples derived from sun-dried camellia seeds feature another key aroma compound with an ROAV ≥ 1, namely nonanal. Nonanal is characterized by a fatty, citrusy, and grassy aroma and has been reported as a significant aroma compound in CO [52,53]. Siegmund et al. have also determined that octanal and nonanal contribute to a fresh and slightly grassy aroma in pumpkin seed oil [54]. Furthermore, there are several additional key aroma compounds with ROAV values equal to or greater than 0.1. These compounds comprise decanal dimers, (E)-2-octenal, heptanal, hexanal, pentanal, n-pentanal dimers, 2-methylbutanal, and (E)-2-heptenal. While these compounds add to the complexity of the oil’s aroma by imparting nutty, almond-like, malty, and cocoa-like fragrances, their intensities are comparatively weaker.
In this study, the oil samples derived from camellia seeds processed using two different drying processes were analyzed. It was found that the aldehydes were the predominant volatile compounds that significantly contributed to the sensory quality of the oil samples. While there were notable variations in the relative abundances of specific compounds, the key aroma compounds and sensory characteristics showed remarkable similarities between the two samples. These findings correspond well with previous research on the volatile compounds of cold-pressed CO, which undergoes processing at lower temperatures that may impede the formation of flavor compounds [30]. Consequently, these compounds could go undetected or be overlooked, underscoring the advantage of HS-GC-IMS for trace substance detection. However, future investigations should incorporate HS-SPME-GC-MS technology to compare and complement the findings, enabling a more comprehensive identification of the separated compounds and their potential impact on flavor. Additionally, integrating electronic nose and electronic tongue techniques will provide a deeper understanding of how various drying methods influence the volatile characteristics and sensory properties of the oil.
As the drying temperature increases, chemical reactions occur more rapidly within the camellia seeds, resulting in a stronger flavor profile. Therefore, higher drying temperatures are beneficial for producing CO with a robust flavor, while low temperatures are more suitable for producing a mild-flavored CO. Consequently, in industrial production, the choice of drying method can be tailored to suit the desired characteristics of the final product. Moreover, this study is limited by a narrow selection of drying methods, as it solely focuses on two drying techniques that have already been implemented in industrial settings. The discussion does not encompass emerging methods such as microwave, infrared, and vacuum drying.

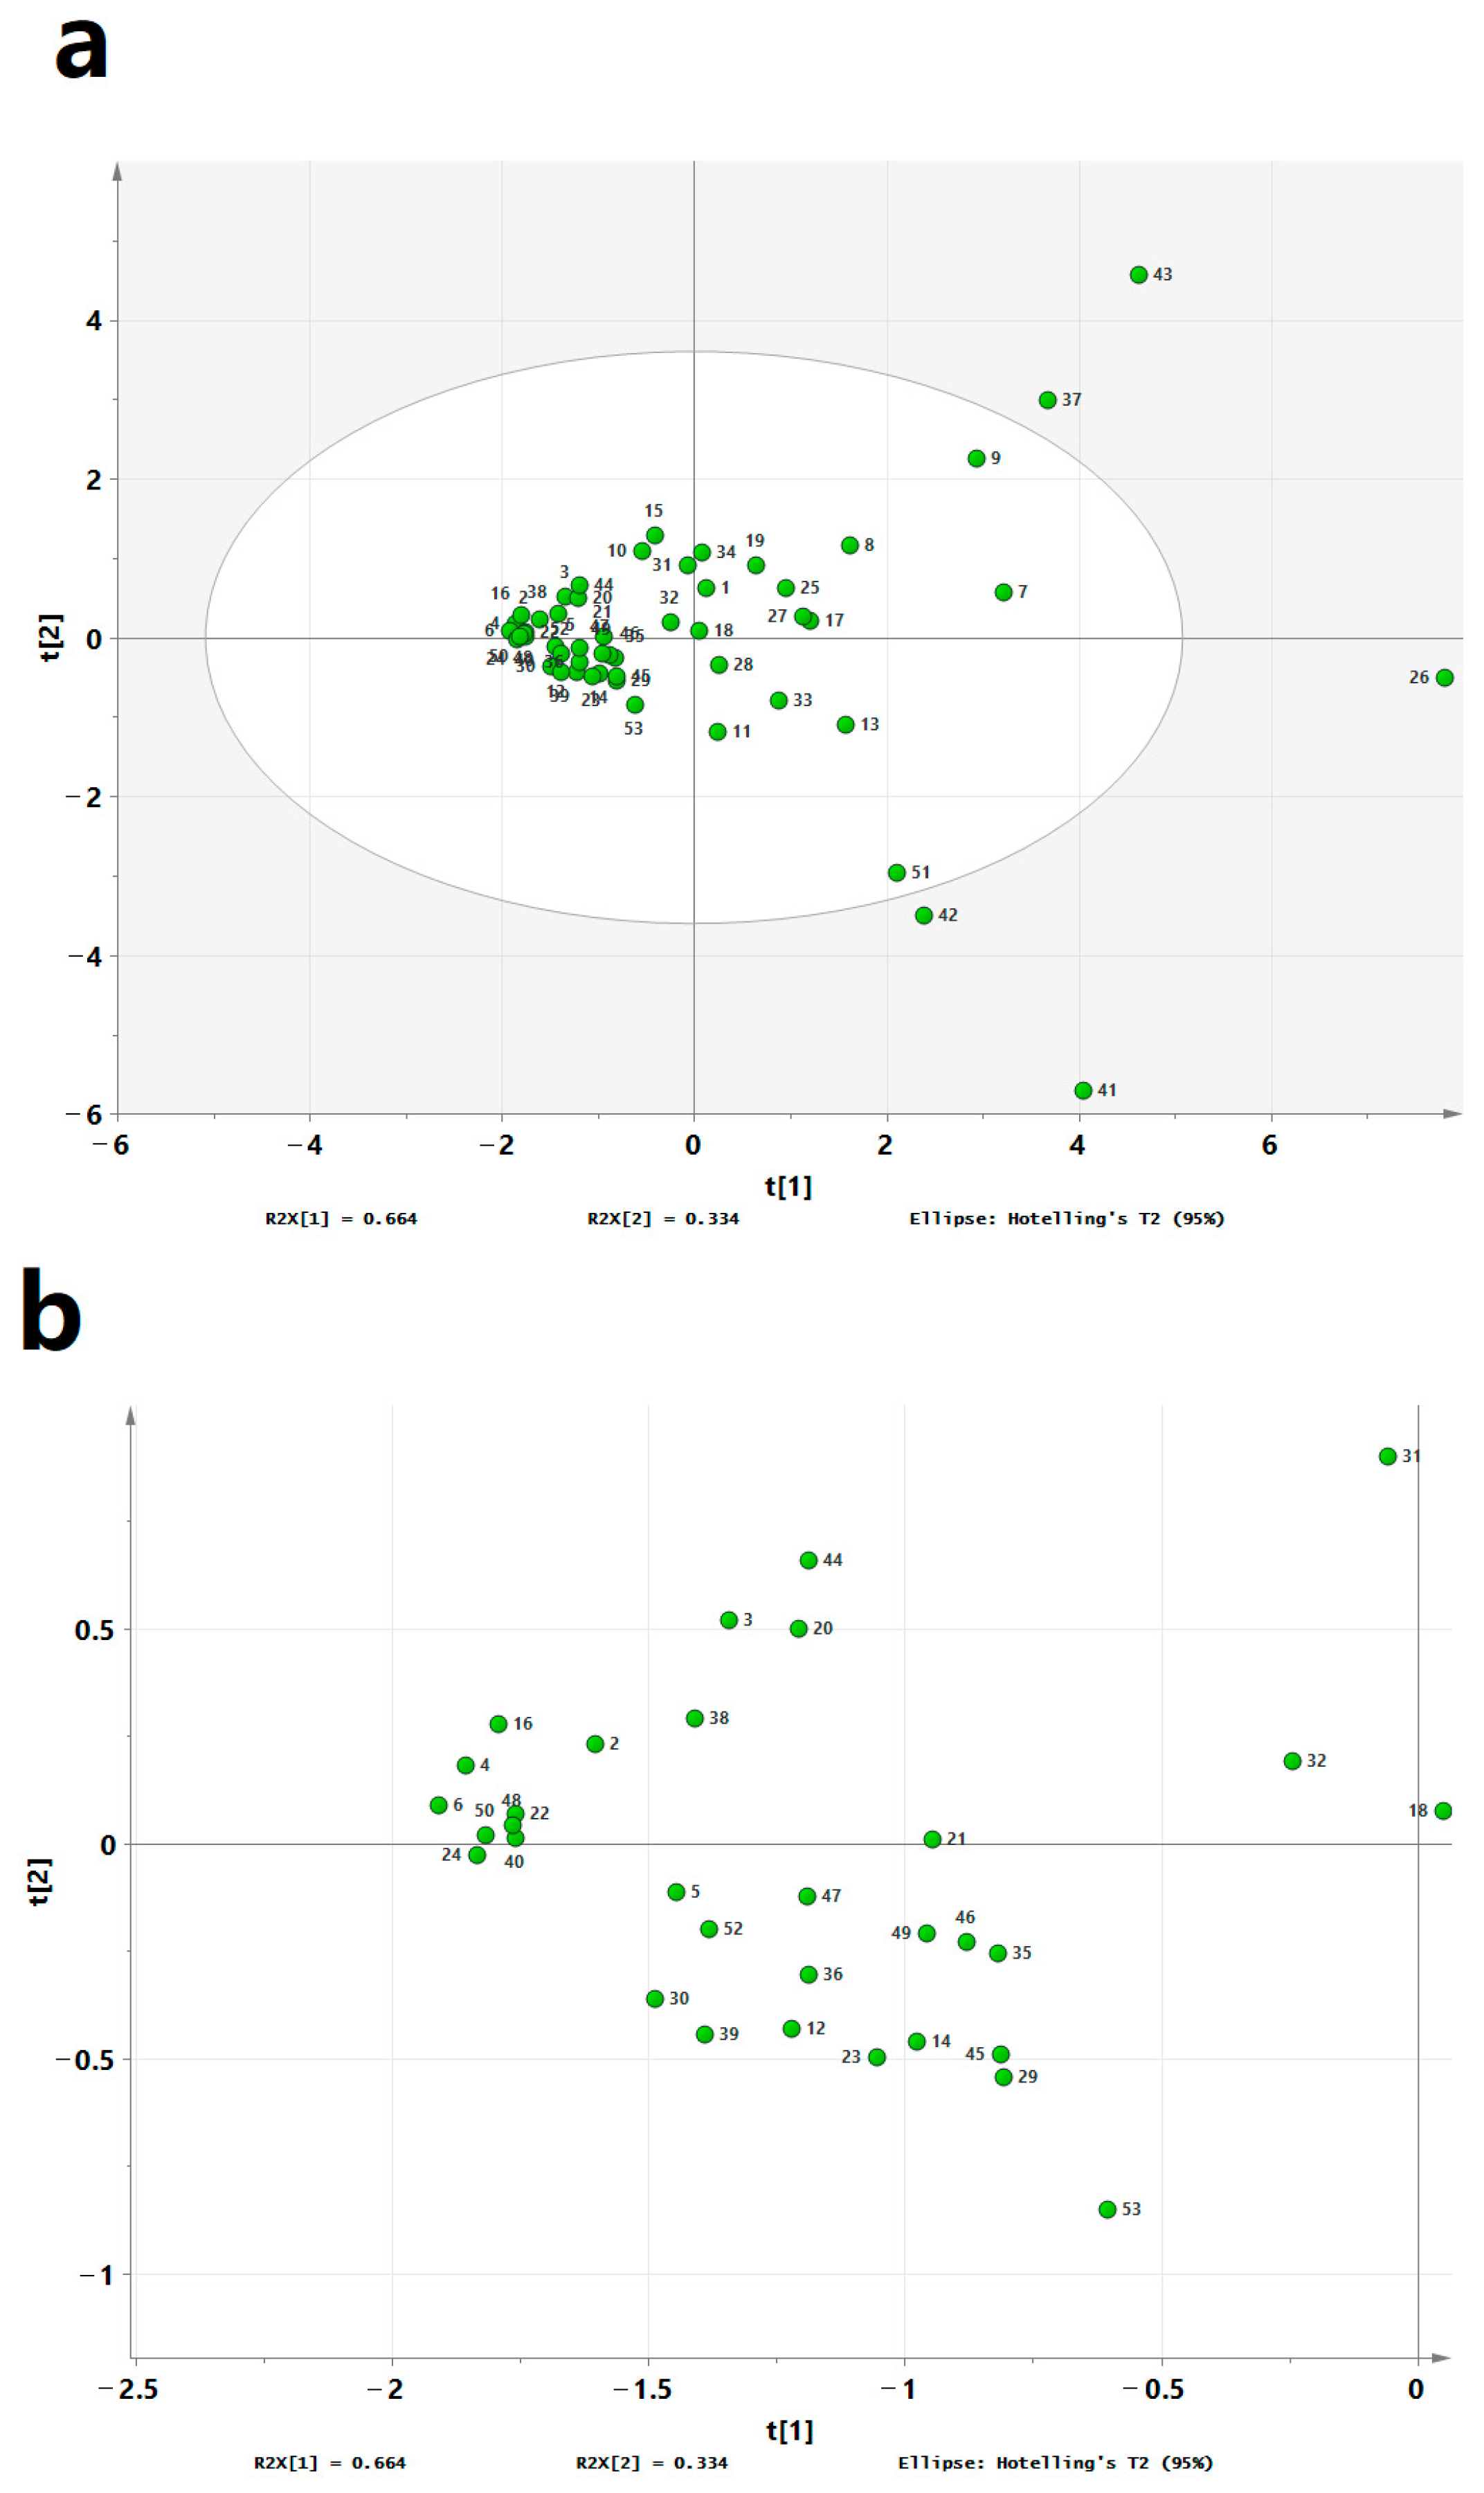
3.6. Principal Component Analysis of VOCs in CO Samples

Principal component analysis (PCA) was conducted to examine the composition of volatile compounds in the oil samples derived from camellia seeds processed using two different drying processes. The eigenvalues and variance contribution rates were computed, revealing that PC1 and PC2 had eigenvalues exceeding 1. These findings indicate that PC1 and PC2 play a crucial role in describing the variation in important aroma compounds. Together, PC1 and PC2 accounted for 99.8% of the total variability, with PC1 explaining 66.4% and PC2 explaining 33.4%. Thus, these principal components effectively capture the majority of information pertaining to the involved components, ensuring reliable parallelism among the samples.
Figure 6 displays the scatter plot depicting the distribution of variable loadings in the PCA model. From Figure 6, it is evident that the contribution of the 53 volatile component variables to the first two principal components is illustrated. Variables positioned closely to each other indicate a strong correlation among them. In the first principal component, significant absolute values of the characteristic vectors are observed for hexanal dimer (No. 26), 1-propanol monomer (No. 43), ethyl acetate (No. 41), acetic acid monomer (No. 37), octanal monomer (No. 7), 1-hexanol monomer (No. 19), 1-propanol dimer (No. 42), and 1-hexen-3-ol (No. 51). Similarly, the second principal component exhibits high absolute values of the characteristic vectors for ethyl acetate (No. 41), 1-propanol monomer (No. 43), 1-propanol dimer (No. 42), acetic acid monomer (No. 37), 1-hexen-3-ol (No. 51), and 1-heptanol monomer (No. 9).
The scatter plot in Figure 7 illustrates the distribution of sample scores in the PCA model. It is clear from the figure that the oil samples derived from sun-dried (y11, y12 and y13) and hot-air-dried (y21, y22 and y23) camellia seeds are located in the positive and negative directions of PC2, respectively, with a noticeable separation between their positions, while there is not much difference in PC1. This PCA model successfully discriminates between the two types of oil samples.

4. Conclusions

This study investigated the volatile compound profiles of CO extracted from camellia seeds dried using two different methods: hot-air-drying and sun-drying. GC-IMS was employed for the analysis. The results revealed that the CO obtained from hot-air-dried camellia seeds exhibited an increased content of saturated fatty acids, accompanied by decreased levels of oleic acid and linoleic acid. Additionally, the hot-air-dried oil displayed higher acid and peroxide values, indicating a more pronounced degree of fat hydrolysis and decomposition, which can promote the formation of flavor compounds during the hot-air-drying process. Comparative analysis of the 3D, 2D, and difference spectra of the volatile compounds in the two oil samples demonstrated the ability of GC-IMS to effectively differentiate between them. A total of 53 volatile compounds was detected, including 19 aldehydes, 17 alcohols, 7 acids, 4 esters, and 4 ketones, as well as 2 unidentified compounds. While the contents of the main aldehyde compounds were not significantly different between the two oil samples, the relative contents of complex aldehydes were higher in the hot-air-dried sample compared to the sun-dried one. Conversely, the relative content of the acid compounds decreased significantly in the hot-air-dried sample, while the relative content of the ester compounds increased. Hexanal was identified as the most important key aroma compound in both oil samples. Significant differences in the concentrations of the most volatile compounds were observed between the two oil samples, and the PCA model could effectively distinguish between the two oil samples, demonstrating the advantages of GC-IMS technology in rapidly and visually identifying differences between samples.

Author Contributions

Conceptualization, S.D. and Y.C.; investigation, L.M., J.G., X.Z., X.C. and B.C.; writing—original draft preparation, S.D. and L.M.; supervision, L.M. and Y.C.; project and administration, Z.Z., B.C. and Z.L.; funding acquisition, S.D., L.M. and Y.C. All authors have read and agreed to the published version of the manuscript.

Funding

This research was funded by Top Ten Technical Research Projects in Hunan Province (2024NK1020); Forestry Science and Technology promotion project of the Central Finance, grant number (2022XT 25); Industry Science and Technology Innovation and Entrepreneurship Team’s Project of Hunan Provincial Committee of the Communist Party of China’s Organization Department (Shennong Guoyou); Oil Tea Industry Science and Technology Support and Technology Demonstration Project of Hunan Province (2023LYCY0018); the open fund of the Hunan Key Laboratory of Economic Crops Genetic Improvement and Integrated Utilization, grant number (E22326); the Foundation of the State Key Laboratory of the Utilization of Woody Oil Resources, grant number (GZKF202204); and University-Industry Collaborative Education Program of the Ministry of Education (230827252607224).

Data Availability Statement

Data are contained within the article.

Conflicts of Interest

The authors declare no conflicts of interest.

References

  1. Xu, Y.; Deng, S.; Ma, L.; Li, M.; Xie, B.; Gao, J.; Shao, M.; Chen, Y. Effects of soil properties and nutrients on the fruit economic parameters and oil nutrient contents of Camellia oleifera. Forests 2023, 14, 1786. [Google Scholar] [CrossRef]
  2. Li, G.; Ma, L.; Yan, Z.; Zhu, Q.; Cai, J.; Wang, S.; Yuan, Y.; Chen, Y.; Deng, S. Extraction of oils and phytochemicals from Camellia oleifera seeds: Trends, challenges, and innovations. Processes 2022, 10, 1489. [Google Scholar] [CrossRef]
  3. Wang, X.; Zeng, Q.; del Mar Contreras, M.; Wang, L. Profiling and quantification of phenolic compounds in camellia seed oils: Natural tea polyphenols in vegetable oil. Food Res. Int. 2017, 102, 184–194. [Google Scholar] [CrossRef] [PubMed]
  4. Qin, P.; Shen, J.; Wei, J.; Chen, Y. A critical review of the bioactive ingredients and biological functions of Camellia oleifera oil. Curr. Res. Food Sci. 2024, 8, 100753. [Google Scholar] [CrossRef] [PubMed]
  5. Zeng, M.; Li, M.; Zhang, B.; Huang, X.; Tao, L.; Liao, W.; Huang, K. Camellia oil inhibits oxidative stress and inflammatory response to ameliorate LPS-induced acute kidney injury via downregulation of TLR4-mediated activation of the NF-κB/AP-1/IRF3 and NLRP3 pathways. J. Funct. Foods 2020, 68, 103908. [Google Scholar] [CrossRef]
  6. Zhu, Q.; Li, G.; Ma, L.; Chen, B.; Zhang, D.; Gao, J.; Deng, S.; Chen, Y. Virgin camellia seed oil improves glycolipid metabolism in the kidney of high fat-fed rats through AMPK-SREBP pathway. Nutrients 2023, 15, 4888. [Google Scholar] [CrossRef] [PubMed]
  7. Zhang, D.; Huang, D.; Zhang, X.; Zhao, H.; Gong, G.; Tang, X.; Li, L. Drying performance and energy consumption of Camellia oleifera seeds under microwave-vacuum drying. Food Sci. Biotechnol. 2023, 32, 969–977. [Google Scholar] [CrossRef] [PubMed]
  8. Wang, Y.; Fei, X.; Shi, X.; Ye, X.; Guo, S.; Luo, F. Effects of harvest time and treatment methods on nutrient accumulation of oil-tea camellia seed and its oil. China Oils Fats 2017, 42, 20–46. [Google Scholar]
  9. Ma, L.; Zhong, H.; Chen, Y.; Peng, S.; Zhu, N.; Chen, L.; Wang, R. The effect of post-harvest treatment of camellia fruit on quality of camellia seed. J. Chin. Cereals Oils Assoc. 2014, 29, 73–76. [Google Scholar]
  10. Luo, F.; Fei, X.; Guo, S.; Chen, J.; Li, K. Effects of harvest time and drying methods on quality of oil-tea camellia seed oil. China Oils Fats 2015, 40, 69–73. [Google Scholar]
  11. Wang, S.; Chen, H.; Sun, B. Recent progress in food flavor analysis using Gas Chromatography–Ion Mobility Spectrometry (GC–IMS). Food Chem. 2020, 315, 126158. [Google Scholar] [CrossRef] [PubMed]
  12. Garrido-Delgado, R.; Dobao-Prieto, M.M.; Arce, L.; Valcárcel, M. Determination of volatile compounds by GC–IMS to assign the quality of virgin olive oil. Food Chem. 2015, 187, 572–579. [Google Scholar] [CrossRef] [PubMed]
  13. Chang, M.; Zhao, P.; Zhang, T.; Luan, J.; Huang, L.; Dong, J.; Gao, H. Characteristic volatiles fingerprints and profiles determination in different grades of co-conut oil by HS-GC-IMS and HS-SPME-GC-MS. Int. J. Food Sci. Technol. 2020, 55, 3670–3679. [Google Scholar] [CrossRef]
  14. Liu, R.; Wei, B. Physical pressing process practice of oil-tea camellia seed. China Oils Fats 2017, 42, 155–157. [Google Scholar]
  15. Hao, Z.; Wu, S.; Jiang, M.; Guan, Y.; Feng, Z. Effect of pretreatment methods of fresh Camellia oleifera fruit on the quality of low-temperature pressed oil-tea camellia seed oil. China Oils Fats 2023, 48, 19–23. [Google Scholar]
  16. Zhang, L.; Zhou, C.; Wang, B.; Yagoub, A.E.G.A.; Ma, H.; Zhang, X.; Wu, M. Study of ultrasonic cavitation during extraction of peanut oil at varying frequencies. Ultrason. Sonochem. 2017, 37, 106–113. [Google Scholar] [CrossRef] [PubMed]
  17. Wang, Y.; He, Y.; Liu, Y.; Wang, D. Analyzing volatile compounds of young and mature Docynia delavayi fruit by HS-SPME-GC-MS and rOAV. Foods 2023, 12, 59. [Google Scholar] [CrossRef] [PubMed]
  18. Su, D.; He, J.J.; Zhou, Y.Z.; Li, Y.L.; Zhou, H.J. Aroma effects of key volatile compounds in Keemun black tea at different grades: HS-SPME-GC-MS, sensory evaluation, and chemometrics. Food Chem. 2022, 373, 131587. [Google Scholar] [CrossRef] [PubMed]
  19. Gao, F.; Birch, J. Oxidative stability, thermal decomposition, and oxidation onset prediction of carrot, flax, hemp, and canola seed oils in relation to oil composition and positional distribution of fatty acids. Eur. J. Lipid Sci. Technol. 2016, 118, 1042–1052. [Google Scholar] [CrossRef]
  20. Schulte, L.R.; Ballard, T.; Samarakoon, T.; Yao, L.; Vadlani, P.; Staggenborg, S.; Rezac, M. Increased growing temperature reduces content of polyunsaturated fatty acids in four oilseed crops. Ind. Crops Prod. 2013, 51, 212–219. [Google Scholar] [CrossRef]
  21. GB 11765-2018; National Standard for Oil-Tea Camellia Seed Oil. State Administration for Market Regulation: Beijing, China, 2018.
  22. He, J.; Wu, X.; Zhou, Y.; Xu, X.; Huang, K. Effects of different preheat treatments on volatile compounds of camellia (Camellia oleifera Abel.) seed oil and formation mechanism of key aroma compounds. Food Biochem. 2021, 45, e13649. [Google Scholar] [CrossRef] [PubMed]
  23. Kraljic, K.; Stjepanovic, T.; Obranovic, M.; Skevin, D.; Medic, H. Influence of conditioning temperature on the quality, nutritional properties and volatile profile of virgin rapeseed oil. Food Technol. Biotechnol. 2018, 56, 562–572. [Google Scholar] [CrossRef] [PubMed]
  24. Dierkes, G.; Bongartz, A.; Guth, H.; Buettner, A. Quality evaluation of olive oil by statistical analysis of multicomponent stable isotope dilution assay data of aroma active compounds. J. Agric. Food Chem. 2012, 60, 394–401. [Google Scholar] [CrossRef] [PubMed]
  25. Jia, X.; Deng, Q.; Yang, Y.; Jiang, L.; Xie, J.; Xie, M. Unraveling of the aroma-active compounds in virgin camellia oil (Camellia oleifera Abel.) using Gas Chromatography-Mass Spectrometry-Olfactometry, Aroma Recombination, and Omission Studies. J. Agric. Food Chem. 2021, 69, 9043–9055. [Google Scholar] [CrossRef]
  26. Kesen, S.; Kelebek, H.; Selli, S. Characterization of the key aroma compounds in Turkish olive oils from different geographic origins by application of Aroma Extract Dilution Analysis (AEDA). J. Agric. Food Chem. 2014, 62, 391–401. [Google Scholar] [CrossRef]
  27. Neugebauer, A.; Schieberle, P.; Granvogl, M. Characterization of the key odorants causing the musty and fusty/muddy sediment off-flavors in olive oils. J. Agric. Food Chem. 2021, 69, 14878–14892. [Google Scholar] [CrossRef]
  28. Reboredo-Rodriguez, P.; Gonzalez-Barreiro, C.; Cancho-Grande, B.; Simal-Gandara, J. Concentrations of aroma compounds and Odor Activity Values of odorant series in different Olive cultivars and their oils. J. Agric. Food Chem. 2013, 61, 5252–5259. [Google Scholar] [CrossRef]
  29. Rios-Reina, R.; Aparicio-Ruiz, R.; Morales, M.T.; García-González, D.L. Contribution of specific volatile markers to green and ripe fruity attributes in extra virgin olive oils studied with three analytical methods. Food Chem. 2023, 399, 133942. [Google Scholar] [CrossRef] [PubMed]
  30. Luo, X. Study on the Effect of Roasting Conditions on Antioxidant Capacity and Flavor Substances of Camellia Seed Oil. Master’s Thesis, Central South University of Forestry and Technology, Changsha, China, 2023. [Google Scholar]
  31. Kesen, S.; Kelebek, H.; Sen, K.; Selli, S. GC-MS-Olfactometric characterization of the key aroma compounds in Turkish olive oils by application of the Aroma Extract Dilution Analysis. Food Res. Int. 2013, 54, 1987–1994. [Google Scholar] [CrossRef]
  32. Xi, B.; Zhang, J.; Xu, X.; Gao, Q.; Cao, J.; Wang, Y. Characterization and metabolism pathway of volatile compounds in walnut oil obtained from various ripening stages via HS-GC-IMS and HS-SPME-GC-MS. Food Chem. 2024, 435, 137547. [Google Scholar] [CrossRef]
  33. Cao, J.; Jiang, X.; Chen, Q.; Shi, J.; Bao, J. Oxidative stabilities of olive and camellia oils: Possible mechanism of aldehydes formation in oleic acid triglyceride at high temperature. LWT-Food Sci. Technol. 2020, 118, 108858. [Google Scholar] [CrossRef]
  34. Xiao, L.; Lee, J.; Zhang, G.; Ebeler, S.E.; Wickramasinghe, N.; Seiber, J.; Mitchell, A.E. HS-SPME GC/MS characterization of volatiles in raw and dry-roasted almonds (Prunus dulcis). Food Chem. 2014, 151, 31–39. [Google Scholar] [CrossRef]
  35. Zeng, W.; Liu, X.; Chao, Y.; Cai, J.; Zeng, W. The effect of extraction methods on the components and quality of Camellia oleifera oil: Focusing on the flavor and lipidomics. Food Chem. 2024, 447, 139046. [Google Scholar] [CrossRef]
  36. Jia, X.; Zhou, Q.; Wang, J.; Yin, Y.; Huang, D. Identification of key aroma-active compounds in sesame oil from microwaved seeds using E-Nose and HS-SPME-GCxGC-TOF/MS. J. Food Biochem. 2019, 43, e12786. [Google Scholar] [CrossRef]
  37. Ferreira, I.M.P.L.V.O.; Pinho, O.; Petisca, C. Coffee: Consumption and Health Implications; Farah, A., Ed.; The Royal Society of Chemistry: Cambridge, UK, 2019; pp. 520–540. [Google Scholar]
  38. Xu, Y.; Bi, S.; Niu, X.; Wang, H.; Xu, X. Comparison of aroma active compounds in cold- and hot-pressed walnut oil by Comprehensive Two-Dimensional Gas Chromatography-Olfactory-Mass Spectrometry and Headspace-Gas Chromatography-Ion Mobility Spectrometry. Food Res. Int. 2023, 163, 112208. [Google Scholar] [CrossRef]
  39. Jia, X.; Zhou, Q.; Huang, D.; Yin, Y. Insight into the comparison of key aroma-active compounds between camellia oils from different processing technology. Food Chem. 2024, 430, 137090. [Google Scholar] [CrossRef]
  40. Cerezo, S.; Hernandez, M.; Palomo-Rios, E.; Luisa, M.; Sanchez-Ortiz, A. Modification of 13-hydroperoxide lyase expression in olive affects plant growth and results in altered volatile profile. Plant Sci. 2021, 313, 111083. [Google Scholar] [CrossRef]
  41. Sanchez-Ortiz, A.; Romero-Segura, C.; Gazda, V.; Sanz, C.; Perez, A.G. Factors limiting the synthesis of virgin olive oil volatile esters. J. Agric. Food Chem. 2012, 60, 1300–1307. [Google Scholar] [CrossRef]
  42. Zhang, Y.; Stoppelmann, F.; Zhu, L.; Rohm, H.; Scherf, K.A. A Comparative study on flavor trapping techniques from the viewpoint of odorants of hot-pressed rapeseed oil. Food Chem. 2023, 426, 136617. [Google Scholar] [CrossRef]
  43. Neugebauer, A.; Granvogl, M.; Schieberle, P. Characterization of the key odorants in high-quality extra virgin olive oils and certified off-flavor oils to elucidate aroma compounds causing a rancid off-flavor. J. Agric. Food Chem. 2020, 68, 5927–5937. [Google Scholar] [CrossRef]
  44. Lin, Y.; Wang, Y.; Huang, Y.; Zeng, W.; Zhang, X.; Chao, Y. Aroma identification and classification in 18 kinds of teas (Camellia sinensis) by sensory evaluation, HS-SPME-GC-IMS/GC × GC-MS, and Chemometrics. Foods 2023, 12, 2433–2447. [Google Scholar] [CrossRef]
  45. He, J.; Wu, X.; Yu, Z. Microwave pretreatment of camellia (Camellia oleifera Abel.) seeds: Effect on oil flavor. Food Chem. 2021, 364, 130388. [Google Scholar] [CrossRef]
  46. Van Gemert, L.J. Compilation of Odour Threshold Values in Air, Water and Other Media, 2nd ed.; Science Publisher: Beijing, China, 2015. [Google Scholar]
  47. Terry, A.; Heinrich, A. Flavornet. 2004. Available online: http://www.flavornet.org (accessed on 10 March 2024).
  48. Krist, S.; Stuebiger, G.; Bail, S.; Unterweger, H. Analysis of Volatile compounds and triacylglycerol composition of fatty seed oil gained from flax and false flax. Eur. J. Lipid Sci. Technol. 2006, 108, 48–60. [Google Scholar] [CrossRef]
  49. Sun, X.; Wan, Y.; Han, J.; Zhang, Y.; Xu, X. Analysis of volatile compounds and flavor fingerprint in hot-pressed flaxseed oil processed under different roasting conditions using Headspace-Gas Chromatography-Ion Mobility Spectrometry. Food Anal. Methods 2023, 16, 888–899. [Google Scholar] [CrossRef]
  50. Aparicio, R.; Morales, M.T.; Alonso, V. Authentication of European extra-virgin olive oils by their chemical compounds, sensory attributes, and consumers’ attitudes. J. Agric. Food Chem. 1997, 45, 1076–1083. [Google Scholar] [CrossRef]
  51. Kiritsakis, A. Flavor components of olive oil-a review. J. Am. Oil Chem. Soc. 1998, 75, 673–681. [Google Scholar] [CrossRef]
  52. Xia, X. The Analysis of Volatile Compounds and Nutrition Composition in Camellia Oil. Master’s Thesis, Nanchang University, Nanchang, China, 2015. [Google Scholar]
  53. Luo, F.; Guo, S.; Fei, X.; Yao, X.; Wang, Y.; Ye, X. The effects of pressing conditions on volatile organic compounds and the quality of crude camellia oil. J. Chin. Cereals Oils Assoc. 2015, 30, 61–66. [Google Scholar]
  54. Siegmund, B.; Murkovic, M. Changes in chemical composition of pumpkin seeds during the roasting process for production of pumpkin seed oil (part 2: Volatile compounds). Food Chem. 2004, 84, 367–374. [Google Scholar] [CrossRef]
Figure 1. 3D spectra of volatile compounds in CO samples y1 (sun-drying) and y2 (hot-air-drying).
Processes 12 01332 g001
Figure 2. HS-GC-IMS 2D spectrum (top view) of oil samples y1 (sun-drying) and y2 (hot-air-drying).
Processes 12 01332 g002
Figure 3. Difference graph of volatile compounds in CO samples: (a) the spectral map of oil sample y1 (sun-drying), (b) The differential contrast spectrum of oil samples y1 (sun-drying) and y2 (hot-air-drying).
Processes 12 01332 g003
Figure 4. Fingerprint of CO samples. The box lines in the graph represent all selected signal peaks in the samples. Each column in the graph represents the signal peaks of the same VOCs in different samples. Region A represents the VOCs with high content in sample y1 (sun-drying). Region B represents the VOCs with high content in sample y2 (hot-air-drying).
Processes 12 01332 g004
Figure 5. GC-IMS qualitative results of volatile compounds in CO samples y1 (sun-drying) and y2 (hot-air-drying).
Processes 12 01332 g005
Figure 6. PCA loading scatter plot of volatile compounds in camellia seed oils with different seed drying processes: (a) overall image, (b) enlarged partial image.
Processes 12 01332 g006
Figure 7. PCA score scatter plot of volatile compounds in camellia seed oil with different seed drying processes (sun-drying: y11, y12, y13; hot-air-drying: y21, y22, y23).
Processes 12 01332 g007
Table 1. Effects of drying processes on the fatty acid composition and quality parameters of CO.
Compounds and Parametersy1y2
Palmitic acid (C16:0)5.18%5.88%
Stearic acid (C18:0)1.75%1.90%
Oleic acid (C18:1n9c)83.60%82.80%
Linoleic acid (C18:2n6c)8.83%8.69%
Linolenic acid (C18:3n3)0.14%0.15%
Arachidonic acid (C20:1n9c)0.51%0.56%
Vitamin E (mg/kg)184.71186.52
Acid value (mg/g)0.540.88
Peroxide value (g/100 g)0.030.07
Table 2. Volatile compounds and their relative contents in camellia seed oil through varying drying processes.
No.LabelCASFormulaMW ARI BRt C [s]Dt D [a.u.]Relative Content (%) E
y1y2
1Nonanal M124-19-6C9H18O142.21102.2782.1181.474352.64 ± 0.011.45 ± 0.01
2Nonanal D124-19-6C9H18O142.21103.3784.6091.932630.52 ± 0.030.27 ± 0.03
31-Octanol M111-87-5C8H18O130.21082.4738.5291.470381.07 ± 0.030.25 ± 0.01
41-Octanol D111-87-5C8H18O130.21081.3736.2121.879060.22 ± 0.010.09 ± 0.01
5(E)-2-Octenal M2548-87-0C8H14O126.21065.1702.551.33290.33 ± 0.020.71 ± 0.01
6(E)-2-Octenal D2548-87-0C8H14O126.21066.9706.291.814460.07 ± 0.000.13 ± 0.01
7Octanal M124-13-0C8H16O128.21012602.4941.403155.67 ± 0.174.24 ± 0.03
8Octanal D124-13-0C8H16O128.21012.8603.9161.827454.68 ± 0.152.30 ± 0.02
91-Heptanol MC111706C7H16O116.2981541.3581.40567.08 ± 0.052.50 ± 0.06
101-Heptanol DC111706C7H16O116.2979537.0921.756322.44 ± 0.010.47 ± 0.01
11Benzaldehyde M100-52-7C7H6O106.1964.1506.071.153480.94 ± 0.033.15 ± 0.00
12Benzaldehyde D100-52-7C7H6O106.1963.7505.2311.466250.24 ± 0.011.19 ± 0.03
13Butyrolactone M96-48-0C4H6O286.1924.7432.2971.085952.37 ± 0.084.24 ± 0.06
14Butyrolactone D96-48-0C4H6O286.1921.3426.4281.297430.45 ± 0.021.43 ± 0.07
15Hexanoic acid M142-62-1C6H12O2116.2991.5564.7531.302762.77 ± 1.350.41 ± 0.09
16Hexanoic acid D142-62-1C6H12O2116.2991.5564.7531.636850.37 ± 0.220.06 ± 0.00
17Heptanal M111-71-7C7H14O114.2902.7395.7541.336693.30 ± 0.022.78 ± 0.04
18Heptanal D111-71-7C7H14O114.2902.3395.2051.697722.01 ± 0.011.86 ± 0.01
191-Hexanol M111-27-3C6H14O102.2874356.7741.335193.45 ± 0.001.66 ± 0.03
201-Hexanol D111-27-3C6H14O102.2872.7355.1261.64081.18 ± 0.010.38 ± 0.01
212-Heptanone M110-43-0C7H14O114.2892.8380.3811.263290.95 ± 0.021.05 ± 0.02
222-Heptanone D110-43-0C7H14O114.2893.1380.931.627320.20 ± 0.000.28 ± 0.00
23Furan-2-carbaldehyde M98-01-1C5H4O296.1829.8306.8131.092510.34 ± 0.011.39 ± 0.04
24Furan-2-carbaldehyde98-01-1C5H4O296.1829.3306.2641.32920.03 ± 0.010.29 ± 0.01
25Hexanal M66-25-1C6H12O100.2794.1271.6751.25583.47 ± 0.032.18 ± 0.03
26Hexanal D66-25-1C6H12O100.2792.9270.5771.565899.17 ± 0.089.21 ± 0.06
271-Pentanol M71-41-0C5H12O88.1761.3240.8631.255763.28 ± 0.012.67 ± 0.05
281-Pentanol D71-41-0C5H12O88.1760.3239.9831.511561.79 ± 0.022.41 ± 0.04
291-Butanol, 3-methyl M123-51-3C5H12O88.1731.3215.0581.247010.54 ± 0.011.65 ± 0.02
301-Butanol, 3-methyl D123-51-3C5H12O88.1729.1213.2991.495160.04 ± 0.000.89 ± 0.01
31Pentanal M110-62-3C5H10O86.1695.4187.7871.18472.73 ± 0.001.05 ± 0.02
32n-pentanal D110-62-3C5H10O86.1695.4187.7871.421921.84 ± 0.011.50 ± 0.07
332-Methylbutanal96-17-3C5H10O86.1661.5166.3811.410991.96 ± 0.053.36 ± 0.13
341-Butanol M71-36-3C4H10O74.1664167.8481.177053.05 ± 0.031.02 ± 0.03
351-Butanol D71-36-3C4H10O74.1661166.0881.381470.81 ± 0.041.39 ± 0.02
362-Butanone78-93-3C4H8O72.1614.2140.871.253570.40 ± 0.011.11 ± 0.01
37Acetic acid M64-19-7C2H4O260.1605.7136.7651.052428.56 ± 0.442.51 ± 0.12
38Acetic acid D64-19-7C2H4O260.1603.3135.5921.154090.77 ± 0.050.39 ± 0.01
392-Methylpropan-1-ol D78-83-1C4H10O74.1629.2148.4941.355240.05 ± 0.001.05 ± 0.02
402-Methylpropan-1-ol M78-83-1C4H10O74.1635.3151.721.172670.15 ± 0.010.33 ± 0.02
41Ethyl Acetate141-78-6C4H8O288.1589.4129.1411.363980.20 ± 0.0210.46 ± 0.09
421-Propanol D71-23-8C3H8O60.1556.6115.0661.267780.75 ± 0.027.06 ± 0.16
431-Propanol M71-23-8C3H8O60.1551.5113.0131.120211.09 ± 0.091.97 ± 0.29
44Propanoic acid79-09-4C3H6O274.1680.9178.1111.105991.36 ± 0.020.26 ± 0.00
45Methyl butanoate623-42-7C5H10O2102.1742.3224.1481.154090.59 ± 0.121.60 ± 0.06
462-Butanone, 3-hydroxy-513-86-0C4H8O288.1709.5198.0511.058980.78 ± 0.061.31 ± 0.03
473-methylbutanoic acid M503-74-2C5H10O2102.1835.6312.9981.219680.58 ± 0.200.94 ± 0.23
483-methylbutanoic acid D503-74-2C5H10O2102.1838.9316.5141.486120.17 ± 0.030.29 ± 0.08
49(E)-2-Heptenal M18829-55-5C7H12O112.2959.8497.3831.256230.72 ± 0.001.23 ± 0.02
50(E)-2-Heptenal D18829-55-5C7H12O112.2959.2496.2341.671370.09 ± 0.010.27 ± 0.01
511-Penten-3-ol616-25-1C5H10O86.1681.6178.5631.356081.02 ± 0.016.35 ± 0.04
521Unidentified 0722.1207.6661.190220.31 ± 0.010.85 ± 0.00
532Unidentified 0761.1240.6751.067060.43 ± 0.032.10 ± 0.02
TotalAldehydes 40.7538.56
Alcohols 38.01132.14
Acids 14.584.86
Esters 3.6117.73
Ketones 2.333.75
A Molecular weight. B Retention index. C Retention time. D Relative drift time. E The volatile compound content is in the form of mean value ± standard deviation (mean ± SD).
Table 3. ROAV values of volatile compounds and sensory description of key compounds (ROAV ≥ 0.1) in camellia seed oils.
No.LabelOdor Detection Threshold (mg/kg)ROAV ValueAroma/Flavor Description
y1y2
1Nonanal M0.00351.330.98Oily, citrus, grass
2Nonanal D0.00350.260.18Oily, citrus, grass
31-Octanol M0.0540.030.01
41-Octanol D0.0540.010
5(E)-2-Octenal M0.0030.190.56Grass, nutty, oily
6(E)-2-Octenal D0.0030.040.1Grass, nutty, oily
7Octanal M0.0001100100Oily, soap, lemon, grass
8Octanal D0.000182.4954.37Oily, soap, lemon, grass
91-Heptanol M0.20.060.03
101-Heptanol D0.20.020.01
11Benzaldehyde M0.30.010.02
12Benzaldehyde D0.300.01
13Butyrolactone M1000
14Butyrolactone D1000
15Hexanoic acid M0.70.010
16Hexanoic acid D0.700
17Heptanal M0.050.120.13Oily, citrus
18Heptanal D0.050.070.09Oily, citrus
191-Hexanol M0.20.030.02
201-Hexanol D0.20.010
212-Heptanone M1.500
222-Heptanone D1.500
23Furan-2-carbaldehyde M0.700
24Furan-2-carbaldehyde0.700
25Hexanal M0.00750.810.69Grass, fatty, oily
26Hexanal D0.00752.152.9Grass, fatty, oily
271-Pentanol M0.470.010.01
281-Pentanol D0.470.010.01
291-Butanol, 3-methyl M0.2500.02
301-Butanol, 3-methyl D0.2500.01
31n-Pentanal M0.0120.40.21Almond, malt
32n-Pentanal D0.0120.270.3Almond, malt
332-Methylbutanal0.01250.280.63Cocoa, almond
341-Butanol M10000
351-Butanol D10000
362-Butanone1500
37Acetic acid M0.50.030.01
38Acetic acid D0.500
392-Methylpropan-1-ol D10000
402-Methylpropan-1-ol M10000
41Ethyl Acetate1.700.01
421-Propanol D27000
431-Propanol M27000
44Propanoic acid0.7200
45Methyl butanoate0.500.01
462-Butanone, 3-hydroxy-500
473-methylbutanoic acid M0.0260.040.09
483-methylbutanoic acid D0.0260.010.03
49(E)-2-Heptenal M0.0130.10.22Soap, fatty, almond
50(E)-2-Heptenal D0.0130.010.05Soap, fatty, almond
511-Penten-3-ol0.350.010.04
Disclaimer/Publisher’s Note: The statements, opinions and data contained in all publications are solely those of the individual author(s) and contributor(s) and not of MDPI and/or the editor(s). MDPI and/or the editor(s) disclaim responsibility for any injury to people or property resulting from any ideas, methods, instructions or products referred to in the content.

