Abstract
Deep peak shaving achieved through the integration of energy storage and thermal power units is a primary approach to enhance the peak shaving capability of a system. However, current research often tends to be overly optimistic in estimating the operational lifespan of energy storage and lacks clear quantification of the cost changes associated with system peak shaving. This study proposes an optimized operation model for the joint operation of thermal power and energy storage while considering the lifespan degradation of energy storage and the deep peak shaving of thermal power. This model measures the cost changes due to the participation of energy storage in thermal power unit peaking. It is able to reflect the value of economic externalities of energy storage in the power system and has a positive reference effect on energy storage investment planning and energy storage subsidy pricing. First, an energy storage lifespan degradation model based on equivalent cycle counts is constructed, along with a thermal power unit peak shaving cost model based on output fluctuations. Second, an optimized joint operation model is developed. Finally, the impact of changes in energy storage capacity and renewable energy output on the system peak shaving costs and energy storage lifespan is recorded. Simulation experiments are conducted based on actual operational parameters, and the results demonstrate that the participation of energy storage in deep peak shaving can indeed effectively reduce system peak shaving costs. Additionally, the actual operational lifespan of energy storage is significantly lower than the floating lifespan.
1. Introduction
Currently, new energy power with wind and light as the main sources consists of the principal field of energy transformation and sustainable development in China. In line with the country’s ‘dual carbon’ goal, the total installed capacity of wind and solar power is expected to reach an impressive 1.2 billion kW by 2030. However, wind and light output have the inherent characteristics of intermittency and volatility, and large-scale wind and light grid connectedness bring the problem of consumption and peaking to the system [1,2,3]. The conventional thermal power unit has proven inadequate for meeting the demands of large-scale wind and solar grid integration. To address this issue, the combination of energy storage and deep peaking operation in thermal power units has emerged as a promising approach to enhance the peaking capacity of the system [4]. However, it is important to acknowledge that deep peaking operation in thermal power units and the associated loss of storage life lead to increased operating costs for the system. Hence, it is of utmost significance to accurately assess the degradation of energy storage lifespan and the cost associated with thermal power unit peaking.
Early studies on energy storage life loss were dominated by experimental analysis, and the correlation curve between the number of energy storage life cycles and the discharge depth was obtained by experimental fitting [5]. Moreover, the improvement of the rainflow counting technique became the mainstream direction of research on energy storage life loss. Li [6] proposed a life decay algorithm for energy storage systems based on the improved rainflow algorithm, focusing on analyzing the effects of temperature and charge state on the shelf life of energy storage. Since then, all influencing factors of energy storage life have been successively confirmed. Xu [7] summarized that the factors affecting energy storage life mainly include temperature, storage and discharge depth, the number of charge cycles and the charge multiplier. Zhao [8] highlighted the impact of the new index of battery capacity retention rate on energy storage life and developed a multi-objective optimization model for energy storage life loss and battery capacity retention rate using the firefly algorithm. Wang [9] addressed the requirement of simplified modeling for full-system optimization and summarized two types of battery life models based on exchange power and discharge depth. The latter models can be further differentiated into two calculations that consider the number of daily cycles and the equivalent number of cycles. Since then, the energy storage life loss model considering the equivalent number of cycles has become the core method for measuring changes in energy storage life [10,11].
Subsequent studies have focused on the operation and investment of energy storage life loss. Refs. [12,13,14,15,16,17] focused on the economic optimization of energy storage configuration and operation, and refs. [18,19] further explored the economic benefits of the combined peak shaving strategy of fire and storage.
Specifically, Wang [12] proposed a two-stage optimization strategy of energy storage allocation and operation that takes into account the cycle life, and they explored the economics of energy storage allocation and frequency regulation. Chen [13] constructed a model for coordinated fire and storage optimization that considers demand response and storage life, where the upper layer guides electricity consumption through time-sharing tariffs. They further obtained optimized load curves with the goal of minimizing load fluctuations, whereby the lower layer coordinates the output of wind–fire and fire storage operation with the goal of minimizing the entire dispatch cost. The authors fully considered the system cost changes of energy storage participation in peaking, but the measurement of storage life loss was slightly insufficient. Cheng [14] established a correspondence model between discharge depth and storage life. Based upon these findings, they proposed a storage life model considering the equivalent cyclic discharge depth constraints, which was convexified for the non-convex terms and transformed into a second-order conical planning model. However, they did not explore the application of energy storage in power systems. Wu [15] proposed a two-layer capacity optimization model of a wind–thermal storage bundled outgoing system that takes into account the storage lifetime, with the upper layer aiming at minimizing the total system cost and the lower layer aiming at minimizing the typical daily dispatch cost. This strategy facilitates the optimization of the proportion of the bundled outgoing power, but it does not take into account the deep peaking cost of the thermal units due to bundling. Joint thermal storage peaking has been a popular research field in recent years. Liang’s [16] multi-objective optimization of liquid air energy storage with RTE and economic indicators as optimization objectives provides good operational and investment recommendations for system operators for the capital expenditure, energy efficiency and Pareto frontier of occupied space energy density of LAES systems. Zhong [17] considered the cooperative optimization of multi-distributed PV generation and diesel generation under energy reserve conditions, established a high-permeability PV generation system and considered the impact of hybrid energy storage on meeting the power of the base load.
The economic benefits of the combined peak shaving strategy of thermal units and storage have also been a hot research field in recent years. Li [18] proposed a hierarchical optimal scheduling scheme in which energy storage assists the deep peaking of thermal power units. It includes three layers of optimization models: upper, middle and lower, and it considers the economics of storage peaking from multiple perspectives but does not provide a detailed measurement of the energy storage cost and the peaking cost of thermal power units. Ye [19] constructed a mathematical model based on the optimal energy abandonment rate and presented a scheduling strategy to maximize the economic benefits of the combined wind–thermal storage system. This model considers thoroughly fluctuations in the peaking cost under different outputs of thermal power units and only takes the energy storage as a link in the system balance without regarding the change in the storage life.
In addition, scholars have also focused on the joint operation optimization of energy storage and power systems (such as wind power, thermal power, etc.) and have discussed how to enhance the stability of power systems, improve energy utilization and reduce operating costs through flexible scheduling of energy storage.
Li [20] focused on the measurement of the creeping cost of thermal power units, with insufficient consideration of oil injection and start–stop costs. On the other hand, Yang [21] concentrated on the two aspects of xs and energy storage peak–valley arbitrage, and they proposed a coordinated planning method between energy storage and thermal power unit flexibility transformation while considering the auxiliary service benefits. Ahmad [22] deduced a probabilistic discretization method that considers the uncertainty of wind turbines and constructed a mixed integer nonlinear optimization problem with three minimization objectives to solve the combined optimal operation of energy storage and wind power. Luca [23] proposed a deep learning-based optimization method for energy storage combined with microgrid scheduling. Nikolaos [24] developed a method for using battery energy storage for peak shaving in the distribution network, and the algorithm was applied and tested using data from actual stationary battery installations by Swiss utilities. Asfand [25] introduced an elastic peak shaving trade-off method to optimize the use of the static BESS algorithm, which focuses on user elasticity and energy storage peak shaving under different supply and demand relationships. Julio [26] compared the economic feasibility of replacing traditional peak power plants with distributed battery energy storage systems and measured the energy storage feasibility and economics to meet the peak power demand. He [27] compared and analyzed the scheduling performance of annual characteristic days with four different scenarios. The results showed that the parallel combination of energy storage and carbon trading can effectively promote thermal-assisted hybrid power cooperative dispatch, improve the utilization of wind and solar power and reduce generation-related costs at the same time. Based on the operating state of energy storage and other resources, Lai [28] proposed a model of resource residual adjustment capacity. Then, a resource aggregation regulation model considering the residual adjustment ability of resources was constructed, and a model for optimal operation and resilience improvement of the power grid was further constructed.
In summary, there is abundant research at present in the field of energy storage life loss and thermal storage joint peaking. However, most of it is centered on energy storage revenue and social benefits, and studies that consider the storage loss cost and the thermal power peaking cost and simultaneously measure the change in the total peaking cost are relatively scarce. This paper differs from the other literature in three ways. First, this paper focuses on analyzing the cost changes brought about by the participation of energy storage in thermal power unit peaking. The economic externality of energy storage is measured through the measurement of cost changes. Second, the research in this paper is based on energy storage enterprises, with the aim of proving the economic value of energy storage enterprises and using this to optimize energy storage investment. Third, this paper focuses on analyzing the change in the system peaking cost rather than the change in the energy storage cost in the objective function, and it focuses on measuring the external value of energy storage rather than the internal rate of return.
The innovation of this paper lies in two aspects:
- (1)
- This paper analyzes the relationship between the battery storage cycle life and the daily equivalent number of full cycles of the battery and the discharge depth, and it constructs a refined model of battery storage cycle life. At the same time, this paper explores the mechanism of energy storage assisting the thermal power unit peak shifting to build an economic decision-making model and its optimal operation strategy that includes the factors of energy storage life loss and the cost of peak shifting of the thermal power unit.
- (2)
- This paper evaluates the degree of influence of changes in parameters such as renewable energy output and energy storage capacity on energy storage life loss, and it clarifies the approximate allocation ratio of energy storage, renewable energy and thermal power.
2. Energy Storage Life Model Based on the Equivalent Number of Full Cycles
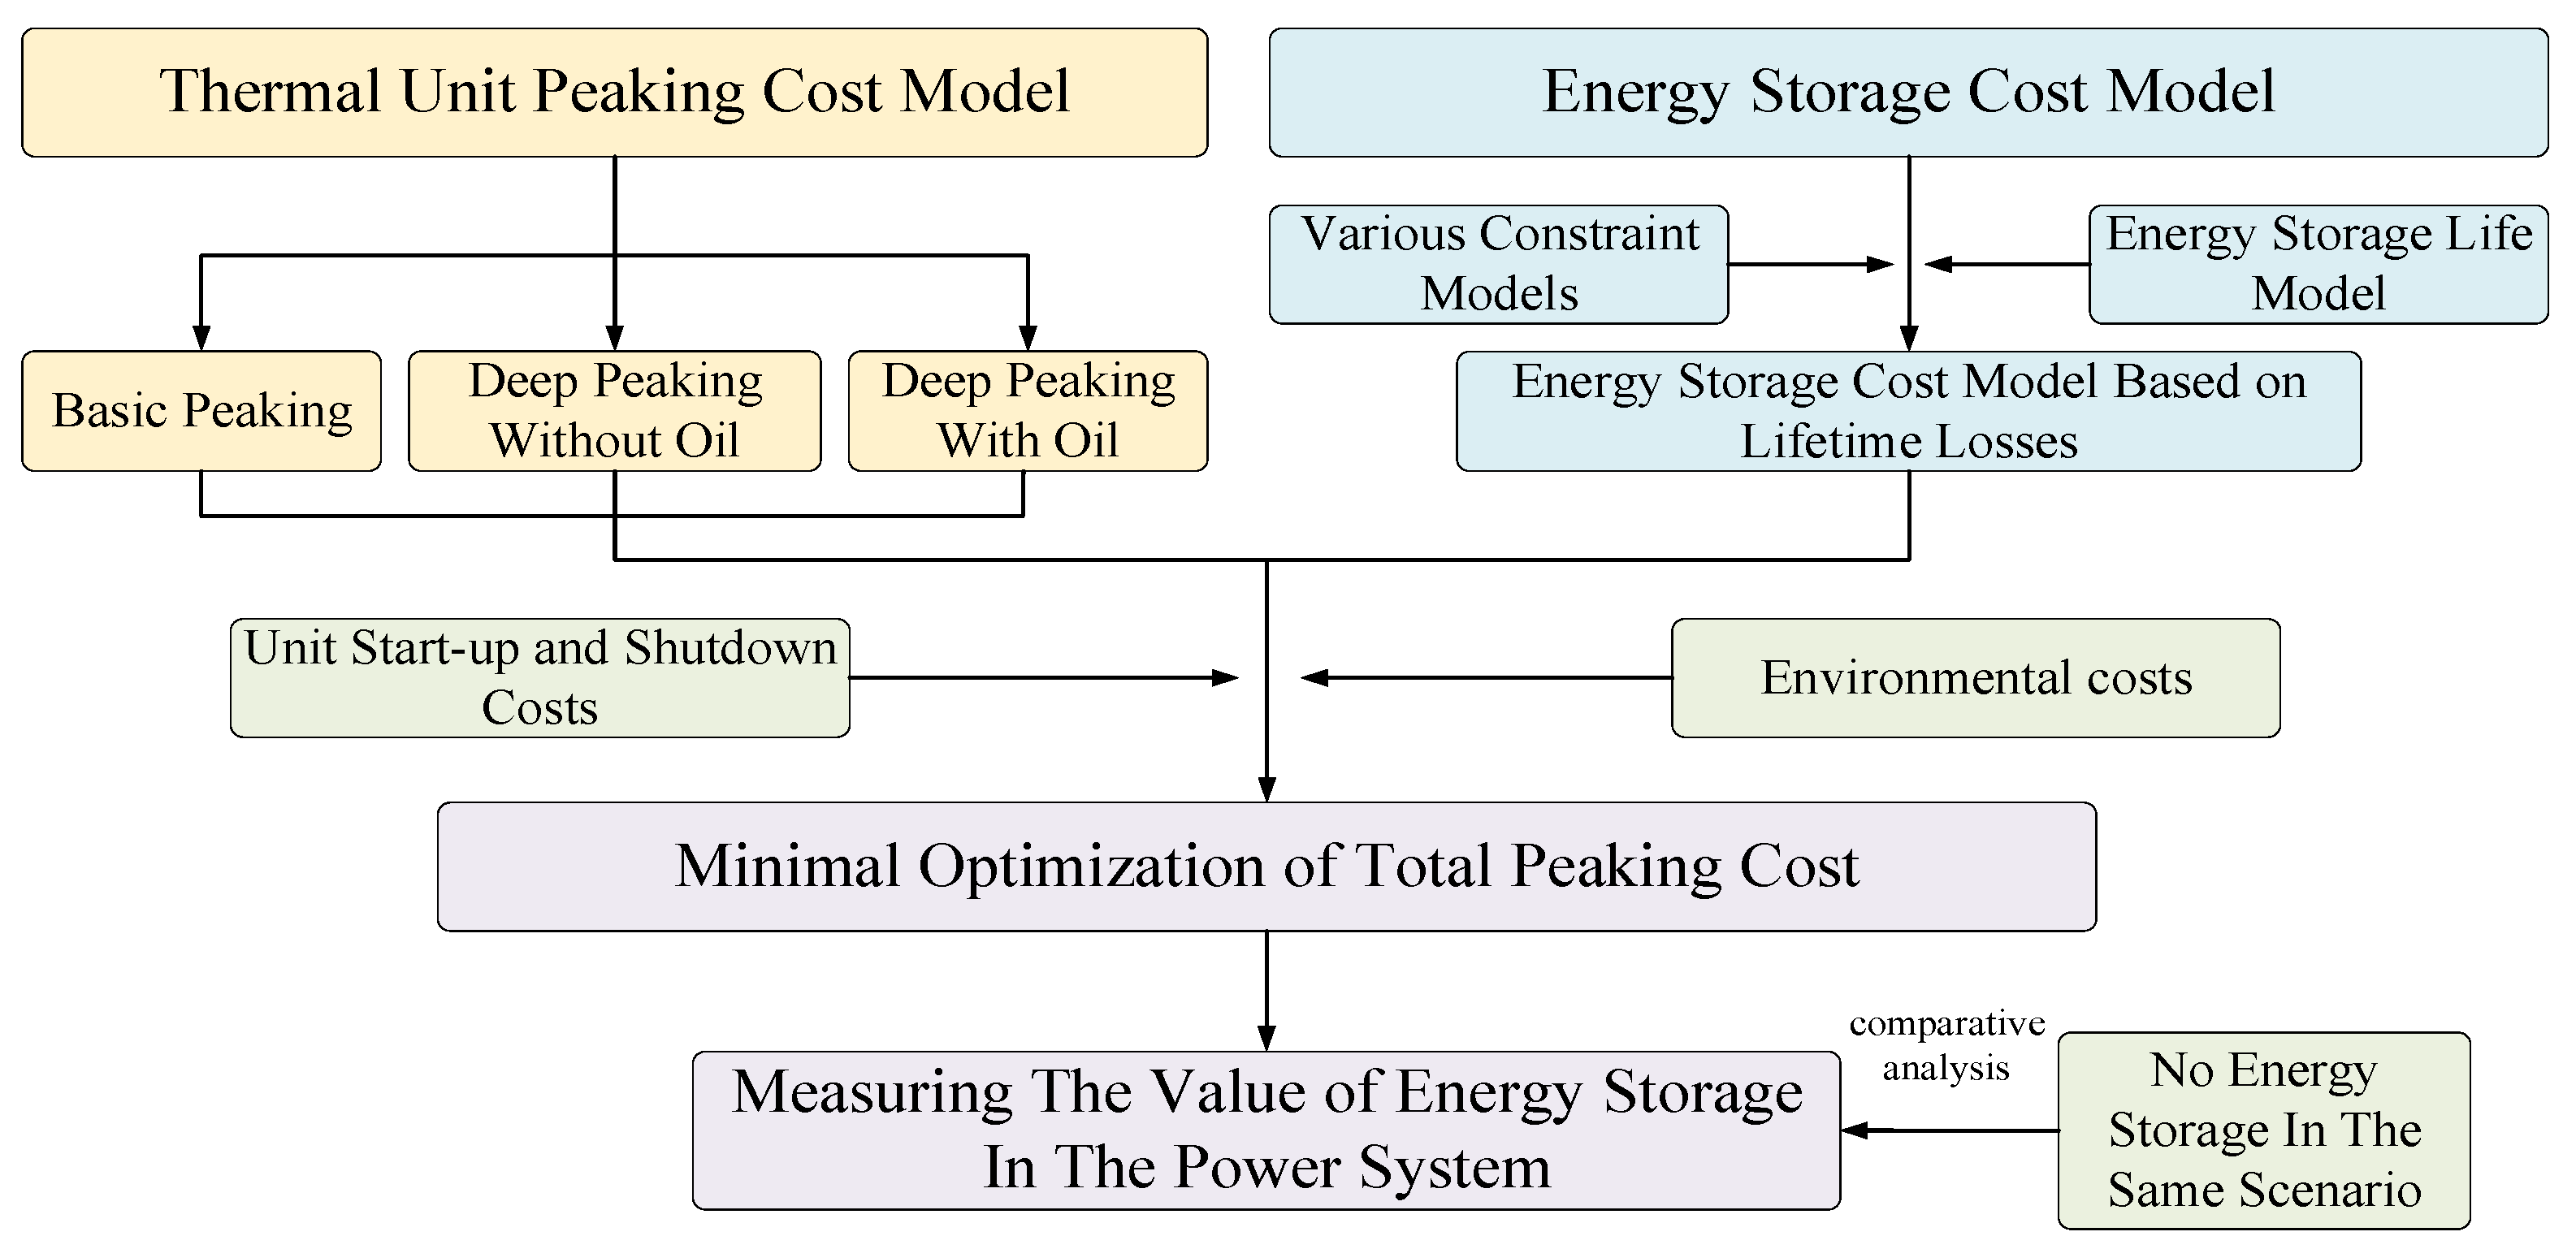
The research flow of this paper is shown in Figure 1.
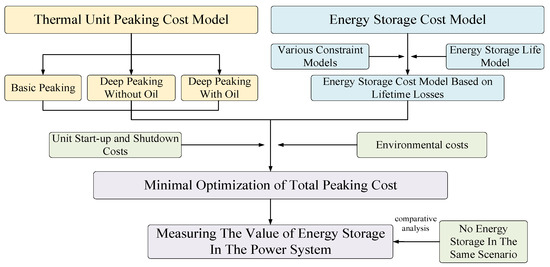
Figure 1.
Flow chart of the study.
2.1. Modeling of Energy Storage Life Cycle
In previous studies, the battery storage life cycle is expressed as a more fixed value of years. In actual operation, the battery storage life cycle can be measured by the number of times that charging and discharging occur, and this number is directly related to the discharge depth [29]. The battery energy storage life cycle function centered on the number of charge and discharge cycles is constructed according to Equation (1):
where denotes the total number of charge and discharge cycles in the whole life cycle of the battery energy storage; denotes the total number of cycles under a 100 percent charge and discharge depth; and is the fitting coefficient. All these are the technical parameters of the battery, which are constant values. represents the standard discharge depth of the battery storage energy. In actual operation, the discharge depth of the battery energy storage is not unchanging. A single value of cannot reflect the real extent of energy storage degradation. The need for each different depth of the charge and discharge cycle is converted to the full depth of the charge and discharge cycle of the equivalent number of cycles of , so the depth of the discharge conversion model is constructed as follows:
In the above equation, represents the charge and discharge depth of the battery storage energy at moment , which is calculated from the charge state of the storage energy at this moment. Currently, the means to determine the charge and discharge cycle of the storage energy becomes the key to measure the change in the storage energy life. Assuming the time for the energy storage to complete the cycle is , the discharge depth at the moment before the completion of the cycle is the cycle depth. The discharge depth is directly related to the state of the charge.
In Equations (3) and (4), denotes the virtual variable of the charge/discharge cycle of the energy storage, which takes a value of 1 when one cycle is completed, and denotes the parameter of the charge state, which takes a value between 0 and 1.
The means to identify the energy storage to complete a charge and discharge cycle needs to be judged according to its charge and discharge state, from the conversion of discharging to charging and completing the cycle, that is,
In Equation (5), represents the charge state dummy variable of the energy storage, which takes a value of 1 when the energy storage is charging. Then, can be set as the discharge state variable of the energy storage.
Subsequently, the daily equivalent number of full charges and discharges of the battery storage can be expressed as
In turn, the number of charges and discharges of the battery’s energy storage is converted to its life cycle , that is,
Moreover, in practice, even if there is no cycling loss, the energy storage still has its maximum life span, i.e., float life; therefore, it needs to satisfy the following constraint:
where denotes the upper limit of the float life of the stored energy.
2.2. Construction of Constraints for Energy Storage Lifetime Modeling
The charge state of the battery storage should satisfy its maximum and minimum charge constraints:
The charge state is bounded by the same level at the beginning and at the end:
The charge state of the battery energy storage at each moment is simultaneously related to its charge and discharge rate at the previous moment:
In Equation (11), and represent the average charging and discharging power of the battery storage; and are the charging and discharging efficiencies of the battery storage, respectively; and is its scheduling interval.
The average charging and discharging power of the battery storage is subject to technical conditions and may not be higher than its maximum charging and discharging power:
The charge/discharge state logic constraints (no simultaneous charging and discharging) are as follows:
3. Thermal Power Unit Peaking Cost Model Construction
The peaking stage of thermal power units can be divided into basic peaking and deep peaking. Deep peaking can be further divided into oil injection and non-oil-injection deep peaking. In the basic peaking stage, the peaking cost of thermal unit i at moment t, , is mainly derived from the fuel cost and start–stop costs and is calculated as follows:
In Equations (15) and (16), denotes the active power of thermal power unit i at time ; denotes the total number of thermal power units; denotes the number of time periods in a scheduling cycle; represents the start–stop state variable of thermal power unit in period ; represents that unit i is in operation; and represents that unit is in shutdown. denotes the start-up cost of thermal power unit ; denotes the fuel cost function of thermal power unit at time ; denotes the unit price of standard power coal; represents the quadratic term coefficient of the function; is the quadratic term coefficient; and is the constant term coefficient
When the unit is operated in the deep peaking phase without oil injection, the rotor metal produces certain additional losses due to alternating stress, which decreases the unit’s life [30]. The life loss cost incurred during the deep peaking of unit can be calculated as
In Equation (17), denotes the lifetime loss factor of the thermal power unit; denotes the acquisition cost of the thermal power unit; and denotes the number of rotor fracture cycle cycles, which can be determined by Langer’s formula.
In the deep peaking phase of oil injection, in addition to the fuel cost, start-up and shutdown cost, life loss cost and the cost of oil injection , the peaking cost of thermal power units should also be counted, which is calculated by the following formula:
In Equation (18), denotes the oil price in the current season, and denotes the oil consumption of thermal power units during the deep peaking stage of oil injection.
Overall, the total cost of the ith thermal power unit to participate in peaking can be expressed by the following segmented function:
4. Construction of Thermal Power Unit Peaking Cost Model
4.1. Mechanism Analysis of Joint Peaking between Energy Storage and Thermal Power Generation
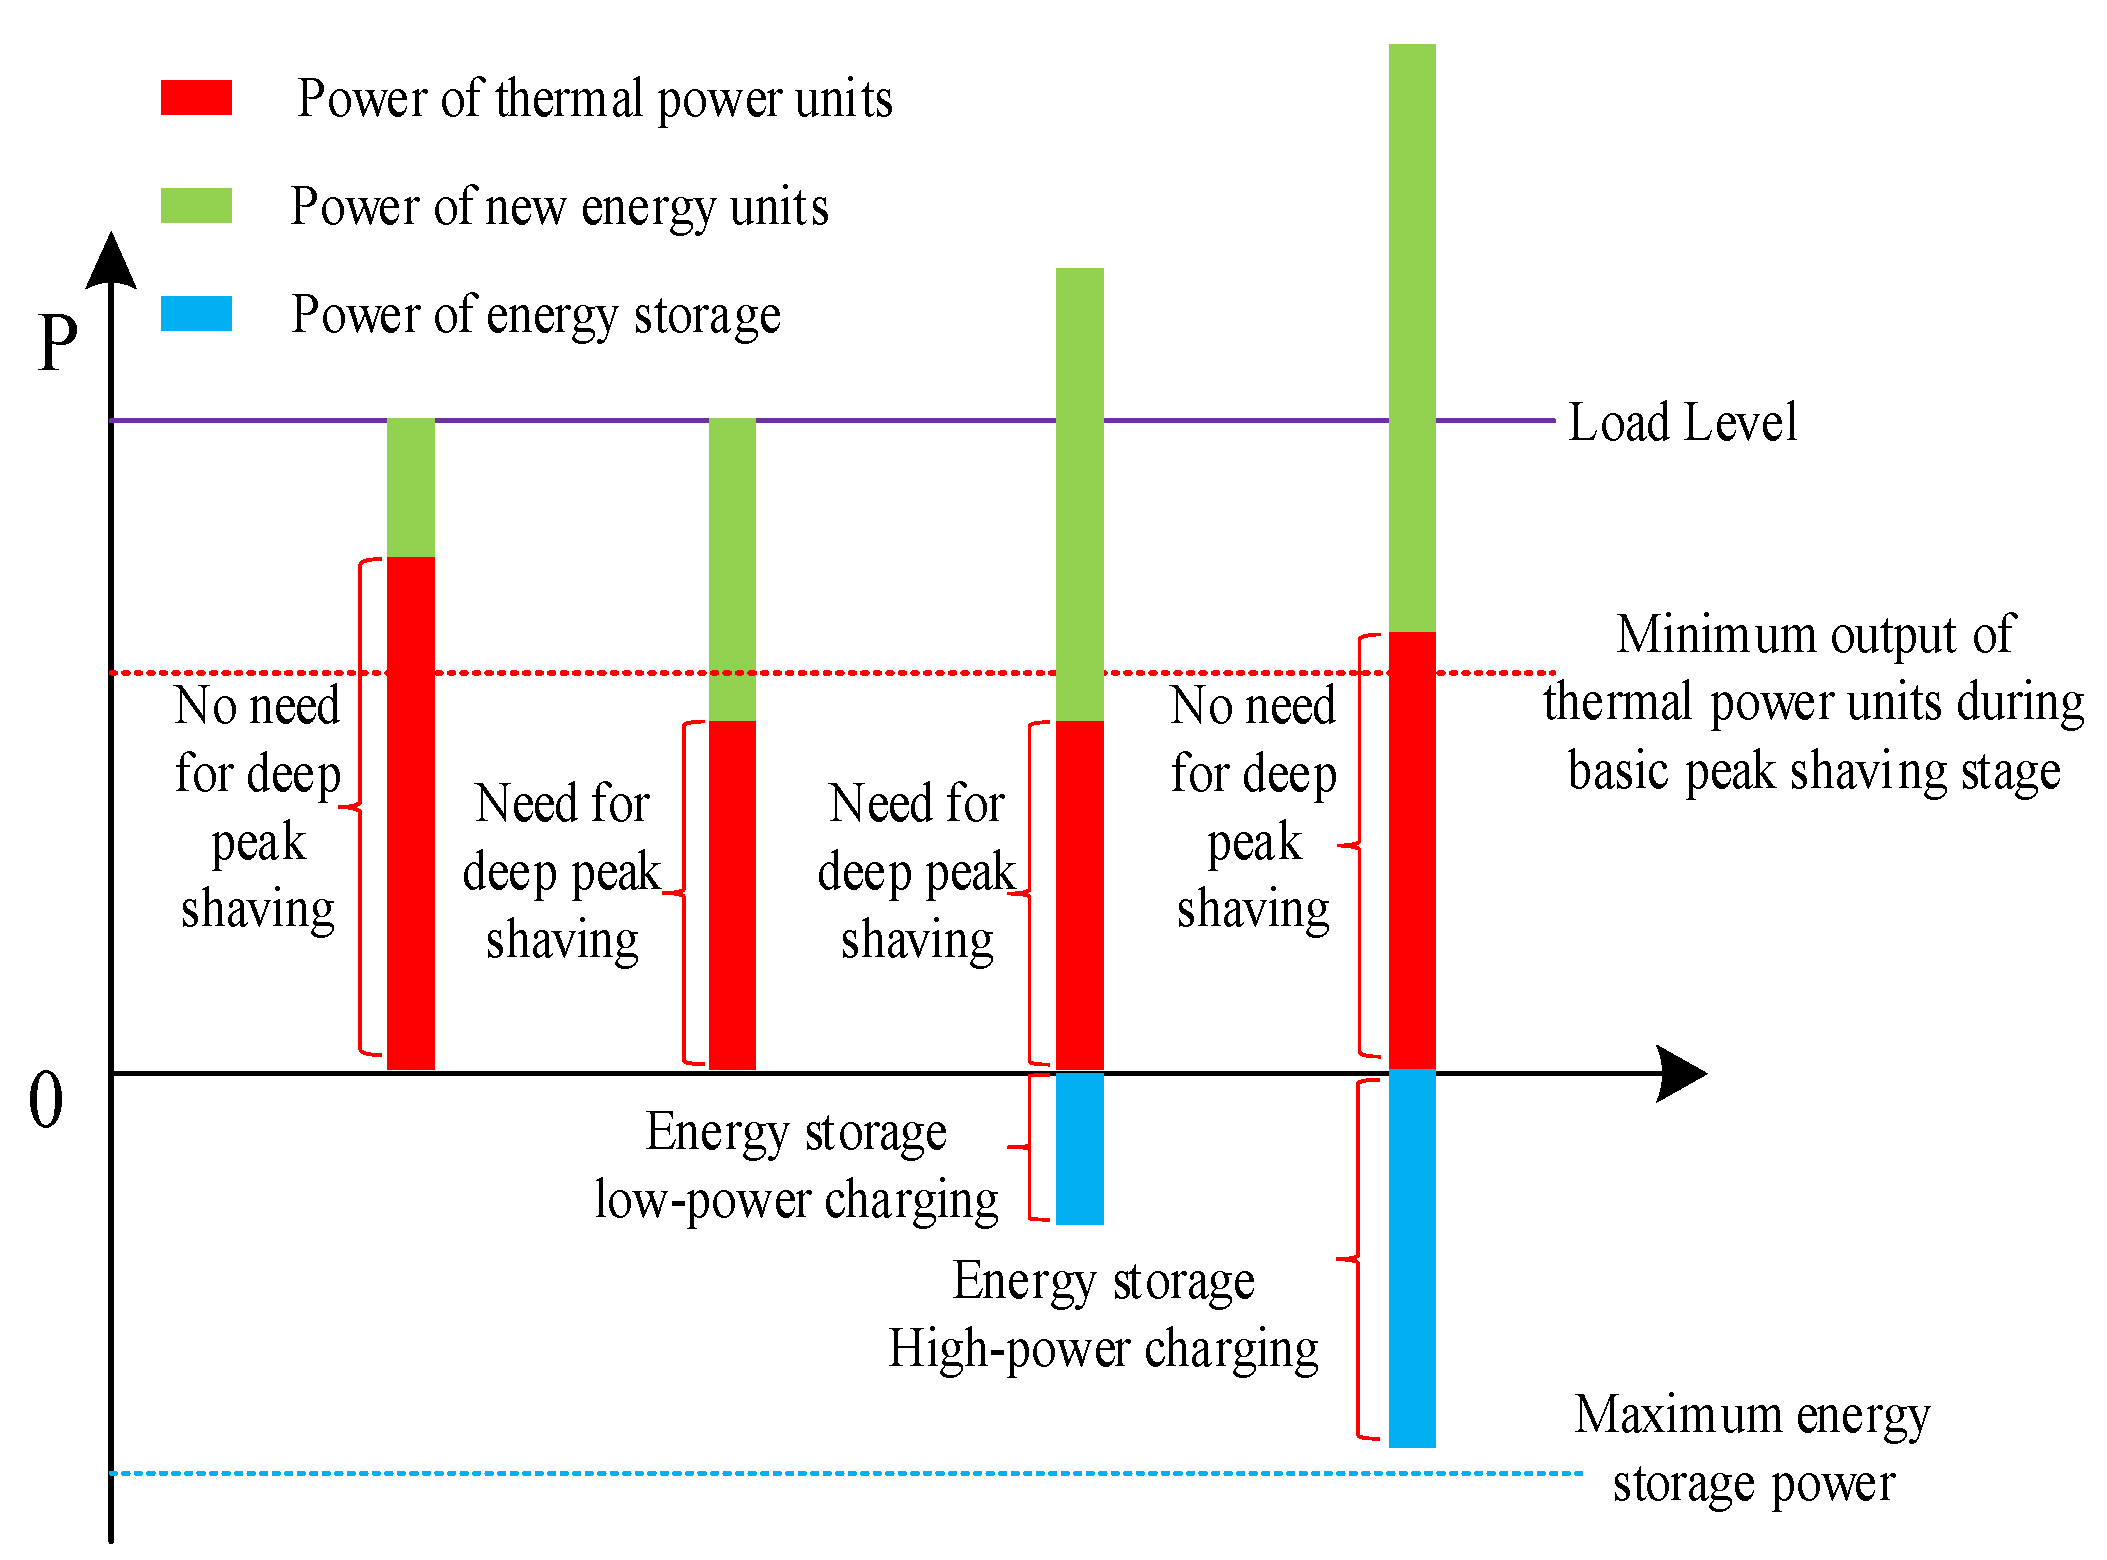
As shown in Figure 2, the large-scale integration of renewable energy sources, particularly wind and photovoltaic energy, has resulted in an increasing peak shaving demand for thermal power units during low-load periods [31]. If the load demand is maintained at the current level, the growing capacity of renewable energy sources gradually reduces the space for the output of traditional thermal power units and results in an increasing reliance on the deep peak shaving of thermal power units. The increasing depth of peak shaving not only burdens the security and reliability of the power system but also raises the system’s shaving costs.

Figure 2.
Analysis of the impact of energy storage and thermal power deep peaking on the system’s supply–demand balance.
However, the involvement of energy storage devices can charge during low-load periods to absorb excess renewable energy and discharge during high-load periods to meet system demand with good energy time-shift characteristics. In addition, energy storage can also effectively decrease the peak shaving capacity requirements of thermal power units, thereby reducing the associated costs of the system [32].
Therefore, the rational use of energy storage with flexible characteristics and its combination with the depth of thermal power unit peak shaving can improve the economic efficiency of system operation and the amount of renewable energy consumption.
4.2. Objective Function Construction
The objective function aims to minimize the total system’s peaking cost, which not only includes the deep peaking cost of thermal power units, start–stop cost and emission cost but also considers the life-long loss cost of energy storage and the penalty cost of wind and light abandonment.
In Equation (20), denotes the peaking cost of thermal power units; denotes the start–stop cost of thermal power units; denotes the pollutant emission cost of thermal power units; denotes the penalty cost of wind and light abandonment; and denotes the life-long loss cost of energy storage.
(1) Start-up and shutdown costs of thermal power units :
In Equation (21), denotes the single start-up and shutdown cost of thermal unit i.
(2) Cost of pollutant emissions from thermal power units :
In Equation (22), denotes the unit emission cost of the kth pollutant; denotes the total power generation capacity of the thermal power unit; and denotes the emission of the kth pollutant per unit of electricity.
(3) Penalty costs for wind and light abandonment :
In Equation (23), and represent the penalty coefficients for wind and light abandonment, respectively; represents the actual output of WTGs at moment t; represents the actual output of PV generating sets at moment t; represents the maximum output of WTGs at moment t; and represents the maximum output of PV generating sets at moment t.
(4) Energy storage cost modeling :
After determining the life cycle of the energy storage, the fixed cost of the energy storage can be discounted over the entire life cycle, i.e., its annual fixed cost is
In Equation (24), denotes the average annual fixed cost of battery energy storage; denotes the total capacity of battery energy storage investment; denotes the investment cost of battery energy storage unit capacity; and denotes the discount rate. Then, the value of the daily fixed cost share of energy storage is
4.3. Constraint Construction
(1) Wind and PV output constraints:
In Equations (26) and (27), represents the maximum output of the wind farm, and represents the maximum output of the photovoltaic power plant.
(2) System power balance constraints:
The sum of the total system’s thermal power unit output, grid-connected wind power, photovoltaic power and energy storage discharge should be equal to the real-time load when the system network losses are not taken into account. In other words, the sum of the total output of thermal power units of the system and the grid-connected wind power and photovoltaic power should be equal to the real-time load plus the energy storage charging load.
In Equation (28), denotes the discharging power of energy storage at time t; denotes the load demand of the system at time t; and denotes the charging power of energy storage at time t.
(3) Positive and negative rotational backup constraints for the system:
In Equation (29), and represent the upper and lower output limit of thermal power unit i, respectively; and represent the positive and negative rotating reserve capacity coefficients to cope with load forecast errors, respectively; and represent the positive and negative rotating reserve capacity coefficients to cope with wind power forecast errors, respectively; and and represent the positive and negative rotating reserve capacity coefficients to cope with photovoltaic forecast errors, respectively.
(4) Thermal unit output constraints:
(5) Thermal unit creep rate constraints:
In Equation (31), and represent the upper limit and lower limit of the creep rate of thermal power unit i, respectively.
(6) Minimum start–stop time constraints for thermal power units:
In Equation (32), and represent the maximum continuous start-up time and maximum continuous shutdown time of thermal power unit i, respectively.
5. Simulation
5.1. Scenario Design and Data Sources
To demonstrate that joint peaking of energy storage and thermal units can generate savings that considers peaking costs and energy storage lifetime losses, two scenarios are constructed in this paper for analysis:
Scenario 1: Only deep peaking of thermal power units exists in the operation of power systems without energy storage equipment.
Scenario 2: Energy storage lifetime losses and thermal power units deep peaking in the operation of power systems are considered (the scenario in this paper).
Moreover, to analyze the optimal energy storage capacity in the system, based on the parameters of Scenario 2, this paper further analyzes the impact of the change in the energy storage capacity as well as the fluctuation in the power of renewable energy on the peaking cost.
In this paper, a regional system is chosen as an example; this system includes six thermal power units. The data are mainly from [13].
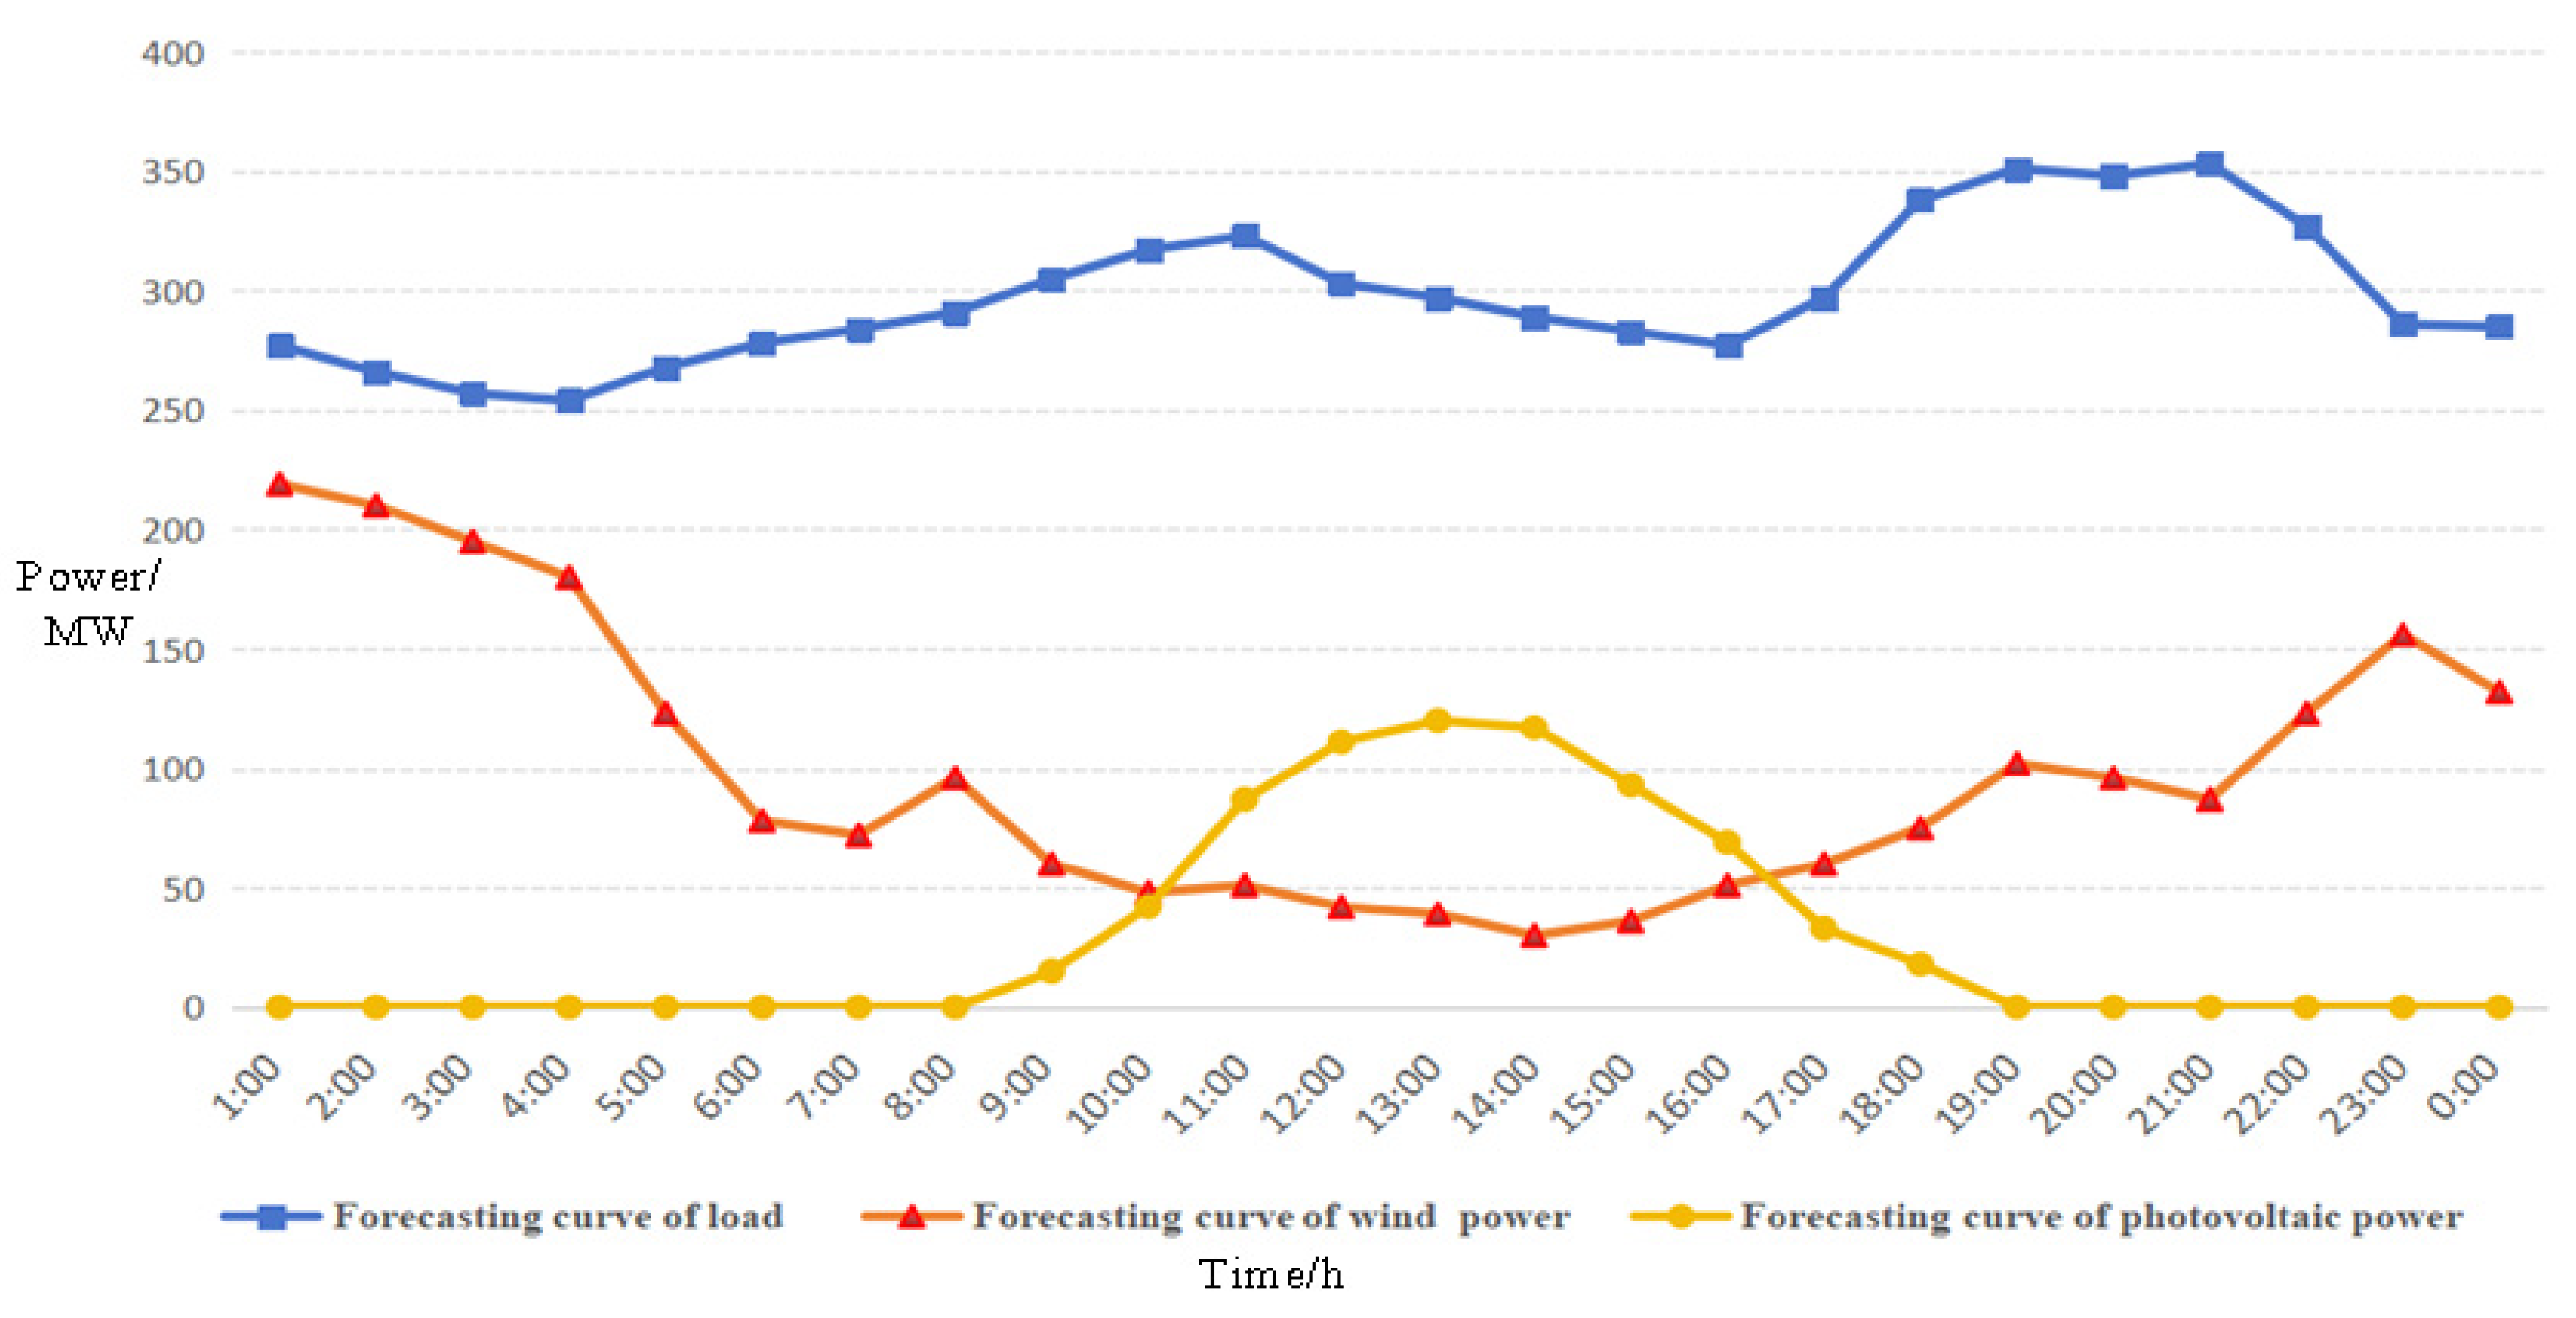
Specifically, the unit parameters are shown in Table A1 of Appendix A. The installed capacity of the wind and photovoltaic power plant is 300 MW and 150 MW, respectively. The abandoned wind and photovoltaic penalty cost is 600 and 500 CNY/MWh, respectively. In this paper, it is assumed that only thermal power units with a capacity of 200 MW are involved in deep peaking. The values of , and are taken as 50%, 40% and 30% of the rated power, respectively. The unit emission costs of CO2, SO2 and NO2 are 54, 3000 and 3000 CNY/t, respectively. Taking a typical day as an example, the wind and photovoltaic forecast curves and the daily load curve are shown in Figure A1 of Appendix A. The energy storage equipment uses iron phosphate carp batteries configured with power capacities of 20 MW and 40 MWh, respectively, with a unit capacity investment cost of 21,900 CNY/kWh, a floating charging life of 10 years without charge and discharge cycles, a rated number of cycles of 1591 and a charging and discharging efficiency of 90%. The system load standby factor is 0.05, the wind power standby factor is 0.01, and the photovoltaic standby factor is 0.01.
The models are solved in this paper using MATLAB 2018a software.
5.2. Analysis of Examples
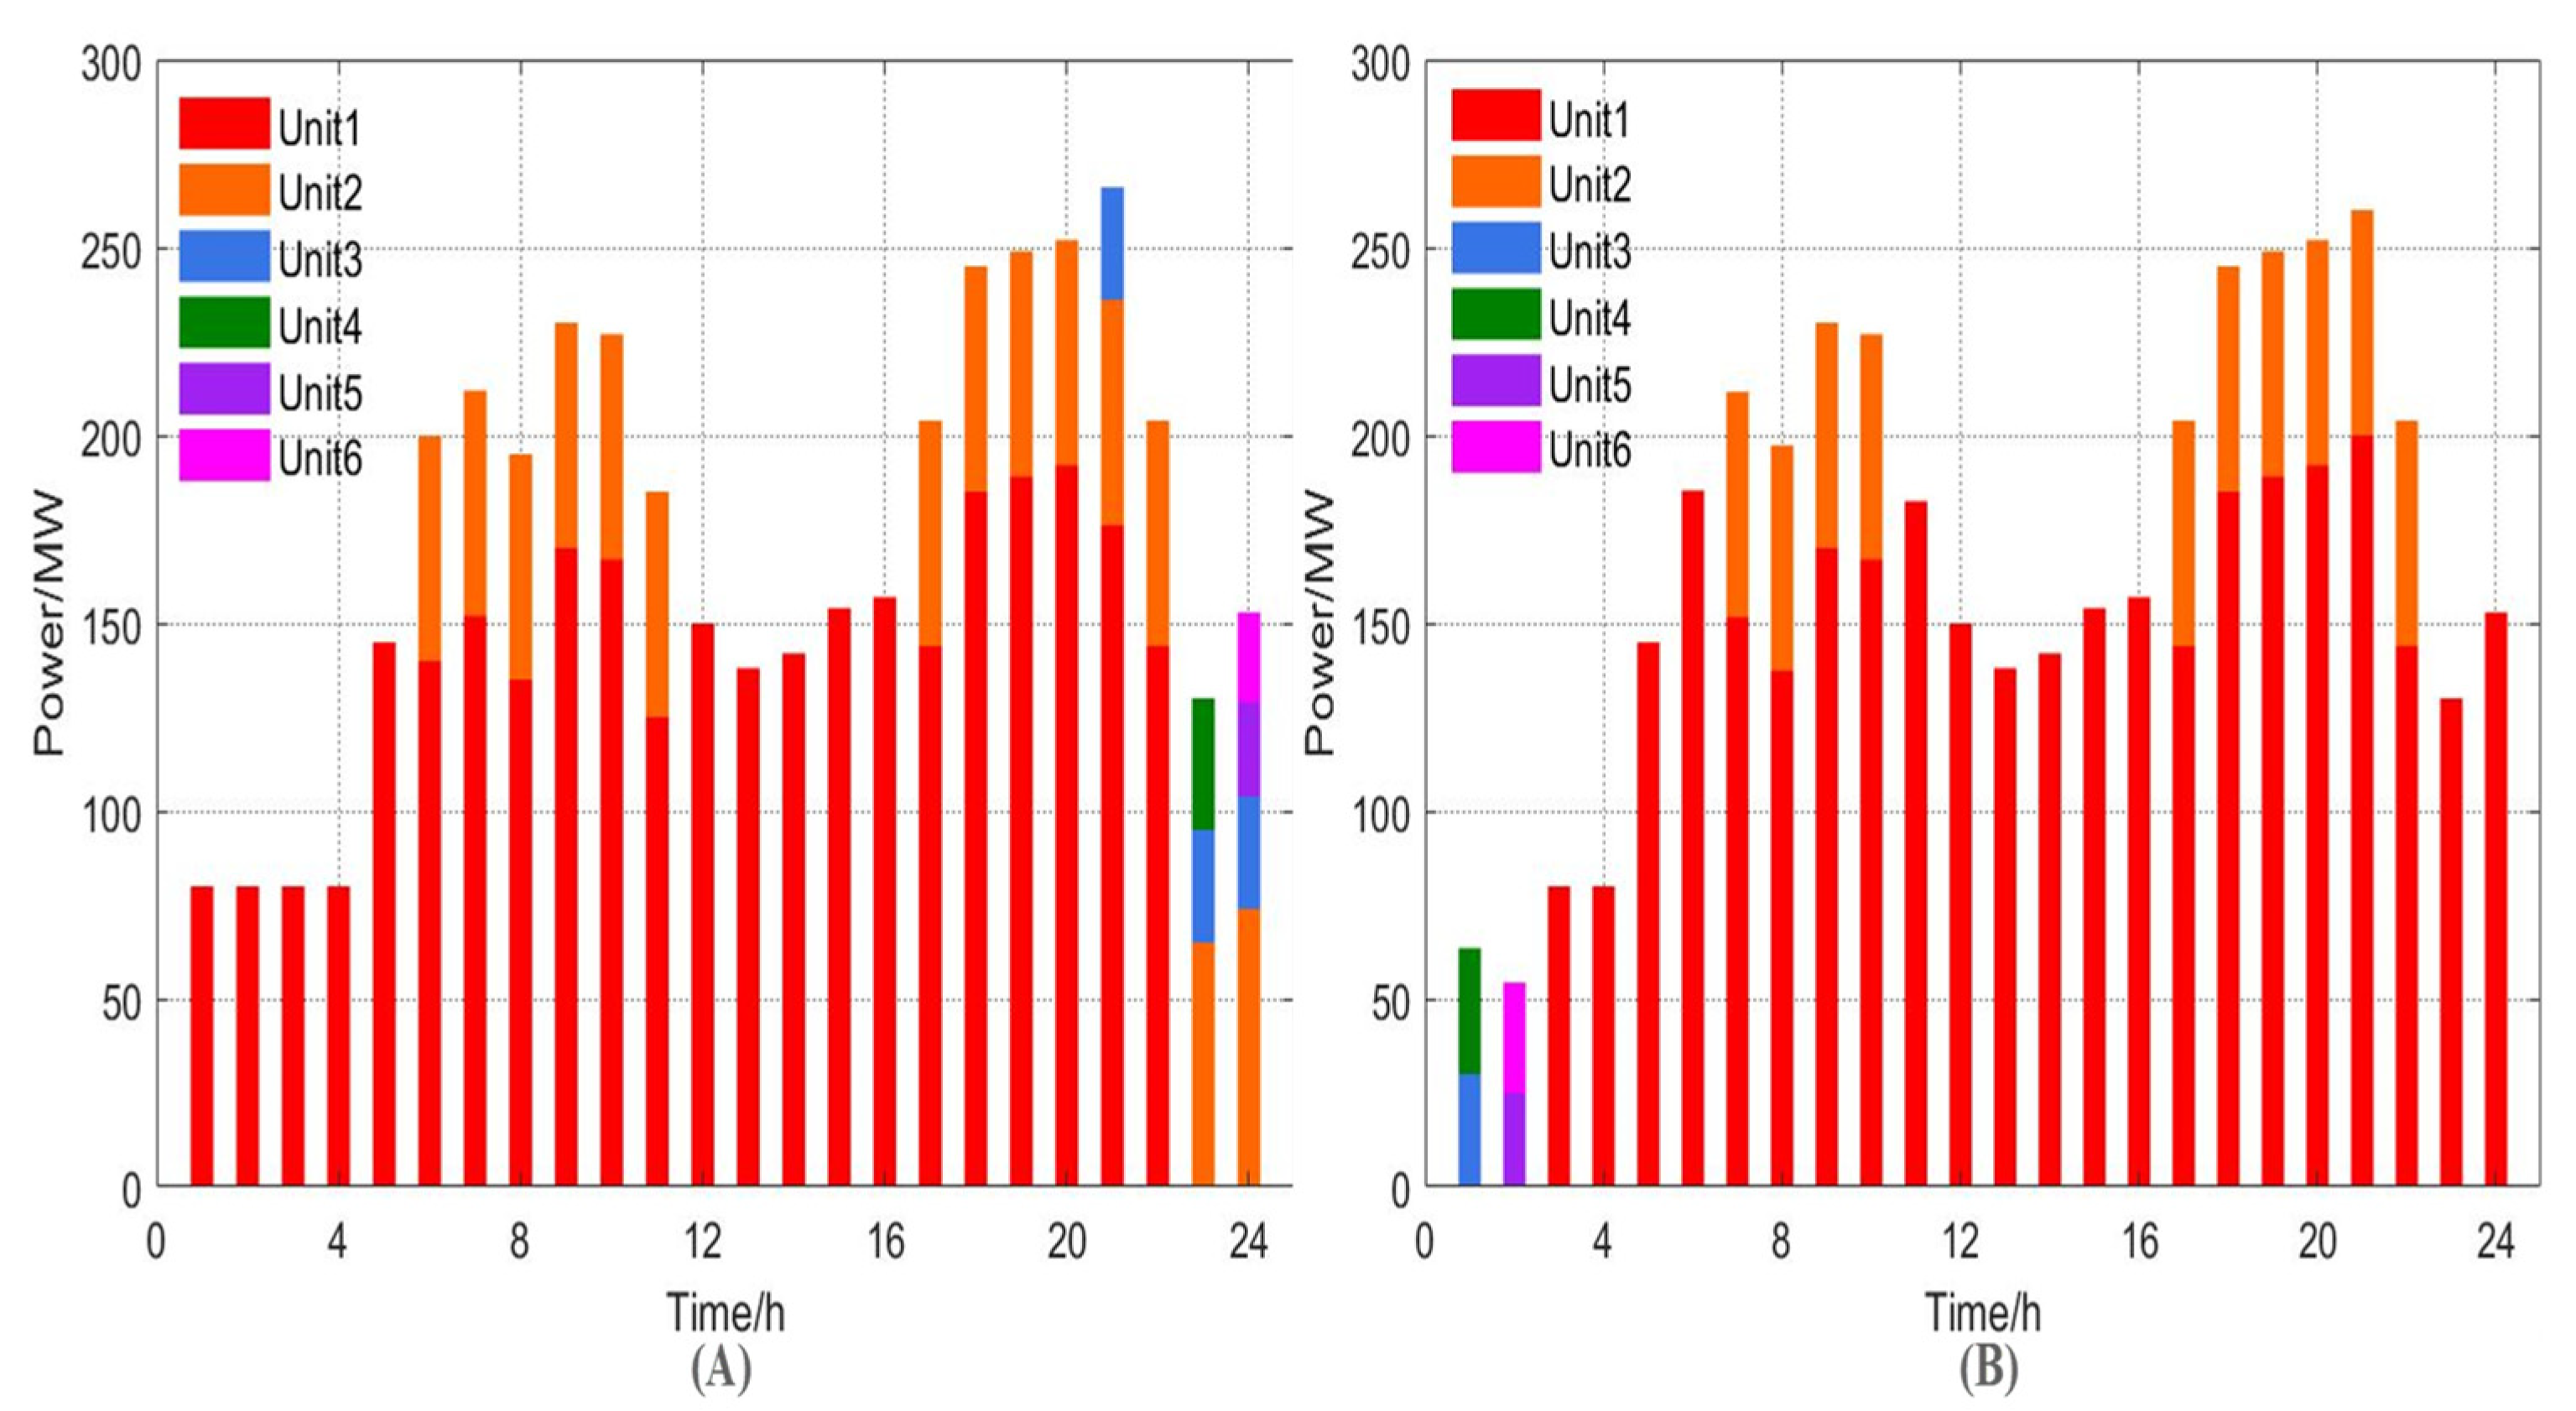
The output power of thermal power units in Scenario 1 and Scenario 2 is shown in Figure 3A,B, respectively. It is observed that the participation of energy storage in peak shaving can reduce the demand for deep peak shaving during low-load periods in the early morning. Specifically, in Figure 3A, from 1:00 to 4:00, when there is no energy storage involved in peaking, thermal power unit 1 needs to perform deep peak shaving in order to consume as much renewable energy as possible so as to maintain a balance between loads and generating power. The lowest power of thermal power unit 1 is 80 MW, which is 40% of the rated power.

Figure 3.
Thermal unit output under scenario1 (A). Thermal unit output under scenario1 (B).
If thermal power unit 1’s output is reduced to the lowest safe power, there is no space for new energy power to be consumed, resulting in the abandonment of new energy power. In contrast, because Figure 3B considers the participation of energy storage equipment, its flexible charging and discharging characteristics can enable the system to choose units with smaller capacities from 1:00 to 2:00 and select units with large capacities after the load rises, which reduces the need for the deep peak shaving of thermal power units. The demand of deep peak shaving in Scenario 2 is only half of that in Scenario 1.
The charging and discharging power of the energy storage device in Scenario 2 is further analyzed, as shown in Figure 4A,B. Figure 4A represents the charging and discharging power of the energy storage for each hour in Scenario 2. Figure 4B represents the variation in the storage capacity of energy storage for each hour in Scenario 2.
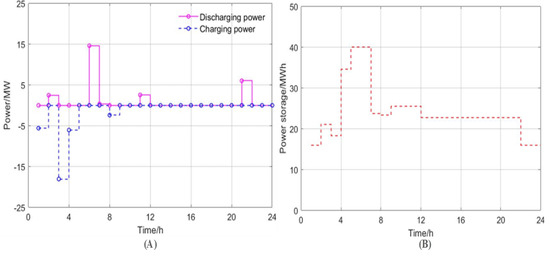
Figure 4.
Energy storage charging/discharging power under Scenario 2 (A). Energy storage capacity under Scenario 2 (B).
As seen in Figure 4, the charging time of energy storage is mainly focused in the early morning, that is, the low-load period. This is mainly because wind power in the early hours of the morning is maintained at a high level. If we use thermal power units for deep peak shaving, it increases the overall operating costs of the system, and through the flexible adjustment of the charge and discharge state of the energy storage equipment, we can reduce the peak shaving costs of the system and enhance the economic efficiency of the system’s operation. In high-load periods, a lithium battery discharges to meet the balance of power demand and supply.
The differences in the dimensions of the thermal power unit deep peak shaving cost and renewable energy abandonment scale in the two scenarios were compared, and the results are shown in Table 1. It can be clearly seen that, with the participation of energy storage equipment in peak shaving, the deep peak shaving cost of thermal power units, the total operation cost of thermal power units, the cost of wind and light abandonment penalties and the total cost in this system are reduced to different degrees. The deep peaking cost of thermal power units after adding energy storage is 50% of that in the scenario without energy storage, and the increase in the cost of storage life loss only accounts for 37.68% of the savings in the deep peaking cost of the thermal power units. Moreover, due to the charging behavior of energy storage during low-load hours, the wind abandonment behavior at night is reduced, and the wind abandonment penalty cost is lowered by 98.7%. The reduction in power generation from thermal power units leads to a reduction in air pollutant emissions by 1.53%. These data show that the consideration of energy storage devices reduces the system’s total operation cost.

Table 1.
Comparison of optimization results under different scenarios (unit: CNY).
To measure the change in energy storage life, the initial floating life of energy storage in this paper is 10 years; considering the life loss, the life cycle of energy storage is predicted to be 5.52 years based on the load level in Scenario 2. This shows that, in actual operation, the phenomenon of lifetime loss of energy storage is obvious; neglecting lifetime loss introduces some error into energy storage investment and operation.
Further, we measured the amount of renewable energy power consumption under the two scenarios, and the results are shown in Table 2 and Figure 5. With the addition of energy storage, the system reduces the renewable energy abandonment rate by 2.98%. The maximum wind abandonment is 13 MW, and the main wind abandonment periods are at 0:00 to 4:00 and 22:00 to 24:00. These results are consistent with the above results.
Table 2.
Comparison of the optimization results under different scenarios (unit: CNY).
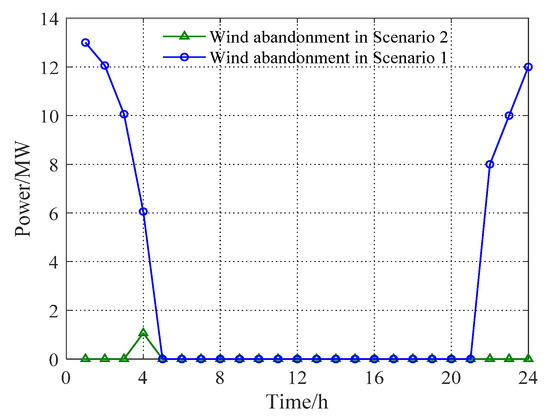
Figure 5.
Impact of the new energy output level and storage capacity on storage lifetime.
5.3. Factors Affecting Energy Storage Utilization
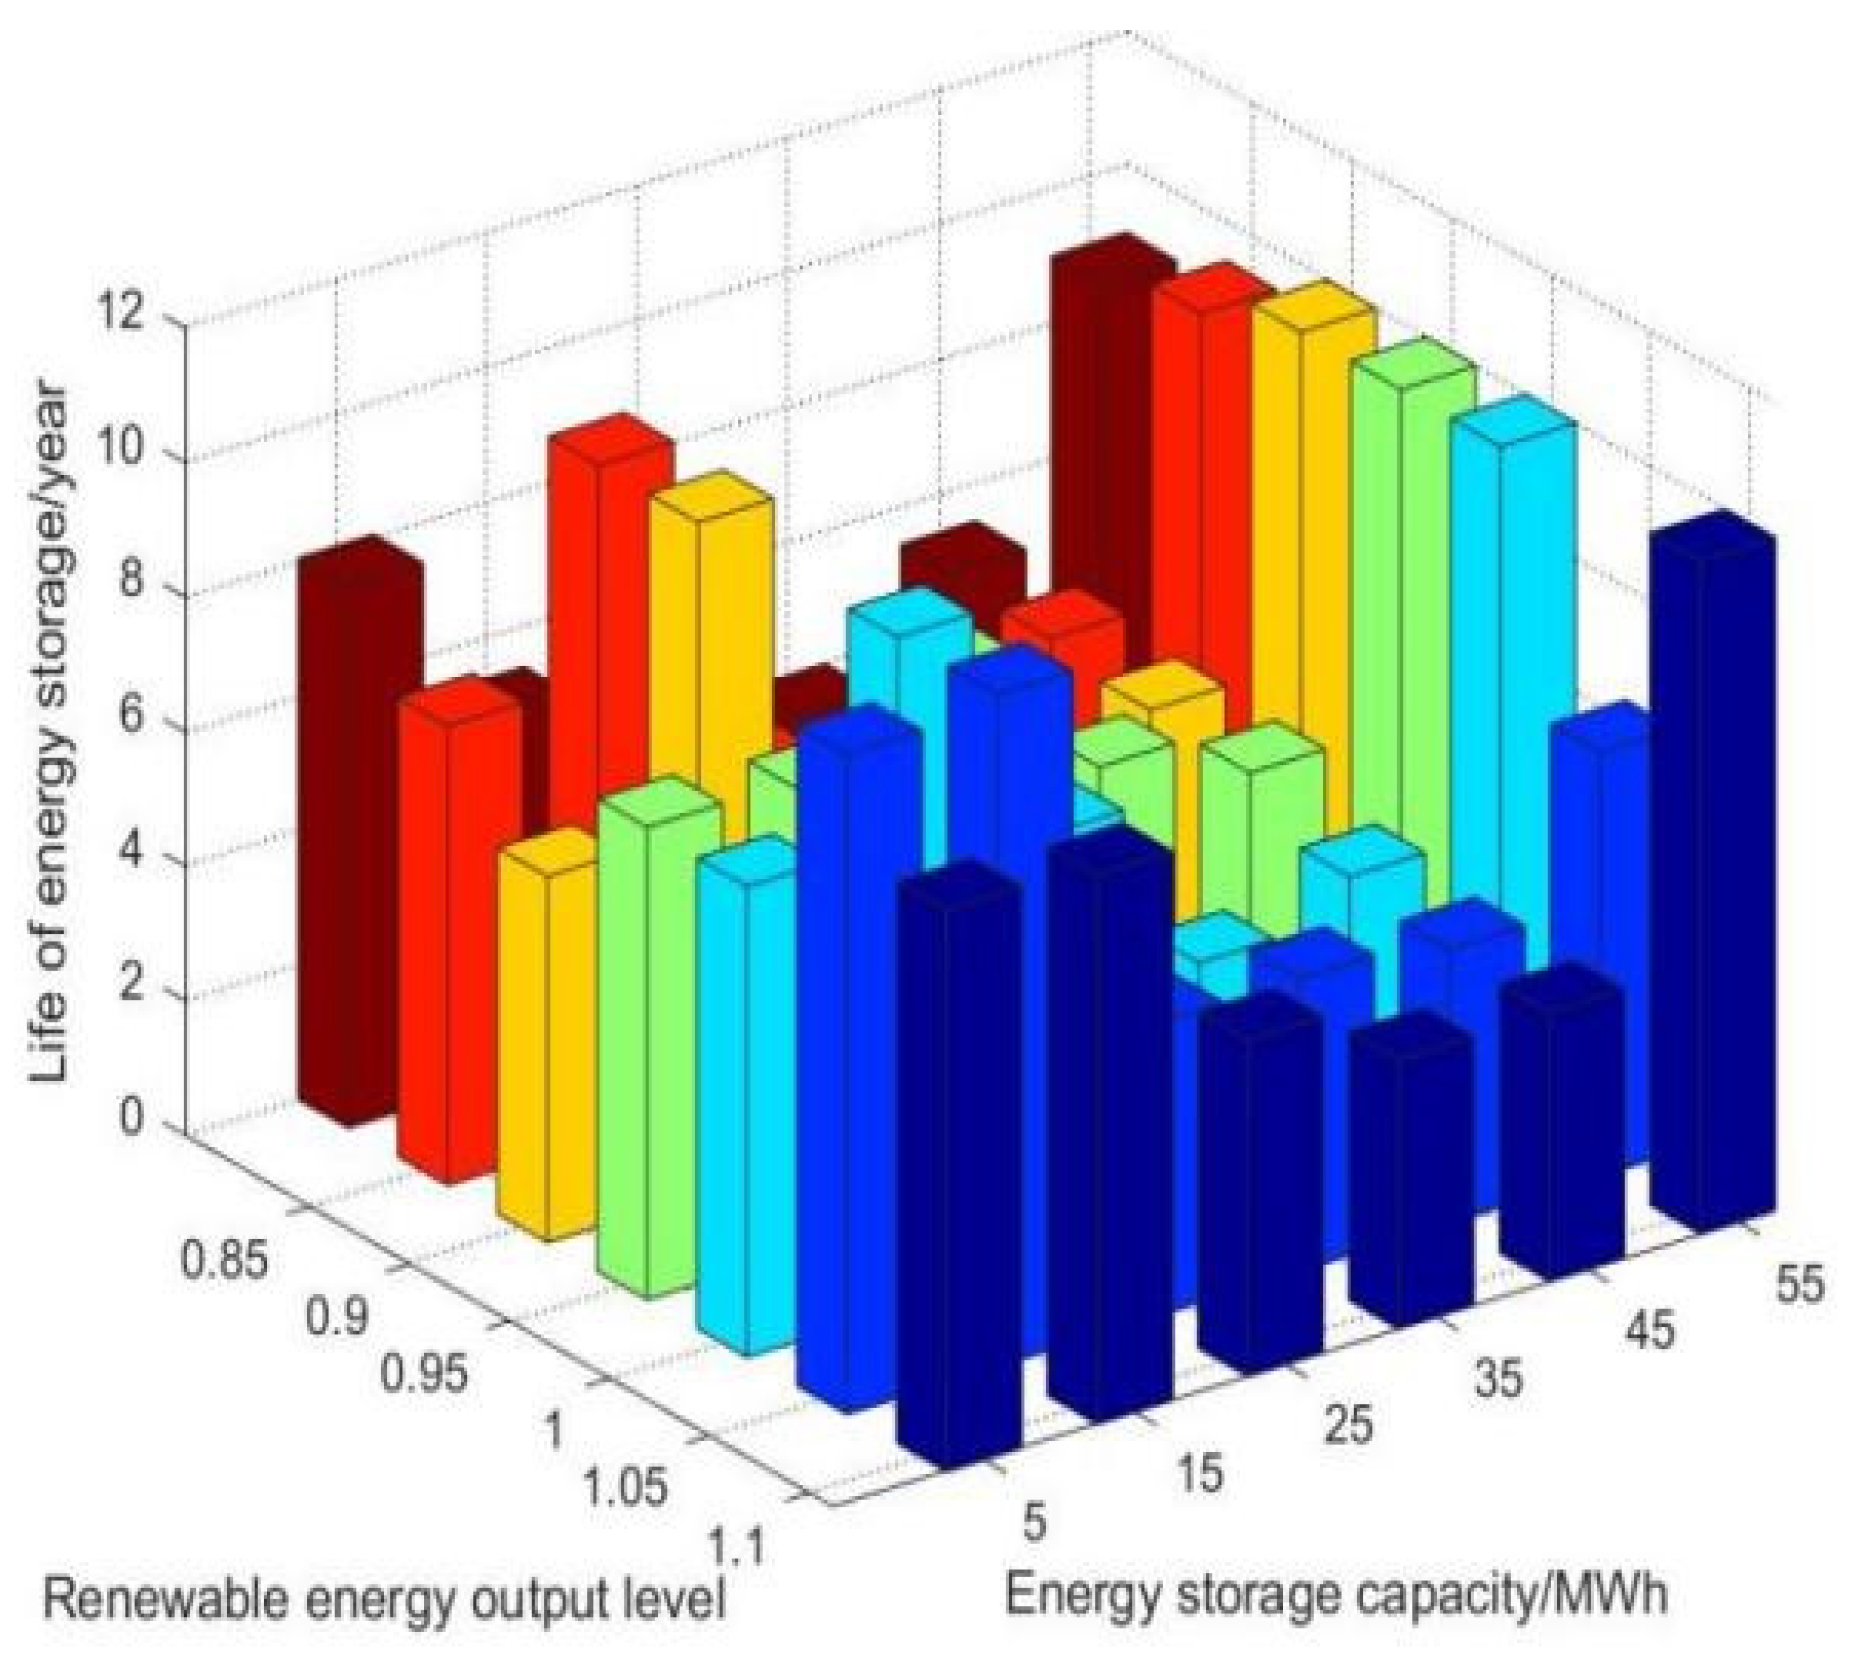
As seen in Figure 6, to analyze the impact of the renewable energy unit output per floating 5% on the energy storage life, the original renewable energy unit output curve in the scenario of this paper is defined as 1. Different colors are used to distinguish different levels of renewable energy output. Shades of color have no specific meaning. At the same time, the change range of the energy storage capacity in the system is set to 5 to 55 MW to further explore the impact of the change in the energy storage capacity on the life cycle of energy storage. From the results shown in Figure 6, as the energy storage investment increases, its life becomes almost close to the 10 years specified by the float life. The life index can also be used as a reverse reflection of the utilization index, i.e., the higher the utilization rate and the number of charge and discharge cycles, the lower the actual life cycle of the energy storage. This indicates that an energy storage capacity that is too high reduces the cost and utilization rate of energy storage. The reasonable investment scale of energy storage capacity in the simulation scenario is between 25 and 45 MW in this case. Most importantly, the increase in renewable energy output improves the utilization rate of energy storage and increases its lifetime loss, and the investment of energy storage can be evaluated according to the output characteristics of local renewable energy units in actual production activities.

Figure 6.
Impact of the new energy output level and storage capacity on storage lifetime.
Let us further analyze the impact of other metrics on energy storage lifetime. The energy storage life also reflects the change in its utilization. According to Table 3, this paper measures the energy storage life under different load standby rates. It was found that, the higher the system load standby rate, the utilization of energy storage increases, and the lifetime decreases significantly. That is, the higher the system’s standby demand, the lower the number of times of charging and discharging for energy storage, and the faster the life depletion. When the load standby rate exceeds 9%, the energy storage lifetime reduces to below 5.23, that is, only half of the initial lifetime.
Table 3.
Impact of spare ratio on energy storage lifetime.
Table 4 analyzes the impact of the energy storage investment cost on energy storage life. The results show that a lower unit cost of energy storage investment produces a lower cost of energy storage loss. Therefore, the energy storage can be charged and discharged frequently to meet the load demand, which increases the utilization of energy storage and reduces the cycle life. When the price of energy storage exceeds the threshold value of 2400, the number of charge and discharge cycles of energy storage basically remain constant, so the cycle life of energy storage increases first and then remains unchanged.
Table 4.
Impact of capacity costs on energy storage lifetime.
6. Conclusions
This paper proposes a thermal unit and energy storage joint optimization operation model that takes into account the lifetime losses of energy storage and deep peak shaving of thermal power units. From the results, the following conclusions can be drawn:
- (1)
- The participation of energy storage equipment in peak shaving can reduce system costs in terms of the peak shaving cost, abandoned wind and photovoltaic penalty cost and the total system power generation cost. Not only does it reduce the low-load power abandonment of wind power, the thermal power unit’s power generation and pollutant emissions, but it also facilitates the consumption of surplus renewable energy.
- (2)
- In the actual operation of power systems, the participation of energy storage in deep peak shaving leads to a significant increase in energy storage lifetime loss. Therefore, in the energy storage life prediction and investment return analysis, the energy storage operation lifetime loss should be considered to avoid an overly optimistic estimation of the economic loss.
- (3)
- The main factors affecting the system peaking cost are renewable energy output fluctuation and load curve fluctuation. Within a certain ratio, increasing investment in energy storage can save the system peaking cost, but too high of an investment not only fails to reduce the system peaking cost but also reduces the utilization rate of energy storage. Therefore, to achieve optimal investment, the construction of energy storage investment should focus on local renewable energy and thermal power installed capacity, wind and photovoltaic intensity, user load levels and other factors.
For future works, we aim to focus on the impact of other factors on the system peaking cost. Examples are environmental factors represented by the uncertainty of new energy output; technical factors represented by the unit climbing rate and the response speed of energy storage; human decision-making factors represented by the demand-side response and the declaration strategy of the market main body; and economic factors represented by the market trading price and the evaluation of the cost of energy storage investment.
Author Contributions
Conceptualization, Y.M.; Methodology, Y.M.; Software, Y.M.; Validation, Y.M.; Formal analysis, Y.M.; Investigation, Y.M.; Resources, Y.M.; Data curation, Y.M.; Writing—original draft, Y.M.; Writing—review & editing, Y.M., Z.C. (Zhengpai Cui), Z.C. (Zheng Cao), D.Y., S.C. and N.L.; Visualization, Z.C. (Zhengpai Cui), Z.C. (Zheng Cao), D.Y. and S.C.; Supervision, Z.C. (Zhengpai Cui), Z.C. (Zheng Cao), D.Y. and S.C.; Project administration, Z.C. (Zhengpai Cui), Z.C. (Zheng Cao), D.Y. and S.C.; Funding acquisition, Z.C. (Zhengpai Cui), Z.C. (Zheng Cao), D.Y. and S.C. All authors have read and agreed to the published version of the manuscript.
Funding
This research was supported by the State Grid Corporation Science and Technology Program: “Analysis of the Impact of the Implementation of Time-Sharing Tariff Policy on the Electricity Consumption Load and Benefits in North Hebei by State Grid Jibei Metering Center in 2023 (SGJBYJ00DFJS2310120)”.
Data Availability Statement
The original contributions presented in the study are included in the article/supplementary material, further inquiries can be directed to the corresponding author/s.
Conflicts of Interest
Author Zhengpai Cui, Zheng Cao and Dong Yao were employed by the company State Grid Jibei Electric Power Company Limited. The remaining authors declare that the research was conducted in the absence of any commercial or financial relationships that could be construed as a potential conflict of interest.
Nomenclature
| N | Total number of thermal power units. |
| Total number of charge and discharge cycles. | |
| Total number of cycles under 100 percent depth charging and discharging. | |
| Equivalent number of cycles for a full depth charge/discharge cycle | |
| Daily equivalent number of full charge and discharge of battery storage. | |
| Standard discharge depth. | |
| Charge and discharge depth of battery storage energy at moment t. | |
| Virtual variable of charge/discharge cycle of energy storage. | |
| Charge state dummy variable. | |
| Life cycle. | |
| Upper limit of the float life of the stored energy. | |
| Scheduling interval. | |
| Maximum continuous start-up time. | |
| Maximum continuous shutdown time. | |
| Average charging power. | |
| Average discharging power. | |
| Active power of thermal power unit i. | |
| Fuel cost function. | |
| Unit price of standard power coal. | |
| Number of rotor fracture cycles. | |
| Oil price in the current season. | |
| Actual output of WTGs at moment t. | |
| Actual output of PV generating sets. | |
| Maximum output of WTGs at moment t. | |
| Maximum output of PV generating sets. | |
| Maximum output of the wind farm. | |
| Maximum output of the photovoltaic power plant. | |
| Discharging power of energy storage. | |
| Load demand of the system at time t. | |
| Charging power of energy storage at time t. | |
| Upper output limit of thermal power unit i. | |
| Lower output limit of thermal power unit i. | |
| Life loss cost incurred during the deep peaking of the unit. | |
| Peaking cost of thermal power units. | |
| Peaking cost of thermal power units. | |
| Start–stop cost of thermal power units. | |
| Pollutant emission cost of thermal power units. | |
| Penalty cost of wind and light abandonment. | |
| Life-long loss cost of energy storage. | |
| Single start-up and shutdown cost of thermal unit i. | |
| Unit emission cost of the kth pollutant. | |
| Average annual fixed cost of battery energy storage. | |
| Investment cost of battery energy storage unit capacity. | |
| Oil consumption of thermal power units during the deep peaking stage of oil injection. | |
| Total power generation capacity of the thermal power unit. | |
| Total capacity of battery energy storage investment. | |
| Fitting coefficient, and all these are the technical parameters of the battery. | |
| Penalty coefficients for wind abandonment. | |
| Penalty coefficients for light abandonment. | |
| Parameter of charge state. | |
| Parameter of charge state in the starting state. | |
| Parameter of charge state in the end state. | |
| Start-up and shutdown cost of thermal power unit i. | |
| Quadratic coefficients. | |
| Primary coefficients. | |
| Constant coefficients. | |
| Lifetime loss factor of the thermal power unit. | |
| Emission of the kth pollutant per unit of electricity. | |
| Discount rate. | |
| Upper limit of the creep rate of thermal power unit i. | |
| Lower limit of the creep rate of thermal power unit i. | |
| Positive rotating reserve capacity coefficients to cope with load forecast errors. | |
| Negative rotating reserve capacity coefficients to cope with load forecast errors. | |
| Positive rotating reserve capacity coefficients to cope with wind power forecast errors. | |
| Negative rotating reserve capacity coefficients to cope with wind power forecast errors. |
Appendix A
Table A1.
Parameters of thermal power units.
Table A1.
Parameters of thermal power units.
| Unit | Maximum Output/MW | Minimum Output/MW | Ramp-Up Rate/MWh | Fuel Cost Factor | ||
|---|---|---|---|---|---|---|
| 1 | 200 | 60 | 80 | 0.0375 | 20.0 | 372.5 |
| 2 | 80 | 40 | 20 | 0.1750 | 17.5 | 352.3 |
| 3 | 50 | 25 | 25 | 0.6250 | 10.0 | 316.5 |
| 4 | 35 | 17.5 | 15 | 0.0834 | 32.5 | 329.2 |
| 5 | 30 | 15 | 10 | 0.2500 | 30.0 | 276.4 |
| 6 | 40 | 20 | 15 | 0.2500 | 30.0 | 232.2 |

Figure A1.
Prediction curves of wind, photovoltaic power and load.
Figure A1.
Prediction curves of wind, photovoltaic power and load.
References
- Jiang, F.; Peng, X.; Tu, C.; Guo, Q.; Deng, J.; Dai, F. An improved hybrid parallel compensator for enhancing PV power transfer capability. IEEE Trans. Ind. Electron. 2022, 69, 11132–11143. [Google Scholar] [CrossRef]
- Li, J.; Mu, G.; Zhang, J.; Li, C.; Yan, G.; Zhang, H.; Chen, G. Dynamic economic evaluation of hundred megawatt-scale electrochemical energy storage for auxiliary peak shaving. Prot. Control. Mod. Power Syst. 2023, 8, 50. [Google Scholar] [CrossRef]
- Cao, Y.; Zhou, B.; Chung, C.Y.; Shuai, Z.; Hua, Z.; Sun, Y. Dynamic modelling and mutual coordination of electricity and watershed networks for spatio-temporal operational flexibility enhancement under rainy climates. IEEE Trans. Smart Grid 2023, 14, 3450–3464. [Google Scholar] [CrossRef]
- Wu, Y.; Wang, J.; Song, Y.; Xie, Y. Resilience-Oriented Valuation for Energy Storage Amidst Extreme Events. Chin. J. Electr. Eng. 2023, 9, 15–25. [Google Scholar] [CrossRef]
- Wu, K.; Zhou, H.; An, S.; Huang, T. Optimal coordinate operation control for wind-photovoltaic-battery storage power-generation units. Energy Convers. Manag. 2015, 90, 466–475. [Google Scholar] [CrossRef]
- Li, K.; Huangfu, X.; Li, M.; Yu, H.; Xu, Q.; Luo, Pan. Energy Storage Planning for Integrated PV-Energy Storage Electric Vehicle Charging Station. Proc. CSU-EPSA 2023, 35, 82–93. (In Chinese) [Google Scholar]
- Xu, B.; Oudalov, A.; Ulbig, A.; Andersson, G.; Kirschen, D.S. Modeling of lithiumion battery degradation for cell life assessment. IEEE Trans. Smart Grid 2018, 9, 1131–1140. [Google Scholar] [CrossRef]
- Zhao, W.; Yuan, X.; Zhou, Y.; Li, P.; Lei, E. Capacity configuration method of a second-use battery energy storage system considering economic optimization within service life. Power Syst. Prot. Control. 2021, 49, 16–24. [Google Scholar]
- Wang, L.; Chen, Q.; He, G.; Kang, C.Q. Optimization of Generation Scheduling Considering Battery Energy Storage Life Model. Autom. Electr. Power Syst. 2019, 43, 93–100. (In Chinese) [Google Scholar]
- He, H.; Zhang, N.; Du, E.; Ge, Y.; Kang, C. Review on Modeling Method for Operation Efficiency and Lifespan Decay of Large-scale Electrochemical Energy Storage on Power Grid Side. Autom. Electr. Power Syst. 2020, 44, 193–207. (In Chinese) [Google Scholar]
- Zakeri, B.; Syri, S. Electrical energy storage systems: A comparative life cycle cost analysis. Renew. Sustain. Energy Rev. 2015, 42, 569–596. [Google Scholar] [CrossRef]
- Wang, Z.; Chen, J.; Zhu, J. Optimal configuration and operation strategy of energy storage considering cycle life. Electr. Power Autom. Equip. 2021, 41, 75–81. (In Chinese) [Google Scholar]
- Chen, Y.; Wu, C.; Jiao, Y.; Sun, Z.; Dai, S.; Zhang, P. Coordinated optimal operation strategy of thermal power-energy storage considering demand response and life model of energy storage. Electr. Power Autom. Equip. 2022, 42, 16–24. (In Chinese) [Google Scholar]
- Cheng, R.; Duan, Y.; Wu, Y.; Zhang, L.; Xu, Z.; Liu, Z. Energy Storage Planning of Distribution Network Considering Equivalent Cyclic Discharge Depth Constraints. South. Power Syst. Technol. 2024; 1–10. (In Chinese) [Google Scholar]
- Wu, X.; He, M.; He, W.; Li, X.; Wang, P.; Wu, Y. Optimal capacity of a wind-solar-thermo-storage-bundled power transmission system considering battery life. Power Syst. Prot. Control 2023, 51, 66–75. (In Chinese) [Google Scholar]
- Liang, T.; She, X.; Li, Y.; Zhang, T.; Ding, Y. Thermo-economic multi-objective optimization of the liquid air energy storage system. J. Energy Storage 2024, 84, 110756. [Google Scholar] [CrossRef]
- Zhong, C.; Chu, W.; Li, X.; Chen, J.; Tian, D.; Wu, X. Optimal dispatch of photovoltaic storage diesel microgrid considering energy storage life. Electrotech. Appl. 2023, 42, 9–15. (In Chinese) [Google Scholar]
- Li, J.; Zhang, J.; Mu, G.; Ge, Y.; Yan, G.; Shi, S. Hierarchical Optimization Scheduling of Deep Peak Shaving for Energy-storage Auxiliary Thermal Power Generating Units. Power Syst. Technol. 2019, 43, 3961–3970. [Google Scholar]
- Ye, Z.; Li, X.; Jiang, F.; Chen, L.; Wang, Y.L.; Dai, S. Hierarchical Optimization Economic Dispatching of Combined Wind-PV-thermal-energy Storage System Considering the Optimal Energy Abandonment Rate. Power Syst. Technol. 2021, 45, 2270–2280. (In Chinese) [Google Scholar]
- Li, X.W.; Wang, X.; Gu, J.W. Business Models of Electric Vehicle Aggregators Considering Electricity Price Uncertainty and Capacity Decay. Electr. Power 2023, 56, 1–7+48. (In Chinese) [Google Scholar]
- Yang, X.Y.; Liu, X.Y.; Guo, Q.; Sun, Y.; Yan, G.G.; Li, H.Y. Coordinated Planning of Energy Storage and Flexible Retrofit of Thermal Power Units Considering Ancillary Service Income. Power Syst. Technol. 2023, 47, 1350–1362. (In Chinese) [Google Scholar] [CrossRef]
- ALAhmad, A.K. Voltage regulation and power loss mitigation by optimal allocation of energy storage systems in distribution systems considering wind power uncertainty. J. Energy Storage 2023, 59, 106467. [Google Scholar] [CrossRef]
- Pinciroli, L.; Baraldi, P.; Compare, M.; Zio, E. Optimal operation and maintenance of energy storage systems in grid-connected microgrids by deep reinforcement learning. Appl. Energy 2023, 352, 121947. [Google Scholar] [CrossRef]
- Efkarpidis, N.A.; Imoscopi, S.; Geidl, M.; Cini, A.; Lukovic, S.; Alippi, C.; Herbst, I. Peak shaving in distribution networks using stationary energy storage systems: A Swiss case study. Sustain. Energy Grids Netw. 2023, 34, 101018. [Google Scholar] [CrossRef]
- Ali, A.Y.; Hussain, A.; Baek, J.-W.; Kim, H.-M. Optimal operation of static energy storage in fast-charging stations considering the trade-off between resilience and peak shaving. J. Energy Storage 2022, 53, 105197. [Google Scholar] [CrossRef]
- Martinez-Bolanos, J.R.; Udaeta, M.E.M.; Gimenes, A.L.V.; da Silva, V.O. Economic feasibility of battery energy storage systems for replacing peak power plants for commercial consumers under energy time of use tariffs. J. Energy Storage 2020, 29, 101373. [Google Scholar] [CrossRef]
- He, Z.; Liu, C.; Wang, Y.; Wang, X.; Man, Y. Optimal operation of wind-solar-thermal collaborative power system considering carbon trading and energy storage. Appl. Energy 2023, 352, 121993. [Google Scholar] [CrossRef]
- Lai, Y.; Sun, Z.; Lu, Z.; Lui, Q. Considering the Power Grid Optimization Operation and Resilience lmprovement Strategy of Energy Storage Resource Aggregation. Electr. Power, 2024; 1–9. (In Chinese). Available online: http://kns.cnki.net/kcms/detail/11.3265.TM.20240604.1730.004.html. (In Chinese)
- Ge, Y.; Shang, C. Energy Storage Planning Constrained by Its Life. In Proceedings of the CSEE, Lisbon, Portugal, 18–20 October 2020; Volume 40, pp. 6150–6161. [Google Scholar]
- Li, Y.; Li, W.; Yan, W. Daily generation scheduling for reducing losses of unit’s lives based on the chance constrained programming model. Power Syst. Technol. 2014, 38, 1885–1890. (In Chinese) [Google Scholar]
- Cole, W.; Denholm, P.; Carag, V.; Frazier, W. The peaking potential of long-duration energy storage in the United States power system. J. Energy Storage 2023, 62, 106932. [Google Scholar] [CrossRef]
- Cui, Y.; An, N.; Fu, X.; Xiu, Z.; Zhao, Y.; Zhong, W. Optimal scheduling of system and compensation cost sharing strategy considering wind power consumption and thermal-storage deep peak shaving. Electr. Power Autom. Equip. 2023, 43, 86–95. [Google Scholar]


Disclaimer/Publisher’s Note: The statements, opinions and data contained in all publications are solely those of the individual author(s) and contributor(s) and not of MDPI and/or the editor(s). MDPI and/or the editor(s) disclaim responsibility for any injury to people or property resulting from any ideas, methods, instructions or products referred to in the content. |
© 2024 by the authors. Licensee MDPI, Basel, Switzerland. This article is an open access article distributed under the terms and conditions of the Creative Commons Attribution (CC BY) license (https://creativecommons.org/licenses/by/4.0/).