Abstract
In the modern aerospace industry, the importance of a lubrication system is self-evident for aero-engines, and the aero-engine bearing chamber return line is an even more challenging environment, as it involves a complex two-phase flow. The designer of the scavenge pipe needs to have an accurate understanding of the flow conditions in the scavenge pipe. This paper establishes a visual scavenge pipe test system. The flow direction was vertical flow, the test temperature was 370 k, and a high-speed camera was used to take high-definition flow photographs, which can observe the three main flow types: bubble flow, slug flow, and annular flow. Code program was created to analyze many pictures taken to obtain the apparent flow rate and perimeter of bubbles in the pipe under different flow conditions and to explore the gas–liquid two-phase flow in the scavenge pipe. A support vector machine (SVM) was used for data regression prediction, and the converted velocities of the gas–oil phases were inputted as eigenvalues to obtain the predicted values of bubble-flow velocity. The bubble-flow analysis prediction model established in this paper has a good prediction effect with root mean square error RMSE = 0.0172, which can more objectively and accurately describe the bubble-flow characteristics in the scavenge pipe.
1. Introduction
In the modern aerospace industry, the high reliability of aero-engines has become a crucial consideration as flight safety is continuously improved. In this context, the lubrication system plays an indispensable role. Slick oil is responsible for lubricating key components such as bearings, gears, and seals, ensuring they work smoothly and with low wear in high-speed operation. Slick oil can effectively take away a large amount of heat generated by the aviation engine in the process of operation, which in turn provides a certain degree of cooling to the engine [1,2]. This cooling effect is essential for maintaining the stable operation of the engine and extending its service life. Elevated temperature air from a compressor is also used to seal the bearing chamber, and additional heat is introduced into the lubricant by radiation, conduction, and convection from the surrounding environment. In modern aero-engine designs, elevated temperature air from the compressor is often utilized to ensure the bearing cavity’s sealing. At the same time, this air introduces additional heat into the lubricant through radiation, conduction, and convection from the surrounding environment. It is worth noting, however, that excessive temperature is a double-edged sword for slick oils. While it helps to enhance the performance of the lubricant, once a critical value is exceeded, the lubricant may spontaneously combust or coke, which poses a severe threat to the reliability and safety of the engine. To effectively manage this risk, aero-engines have adopted various measures to design the bearing chamber. A ventilation pipe is installed at the top of the bearing chamber, which serves to exhaust most of the sealing air to prevent excessive pressure. At the bottom, on the other hand, the scavenge pipe is installed, which is connected to an oil-return pump and is responsible for discharging significant amounts of lube oil and a few gases to achieve lube oil recycling. Of particular note is that the scavenge pipe is a complex environment. There is a significant amount of elevated-temperature lube oil flow and minimal pressurized sealing gas. This complex oil and gas two-phase flow state makes the slippery oil more prone to spontaneous combustion and coking [3,4]. Therefore, through reasonable system design and exemplary maintenance management, we can effectively control the temperature in the bearing cavity of the aero-engine, ensure the safe and stable operation of the sliding oil, and thus improve the reliability and safety of the whole engine. Based on the flow pattern of bearing cavity oil and gas lubrication research, this can be carried out under strict theoretical guidance and higher accuracy and efficiency of analysis; so, in recent years, people have been paying attention to it. One of the primary tasks in studying oil–air two-phase lubrication in bearing cavities based on flow pattern is the judgment of flow pattern, a very effective technique to quickly and accurately judge the flow state by testing the characteristic parameters.
Although traditional flow pattern discriminant diagrams and empirical relational equations are widely used in the study of multiphase flow in tubes, they face challenges such as poor identification accuracy and more constraints on their use [5]. However, with the progress of science and technology and especially the rapid development of computer technology, two-phase flow measurement technology, data fusion technology, and signal analysis theory, new methods are being provided to improve the analysis of two-phase flow in tubes. Therefore, by combining these new technologies and processes, we can develop more advanced and efficient tools and methods for analyzing two-phase flow in tubes to overcome the deficiencies in the traditional methods and improve the analyses’ accuracy and reliability. G. Rafalko [6,7] and his colleagues employed images to identify two-phase flow patterns directly and analyzed the pressure fluctuation signals in the tube resulting from two-phase flow by capturing those signals. V.T. Nguyen et al. [8,9,10] used wavelets for the analysis. H. Ji et al. [11,12] used the empirical mode decomposition method for the signal decomposition. Diego Mesa et al. [13] used image analysis for bubble size measurements. In this paper, we carry out a visualization test of two-phase flow in a scavenge pipe by utilizing a high-speed camera to capture images of the flow dynamics, establish code program to analyze the photos from the high-speed camera, and analyze and calculate the apparent velocity of the target bubbles and the perimeter of the bubble contour in the picture to obtain the kinematic characteristics of the bubbles in the pipe.
As an essential engine for advancing artificial intelligence, machine learning is dedicated to mining and learning potential laws from massive system data and constructing predictive models using cutting-edge algorithms. Machine learning techniques have been widely applied in several areas where signal analysis is in high demand. For example, in the study of B, Yadav et al. [14,15], they employed neural network models for prediction and classification tasks. However, it is worth noting that the training process of neural network models usually takes a long time, and the data preprocessing step is crucial for the model’s performance. It is worth noting that the training cycle of neural networks is long, and the data preprocessing step before training is significant and requires careful manipulation. Coulston et al. [16] provided a reasonable estimation of the prediction uncertainty of the random forest regression model, which suffers from the problems of overfitting and black-boxing, etc. Wang et al. [17] used the SVM for air quality prediction, which has a better prediction accuracy. SVM has less influence on the training data and has a better prediction accuracy against the noise. SVM has less influence on the training data and has better resistance to the fluctuation of noisy data and local small samples, and the prediction results are relatively stable. The SVM model has strong interpretability, and SVM has strong generalization ability after training the model and has better prediction ability for new samples, which can effectively avoid the overfitting problem [18,19,20]. Therefore, it has been widely used in practical applications.
In this study, we built a test rig to visualize the scavenge pipe [21,22]. The flow direction was vertical upward flow, the test temperature was 370 k, and a high-speed photographic instrument photographed the flow pattern. We observed three main flow patterns: bubble flow, slug flow, and annular flow. The code program was established to analyze the corresponding pictures to obtain the apparent flow velocity of the bubbles in the tube under different flow conditions and the circumference of the bubbles in the corresponding images. SVM machine learning was used for data regression prediction, and the conversion velocities of the gas and oil were input as the eigenvalues to obtain the predicted values of the bubble-flow velocities. The bubble-flow analysis prediction model established in this paper has a good prediction effect with an error value lower than 5%. We are able to accurately analyze the movement of the bubbles in the oil-return pipeline to gain insight into their dynamic behavior. This model helps to improve our understanding of the scavenge pipe’s performance and provides robust data support for subsequent improvement and optimization.
2. Experimental Apparatus
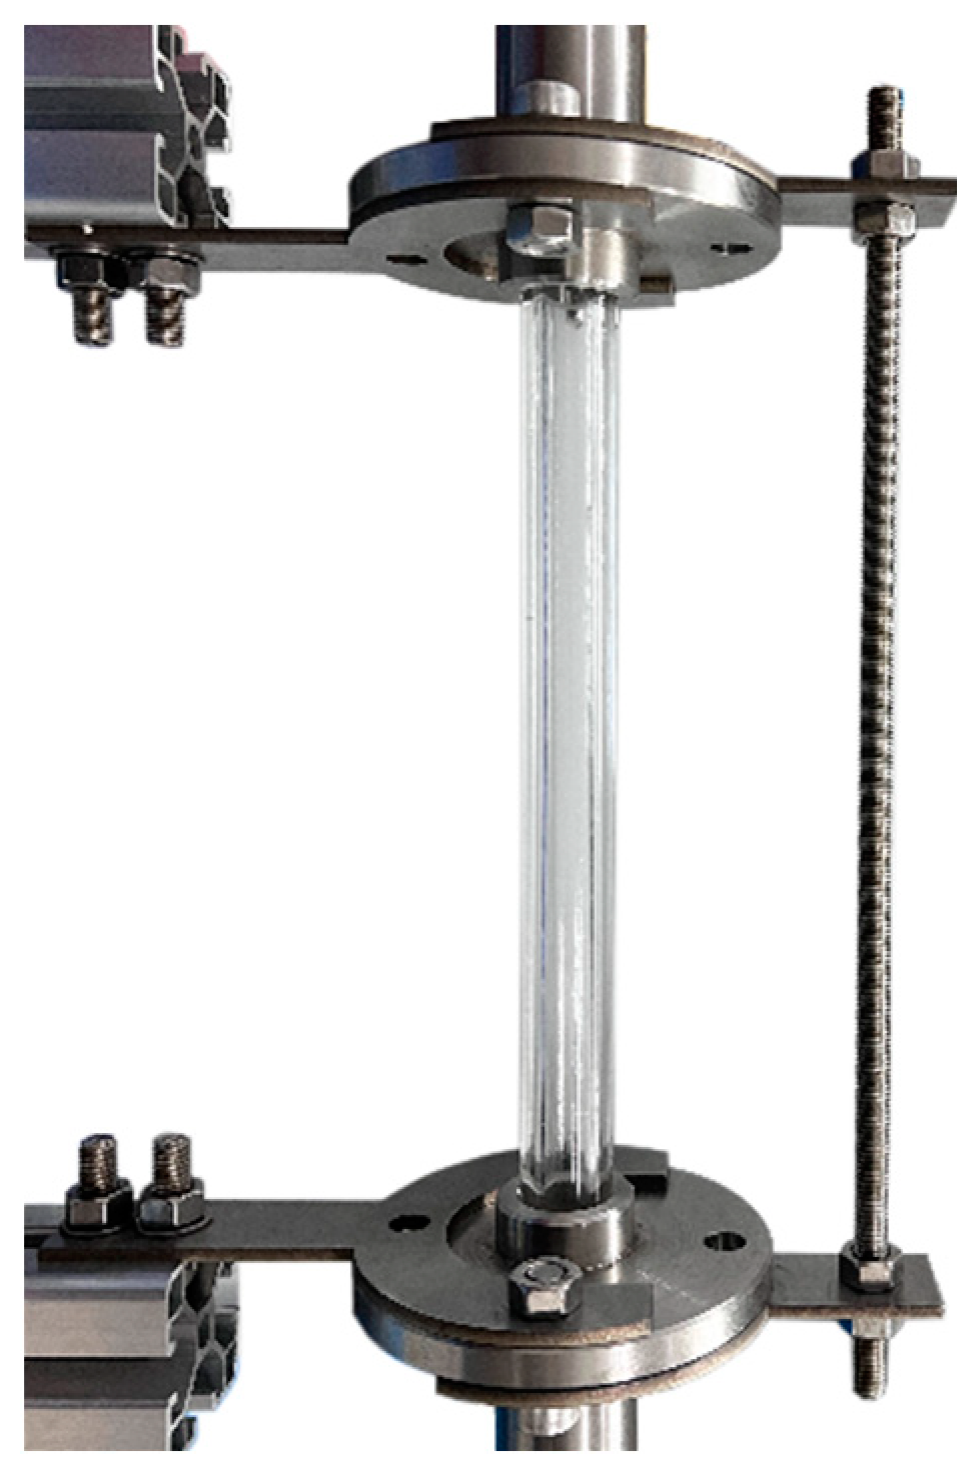
As shown in Figure 1, our constructed scavenge pipe visualization test system successfully captured the two-phase flow pattern images inside the vertical tube under different flow conditions. We must ensure that the pipe’s lubricant reaches the target temperature. Therefore, the system first heats the lubricant in the tank to raise the essential temperature. Second, the lubricant inflows the oil heating controller with temperature feedback for precise heating to ensure that the outlet temperature meets the expectation. At the same time, the oil flow into the mixer is finely regulated by a fluid flow controller (Meikong, Hangzhou, China). Compressed air generated by the compressor passes through a gas canister to the gas heating controller, which can heat the gas to the set temperature. A gas flow controller (Shoukeshihua, Beijing, China) regulates the air volume entry of the mixing device. The gas–oil mixer will uniformly mix the oil–gas flow and send it to the visualization pipe. As illustrated in Figure 2, the pipeline is vertically upward, with a pipe diameter of 10 mm and length of 200 mm, with temperature measurement points at both ends. The visualization component was crafted from robust quartz glass of superior strength, which facilitates the photographic apparatus X190 to record the movement. The camera (Qianyanlang, Hefei, China) has a resolution of 1280 × 1024, shooting 9300 fps to meet the test accuracy requirements. Under the action of the oil and gas separation device, the gas-free slippery oil enters the oil tank, completing the closed loop of the experimental system. The physical properties of the air and oil used are detailed in Table 1.
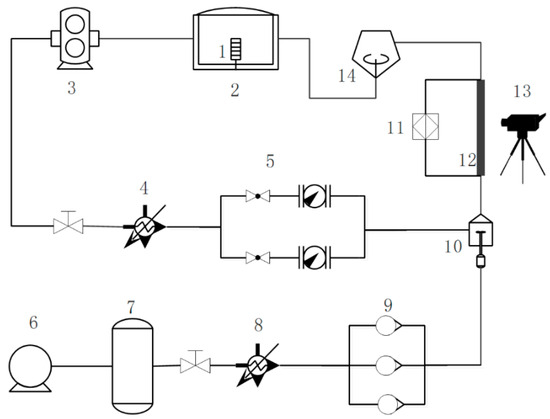
Figure 1.
Scavenge pipe flow visualization diagram of the test system [12]. 1. Electric heating; 2. oil storage tank; 3. oil pump; 4. oil heating controller; 5. oil flow controller; 6. air compressor; 7. gas canister; 8. gas heating controller; 9. gas flow controller; 10. Gas–oil mixer; 11. thermocouple; 12. visualization test section; 13. filming device; 14. Oil–gas separator.

Figure 2.
Visualization of test pipes [12].

Table 1.
Physical properties of the air and oil.
3. Results and Discussion
3.1. Investigation of the Effect of Two-Phase Flow on Bubble Flow in Scavenge Pipe
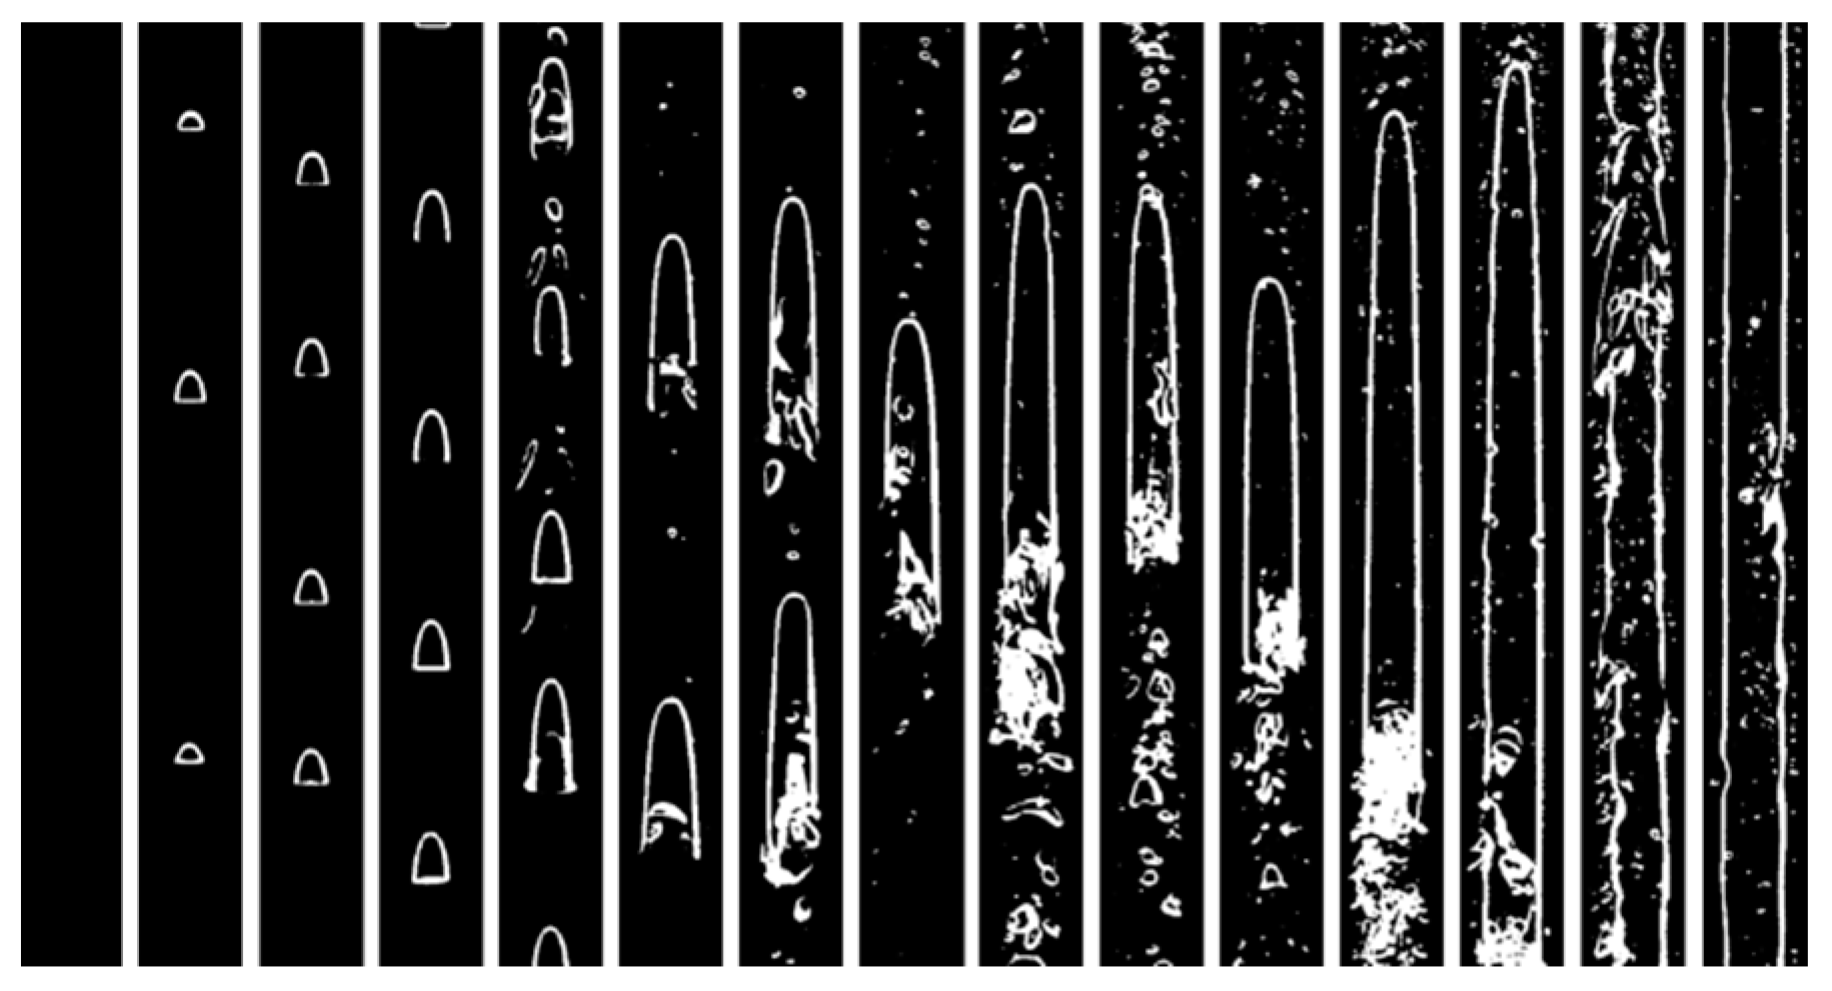
The physical model of this paper is shown in Figure 2; the diameter of the pipe is 10 mm, the length of the visualized pipe is 200 mm, the medium used in the pipe is air and oil, and the flow direction is a vertically upward flow. Respectively, we changed the pipeline gas–liquid two-phase inlet flow for test simulation, used the high-speed camera to shoot the flow with a shooting frame rate of 5000 fps, and set the two-phase mixing temperature of 370 k for each group of tests to ensure the liquid-phase discounted speed for the unchanged scenario and, in turn, to increase the inlet flow rate, sequentially shooting the pipe flow photographs and resulting in the flow changes as shown in Figure 3. For better flow analysis of the bubbles, the photographs were binarized to observe the edges and shapes of the bubbles more clearly and to facilitate further analysis of their flow characteristics.

Figure 3.
Changes in flow patterns in the tube with increasing air intake when .
Below, denotes the oil- and gas-phase converted velocities, respectively, defined as .
where A is the flow channel’s cross-sectional area; is the liquid and gas phase volume flow rate, respectively.
The oil–gas flow in the vertically placed scavenge pipe with a diameter of 10 mm is shown in Figure 3. Ensuring that the oil-converted velocity was 0.962 m/s constantly, with the gas–phase, the converted velocity gradually increased. We shot the changes in flow inside the pipe, where the converted velocity changes of the gas were in the range of 0~2.12 m/s. In the intake of less gas, the formation of the pipe for the bubble flow [23,24], due to the vertical placement of the pipeline, caused the gas to bubble upward along the central axis of the movement. With the further increase in air inlet, the tiny bubbles grew into air bombs, forming a bullet-shaped flow. The end of the bubble was hemispherical, the tail was flat, and there were tiny bubbles sandwiched between two bubbles. With further increase in the inlet volume, the bubbles gradually elongated due to the restriction of the tube wall, and the tiny bubbles at their ends became more numerous and more significant. When the discounted velocity of the gas phase reached 1.48 m/s, annular flow occurred, with a gas nucleus in the center of the tube, and the liquid phase was extruded to the wall surface of the tube to form a fluid film.
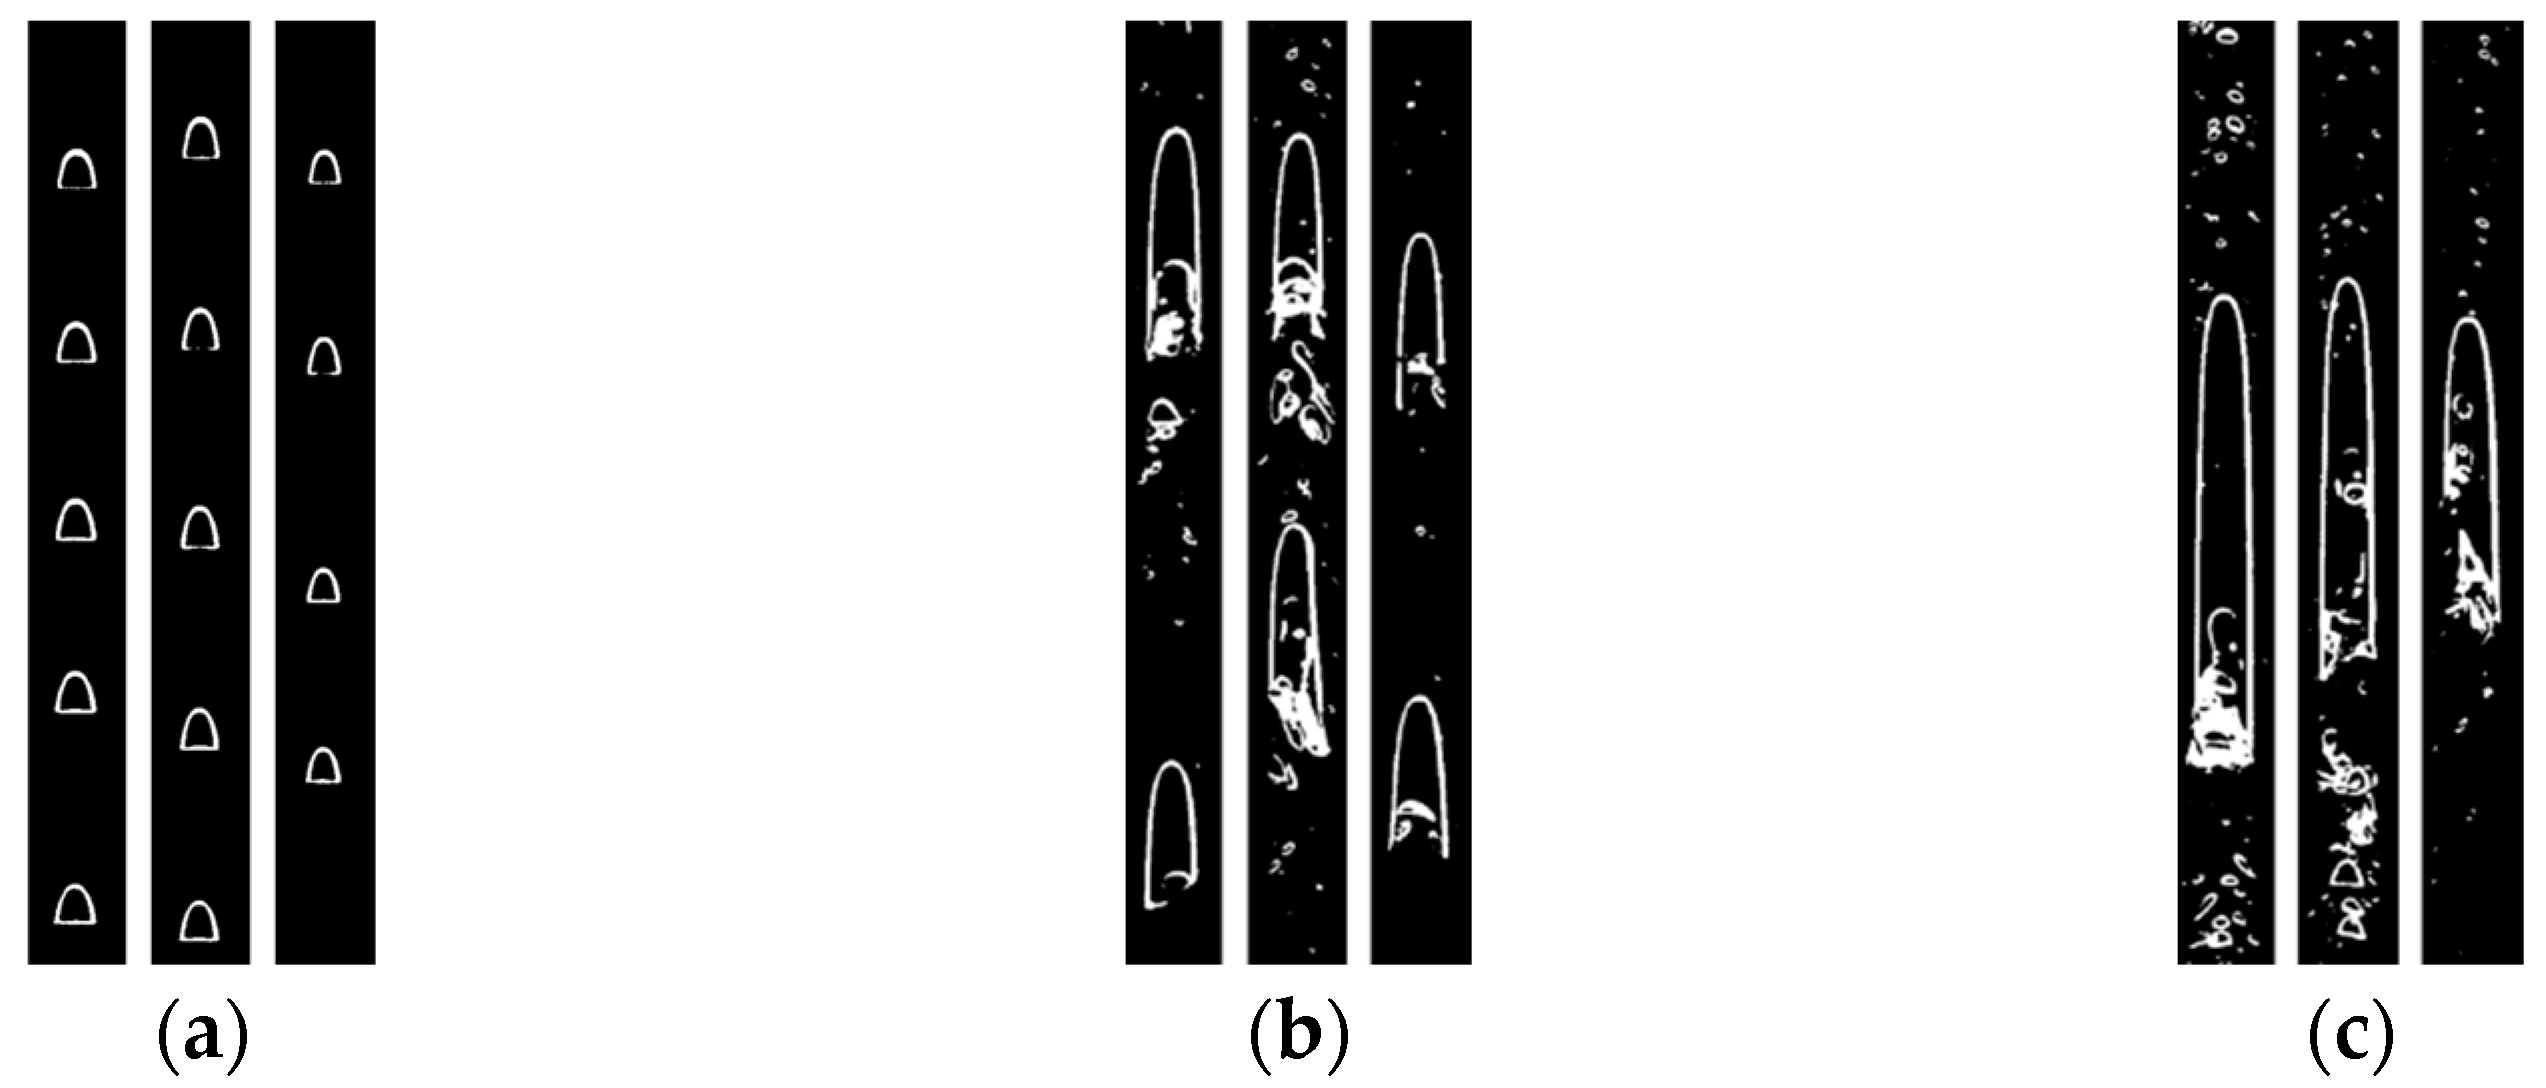
As shown in Figure 4 for the vertically placed 10 mm diameter scavenge pipe, the flow changed in the pipe with the gradual increase of the liquid-phase phase conversion velocity when the gas-phase conversion velocity was guaranteed to be 0.5, 1, and 1.4 m/s, respectively. When the gas-phase conversion speed was constant, with the liquid-phase flow rate increasing, it was found that, owing to the compression impact of the oil, when , the tiny bubbles were compressed to a smaller size. The volume of the bubbles was compressed into a smaller size.

Figure 4.
Changes in flow patterns in the tube with increasing liquid-phase converted velocity at constant gas-phase converted velocity. (a) ; (b) ; (c) .
3.2. Flow Analysis of Bubbles in the Scavenge Pipe
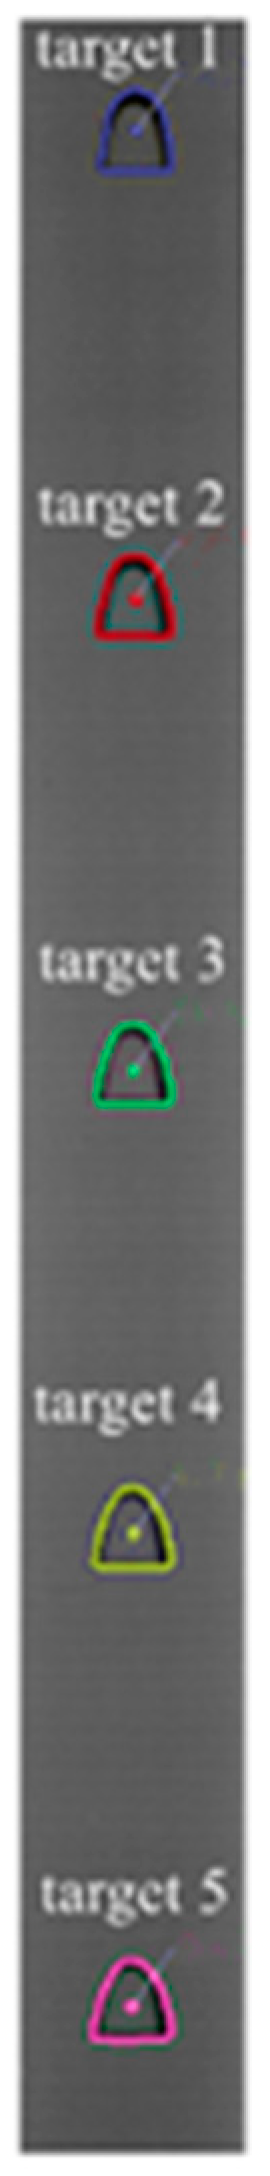
We used high-speed photography to capture the flow visually for an in-depth study of the two-phase flow of oil and gas in the scavenge pipe. Using a high-speed camera with a frame rate of up to 5000 fps, we recorded the flow’s details with very high temporal resolution, obtaining the precise contours of the bubbles and their movement trends. The code program was set up to analyze the photos from the high-speed camera to obtain the motion characteristics of the bubbles in the pipe. As shown in Figure 5, target identification was first carried out on the pictures of bubble flow inside the photographed tube, and then, the size calibration was carried out. The frame rate was used as the time scale to compare the target motion on the pictures under continuous shooting. The analysis and calculation were performed to obtain the target bubbles’ apparent motion speed and the bubble contours’ perimeters in the photographs.
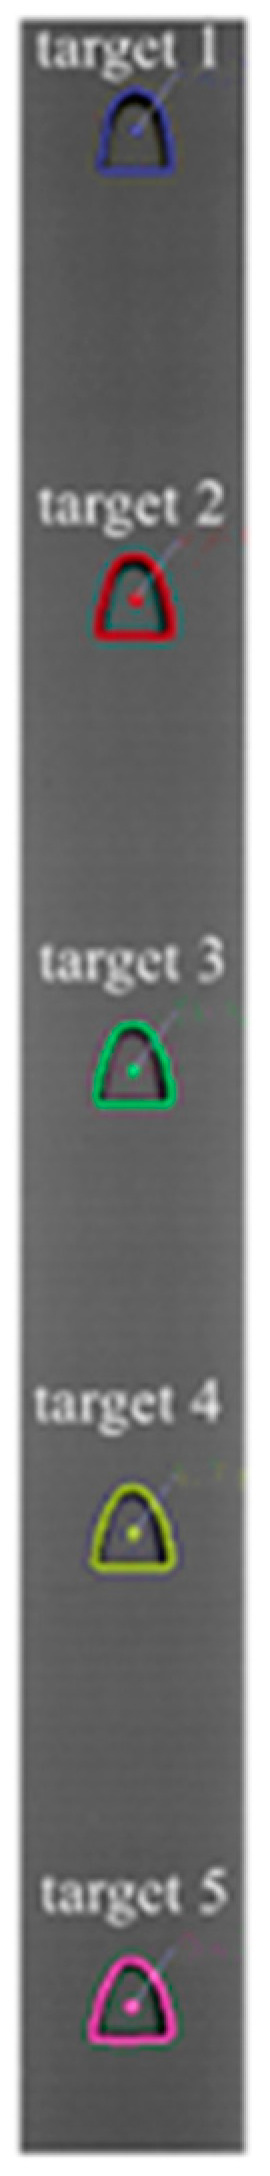
Figure 5.
Target recognition map of the captured image.
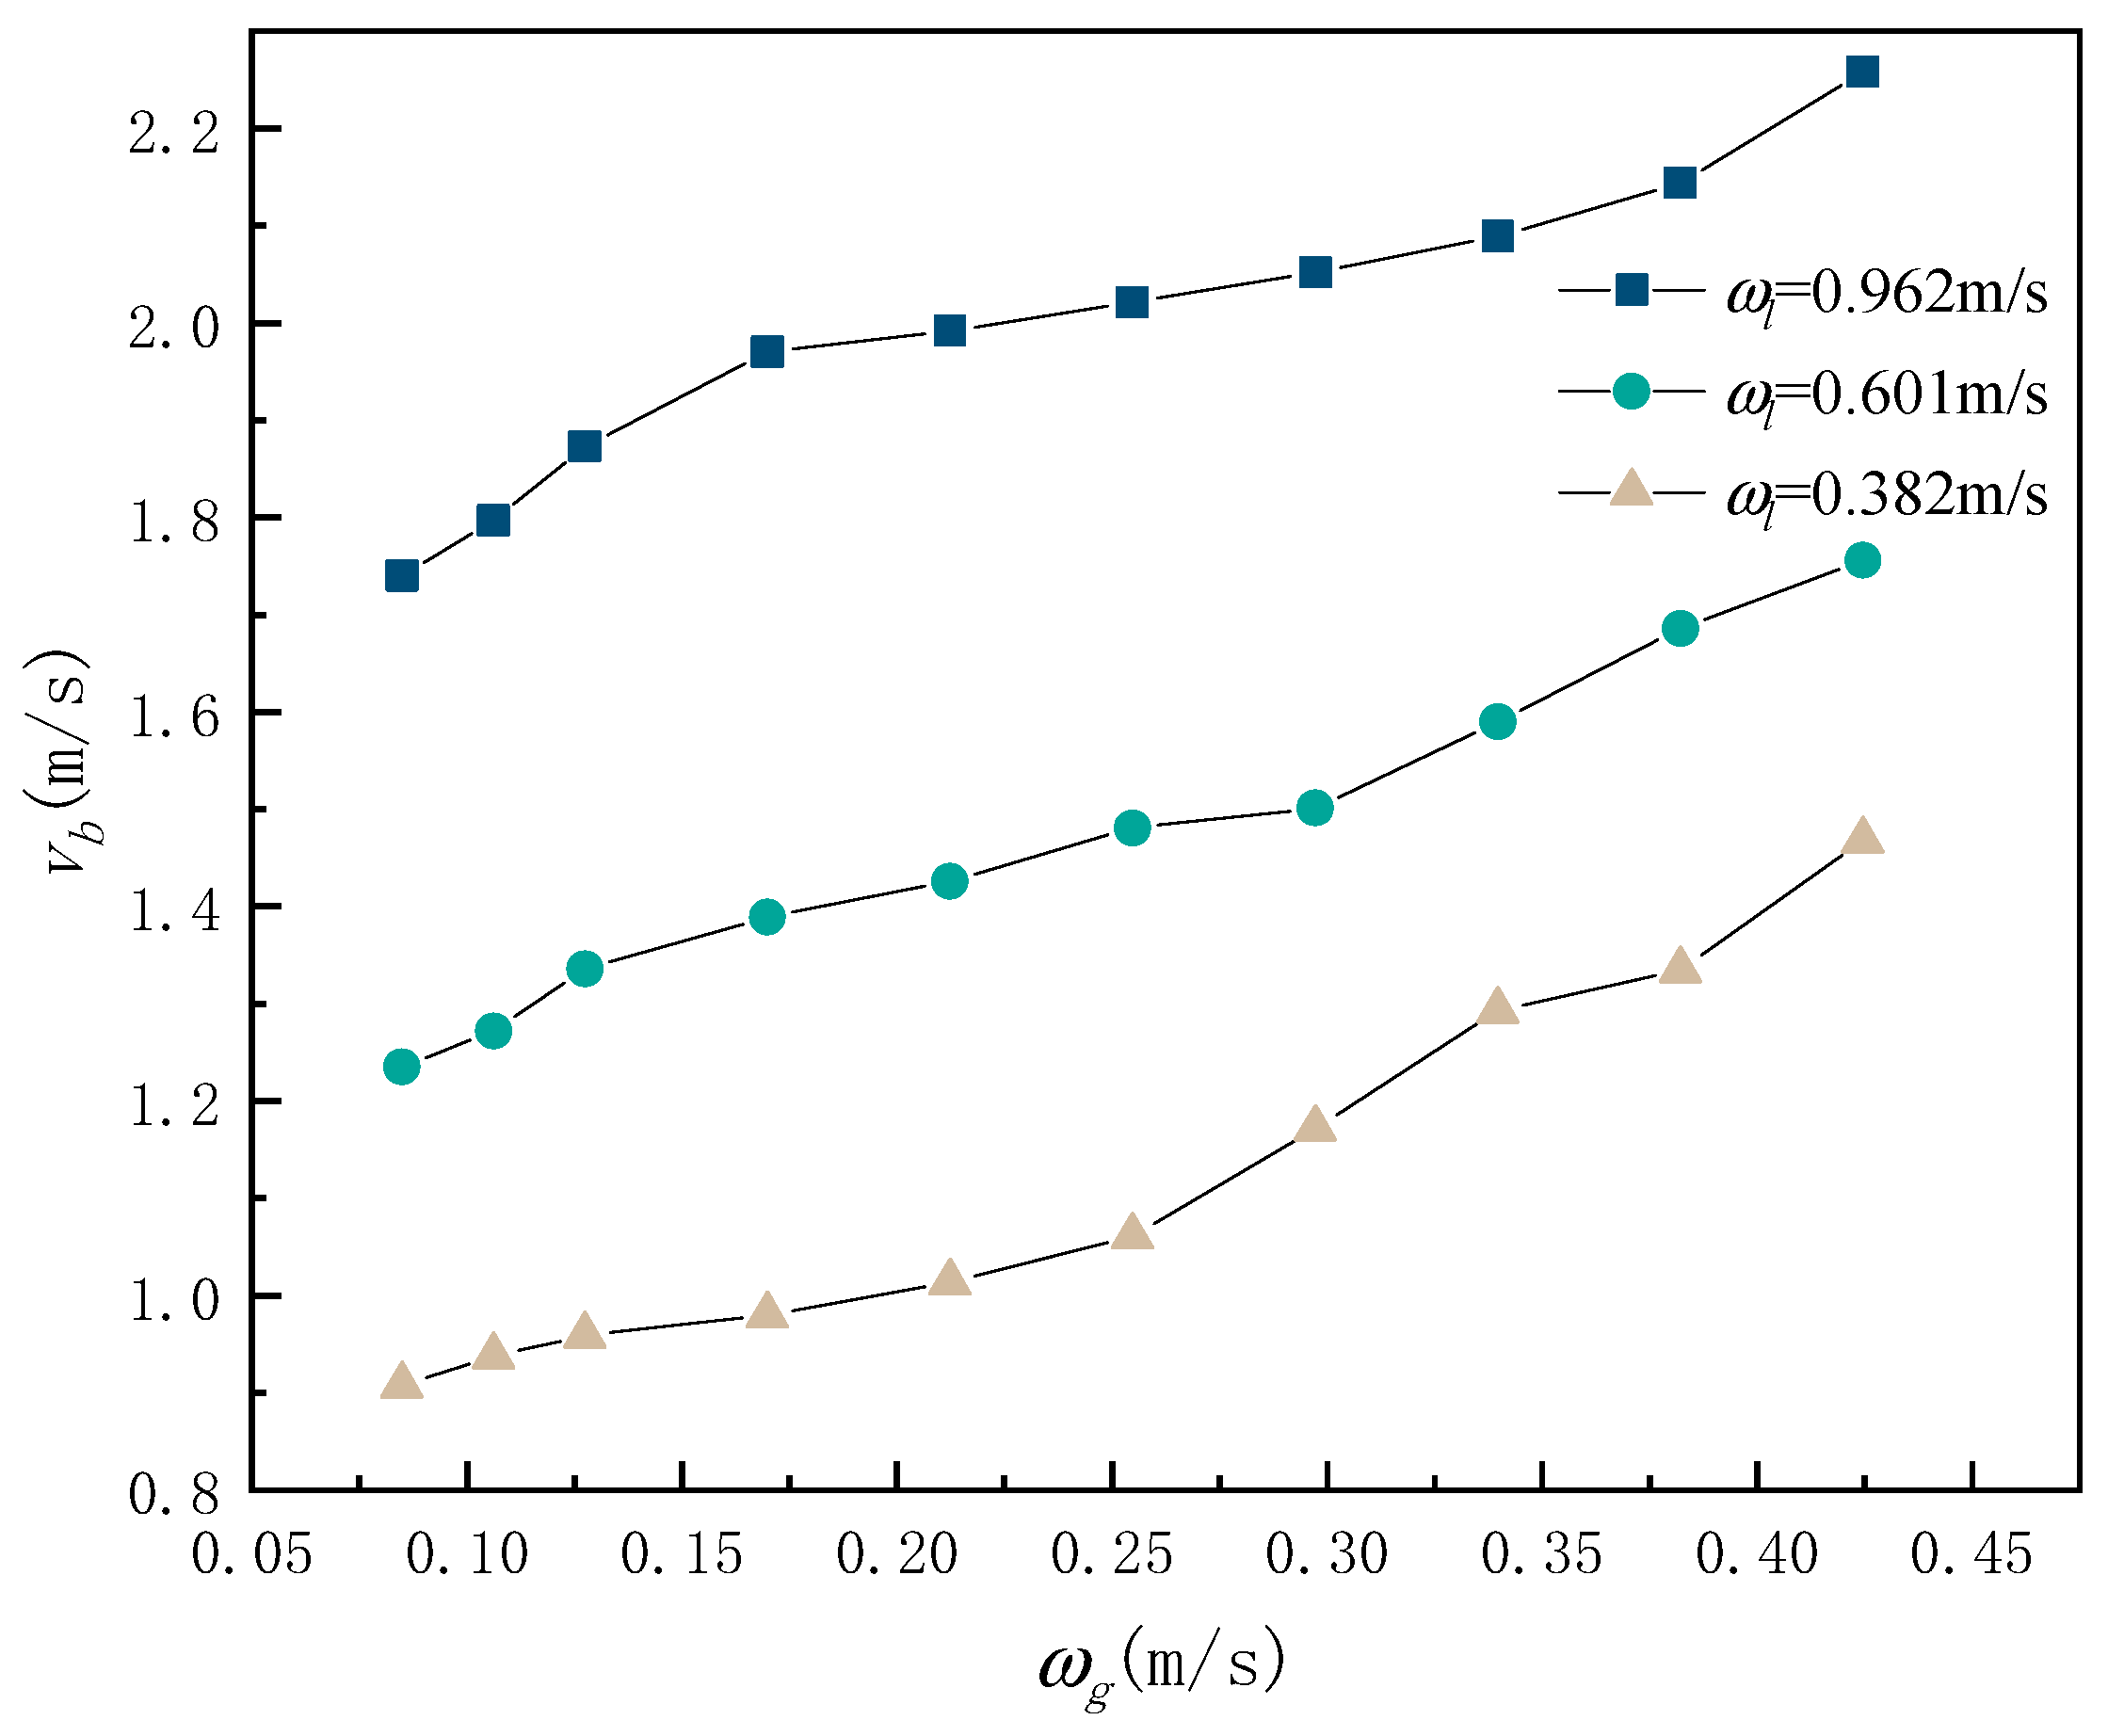
As shown in Figure 6, the liquid-phase conversion speed was unchanged for the apparent bubble velocity changes in the pipe. As the gas-phase conversion rate increased, the speed of bubbles gradually increased, and the gas-phase conversion speed of 0.17 m/s before the growth rate of the bubble velocity became more extensive. Then, the growth rate became flat. The discounted velocity of the gas continued to increase, and after reaching 0.32 m/s, the growth rate of the bubble velocity rose again. Longitudinally, looking at the apparent bubble velocity change graph in the tube, in the case of a constant inlet volume, the bubble velocity increased further with the increase of the liquid-phase converted velocity.

Figure 6.
Changes in the apparent velocity of bubbles in tubes with changes in gas-phase converted velocity.
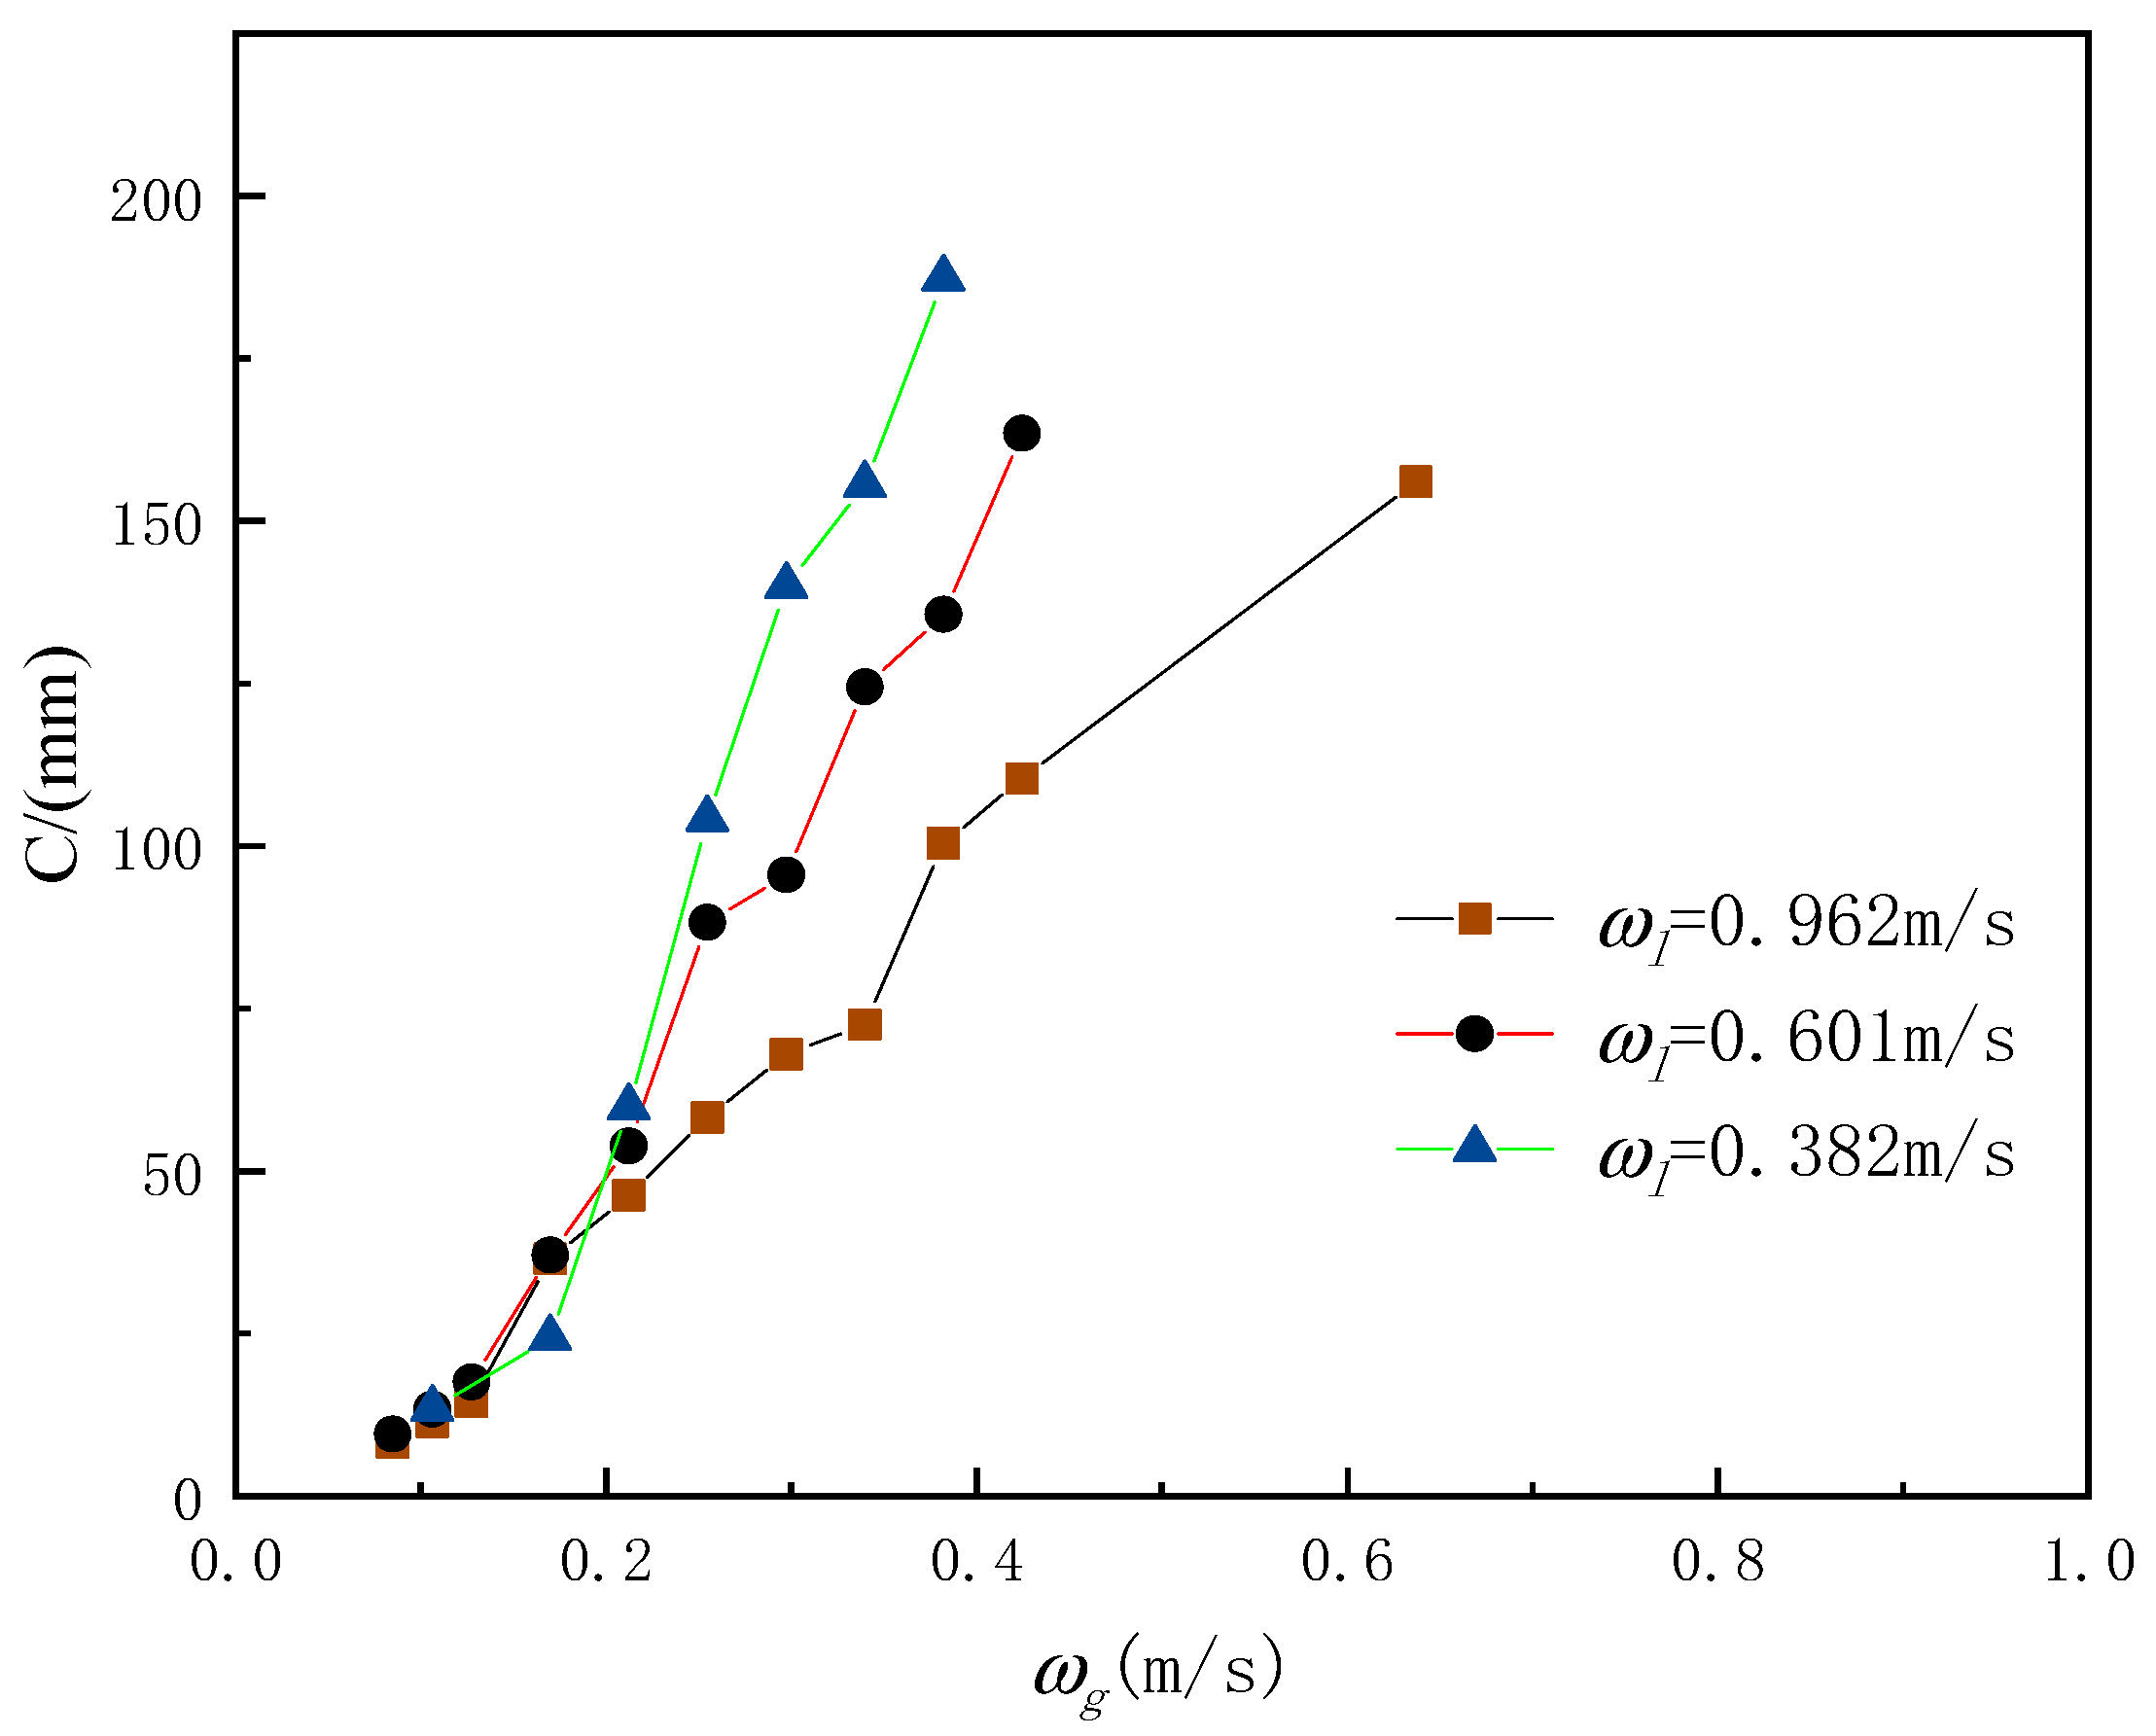
The bubble variations in the tube have been described in detail in the previous subsections, as shown in Figure 7 for the apparent bubble perimeter variations in the tube. In the case of constant liquid-phase velocity, the bubble perimeter increased approximately linearly with the increase of the inlet volume, and the larger the liquid-phase discounted velocity is, the lower the growth rate of the bubble perimeter. At a constant gas-phase conversion rate, the larger the liquid-phase conversion rate, the smaller the bubble circumference. The more significant the liquid-phase flow rate, the larger the pressure on the bubble; thus, the smaller it is compressed.
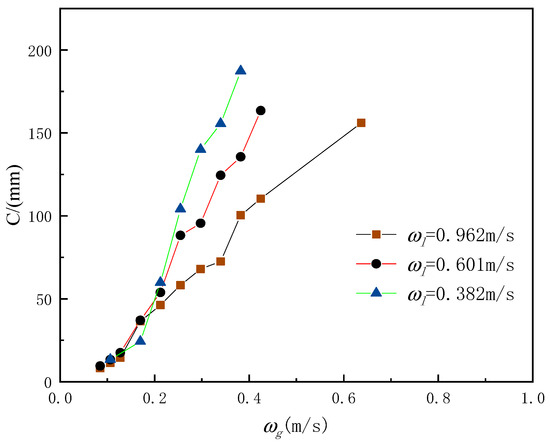
Figure 7.
Changes in bubble circumference in photographs taken with changes in gas-phase converted velocity.
3.3. Construction of a Predictive Model for Bubble Flow in the Scavenge Pipe
SVM is an algorithm based on binary classification algorithm and supervised decision making [25], which is used to find the ideal straight line that segments 2D data points according to coordinate characteristics, and it has strong robustness and generalization ability while performing precise segmentation. SVM provides a superior classification method compared to logistic regression methods. Overall, SVM regression achieves data prediction by finding the optimal regression function, which fully uses the techniques of support vectors and kernel functions and has solid and generalization predictive abilities.
SVM data regression prediction was used to establish a prediction model for bubble-flow characteristics of oil–gas flow in a scavenge pipe using the converted velocity of the gas and liquid phases as the two eigenvalues. Firstly, data preparation was performed by splitting the original dataset into eigenvectors and corresponding target values, followed by feature transformation by normalization, model training, selection of appropriate kernel functions, and model optimization. Once the training was completed, the new unknown data were predicted using the trained model. By inputting the feature vectors, SVM calculated the corresponding objective value as the prediction result according to the regression function.
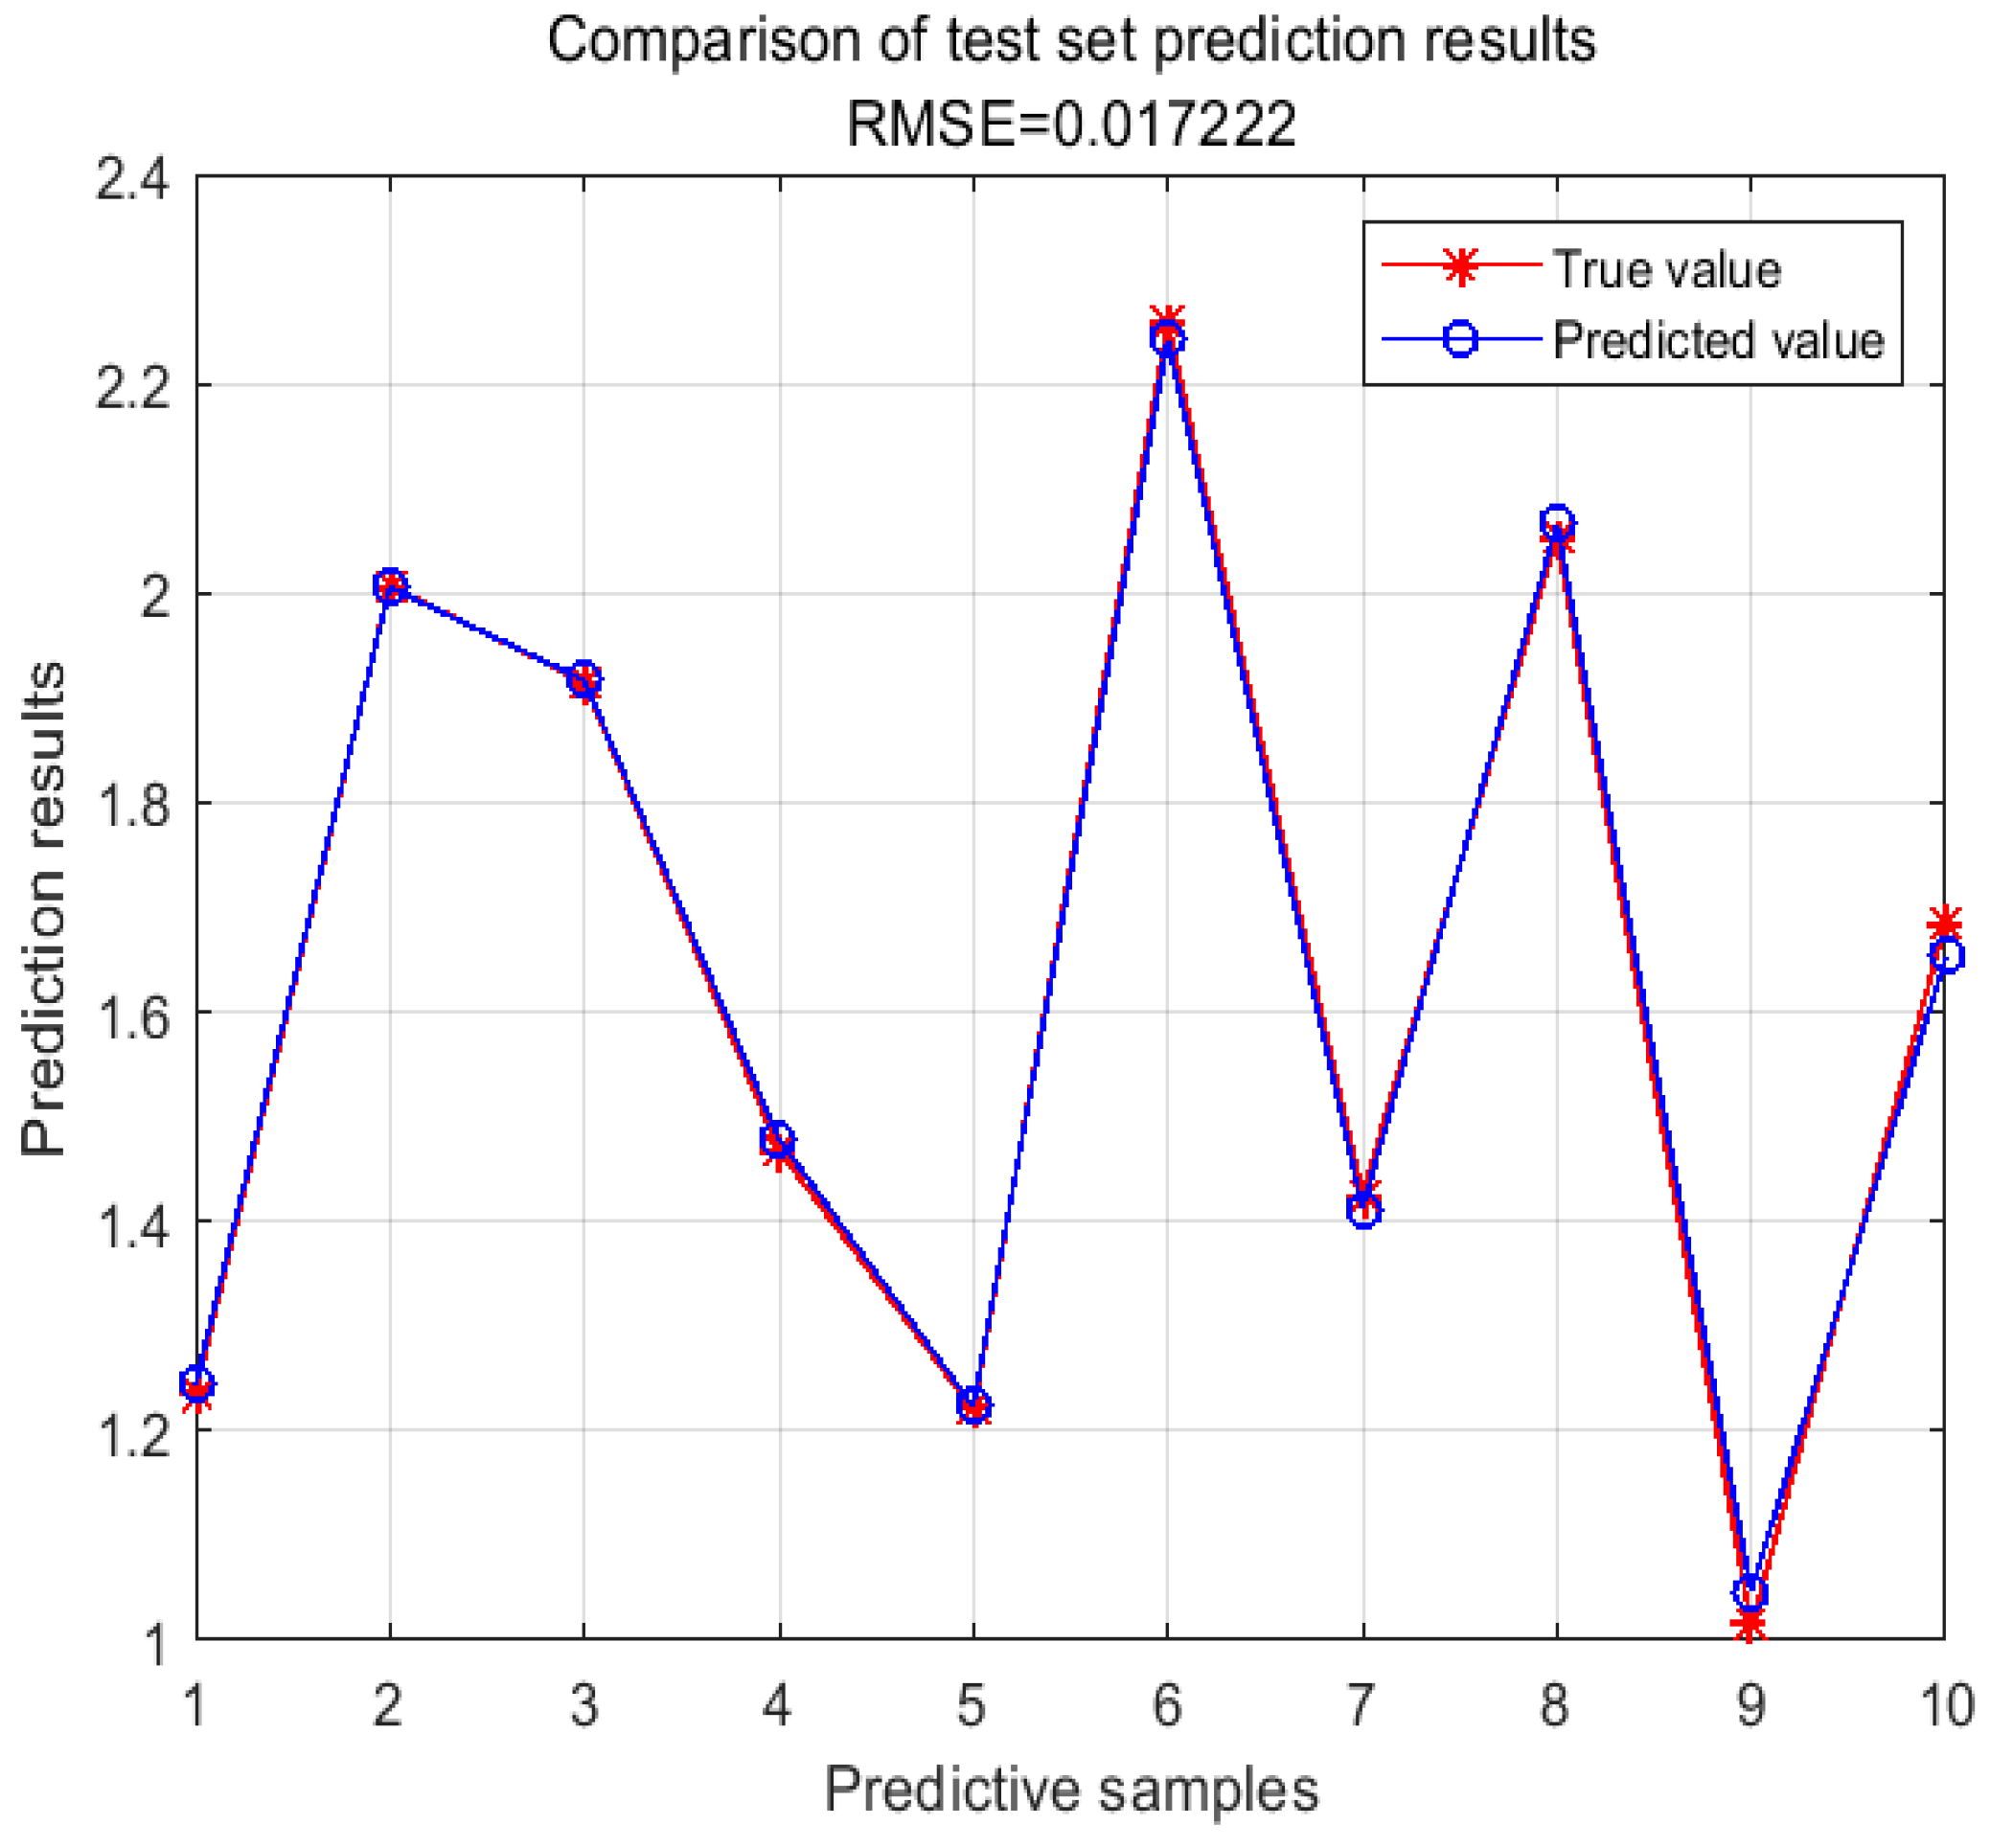
The bubble-flow characteristics-prediction model was established, respectively, with the converted velocity of gas–liquid two-phase flow as the input of eigenvalue and the apparent flow velocity of bubbles as the output of target parameter, with 80 sample data in the training set and 10 test samples. Figure 8 shows that the prediction results are promising, with the root mean square error RMSE = 0.0172, and the model prediction error is less than 5%. The model achieves the design expectations and shows that combining machine learning with in-pipe bubble-flow analysis is highly rewarding. The current work has made significant progress in predicting the flow characteristics of bubbles in tubes, and this improvement in predictive capability is vital for both engineering practice and academic research. Moving forward, our research will focus on further improving the generalization capability of the prediction model to a broader range of flow regimes. Specifically, we expect to optimize the model structure and algorithms to accurately capture and evaluate the complex oil–gas flow conditions in the scavenge pipe.
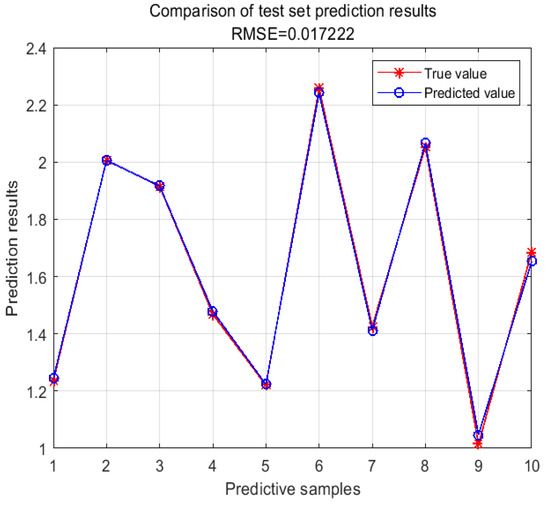
Figure 8.
Comparison of test set prediction results.
4. Conclusions
The paper introduces a visualized experiment system for monitoring oil–gas flow dynamics in the scavenge pipe at 370 k for vertical flow. The main flow patterns of bubble flow, slug flow, and annular flow in the pipe were photographed by a high-speed camera to ensure that the liquid-phase and gas-phase discounted velocities were constant, respectively, and to obtain the change of the bubbles in the pipe with the liquid-phase and gas-phase discounted velocities.
Based on the photos taken by the high-speed camera, the code program was established to carry out the corresponding analysis to obtain the apparent flow velocity of the bubbles in the pipe under different flow conditions and the circumference of the bubbles in the pipe under the related photos, which further facilitates the understanding of the influence of the oil–gas flow conditions in the scavenge pipe on the bubbles’ flow characteristics.
A bubble-flow characteristics-prediction model for the two-phase flow of oil and gas in the scavenge pipe was established by SVM data regression prediction using the converted velocity of gas and liquid phases as eigenvalues. The model has a RMSE = 0.0172 and a prediction error of less than 5%, proving that the model achieves the design expectations. The current work will contribute to a more objective and accurate prediction of the bubble-flow characteristics inside the pipe and a better understanding of the oil–gas flow inside the scavenge pipe.
Author Contributions
X.L. and S.W. conceived the experiments; X.L. conducted the experiments; W.S. performed statistical analysis and figure generation. All authors have read and agreed to the published version of the manuscript.
Funding
This research was funded by national science and technology major projects of China, grant number J2019-III-0023-0067.
Data Availability Statement
The original contributions presented in the study are included in the article, further inquiries can be directed to the corresponding authors.
Conflicts of Interest
The authors declare no conflicts of interest.
References
- Li, G.Q. Present and future of aeroengine oil system. Aeroengine 2011, 6, 49–52. [Google Scholar]
- Peng, Q.; Guo, Y.-Q.; Sun, H. Modeling and Fault Diagnosis of Aero-engine Lubricating Oil System. In Proceedings of the 2018 37th Chinese Control Conference (CCC), Wuhan, China, 25–27 July 2018; pp. 5907–5912. [Google Scholar] [CrossRef]
- Flouros, M.; Iatrou, G.; Yakinthos, K.; Cottier, F.; Hirschmann, M. Two-Phase Flow Heat Transfer and Pressure Drop in Horizontal Scavenge Pipes in an Aero-engine. J. Eng. Gas Turbines Power 2015, 137, 081901. [Google Scholar] [CrossRef]
- Chandra, B.; Simmons, K.; Pickering, S.; Collicott, S.H.; Wiedemann, N. Study of gas/liquid behavior within an aero enginebearing chamber. J. Eng. Gas Turbines Power 2013, 135, 051201. [Google Scholar] [CrossRef]
- Hewitt, G.F. Two-Phase Flow and Its Applications: Past, Present, and Future. Heat Transf. Eng. 1983, 4, 67–79. [Google Scholar] [CrossRef]
- Rafałko, G.; Mosdorf, R.; Górski, G. Two-phase flow pattern identification in minichannels using image correlation analysis. Int. Commun. Heat Mass Transf. 2020, 113, 104508.1–104508.9. [Google Scholar] [CrossRef]
- Thaker, J.; Banerjee, J. Characterization of two-phase slug flow sub-regimes using flow visualization. J. Pet. Sci. Eng. 2015, 135, 561–576. [Google Scholar] [CrossRef]
- Nguyen, V.T.; Dong, J.E.; Song, C.H. An application of the wavelet analysis technique for the objective discrimination of two-phase flow patterns. Int. J. Multiph. Flow 2010, 36, 755–768. [Google Scholar] [CrossRef]
- De Giorgi, M.G.; Ficarella, A.; Lay-Ekuakille, A. Monitoring Cavitation Regime from Pressure and Optical Sensors: Comparing Methods Using Wavelet Decomposition for Signal Processing. IEEE Sens. J. 2015, 15, 4684–4691. [Google Scholar] [CrossRef]
- Dong, F.; Zhang, S.; Shi, X.; Wu, H.; Tan, C. Flow Regimes Identification-based Multidomain Features for Gas–Liquid Two-Phase Flow in Horizontal Pipe. IEEE Trans. Instrum. Meas. 2021, 70, 7502911. [Google Scholar] [CrossRef]
- Ji, H.; Long, J.; Fu, Y.; Huang, Z.; Wang, B.; Li, H. Flow Pattern Identification Based on EMD and LS-SVM for Gas–Liquid Two-Phase Flow in a Minichannel. IEEE Trans. Instrum. Meas. 2011, 60, 1917–1924. [Google Scholar]
- Liang, X.; Wang, S.; Shen, W. Random Forest Model of Flow Pattern Identification in Scavenge Pipe Based on EEMD and Hilbert Transform. Energies 2023, 16, 6084. [Google Scholar] [CrossRef]
- Mesa, D.; Quintanilla, P.; Reyes, F. Bubble Analyser-An open-source software for bubble size measurement using image analysis. Miner. Eng. 2022, 180, 107497. [Google Scholar] [CrossRef]
- Yadav, B.; Devi, V.S. Novelty detection applied to the classification problem using Probabilistic Neural Network. In Proceedings of the 2014 IEEE Symposium on Computational Intelligence and Data Mining (CIDM), Orlando, FL, USA, 9–12 December 2014. [Google Scholar] [CrossRef]
- Liu, L.; Bai, B. Flow regime identification of swirling gas-liquid flow with image processing technique and neural networks. Chem. Eng. Sci. 2019, 199, 588–601. [Google Scholar] [CrossRef]
- Coulston, J.W.; Blinn, C.E.; Thomas, V.A.; Wynne, R.H. Approximating Prediction Uncertainty for Random Forest Regression Models. Photogramm. Eng. Remote Sens. J. Am. Soc. Photogramm. 2016, 82, 189–197. [Google Scholar] [CrossRef]
- Wang, W.; Men, C.; Lu, W. Online prediction model based on support vector machine. Neurocomputing 2008, 71, 550–558. [Google Scholar] [CrossRef]
- Otchere, D.A.; Ganat, T.O.A.; Gholami, R.; Ridha, S. Application of supervised machine learning paradigms in the prediction of petroleum reservoir properties: Comparative analysis of ANN and SVM models. J. Pet. Sci. Eng. 2021, 200, 108182. [Google Scholar] [CrossRef]
- Meenal, R.; Selvakumar, A.I. Assessment of SVM, empirical and ANN based solar radiation prediction models with most influencing input parameters. Renew. Energy 2018, 121, 324–343. [Google Scholar] [CrossRef]
- Yang, K.; Zhao, l.; Wang, C. A new intelligent bearing fault diagnosis model based on triplet network and SVM. Sci. Rep. 2022, 12, 5234. [Google Scholar] [CrossRef]
- Kawahara, A.; Sadatomi, M.; Nei, K.; Matsuo, H. Experimental study on bubble velocity, void fraction and pressure drop for gas–liquid two-phase flow in a circular microchannel. Int. J. Heat Fluid Flow 2009, 30, 831–841. [Google Scholar] [CrossRef]
- Hanafizadeh, P.; Saidi, M.; Gheimasi, A.N.; Ghanbarzadeh, S. Experimental investigation of air–water, two-phase flow regimes in vertical mini pipe. Sci. Iran. 2011, 18, 923–929. [Google Scholar] [CrossRef]
- Liu, Y.; Upchurch, E.R.; Ozbayoglu, E.M. Experimental Study of Single Taylor Bubble Rising in Stagnant and Downward Flowing Non-Newtonian Fluids in Inclined Pipes. Energies 2021, 14, 578. [Google Scholar] [CrossRef]
- Liu, Y.; Upchurch, E.R.; Ozbayoglu, E.M. Experimental and Theoretical Studies on Taylor Bubbles Rising in Stagnant Non-Newtonian Fluids in Inclined Non-Concentric Annuli. Int. J. Multiph. Flow 2022, 147, 103912. [Google Scholar] [CrossRef]
- Zheng, D.; Ozbayoglu, E.M.; Miska, S.Z.; Liu, Y. Cement Sheath Fatigue Failure Prediction by Support Vector Machine Based Model. In Proceedings of the Paper presented at the SPE Eastern Regional Meeting, Wheeling, WV, USA, 18–20 October 2022. [Google Scholar]

Disclaimer/Publisher’s Note: The statements, opinions and data contained in all publications are solely those of the individual author(s) and contributor(s) and not of MDPI and/or the editor(s). MDPI and/or the editor(s) disclaim responsibility for any injury to people or property resulting from any ideas, methods, instructions or products referred to in the content. |
© 2024 by the authors. Licensee MDPI, Basel, Switzerland. This article is an open access article distributed under the terms and conditions of the Creative Commons Attribution (CC BY) license (https://creativecommons.org/licenses/by/4.0/).