Article

Optimization of Fine-Fracture Distribution Patterns for Multi-Stage and Multi-Cluster Fractured Horizontal Wells in Tight Gas Reservoirs

by
Long Ren
1,2,*,
Junzhang Wang
1,
Cong Zhao
1,
Cheng Jing
1,2,
Jian Sun
1,
Desheng Zhou
1,2,
Fuguo Xiang
1,2,
Diguang Gong
1,2 and
Haiyan Li
3
1
School of Petroleum Engineering, Xi’an Shiyou University, Xi’an 710065, China
2
Shaanxi Key Laboratory of Advanced Stimulation Technology for Oil & Gas Reservoirs, Xi’an 710065, China
3
Party School of Party Committee, Shengli Petroleum Bureau Co., Ltd. Sinopec, Dongying 257097, China
*
Author to whom correspondence should be addressed.
Processes 2024, 12(7), 1392; https://doi.org/10.3390/pr12071392
Submission received: 26 May 2024 / Revised: 16 June 2024 / Accepted: 3 July 2024 / Published: 4 July 2024
(This article belongs to the Special Issue Numerical Simulations of Fracturing in Petroleum Engineering)

Abstract

:
The efficient development of tight gas reservoirs is significantly enhanced by multi-stage and multi-cluster fracturing techniques in conjunction with horizontal well technology, leading to substantial increases in reservoir drainage volume and individual well productivity. This study presents a tailored fine-fracturing approach for horizontal wells in tight gas reservoirs, supported by a gas–water two-phase numerical simulation model. Utilizing the orthogonal experimental design method, we simulated and optimized various fracture distribution schemes to refine fracturing parameters for maximum efficiency. The optimization was further validated through a comparison with actual well completion and development dynamics. The quantitative results highlight the optimal fracture distribution for horizontal wells, with a horizontal section length of 1400 to 1600 m and 14 to 16 fracturing stages. The pattern features a “dense at both ends and sparse in the middle” strategy, with stage spacing of 80 to 110 m, and a “longer in the middle and shorter at both ends” fracture half-length of 100 to 140 m, achieving a fracture conductivity of 30 μm2·cm. To ensure the economic feasibility of the proposed fracturing strategy, we conducted an economic evaluation using the net present value (NPV) method, which confirmed the robustness of the optimization outcomes in terms of both technical performance and economic viability. The reliability of these optimization outcomes has been confirmed through practical application in the development of horizontal wells in the study area. This research approach and methodology can provide theoretical guidance for the design of hydraulic fracturing operations and the integration of geological and engineering practices in similar unconventional oil and gas reservoirs.

1. Introduction

The development of unconventional gas resources has been significantly enhanced by the implementation of multi-stage and multi-cluster hydraulic fracturing in horizontal wells. This technique has become pivotal for the economic extraction of tight gas reservoirs, which are characterized by low permeability and low porosity formations [1,2,3]. The optimization of fracture distribution patterns and operational parameters is crucial for maximizing the stimulated reservoir volume (SRV) and improving the productivity of the reservoir [4,5,6]. Over the past decade, extensive research has focused on understanding the complex behavior of hydraulic fractures and their interaction with the formation’s geomechanical properties. The advent of advanced numerical simulation models, such as the planar 3D model, has provided valuable insights into the vertical propagation of hydraulic fractures in multi-layered reservoirs [7,8,9,10]. These models have been instrumental in predicting fracture geometry and analyzing the influence of various operational parameters, including injection rate, fluid viscosity, and geostress [11,12,13,14,15]. Despite these advancements, the optimization of multi-stage, multi-cluster hydraulic fracturing remains a complex challenge due to the interplay of geological uncertainties and operational constraints. Recent studies have highlighted the need for a comprehensive understanding of the geomechanical properties of tight formations and the development of efficient optimization algorithms [16]. The integration of machine learning and data-driven approaches has shown promise in predicting fracture behavior and guiding the design of hydraulic fracturing operations [17,18,19]. However, the aforementioned methods have not conducted simulation optimization on the non-uniform distribution of fractures, thereby failing to achieve the purpose of fine-fracture distribution in horizontal wells.
The optimization of fracture distribution patterns in horizontal wells is a complex task that requires a nuanced understanding of the reservoir’s geological characteristics and the behavior of the fractures within it. Geological complexity, with its heterogeneity and natural fracture networks, demands meticulous subsurface analysis. Hydraulic fracture behavior is subject to the complex interplay of in situ stresses, rock anisotropy, and pre-existing geological structures, often diverging from model predictions. Key parameter uncertainties, such as those in rock strength and permeability, contribute to the unpredictability of outcomes. The non-uniform geological characteristics of reservoirs and practical constraints like pumping rates and proppant availability complicate the quest for uniform fracture distribution. In recent years, the multi-parameter collaborative optimization experimental design method known as Response Surface Methodology (RSM) has emerged [20,21,22,23]. RSM is a technique that simulates the actual limit state surface through a series of deterministic “experiments” involving multiple variables. It allows for the optimization of each parameter individually, and then, through a systematic coordination mechanism, it addresses the coupling issues between parameters and seeks the optimal solution. This method and orthogonal experimental design have been widely recognized and applied to multi-parameter collaborative optimization problems.
To this end, the present study aimed to develop a reasonable fracture distribution pattern for horizontal wells in tight gas reservoirs by establishing a gas–water two-phase numerical simulation model. This model was specifically tailored for multi-stage and multi-cluster fractured horizontal wells, accounting for the variability in fracture length and the non-uniform nature of fractures that are commonly encountered in tight formations. The results of this comprehensive analysis provided valuable insights into the optimal fracturing parameters and fracture distribution patterns that maximize well productivity.

2. Basic Model Establishment

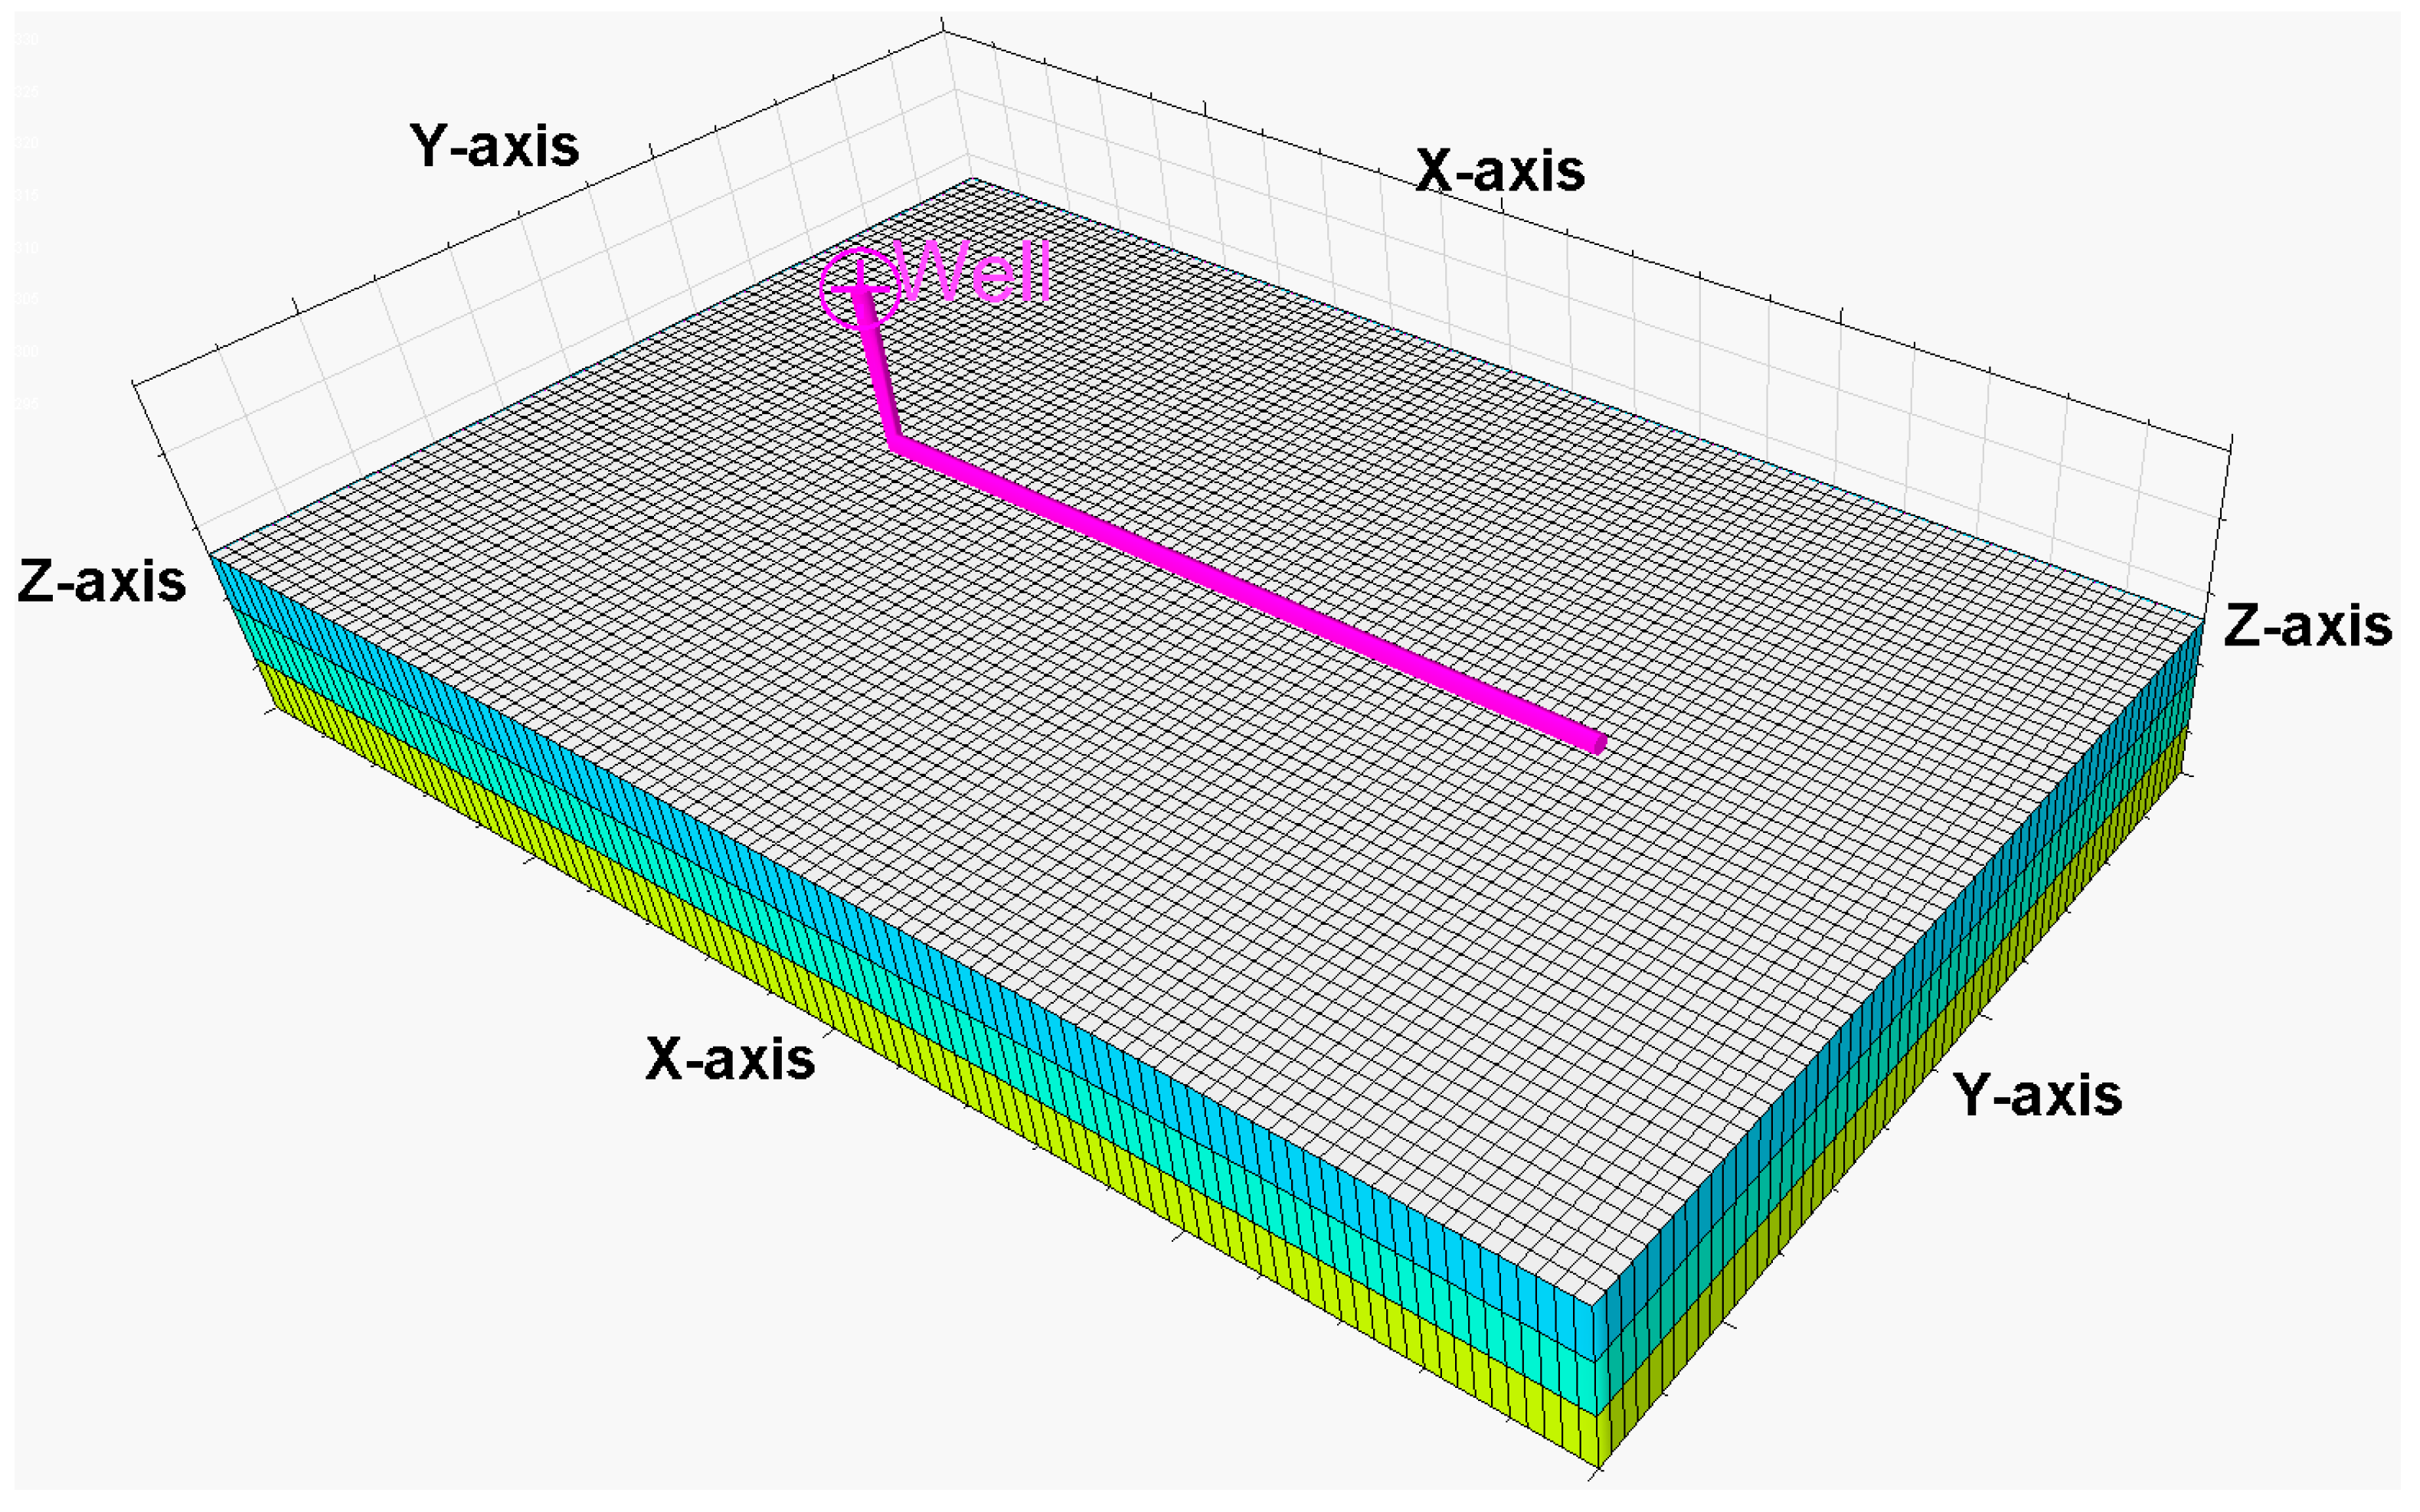
2.1. Numerical Modeling and Grid Division

The geological parameters outlined herein are based on a conceptual model designed to encapsulate the essential characteristics of a tight gas reservoir. It is imperative to note that while this model is not a direct representation of a specific real-world reservoir, it incorporates typical values and conditions that allow for the generalization of our findings to similar reservoirs. The model’s parameters include an average gas layer thickness of 25 m, an average permeability of 0.05 mD, an average porosity of 9.4%, and an original gas saturation of 50.2%. Utilizing the ECLIPSE BlackOil module, a three-dimensional numerical simulation model for gas and water two-phase flow has been developed. The model employs an infinite grid system with a total of 750,000 cells, arranged in 500 cells along the x-axis, 500 cells along the y-axis, and 3 cells along the z-axis, corresponding to the vertical depth. Each cell measures 20 m by 20 m in planar dimensions and 4 m in vertical depth, resulting in a grid cell area of 400 m2. The total simulated area encompasses 100 square kilometers, with an estimated gas reserve abundance of 1.28 × 10⁸ m3/km2. The structure of the numerical model for tight gas reservoir is illustrated in Figure 1.

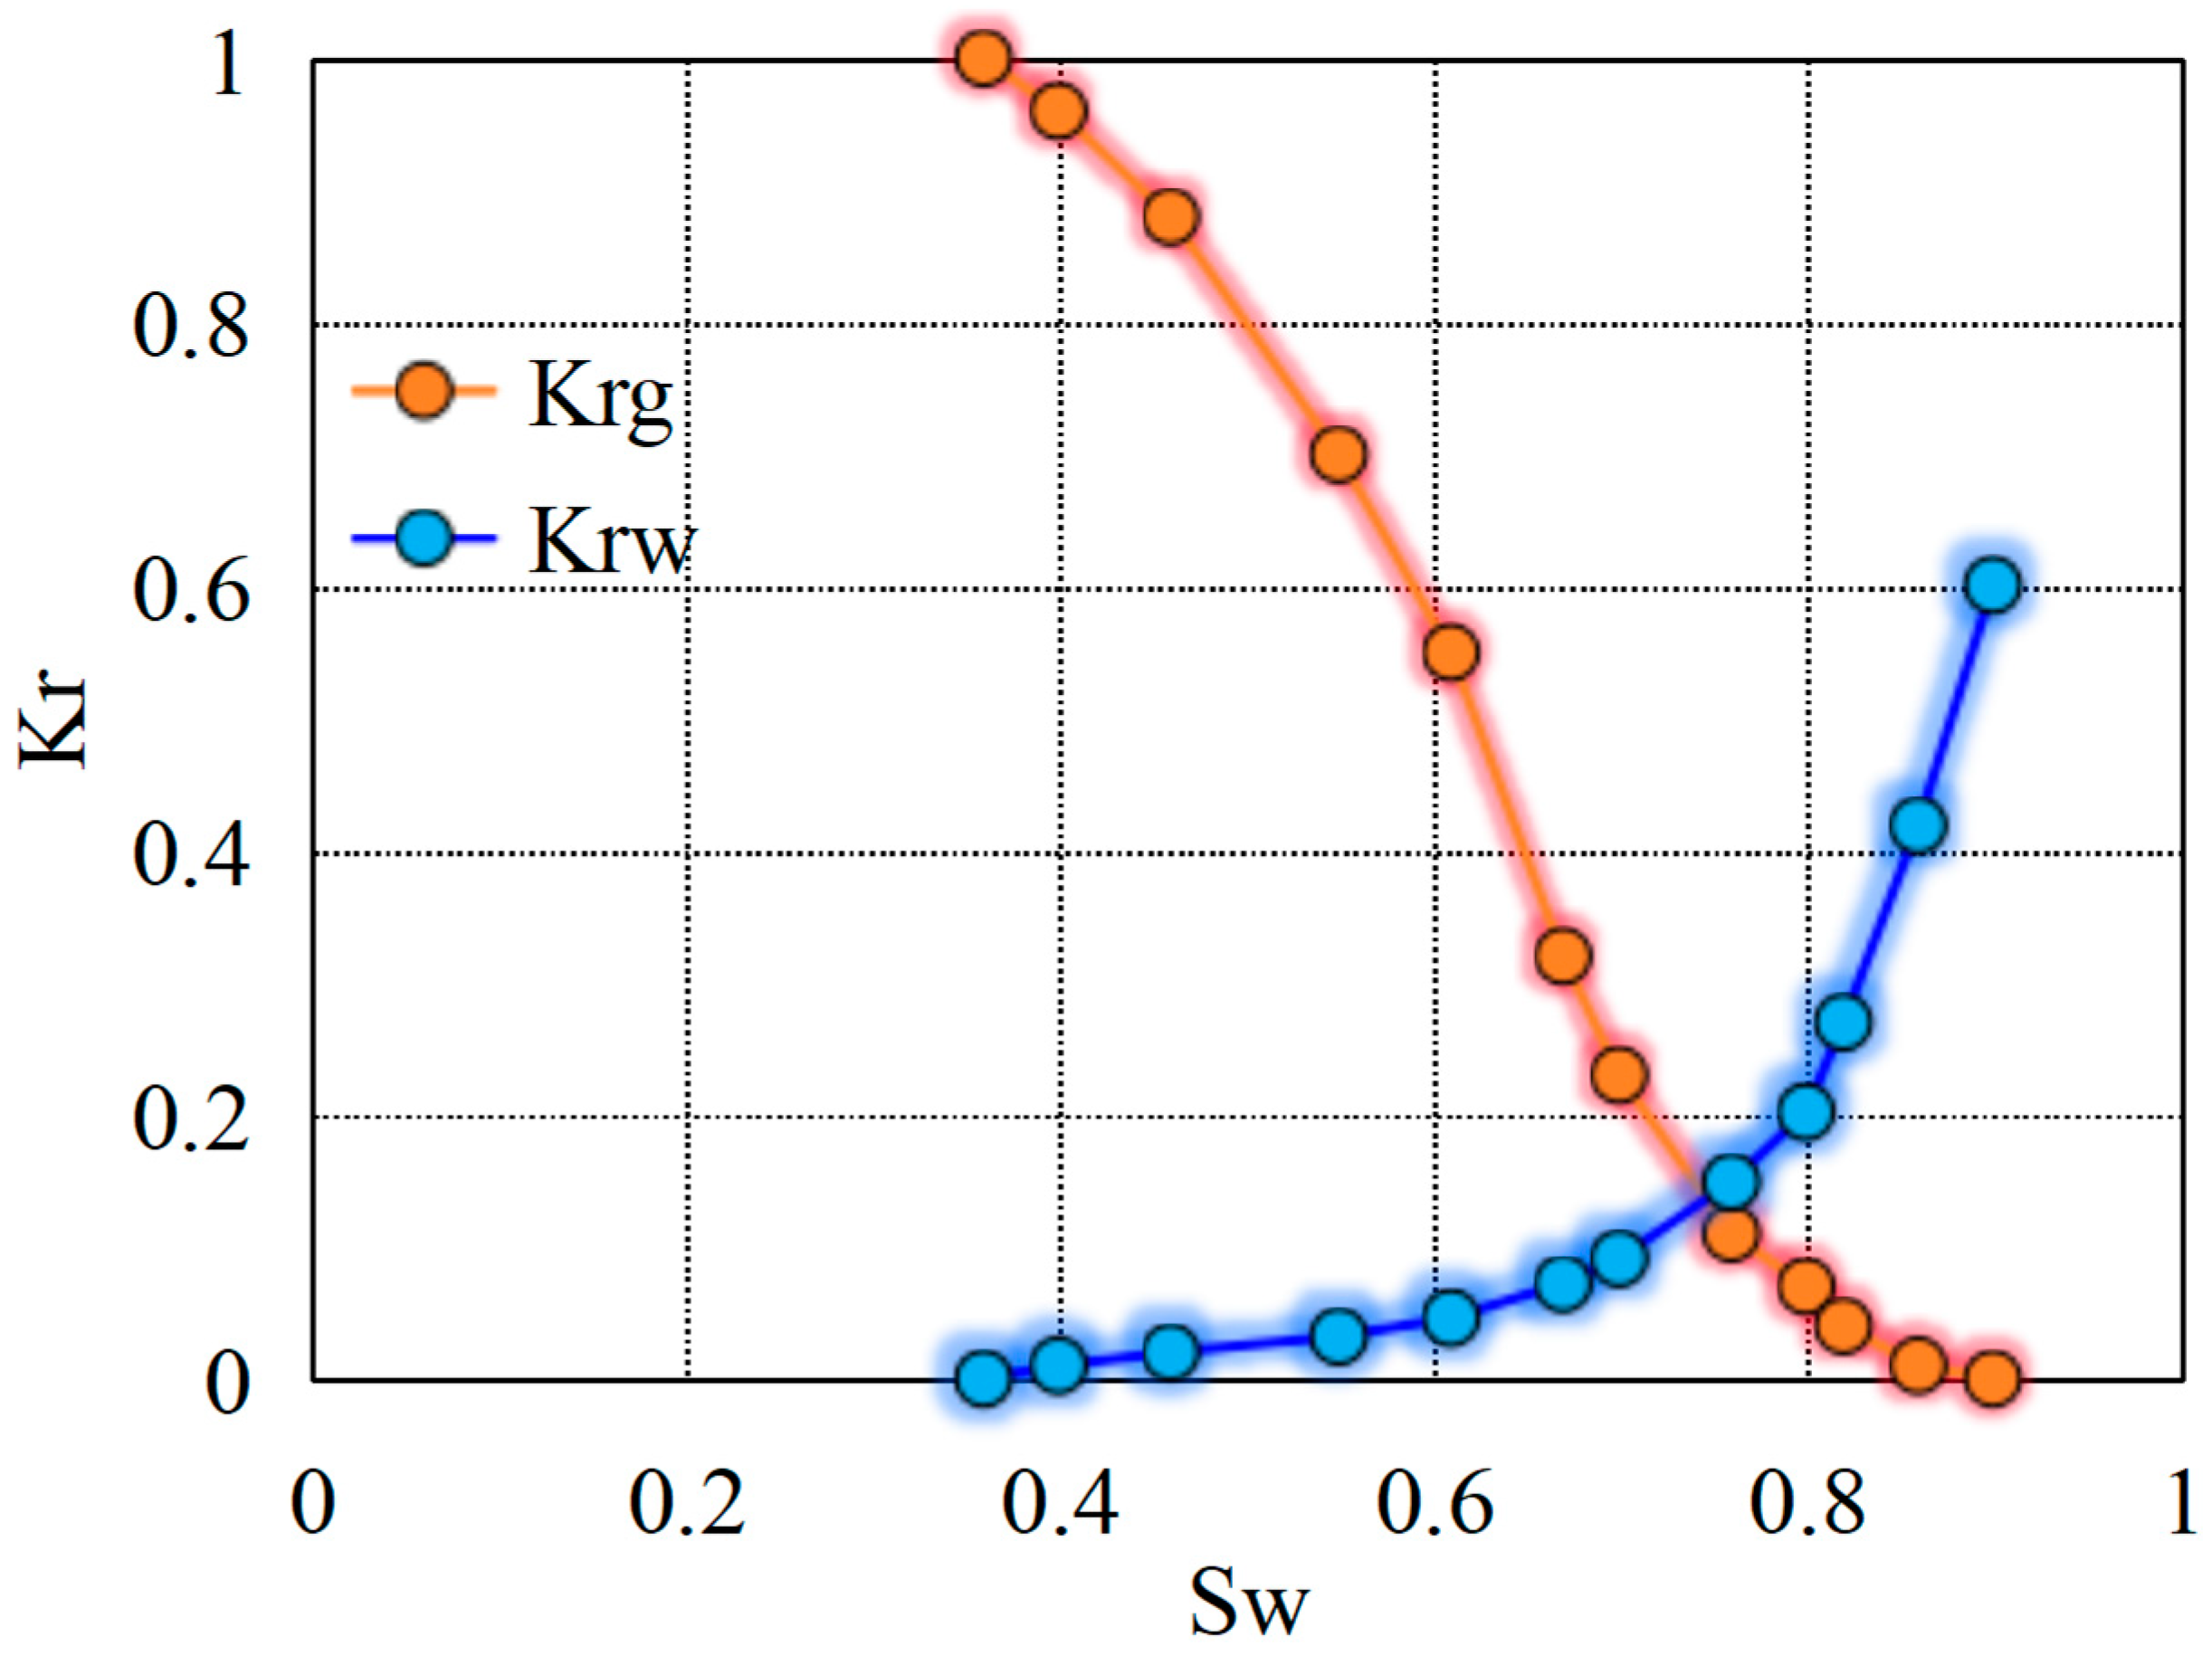
2.2. Formation and Fluid Properties Parameters

The fluid property model presented in this study offers a comprehensive characterization of the physical properties of fluids within gas reservoirs. It meticulously documents the formation water and natural gas properties that mirror the in situ conditions of the reservoir. The properties listed in Table 1 are derived from the Su5 block of the Sulige Gas Field in the Ordos Basin, China, providing a real-world dataset that ensures the model’s relevance and applicability. These include measurements of viscosity and other parameters at the standard reservoir temperature, which are indicative of the conditions prevalent in the region’s subterranean environment. The model further integrates the high-pressure physical properties of natural gas, as detailed in Table 2, essential for simulating the behavior of gas under the specific conditions encountered in the Su5 block. Additionally, the model captures the critical relative permeability curves, essential for deciphering the interplay between gas and water mobility within the reservoir rock matrix. Figure 2 illustrates the gas–water relative permeability curve, derived from laboratory experiments that simulate the actual conditions of the Su5 block, showcasing the fluid flow dynamics within this particular gas field.

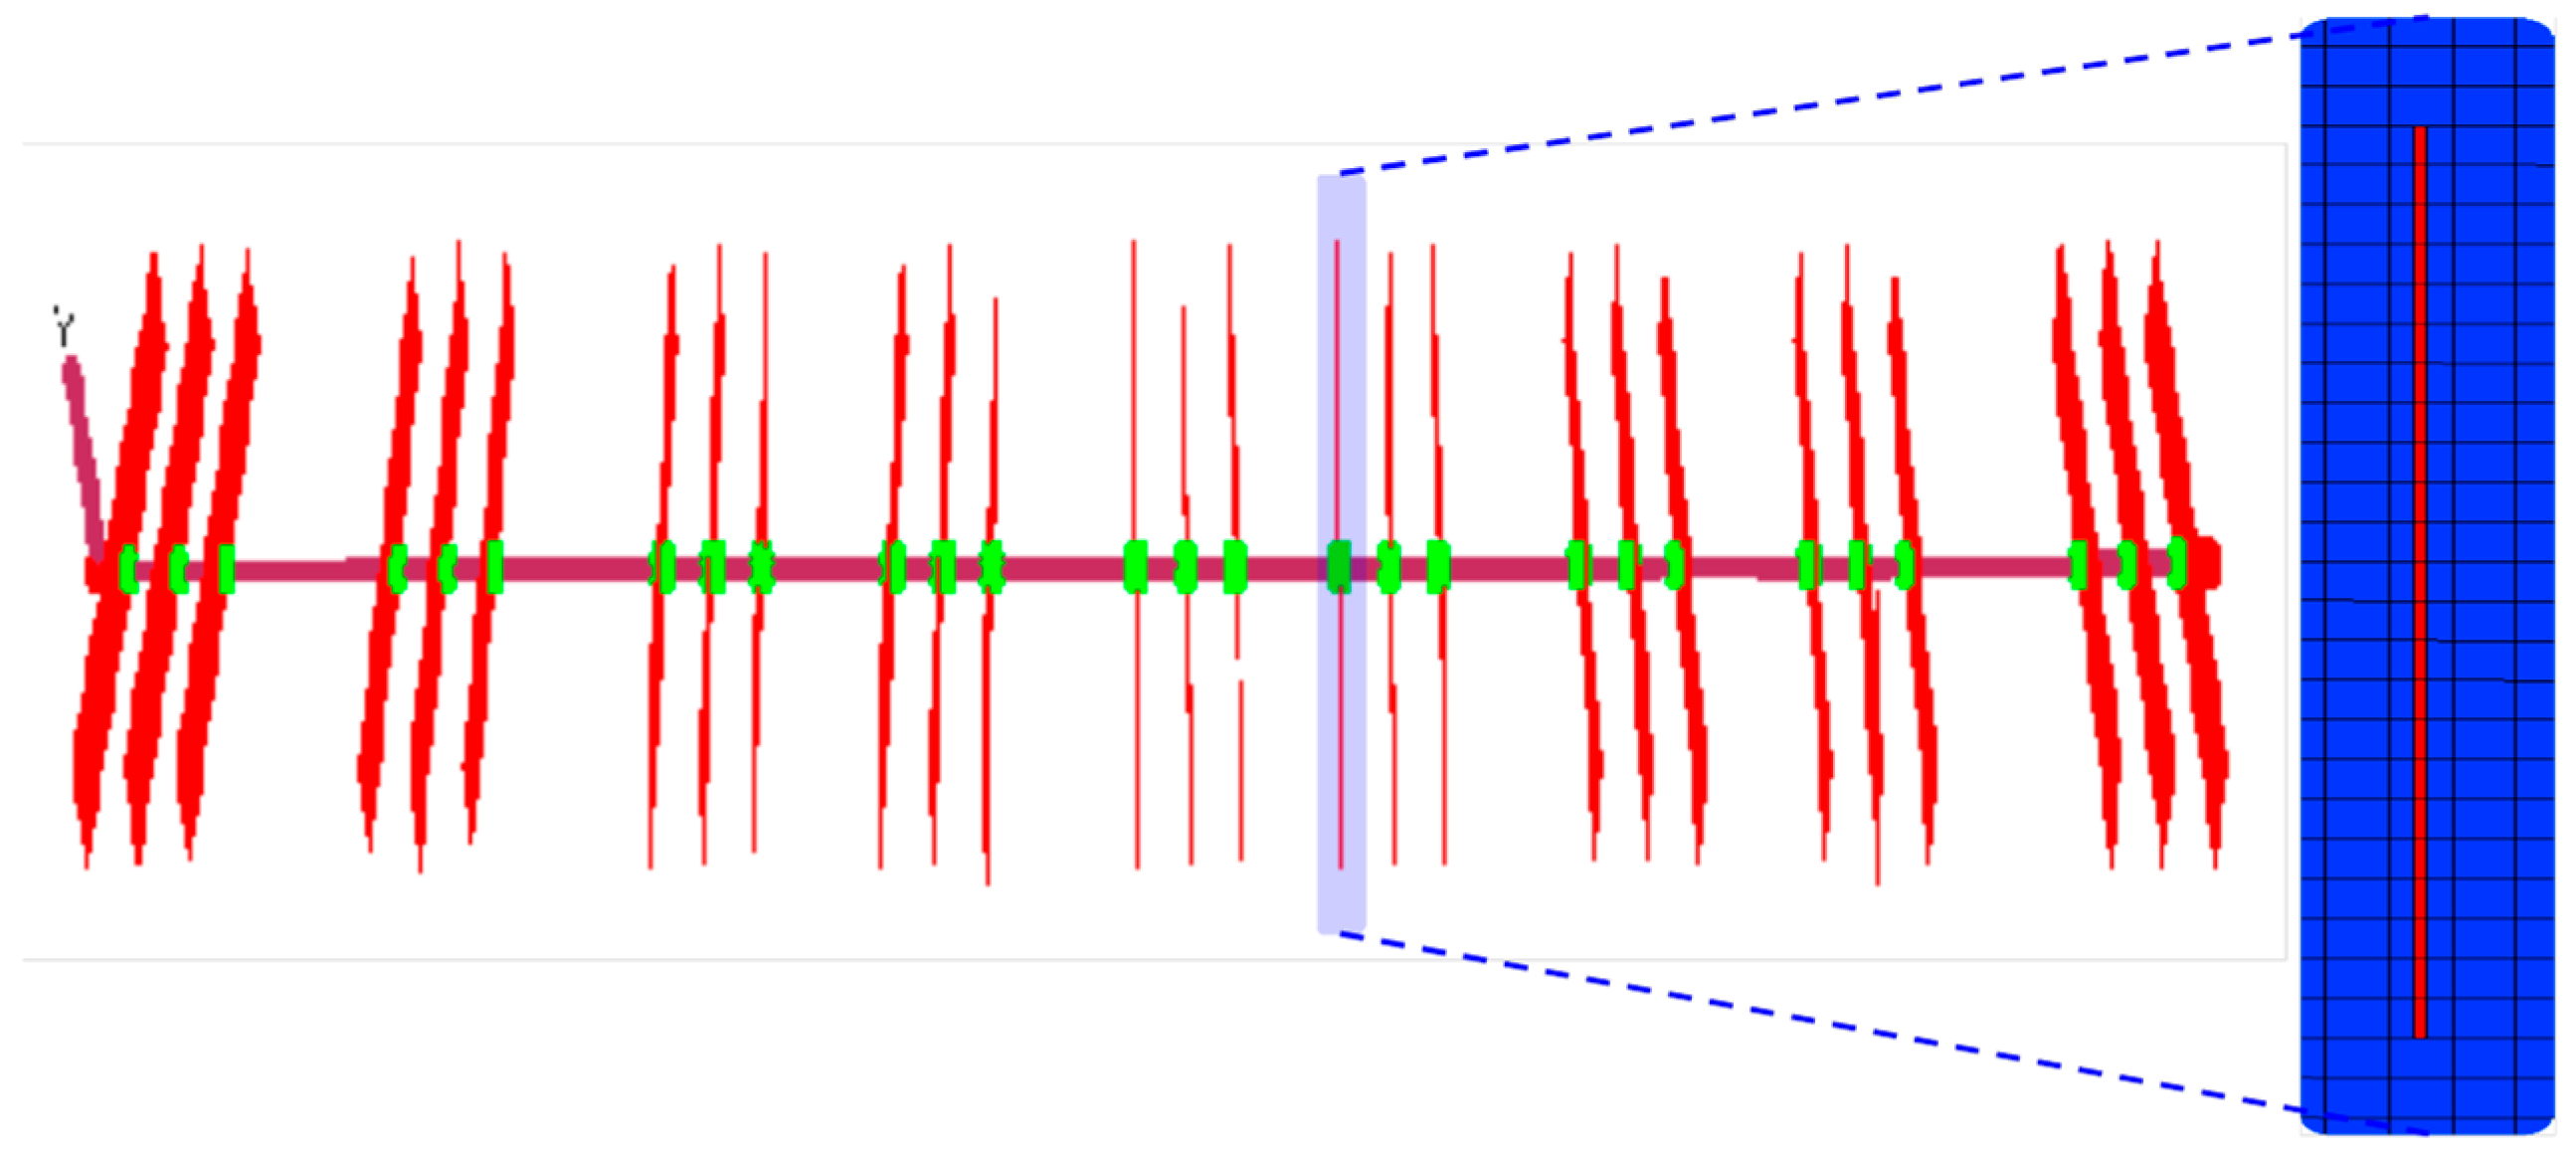
2.3. Treatment of Hydraulic Fractures

In the development of unconventional tight gas reservoirs, hydraulic fracturing is essentially required for production wells, with the resulting artificial fractures predominantly concentrated in the vicinity of the wellbore and exhibiting distinct directionality. This leads to significant variations in the permeability of the reservoir near the wellbore, where permeability is higher along the fracture direction and exhibits characteristics of infinite conductivity. Consequently, during numerical simulation, the permeability at the location of the fracture grid within the model is adjusted based on the fracture stimulation parameters and production dynamics, effectively equating it to an artificial fracture. In the study area, the maximum principal stress orientation is typically NE 75 to 85 degrees. Generally, the propagation of hydraulic fractures is primarily controlled by the in situ stress conditions and the tensile strength of the formation, extending along the direction of the maximum principal stress.
Utilizing this knowledge, the Eclipse reservoir numerical simulation model applies the Local Grid Refinement (LGR) technique to effectively manage the fractures generated by multi-cluster fracturing in horizontal wells. Figure 3 depicts the fracture distribution resulting from a multi-cluster fracturing operation, consisting of nine stages with three clusters per stage, within a horizontal well, as well as the LGR effect surrounding a single fracture.

3. Simulation Scheme Design

3.1. Horizontal-Well Fracturing Parameters

Based on actual hydraulic fracturing operations, appropriate parameters for horizontal-well length and fracture characteristics are selected to reflect field conditions for optimization. The parameter design matrix of fundamental parameter factors, which includes horizontal-well length, the number of fracturing stages, fracture half-length, fracture conductivity, and stage spacing, along with their respective levels for fractured horizontal wells, is presented in Table 3.
Since the position of the fractures along the horizontal well determines the spacing between fracturing stages, the four levels of stage spacing (X1, X2, X3, and X4) from the aforementioned table are reflected in the following different fracture distribution design schemes.

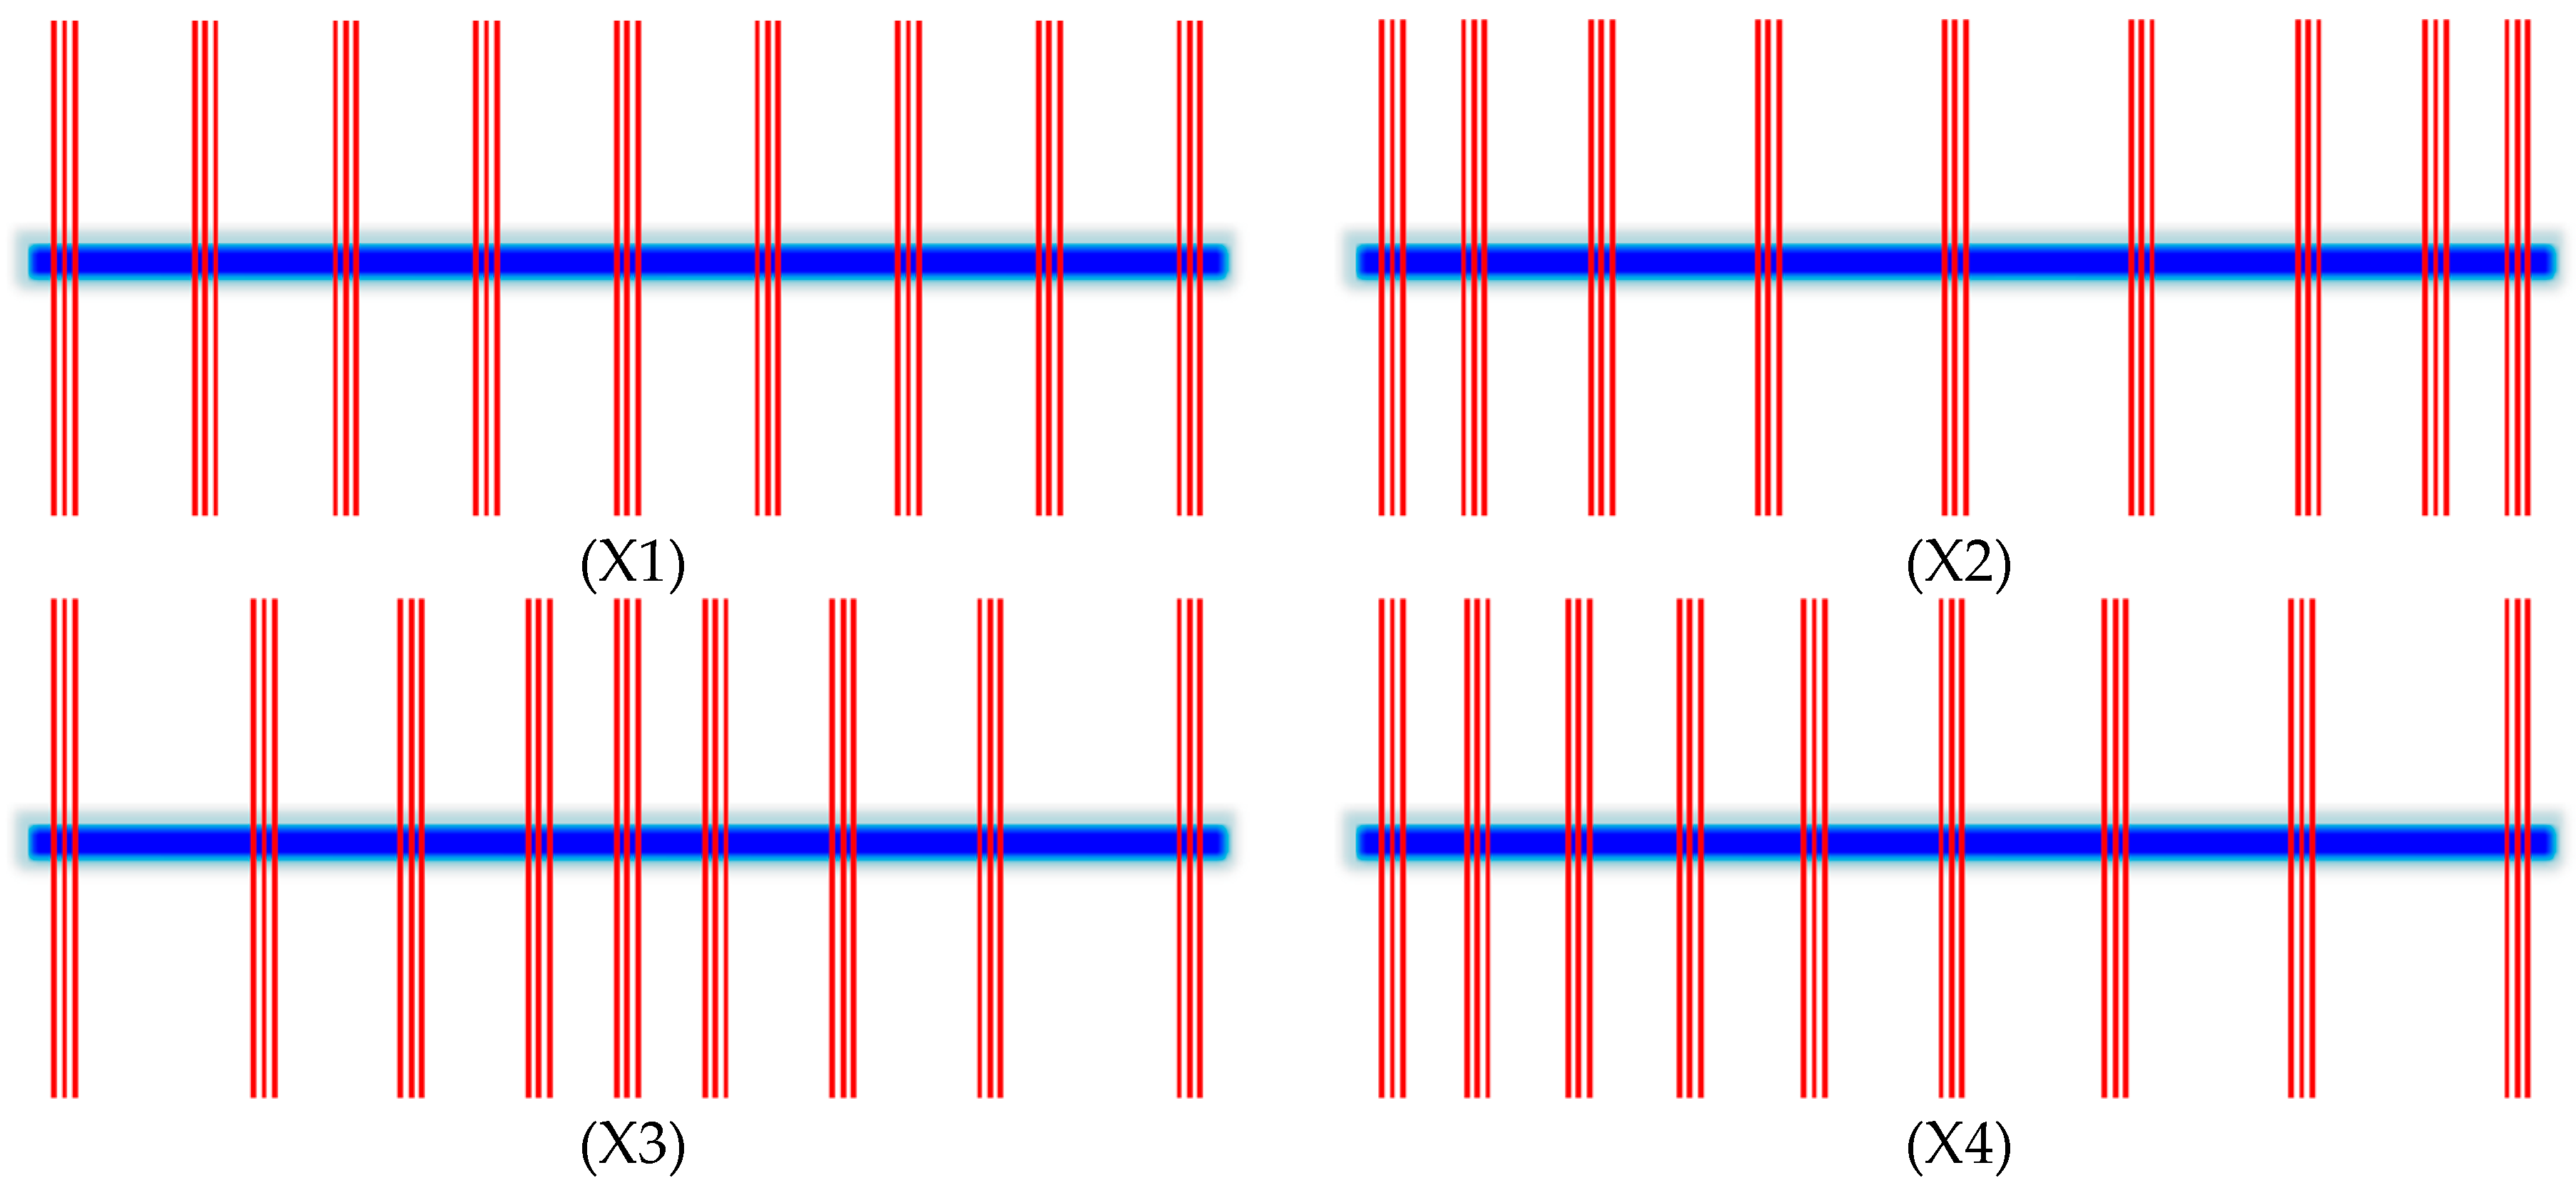
3.2. Fine-Fracture Distribution Patterns

Taking the example of hydraulic fracturing in a horizontal well with nine stages and three clusters per stage, four differentiated fracture distribution schemes are designed as follows:
(X1) Equal spacing of fractures along the horizontal well;
(X2) Denser fracture distribution at the ends of the horizontal section, with sparser distribution in between;
(X3) Sparser fracture distribution at the ends of the horizontal section, with denser distribution in between;
(X4) Denser fracture distribution at the heel of the horizontal well, and sparser at the toe.
Figure 4 presents the schematic diagrams of various fracture distribution schemes for the horizontal well, each featuring distinct stage spacing to optimize fracture efficiency and coverage. These diagrams highlight the customized approach to well stimulation, emphasizing the adaptability of the fracture design to different reservoir conditions.
Assuming that numerical simulation has demonstrated that the development effectiveness of the horizontal well is optimal under Scheme X3, four refined multi-cluster fracture distribution patterns are designed based on this foundation:
(Y1) Equal-length pattern, where the lengths of all fractures in the horizontal section are equal;
(Y2) Spindle pattern, where fractures in the middle of the horizontal section are longer, and those at the ends are shorter;
(Y3) Dumbbell pattern, where fractures in the middle of the horizontal section are shorter, and those at the ends are longer;
(Y4) Increasing pattern, where the length of the fractures gradually increases from the heel to the toe of the horizontal well.
The schematic diagrams in Figure 5 illustrate the intricate design of the refined multi-cluster fracture distribution patterns for the horizontal well, showcasing their spatial configuration and the strategic placement intended to optimize reservoir contact and stimulate fluid flow.
On the basis of the above design scheme, considering the different number of fracture clusters in each fracturing stage, the factors and levels for fine-fracture distribution pattern design in a multiple-fractured horizontal well are shown in Table 4.

4. Reasonable Fracturing Design

4.1. Optimization Results Based on Deterministic Models

An orthogonal experimental design is used to efficiently identify optimal factor combinations and to uncover underlying patterns across various levels, enabling effective analysis. This method is particularly adept at dissecting complex experimental scenarios where multiple variables interact in intricate ways. By systematically varying factors at different levels, orthogonal designs minimize the number of experiments needed while maximizing the information obtained from each test.
An orthogonal experimental design was applied to the factors and levels presented in Table 3, resulting in the construction of an L64 (161 × 44) orthogonal table, which requires 64 experimental schemes. After eliminating schemes with significantly low economic benefits (e.g., the scheme with 18 fractures in a 600 m horizontal section length), numerical simulation production forecasts were conducted for the remaining 48 schemes (labeled F-1 to F-48).
Using the cumulative gas production of horizontal wells in the initial state, 3rd year, 5th year, and 10th year as technical evaluation indicators, 12 schemes with distinct technical advantages at different development stages are identified by their respective numbers: F-24, F-28, F-32, F-37, F-38, F-39, F-41, F-42, F-43, F-45, F-46, and F-47. The cumulative gas production in different development stages of the gas reservoir is shown in Figure 6a.
Subsequently, considering economic factors such as drilling investment, fracturing costs, and sales revenue, these 12 schemes’ simulation results were evaluated using the net present value (NPV) method, yielding the NPV at different development stages, with the economic evaluation results presented in Figure 6b.
Comprehensively considering technical indicators and economic factors, the optimal fracturing modification basic parameter combination scheme is selected. (1) The technically optimal (maximizing production) horizontal-well fracture placement scheme is F-46, featuring a horizontal section length of 1800 m, with 18 fracturing stages, half-length fractures of 150 m, fracture conductivity of 20 μm2·cm, and a “uniform spacing” arrangement for stage intervals. (2) The economically optimal (maximizing NPV) horizontal-well fracture placement scheme is F-28, with a horizontal section length of 1400 m, 14 fracturing stages, half-length fractures of 150 m, fracture conductivity of 30 μm2·cm, and a “denser at both ends and sparser in the middle” (stage spacing of 80 to 110 m) differential spacing scheme for stage intervals of the horizontal well.
Based on the economically optimized F-28 scheme, a full orthogonal experimental design was conducted for four different fracture lengths and cluster counts, resulting in 16 fine-fracture distribution patterns for horizontal wells. Subsequently, numerical simulation production forecasts for horizontal wells were conducted for different schemes, with the cumulative gas production over ten years of well operation serving as the ultimate evaluation criterion. Comprehensive comparative charts of the cumulative gas production for the horizontal well developed in the 10th year under different fracture distribution patterns are presented in Figure 7.
The predictions derived from various modeling schemes have pointed towards an optimal configuration for the refined fracture distribution within the horizontal wells of our study area. This configuration, which demonstrates the most promising results, is defined by an arrangement that places “longer fractures in the middle and shorter fractures at both ends”. Specifically, the fracture half-length ranges from 100 to 140 m, and this pattern is complemented by a cluster design that consists of three to four clusters per stage. This strategic distribution aims to enhance the contact area between the wellbore and the reservoir, thereby improving the extraction efficiency. The rationale behind this pattern is rooted in the geological characteristics of the study area, where the gas-bearing sandstone layers exhibit varying degrees of lateral continuity. The design takes into account the need to maximize the interaction between the fractures and the productive formations while minimizing the potential for encountering non-productive intervals, such as mud layers.
In practical mining operations, the construction risks escalate with the elongation of the horizontal well sections and the proliferation of fracturing points. When the horizontal section of a well extends beyond 1600 m, the probability of intersecting with less productive or non-productive zones, such as mud layers, significantly increases. This not only diminishes the effective reservoir encounter rate but also introduces additional challenges in well construction and completion. To mitigate these risks, this study recommends adopting a fracturing scheme that maintains a horizontal section length within the range of 1400 to 1600 m. By doing so, it is anticipated that the effective reservoir encounter rate can be enhanced, targeting an encounter rate of approximately 70%. This approach also seeks to minimize operational hazards and reduce the associated costs. Moreover, the selection of the appropriate horizontal-well length and fracture distribution is crucial for balancing the stimulation effectiveness and the economic viability of the operation. The recommended scheme is expected to provide a sweet spot that optimizes the fracture network’s coverage of the reservoir while avoiding the complications arising from drilling into unfavorable geological intervals.
Synthesizing the results, the refined fracture distribution pattern, with its specific configuration and the recommended horizontal-well length, is designed to address the geological nuances of the study area and the operational constraints of horizontal well construction. It represents a data-driven strategy that aims to optimize the development of unconventional gas resources, ensuring both technical feasibility and economic sustainability.

4.2. Exploration of Reasonable Fracture Distribution Patterns under Uncertainty Conditions

The optimization of hydraulic fracture distribution in tight gas reservoirs is a complex endeavor, intricately linked with the challenges posed by subsurface uncertainties and heterogeneities. These geological variables, which include variations in rock mechanical properties, the presence of natural fracture networks, and the spatial distribution of reservoir spatial physical properties, introduce significant complexity to the hydraulic fracturing process. Despite the structured methodology of this study, we recognize the inherent limitations of simulation models in fully encapsulating the diverse characteristics of subsurface heterogeneity. The influence of such heterogeneities on the propagation of hydraulic fractures is manifold. The interaction between induced fractures and pre-existing geological structures can significantly alter fluid flow pathways, either promoting or impeding the efficiency of reservoir stimulation. Furthermore, uncertainties surrounding key parameters—such as in situ stress orientations, variations in rock strength, and the dynamics of fluid–rock interactions during fracturing—can lead to a spectrum of potential outcomes that deterministic simulations may not fully capture.
This study, while anchored in a conceptually homogeneous model, acknowledges the often heterogeneous nature of subsurface conditions in the simulation optimization process. The outcomes are presented as a spectrum of effective strategic options rather than as a singular solution. By offering a range of optimization results, we propose a strategy that is adaptable to the intrinsic variability of subsurface conditions. This approach surpasses the limitations of the model’s idealized conditions, aiming for applicability in the complex realities of real-world operations. In the realm of geological modeling, both conceptually homogeneous models and heterogeneous models play pivotal roles and possess distinct strengths. They cater to different needs and are applicable in a variety of scenarios when addressing subsurface challenges. There is no one-size-fits-all “optimal result” when it comes to selecting between these two types of models. Instead, the choice of the model should be informed by a careful consideration of the specific application contexts and research objectives at hand. If the physical properties of the study area exhibit relative uniformity, or if there is a pressing need for computational efficiency due to time or resource constraints, a conceptually homogeneous model may offer a more streamlined and efficient approach. This type of model can provide valuable insights and optimized solutions, with reduced computational expense, making it particularly suitable for large-scale or preliminary analyses. Conversely, when the objective is to achieve a high degree of fidelity in the representation of complex spatial heterogeneity within a specific geological block, a heterogeneous model is indispensable. These models, with their ability to incorporate detailed geological variations, are crucial for scenarios demanding precise simulations that can capture the subtleties of local geological nuances. Therefore, while the applicability of optimization results derived from conceptually homogeneous models is broad and can be generalized across different geological settings, the applicability of optimization results from heterogeneous models is more focused and confined to a particular study area. This focused approach ensures that the model’s predictions and recommendations are highly relevant and specific to the unique characteristics of the geological context under investigation.
Based on the aforementioned understanding, it becomes clear that the optimization of fracture distribution must be approached with a high degree of flexibility and adaptability. Given the diverse and unpredictable nature of subsurface conditions, a “one-size-fits-all” strategy falls short in addressing the complex realities of hydraulic fracturing operations. Each well must be considered a unique case, necessitating tailored strategies that account for its specific geological context and operational constraints. The principle of “one well, one policy” highlights the need for individualized fracture designs informed by detailed subsurface characterization and a comprehensive understanding of local geomechanics. This approach not only acknowledges the heterogeneity of each reservoir, but also capitalizes on it to enhance the efficiency and effectiveness of hydraulic fracturing. By adopting a “one well, one policy” strategy, operators can more effectively navigate the uncertainties and complexities associated with subsurface operations. This includes employing advanced diagnostic tools, real-time monitoring, and data-driven decision-making processes that enable the continuous refinement of fracture designs as new information emerges. Essentially, the “one well, one policy” approach advocates for a more personalized and responsive hydraulic fracturing strategy, capable of evolving with the ever-changing understanding of the subsurface. It signifies a forward-looking paradigm shift set to improve the overall success and sustainability of hydraulic fracturing operations in the tight gas reservoirs of the future.

5. Conclusions

This study has successfully established a tailored fine-fracturing approach for horizontal wells in tight gas reservoirs, providing valuable theoretical guidance and a comprehensive framework for optimizing fracture distribution patterns in similar unconventional hydrocarbon reservoirs.
(1) The optimal fracture distribution pattern for horizontal wells in the study area is characterized by a combination that features fractures that are longer in the middle and shorter at both ends. This pattern, which includes a fracture half-length of 100 to 140 m and a cluster number of three to four clusters per stage, with a fracture conductivity of 30 μm2·cm, has been identified as the most effective in enhancing well productivity.
(2) The practical application of the economically optimized scheme has demonstrated its effectiveness in improving the effective reservoir encounter rate and reducing operational risks and costs. With a horizontal section length of 1400 to 1600 m, this scheme, which includes fracturing at every 100 m along the well, has proven to be a balance between technical performance and economic viability, assuming a 70% encounter rate.
(3) The integration of numerical simulation with economic evaluation using the NPV method has provided a robust framework for assessing the economic feasibility of different fracturing schemes. This methodology has been instrumental in selecting the optimal basic parameter combination scheme that considers both technical performance and economic benefits. Furthermore, it is advised that in practical applications, specific issues should be analyzed on a case-by-case basis to ensure that the chosen fracturing scheme is tailored to the unique conditions and constraints of the operation at hand.

Author Contributions

Conceptualization and methodology: L.R. and D.Z.; validation: J.W. and C.Z.; data curation: C.J. and J.S.; writing—original draft: L.R. and F.X.; writing—review and editing: D.G. and H.L. All authors have read and agreed to the published version of the manuscript.

Funding

This research was supported by the National Natural Science Foundation of China (No. 52304036, 51934005, U23B2089) and Natural Science Basic Research Plan in Shaanxi Province of China (No. 2023-JC-YB-344, 2023-JC-YB-433).

Data Availability Statement

The data utilized in this study can be accessed for research purposes by contacting the corresponding author.

Acknowledgments

We extend our gratitude to Xi’an Shiyou University and Shengli Petroleum Bureau Co., Ltd. Sinopec for their support in facilitating this research.

Conflicts of Interest

The author Haiyan Li is employed by the Shengli Petroleum Bureau Co., Ltd. Sinopec; The remaining authors declare that the research was conducted in the absence of any commercial or financial relationships that could be construed as a potential conflict of interest.

References

  1. Zhao, J.; Chen, X.; Li, Y.; Fu, B.; Xu, W. Numerical Simulation of Multi-stage Fracturing and Optimization of Perforation in a Horizontal Well. Pet. Explor. Dev. 2017, 44, 119–126. [Google Scholar] [CrossRef]
  2. Hou, B.; Chang, Z.; Wu, A.A.; Elsworth, D. Simulation of Competitive Propagation of Multi-fractures on Shale Oil Reservoir Multi-clustered Fracturing in Jimsar Sag. Acta Pet. Sin. 2022, 43, 75–90. [Google Scholar]
  3. Zhou, F.J.; Su, H.; Liang, X.Y.; Meng, L.F.; Yuan, L.S.; Li, X.H.; Liang, T.B. Integrated Hydraulic Fracturing Techniques to Enhance Oil Recovery from Tight Rocks. Pet. Explor. Dev. 2019, 46, 1007–1014. [Google Scholar] [CrossRef]
  4. Lu, Y.; Li, H.T.; Wang, J.C.; Liu, T.; Wu, K.L. Productivity Evaluation Model for Multi-cluster Fractured Wells Based on Volumetric Source Method. Energy Rep. 2022, 8, 8467–8479. [Google Scholar] [CrossRef]
  5. Zhang, H.; Bai, Y.H.; Fang, M.J.; Meng, F.K. Influencing Factors Analysis and Optimization of Hydraulic Fracturing in Multi-layered and Thin Tight Sandstone Gas Reservoir. Energies 2023, 16, 7797. [Google Scholar] [CrossRef]
  6. Parvizi, H.; Rezaei-Gomari, S.; Nabhani, F.; Turner, A.; Feng, W.C. Hydraulic Fracturing Performance in Tight Sandstone Gas Reservoirs with High Perm Streaks and Natural Fractures. In Proceedings of the EUROPEC 2015, Madrid, Spain, 1–4 June 2015; p. 174338. [Google Scholar] [CrossRef]
  7. Gao, Q.; Cheng, Y.; Yan, C. A 3D Numerical Model for Investigation of Hydraulic fracture Configuration in Multilayered Tight Sandstone Gas Reservoirs. J. Pet. Explor. Prod. Technol. 2018, 8, 1413–1424. [Google Scholar] [CrossRef]
  8. Ren, L.; Su, Y.L.; Wang, W.D.; Zhao, G.Y.; Yuan, B. Seepage Characteristics and Productivity Distribution of Segmented and Multi-cluster Fractured Horizontal Wells. J. Xi’an Shiyou Univ. Nat. Sci. Ed. 2013, 28, 55–59. [Google Scholar]
  9. Cheng, H.L.; Cheng, Z.Y.; Qin, Q.; Chen, H.; Wan, F.; Zhao, J.Y.; Li, J.P. Production Analysis of Multi-stage Fractured Horizontal Wells in Tight Oil Reservoirs. In Proceedings of the International Field Exploration and Development Conference 2023; Lin, J., Ed.; Springer Series in Geomechanics and Geoengineering; Springer: Singapore, 2024. [Google Scholar]
  10. Ren, L.; Su, Y.L.; Zhan, S.Y.; Meng, F.K. Progress of Research on Productivity Prediction Methods for Stimulated Reservoir Volume (SRV)-Fractured Horizontal Wells in Unconventional Hydrocarbon Reservoirs. Arab. J. Geosci. 2019, 12, 184. [Google Scholar] [CrossRef]
  11. Yong, R.; Zhou, F.J.; Li, M.H.; Song, Y.; Zhou, X.J.; Zhao, Z.H.; Li, B.; Qin, S.Y. Effects of Fracturing Parameters on Fracture Unevenness During Large-Stage Multi-cluster Fracturing in Horizontal Wells. Front. Energy Res. 2021, 9, 612486. [Google Scholar] [CrossRef]
  12. Ren, L.; Su, Y.L.; Lu, M.J.; Zhang, Y.H.; Cui, J. Optimization of Fracture Parameters of Segmented and Multi-cluster Fracturing Horizontal Wells in Unltra-low Permeability Reservoirs. J. Xi’an Shiyou Univ. Nat. Sci. Ed. 2015, 30, 49–52. [Google Scholar]
  13. Guo, T.K.; Wang, Y.P.; Chen, M.; Qu, Z.Q.; Tang, S.J.; Wen, D.W. Multi-stage and Multi-well Fracturing and Induced Stress Evaluation: An Experiment Study. Geoenergy Sci. Eng. 2023, 230, 212271. [Google Scholar] [CrossRef]
  14. Li, L.L.; Yao, J.; Li, Y.; Wu, M.L.; Zeng, Q.D.; Lu, R.R. Productivity Calculation and Distribution of Staged Multi-cluster Fractured Horizontal Wells. Pet. Explor. Dev. 2014, 41, 504–508. [Google Scholar] [CrossRef]
  15. Zeng, Q.D.; Tong, Y.; Yao, J. Production Distribution in Multi-cluster Fractured Horizontal Wells Accounting for Stress Interference. J. China Univ. Pet. (Ed. Nat. Sci.) 2019, 43, 99–107. [Google Scholar]
  16. Sarvaramini, E.; Miller, P.; Burnham, J.; Kivari, A. Quantifying Hydraulic Fracture Geometry and Morphology in a Multi-cluster, Multi-stage, Hydraulically Fractured Well Using Volume-to-First-Response Analysis. In Proceedings of the SPE Hydraulic Fracturing Technology Conference and Exhibition, Woodlands, TX, USA, 6–8 February 2024; p. 217832. [Google Scholar] [CrossRef]
  17. Wang, B.; Fang, Y.; Li, L.Z.; Liu, Z. Automatic Optimization of Multi-well Multi-stage Fracturing Treatments Combining Geomechanical Simulation, Reservoir Simulation and Intelligent Algorithm. Processes 2023, 11, 1759. [Google Scholar] [CrossRef]
  18. Yang, H.H.; Liu, X.Y.; Chu, X.S.; Xie, B.H.; Zhu, G.; Li, H.C.; Yang, J. Optimization of Tight Gas Reservoir Fracturing Parameters via Gradient Boosting Regression Modeling. Heliyon 2024, 10, e27015. [Google Scholar] [CrossRef] [PubMed]
  19. Ye, F.; Li, X.; Zhang, N.; Xu, F. Prediction of Single-Well Production Rate after Hydraulic Fracturing in Unconventional Gas Reservoirs Based on Ensemble Learning Model. Processes 2024, 12, 1194. [Google Scholar] [CrossRef]
  20. Khormali, A.; Ahmadi, S. Experimental and modeling analysis on the performance of 2-mercaptobenzimidazole corrosion inhibitor in hydrochloric acid solution during acidizing in the petroleum industry. J. Pet. Explor. Prod. Technol. 2023, 13, 2217–2235. [Google Scholar] [CrossRef]
  21. Kahhal, P.; Ghasemi, M.; Kashfi, M.; Ghorbani-Menghari, H.; Kim, J.H. A multi-objective optimization using response surface model coupled with particle swarm algorithm on FSW process parameters. Sci. Rep. 2022, 12, 2837. [Google Scholar] [CrossRef] [PubMed]
  22. Zhai, M.Y.; Wang, D.Y.; Zhang, Z.L.; Zhang, L.Y.; Yang, F.; Huang, B.; Zhong, A.H.; Li, L.C. Numerical simulation and multi-factor optimization of hydraulic fracturing in deep naturally fractured sandstones based on response surface method. Eng. Fract. Mech. 2022, 259, 108110. [Google Scholar] [CrossRef]
  23. Khormali, A.; Ahmadi, S. Prediction of barium sulfate precipitation in dynamic tube blocking tests and its inhibition for waterflooding application using response surface methodology. J. Pet. Explor. Prod. Technol. 2023, 13, 2267–2281. [Google Scholar] [CrossRef]
Figure 1. Numerical model diagram of the tight gas reservoir.
Processes 12 01392 g001
Figure 2. Gas–water relative permeability curve.
Processes 12 01392 g002
Figure 3. Schematic representation of the LGR effect surrounding a single fracture within a multi-stage and multi-cluster fractured horizontal well. (Green indicates the perforation location, while red represents the multi-cluster hydraulic fracture.)
Processes 12 01392 g003
Figure 4. Schematic diagram of differential fracturing (varied stage-spacing distribution) plan for horizontal well (nine stages with three clusters per stage).
Processes 12 01392 g004
Figure 5. Schematic diagram of differential fracturing (varied stage spacing distribution) plan for horizontal well (nine stages with three clusters per stage).
Processes 12 01392 g005
Figure 6. Technical and economic indicators of advantageous solutions in different stages of gas reservoir development.
Processes 12 01392 g006
Figure 7. The comprehensive comparative charts of cumulative gas production for the horizontal well developed in the 10th year under different fracture distribution patterns.
Processes 12 01392 g007
Table 1. The formation and fluid property parameters.
Parameters (Unit)Data
Formation water density, g/cm31.008
Formation water volume factor1.03
Rock compression coefficient, 10−5/bar4.3974
Reservoir temperature, °C95
Formation water viscosity, mPa·s0.5
Formation water compression coefficient, 10−5/bar4.56
Relative density of natural gas0.616
Original formation pressure, bar276
Table 2. High-pressure properties of natural gas.
Pressure (bar)Compression Factor (Zg)Viscosity (mPa·s)
101.00450.0134
200.99680.0137
400.98320.0143
1000.95680.0161
1200.95280.0167
1600.9520.0179
1800.95520.0185
2000.96080.0191
2400.97920.0203
2600.9920.0209
2801.00720.0215
3001.02480.0221
3201.04480.0227
Table 3. The factors and levels of basic parameter design for a fractured horizontal well.
Factors
/
Levels
F1F2F3F4F5
Horizontal-Well Length (m)Number of Fracturing StagesHalf-Length of Fracture (m)Fracture Conductivity (μm2·cm)Stage Spacing (Different Design)
L16003~105010X1
L210003~1210015X2
L314003~1615020X3
L418003~1820030X4
Table 4. The factors and levels for fine-fracture distribution pattern design in a multi-stage and multi-cluster fractured horizontal well.
Factors
/
Levels
F5F6F7
Fracture Distribution Pattern
(Differences in Position)
Fracture Distribution Pattern
(Differences in Length)
Cluster Number
(per Stage)
L1X1Y12
L2X2Y23
L3X3Y34
L4X4Y45
Disclaimer/Publisher’s Note: The statements, opinions and data contained in all publications are solely those of the individual author(s) and contributor(s) and not of MDPI and/or the editor(s). MDPI and/or the editor(s) disclaim responsibility for any injury to people or property resulting from any ideas, methods, instructions or products referred to in the content.

