Article

The Analysis of Transient Temperature in the Wellbore of a Deep Shale Gas Horizontal Well

by
Shilong Zhang
1,
Jianhong Fu
1,
Chi Peng
1,*,
Yu Su
2,
Honglin Zhang
1 and
Mou Yang
1
1
State Key Laboratory of Oil and Gas Reservoir Geology and Exploitation, Southwest Petroleum University, Chengdu 610500, China
2
Engineering Technology Research Institute, PetroChina Southwest Oil & Gas Field Company, Chengdu 610017, China
*
Author to whom correspondence should be addressed.
Processes 2024, 12(7), 1402; https://doi.org/10.3390/pr12071402
Submission received: 3 June 2024 / Revised: 19 June 2024 / Accepted: 3 July 2024 / Published: 5 July 2024
(This article belongs to the Section Process Control and Monitoring)

Abstract

:
The transient temperature of the wellbore plays an important role in the selection of downhole tools during the drilling of deep shale gas horizontal wells. This study established a transient temperature field model of horizontal wells based on the convection heat transfer between wellbore and formation and the principle of energy conservation. The model verification shows that the root mean squared error (RMSE) between the measured annular temperature neat bit and the predicted value is 0.54 °C, indicating high accuracy. A well in Chongqing, China, is taken as an example to study the effects of bottom hole assembly (BHA), drill pipe size, drilling fluid density, flow rate, inlet temperature of drilling fluid, and drilling fluid circulation time on the temperature distribution in wellbore annulus. It is found that the increase in annular temperature is about 1 °C/100 m in the horizontal section when a positive displacement motor (PDM) is used. A Φ139.7 mm drill pipe is more favorable for cooling than Φ139.7 mm + Φ127 mm drill pipe. Reducing drilling fluid density and flow rate and inlet temperature is beneficial to reduce bottom hole temperature. Bit-breaking rock, bit hydraulic horsepower, and drill pipe rotation will increase the bottom hole temperature. The research results can provide theoretical guidance for temperature prediction, selection of proper drill tools, and adjustment of relevant parameters in deep shale gas horizontal wells.

1. Introduction

With the rapid development of technology, the exploration of oil and gas resources has greatly increased, and the exploration and development of deep shale gas has also made good progress [1,2]. However, with the continuous development of shale gas exploration and development to deep formation, complex geological conditions such as high temperature and high pressure have become challenges in deep shale gas horizontal well drilling engineering [3]. The high-temperature environment is a primary reason for the failure of downhole tools. Currently, tools are often selected based on formation temperature, with the empirical assumption that tool failure will not occur as long as the tool’s temperature limit equals the formation temperature. However, a significant amount of heat is generated during the drilling process, which can cause the bottom hole temperature to exceed the formation temperature [4]. Therefore, to ensure safe drilling in deep shale gas horizontal wells, it is necessary to conduct research on the temperature distribution of horizontal wellbores and influencing factors.
The temperature distribution in the wellbore during the drilling process is difficult to measure directly. Scholars often use computer simulations, employing analytical and numerical methods to explore the distribution rule of wellbore temperature. The analytical approach, represented by the research of Ramey [5], Holmes and Swift [6], Shiu and Beggs [7], Hasan and Kabir [8], and Li [9,10], is based on the steady-state heat transfer mechanism of the wellbore. It adopts a semi-analytical method to address the unsteady heat conduction within the formation. By analyzing the heat flow into and out of infinitesimal elements and applying the principle of energy conservation, an analytical mathematical model for steady-state heat conduction in the wellbore is established. However, this analytical model of the wellbore temperature field neglects factors such as heat source terms and wellbore structure, making it difficult to accurately predict the wellbore temperature field under complex operating conditions. The numerical method is rooted in the transient heat transfer mechanism of the wellbore. It takes into account factors such as thermal convection of the wellbore fluid, axial heat conduction of the drill pipe, convective heat transfer between the drill pipe and the fluid, as well as heat exchange among the casing, cement column, and formation. Based on the principle of energy conservation, differential equations of the wellbore temperature field are formulated. These equations are solved using methods such as finite difference, finite volume, and finite element [11,12,13,14,15]. Representative works include Raymond [11] and Marshall [12], who were the first to establish a numerical model for transient heat transfer in the wellbore during drilling fluid circulation.
Based on these studies, scholars have expanded the research scope and adaptation conditions of wellbore temperature fields. Their research has taken into account conditions such as fluid properties, drilling parameters, and heat sources [16,17,18,19,20,21,22,23,24,25,26,27,28,29,30,31]. Li et al. [21] studied the temperature profile of long horizontal wellbore sections using a three-dimensional stability model. Yang et al. [22] established a transient heat transfer model for the wellbore formation during the entire drilling process, analyzing the downhole temperature distribution during drilling fluid circulation and stop circulation. Li et al. [23] discussed the variation of wellbore and formation temperatures with shut-in time under overflow. Zhang et al. [24] studied the wellbore temperature distribution during the circulation phase when a continuous formation kick occurs at the bottom of the well. Al Saedi et al. [25] proposed two new models to solve the temperature distribution during drilling fluid circulation. Yang et al. [26] investigated transient temperature changes in the wellbore when the drill pipe maintains an eccentric position during deep well operations. Abdelhafiz et al. [27] established transient and steady-state numerical analysis models for wellbore temperature during drilling fluid circulation, analyzing the effects of flow rate and flow pattern on wellbore temperature distribution. Song and Guan [28] presented a complete transient temperature model for deepwater drilling fluid circulation, analyzing the influence of factors such as water depth, water temperature, and riser insulation on the temperature of drilling fluid circulation. Khan and May [29] developed a mathematical model for predicting transient bottomhole temperature during drilling, applicable to vertical wells, inclined wells, and horizontal wells. Yang et al. [30] established a reel well drilling temperature model considering bit heating. Mao et al. [31] created a wellbore temperature prediction model that accounts for bit heat generation and variations in mud thermophysical parameters, exploring the effects of mud system, density, flow rate, inlet temperature, Revolutions per minute (RPM), and weight on bit (WOB) on wellbore and downhole tool temperatures.
It is not difficult to find that most existing models are aimed at predicting wellbore temperature distribution during vertical drilling. However, due to the different temperature distributions in the surrounding formations of the vertical section, oblique section, and horizontal section of horizontal wells, there are differences in wellbore temperature distribution compared to vertical wells. Therefore, this paper established a wellbore temperature field model for deep shale gas horizontal drilling, solved the model using the finite difference method, and validated it with field data. The results show that the model has sufficient accuracy to calculate the transient wellbore temperature distribution. Based on this, we investigated the effects of bottom hole assembly (BHA), drill pipe size, drilling fluid density, flow rate, inlet temperature of drilling fluid, and drilling fluid circulation time on the temperature distribution in the wellbore annulus. This research can provide a theoretical understanding of the prediction of transient wellbore temperature in deep shale gas horizontal wells and its application.

2. Wellbore Heat Transfer Model
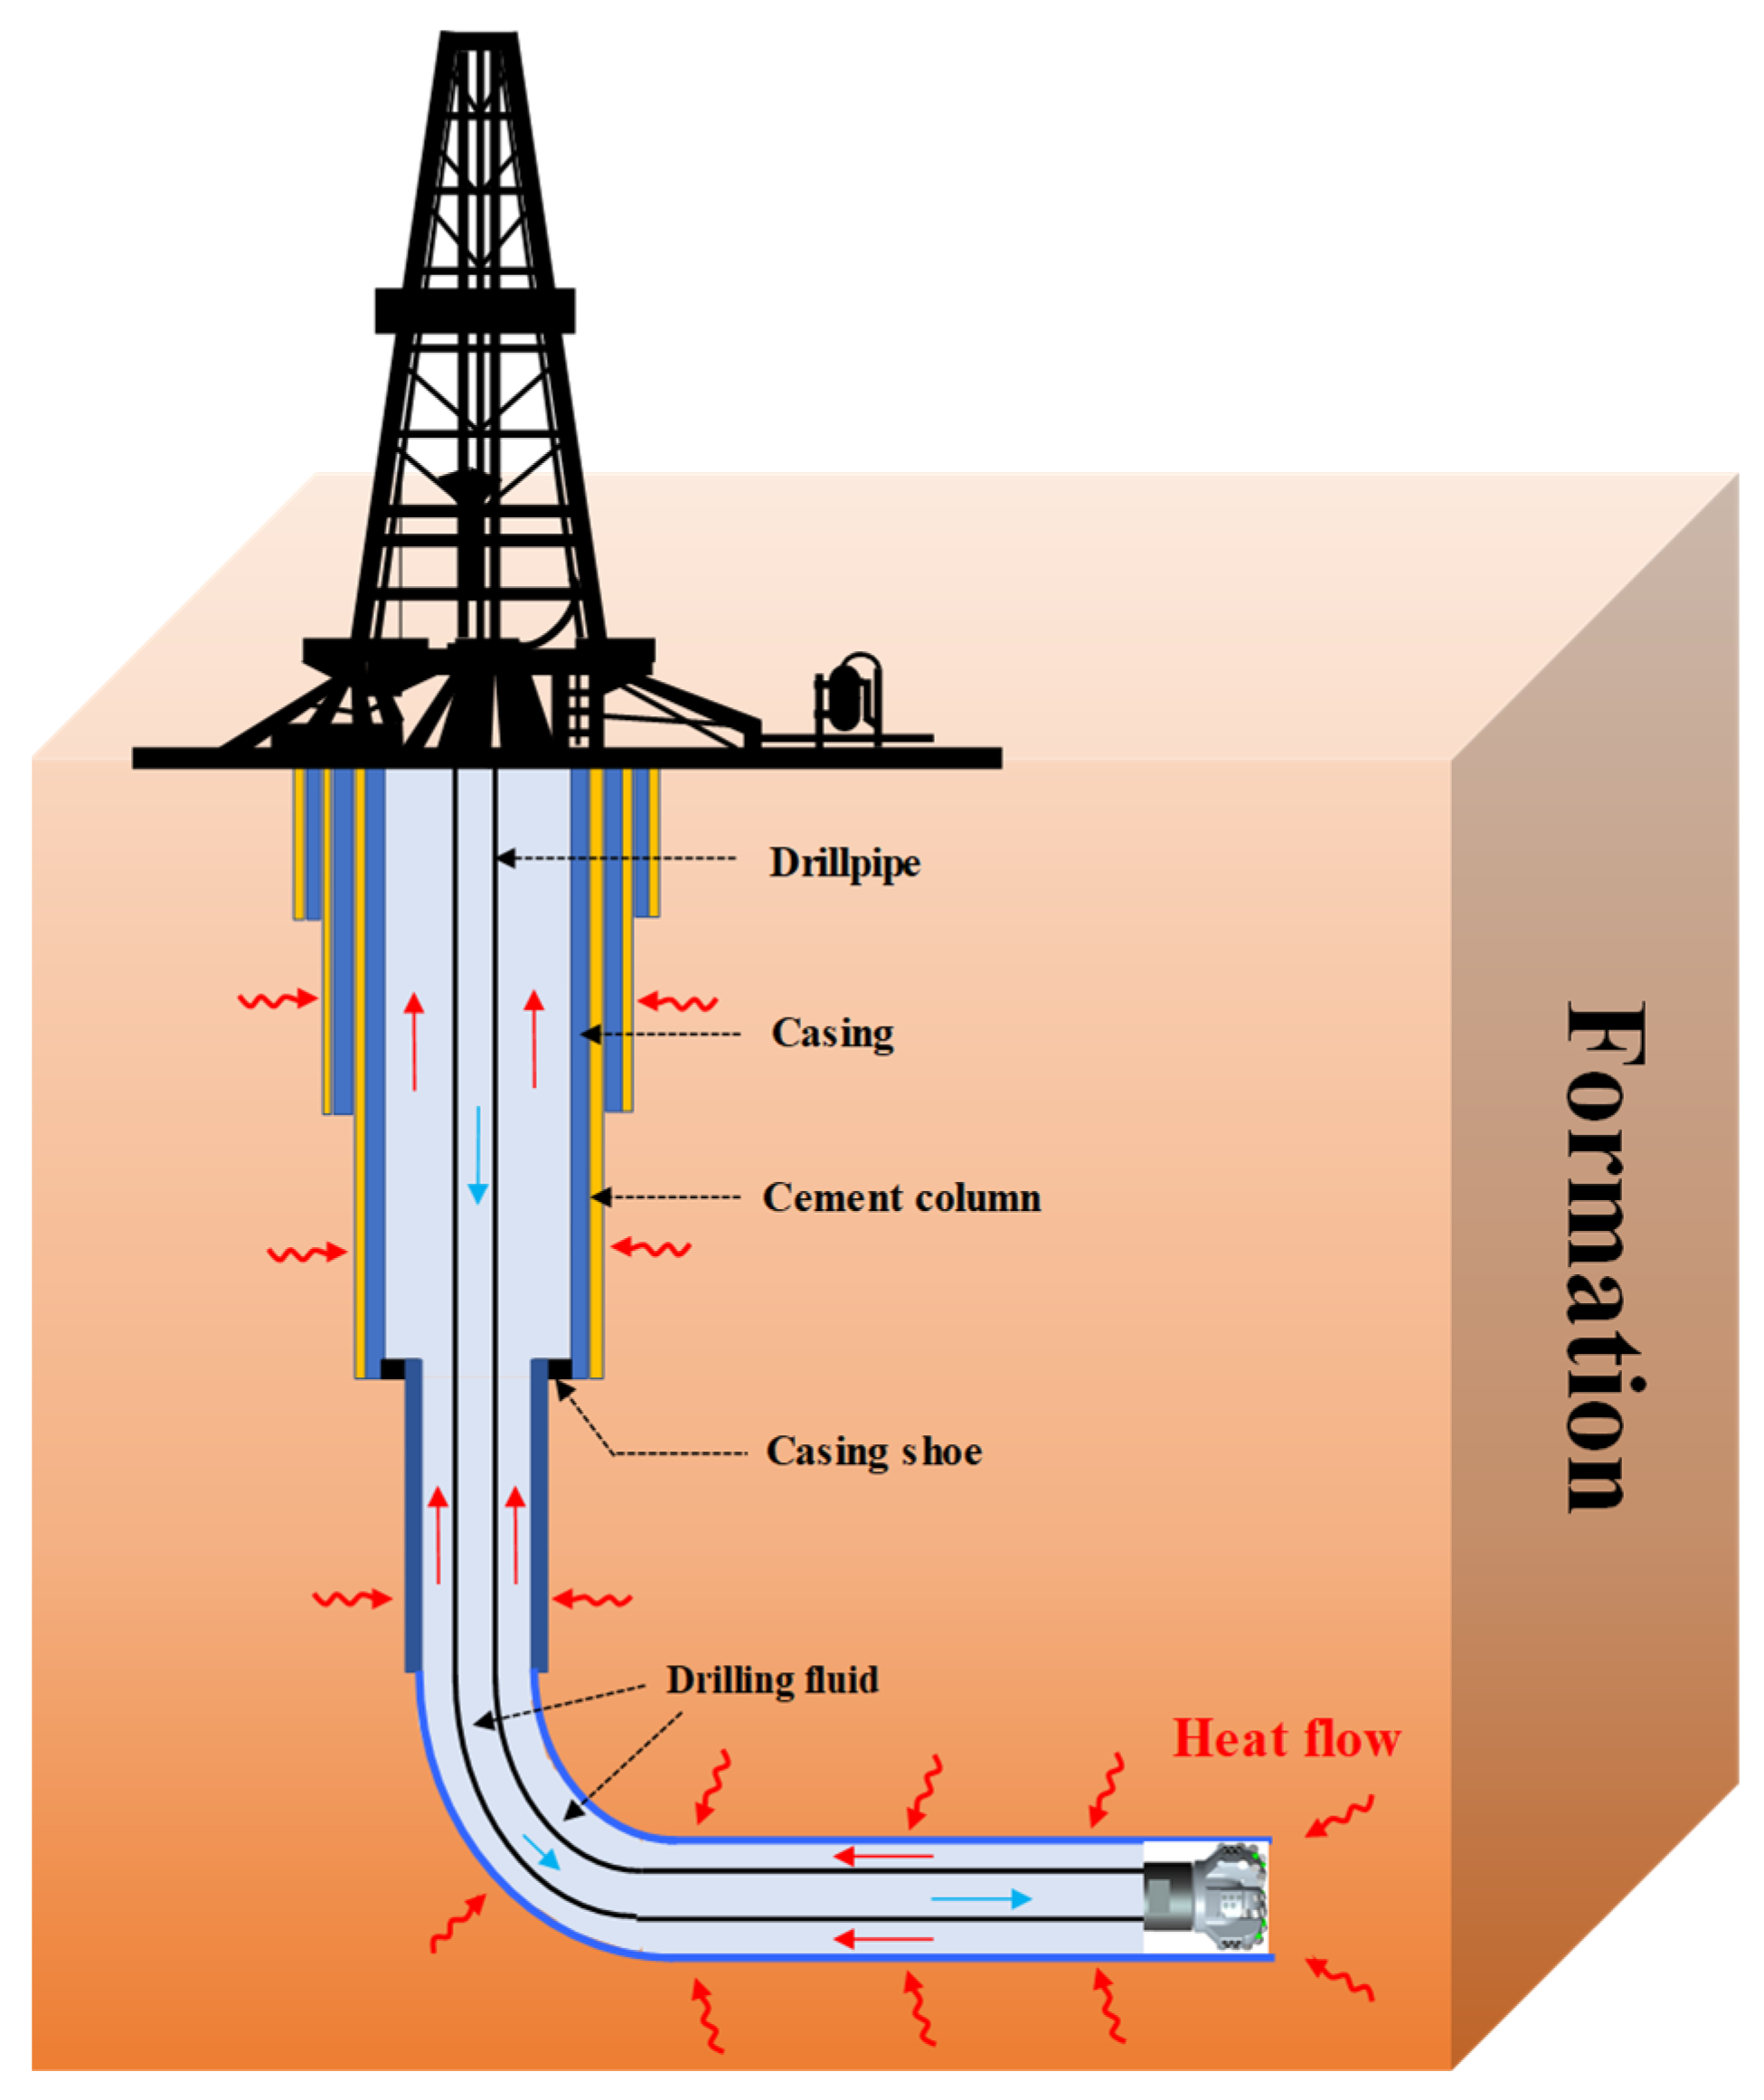
2.1. Physical Model

During the drilling process, the drilling fluid discharged from the mud pump reaches the wellhead through the ground circulation system and then flows from the wellhead through the kelly, drill pipe, and drill collar to the drill bit, where it is sprayed through the drill nozzle. It then flows upward through the annulus between the drill pipe and the casing (or well wall) and returns to the ground, as shown in Figure 1. The flow of drilling fluid in the downhole circulation system is mainly divided into two stages: ① drilling fluid flows from the wellhead to the drill bit. ② drilling fluid returns from the bottom of the well to the ground.

2.2. Model Assumes

Based on the characteristics of drilling fluid circulation during horizontal drilling, the transient wellbore temperature field model is established based on the following basic assumptions:
  • The formation temperature varies linearly with well depth, and the effects of overflow, loss, and fluid phase transitions during the drilling process on the wellbore temperature distribution are not considered.
  • During rotary drilling, the friction heat generated by drill pipe buckling and rotation is not considered. The drill pipe is centered in the wellbore, and the wellbore trajectory has a regular geometric shape.
  • Fluid conduction along the axial direction and radial temperature gradients within the fluid are neglected, while axial heat conduction of the drill pipe and convective heat transfer between the fluid and the drill pipe wall in the radial direction are considered.
  • The thermophysical parameters of the fluid, formation and various heat transfer media in the wellbore remain constant, and the influence of fluid flow in the formation pores on the formation temperature distribution is neglected.
It is worth noting that the elimination of the effects of overflow, leakage, and fluid phase transition is mainly because these factors may not be the main influencing factors during drilling, and introducing these complex factors into the simulation will greatly increase the complexity and uncertainty of the model.

2.3. Mathematical Model

Based on the research of Raymond [11], Marshall & Bentsen [12], and Yang [32], etc., this paper takes a thermal equilibrium infinitesimal dz in the direction of the wellbore axis at depth z and time t. The heat exchange between various media downholes is shown in Figure 2. When the drilling fluid flows downward along the drill pipe from the wellhead at a certain temperature (Tp), its temperature change depends on the heat exchange with the annular drilling fluid in the radial direction (Qap), as well as the external work performed on it (dW1), which includes friction heat generated during the downward movement of the drilling fluid (QfD), heat generated by the rotation of the drill pipe (Qrd), heat from bit breaking rock (Qrg), and heat generated by the drilling fluid passing through the nozzle (Qnp). When the drilling fluid enters the annulus after passing through the drill bit and returns upward, its temperature change depends on the heat exchange with the drilling fluid inside the drill pipe and the formation in the radial direction (Qla), as well as the external work done on it (dW2), such as the friction heat generated during the upward flow of the annular drilling fluid (Qfa).
Taking the thermal equilibrium microfacies formation, fluid in the annulus, drill pipe wall, and fluid within the drill pipe as research objects, considering the influence of heat sources on the transient temperature field of the wellbore, and based on the conservation of energy, transient heat transfer mathematical models are established.

2.3.1. Temperature Model of Mud in Drill Pipe

There are two parts of heat change of drilling fluid in the drill pipe in the axial direction: ① inflow heat Qp(z). ② outflow heat Qp(z + dz).
In time dt, the net heat imported and exported by the drilling fluid in the drill pipe in the axial direction is
d Q 1 = Q p z Q p z + d z = ρ l c l q T p z , t T p z + d z , t d t
where ρl is the density of drilling fluid in the drill pipe, kg/cm3. cl refers to the specific heat capacity of drilling fluid in the drill pipe, j/(kg·°C). q refers to the mass flow of drilling fluid, kg/s. Tp refers to the drilling fluid temperature in the drill pipe, °C. z is the well depth, m. t is time, s.
In time dt, the heat exchanged between the drilling fluid in the drill pipe and the inner wall of the drill pipe in the radial direction by convection heat exchange is
d Q 2 = 2 π r pi h pi T d z , t T p z , t d z d t
where rpi is the inner radius of the drill pipe, m. hpi refers to the convective heat transfer coefficient of the inner wall of the drill pipe, W/(m2·°C). Td refers to the temperature of the drill pipe wall, °C.
The change of heat in the drilling fluid inside the drill pipe in the radial direction is the heat transferred from the annular drilling fluid, and the change of heat caused by the internal heat source is the viscous dissipation heat generated by the flow of drilling fluid.
In time dt, the work performed by friction caused by fluid flow in the drill pipe is
d W = Q fp d z d t
where Qfp refers to the heat generated by friction in the drill pipe, W/m.
In time dt, the increment of energy in the infinitesimal control body is
d E = ρ l c l T p t π r pi 2 d t d z
According to the first law of thermodynamics, the net heat imported and exported into and out of the infinitesimal element plus the heat generated by the heat source within the infinitesimal element equals the increase in internal energy of the infinitesimal element. Therefore, the temperature model of mud in drill pipe is as follows:
Q fp ρ l q c l T p z 2 π r pi h pi T p T d = ρ l c l π r pi 2 T p t

2.3.2. Temperature Model of Drill Pipe and Drill Bit

The drill pipe wall exchanges heat through convection with the drilling fluid inside and outside the drill pipe radially while conducting heat axially through heat conduction. Based on the first law of thermodynamics, the temperature model of the drill pipe and drill bit can be established as follows:
λ d 2 T d z 2 + 2 r po h po r po 2 r pi 2 T a T d + 2 r pi h pi r po 2 r pi 2 T p T d + Q r g = ρ d c d T d t
where ρd d is the density of the drill pipe, kg/m3. cd refers to the specific heat capacity of the drill pipe, J/(kg·°C). λd is the thermal conductivity of the drill pipe, W/(m·°C). rpo is the outer radius of the drill pipe, m. Ta refers to the temperature of drilling fluid in the annulus, °C.
The mathematical expression of friction heat generated by the bit and the formation is [31,33]
Q r g = ξ f W N D 2 + D d + d 2 74.3 ( D + d )
where ξ is the correction factor. Qrg is the friction heat generated by the bit and the formation, W. f is the friction coefficient between the bit and the formation. W is the weight on the drill bit, kN. N is the RPM, r/min. D is the outer diameter of the drill bit, m. d is the inner diameter of the drill bit, m.

2.3.3. Temperature Model of Annular Mud

The heat inflow and outflow of the drilling fluid in the annulus in the axial direction are Qa(z + dz) and Qa(z). According to the first law of thermodynamics, the temperature model of annular mud is
ρ l q c l T a z + 2 π r w U w T f T a + 2 π r po h po T d T a + Q fa = ρ l c l π r w 2 r po 2 T a t
where hpo is the convective heat transfer coefficient of the outer wall of the drill pipe, W/(m2·°C). Uw is the comprehensive heat transfer coefficient.

2.3.4. Temperature Model of Formation near Well

In the cylindrical coordinate system, the differential equation of formation heat conduction can be expressed as follows [22]:
2 T f r 2 + 1 r T f r + 2 T f z 2 = ρ f c f λ f T f t
where r is the radial distance, m. λf is the formation thermal conductivity, W/(m·K). cf is the specific heat capacity of rock, J/(kg·°C). ρf is the rock density, kg/m3. Tf refers to the formation temperature, °C.

2.4. Initial Condition and Boundary Condition

Considering the characteristics of horizontal well drilling, definite solution conditions are given for the vertical section, oblique section, and horizontal section of the horizontal well.

2.4.1. Initial-Boundary Condition of Vertical Section

In the vertical section, the initial temperature of each heat transfer unit is assumed to be equal to the original formation temperature, as shown in Equation (10).
T p z , t = 0 = T d z , t = 0 = T a z , t = 0 = T f r , z , t = 0 = T s + G T z
At the wellhead (z = 0), the drilling fluid inlet temperature and the drilling fluid outlet temperature can be measured by wellhead instruments and equipment, which are as follows:
T p z = 0 , t = T in T a z = 0 , t = T out
At the kick-off point (z = Hkop), the temperature at the end of the vertical section is equal to the temperature at the beginning of the oblique section, which can be expressed as
T p z = H kop , t = T p _ kop T a z = H kop , t = T a _ kop
where Tp_kop refers to the drilling fluid temperature in the drill pipe at the kick-off point, °C. Ta_kop refers to the drilling fluid temperature in the annulus at the kick-off point, °C.

2.4.2. Initial-Boundary Value Condition of Oblique Section

In the oblique section, the initial temperature of each unit is the same as that of the formation, as shown in Equation (13).
T p z , t = 0 = T d z , t = 0 = T a z , t = 0 = T f r , z , t = 0
The temperature at the end of the oblique section is the same as the beginning of the horizontal section, which can be expressed as
T p z = H end , t = T p _ end T a z = H end , t = T a _ end
where Hkop is the well depth of the kick-off point, m. Hend is the well depth at the beginning of the horizontal section, m. Tp_end is the drilling fluid temperature in the drill pipe at the beginning of the horizontal section, °C. Ta_end is the drilling fluid temperature in the annulus at the beginning of the horizontal section, °C.

2.4.3. Initial-Boundary Condition of Horizontal Segment

In the horizontal section, the initial temperature of each unit is the same as that of the formation, as shown in Equation (13).
At the far boundary of the formation, the formation temperature is not affected by the wellbore heat transfer, and the formation temperature is the original formation temperature, which is
T f r , z , t r r = 0
At the junction of the formation and the wellhole, the heat that the formation flows into the borehole through the borehole wall in the form of heat conduction is equal to the heat that the borehole wall exchanges with the annular drilling fluid in the radial direction through heat convection, which can be expressed as
λ f T f r , z , t r r = r w = h w T f r w , z , t T a z , t

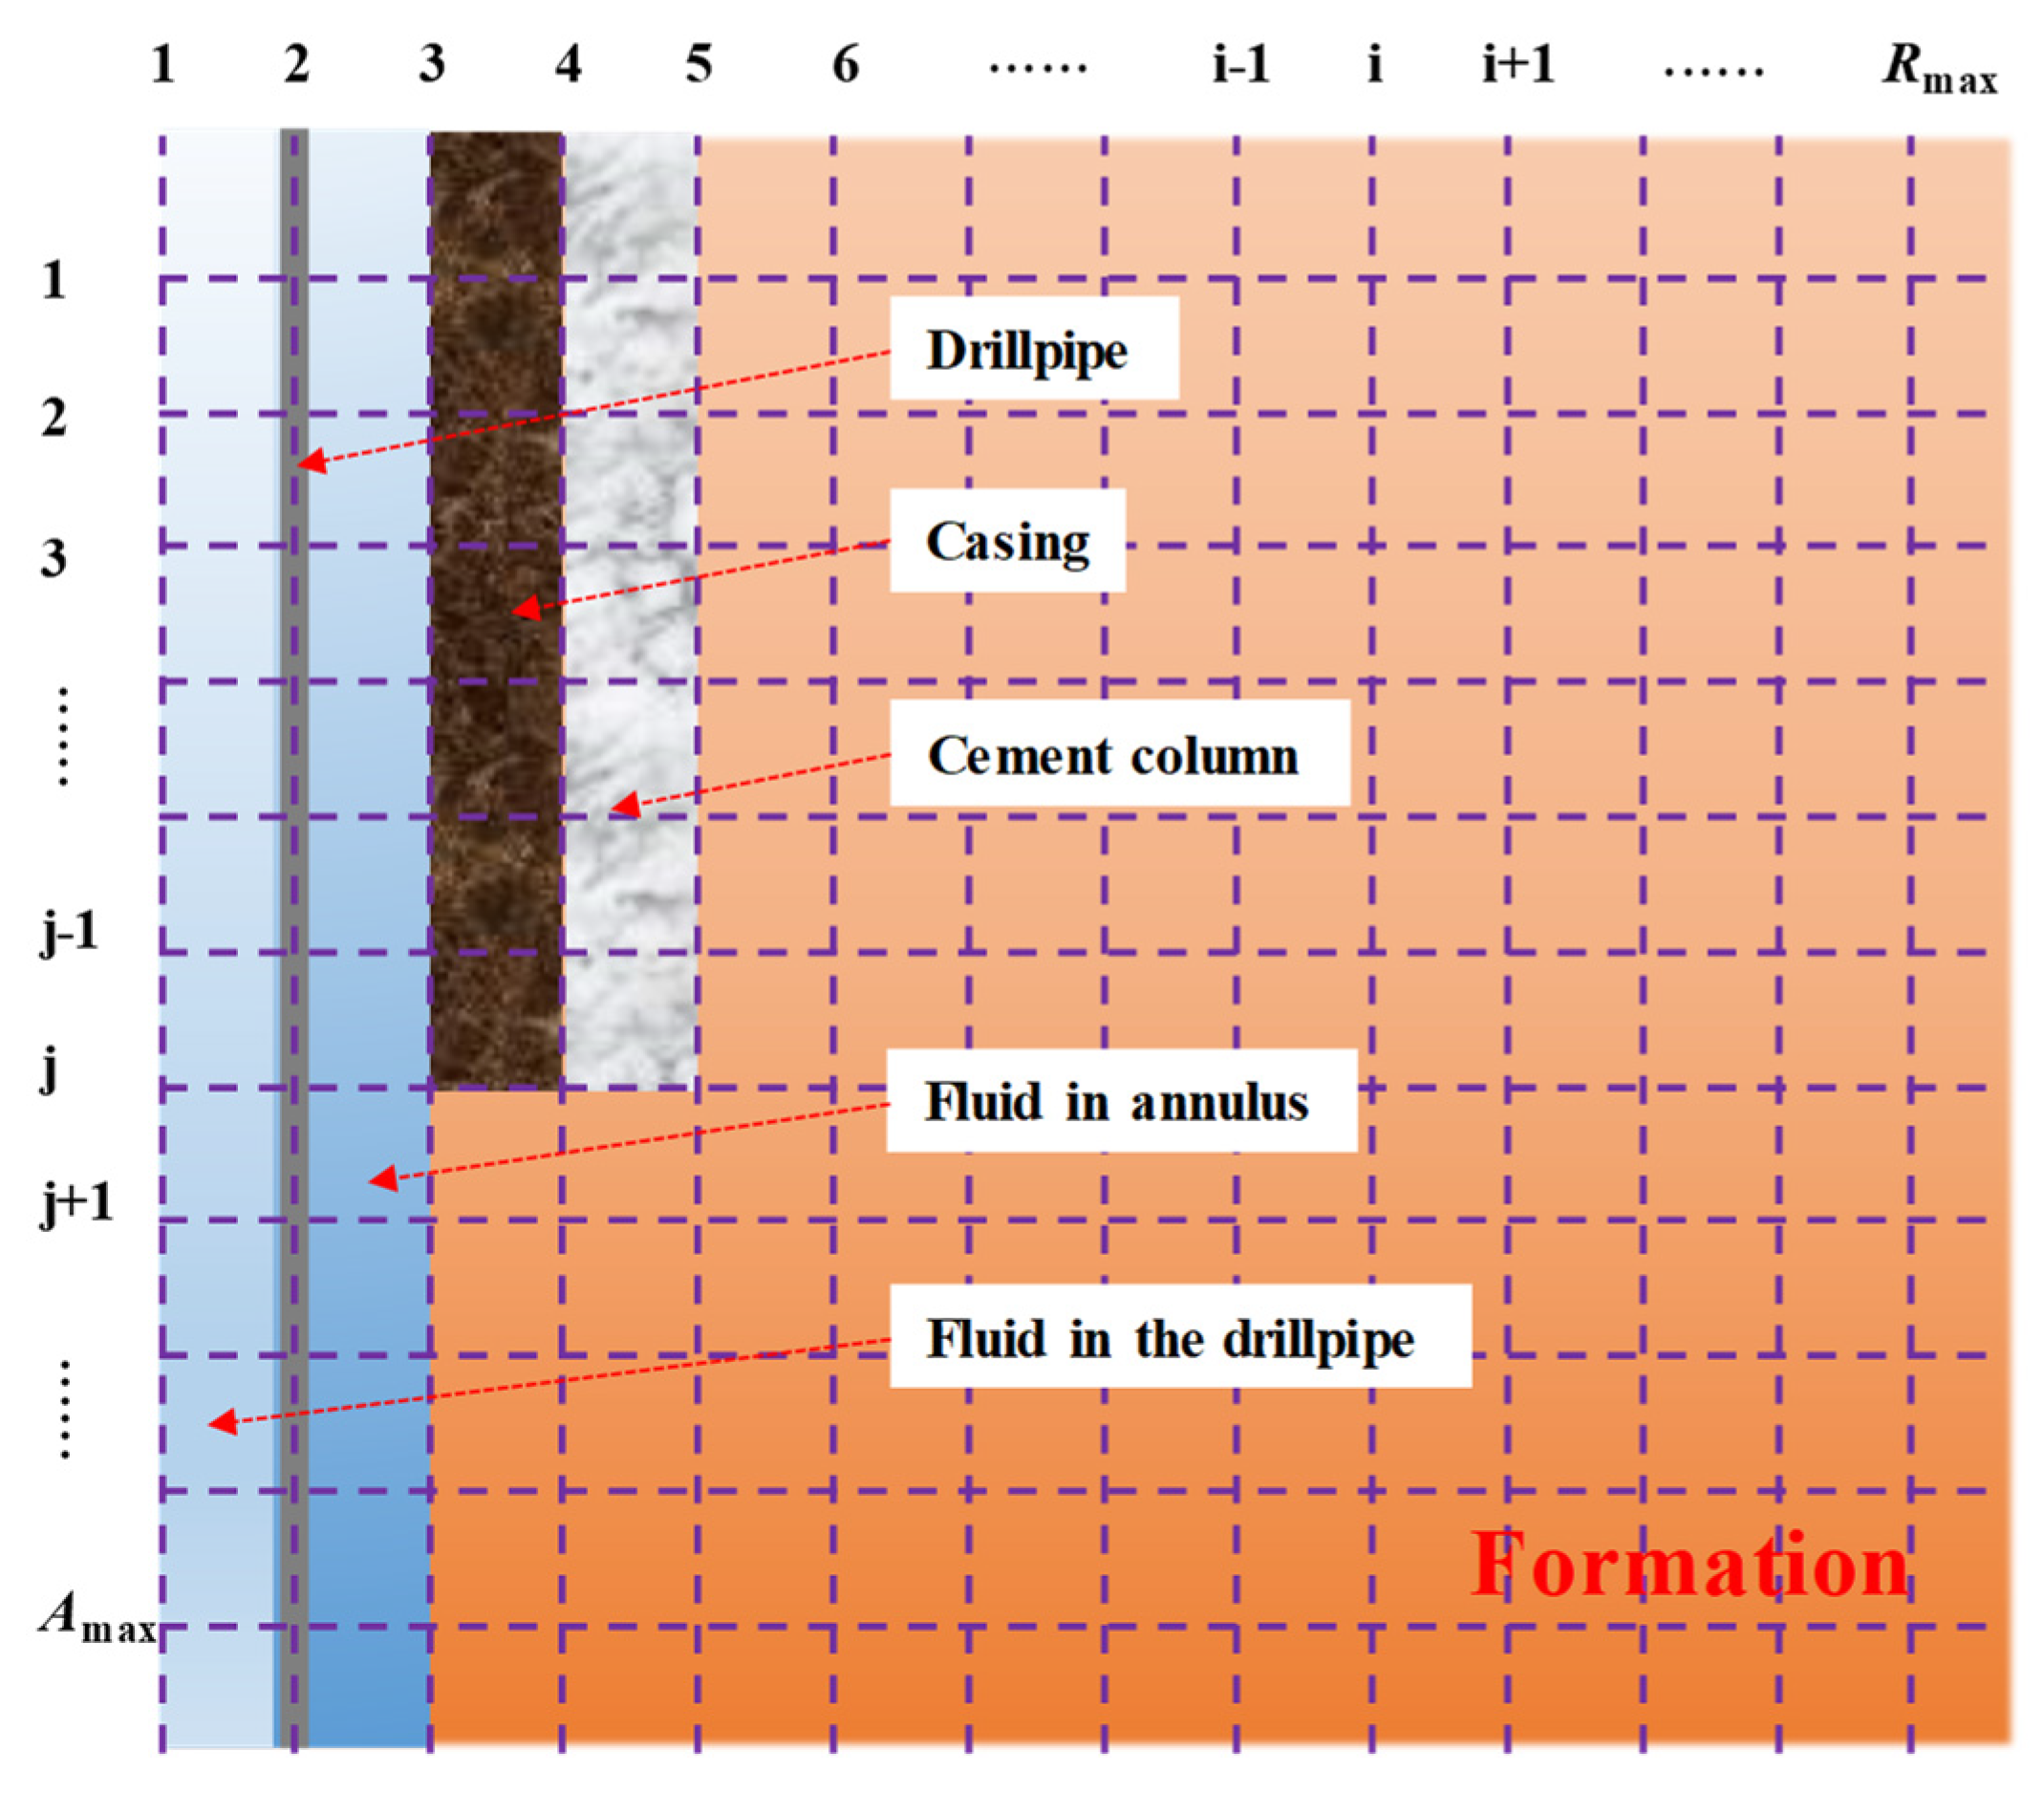
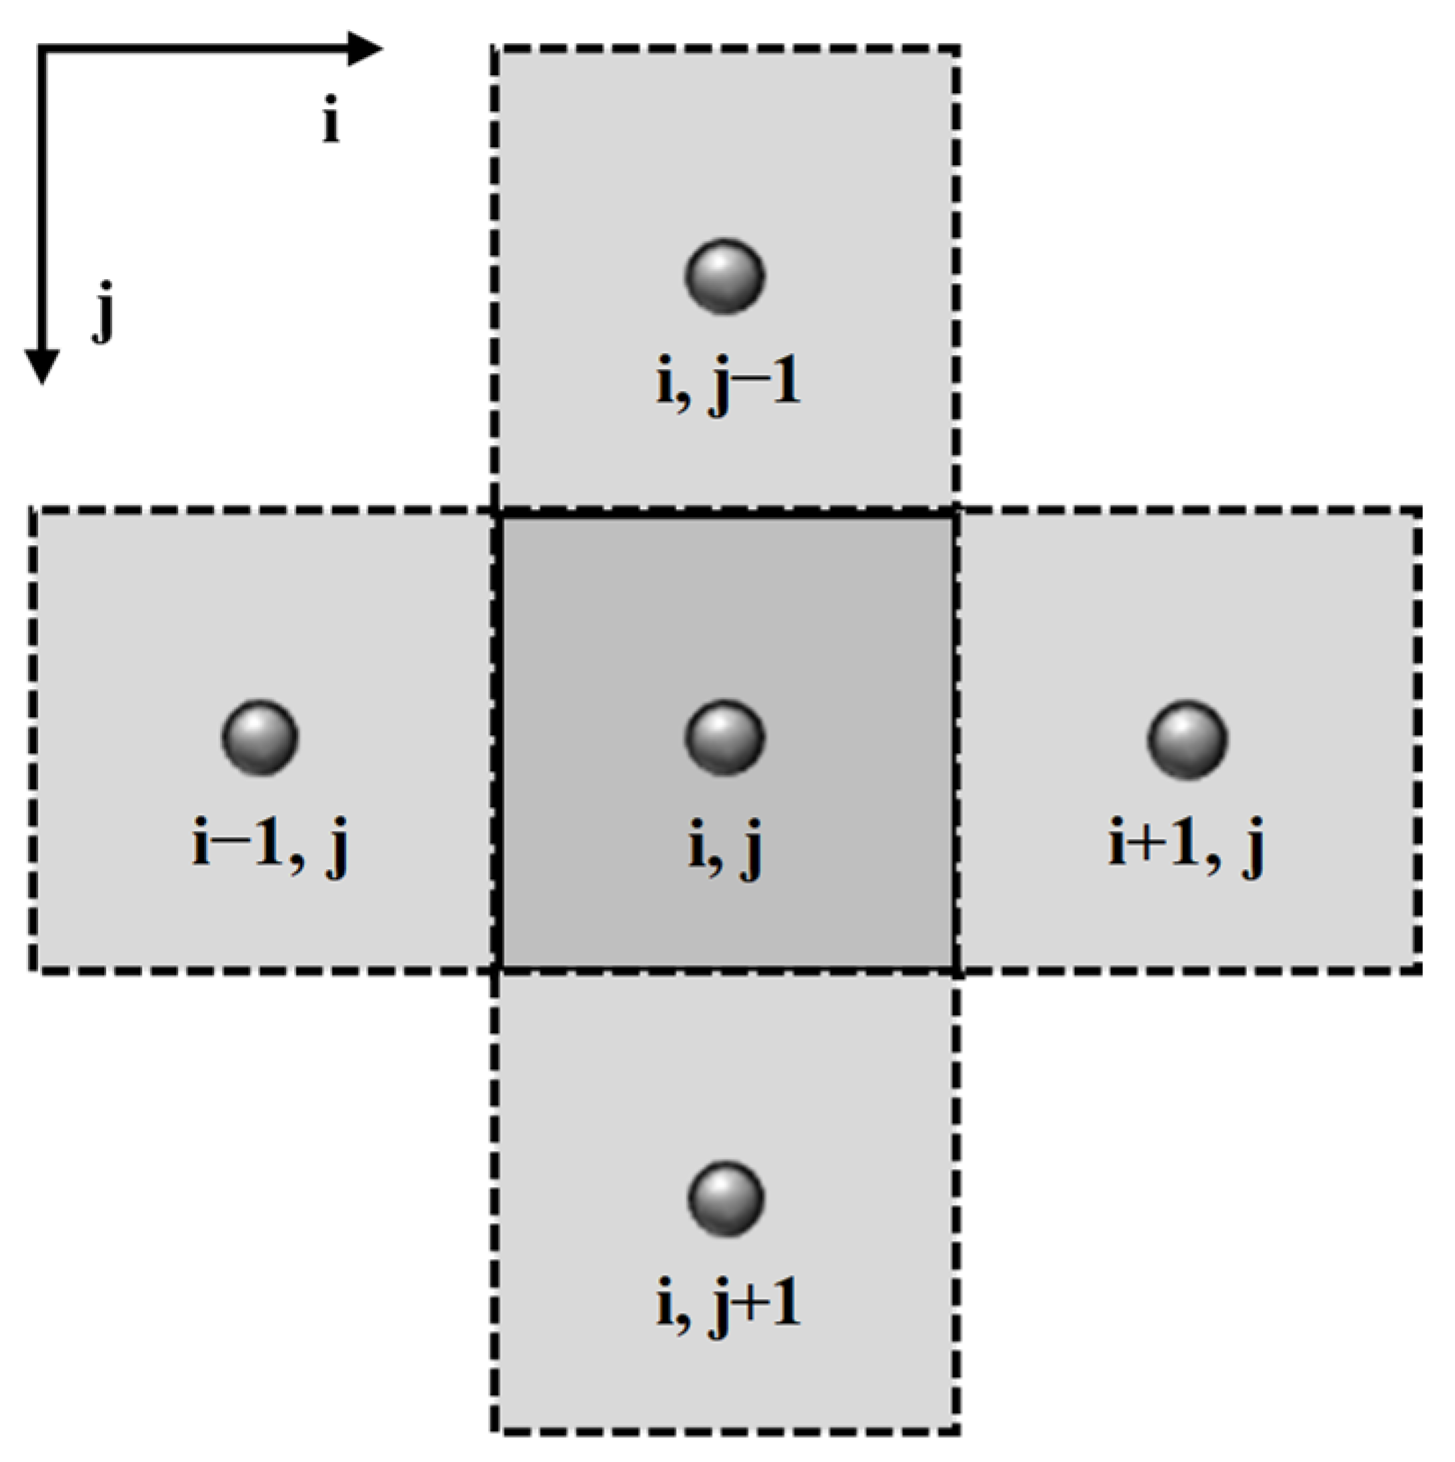
2.5. Model Discretization and Solution

The mathematical model of the transient temperature field in the wellbore is too complex. Despite a series of simplifications made during the modeling process and the determination of initial conditions and boundary conditions, the analytical solution of the control equation is still unavailable at present. Therefore, the finite difference method is adopted in this paper to solve the problem.
The solution domain of the control equations includes the wellbore and the formation. The entire two-dimensional surface area is discretized in the axial and radial directions (as shown in Figure 3), and difference equations are established at the nodes of each grid. For programming convenience, Tp, Td, and Ta are denoted as T1, T2, and T3, respectively. Symbols n, i, and j represent the time number, radial grid number, and axial grid number, respectively.
Therefore, the differential equations of the wellbore transient temperature field can be expressed as Equations (17) to (20).
① Drilling fluid in drill string:
Q p ρ l q c l T 1 , j n + 1 T 1 , j 1 n + 1 Δ z 2 π r pi h pi T 1 , j n + 1 T 2 , j n + 1 = ρ l c l π r pi 2 T 1 , j n + 1 T 1 , j n Δ t
② Drill string wall:
λ d T 2 , j + 1 n + 1 2 T 2 , j n + 1 + T 2 , j 1 n + 1 Δ z 2 + 2 r po h po r po 2 r pi 2 T 3 , j n + 1 T 2 , j n + 1 + 2 r pi h pi r po 2 r pi 2 T 1 , j n + 1 T 2 , j n + 1 = ρ d c d T 2 , j n + 1 T 2 , j n Δ t
③ Drilling fluid in annulus:
ρ l q c l T 3 , j n + 1 T 3 , j 1 n + 1 Δ z + 2 π r w U w T 4 , j n + 1 T 3 , j n + 1 + 2 π r co h co T 2 , j n + 1 T 3 , j n + 1 + Q a = ρ l c l π r w 2 r po 2 T 3 , j n + 1 T 3 , j n Δ t
④ Formation:
T i + 1 , j n + 1 2 T i 1 , j n + 1 + T i 1 , j n + 1 Δ r 2 + 1 r i T i , j n + 1 T i , j 1 n + 1 Δ r + T i , j + 1 n + 1 2 T i , j n + 1 + T i , j 1 n + 1 Δ z 2 = ρ f c f λ f T i , j n + 1 T i , j n Δ t i 4
Since Equations (17) to (20) adopt fully implicit difference discretization, Tp, Td, and Ta cannot be directly solved. Typically, the above difference equations are integrated as follows [33]:
W i , j T i 1 , j n + 1 + C i , j T i , j n + 1 + E i , j T i + 1 , j n + 1 + N i , j T i , j 1 n + 1 + S i , j T i , j + 1 n + 1 = B i , j
The naming rule for the coefficients in Equation (21) is shown in Figure 4. If the number of nodes along the axis is Amax, and the number of nodes in the radial direction is Rmax, then all nodes are substituted into Equation (21). Integrating all the nodes, we can obtain the matrix Equation (22). Obviously, this coefficient matrix is a pentadiagonal sparse matrix, which can be solved using the chase method.
C E S W C E S W C E S W C E S N W C E N W C E N W C E N W C A max R max × A max R max T 1 , 1 n + 1 T 2 , 1 n + 1 T i 1 , j n + 1 T i , j n + 1 T i , j n + 1 T i + 1 , j n + 1 T A max 1 , R max n + 1 T A max , R max n + 1 = B 1 , 1 B 2 , 1 B i 1 , 1 B i , j B i , j B i + 1 , j B A max 1 , R max B A max , R max

3. Results and Discussion

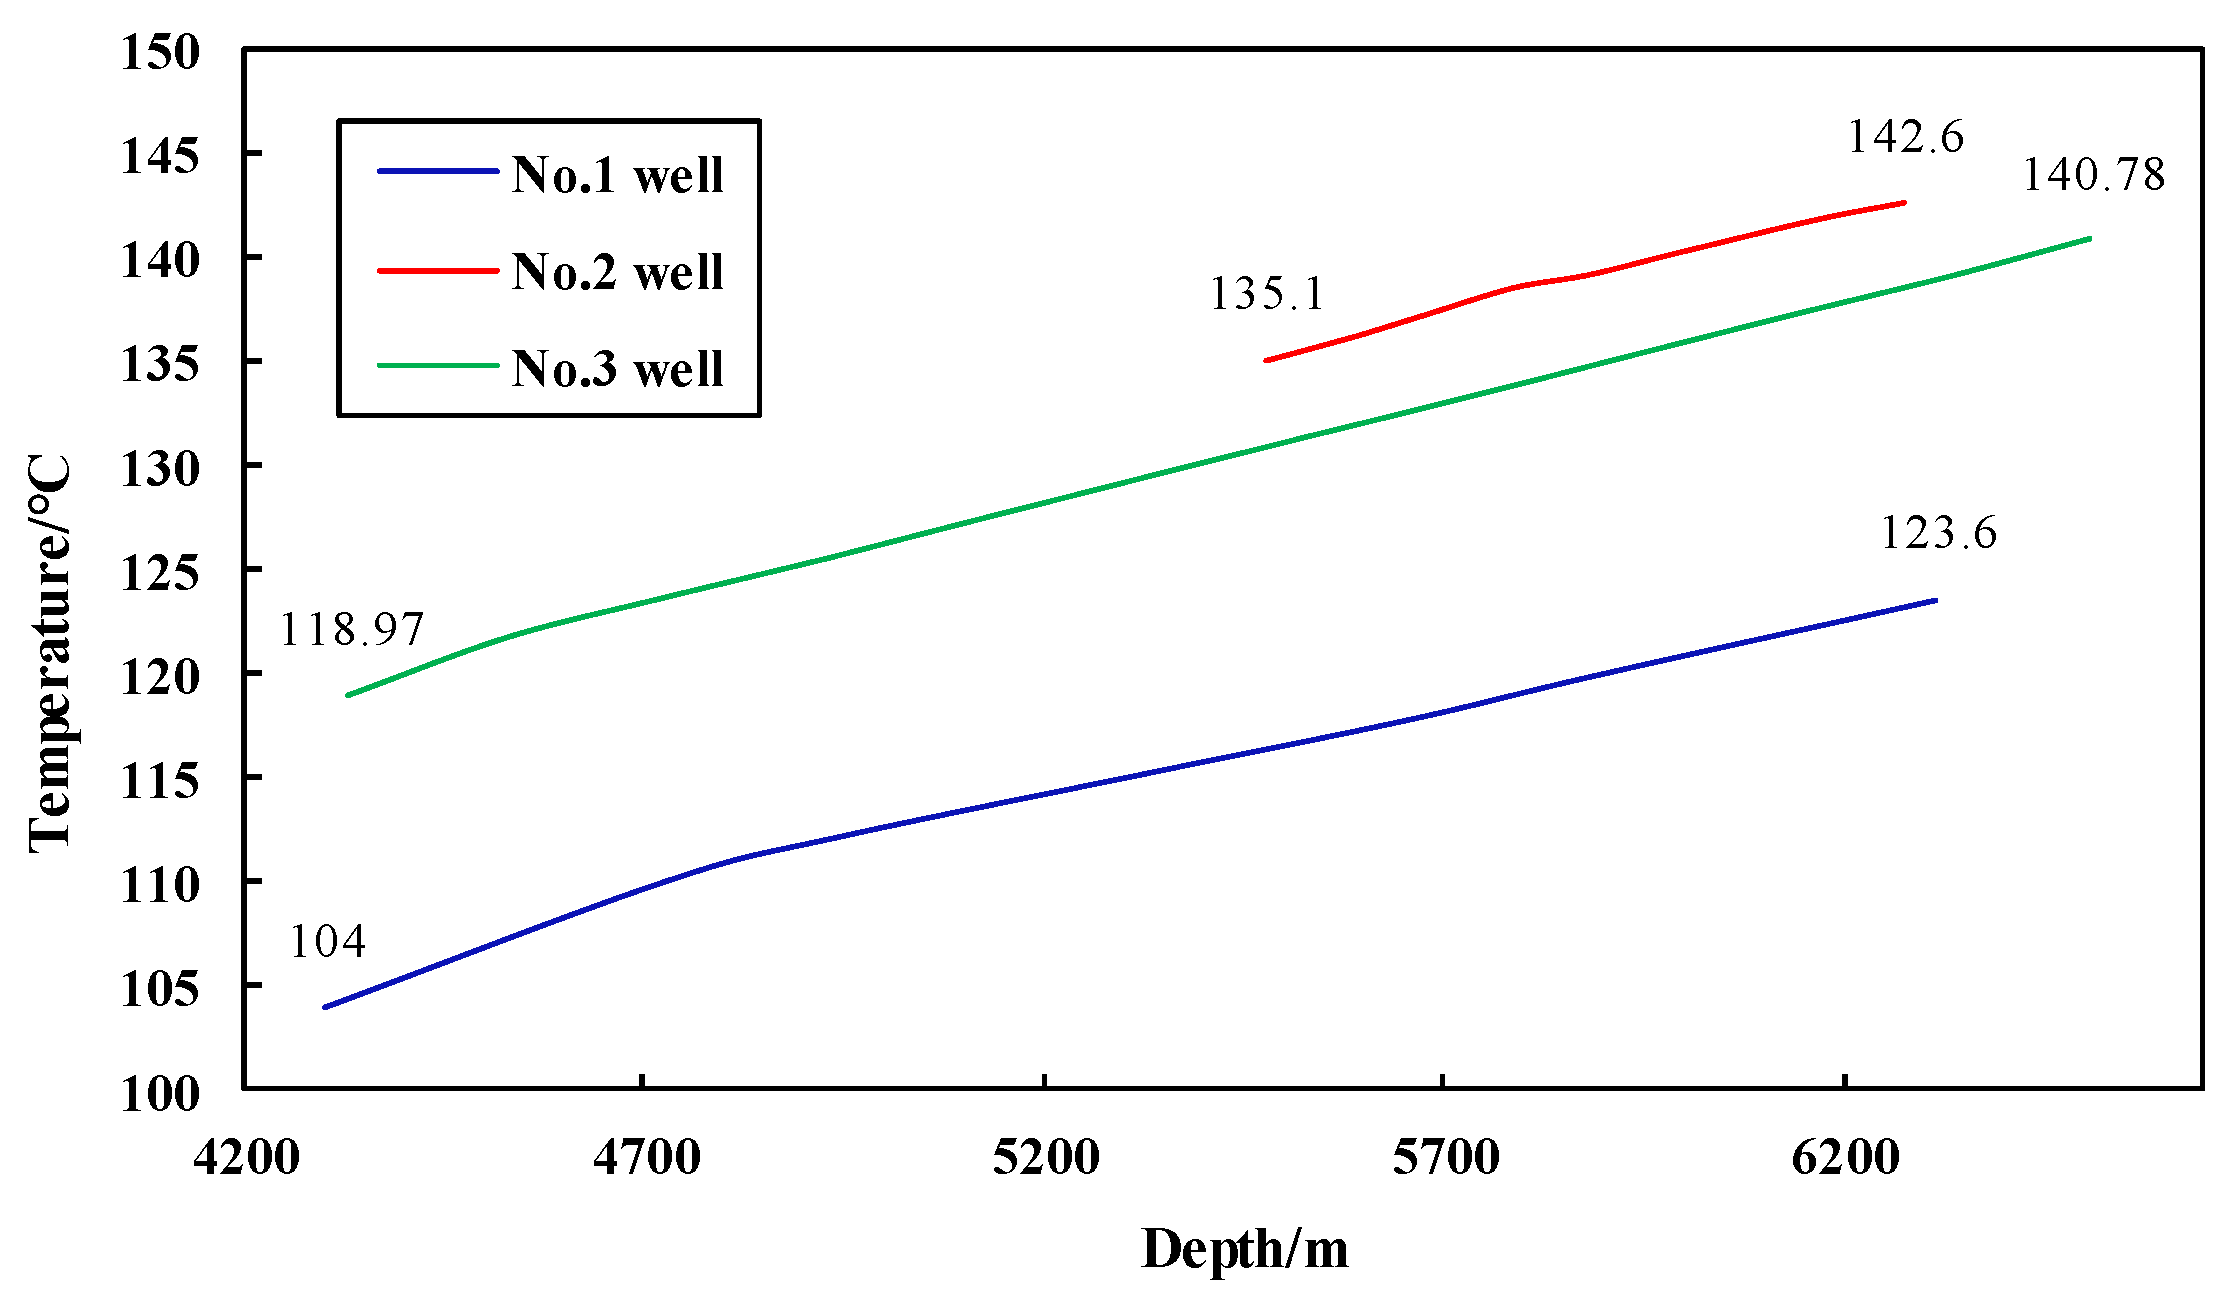
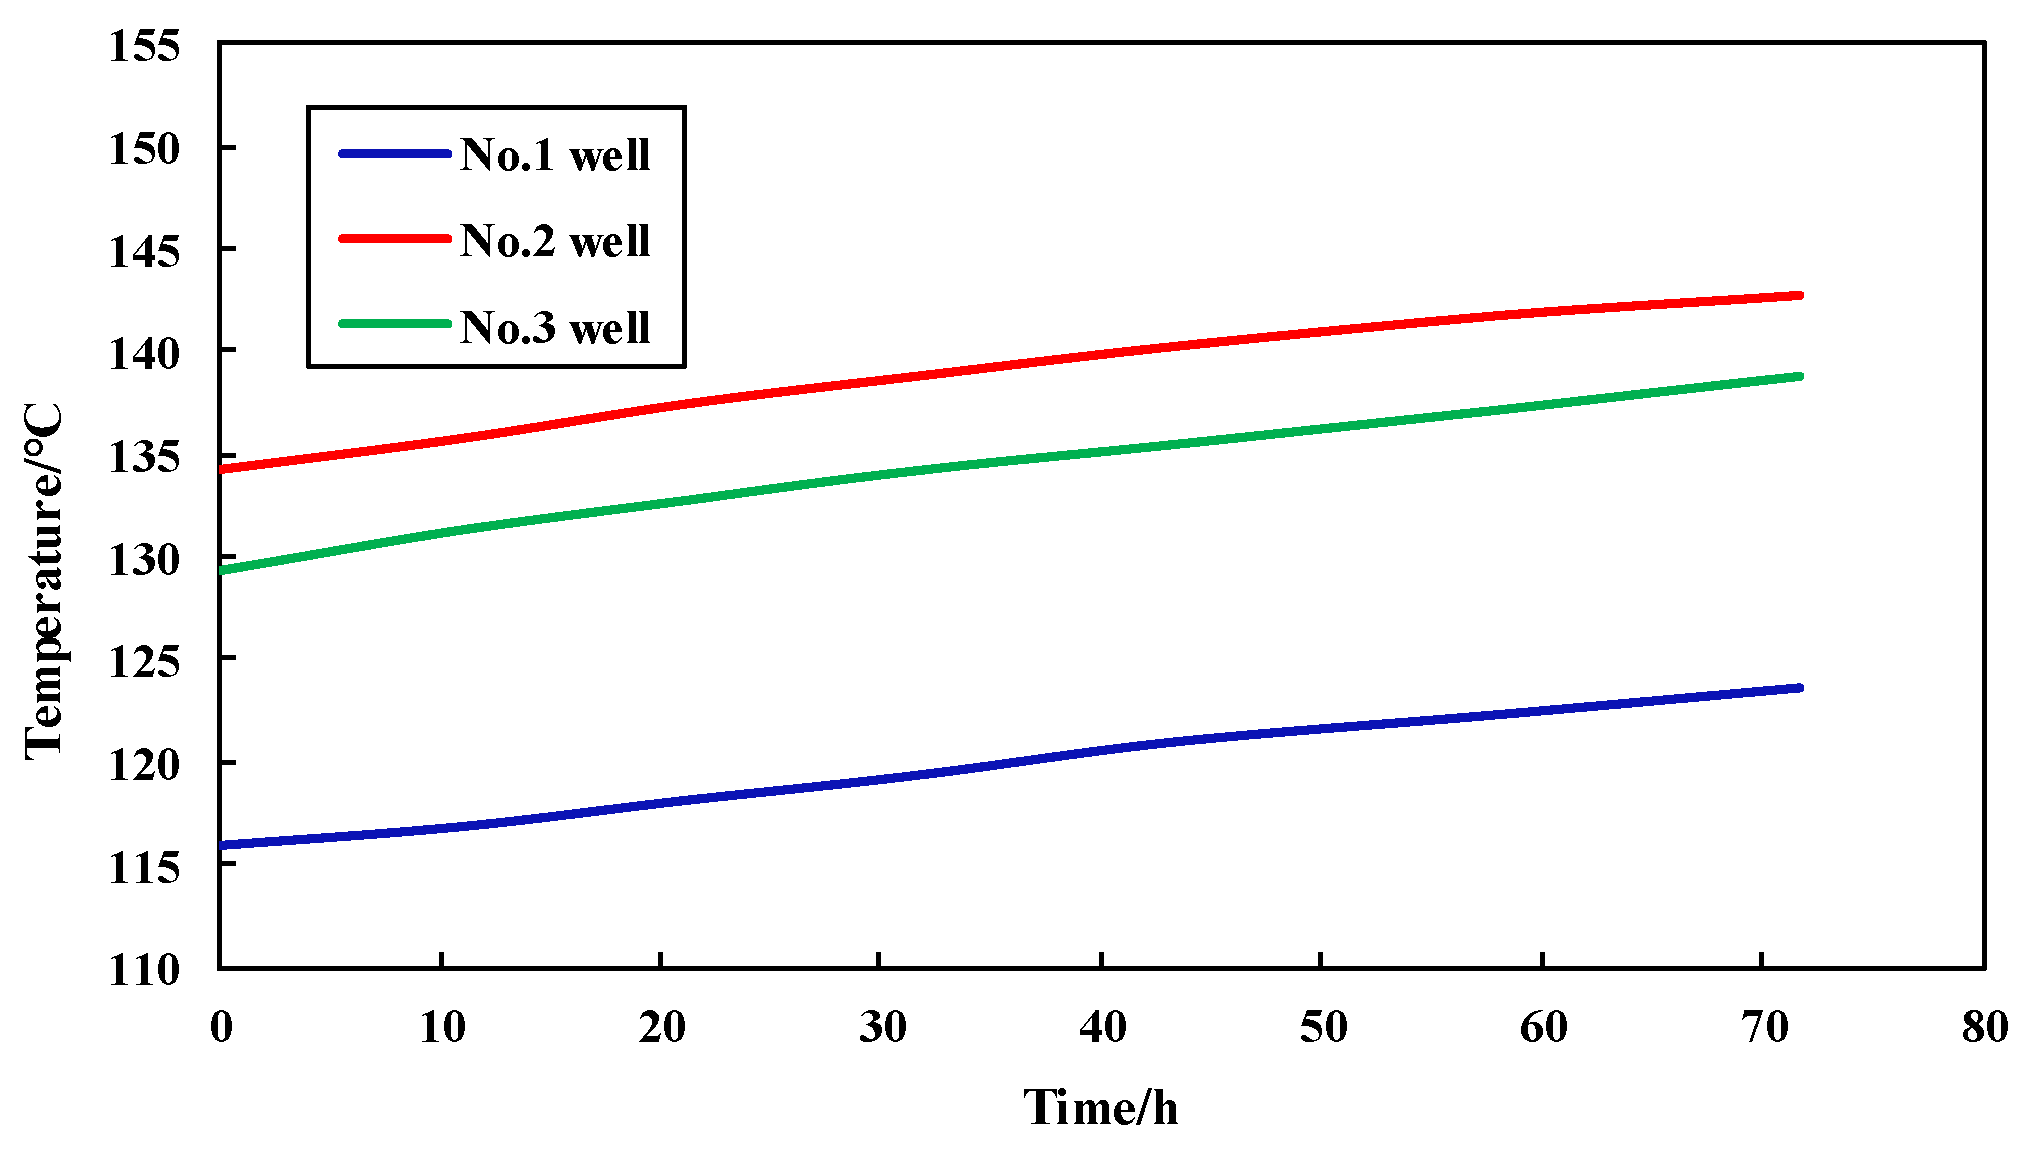
3.1. Modeling Verification

To validate the model, we will verify its applicability through comparison with actual field measurement data. Three horizontal wells in Chongqing, China, were selected. Table 1 shows the temperature parameters of the validation model. The simulation parameters were consistent with the actual field data, and the simulation results are shown in Figure 5. The root mean square error (RMSE) of the predicted and measured results was calculated. The RMSE between the measured data and simulation results for No.1 well from 4300 m to 6320 m (horizontal section) was 1.05 °C. The RMSE for No.2 well from 5470 m to 6270 m (horizontal section) was 0.54 °C. The RMSE for No.3 well from 4330 m to 6510 m (horizontal section) was 0.99 °C. The results indicate that the temperature difference between the measured data and the predicted results is less than 6 °C, with an error of less than 5%. Therefore, this model demonstrates high prediction accuracy for wellbore temperature during horizontal well drilling.

3.2. Sensitivity Analysis of Key Parameters

This paper uses No.2 well, which has the highest prediction accuracy, as a field case to investigate the influence of BHA, drill pipe size, drilling fluid density, flow rate, inlet temperature of drilling fluid, and drilling fluid circulation time on the temperature distribution in the wellbore annulus. The relevant parameters of No.2 well are shown in Table 2, Table 3, Table 4 and Table 5.

3.2.1. Influence of BHA

Figure 6 shows the temperature change with well depth during drilling in the shale gas horizontal section with a PDM. In order to avoid the impact of single data on the analysis results, this section analyzes the temperature changes with well depth in the horizontal sections of three wells. It can be seen that the No.1 well increased from 104 °C to 123.6 °C in the well section from 4300 m to 6320 m (the length is 2020 m), with an increase of about 0.970 °C/100 m. No.2 well increased from 135.1 °C to 142.6 °C in the well section from 5470 m to 6270 m (the length is 800 m), with an increase of about 0.938 °C/100 m. No.3 well increased from 118.97 °C to 140.78 °C in the well section from 6510 m to 4330 m (the length is 2180 m), with an increase of about 1.000 °C/100 m. The results show that the temperature increase during drilling in the shale gas horizontal section with a PDM is about 1 °C/100 m.
Taking No.2 well as an example, the temperature changes in annular at 0 r/min, 50 r/min, and 100 r/min were analyzed, as shown in Figure 7. It can be seen that when the RPM of PDM is 0 r/min, the bottom hole temperature is 139.60 °C. When the RPM of PDM is 50 r/min, the bottom hole temperature is 140.26 °C. When the RPM of PDM is 100 r/min, the bottom hole temperature is 140.93 °C. The results indicate that as the PDM rotation speed decreases, the bottom hole temperature decreases.

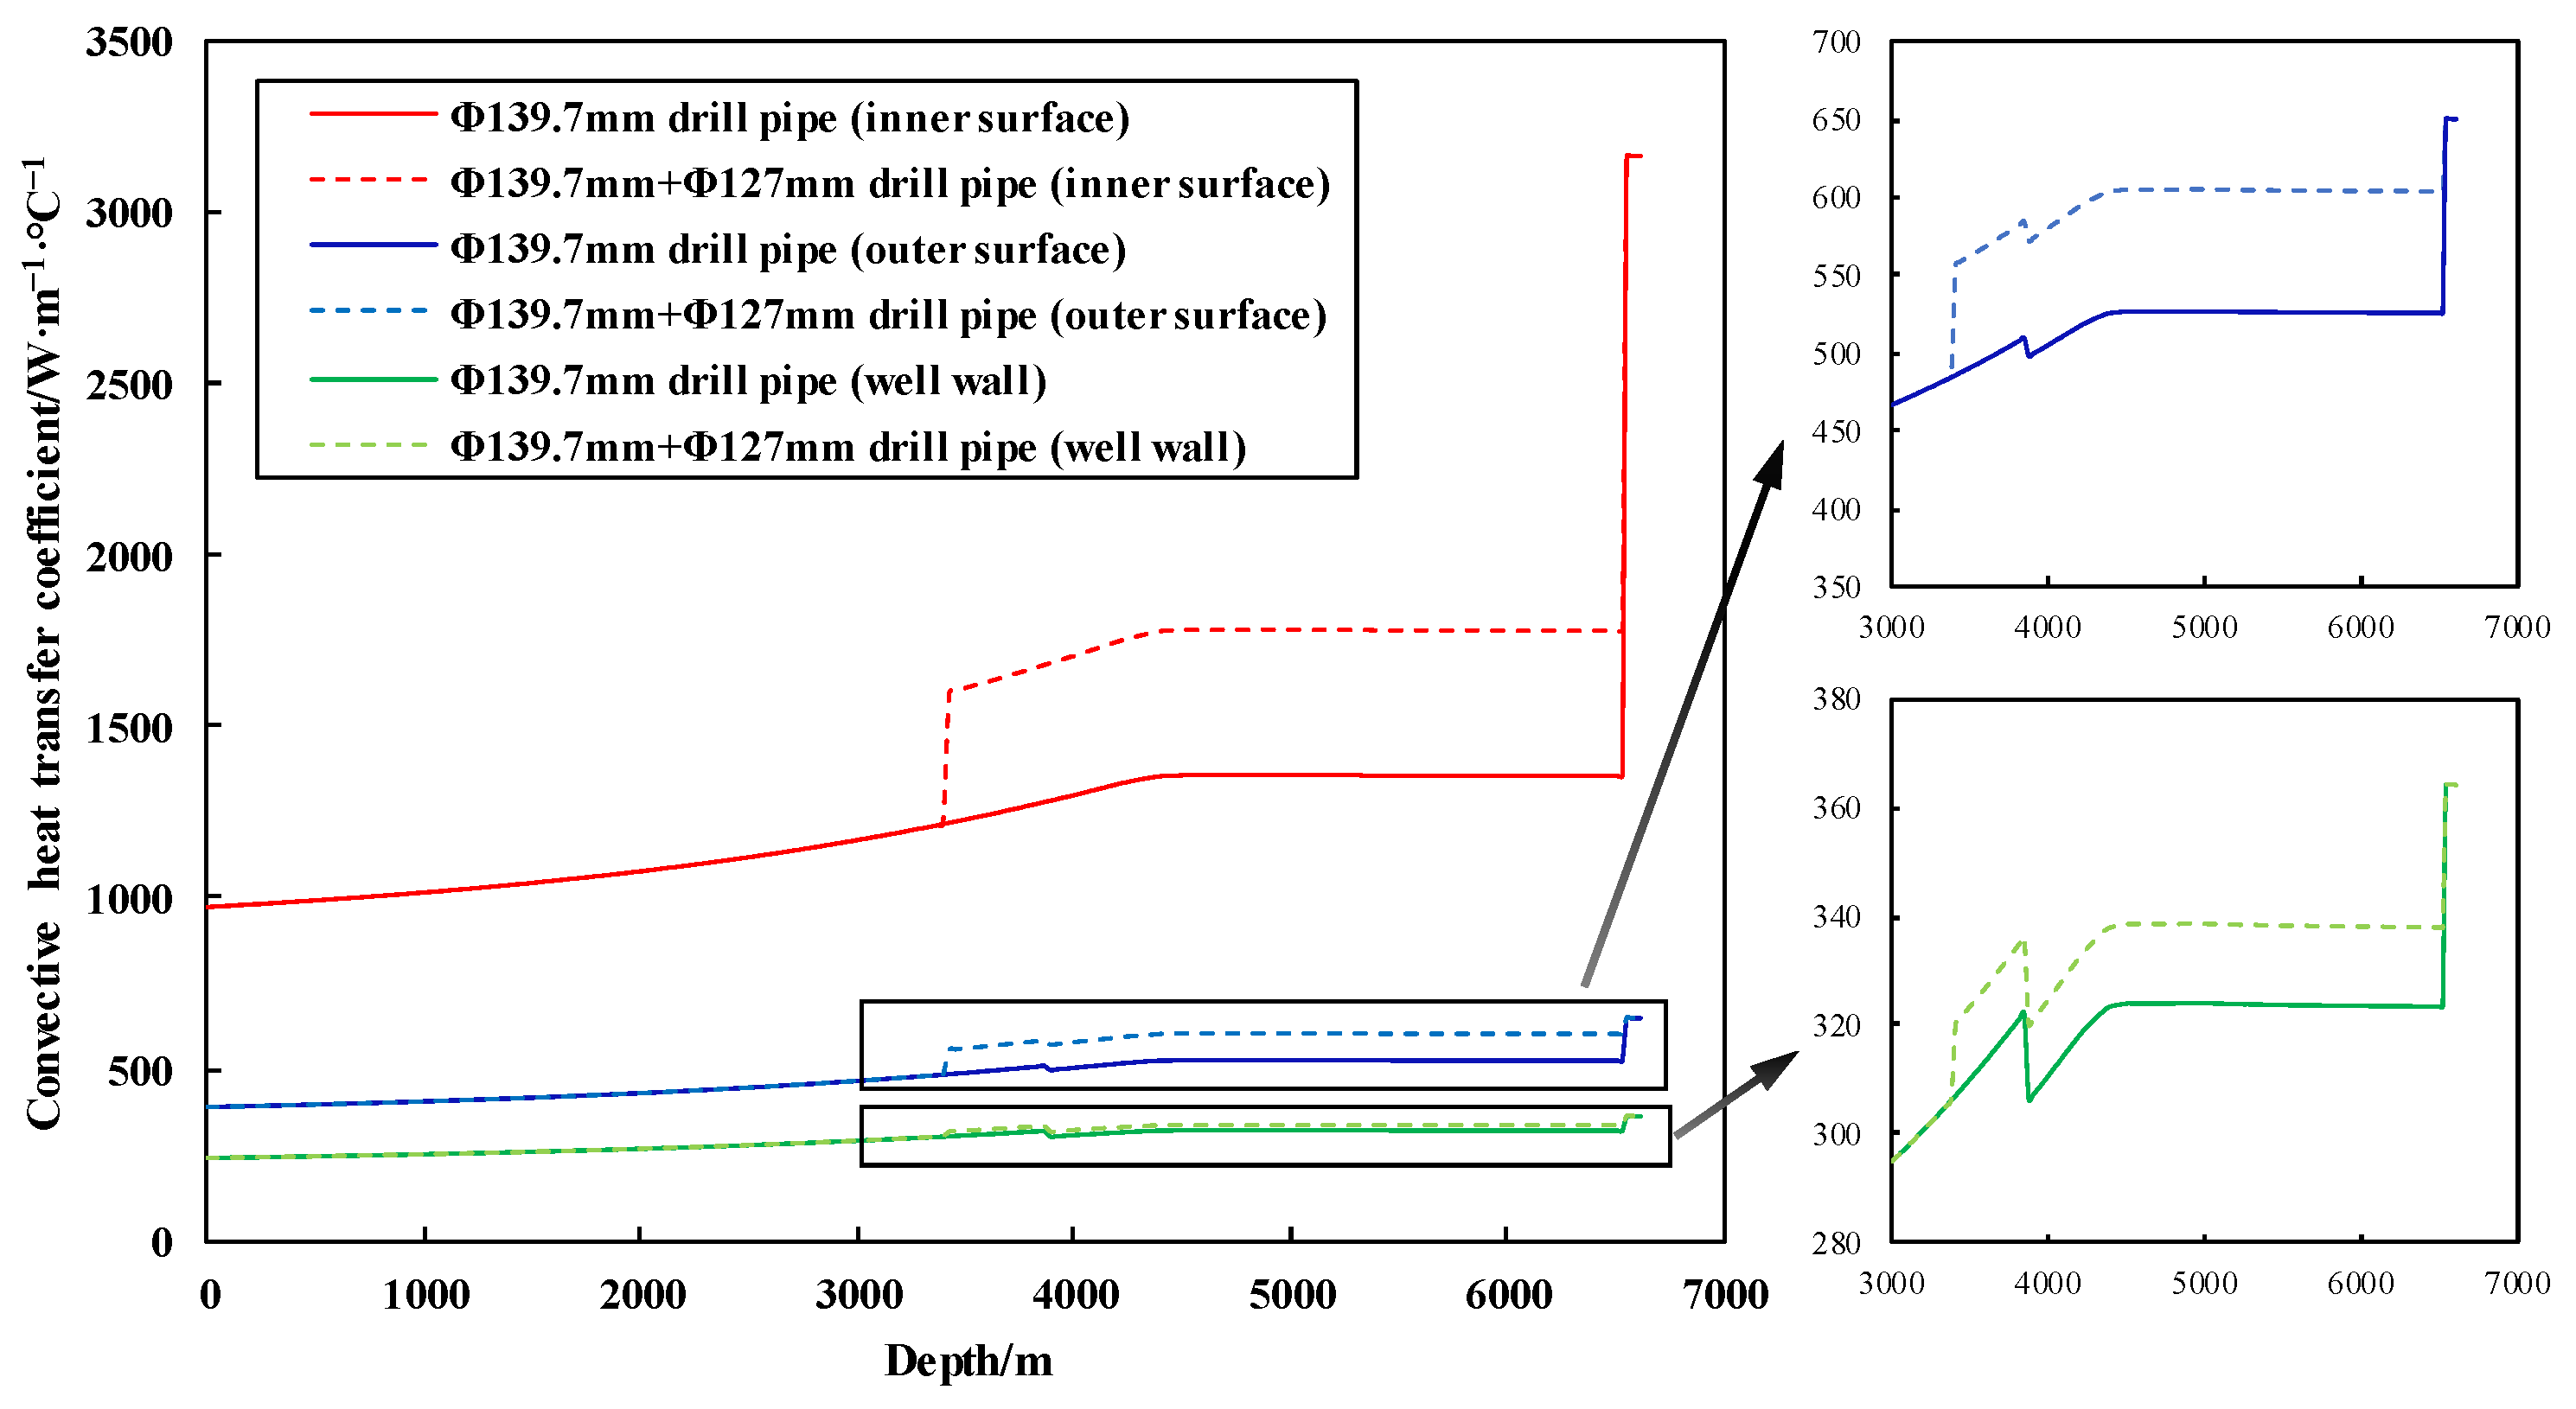
3.2.2. Influence of Drill Pipe Size

Figure 8 shows the temperature changes when using Φ139.7 mm drill pipe and Φ139.7 mm + Φ127 mm drill pipe. It can be seen that the Φ139.7 mm drill pipe has a bottom hole temperature 2.7 °C lower than that of the Φ139.7 mm + Φ127 mm drill pipe. The turning point on the curve corresponds to the well depth where the wellbore curvature in the building section is the largest, indicating that the drilling pipe size at this well depth has a smaller impact on the wellbore temperature. However, in the horizontal section, as the well depth increases, the temperature difference increases, indicating that the influence of the drilling pipe size on the wellbore temperature is more significant in the horizontal section compared to the vertical and oblique sections. Figure 9 shows the frictional heat generation of the drill pipe. It can be observed that the Φ139.7 mm drill pipe generates more frictional heat both inside the pipe and in the annulus. Figure 10 illustrates the convective heat transfer coefficient of the drill pipe. It is evident that the Φ139.7 mm + Φ127 mm drill pipe has a higher convective heat transfer coefficient, indicating a greater amount of convective heat exchange and higher generated temperature. The results demonstrate that despite the higher frictional heat generation of the Φ139.7 mm drill pipe, its convective heat exchange is less, resulting in lower heat production. Therefore, using the Φ139.7 mm drill pipe is more beneficial for reducing bottom hole temperature compared to the Φ139.7 mm + Φ127 mm drill pipe.

3.2.3. Influence of Drilling Fluid Density

Figure 11 shows the curve of annular temperature variation with well depth under different drilling fluid densities. It can be seen that in the horizontal section, the annular temperature for a drilling fluid density of 1.85 g/cm3 is lower, indicating that reducing the drilling fluid density can lower the annular temperature. When the drilling fluid density is reduced by 0.17 g/cm3, the bottom hole temperature drops by 6.3 °C. The results show that reducing the drilling fluid density decreases the solid phase content in the drilling fluid. It reduces the circulation pressure loss and the amount of heat generated. In addition, it can effectively increase the fluid’s specific heat capacity and reduce thermal conductivity, which can effectively reduce temperature to a certain extent. However, reducing the density of drilling fluid may weaken its ability to carry drilling chips, thus affecting the borehole cleaning effect. The deterioration of drilling fluid performance may increase the wear of drilling equipment. Therefore, it is necessary to consider various factors to reasonably control the drilling fluid density.

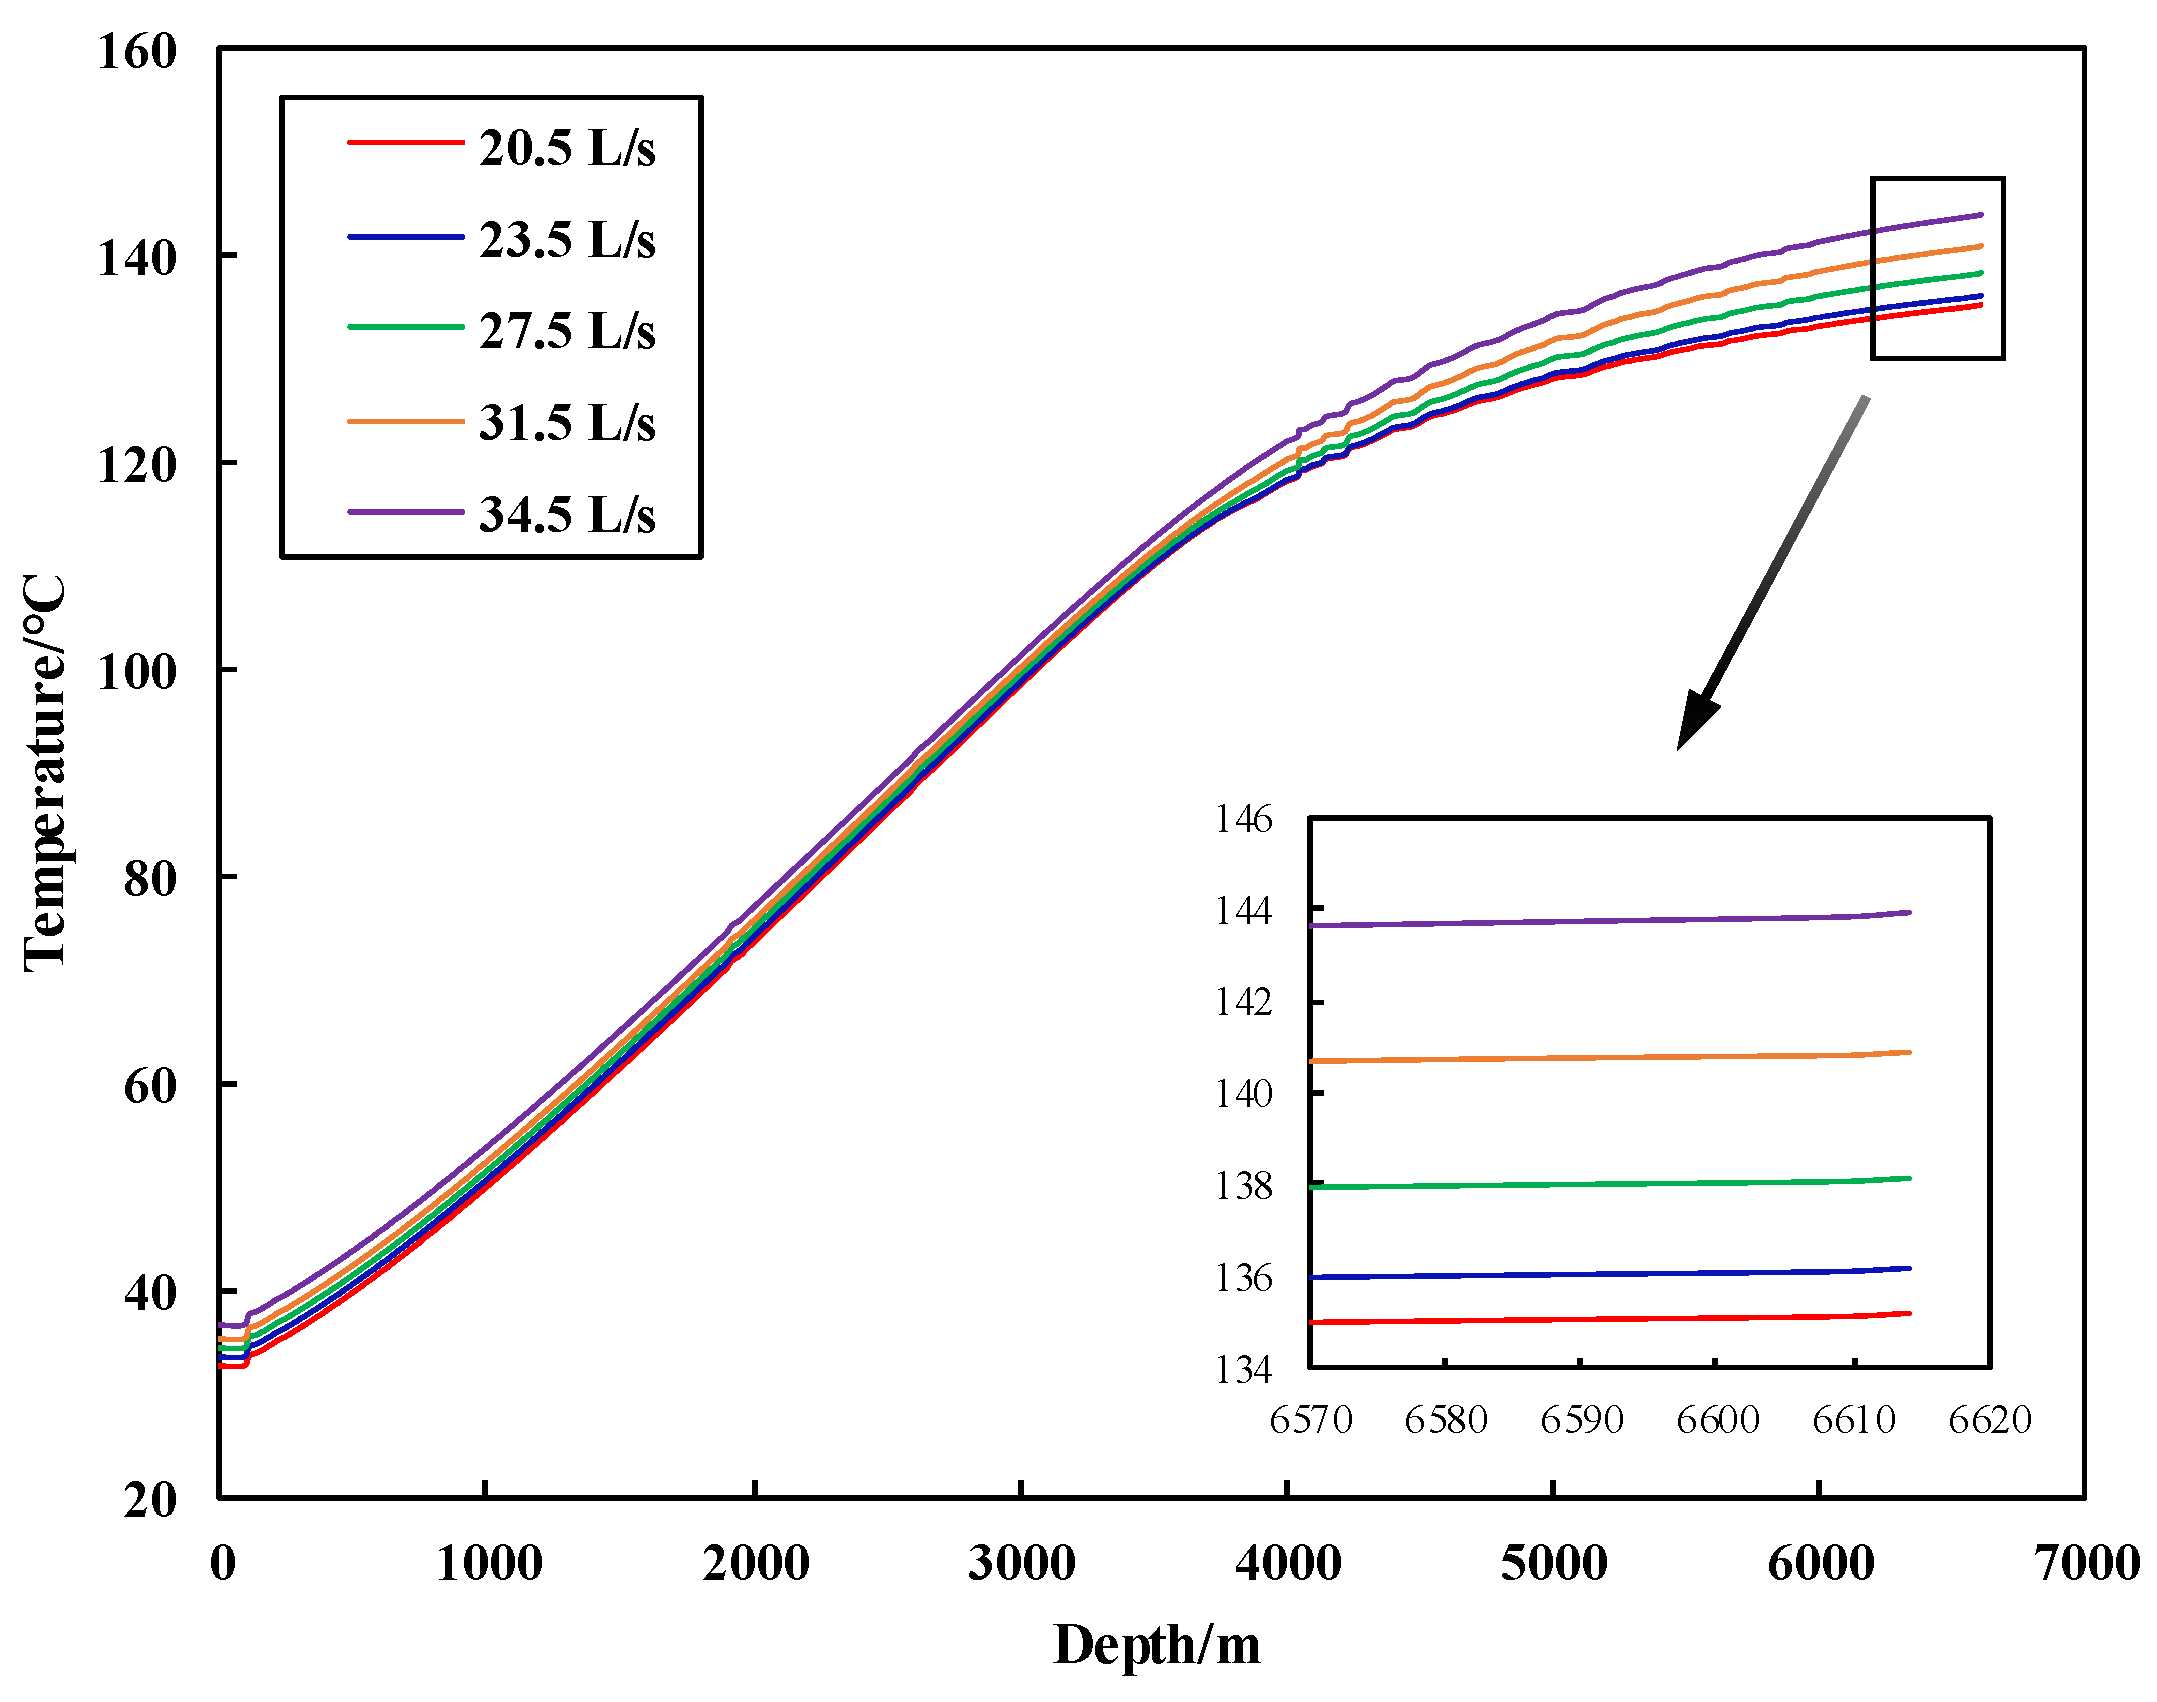
3.2.4. Influence of Drilling Fluid Flow Rate

With a drilling fluid density of 2.02 g/cm3 and an inlet temperature of the drilling fluid of 58 °C, the variation curve of annular temperature with a well depth under different drilling fluid flow rates is shown in Figure 12. It can be seen that when the flow rate is 20.5 L/s, 23.5 L/s, 27.5 L/s, 31.5 L/s, and 34.5 L/s, the bottom hole temperatures are 135.2 °C, 136.2 °C, 138.2 °C, 140.9 °C, and 143.9 °C, respectively. As the drilling fluid flow rate increases, the bottom hole temperature rises. When the drilling fluid flow rate is reduced by 14 L/s, the bottom hole temperature drops by 8.7 °C. The results show that reducing the drilling fluid flow rate can lower the RPM of PDM. As mentioned in Section 3.2.1, reducing the RPM of PDM is beneficial for decreasing the bottom hole temperature. In addition, the circulation pressure loss increases with increasing drilling fluid flow rate. Therefore, reducing the drilling fluid flow rate can decrease the circulation pressure loss, resulting in less heat generation and, consequently, decreasing the bottom hole temperature.

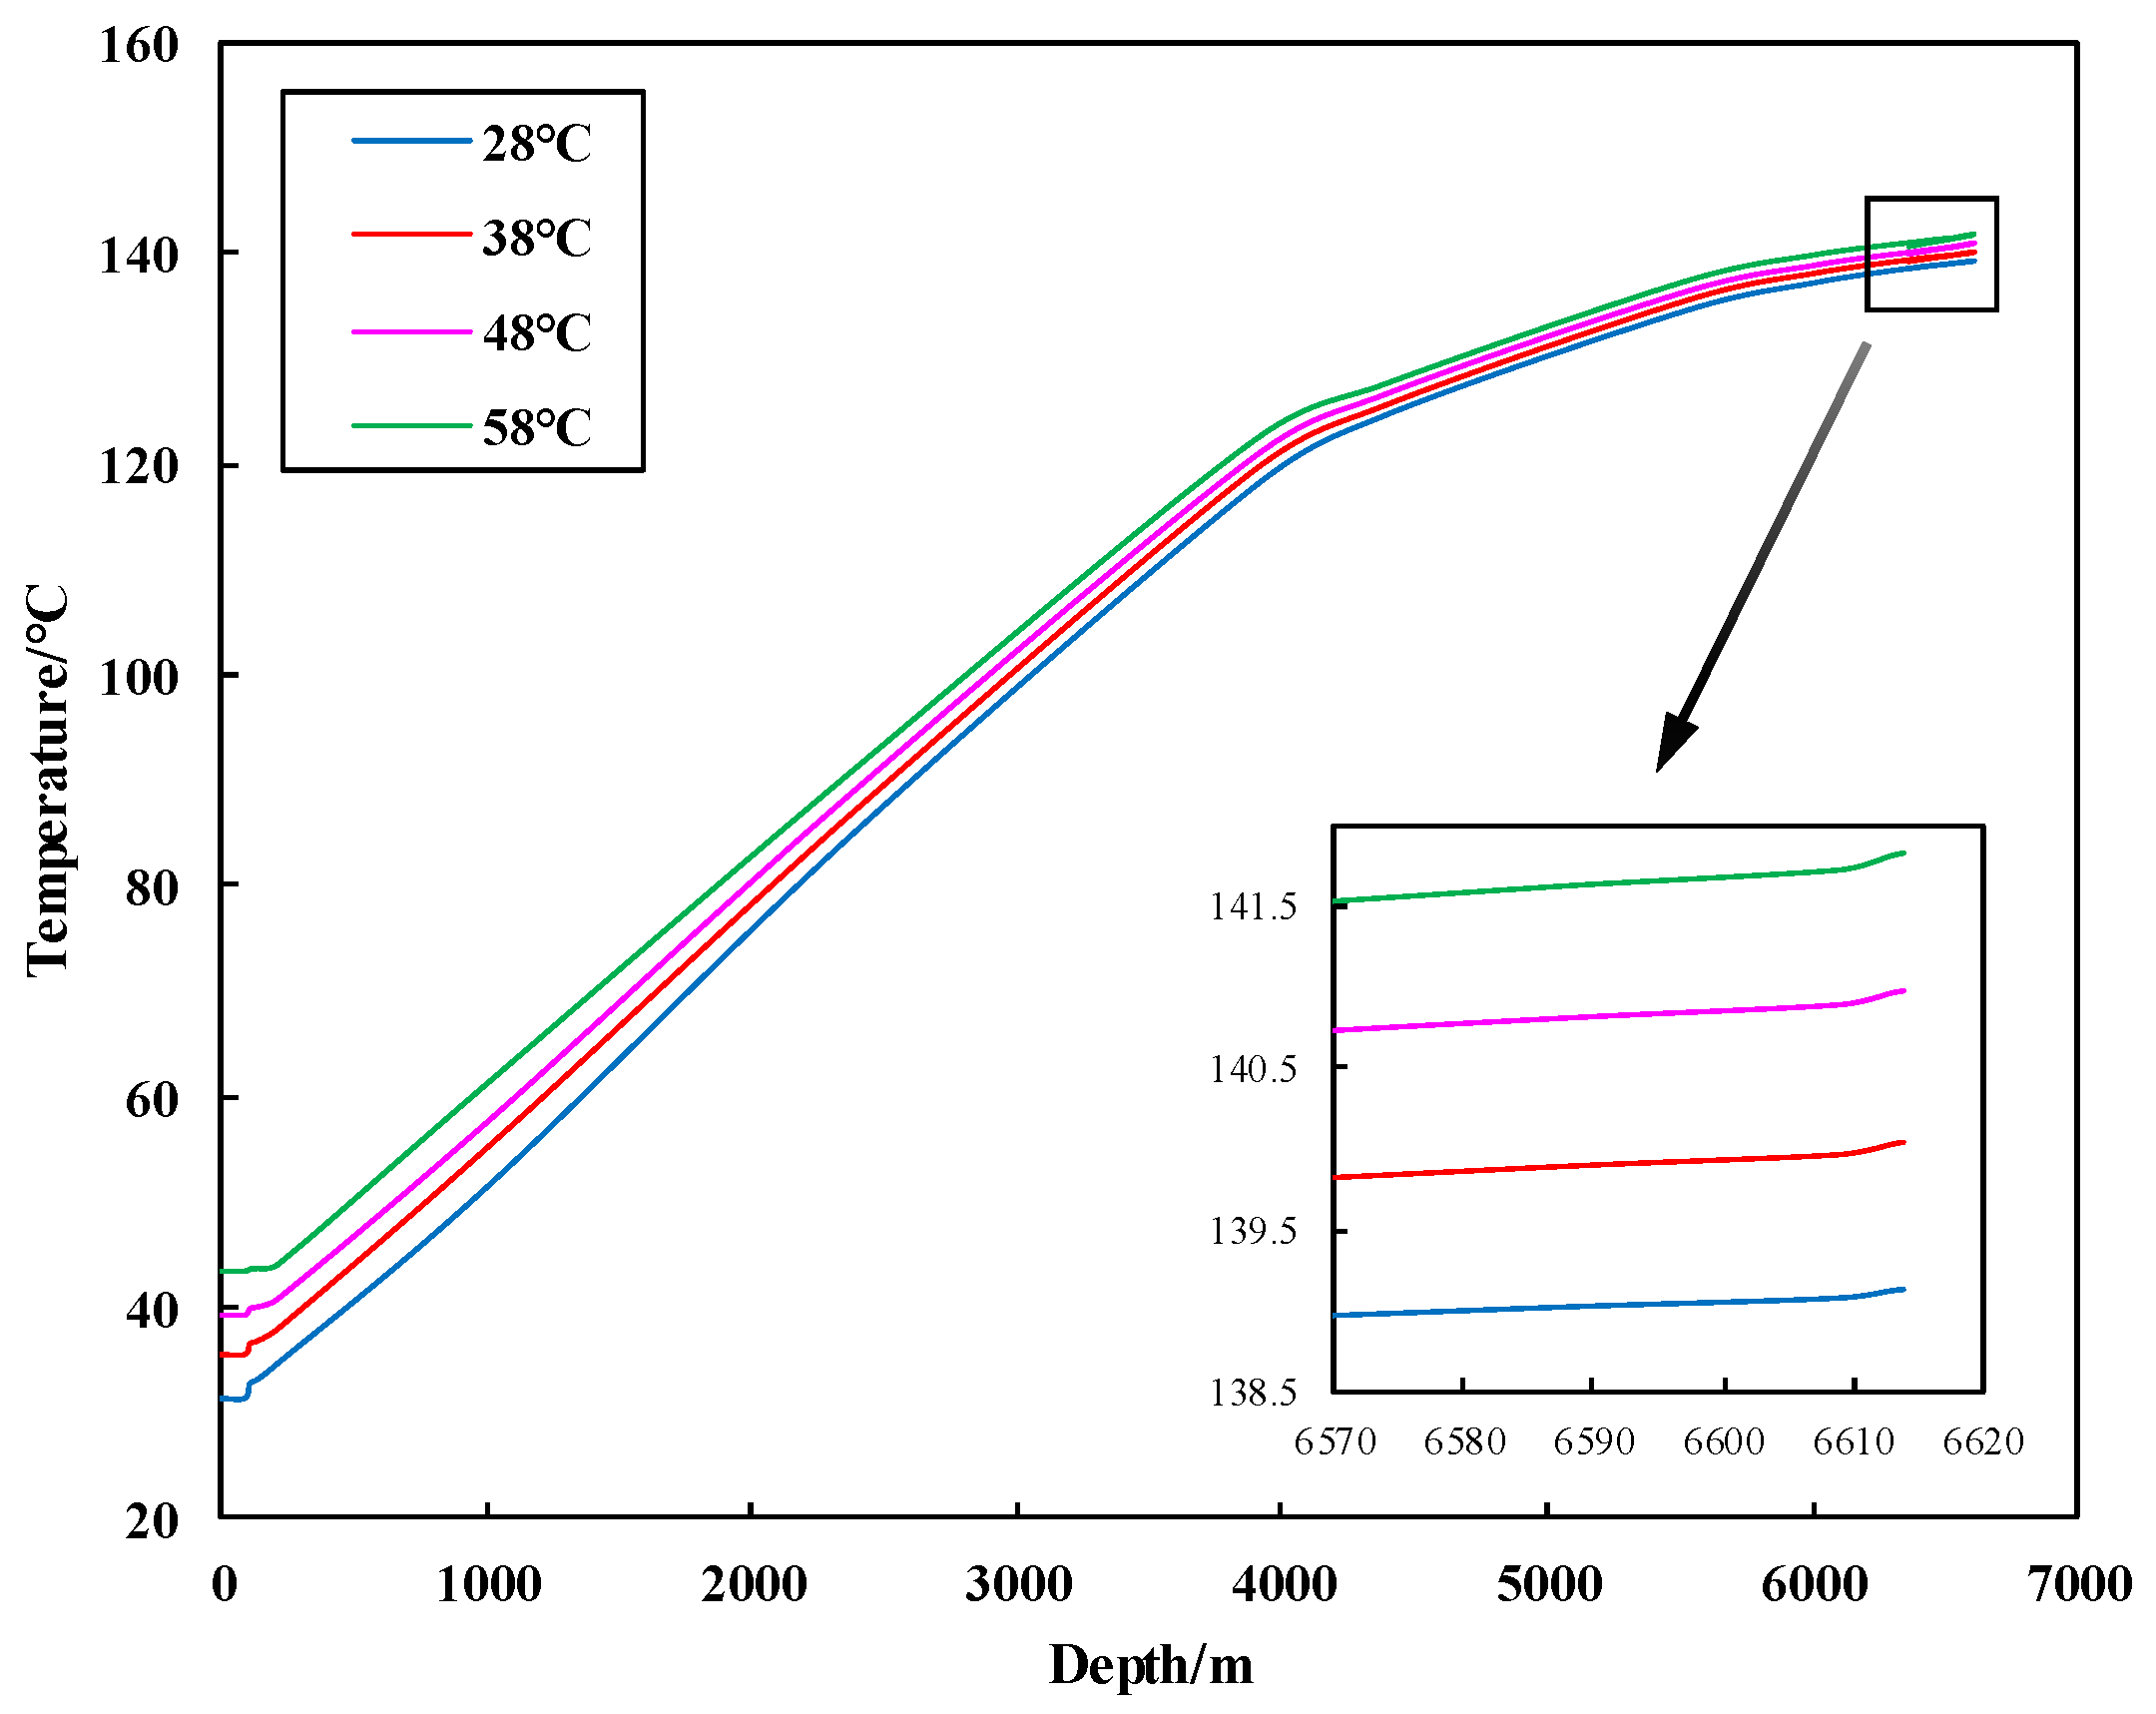
3.2.5. Influence of Inlet Temperature of Drilling Fluid

With a drilling fluid density of 2.02 g/cm3 and a drilling fluid flow rate of 31.5 L/s, the variation curve of annular temperature with well depth under different inlet temperatures is shown in Figure 13. It can be seen that when the inlet temperatures are 28 °C, 38 °C, 48 °C, and 58 °C, the bottom hole temperatures are 139.1 °C, 140.9 °C, 142.3 °C, and 143.4 °C, respectively. As the inlet temperature decreases, the bottom hole temperature decreases. When the drilling fluid inlet temperature is reduced by 30 °C, the bottom hole temperature drops by 4.3 °C. It is worth noting that when the well is deep, and the formation temperature is high, despite decreasing the inlet temperature, the cold slurry can easily be heated during its flow in the pipe, resulting in a smaller impact of ground cooling on the bottom hole temperature.

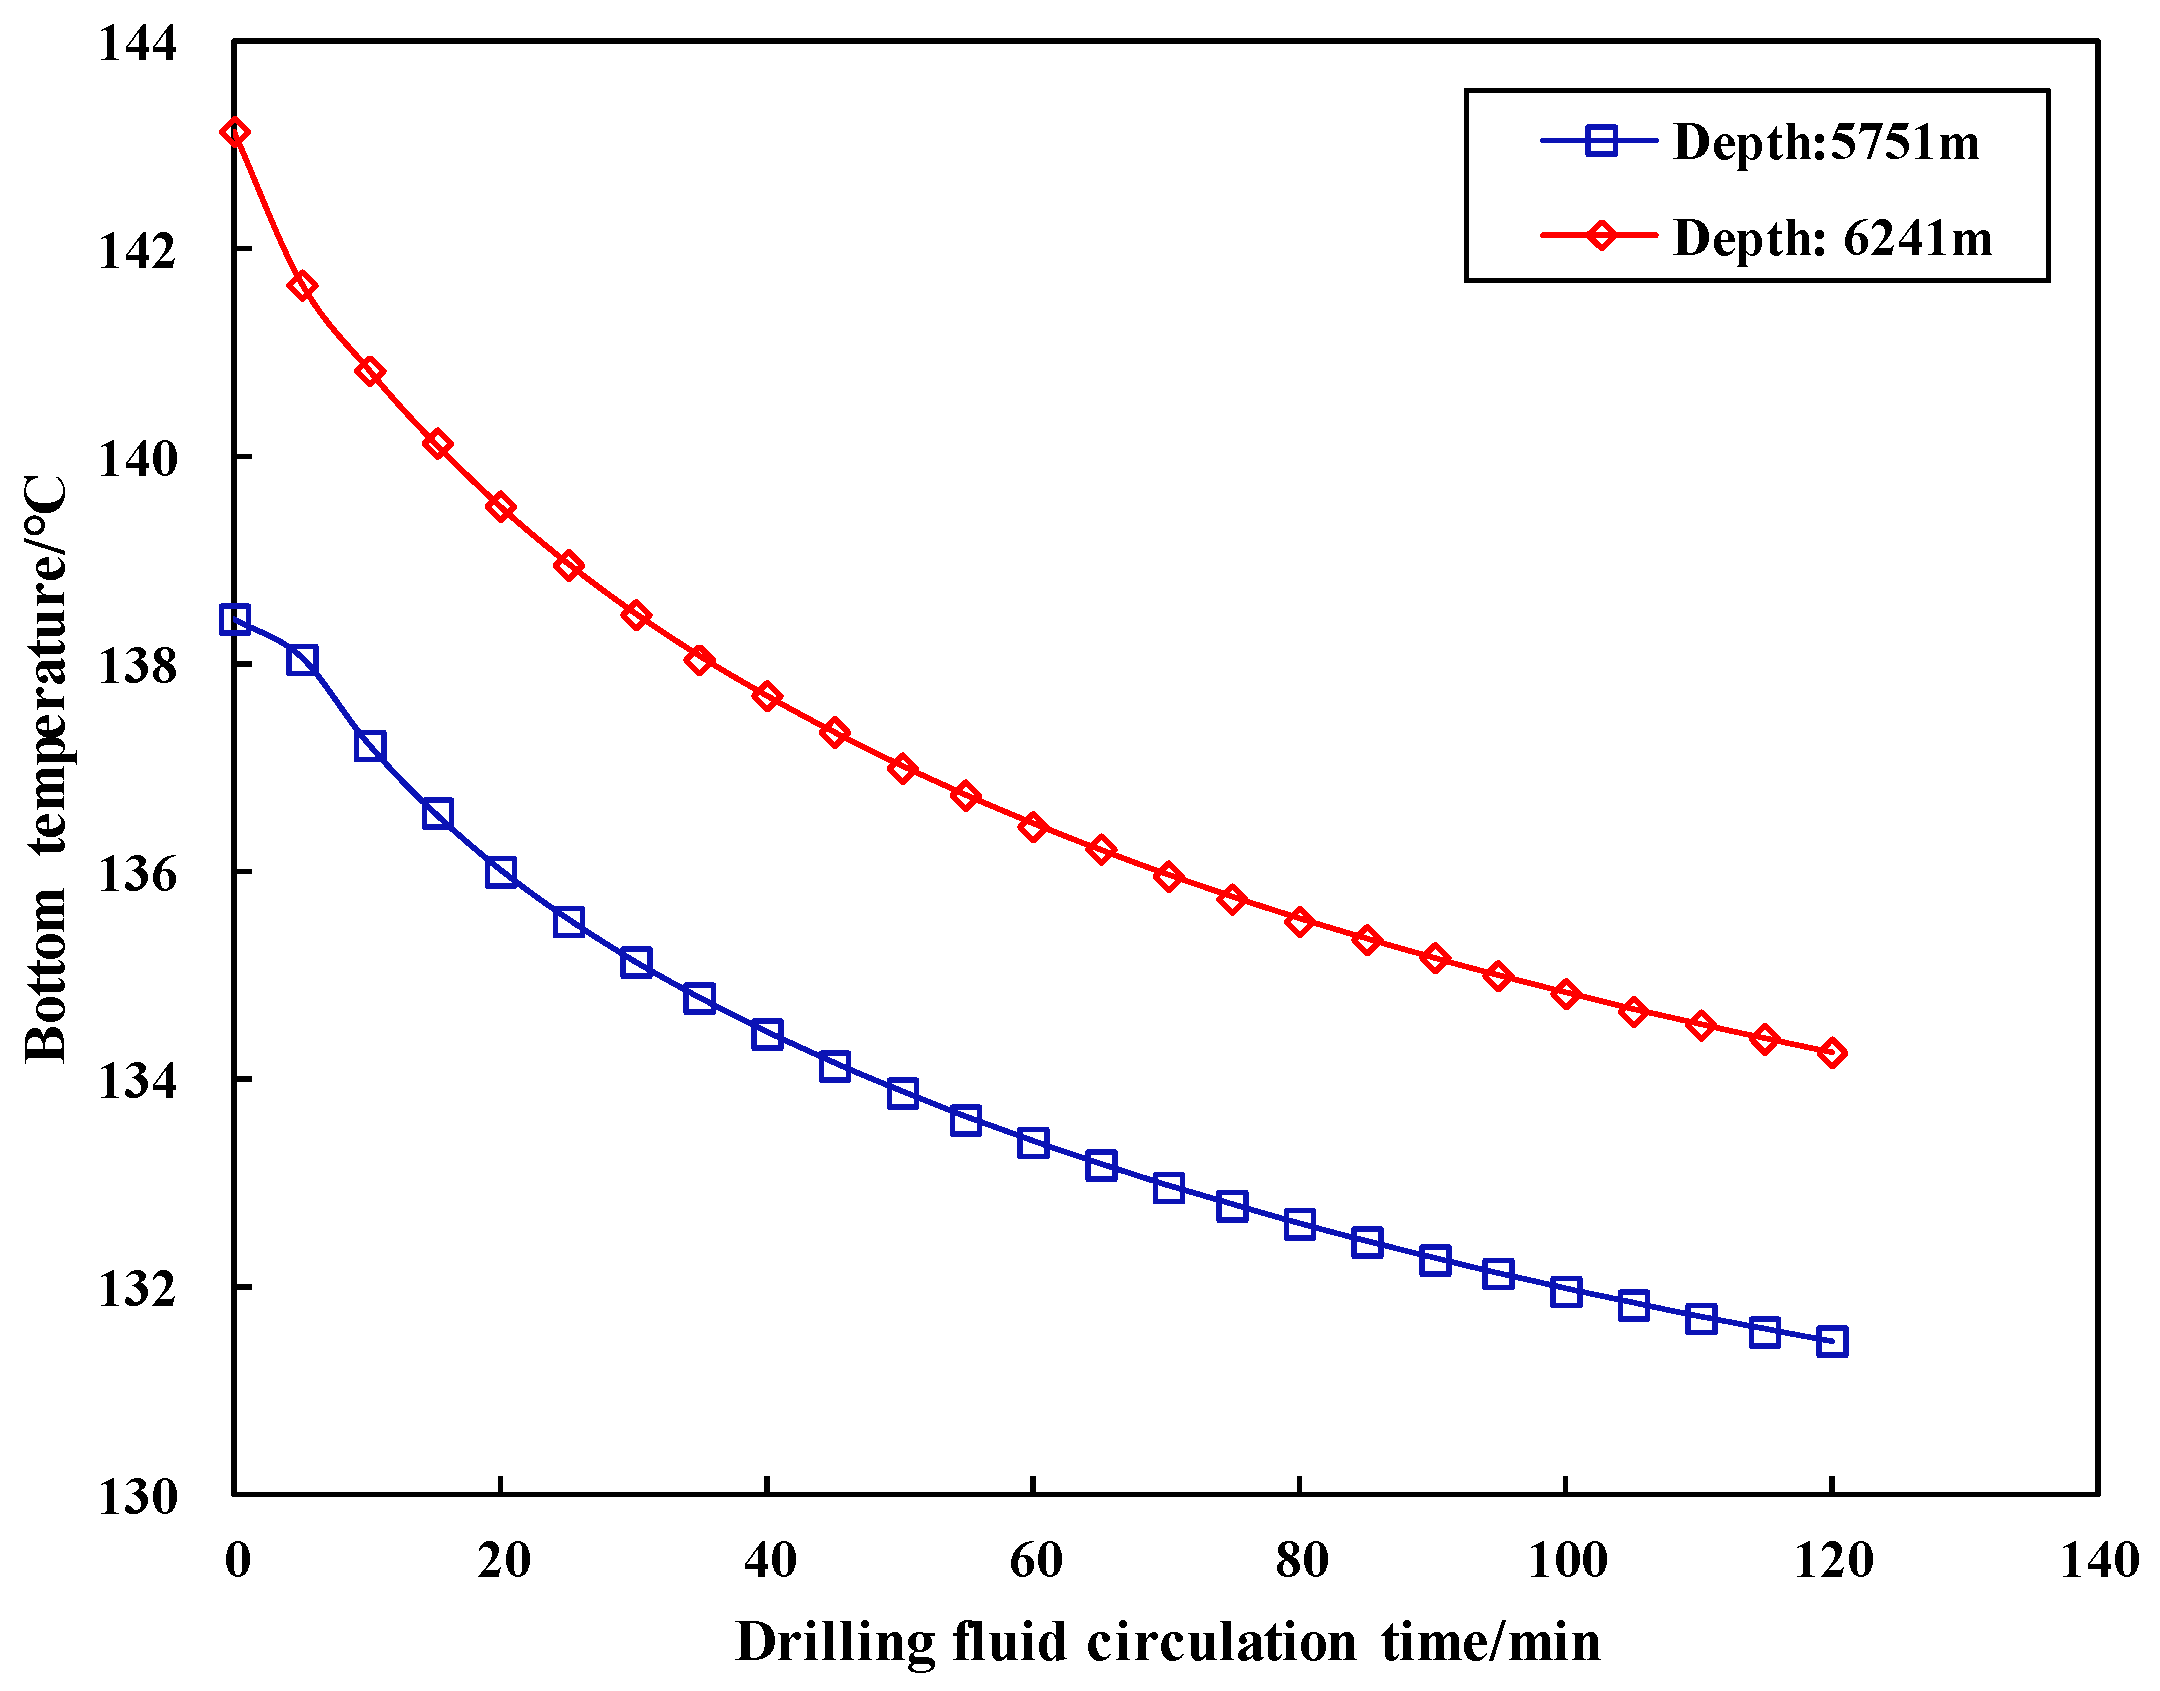
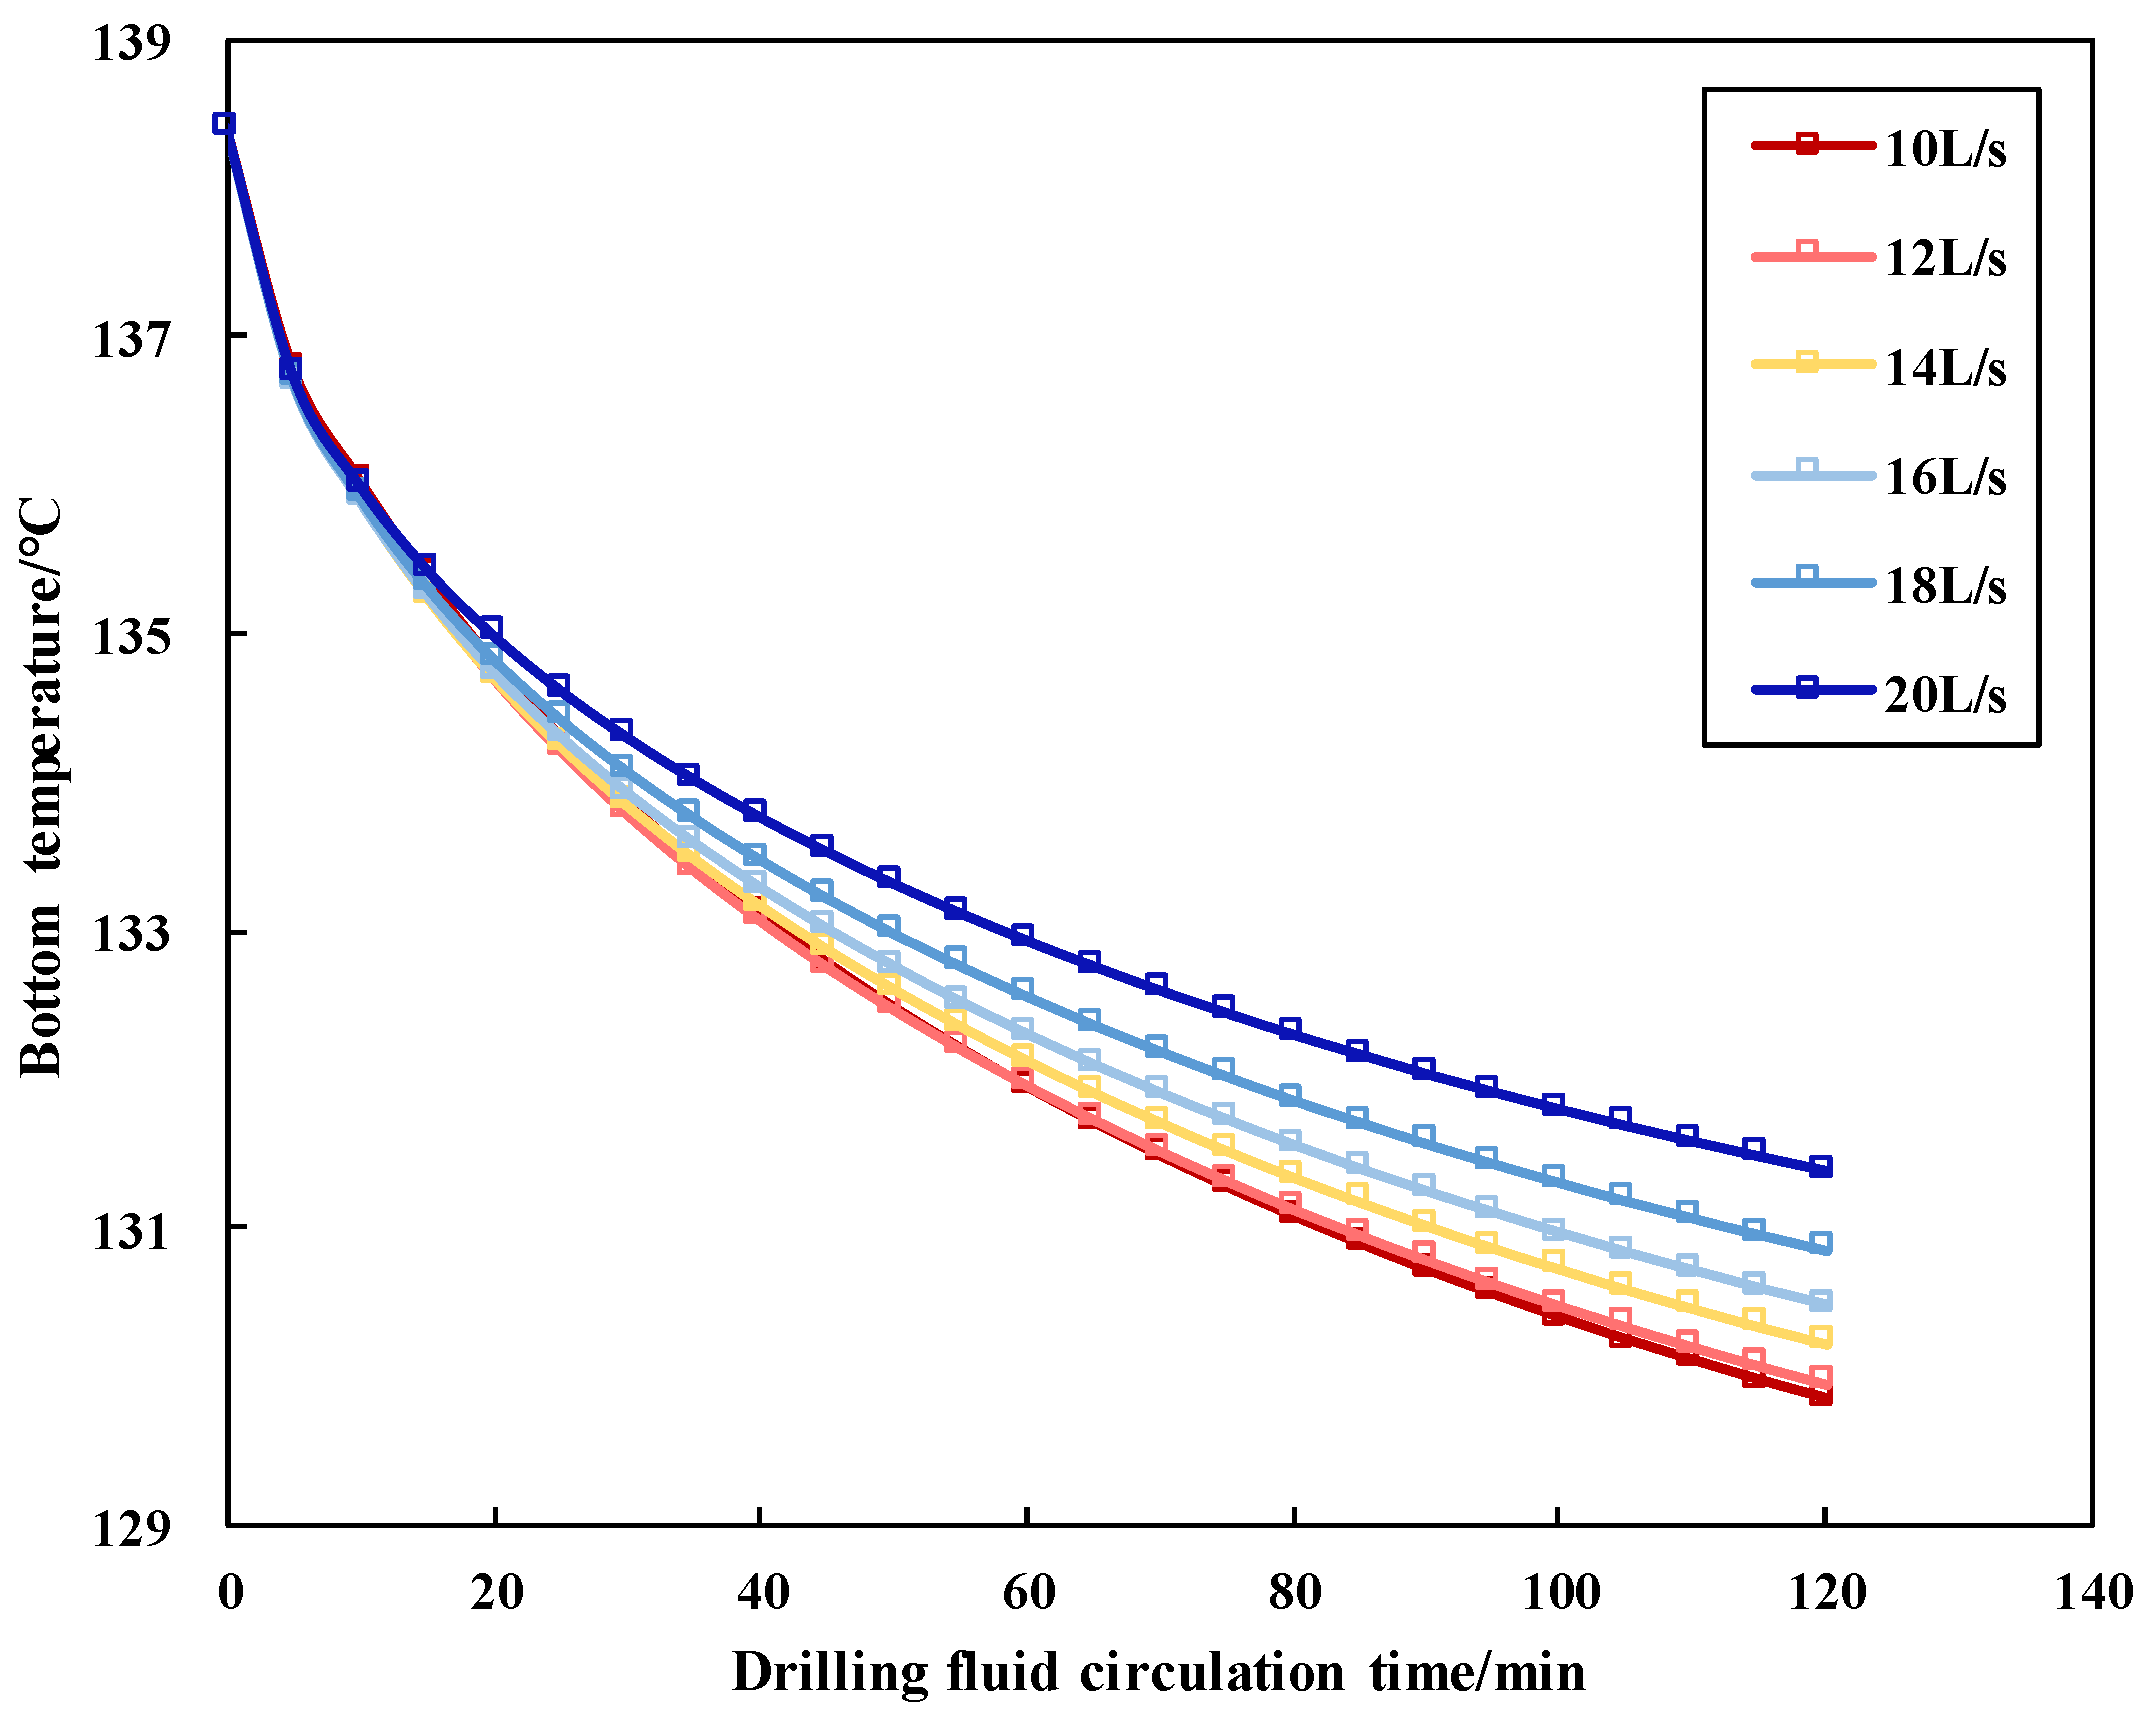
3.2.6. Influence of Drilling Fluid Circulation Time

Figure 14 shows the curve of the wellbore temperature varying with time during the drilling. It can be seen that as time increases, the wellbore temperature shows a slow upward trend. When the drilling fluid is circulated without drilling, the relationship curve between drilling fluid circulation time and annular temperature in horizontal wells is shown in Figure 15. It can be seen that as the circulation time increases, the annular temperature decreases, but the degree of decrease diminishes. According to Figure 15, at well depths of 5751 m and 6251 m, the circulation times required for the bottom hole temperature to drop by 3 °C are 25 min and 15 min, respectively. Theoretically, the higher the temperature, the shorter the circulation time required to achieve the same temperature drop, and the flow rate should not be too large during circulation cooling. Figure 16 shows the relationship between different drilling fluid circulation flow rates and circulation times at a well depth of 5751 m. The larger the circulation flow rate, the lower the cooling efficiency for the same circulation time.

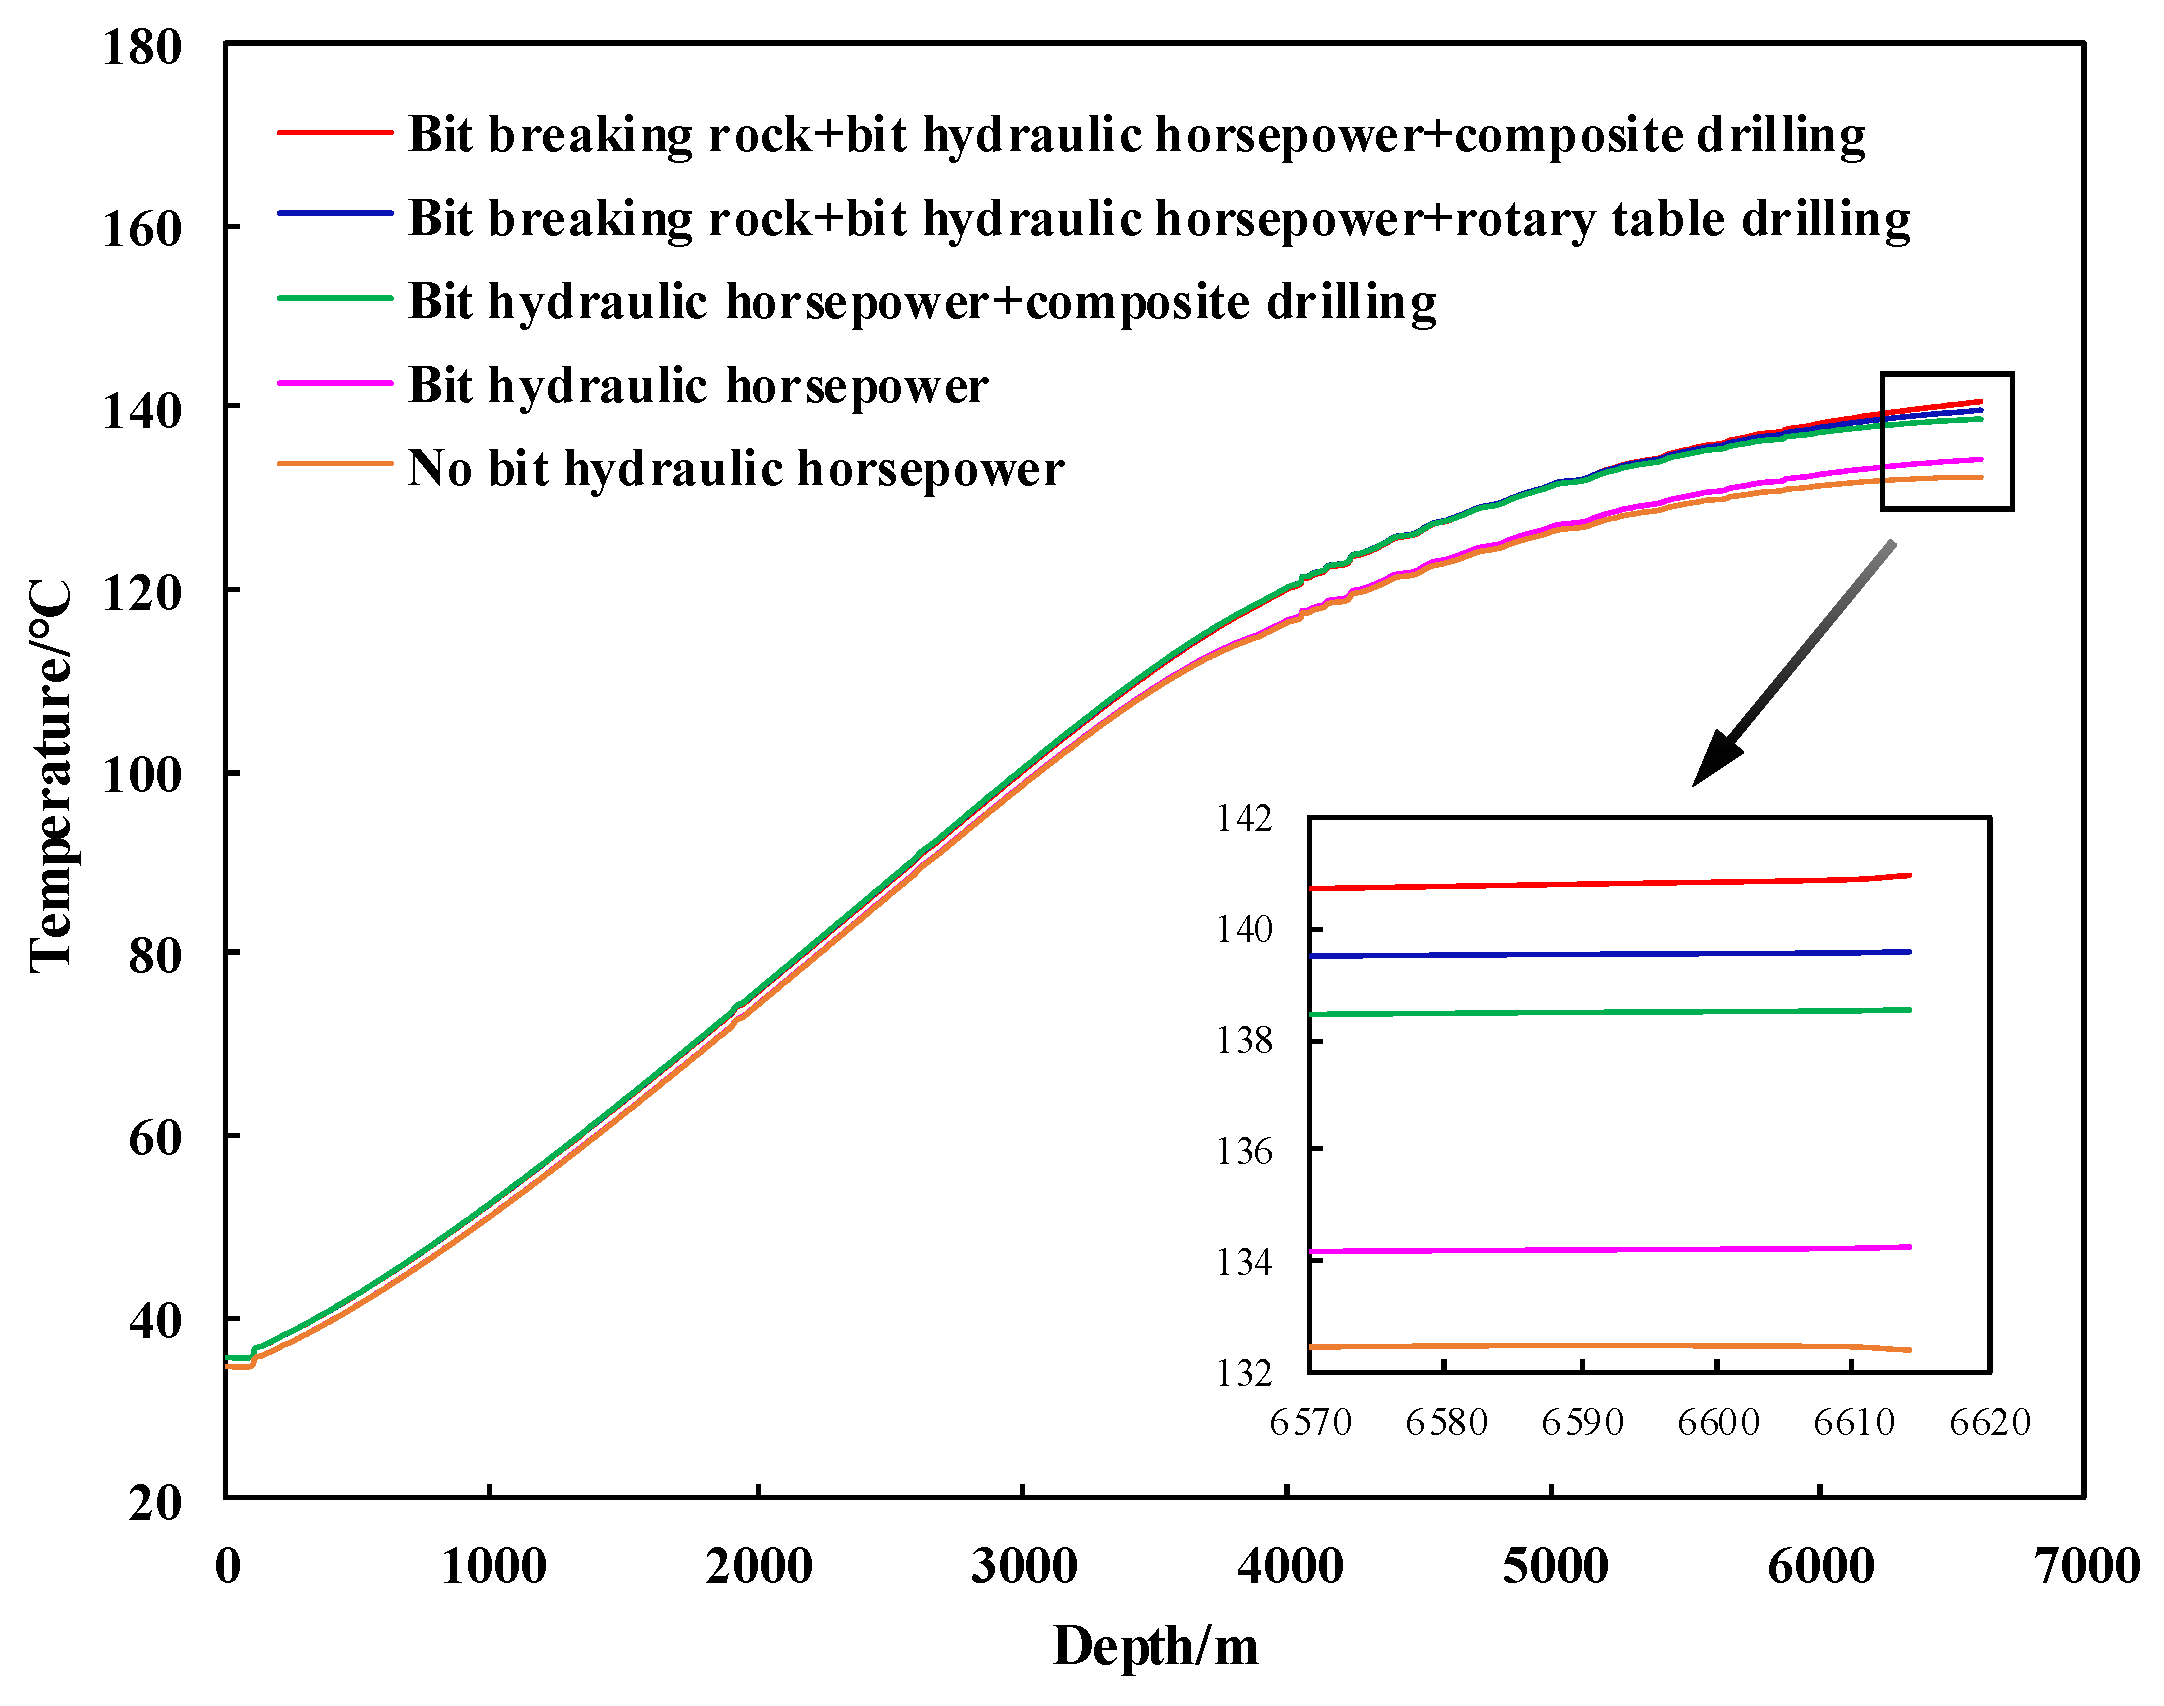
3.2.7. Influence of Heat Sources

Figure 17 shows the temperature distribution of wellbore annulus with well depth in the horizontal well when considering different heat source terms. Obviously, when considering bit-breaking rock, bit hydraulic horsepower, and drill pipe rotation, the annulus temperature at the same well depth is higher than when there are no heat source terms. Moreover, as the well depth increases, the difference is more pronounced. Figure 18 shows the heat generated by different heat sources. The temperature produced by the bit-breaking rock is 2.4 °C. Bit hydraulic horsepower generates a temperature of 1.82 °C, top drive rotation generates a maximum temperature of 2.95 °C, and top drive rotation (80 r/min) and PDM rotation (100 r/min) generate a temperature of 4.28 °C. Therefore, near the critical temperature point of the rotary steering drilling tool, measures such as reducing the top drive rotation speed and removing the PDM can reduce the downhole annulus temperature.

4. Conclusions

This paper establishes a wellbore temperature field model during the drilling process of deep shale gas horizontal wells. The finite difference method is used to solve the model, and field data are utilized for verification. Based on this, the study explores the influence of BHA, drill pipe size, drilling fluid density, flow rate, inlet temperature of drilling fluid, and drilling fluid circulation time on the temperature distribution of the wellbore annulus. Key findings are as follows:
(1)
Based on the established wellbore temperature field model, the RMSE of the prediction results for three wells on site are 1.05 °C, 0.54 °C, and 0.99 °C. The temperature difference between the measured data and the prediction results is less than 6 °C, and the relative error is less than 5%, indicating that the model has high accuracy.
(2)
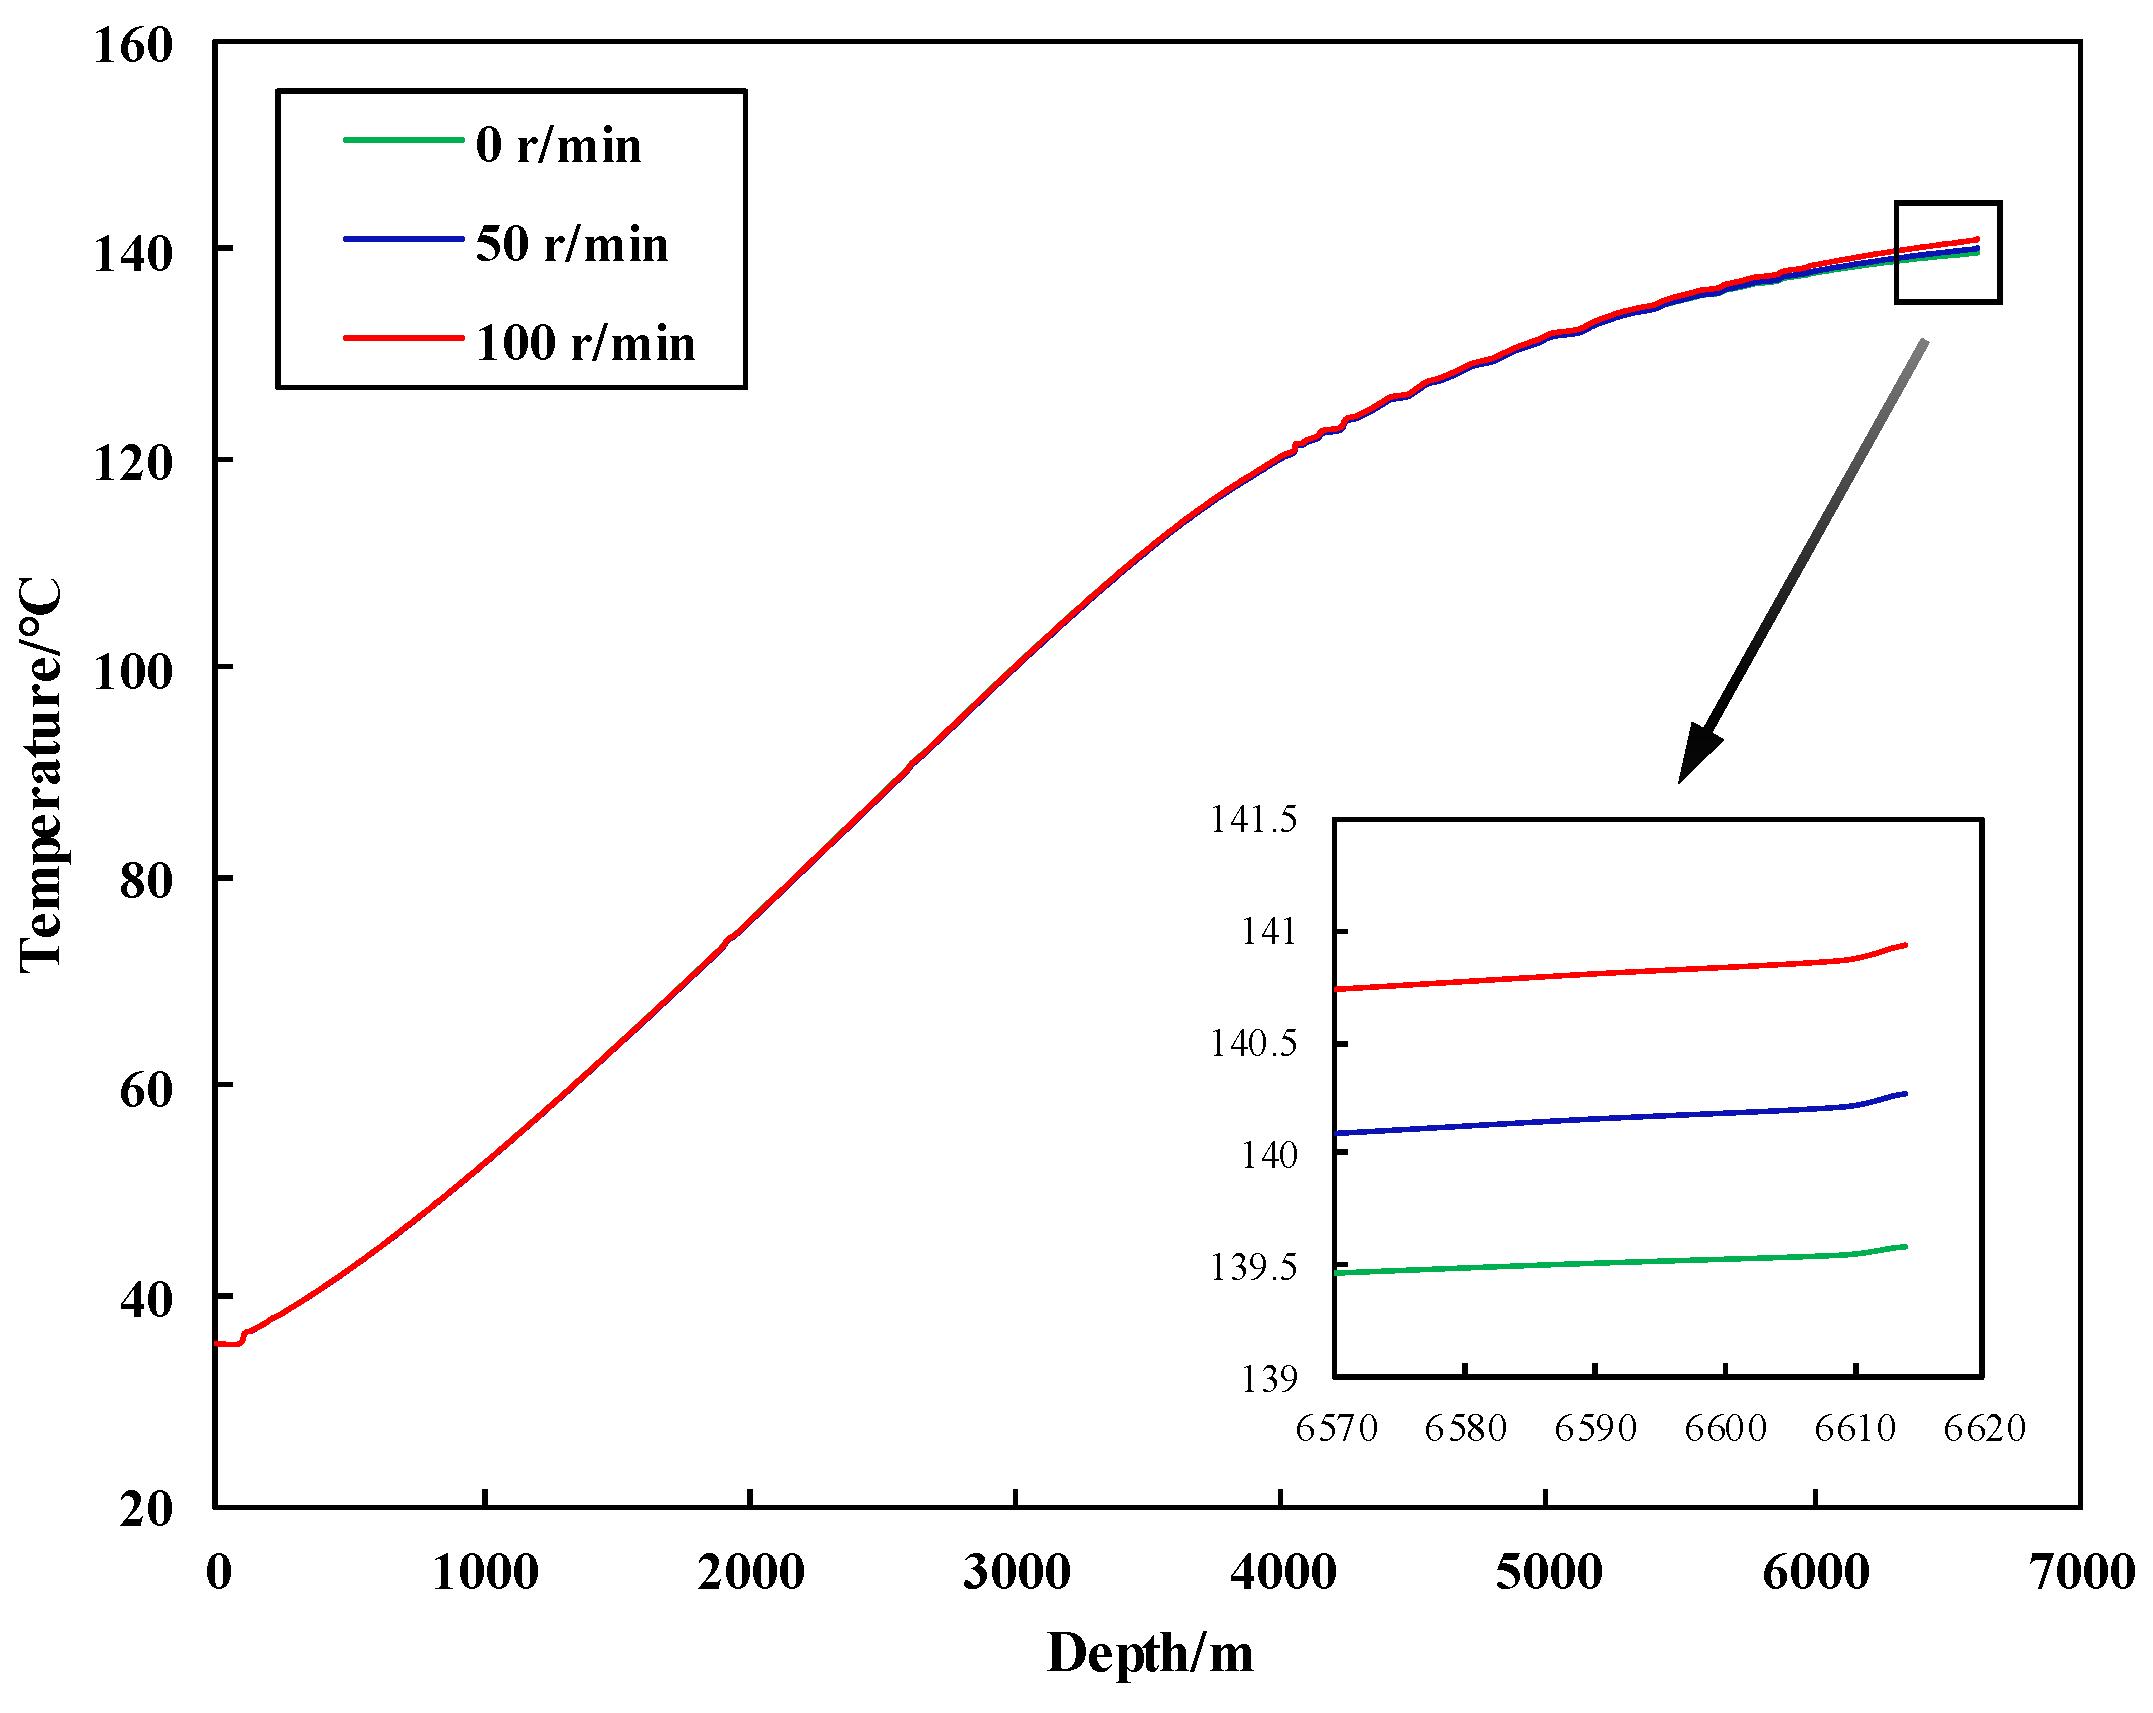
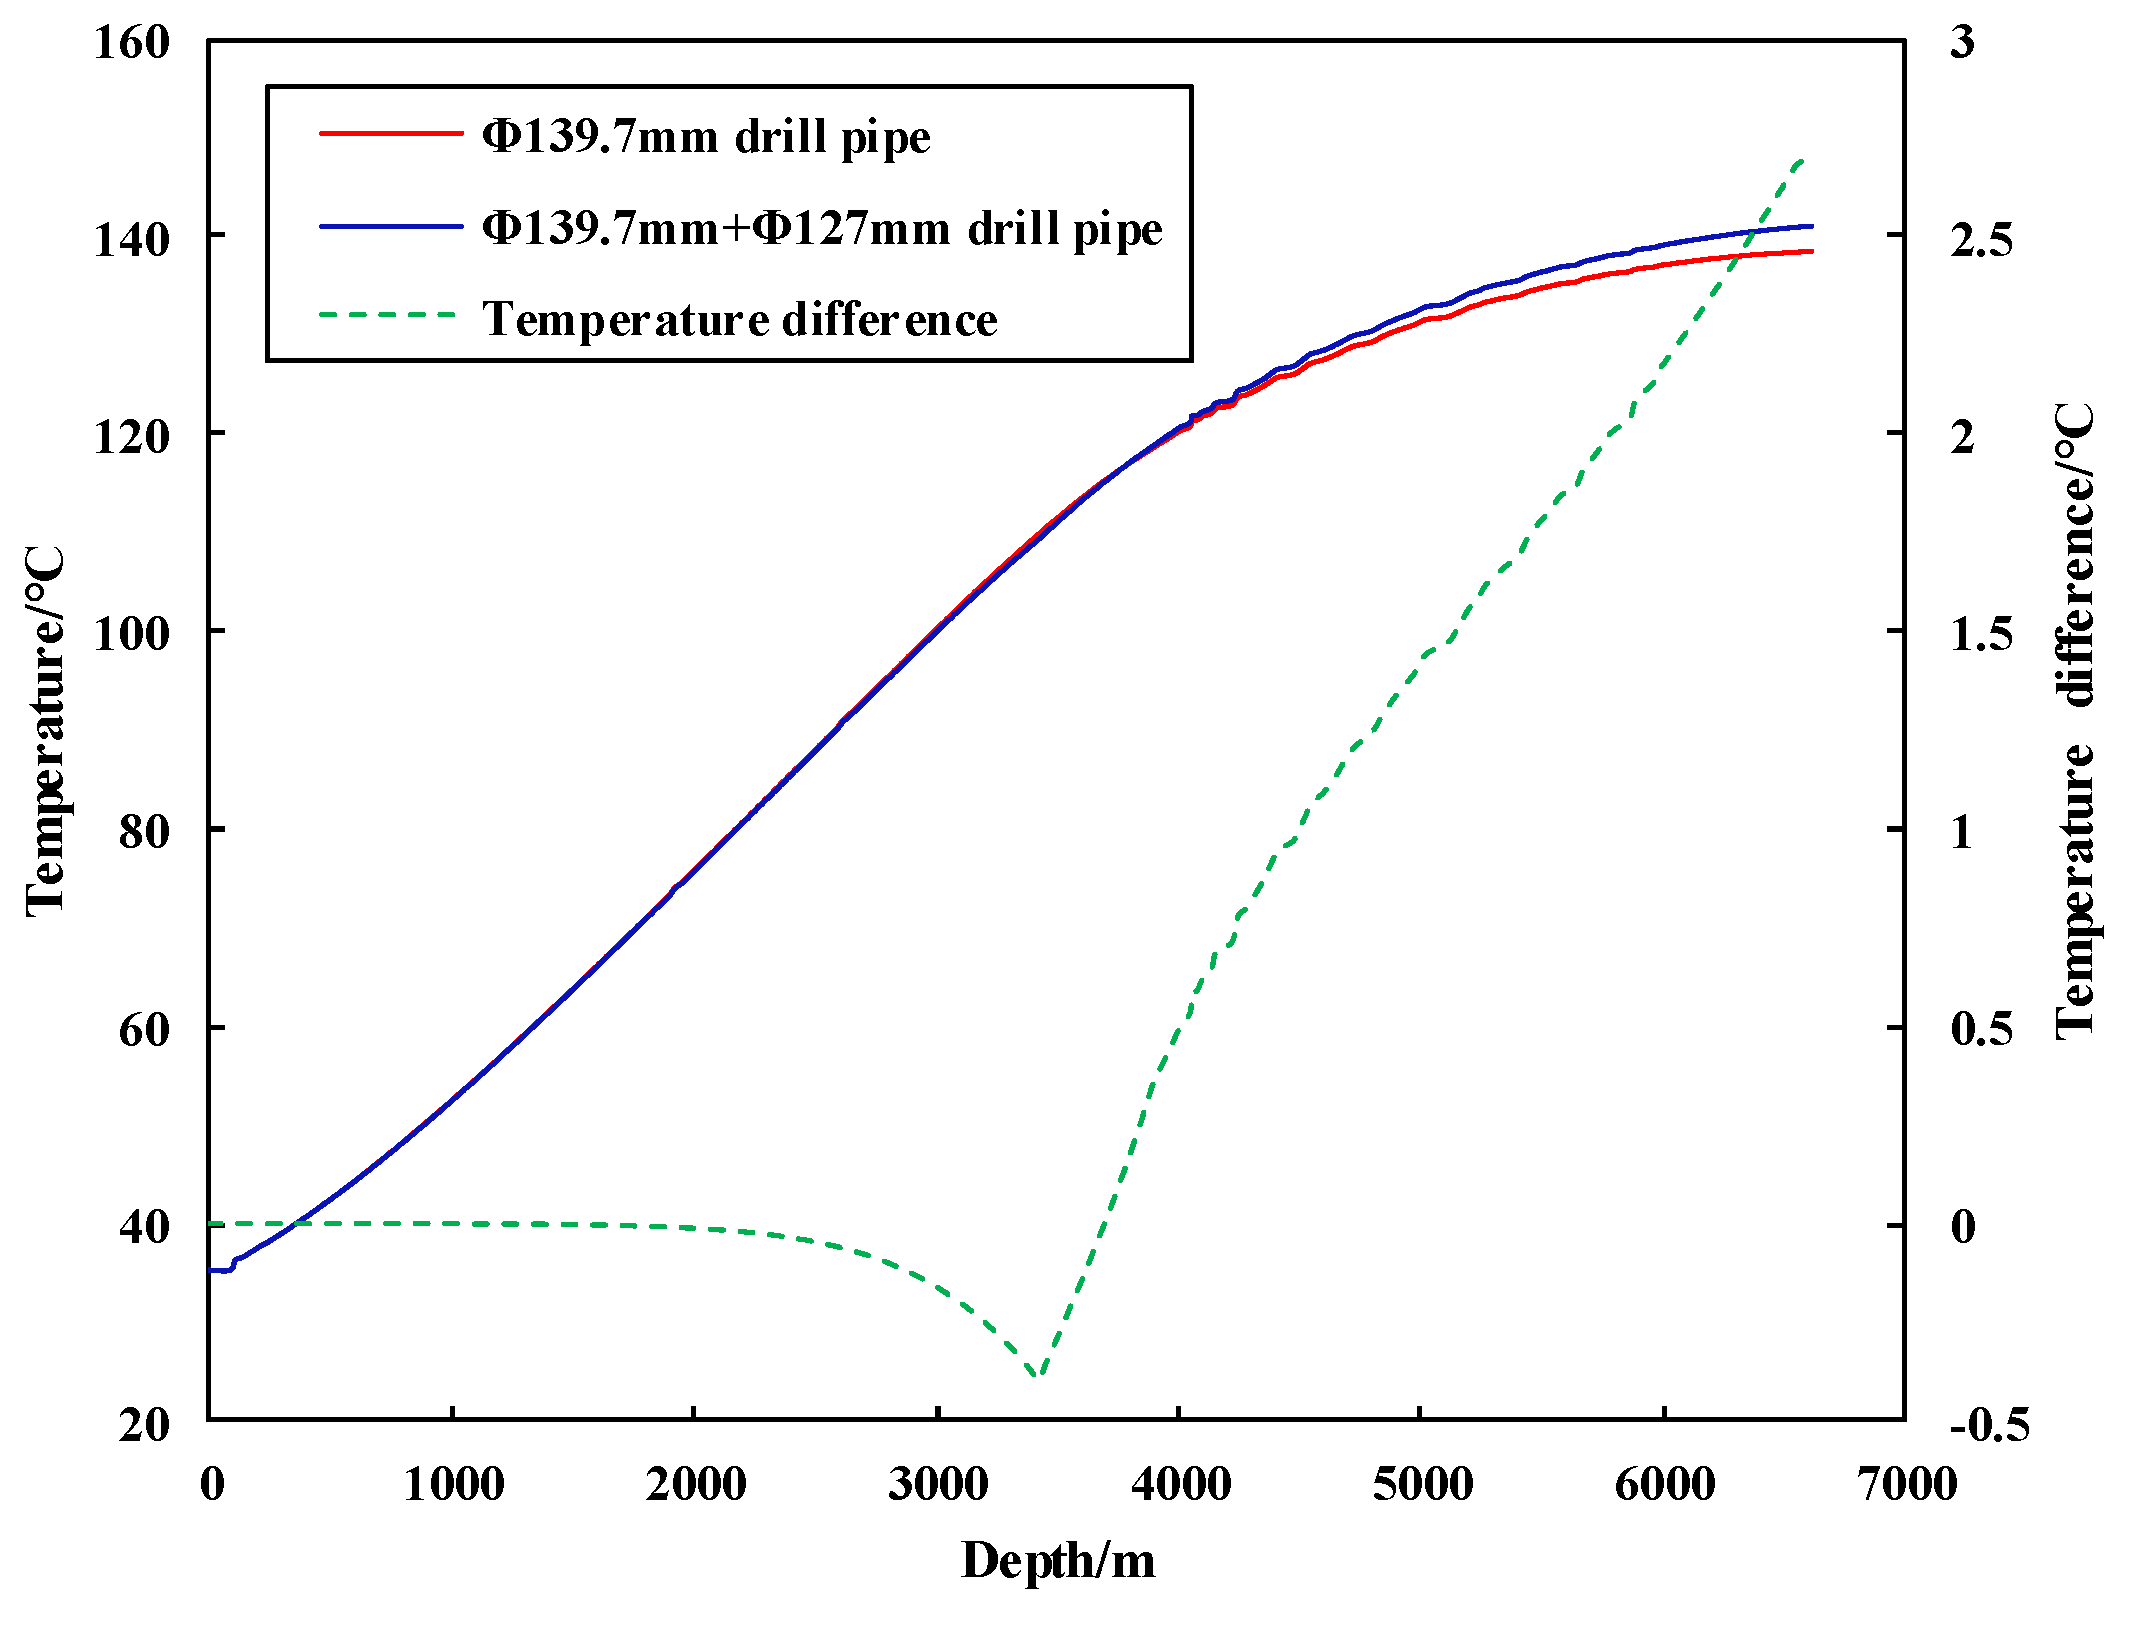
When drilling in the shale gas horizontal section with a PDM, the annular temperature increases by approximately 1 °C/100 m. As the RPM of PDM decreases, the bottom hole temperature decreases. In addition, using Φ139.7 mm drill pipe is favorable for cooling than Φ139.7 mm + Φ127 mm drill pipe.
(3)
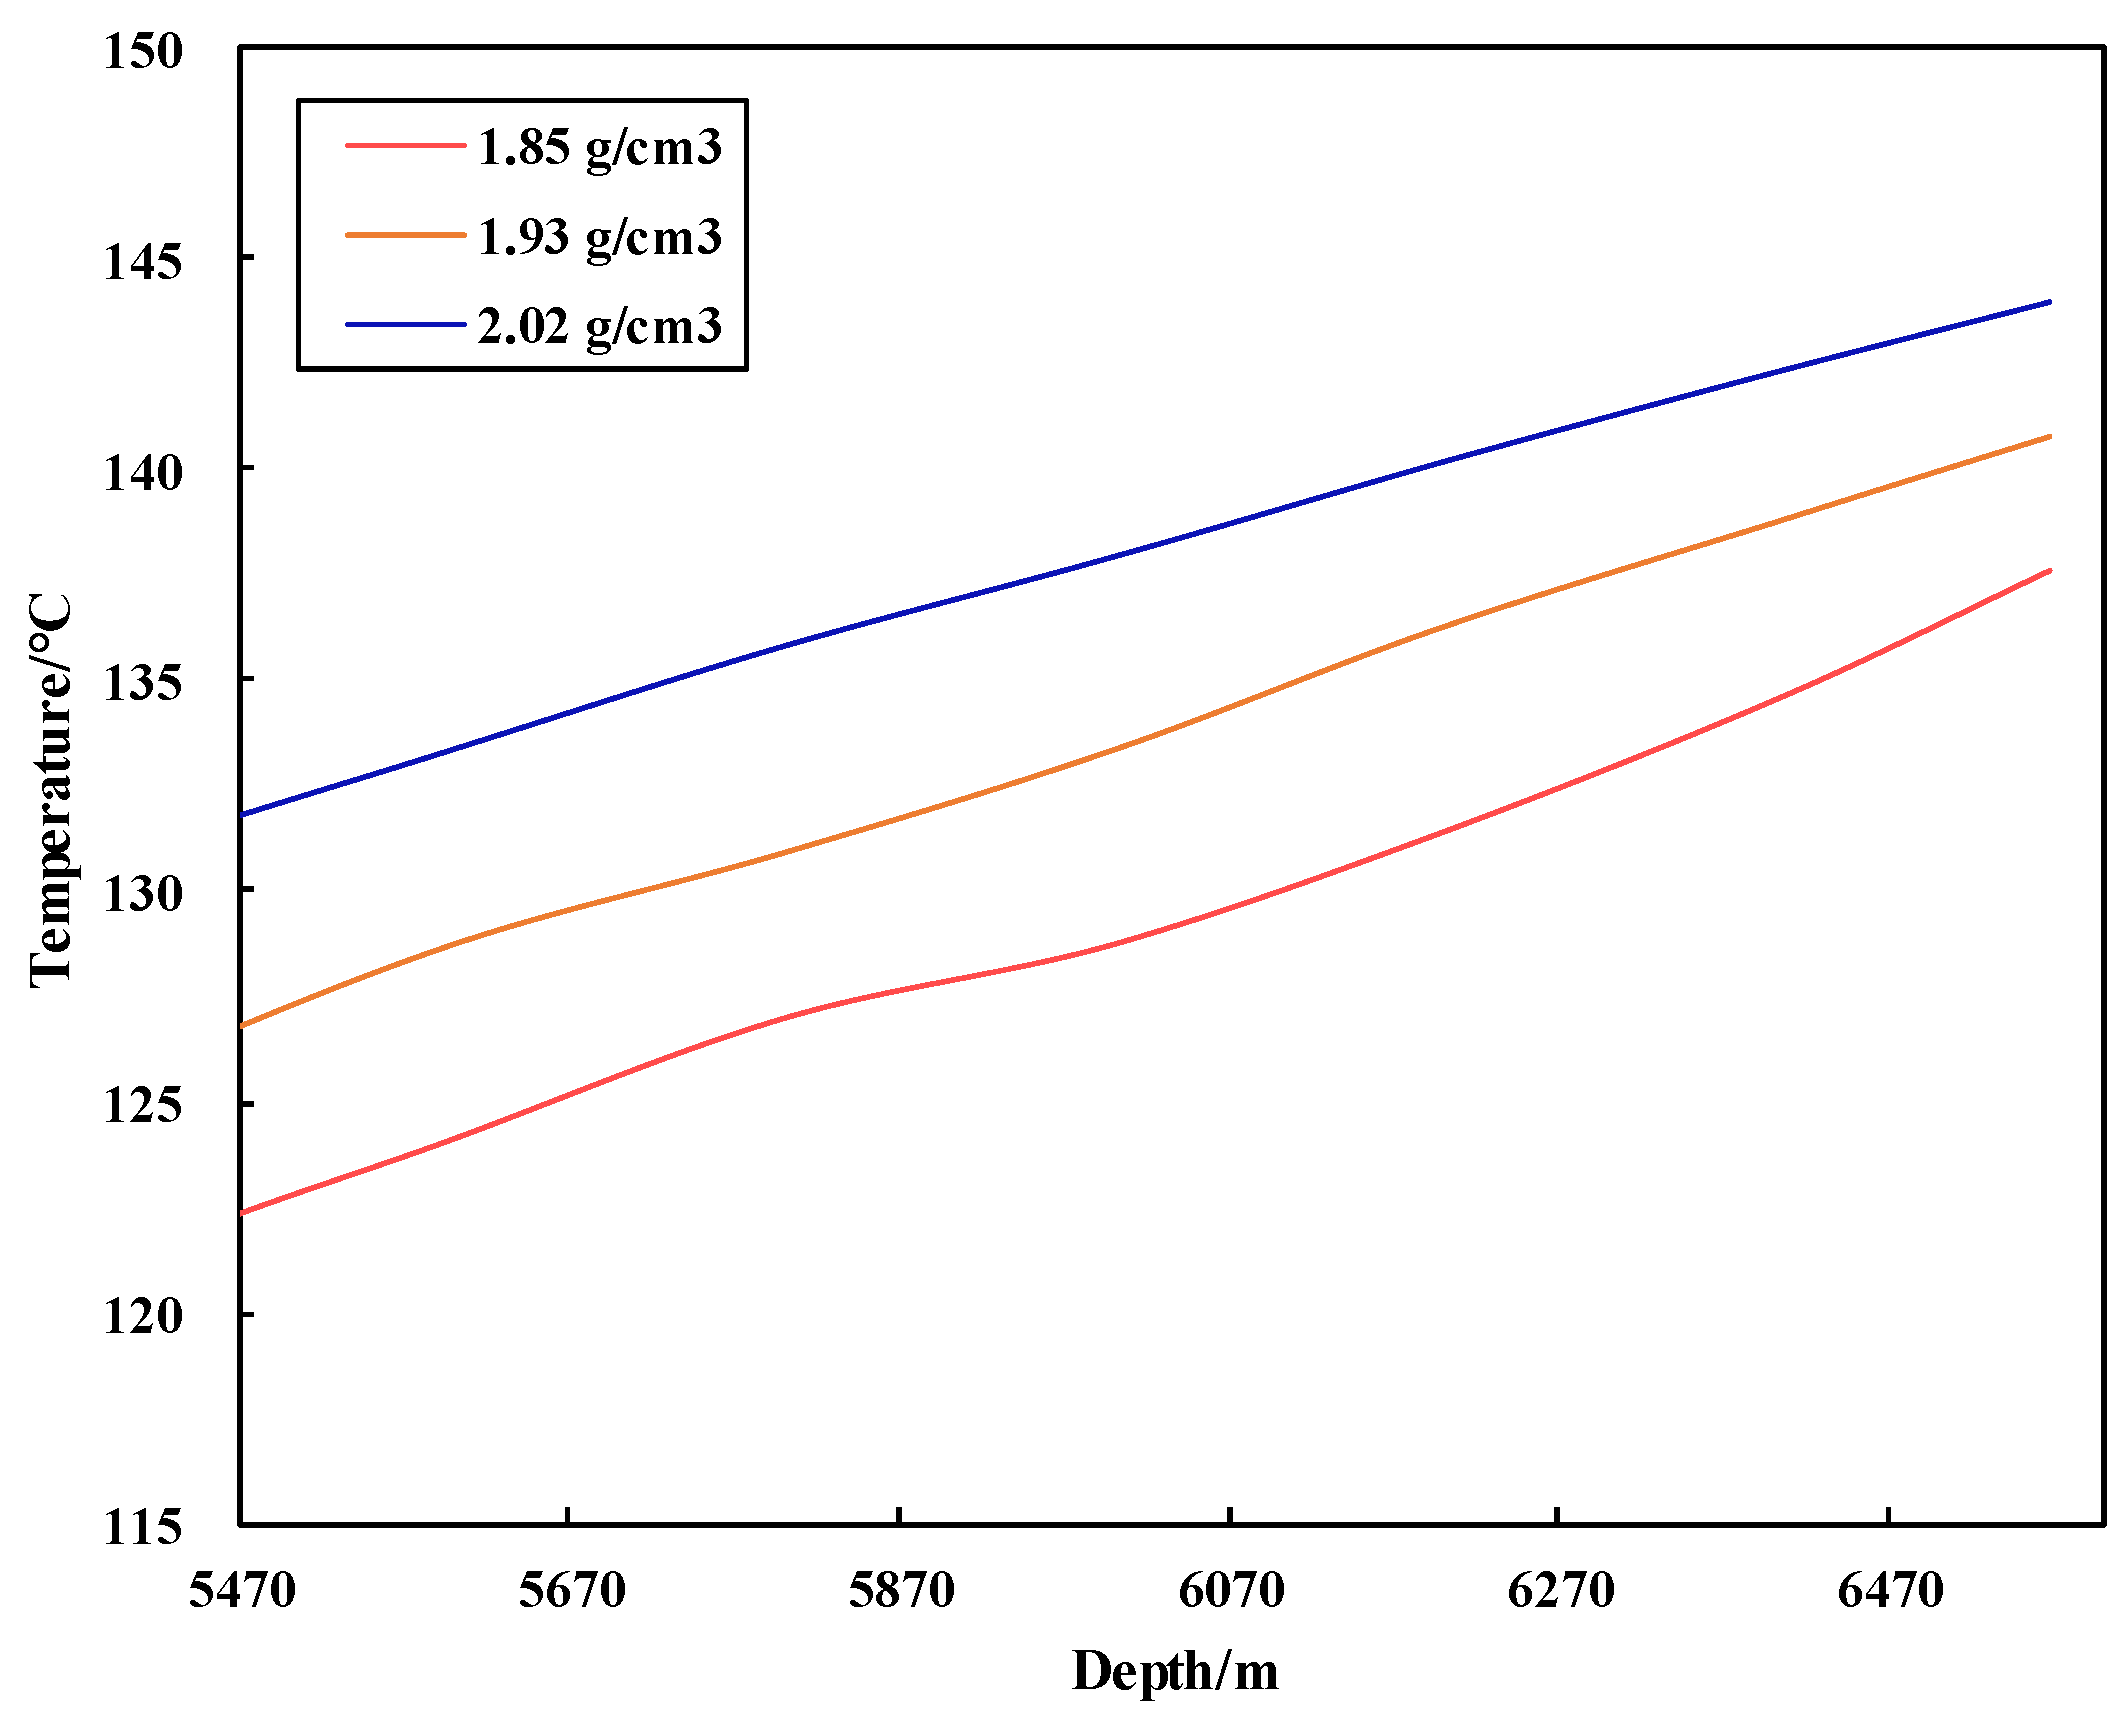
In the horizontal well section, when the drilling fluid density is reduced by 0.17 g/cm3, the bottom hole temperature decreases by 6.3 °C. When the drilling fluid flow rate is reduced by 14 L/s, the bottom hole temperature drops by 8.7 °C. Additionally, decreasing the drilling fluid inlet temperature by 30 °C results in a 4.3 °C reduction in the bottom hole temperature. These results show that reducing the density, flow rate, and inlet temperature of drilling fluid is beneficial for decreasing the bottom hole temperature in horizontal well sections.
(4)
When the drilling fluid is circulating without drilling, at a depth of 5751 m and 6251 m, the bottom hole temperature decreases by 3 °C, and the corresponding circulation times are 25 min and 15 min, respectively. The higher the temperature, the shorter the circulation time required to reduce the same degree of temperature, and the circulation flow rate should not be too large.
(5)
Bit-breaking rock, bit hydraulic horsepower, and drill pipe rotation affect the wellbore annular temperature. Therefore, it is recommended to reduce the downhole circulation temperature by measures such as decreasing the top drive rotation speed and removing the PDM near the critical temperature point of the rotary steering drilling tool.
This paper explores the influence of seven factors on wellbore annular temperature. However, due to certain assumptions made during the model-building process, the model has some limitations. The future study should focus on refining the model by determining the relationship between some parameters and temperature based on experimental results, in order to improve the prediction accuracy of the model.

Author Contributions

Conceptualization, J.F. and C.P.; Methodology, S.Z.; Software, S.Z., Y.S. and H.Z.; Validation, S.Z.; Formal analysis, S.Z., Y.S. and M.Y.; Investigation, S.Z. and Y.S.; Resources, C.P.; Writing—original draft, S.Z., J.F., C.P. and H.Z.; Visualization, H.Z.; Supervision, J.F.; Project administration, J.F., C.P. and M.Y.; Funding acquisition, J.F. and C.P. All authors have read and agreed to the published version of the manuscript.

Funding

This research was funded by National Natural Science foundation of China grant numbers 52104006 and 52174008, and Science and Technology Cooperation Project of the CNPC-SWPU Innovation Alliance grant number 2020CX040202.

Data Availability Statement

The data presented in this study are available on request from the corresponding author.

Acknowledgments

The authors would also like to thank Michael C. Sukop of Florida International University for his suggestions and help.

Conflicts of Interest

Author Yu Su was employed by the company Engineering Technology Research Institute, PetroChina Southwest Oil & Gas Field Company. The remaining authors declare that the research was conducted in the absence of any commercial or financial relationships that could be construed as a potential conflict of interest.

Nomenclature

Tpthedrilling fluid temperature in the drill pipe, °C
Qapthe heat exchange between drilling fluid in drill pipe and annular drilling fluid in radial direction, W/m
QfDthe friction heat generated by drilling fluid and inner wall of drill pipe, W/m.
Qrdthe heat generated by the rotation of the drill pipe, W/m
Qrgthe friction heat generated by the bit and the formation, W
Qnpthe heat generated by the drilling fluid passing through the nozzle, W
Qlathe heat exchange between drilling fluid and formation in radial direction, W/m
Qfathe heat generated by friction in annulus, W/m
Qp(z) Inflow heat of drilling fluid in drill pipe in axial direction, W
Qp(z + dz) Outflow heat of drilling fluid in drill pipe in axial direction, W
ρlthe density of drilling fluid in the drill pipe, kg/cm3
clthe specific heat capacity of drilling fluid in the drill pipe, j/(kg·°C)
qthe mass flow of drilling fluid, kg/s
zthe well depth, m
ttime, s
rpithe inner radius of drill pipe, m
hpithe convective heat transfer coefficient of the inner wall of the drill pipe, W/(m2·°C)
Tdthe temperature of drill pipe wall, °C
Qfpthe heat generated by friction in the drill pipe, W/m
ρdthe density of drill pipe, kg/m3
cdthe specific heat capacity of drill pipe, J/(kg·°C)
λdthe thermal conductivity of drill pipe, W/(m·°C)
rpothe outer radius of drill pipe, m
Tathe temperature of drilling fluid in annulus, °C
ξthe correction factor
fthe friction coefficient between the bit and the formation
Wthe weight on the drill bit, kN
Nthe RPM, r/min
Dthe outer diameter of the drill bit, m
dthe inner diameter of the drill bit, m
Qa(z)Inflow heat of drilling fluid in the annulus in axial direction, W
Qa(z + dz)Outflow heat of drilling fluid in the annulus in axial direction, W
hpothe convective heat transfer coefficient of the outer wall of the drill pipe, W/(m2·°C)
Uwthe comprehensive heat transfer coefficient
rthe radial distance, m
λfthe formation thermal conductivity, W/(m·K)
cfthe specific heat capacity of rock, J/(kg·°C)
ρfthe rock density, kg/m3
Tfthe formation temperature, °C
TinInlet temperature of drilling fluid at wellhead, °C
ToutOutlet temperature of drilling fluid at wellhead, °C
HkopThe well depth of the kick-off point, m
Tp_kopthe drilling fluid temperature in the drill pipe at the kick-off point, °C
Ta_kopthe drilling fluid temperature in the annulus at the kick-off point, °C
Hendthe well depth at the beginning of the horizontal section, m
Tp_endthe drilling fluid temperature in the drill pipe at the beginning of the horizontal section, °C
Ta_endthe drilling fluid temperature in the annulus at the beginning of the horizontal section, °C
hwthe convective heat transfer coefficient between formation and wellhole, W/(m2·°C)
nthe time number
ithe radial grid number
jaxial grid number

References

  1. Zou, C.D.; Yumanetal, W. Shale gas in China: Characteristics, challenges and prospects (Ⅱ). Pet. Explor. Dev. 2016, 43, 166–178. [Google Scholar] [CrossRef]
  2. Liu, P.; Feng, Y.; Zhao, L.; Li, N.; Luo, Z. Technical status and challenges of shale gas development in Sichuan Basin, China. Petroleum 2015, 1, 1–7. [Google Scholar] [CrossRef]
  3. Sun, J.; Xu, C.; Kang, Y.; Jing, H.; Zhang, J.; Yang, B.; You, L.; Zhang, H.; Long, Y. Formation damage mechannism and control strategy of the compound function of drilling fluid and fracturing fluid in shale reservoirs. Pet. Explor. Dev. 2024, 51, 380–388. [Google Scholar] [CrossRef]
  4. Nguyen, D.A.; Miska, S.Z.; Yu, M.; Saasen, A. Modeling thermal effects on wellbore stability. In Proceedings of the Trinidad and Tobago Energy Resources Conference, SPE-133428-MS, Port of Spain, Trinidad and Tobago, 27–30 June 2010. [Google Scholar] [CrossRef]
  5. Ramey, H.J., Jr. Wellbore Heat Transmission. J. Pet. Technol. 1962, 14, 427–435. [Google Scholar] [CrossRef]
  6. Holmes, C.S.; Swift, S.C. Calculation of circulating mud temperatures. JPT J. Pet. Technol. 1970, 22, 670–674. [Google Scholar] [CrossRef]
  7. Shiu, K.C.; Beggs, H.D. Predicting temperatures in flowing oil wells. J. Energy Resour. Technol. 1980, 102, 2–11. [Google Scholar] [CrossRef]
  8. Kabir, C.S.; Hasan, A.R.; Kouba, G.E.; Ameen, M.M. Determining circulating fluid temperature in drilling, workover, and well control operations. SPE Drill. Complet. 1996, 11, 74–79. [Google Scholar] [CrossRef]
  9. Li, Q.; Li, Y.; Cheng, Y.; Li, Q.; Wang, F.; Wei, J.; Liu, Y.; Zhang, C.; Song, B.; Yan, C.; et al. Numerical simulation of fracture reorientation during hydraulic fracturing in perforated horizontal well in shale reservoirs. Energy Sources Part A Recovery Util. Environ. Eff. 2018, 40, 1807–1813. [Google Scholar] [CrossRef]
  10. Li, Q.; Liu, J.; Wang, S.; Guo, Y.; Han, X.; Li, Q.; Cheng, Y.; Dong, Z.; Li, X.; Zhang, X. Numerical insights into factors affecting collapse behavior of horizontal wellbore in clayey silt hydrate-bearing sediments and the accompanying control strategy. Ocean Eng. 2024, 297, 117029. [Google Scholar] [CrossRef]
  11. Raymond, L. Temperature distribution in a circulating drilling fluid. J. Pet. Technol. 1969, 21, 333. [Google Scholar] [CrossRef]
  12. Marshall, D.W.; Bentsen, R.G. A computer-model to determine the temperature distributions in a wellbore. J. Can. Pet. Technol. 1982, 21, 63–75. [Google Scholar] [CrossRef]
  13. Yang, M.; Li, X.; Deng, J.; Meng, Y.; Li, G. Prediction of wellbore and formation temperatures during circulation and shut-in stages under kick conditions. Energy 2016, 94, 1018–1029. [Google Scholar] [CrossRef]
  14. Cai, J.; Duan, Y. Study on temperature distribution along wellbore of fracturing horizontal wells in oil reservoir. Petroleum 2015, 1, 358–365. [Google Scholar] [CrossRef]
  15. Hou, Z.; Yan, T.; Li, Z.; Feng, J.; Sun, S.; Yuan, Y. Temperature prediction of two phase flow in wellbore using modified heat transfer model: An experimental analysis. Appl. Therm. Eng. 2019, 149, 54–61. [Google Scholar] [CrossRef]
  16. Shahbazi, M.; Najafi, M.; Marji, M.F.; Rafiee, R. A thermo-mechanical simulation for the stability analysis of a horizontal wellbore in underground coal gasification. Petroleum 2023, 10, 243–253. [Google Scholar] [CrossRef]
  17. Kumar, A.; Samuel, R. Analytical model to predict the effect of pipe friction on downhole fluid temperatures. SPE Drill Complet. 2013, 28, 270–277. [Google Scholar] [CrossRef]
  18. Zhao, X.; Zhao, Y.; Wang, Z.; Chen, G.; Li, P.; Liang, W.; Gao, X.; Xu, H.; Jiang, L.; Wei, N. Wellbore temperature distribution during drilling of natural gas hydrate formation in South China sea. Petroleum 2021, 7, 451–459. [Google Scholar] [CrossRef]
  19. Yang, H.; Li, J.; Liu, G.; Wang, C.; Li, M.; Jiang, H. Numerical analysis of transient wellbore thermal behavior in dynamic deepwater multi-gradient drilling. Energy 2019, 179, 138–153. [Google Scholar] [CrossRef]
  20. Sun, W.; Pei, J.; Wei, N.; Zhao, J.; Xue, J.; Zhou, S.; Zhang, L.; Kvamme, B.; Li, Q.; Li, H.; et al. Sensitivity analysis of reservoir risk in marine gas hydrate drilling. Petroleum 2021, 7, 427–438. [Google Scholar] [CrossRef]
  21. Li, M.; Liu, G.; Li, J. Thermal effect on wellbore stability during drilling operation with long horizontal section. J. Nat. Gas Sci. Eng. 2015, 23, 118–126. [Google Scholar] [CrossRef]
  22. Yang, M.; Meng, Y.; Li, G.; Deng, J.; Zhao, X. A transient heat transfer model of wellbore and formation during the whole drilling process. Acta Pet. Sin. 2013, 34, 366–371. [Google Scholar] [CrossRef]
  23. Li, G.; Yang, M.; Meng, Y.; Wen, Z.; Wang, Y.; Yuan, Z. Transient heat transfer models of wellbore and formation systems during the drilling process under well kick conditions in the bottom-hole. Appl. Therm. Eng. 2016, 93, 339–347. [Google Scholar] [CrossRef]
  24. Zhang, Z.; Xiong, Y.; Gao, Y.; Liu, L.; Wang, M.; Peng, G. Wellbore temperature distribution during circulation stage when well_kick occurs in a continuous formation from the bottom_hole. Energy 2018, 164, 964–977. [Google Scholar] [CrossRef]
  25. Al Saedi, A.; Flori, R.; Kabir, C. New analytical solutions of wellbore fluid temperature profiles during drilling, circulating, and cementing operations. J. Pet. Sci. Eng. 2018, 170, 206–217. [Google Scholar] [CrossRef]
  26. Yang, M.; Xie, R.; Liu, X.; Chen, Y.; Tang, D.; Meng, Y. A novel method for estimating transient thermal behavior of the wellbore with the drilling string maintaining an eccentric position in deep well operation. Appl. Therm. Eng. 2019, 163, 114346. [Google Scholar] [CrossRef]
  27. Abdelhafiz, M.M.; Hegele, L.A.; Oppelt, J.F. Numerical transient and steady state analytical modeling of the wellbore temperature during drilling fluid circulation. J. Pet. Sci. Eng. 2020, 186, 106775. [Google Scholar] [CrossRef]
  28. Song, X.C.; Guan, Z.C. Full transient analysis of heat transfer during mud circulation in deep-water wells. Acta Pet. Sin. 2011, 32, 704–708. [Google Scholar] [CrossRef]
  29. Khan, N.U.; May, R. A generalized mathematical model to predict transient bottomhole temperature during drilling operation. J. Pet. Sci. Eng. 2016, 147, 435–450. [Google Scholar] [CrossRef]
  30. Yang, H.; Li, J.; Zhang, H.; Jiang, J.; Guo, B.; Zhang, G. Numerical analysis of heat transfer rate and wellbore temperature distribution under different circulating modes of Reel-well drilling. Energy 2022, 254, 124313. [Google Scholar] [CrossRef]
  31. Mao, L.; Wei, C.; Jia, H.; Lu, K. Prediction model of drilling wellbore temperature considering bit heat generation and variation of mud thermophysical parameters. Energy 2023, 284, 129341. [Google Scholar] [CrossRef]
  32. Yang, M.; Meng, Y.; Li, G.; Li, Y.; Chen, Y.; Zhao, X.; Li, H. Estimation of wellbore and formation temperatures during the drilling process under lost circulation conditions. Math. Probl. Eng. 2013, 2013, 1943–1997. [Google Scholar] [CrossRef]
  33. Memarzadeh, F.; Miska, S. Numerical simulation of diamond-bit drilling with air. In Proceedings of the SPE Rocky Mountain Regional Meeting, Casper, WY, USA, 21 May 1984. [Google Scholar] [CrossRef]
Figure 1. Schematic diagram of downhole drilling fluid circulation.
Processes 12 01402 g001
Figure 2. Heat unit transfer model between fluid in drill pipe, drill pipe, annular fluid, and formation during drilling.
Processes 12 01402 g002
Figure 3. Grid division of wellbore stratum two-dimensional area.
Processes 12 01402 g003
Figure 4. Naming rules of coefficients in matrix equation.
Processes 12 01402 g004
Figure 5. Model verification results. (a) No.1 well; (b) No.2 well; (c) No.3 well.
Processes 12 01402 g005
Figure 6. Temperature change with well depth during drilling in the shale gas horizontal section with a PDM.
Processes 12 01402 g006
Figure 7. Variation of annular temperature with well depth at different RPM of PDM.
Processes 12 01402 g007
Figure 8. Variation of annular temperature with well depth under different drill pipe sizes.
Processes 12 01402 g008
Figure 9. Friction-induced heat of drill pipe.
Processes 12 01402 g009
Figure 10. Convective heat transfer coefficient.
Processes 12 01402 g010
Figure 11. Variation of annular temperature with well depth under different drilling fluid densities.
Processes 12 01402 g011
Figure 12. Variation curve of annular temperature with well depth under different drilling fluid flow rates.
Processes 12 01402 g012
Figure 13. Variation of annular temperature with well depth at different inlet temperatures of drilling fluid.
Processes 12 01402 g013
Figure 14. Relationship between drilling time and wellbore temperature in horizontal wells.
Processes 12 01402 g014
Figure 15. Relationship between circulation time and annular temperature in horizontal wells.
Processes 12 01402 g015
Figure 16. Variation of bottom hole temperature with circulating time under different circulating flow rates.
Processes 12 01402 g016
Figure 17. Influence of bit breaking rock, bit hydraulic horsepower, and drill pipe rotation on wellbore temperature.
Processes 12 01402 g017
Figure 18. Influence of different heat sources on wellbore temperature.
Processes 12 01402 g018
Table 1. The temperature parameters of the validation model.
Geothermal Gradient/(°C/100 m)Wellhead Temperature/°C
No.1 well3.031
No.2 well3.039
No.3 well3.038
Table 2. Well structure data of No.2 horizontal well.
Number of SpuddingBorehole Size
/mm
Well Depth
/m
Casing Size
/mm
Casing Depth
/m
First-spudding660.4200508198
Second-spudding406.42609339.72607
Third-spudding311.24008244.474006
Four-spudding215.96640139.76638
Table 3. Drilling parameters.
Drilling Fluid
Density/(g/cm3)
Plastic Viscosity/(mPa⋅s)Stand Pipe
Pressure/MPa
Flow Rate
/(L/s)
WOB
/KN
RPM
/(r/min)
1.9~2.0645–5736–3931–328075–90
Table 4. BHA of No.2 horizontal well.
Drilling Tool NameOutside Diameter
/mm
Inner Diameter
/mm
Length
/m
Unit Weight
/(N/m)
PDC bit215.900.23300
Drill collar171.557.211.51582.7
Heavy-weight drill pipe12776.210720.3
PDM17257.291582.7
Heavy-weight drill pipe12776.227720.3
drilling jar17278101580
Heavy-weight drill pipe12776.218720.3
Drill pipe127108.612600284.58
Drill pipe139.7118.623954.27360.47
Table 5. Thermophysical parameters of heat transfer medium.
MediumDensity
/(g/cm3)
Specific Heat Capacity
/(J/kg·°C)
Thermal Conductivity
/(W/(m·°C))
Drilling fluid2.0615100.75
Tubular column7.8040043.75
Rock2.648372.25
Disclaimer/Publisher’s Note: The statements, opinions and data contained in all publications are solely those of the individual author(s) and contributor(s) and not of MDPI and/or the editor(s). MDPI and/or the editor(s) disclaim responsibility for any injury to people or property resulting from any ideas, methods, instructions or products referred to in the content.

