


Highly Adsorptive Organic Xerogels for Efficient Removal of Metformin from Aqueous Solutions: Experimental and Theoretical Approach

 , , , ,
Abstract
1. Introduction
2. Materials and Methods
2.1. Reactants
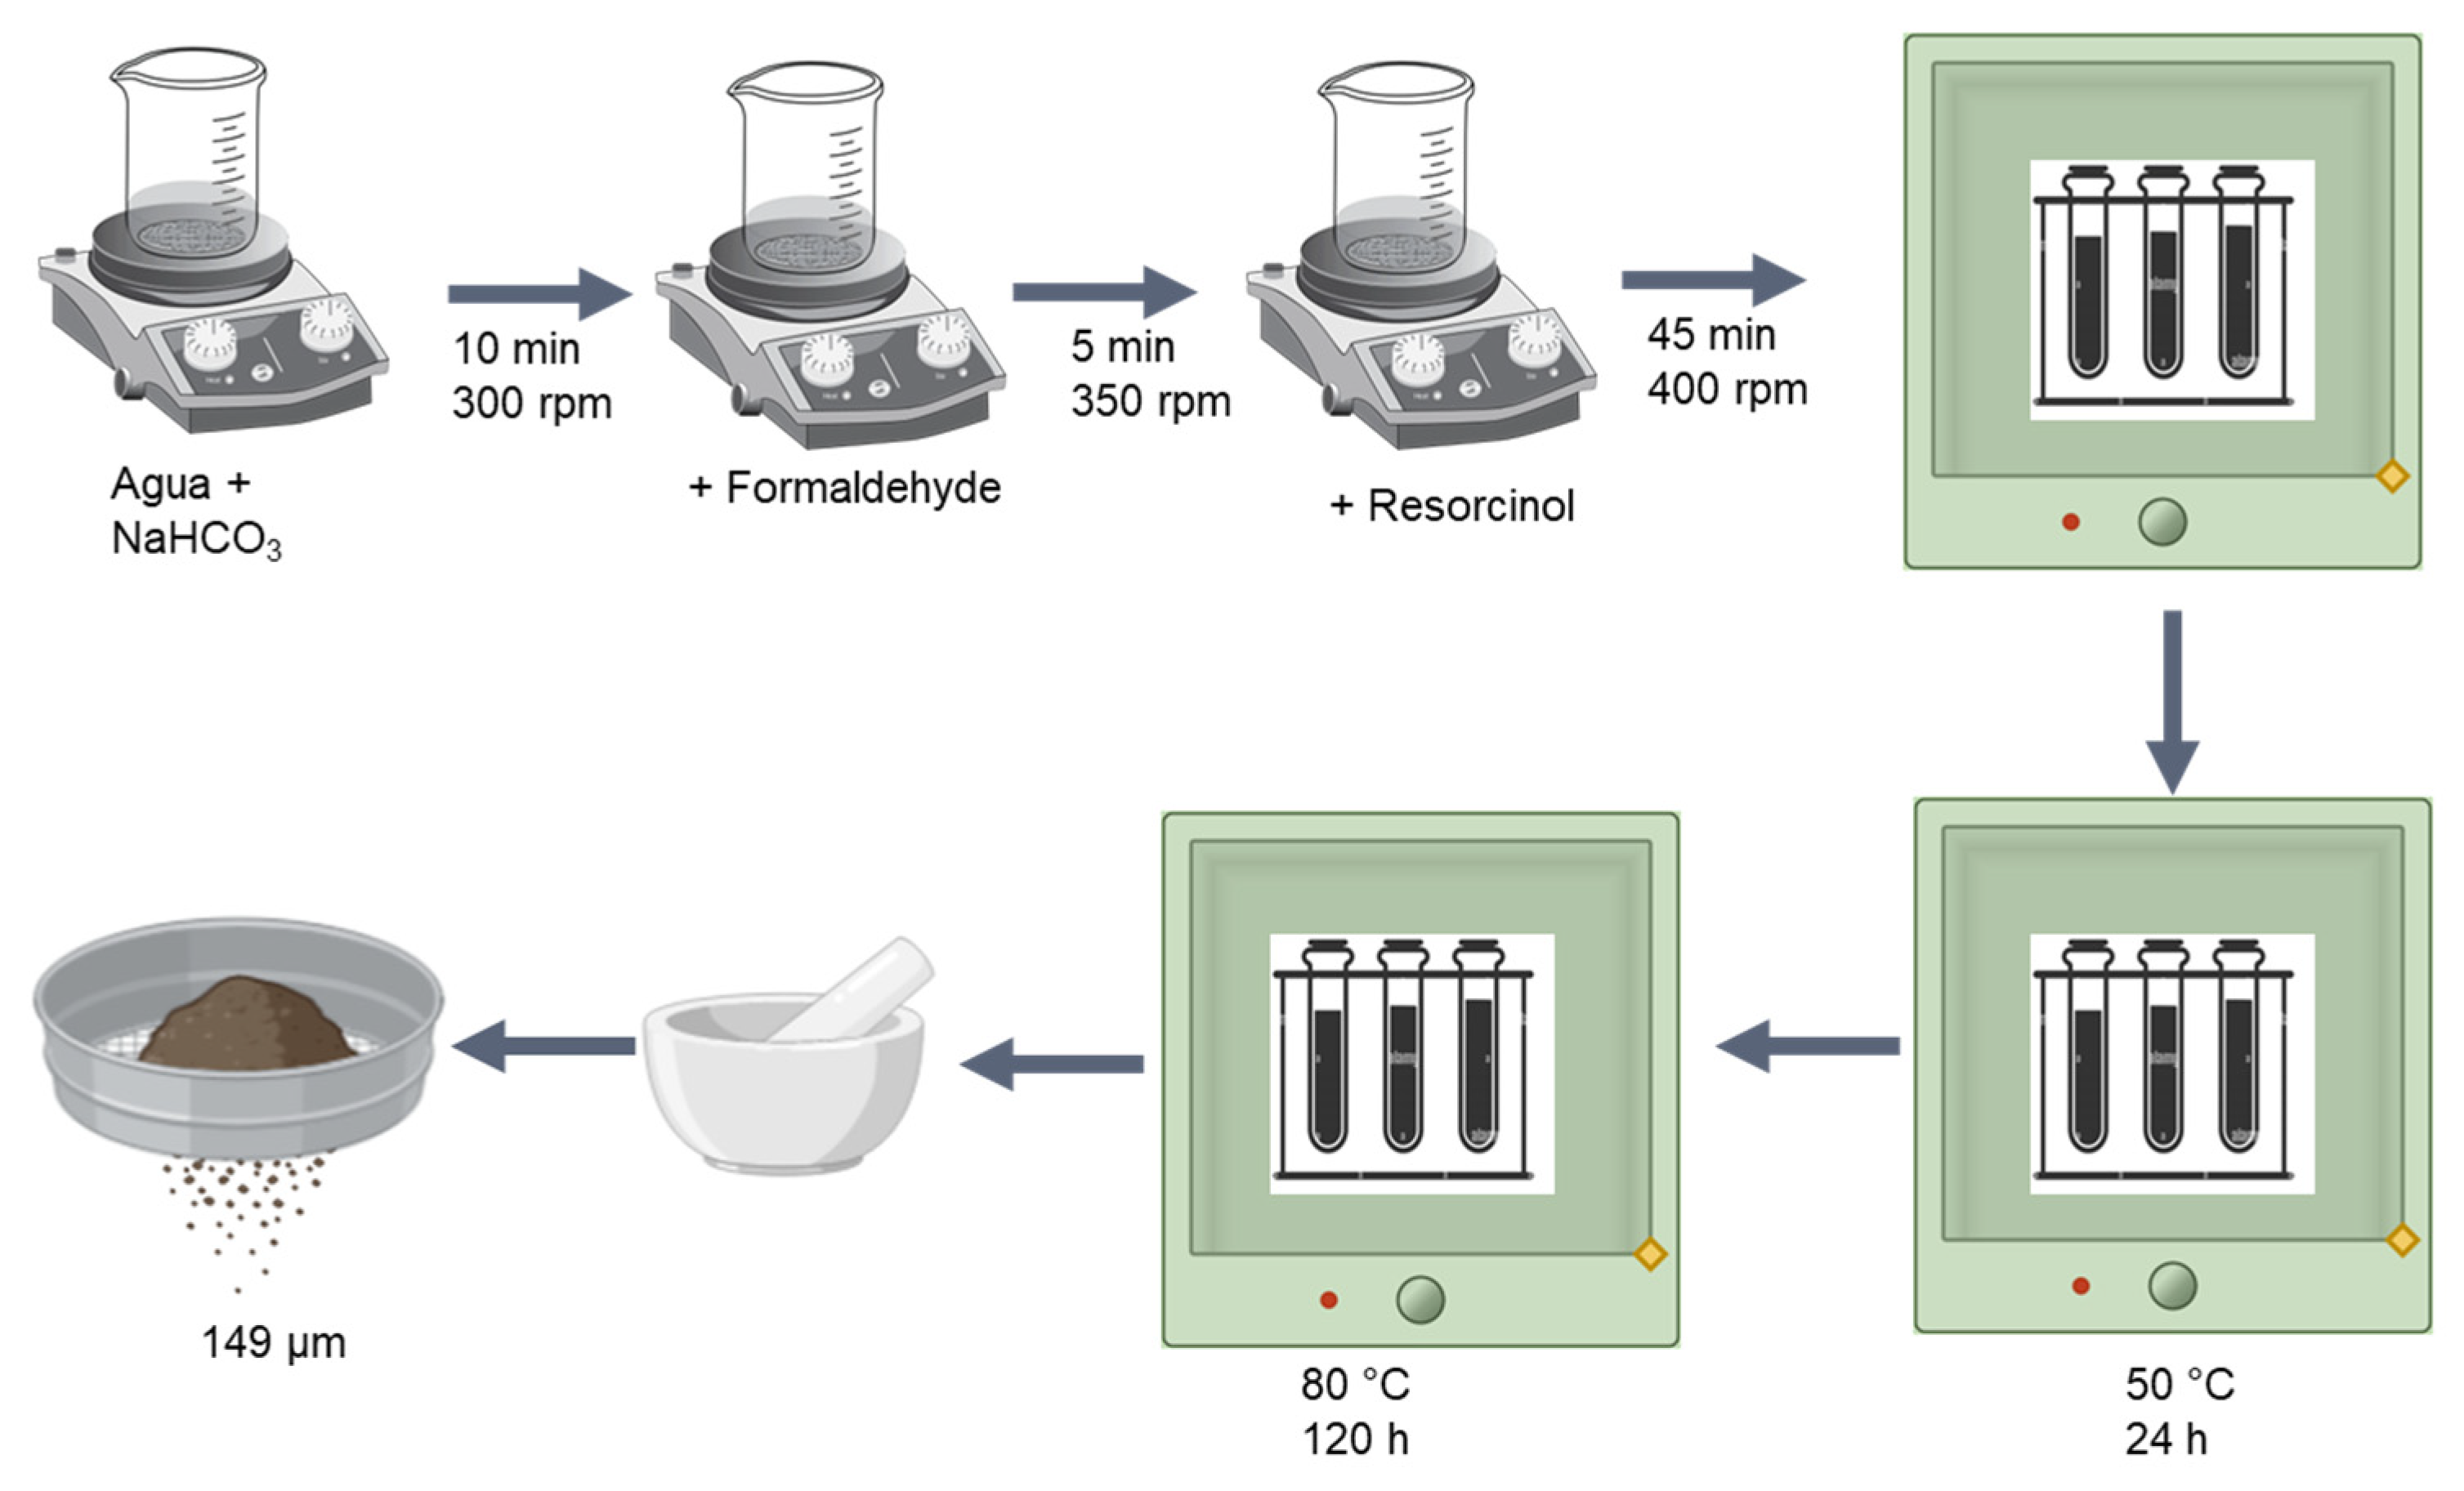
2.2. Xerogel Synthesis
2.3. Characterization of Xerogels
2.4. Determination of Metformin in Aqueous Solution
2.5. Metformin Adsorption Equilibrium
2.6. DFT Calculations
3. Results and Discussion
3.1. Xerogel Obtention Process
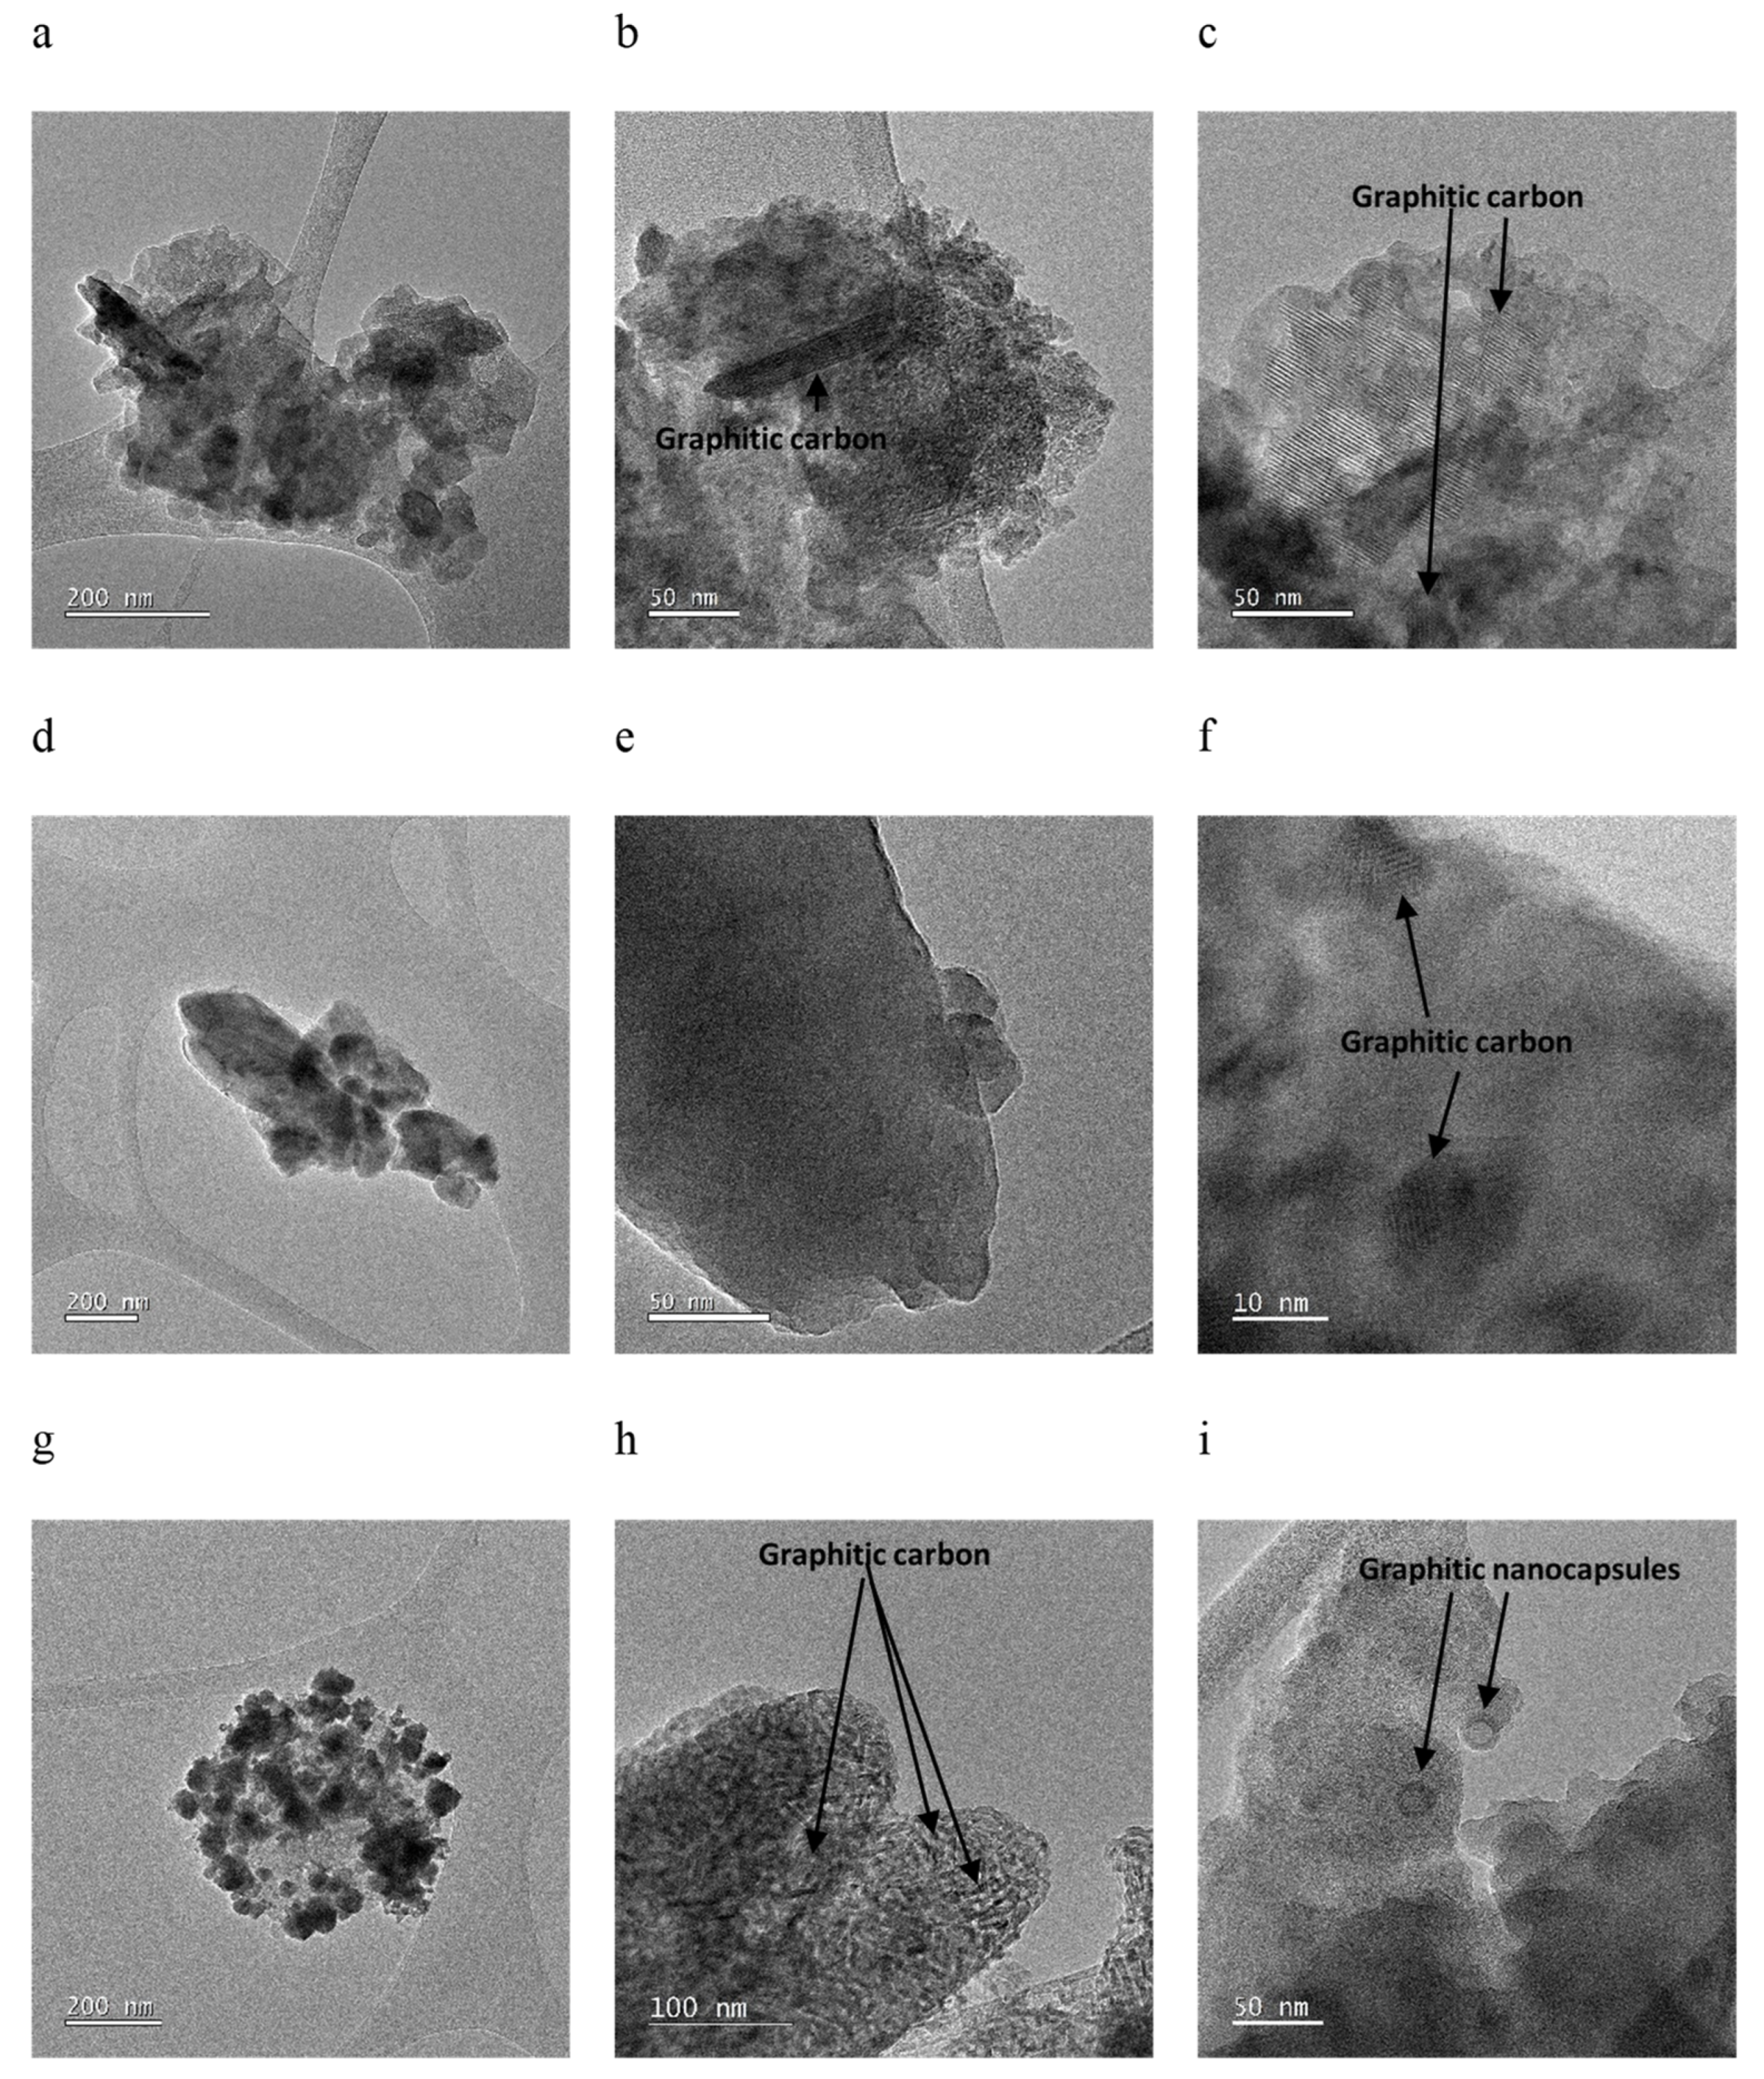
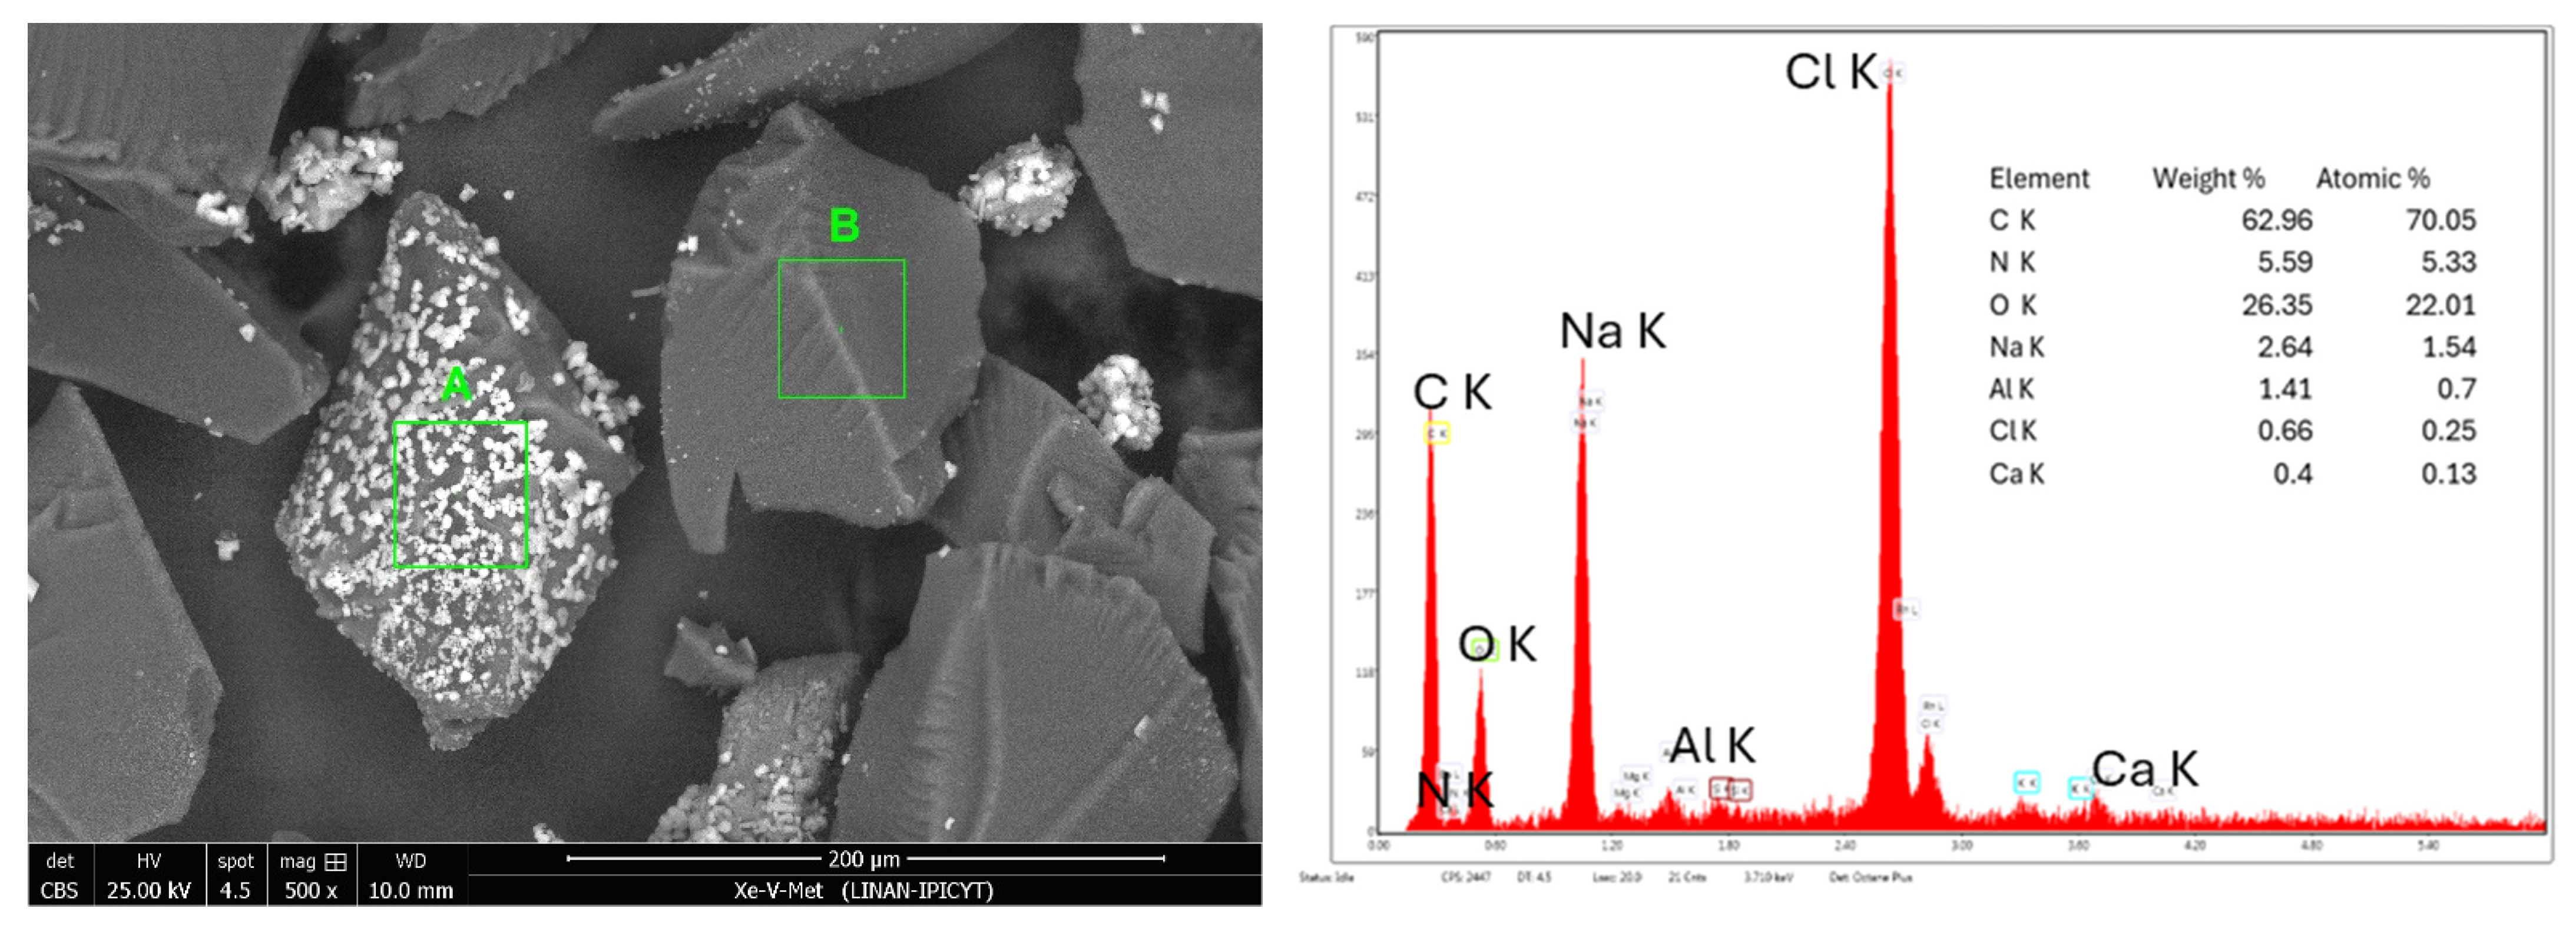
3.2. Physicochemical Characterization of Xerogels
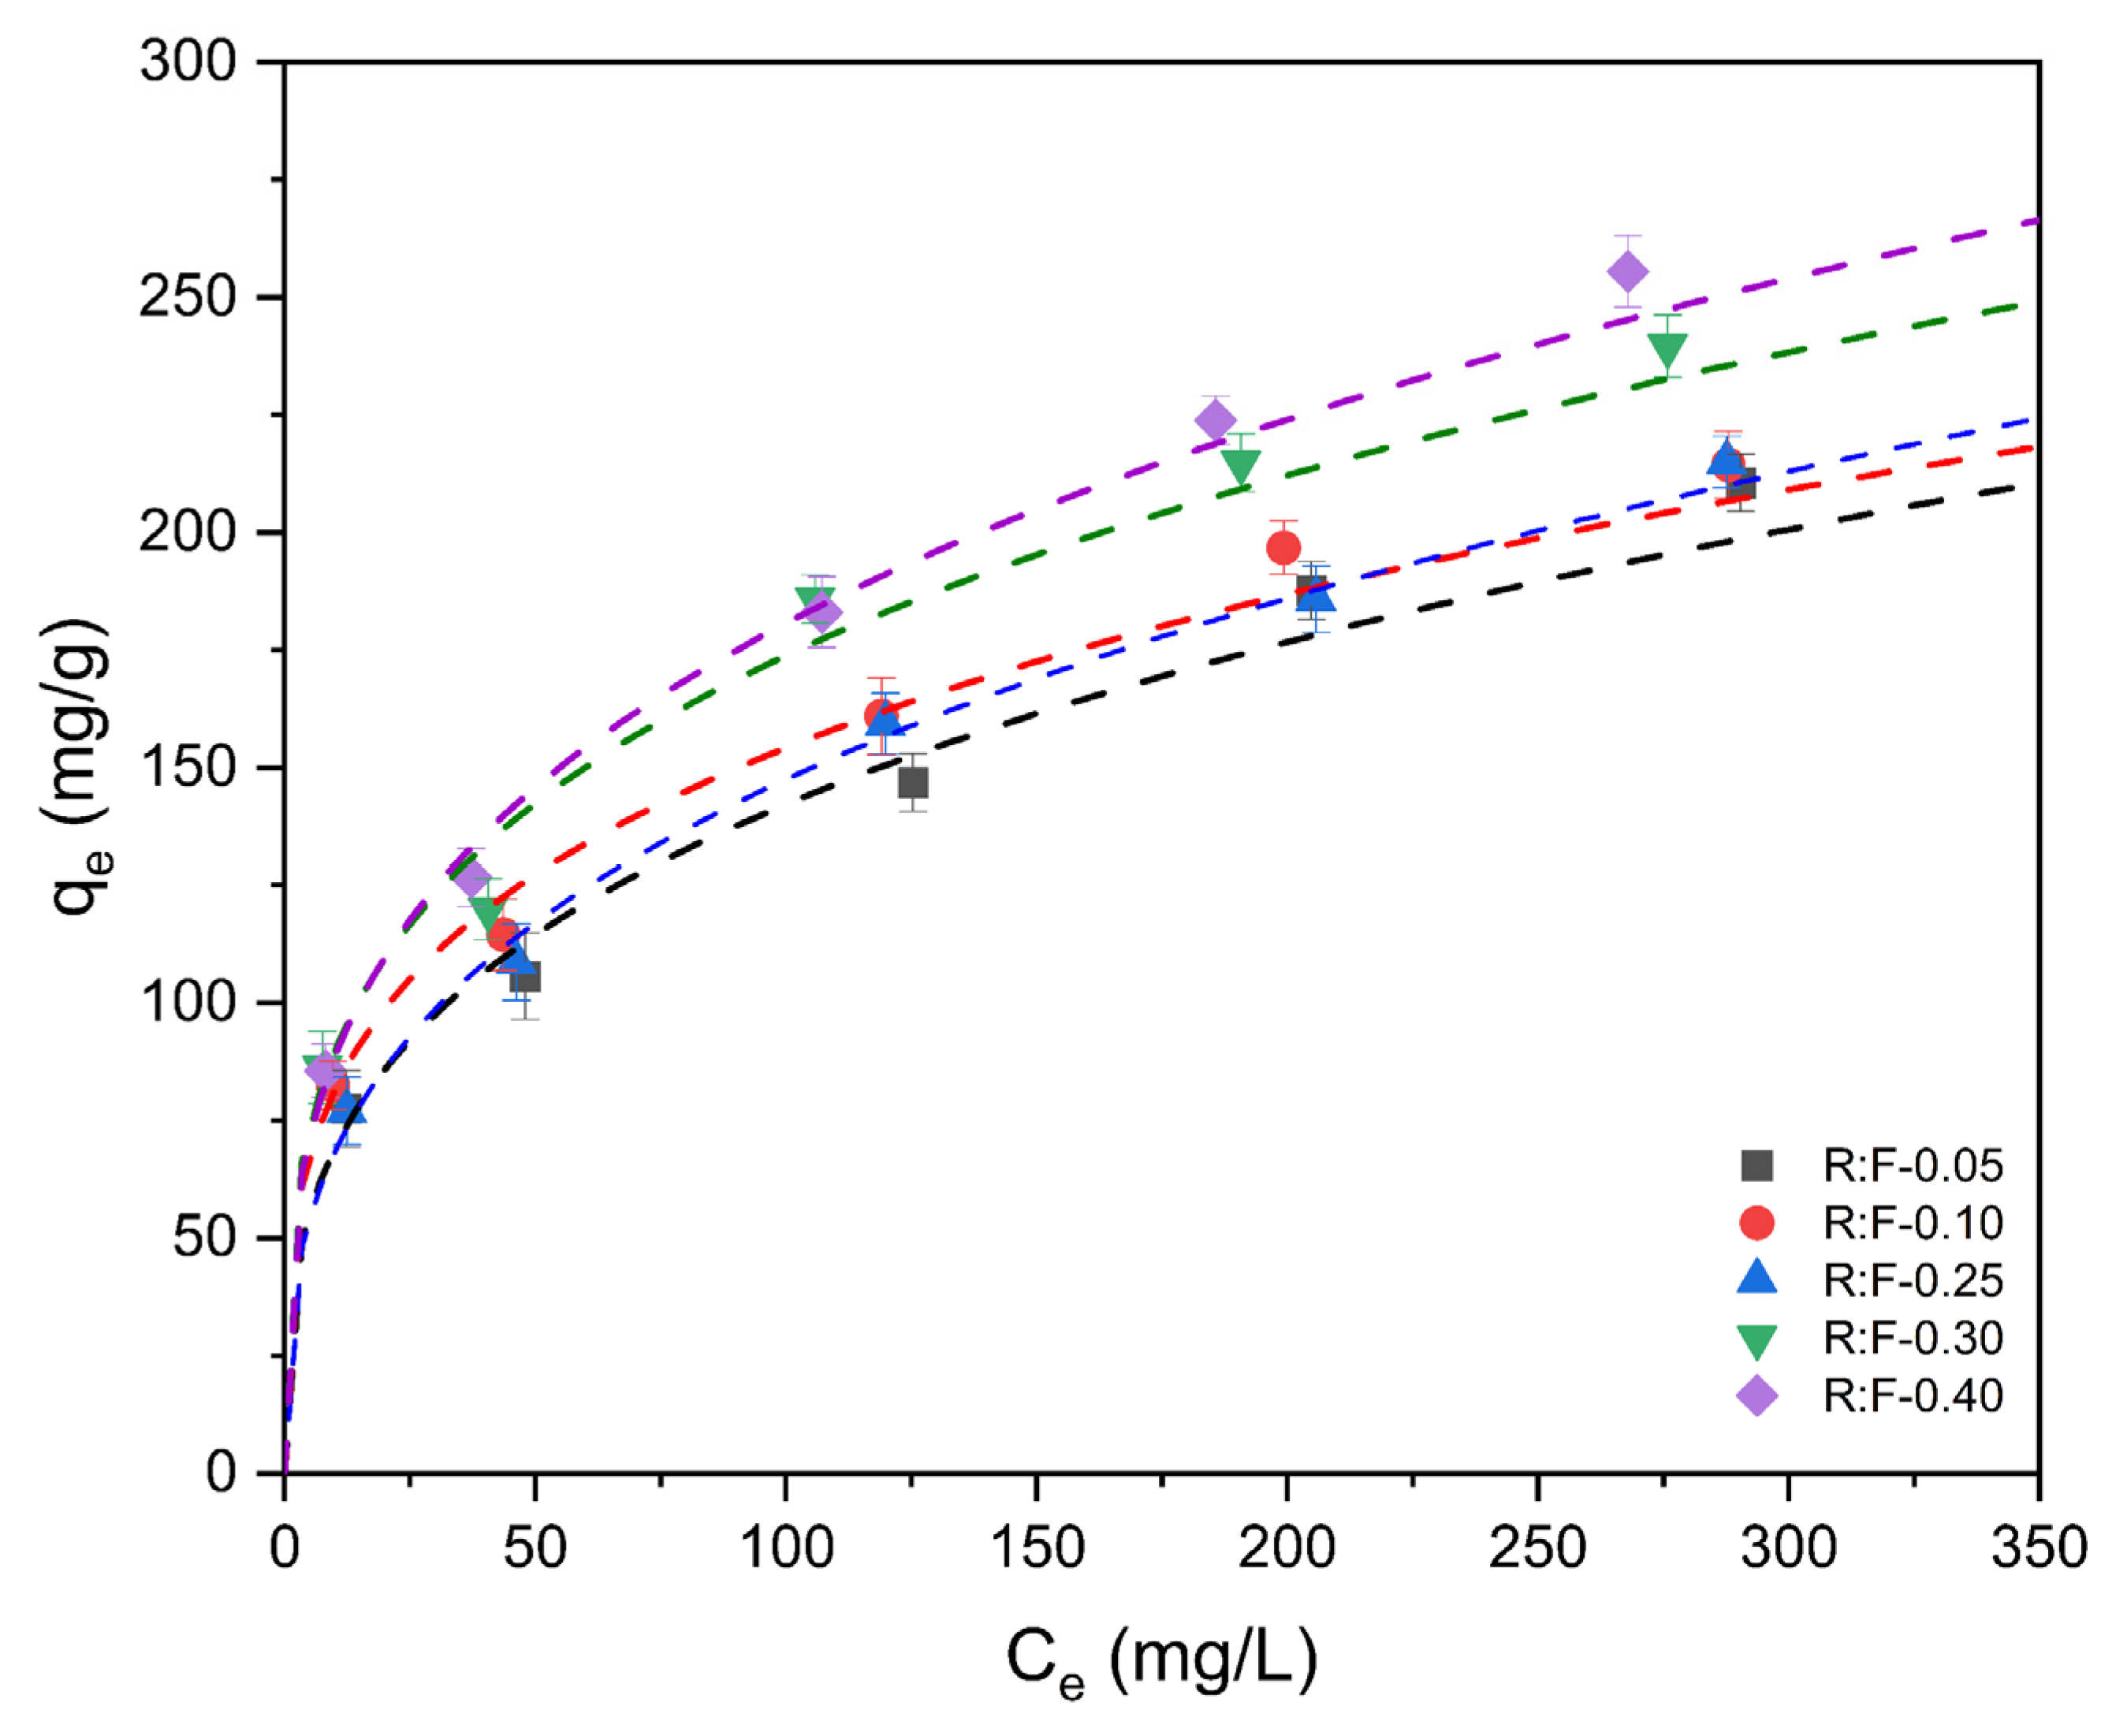
3.3. Adsorption Equilibrium
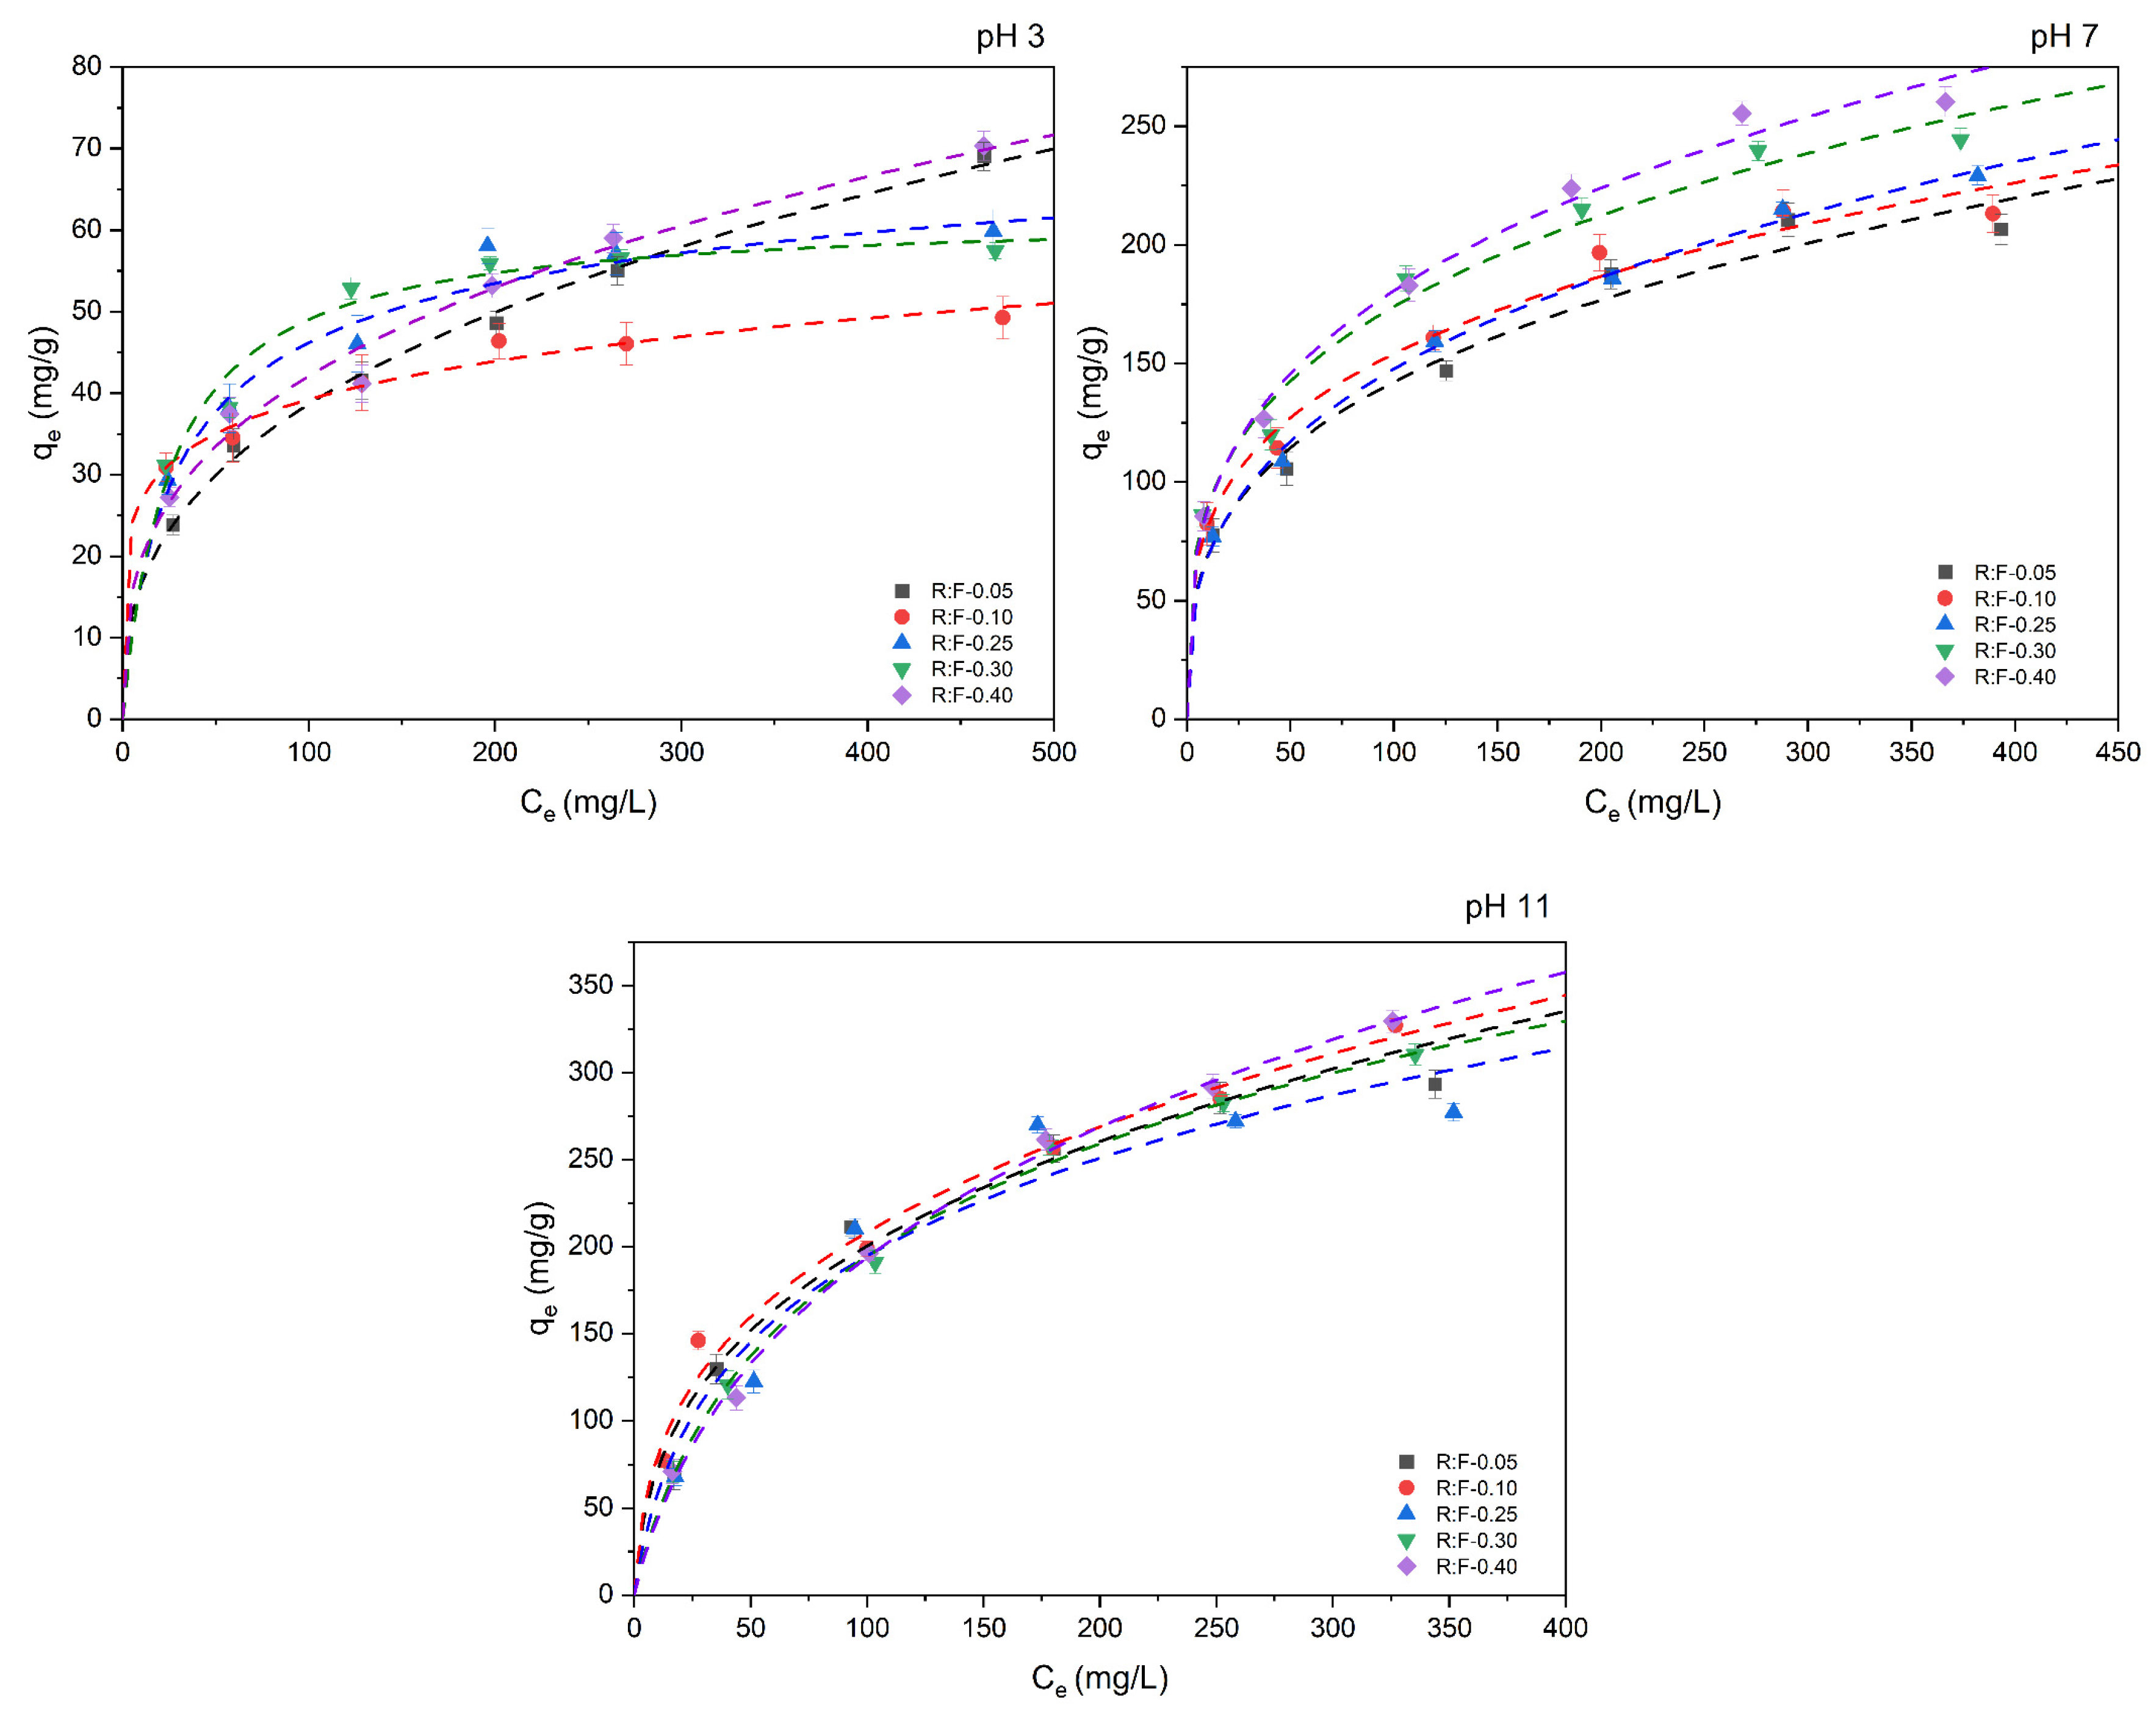
3.3.1. Effect of pH
3.3.2. Effect of Temperature and Thermodynamic Analysis
- ΔHads = Adsorption heat, J/mol.
- K = Langmuir isothermal equilibrium constant related to adsorption enthalpic, L/mg.
- R = Universal constant of ideal gases, 8.314 J/mol K.
- T = Temperature, K.
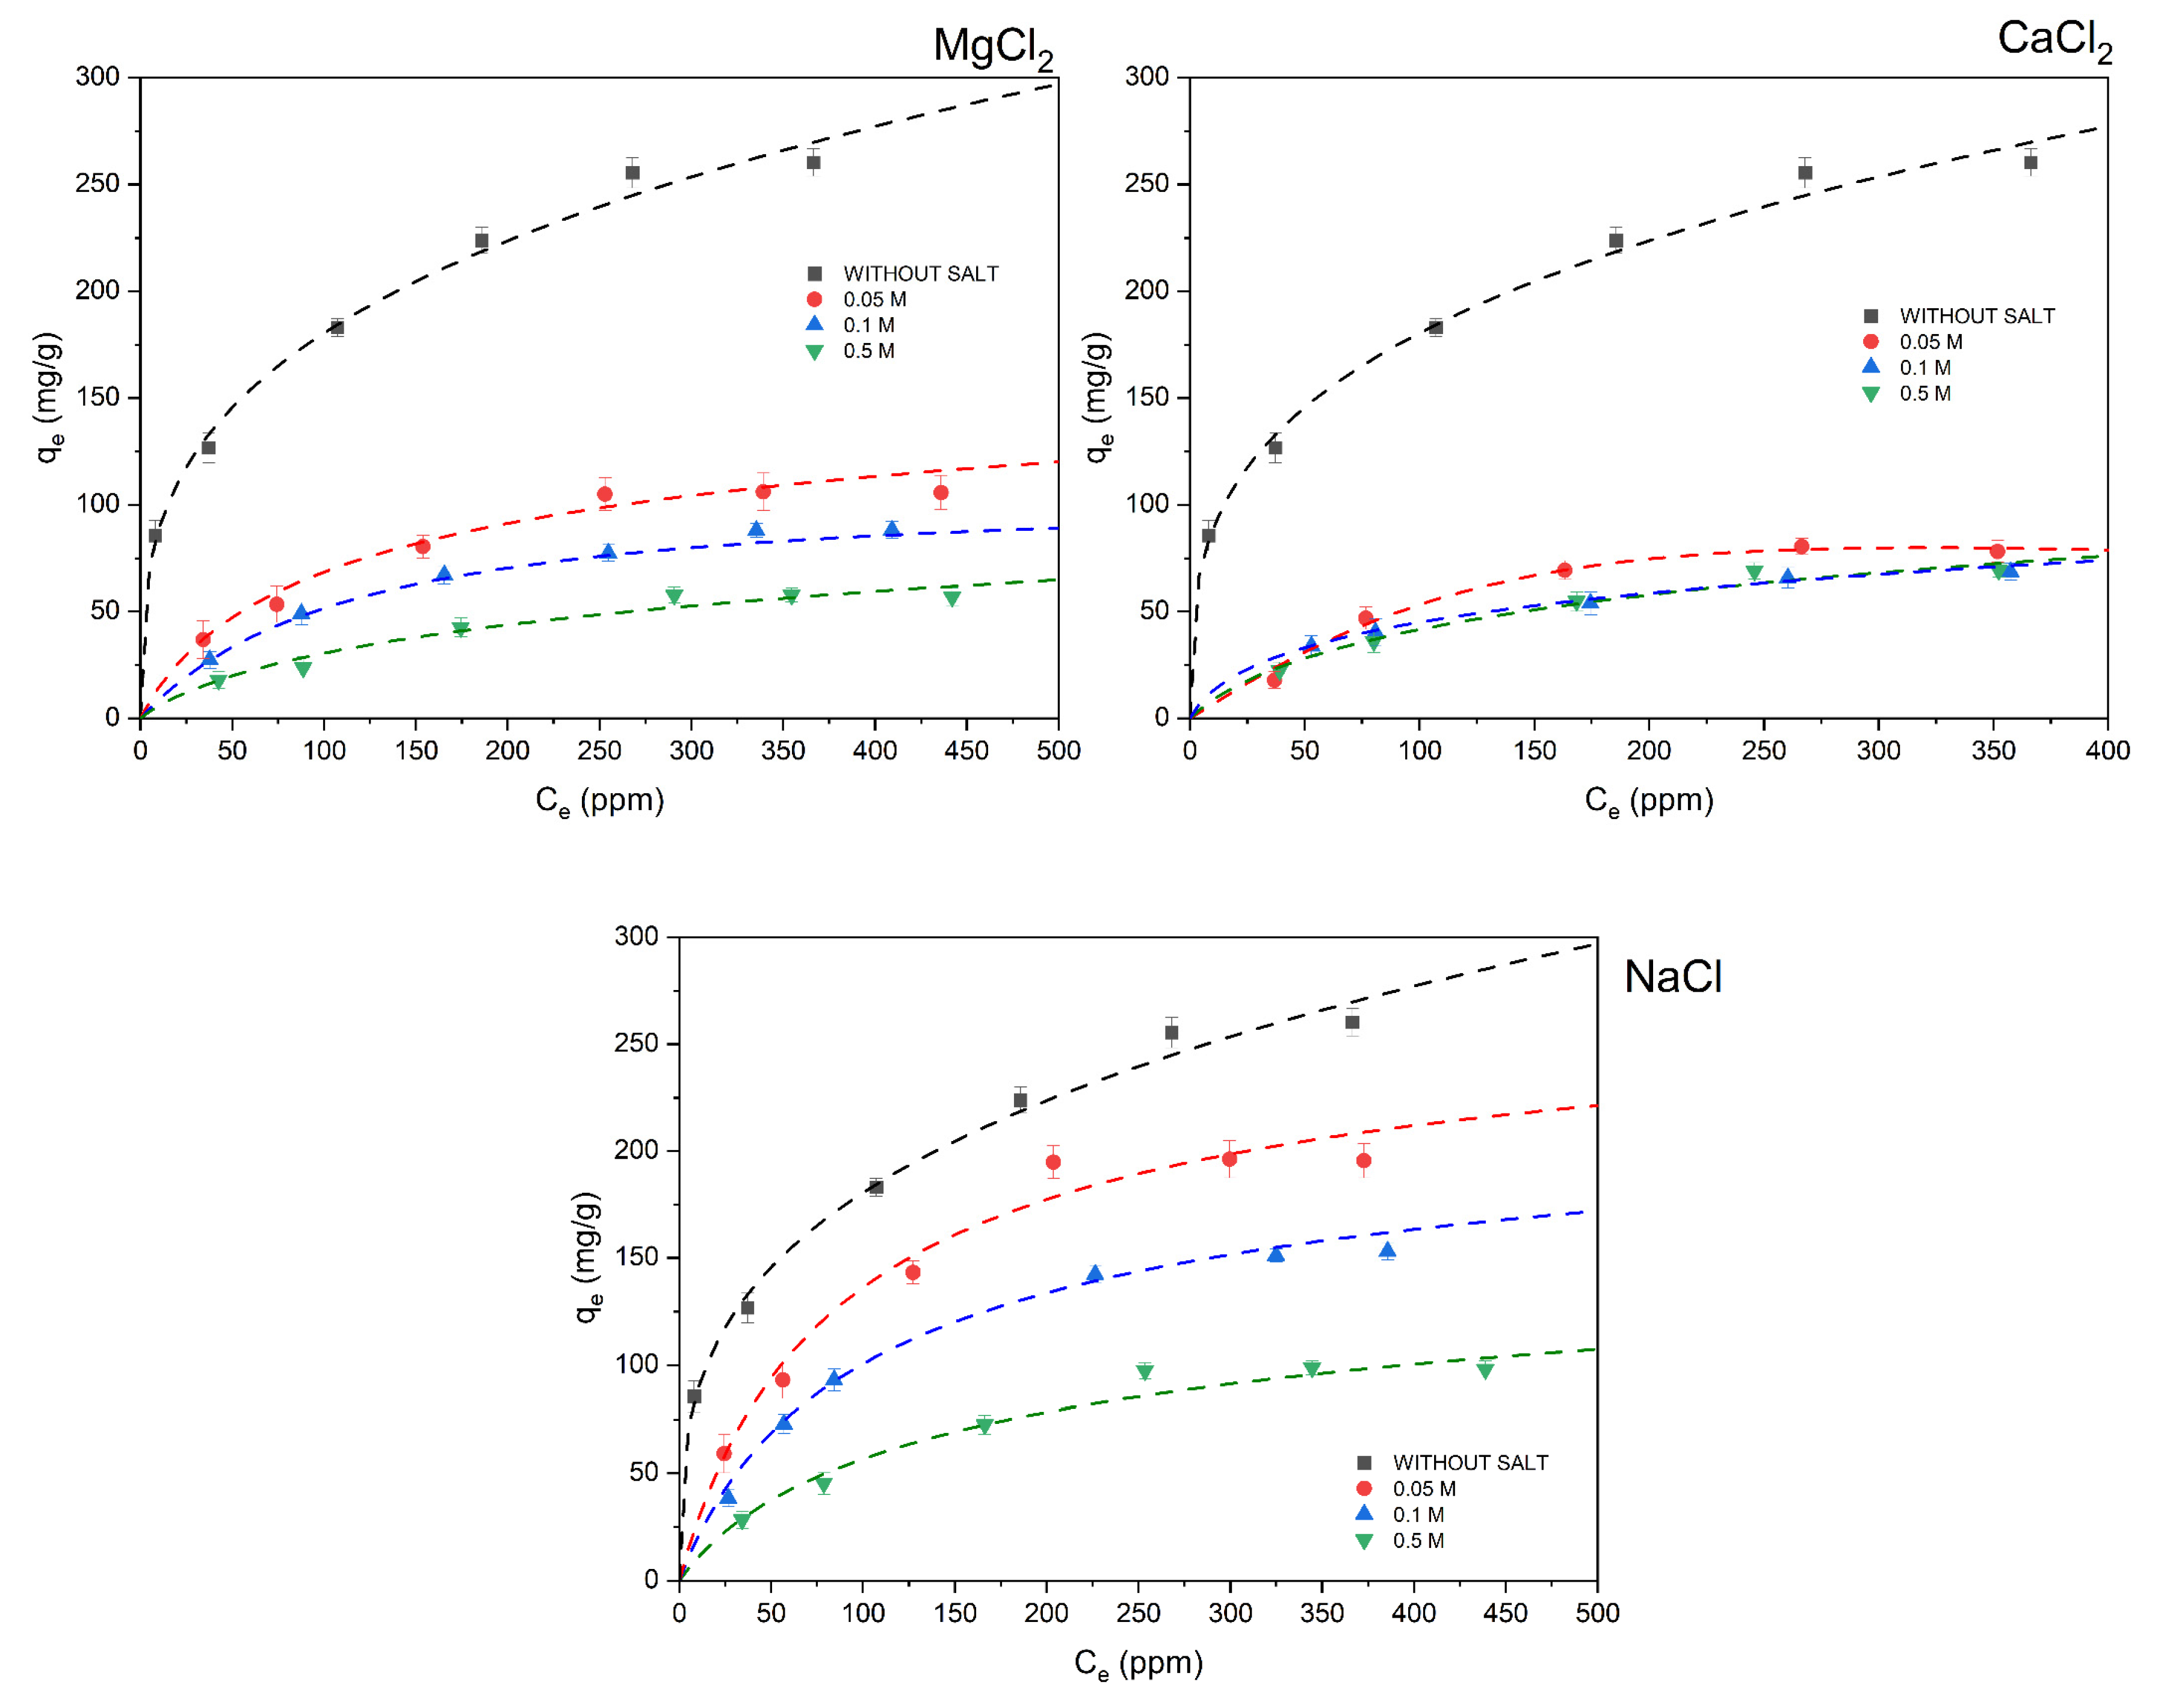
3.3.3. Effect of Competitive Ions
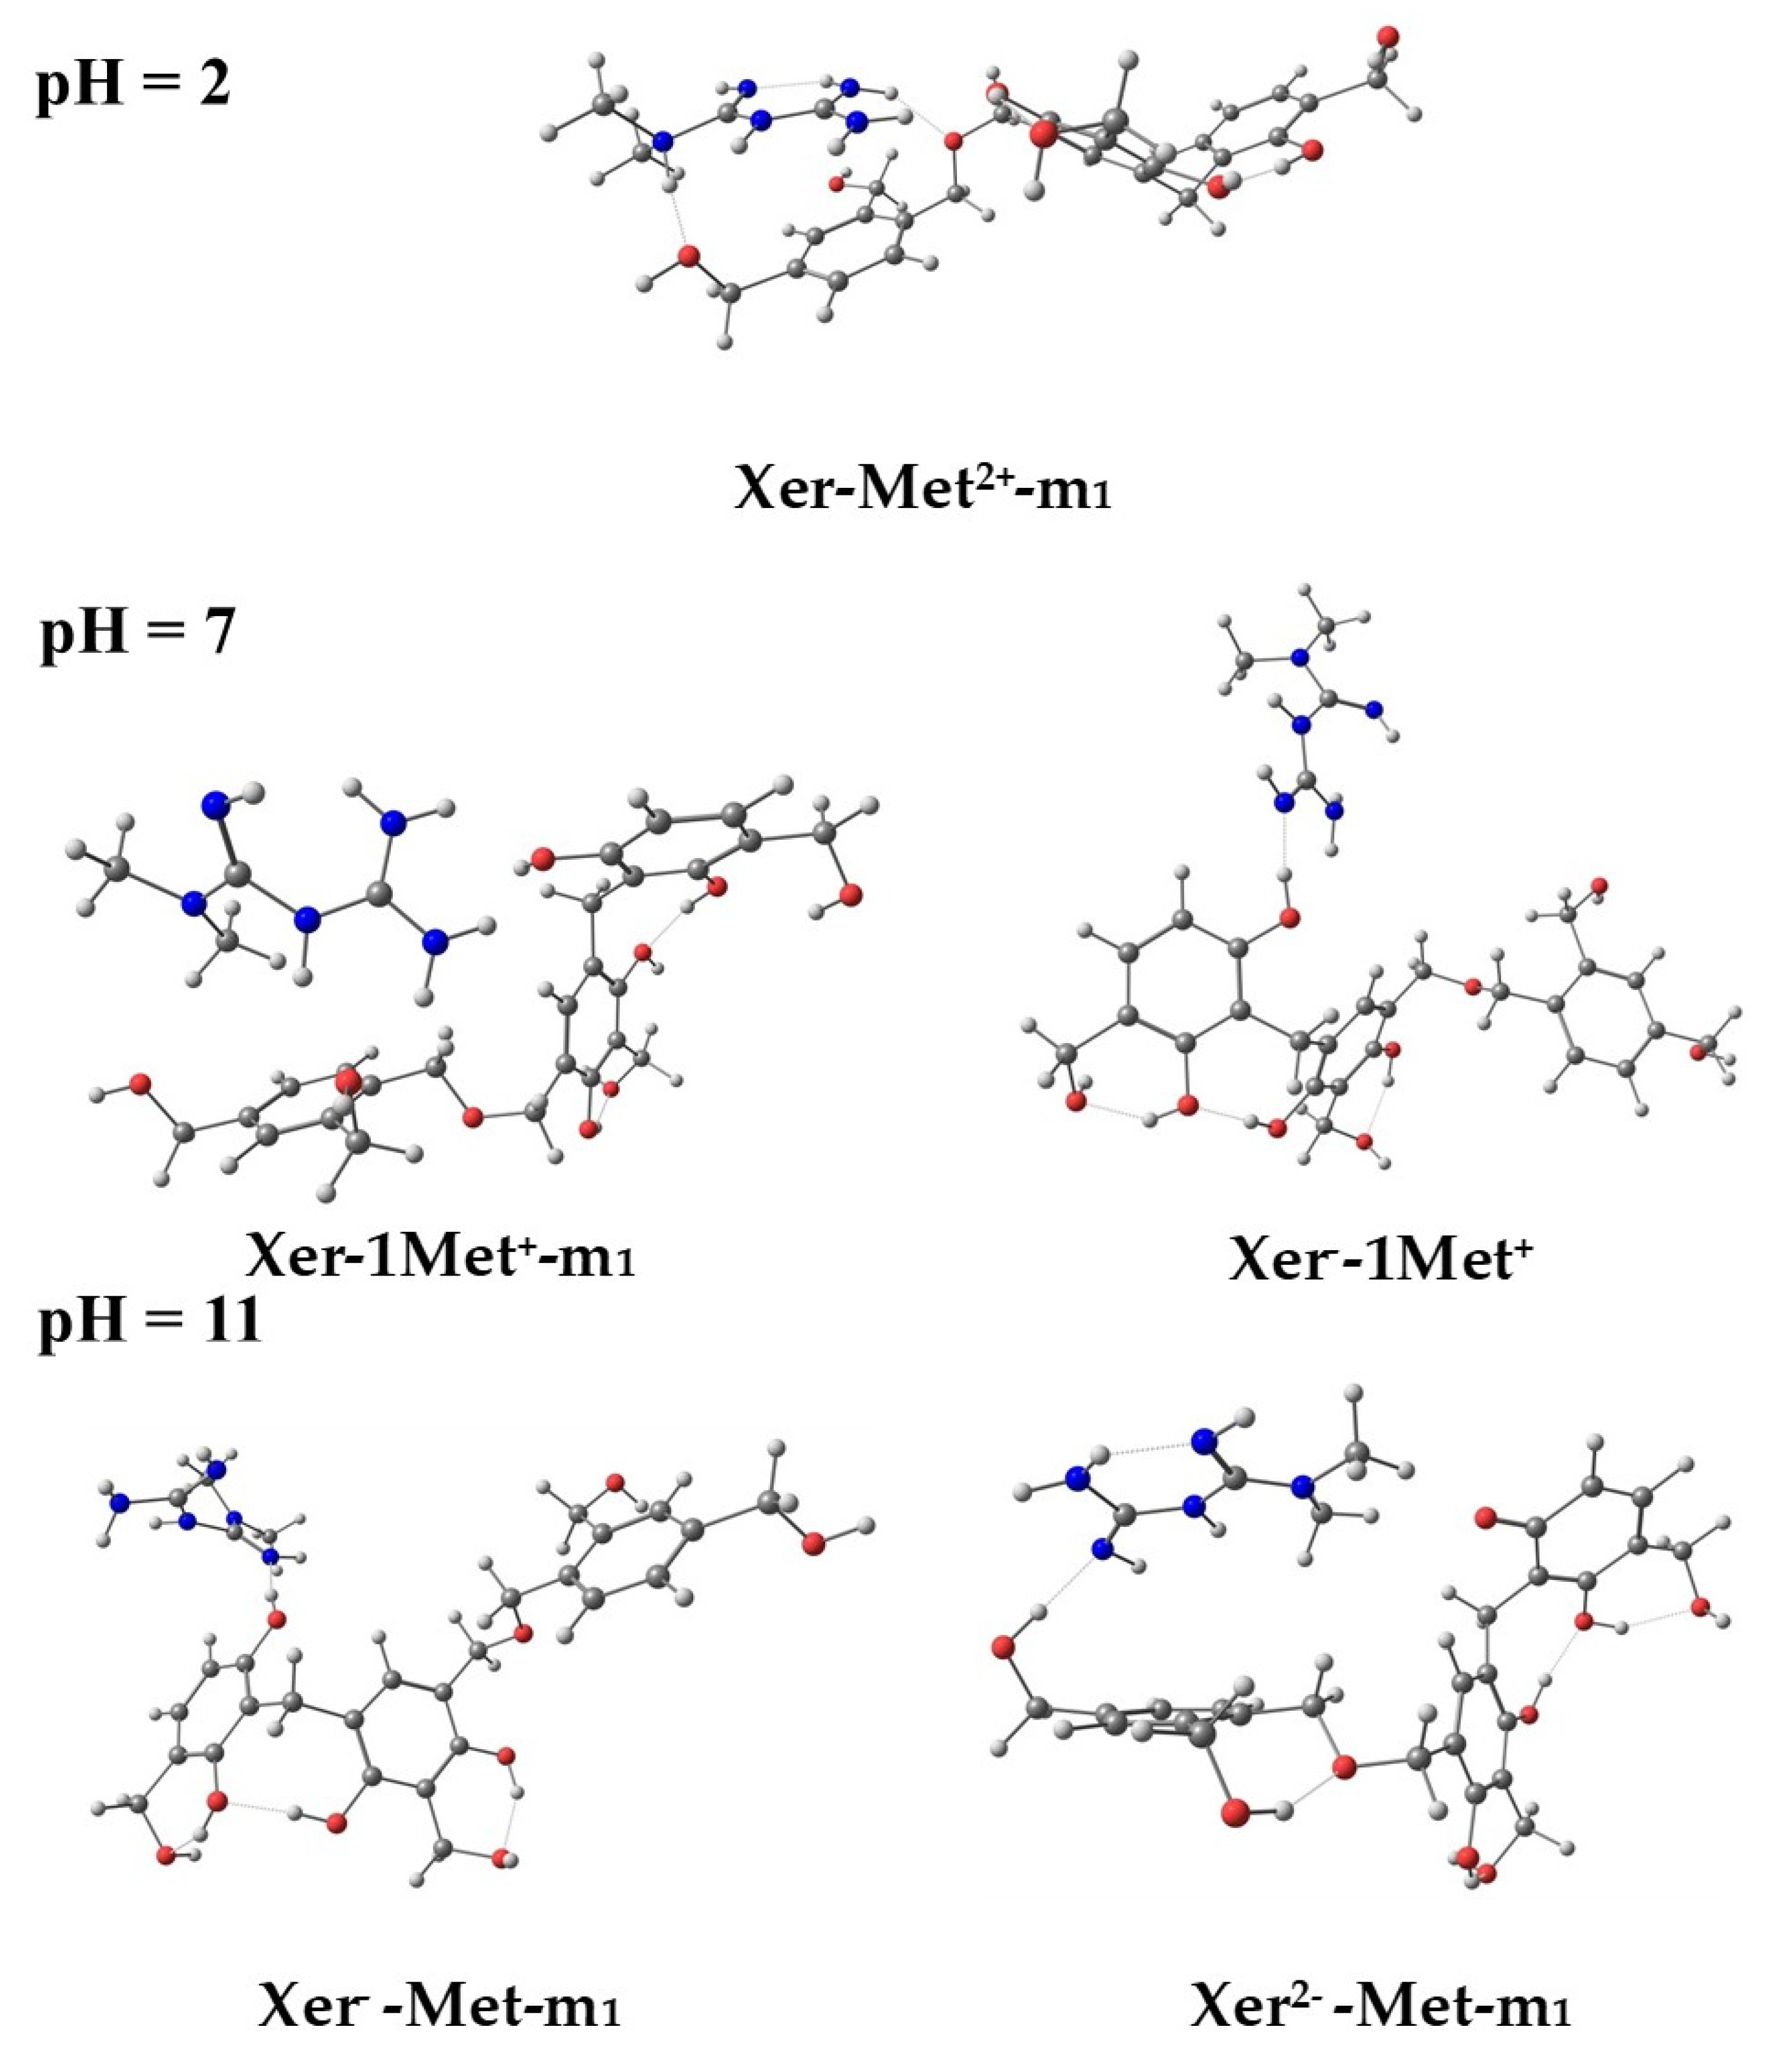
3.3.4. Computational Results on the Adsorption of Metformin
3.3.5. Adsorption in Simulated Urine
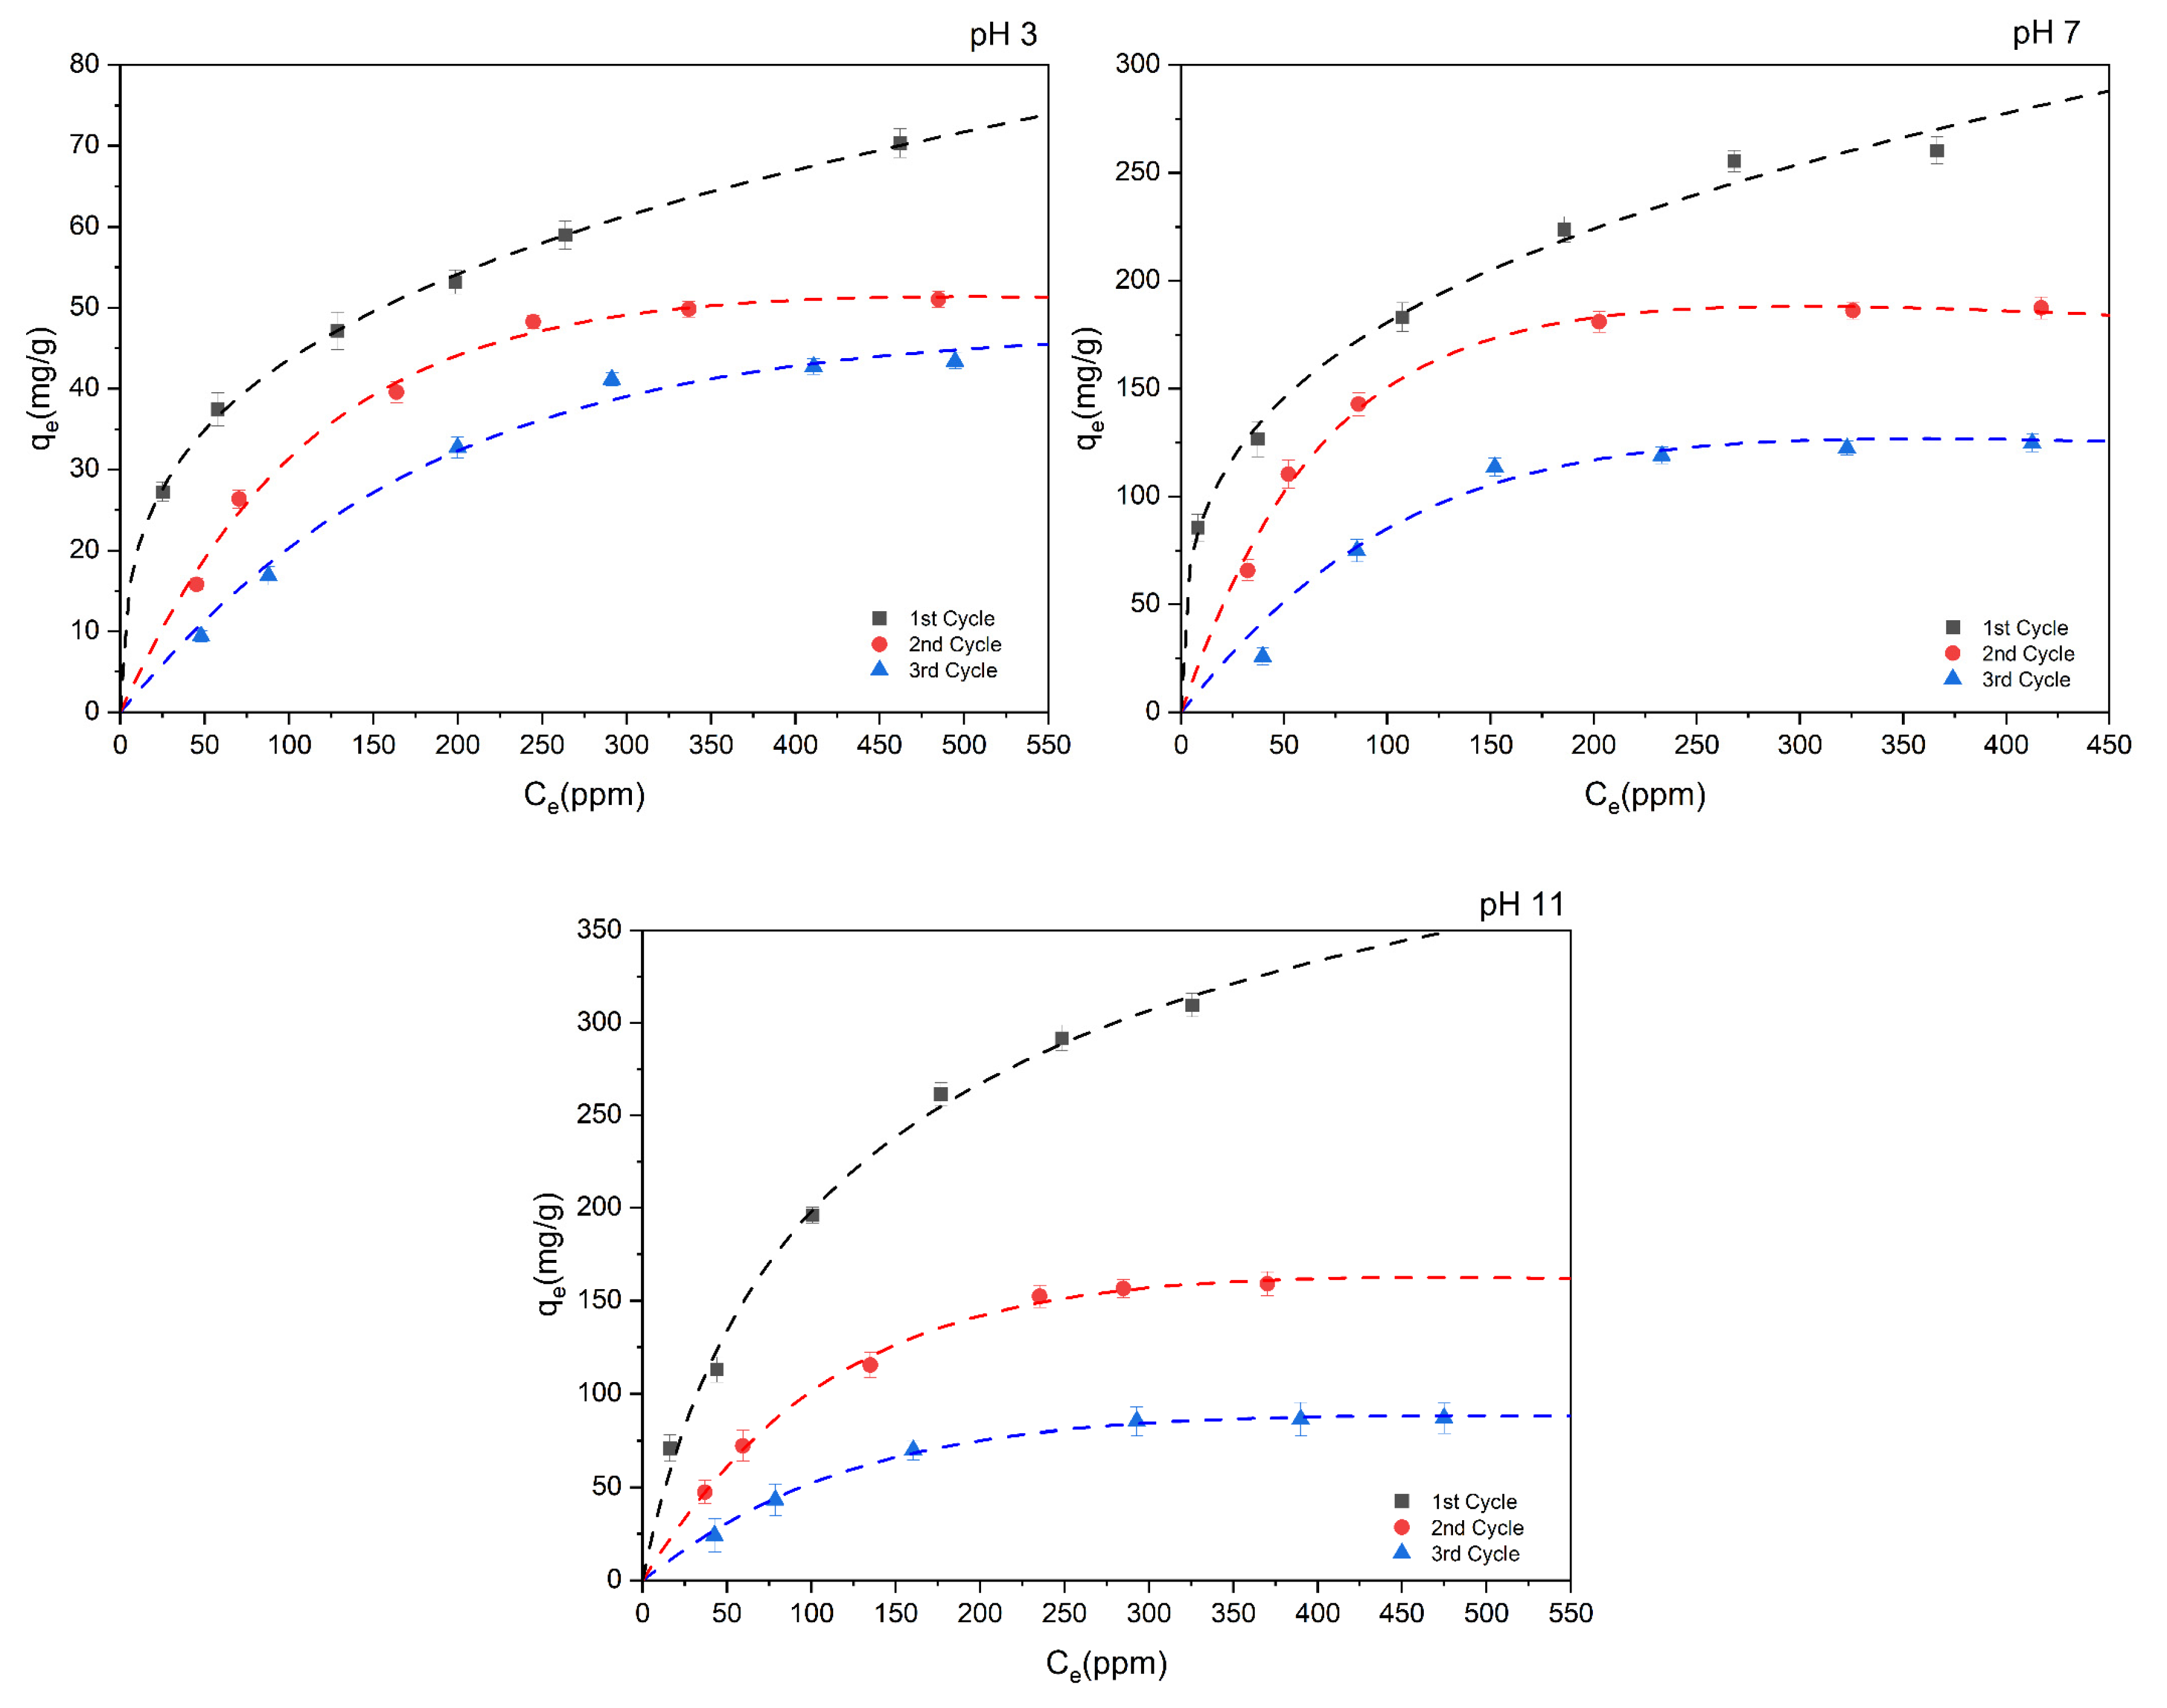
3.3.6. Reuse Cycles
4. Conclusions
Supplementary Materials
Author Contributions
Funding
Data Availability Statement
Acknowledgments
Conflicts of Interest
References
- Foretz, M.; Guigas, B.; Bertrand, L.; Pollak, M.; Viollet, B. Metformin: From Mechanisms of Action to Therapies. Cell Metab. 2014, 20, 953–966. [Google Scholar] [CrossRef]
- Hernández, B.; Pflüger, F.; Kruglik, S.G.; Cohen, R.; Ghomi, M. Protonation–deprotonation and structural dynamics of antidiabetic drug metformin. J. Pharm. Biomed. Anal. 2015, 114, 42–48. [Google Scholar] [CrossRef]
- Balakrishnan, A.; Sillanpää, M.; Jacob, M.M.; Vo, D.-V.N. Metformin as an emerging concern in wastewater: Occurrence, analysis and treatment methods. Environ. Res. 2022, 213, 113613. [Google Scholar] [CrossRef]
- Desai, D.; Wong, B.; Huang, Y.; Ye, Q.; Tang, D.; Guo, H.; Huang, M.; Timmins, P. Surfactant-Mediated Dissolution of Metformin Hydrochloride Tablets: Wetting Effects Versus Ion Pairs Diffusivity. J. Pharm. Sci. 2014, 103, 920–926. [Google Scholar] [CrossRef]
- Boehm, H.P.; Diehl, E.; Heck, W.; Sappok, R. Surface Oxides of Carbon. Angew. Chem. Int. Ed. Engl. 1964, 3, 669–677. [Google Scholar] [CrossRef]
- Ramírez-Muñiz, K.; Song, S.; Berber-Mendoza, S.; Tong, S. Adsorption of the complex ion Au(CN)2- onto sulfur-impregnated activated carbon in aqueous solutions. J. Colloid Interface Sci. 2010, 349, 602–606. [Google Scholar] [CrossRef]
- Sarigul, N.; Korkmaz, F.; Kurultak, İ. A New Artificial Urine Protocol to Better Imitate Human Urine. Sci. Rep. 2019, 9, 20159. [Google Scholar] [CrossRef]
- Ocampo-Pérez, R.; Leyva-Ramos, R.; Sanchez-Polo, M.; Rivera-Utrilla, J. Role of pore volume and surface diffusion in the adsorption of aromatic compounds on activated carbon. Adsorption 2013, 19, 945–957. [Google Scholar] [CrossRef]
- Frisch, M.J.; Hiscocks, J. Gaussian 09; Gaussian, Inc.: Pittsburgh, PA, USA, 2009. [Google Scholar]
- Al-Muhtaseb, S.A.; Ritter, J.A. Preparation and Properties of Resorcinol–Formaldehyde Organic and Carbon Gels. Adv. Mater. 2003, 15, 101–114. [Google Scholar] [CrossRef]
- Pekala, R.W. Organic aerogels from the polycondensation of resorcinol with formaldehyde. J. Mater. Sci. 1989, 24, 3221–3227. [Google Scholar] [CrossRef]
- Heidari, B.S.; Cheraghchi, V.-S.; Motahari, S.; Motlagh, G.H.; Davachi, S.M. Optimized mercapto-modified resorcinol formaldehyde xerogel for adsorption of lead and copper ions from aqueous solutions. J. Sol-Gel Sci. Technol. 2018, 88, 236–248. [Google Scholar] [CrossRef]
- Khamkure, S.; Gamero-Melo, P.; Garrido-Hoyos, S.E.; Reyes-Rosas, A.; Pacheco-Catalán, D.-E.; López-Martínez, A.M. The Development of Fe3O4-Monolithic Resorcinol-Formaldehyde Carbon Xerogels Using Ultrasonic-Assisted Synthesis for Arsenic Removal of Drinking Water. Gels 2023, 9, 618. [Google Scholar] [CrossRef]
- Ficanha, A.M.M.; Oro, C.E.D.; Franceschi, E.; Dallago, R.M.; Mignoni, M.L. Evaluation of Different Ionic Liquids as Additives in the Immobilization of Lipase CAL B by Sol-Gel Technique. Appl. Biochem. Biotechnol. 2021, 193, 2162–2181. [Google Scholar] [CrossRef]
- Gaikwad, M.M.; Kakunuri, M.; Sharma, C.S. Enhanced catalytic graphitization of resorcinol formaldehyde derived carbon xerogel to improve its anodic performance for lithium ion battery. Mater. Today Commun. 2019, 20, 100569. [Google Scholar] [CrossRef]
- AlAreeqi, S.; Bahamon, D.; Polychronopoulou, K.; Vega, L.F. Insights into the thermal stability and conversion of carbon-based materials by using ReaxFF reactive force field: Recent advances and future directions. Carbon 2022, 196, 840–866. [Google Scholar] [CrossRef]
- Sundqvist, B. Carbon under pressure. Phys. Rep. 2021, 909, 1–73. [Google Scholar] [CrossRef]
- Bystrzejewski, M.; Lange, H.; Huczko, A.; Elim, H.; Ji, W. Study of the optical limiting properties of carbon-encapsulated magnetic nanoparticles. Chem. Phys. Lett. 2007, 444, 113–117. [Google Scholar] [CrossRef]
- Gorman, M. The evidence from infrared spectroscopy for hydrogen bonding: A case history of the correlation and interpretation of data. J. Chem. Educ. 1957, 34, 304. [Google Scholar] [CrossRef]
- Long, D.A. Infrared and Raman characteristic group frequencies. Tables and charts George Socrates John Wiley and Sons, Ltd, Chichester, Third Edition, 2001. Price pound sterling 135. J. Raman Spectrosc. 2004, 35, 905. [Google Scholar] [CrossRef]
- Comí, M.; Fernández, M.; Santamaría, A.; Lligadas, G.; Ronda, J.C.; Galià, M.; Cádiz, V. Carboxylic Acid Ionic Modification of Castor-Oil-Based Polyurethanes Bearing Amine Groups: Chemically Tunable Physical Properties and Recyclability. Macromol. Chem. Phys. 2017, 218, 1700379. [Google Scholar] [CrossRef]
- Zhu, S.; Liu, Y.-G.; Liu, S.-B.; Zeng, G.-M.; Jiang, L.-H.; Tan, X.F.; Zhou, L.; Zeng, W.; Li, T.-T.; Yang, C.-P. Adsorption of emerging contaminant metformin using graphene oxide. Chemosphere 2017, 179, 20–28. [Google Scholar] [CrossRef]
- Balasubramani, K.; Sivarajasekar, N.; Naushad, M. Effective adsorption of antidiabetic pharmaceutical (metformin) from aqueous medium using graphene oxide nanoparticles: Equilibrium and statistical modelling. J. Mol. Liq. 2020, 301, 112426. [Google Scholar] [CrossRef]
- Kyzas, G.Z.; Nanaki, S.G.; Koltsakidou, A.; Papageorgiou, M.; Kechagia, M.; Bikiaris, D.N.; Lambropoulou, D.A. Effectively designed molecularly imprinted polymers for selective isolation of the antidiabetic drug metformin and its transformation product guanylurea from aqueous media. Anal. Chim. Acta 2015, 866, 27–40. [Google Scholar] [CrossRef]
- Spessato, L.; Duarte, V.A.; Viero, P.; Zanella, H.; Fonseca, J.M.; Arroyo, P.A.; Almeida, V.C. Optimization of Sibipiruna activated carbon preparation by simplex-centroid mixture design for simultaneous adsorption of rhodamine B and metformin. J. Hazard. Mater. 2021, 411, 125166. [Google Scholar] [CrossRef]
- Sanchez-Silva, J.M.; Collins-Martínez, V.H.; Padilla-Ortega, E.; Aguilar-Aguilar, A.; Labrada-Delgado, G.J.; Gonzalez-Ortega, O.; Palestino-Escobedo, G.; Ocampo-Pérez, R. Characterization and transformation of nanche stone (Byrsonima crassifolia) in an activated hydrochar with high adsorption capacity towards metformin in aqueous solution. Chem. Eng. Res. Des. 2022, 183, 580–594. [Google Scholar] [CrossRef]
- Dave, P.N.; Kamaliya, B.; Macwan, P.M.; Trivedi, J.H. Fabrication and characterization of a gum ghatti-cl-poly(N-isopropyl acrylamide-co-acrylic acid)/CoFe2O4 nanocomposite hydrogel for metformin hydrochloride drug removal from aqueous solution. Curr. Res. Green Sustain. Chem. 2023, 6, 100349. [Google Scholar] [CrossRef]
- Szalewicz, K. Hydrogen Bond, in Encyclopedia of Physical Science and Technology, 3rd ed.; Meyers, R.A., Ed.; Academic Press: New York, NY, USA, 2003; pp. 505–538. [Google Scholar]
- Fu, L.; Li, J.; Wang, G.; Luan, Y.; Dai, W. Adsorption behavior of organic pollutants on microplastics. Ecotoxicol. Environ. Saf. 2021, 217, 112207. [Google Scholar] [CrossRef]
- Badran, I.; Hassan, A.; Manasrah, A.D.; Nassar, N.N. Experimental and theoretical studies on the thermal decomposition of metformin. J. Therm. Anal. Calorim. 2019, 138, 433–441. [Google Scholar] [CrossRef]
- Adnan; Omer, M.; Khan, B.; Khan, I.; Alamzeb, M.; Zada, F.M.; Ullah, I.; Shah, R.; Alqarni, M.; Simal-Gandara, J. Equilibrium, Kinetic and Thermodynamic Studies for the Adsorption of Metanil Yellow Using Carbonized Pistachio Shell-Magnetic Nanoparticles. Water 2022, 14, 4139. [Google Scholar] [CrossRef]
- Aljamali, N.; Khdur, R.; Alfatlawi, I. Physical and Chemical Adsorption and its Applications. Int. J. Thermodyn. Chem. Kinet. 2021, 7, 1–8. [Google Scholar]
- De Gisi, S.; Lofrano, G.; Grassi, M.; Notarnicola, M. Characteristics and adsorption capacities of low-cost sorbents for wastewater treatment: A review. Sustain. Mater. Technol. 2016, 9, 10–40. [Google Scholar] [CrossRef]
- Kłonkowski, A.M.; Grobelna, B.; Widernik, T.; Jankowska-Frydel, A.; Mozgawa, W. The Coordination State of Copper(II) Complexes Anchored and Grafted onto the Surface of Organically Modified Silicates. Langmuir 1999, 15, 5814–5819. [Google Scholar] [CrossRef]
- Torres, C.E.I.; Quezada, T.E.S.; Kharissova, O.V.; Kharisov, B.I.; de la Fuente, M.I.G. Carbon-based aerogels and xerogels: Synthesis, properties, oil sorption capacities, and DFT simulations. J. Environ. Chem. Eng. 2021, 9, 104886. [Google Scholar] [CrossRef]
- Sun, A.; Hou, X.; Hu, X. Super-performance photothermal conversion of 3D macrostructure graphene-CuFeSe2 aerogel contributes to durable and fast clean-up of highly viscous crude oil in seawater. Nano Energy 2020, 70, 104511. [Google Scholar] [CrossRef]
- Zou, C.-Y.; Ji, W.; Shen, Z.; Tang, Q.; Fan, M. NH3 molecule adsorption on spinel-type ZnFe2O4 surface: A DFT and experimental comparison study. Appl. Surf. Sci. 2018, 442, 778–786. [Google Scholar] [CrossRef]
- Serna-Carrizales, J.C.; Zárate-Guzmán, A.I.; Aguilar-Aguilar, A.; Forgionny, A.; Bailón-García, E.; Flórez, E.; Gómez-Durán, C.F.A.; Ocampo-Pérez, R. Optimization of Binary Adsorption of Metronidazole and Sulfamethoxazole in Aqueous Solution Supported with DFT Calculations. Processes 2023, 11, 1009. [Google Scholar] [CrossRef]
- Forgionny, A.; Acelas, N.Y.; Jimenez-Orozco, C.; Flórez, E. Toward the design of efficient adsorbents for Hg2+ removal: Molecular and thermodynamic insights. Int. J. Quantum Chem. 2020, 120, e26258. [Google Scholar] [CrossRef]
- Rubtsov, I.V.; Kumar, K.; Hochstrasser, R.M. Dual-frequency 2D IR photon echo of a hydrogen bond. Chem. Phys. Lett. 2005, 402, 439–443. [Google Scholar] [CrossRef]
- Kafle, B.P. Chapter 6—Introduction to nanomaterials and application of UV–Visible spectroscopy for their characterization. In Chemical Analysis and Material Characterization by Spectrophotometry; Kafle, B.P., Ed.; Elsevier: Amsterdam, The Netherlands, 2020; pp. 147–198. [Google Scholar]


| Property | Value |
|---|---|
| Name | Metformin Hydrochloride (1,1-Dimethylbiguanide hydrochloride) |
| CAS number | 1115-70-4 |
| Molecular Formula | C4H11N5 · HCl |
| Structure | 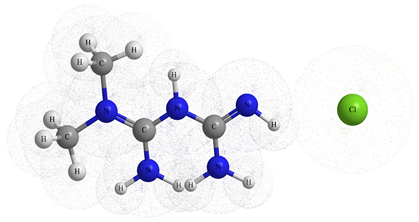 |
| Molecular weight (g/mol) | 165.62 |
| Water solubility (mg/mL at 25 °C) | 300 |
| pKa (experimental) | 2.8 and 11.5 |
| Vapor pressure (kPa at 20 °C) | <0.000001 kPa |
| Melting point (°C) | 223–226 |
| Boiling point (°C at 760 mmHg) | 224.1 |
| Molecular dimensions | |
| x (Å) | 10.83 |
| y (Å) | 4.25 |
| z (Å) | 1.8 |
| Adsorbent | Adsorption Capacity (mg/g) | Experimental Conditions (Dose, Concentrations (C0), Time, Temperature, and pH | Potential Mechanisms | Reference |
|---|---|---|---|---|
| Graphene oxide | 96.7 | 0.5 g/L, 8–40 mg/L, 25 °C, 160 min, 6 | π–π interactions and hydrogen bonds | [22] |
| Graphene oxide | 122.6 | 0.13 g/L, 300–700 mg/L, 3 h, 20.53 °C, 6.26 | - | [23] |
| Molecularly imprinted polymers | 80.0 | 1.0 g/L, 0–100 mg/L, 6 h, 25 °C, 10 | Electrostatic attractions | [24] |
| Activated carbon from Sibipiruna | 103.83 | 1.0 g/L, 25–900 mg/L, 6 h, 30–50 °C, 6 | Physisorption | [25] |
| Hydrochar activated from Byrsonima crassifolia stones | 113.6 | 2.5 g/L, 100–1000 mg/L, 7 days, 25 °C, 7 | Attractive electrostatic interactions | [26] |
| Gum ghatti-cl-poly(N-isopropyl acrylamide-co-acrylic acid)/CoFe2O4 nanocomposite hydrogel | 151.07 | 0.8 g/L, 25–250 mg/L, 24 h, 30 °C, 8 | Lone pair–pi interaction, electrostatic interactions, and hydrogen bonding | [27] |
| Resorcinol-Fomraldehyde xerogels | 325 | 0.5 g/L, 50–500 ppm, 7 days, 25 °C, 11 | Electrostatic interactions, and hydrogen bonding | This study |
| Xerogel | Temperature (°C) | ΔHads (kJ/mol) | (kJ/mol) | (J/mol) |
|---|---|---|---|---|
| R:F-0.05 | 15 | 19.33 | 9.41 | 34.45 |
| 25 | 9.47 | |||
| 45 | 8.37 | |||
| R:F-0.25 | 15 | 12.86 | 9.84 | 10.50 |
| 25 | 9.72 | |||
| 45 | 9.52 | |||
| R:F-0.40 | 15 | 0.77 | 8.60 | 27.16 |
| 25 | 9.05 | |||
| 45 | 9.41 |
Disclaimer/Publisher’s Note: The statements, opinions and data contained in all publications are solely those of the individual author(s) and contributor(s) and not of MDPI and/or the editor(s). MDPI and/or the editor(s) disclaim responsibility for any injury to people or property resulting from any ideas, methods, instructions or products referred to in the content. |
© 2024 by the authors. Licensee MDPI, Basel, Switzerland. This article is an open access article distributed under the terms and conditions of the Creative Commons Attribution (CC BY) license (https://creativecommons.org/licenses/by/4.0/).
Share and Cite
Aguilar-Maruri, S.A.; Perera-Triana, D.; Flórez, E.; Forgionny, A.; Palestino, G.; Gómez-Durán, C.F.A.; Ocampo-Pérez, R. Highly Adsorptive Organic Xerogels for Efficient Removal of Metformin from Aqueous Solutions: Experimental and Theoretical Approach. Processes 2024, 12, 1431. https://doi.org/10.3390/pr12071431
Aguilar-Maruri SA, Perera-Triana D, Flórez E, Forgionny A, Palestino G, Gómez-Durán CFA, Ocampo-Pérez R. Highly Adsorptive Organic Xerogels for Efficient Removal of Metformin from Aqueous Solutions: Experimental and Theoretical Approach. Processes. 2024; 12(7):1431. https://doi.org/10.3390/pr12071431
Chicago/Turabian StyleAguilar-Maruri, S. A., D. Perera-Triana, Elizabeth Flórez, Angélica Forgionny, Gabriela Palestino, C. F. A. Gómez-Durán, and Raúl Ocampo-Pérez. 2024. "Highly Adsorptive Organic Xerogels for Efficient Removal of Metformin from Aqueous Solutions: Experimental and Theoretical Approach" Processes 12, no. 7: 1431. https://doi.org/10.3390/pr12071431
APA StyleAguilar-Maruri, S. A., Perera-Triana, D., Flórez, E., Forgionny, A., Palestino, G., Gómez-Durán, C. F. A., & Ocampo-Pérez, R. (2024). Highly Adsorptive Organic Xerogels for Efficient Removal of Metformin from Aqueous Solutions: Experimental and Theoretical Approach. Processes, 12(7), 1431. https://doi.org/10.3390/pr12071431