Article

Quantitative Characterization of Pore–Fracture Structures in Coal Reservoirs by Using Mercury Injection–Removal Curves and Permeability Variation under Their Constraints

1
Beijing Tianma Intelligent Control Technology Co., Ltd., Beijing 101399, China
2
College of Resources, Shandong University of Science and Technology, Tai’an 271019, China
3
College of Earth Sciences & Engineering, Shandong University of Science and Technology, Qingdao 266590, China
4
School of Resources and Geosciences, China University of Mining and Technology, Xuzhou 221116, China
5
Department of Mechanical, Materials and Manufacturing Engineering, Faculty of Engineering, University of Nottingham, Nottingham NG7 2RD, UK
6
Department of Materials Engineering, KU Leuven, Campus Bruges, 8200 Bruges, Belgium
*
Author to whom correspondence should be addressed.
Processes 2024, 12(7), 1434; https://doi.org/10.3390/pr12071434
Submission received: 14 June 2024 / Revised: 4 July 2024 / Accepted: 5 July 2024 / Published: 9 July 2024
(This article belongs to the Section Chemical Processes and Systems)

Abstract

:
Pore and fracture structure heterogeneity is the basis for coalbed methane production capacity. In this paper, high-pressure mercury intrusion test curves of 16 coal samples from the Taiyuan Formation in the Linxing area are studied. Based on the fractal dimension values of mercury intrusion and retreat curves, the correlation between the two different fractal parameters is studied. Then, the permeability variation of different types of coal samples is studied using overlying pressure pore permeability tests. The correlation between the permeability variation of coal samples and dimension values is explored, and the results are as follows. (1) Based on porosity and mercury removal efficiency, all coal samples can be divided into three types, that is, types A, B, and C. Among them, Type A samples are characterized by lower total pore volume, with pore volume percentages ranging from 1000 to 10,000 nm not exceeding 15%. (2) During the mercury injection stage, both the M-model and S-model can reflect the heterogeneity of seepage pore distribution. In the mercury removal stage, the M-model cannot characterize the heterogeneity of pore size distribution in each stage, which is slightly different from the mercury injection stage. (3) The permeability of Type A samples is most sensitive to pressure, with a permeability loss rate of up to 96%. The original pore and fracture structure of this type of coal sample is relatively developed, resulting in a high initial permeability. (4) There is no significant relationship between compressibility and fractal dimension of mercury injection and mercury removal, which may be due to the comprehensive influence of pore structure on the compressibility of the sample.

1. Introduction

Over the past 20 years, exploration and development of coalbed methane in China has gradually shifted from shallow formations (less than 2000 m) to deep formations [1,2,3,4,5]. Differing from shallow coal seams, deep coal reservoirs are characterized by higher temperature, pressure, and gas saturation [6,7,8,9]. The special temperature and pressure conditions make the production capacity of deep coalbed methane more complex. The pore size distribution of coal reservoirs and structural heterogeneity under these constraints have become one of the key factors restricting the production capacity of deep coalbed methane [10,11,12]. Therefore, the quantitative characterization of pore–fracture structures in coal reservoirs is the basis for revealing the production process of coalbed methane.
High-pressure mercury intrusion testing has become one of the commonly used methods to characterize pore and fracture structures of unconventional reservoirs [13,14,15,16,17,18]. Based on high-pressure mercury intrusion testing data, single and multifractal models have been used to calculate the fractal dimension value D [19,20,21,22]. The quantitative characterization of pore and fracture structures has been achieved using the fractal dimension, and correlation between fractal dimension and pore-structure parameters have been studied. The results show that the fractal dimension of seepage pores controls the sample’s percolation capacity, while the fractal dimension value of adsorption pores mainly affects the sample’s adsorption capacity [14,15,23,24,25,26]. Meanwhile, the applicability of different fractal models (Menger model, Sierpinski model, multi-fractal model, and so on) in characterizing the heterogeneity of pore volume distribution has been studied [20,27,28,29,30]. Zhang et al. (2022) and Yao et al. (2024) show that the S-model could characterize distribution heterogeneity of seepage pores and macropores, which is consistent with the mercury injection stage [30,31]. However, the M-model cannot characterize heterogeneity of pore size distribution in each stage [32,33,34].
Above all, some research has been conducted on pore and fracture structure heterogeneity in coal reservoirs, and some conclusions have been reached. However, there are still some problems in this field. Firstly, the mercury intrusion curve is often used for fractal dimension calculation. The process of coalbed methane extraction is often consistent with the mercury removal process, and the calculation of the fractal dimension for the mercury removal curve needs to be studied. Secondly, while the fractal dimension is the main parameter for quantitatively characterizing pore and fracture structure, it has not yet been studied for its influence on the dynamic variation of permeability in coal reservoirs.
In this paper, high-pressure mercury intrusion test curves of 16 coal samples from the Taiyuan Formation in the Linxing area are the research objects. Based on the fractal dimension values of mercury intrusion and retreat curves, the correlation among the two different fractal parameters is studied. Then, the permeability variation of different types of coal samples are studied using overlying pressure pore permeability tests. The correlation between the permeability variation of coal samples and dimension values is explored.

2. Experimental Tests and Fractal Theory

2.1. Sample Preparation and Experimental Testing

Linxing area is located in Linxian and Xingxian counties in the west of Shanxi Province. It is tectonically located in the Yishan slope of the Ordos Basin and Jinxi flexural belt, and it is generally a monoclinal structure. Coal-bearing strata of the Upper Carboniferous series and Lower Triassic series are found in the area, and the depth of strata buried gradually increases from east to west, and then the depth of strata buried in the southwest side of the block is greater than 2000 m.
Seismic exploration shows that the area can be further divided into three tectonic units. Among them, the east and middle are uplift areas affected by intrusive rocks, and the faults are developed and distributed in a ring radial pattern. The central part is a syncline area developed around the uplift, which is distributed in a ring. The west, north, and south are gentle fold areas with little dip. The relatively simple monoclinal structure in the region is generally conducive to CBM enrichment, and the Zijinshan fault development area in the east and central region is unfavorable to CBM preservation. However, due to its relatively good reservoir physical properties, there may be high CBM enrichment production areas in some areas.
The depth of coal seams in the study area is large, with most being greater than 1500 m. The buried depth of the No. 5 coal seam is 1018~2046 m, with an average of 1833 m. The buried depth of the No. 9 coal seam is 1087~2102 m, with an average of 1902 m. The buried depth of the coal seams gradually increases from the northeast to southwest in general, and the buried depth is less in the central and eastern uplift area, about 1000 m.

Experimental Methods

First, the experimental samples were ground into powder form and tested for their industrial and microscopic composition. Then, the polished samples were placed at 60 °C to dry for 48 h. Secondly, the pore rupture test was carried out on the sample using the 9520 mercury porosimeter; the maximum experimental pressure was 100 MP, the pore size measurement range was 0.019–280.310 μm, and the test temperature was room temperature. By constantly changing the magnitude of the pressure, the pore size distribution and specific surface area of the samples were measured. The pore diameter distribution of all the coal samples is as follows in Table 1.

2.2. Fractal Theory

The Menger model (M-model) is shown in Equation (1) [35].
lg ( d v / d p ) ( D 4 ) lg ( p )
where DM is a fractal dimension and is dimensionless; P is the intrusion pressure, MPa; and V is the total intrusion volume, cm3·g−1.
The Sierpinski model (S-model) is shown in Equation (2) [36].
ln v = ( 3 D ) ln ( p p t + l n a )
where V is the volume of mercury injected into the sample, ml; P is the intrusion pressure, Mpa; Pt is the threshold pressure, Mpa; DS is the fractal dimension; and a is a constant.
q~D(q) is a set of basic languages to describe the local features of multifractals, and the formula for calculating D(q) is as follows:
D q = τ ( q ) q 1
where τ(q) is the mass index function and q is the statistical order of moments.
To quantitatively describe the effect of effective stress on permeability, the dimensionless parameter permeability loss rate Dk was introduced to describe the permeability sensitivity [37]. Dk is defined as follows:
D k = k 0 k i k 0 × 100 %
where k0 is the permeability of the coal sample under the initial confining pressure, mD; and ki is the permeability of the coal sample after applying confining pressure i times, mD.
The Cf calculation method can be verified by the DP-P test,
C f = ln ( k / k 0 ) 3 ( σ σ 0 )
where Cf is the pore compressibility coefficient under the change in horizontal effective stress, MPa−1; k is the permeability after the horizontal stress changes to σ Mpa, mD; and k0 is the initial permeability, mD.
The data source of the above fractal model is the mercury intrusion curve, and the pore–fracture structure heterogeneity of the reservoir is discussed by calculating the fractal dimension. Whether the mercury removal curve has fractal characteristics and its limitations on porosity and permeability changes are open to discussion. Based on the mercury regression curves of the same sample, the fractal dimensions of the three fractal dimensions were calculated. The difference in fractal characteristics between the mercury intrusion curve and the mercury removal curve of the same sample is discussed.

3. Results and Discussion

3.1. Pore and Fracture Distribution Based on High-Pressure Mercury Test

Based on the basic information of the samples and the experimental parameters of high-pressure mercury, the 16 samples were divided into three types, A, B, and C, by the porosity and total pore volume. This is because the mercury removal efficiency reflects the uniformity of the pore throat distribution. In contrast, porosity reflects the reservoir capacity, permeability, pore water pressure, and lithology identification of rocks, which is an important indicator of rock pore properties. Among the types, Type A comprises samples with a lower total pore volume and lower percentage of pore volumes within the 1000–10,000 nm range, with the total pore volume ranging from 0.2 to 1.0 cc and the percentage of pore volumes within the 1000–10,000 nm range not exceeding 15%. Type B comprises samples with a lower total pore volume and a higher percentage of pore volumes within the 1000–10,000 nm range, with the total pore volume ranging from 0.2 to 0.8 cc and the percentage of pore volumes within the 1000–10,000 nm range exceeding 25%. Type C comprises the samples with a high total pore volume and a large percentage of pore volumes at 1000~10,000 nm, whose total pore volume is 0.8~1.4 cc and pore volume percentage at 1000~10,000 nm is greater than 30% (Figure 1).
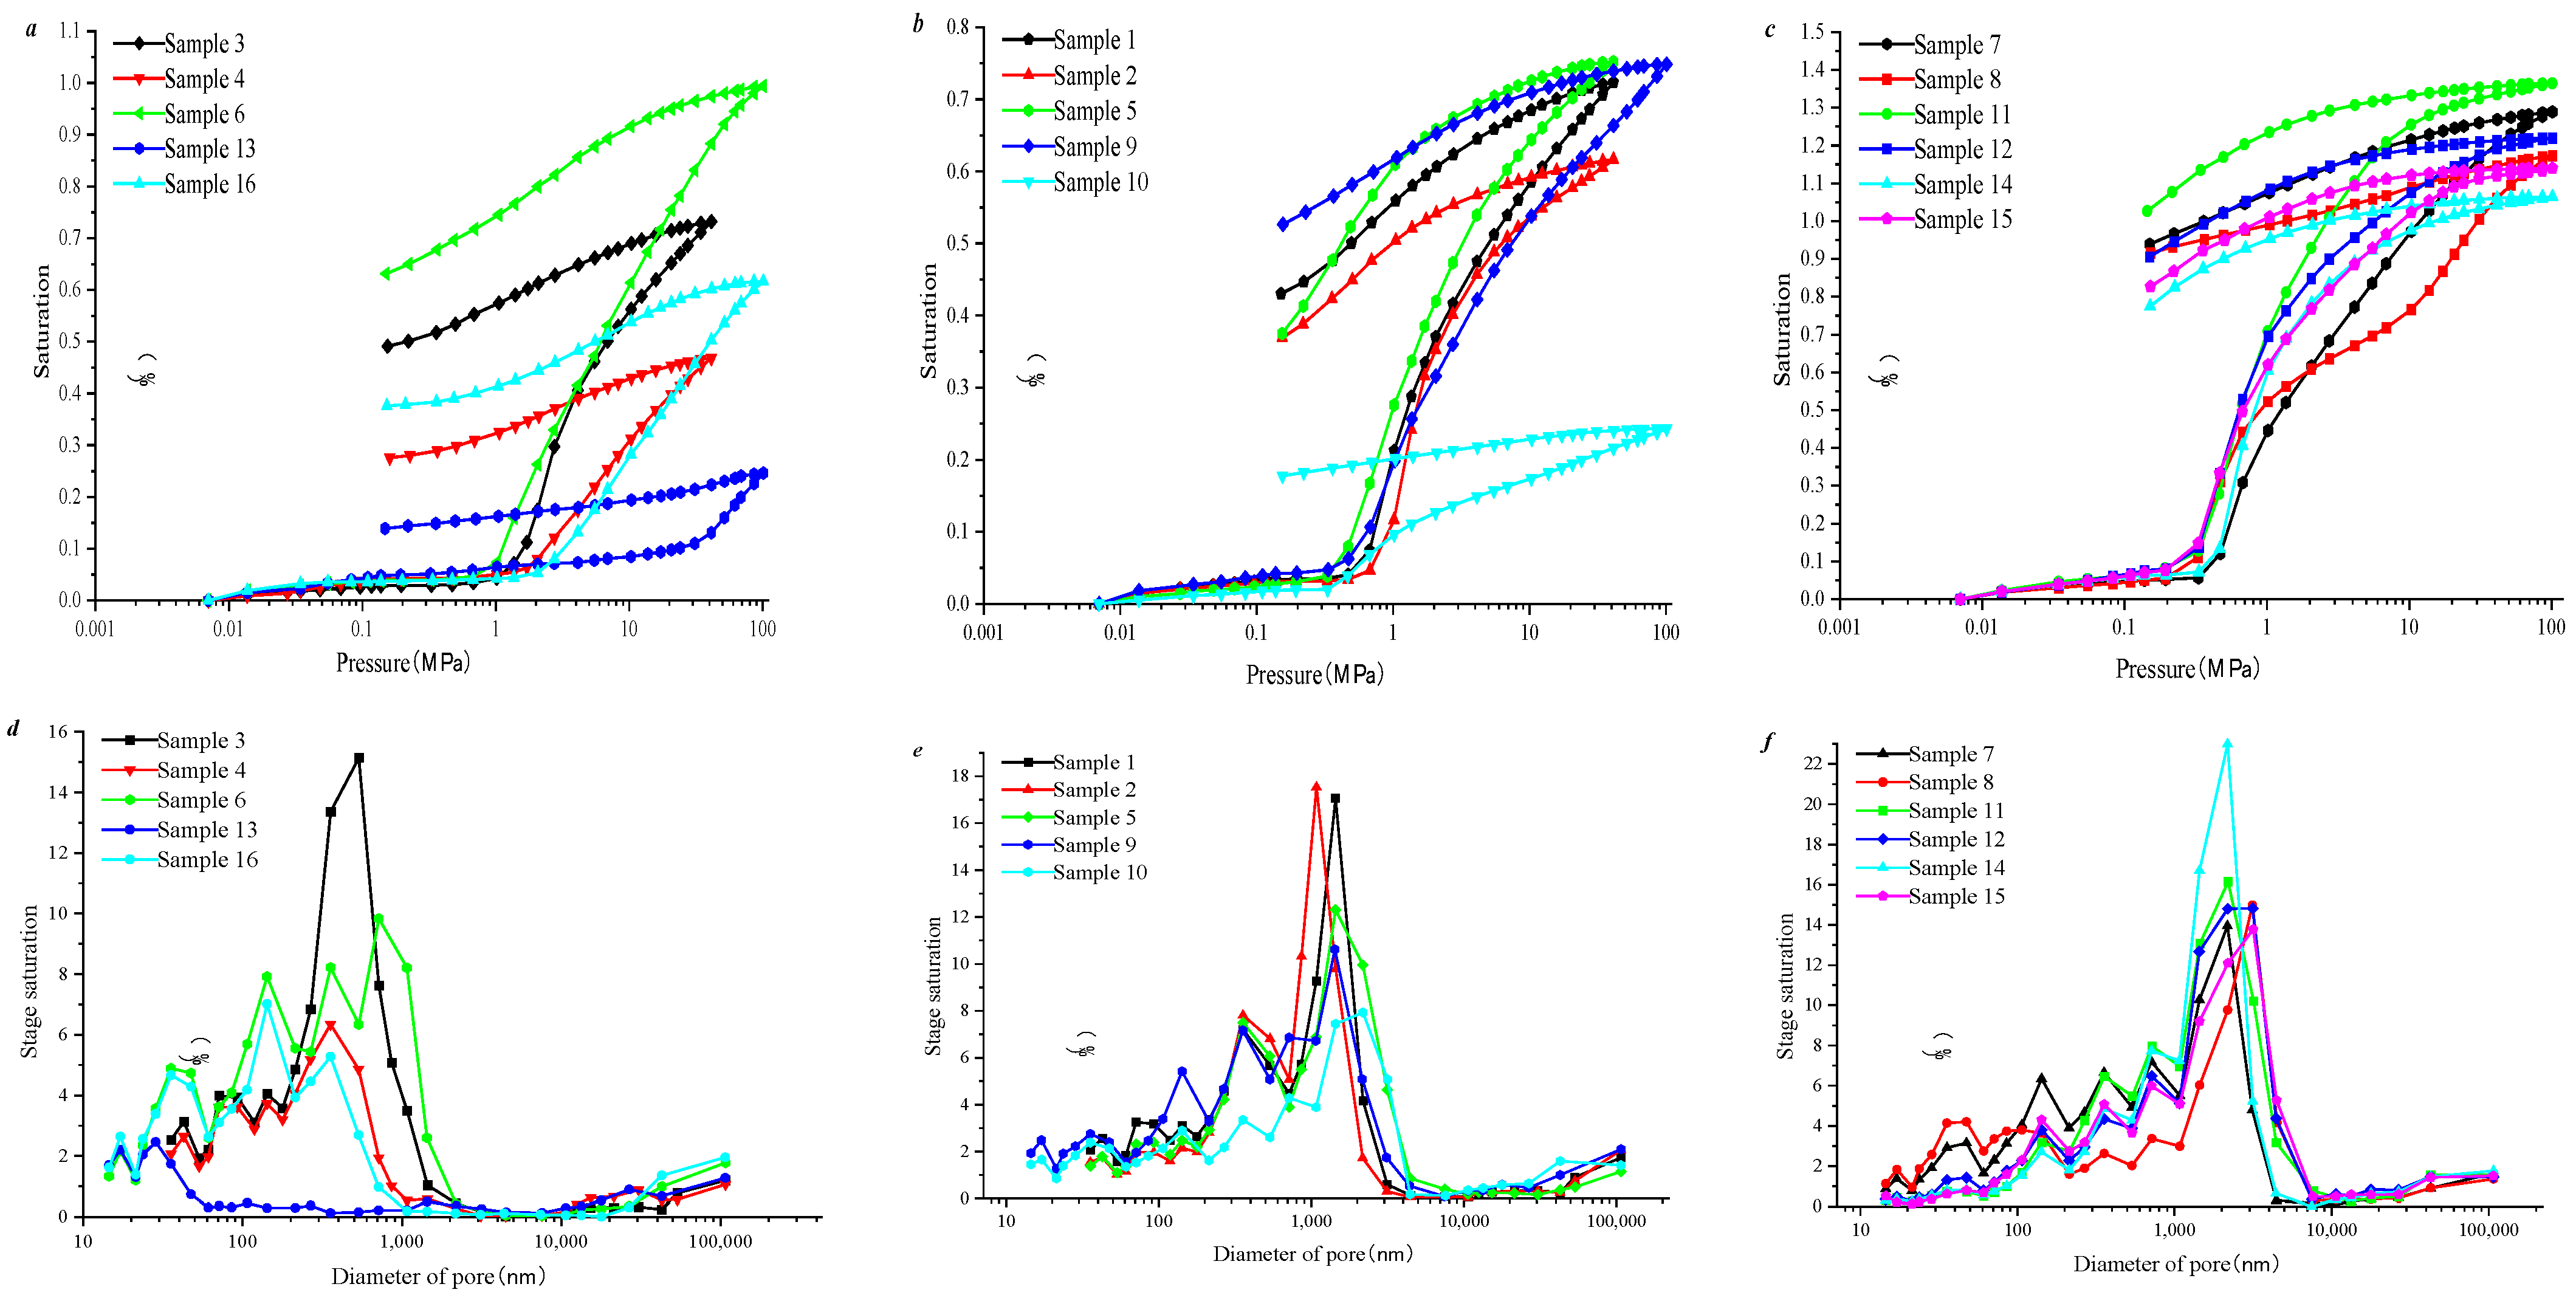
Figure 2a shows that when the mercury intrusion pressure is less than 1 MPa, the mercury intrusion curves of all samples are relatively slow. When the mercury intrusion pressure is between 1 and 100 MPa, the mercury intrusion curves of all samples increase, indicating that the samples have extensive microscopic pores. Figure 2b shows that in Type B when the mercury intrusion pressure is less than 0.3 MPa, the mercury intrusion curves for all samples are relatively slow. When the mercury intrusion pressure is between 0.3 and 100 MPa, the mercury intrusion curves for all samples increase. During the mercury removal process, the curves are relatively steep, indicating that the connectivity of the pore throats in all samples is good. Figure 2c shows that in Type C when the mercury intrusion pressure is less than 0.3 MPa, the mercury intrusion curves for all samples are relatively slow. The mercury intrusion pressure was increased from 0.3 to 100 MPa during the mercury intrusion process, and the mercury intrusion curves of all samples increased. During the mercury removal process, the mercury removal curves were relatively flat, and the mercury removal efficiency was low, indicating that the connectivity of the pore and fracture system in all samples was poor. According to the differences in research objectives, the relevant literature has classified sample types based on factors such as pore structure parameters and mineral composition. Figure 2d–f show that all samples can be divided into three categories based on pore structure parameters (total pore volume, percent of pores with diameters of 10~100 nm and >100 nm) and porosity. To achieve a fine-scale characterization of the pore–fracture system in coal reservoirs, the pore–fracture system was divided into macropores (with diameters of 1000~10,000 nm), seepage pores (with diameters of 100~1000 nm), and adsorption pores (with diameters less than 100 nm).
The percentage of seepage pore volume of Type B samples is 30~50%, which is larger than that of Type C samples and smaller than that of Type A samples. The percentage of macropore volume of Type C samples was 30–60%, larger than that of Type B samples, but the percentage of macropore volume of Type B samples was much higher than that of Type A samples (Figure 3). In general, the seepage pores and adsorption pores of Type A samples are more developed, while the macropores of Type B and Type C samples are more developed.

3.2. Pore–Fracture Distribution Heterogeneity by Using Mercury Intrusion Curves

The DM value can be calculated by the sponge model. The fractal curve can reflect the obvious linear negative correlation between lgp and lg (dv/dp), which indicates that the mercury intrusion fractal characteristics of the sample can be well reflected by the model. The linear fit of Type A samples ranges from 0.08 to 0.74, and the DM value ranges from 3.1 to 4.4. The linear fit of Type B samples ranges from 0.96 to 0.99, and DM values range from 2.3 to 2.7 (Figure 4). The linear fit of Type C samples ranges from 0.89 to 0.99, and DM values range from 2.3 to 2.9 (Figure 4). By comparison, the DM value of Type B is similar to that of Type C samples, indicating that the heterogeneity of pore structure distributions of Type B and C samples are similar.
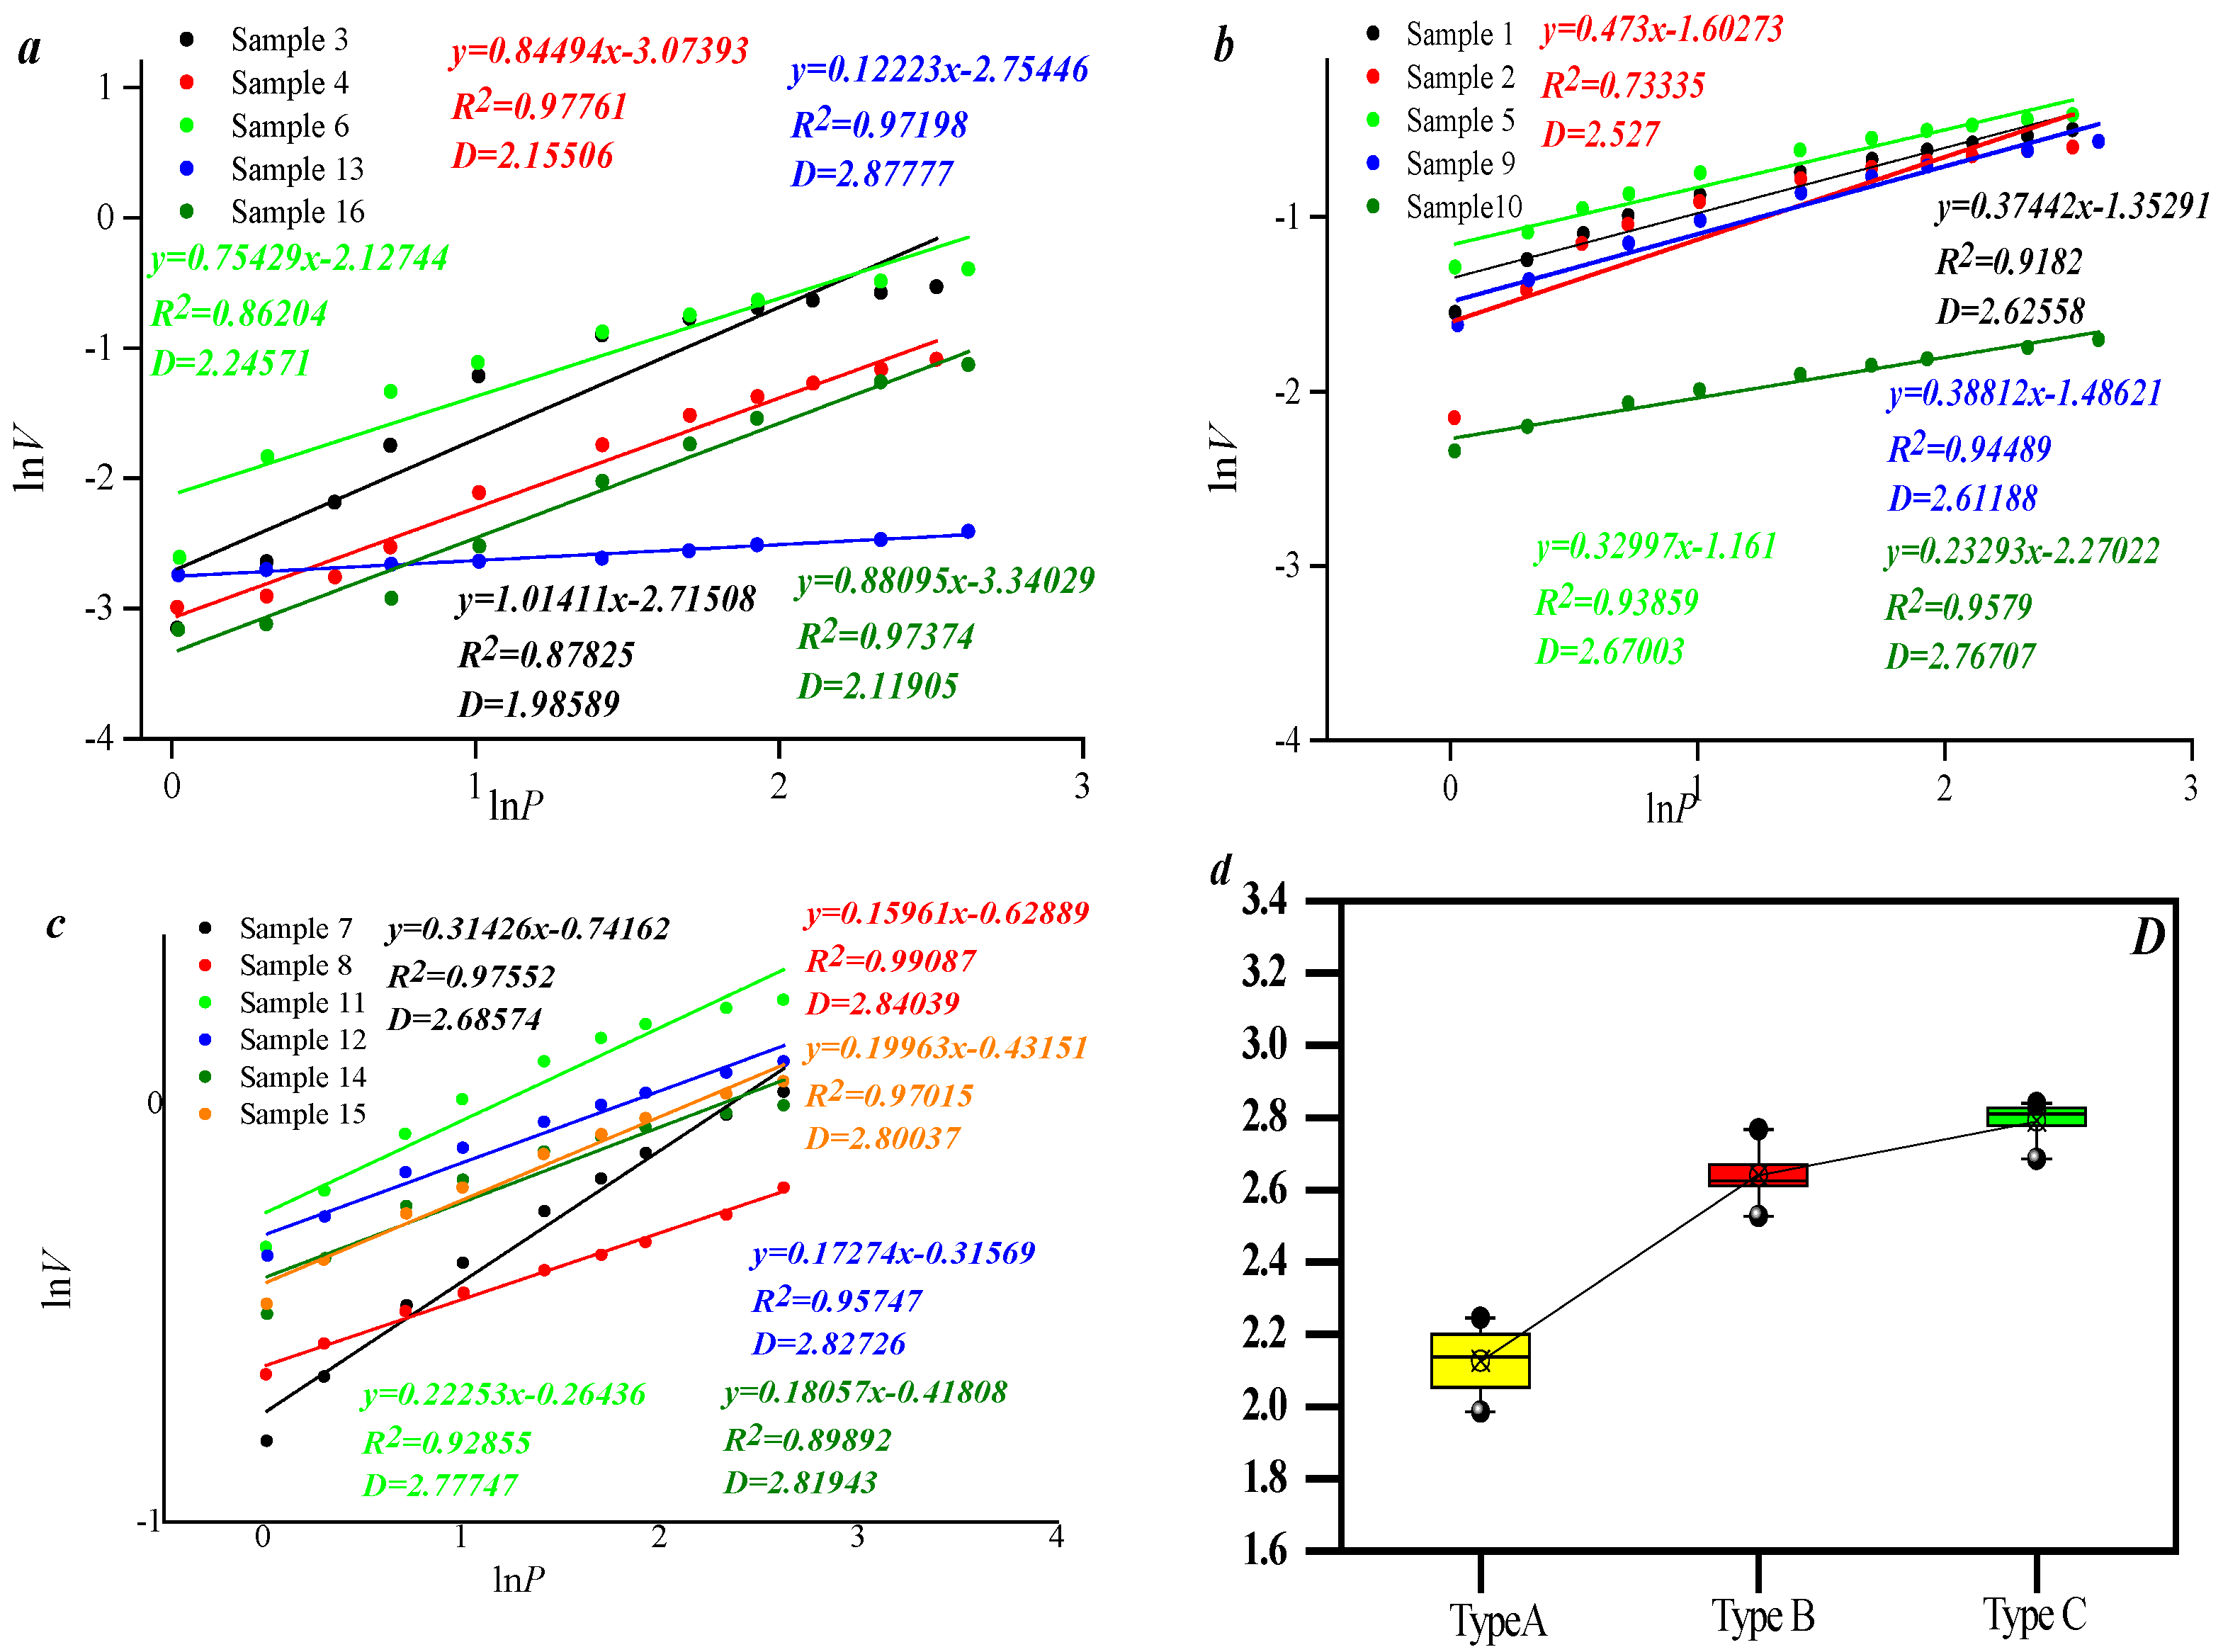
The DS value is calculated from the S-model. The fractal curve can reflect that there is an obvious linear positive correlation between lnp and lnv, which indicates that the fractal characteristics of samples can be well reflected by the model. The linear fit of Type A samples ranges from 0.86 to 0.97, and DS values range from 1.9 to 2.2. The linear fit of Type B samples ranges from 0.73 to 0.95, and DS values range from 2.5 to 2.7 (Figure 5). The linear fit of Type C samples ranges from 0.89 to 0.99, and DS values range from 2.6 to 2.8 (Figure 5). By comparison, the DS value of Type B is similar to that of the Type C samples, indicating that the heterogeneity of pore structure distribution of Type B and C samples is similar. The calculated results of this model are consistent with those of the sponge model.
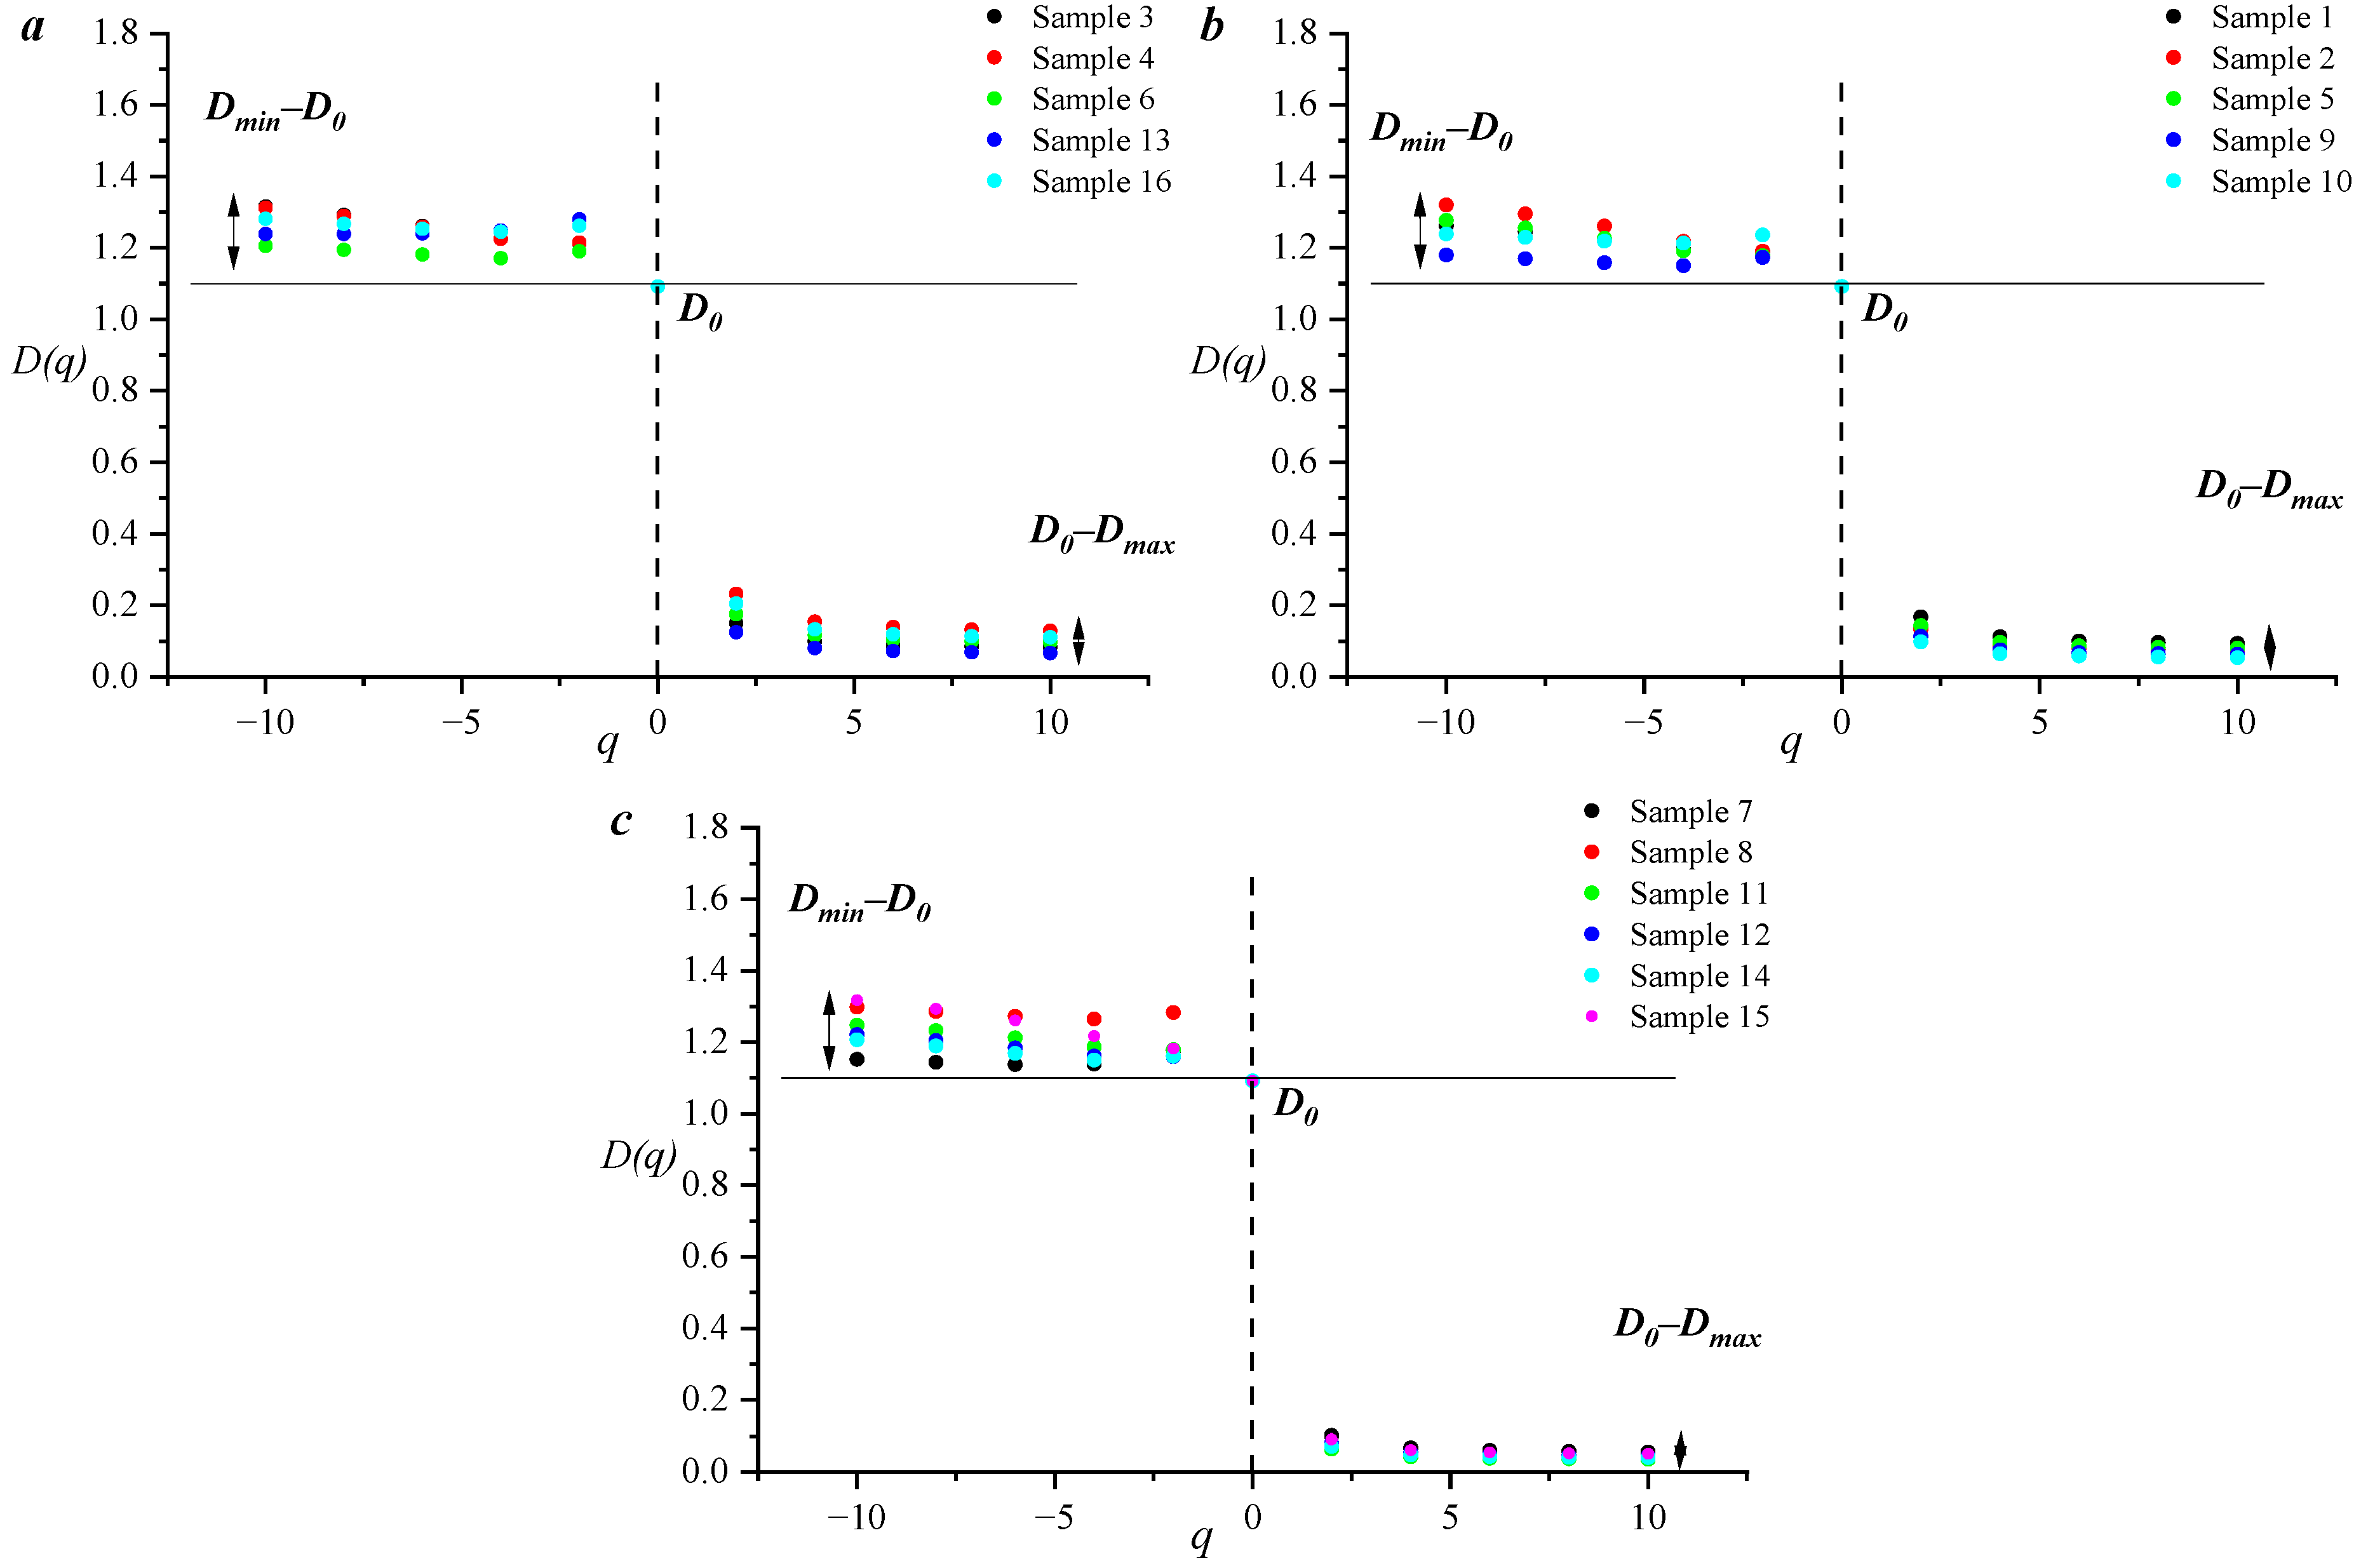
As can be seen from Figure 6, the q~D(q) spectra of all samples show an obvious inverse S-model, indicating that the pore size distribution of the coal samples is characterized by multifractal characteristics, and the pore structure of such samples is heterogeneous. The range of D−10D0 for Type A samples is 1.15~1.88, and the range of D0D10 is 0.07~1.01. The range of D−10D0 for Type B samples is 1.21~1.34, and the range of D0D10 is 0.26~0.80. The range of D−10D0 for Type C samples is 1.18~1.39, and the range of D0D10 is 0.15~0.60. The relevant literature shows that the left spectral width represents the heterogeneity in the low-value pore volume region, and the right spectral width represents the heterogeneity in the high-value pore volume region. The curve on the left side of the Type A samples is larger than that of the Type B and Type C samples, indicating that Type A has a strong heterogeneity of pore volume distribution. The curve on the right side of Type A is larger than that of Type B and Type C, indicating that the distribution of macropore volume in Type A is more heterogeneous.
Figure 7 indicates that the heterogeneity of adsorption pores and macropores of the Type A samples is stronger than that of the Type B and Type C samples, which is consistent with the results of Figure 6.
The results of the multifractal calculation show that the relationship between D−10D0 and D−10D10, D0D10 and D−10D10, D−10D0, and D0D10 is positive, and the relationship between D−10D0 and Dv10D10 is more significant. This also indicates that the low pore volume region controls the heterogeneity of the overall pore distribution of the sample (Figure 8).

3.3. Pore and Fracture Structure Heterogeneity by Using Mercury Removal Curves

The DM value can be calculated according to the sponge model. The fractal curve can reflect the obvious linear negative correlation between logp and log (dv/dp), indicating that the sample mercury removal curve has fractal characteristics. The linear fit of Type A samples ranges from 1.15 to 1.37, and the DM values range from 2.6 to 2.8. The linear fit of Type B samples ranges from 1.0 to 1.4, and the DM value ranges from 2.6 to 3.0 (Figure 9). By comparison, the DM value of Type B is higher than that of Type A, indicating that the heterogeneity of pore structure distribution of the Type B samples is stronger than that of the Type A samples.
The DS value is calculated using the Sierpinski model. The fractal curves could reflect an obvious linear positive correlation between lnp and lnv, indicating that the model can also be used to characterize the fractal characteristics of mercury removal curves. The linear fit of Type A samples ranges from 0.07 to 0.12, and DS values range from 2.88 to 2.93. The linear fit of Type B samples ranges from 0.04 to 0.06, and DS values range from 2.94 to 2.96 (Figure 10). In comparison, it is evident that the DS value of Type B exceeds that of Type A, consistent with Figure 9 but divergent from Figure 5. This further indicates a high level of consistency in the calculation results of the fractal model based on the mercury removal curve.
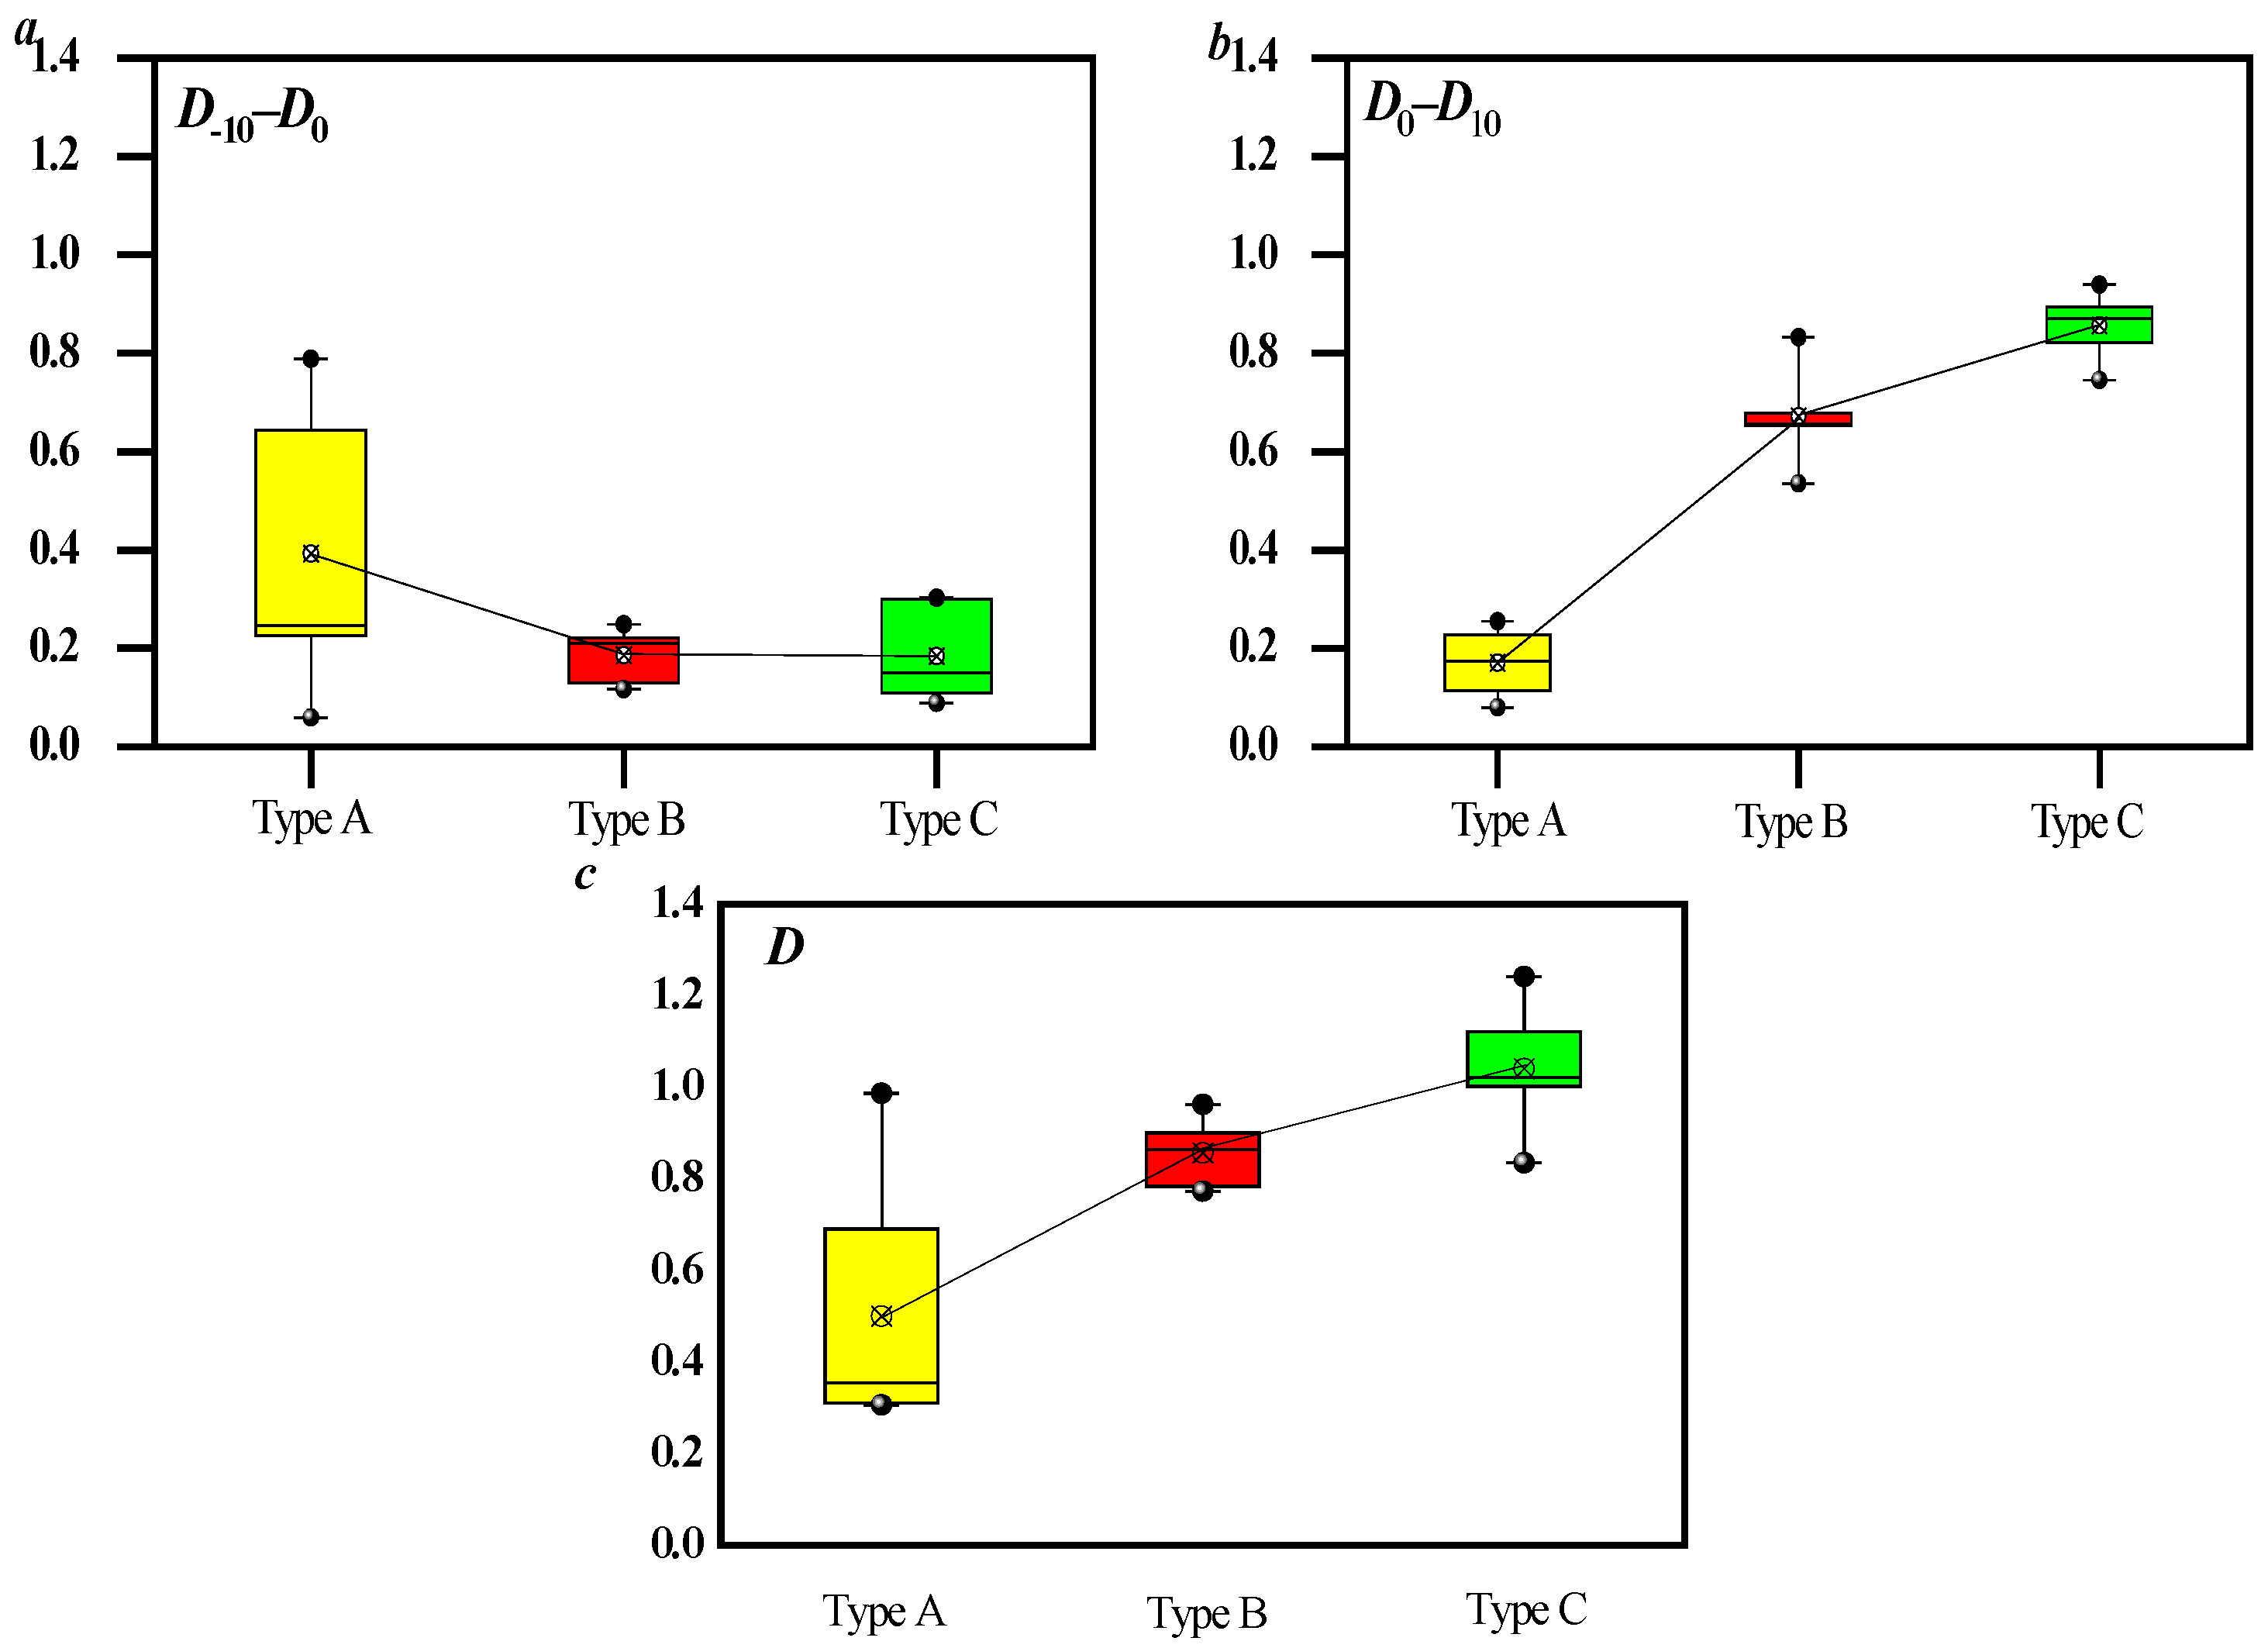
Figure 11a and b show that q~D(q) spectra of all samples show an inverse S-model, indicating that the pore size distribution based on mercury removal curves also has multifractal characteristics. The range of D−10D0 for the Type A samples is 0.4~0.6, and the range of D0D10 is 0.73~0.86. The D−10D0 range of the Type B samples is 0.5~1.1, and the D0D10 range is 0.9~0.97. The relevant literature shows that the left spectral width represents heterogeneity in the low-value pore volume region, and the right spectral width represents heterogeneity in the high-value pore volume region. The curve on the left side of the Type B samples is larger than that of the Type A samples, indicating that the distribution of small pores in the Type B samples is more heterogeneous. This understanding is consistent with the understanding of the mercury intrusion curve. The curve on the right side of Type A is larger than that of Type B, indicating that macropore diameter distribution in Type A is more heterogeneous. This result is inconsistent with that of the mercury intrusion curve.
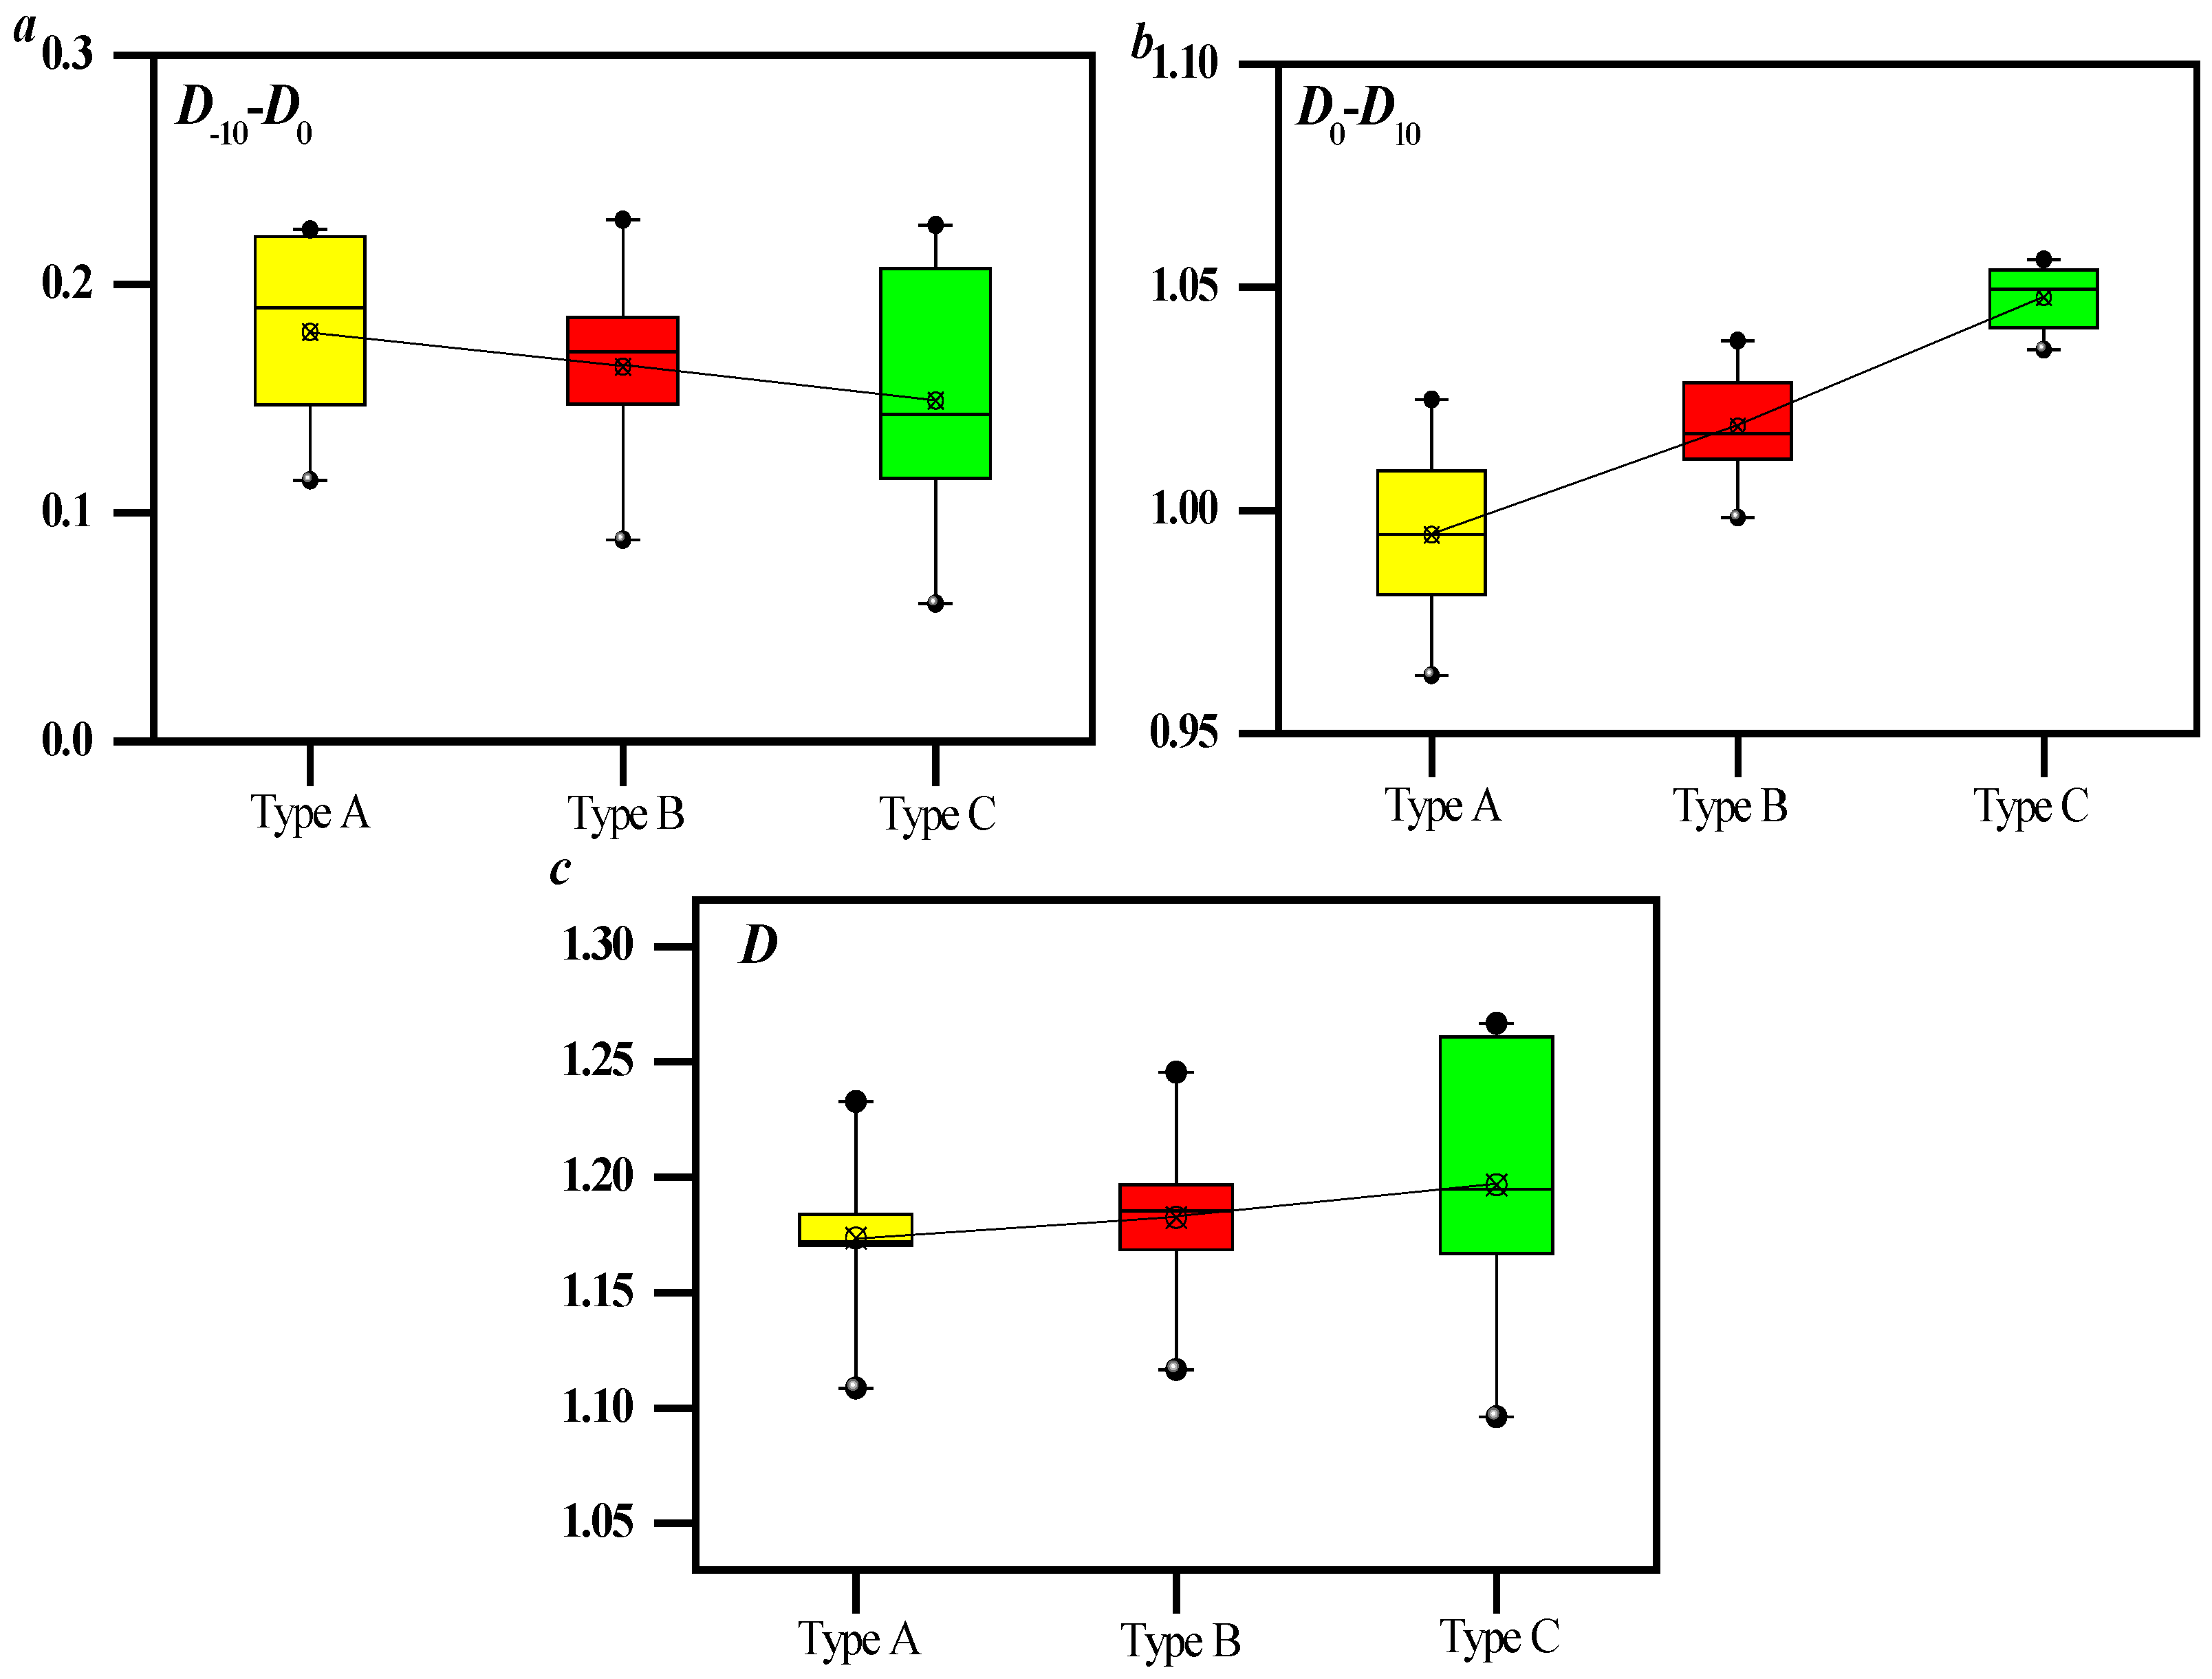
Figure 12 shows that the variation range of D−10D0 of the Type B samples is larger than that of the Type A samples, which indicates that the heterogeneity of smaller pores of the Type B samples is greater than that of the Type A samples. This result is consistent with Figure 7. The variation range of D0D10 of the Type A samples is greater than that of the Type B samples, which indicates that the heterogeneity of the macropores of the Type A samples is greater than that of the Type B samples. This result is inconsistent with the result in Figure 7.
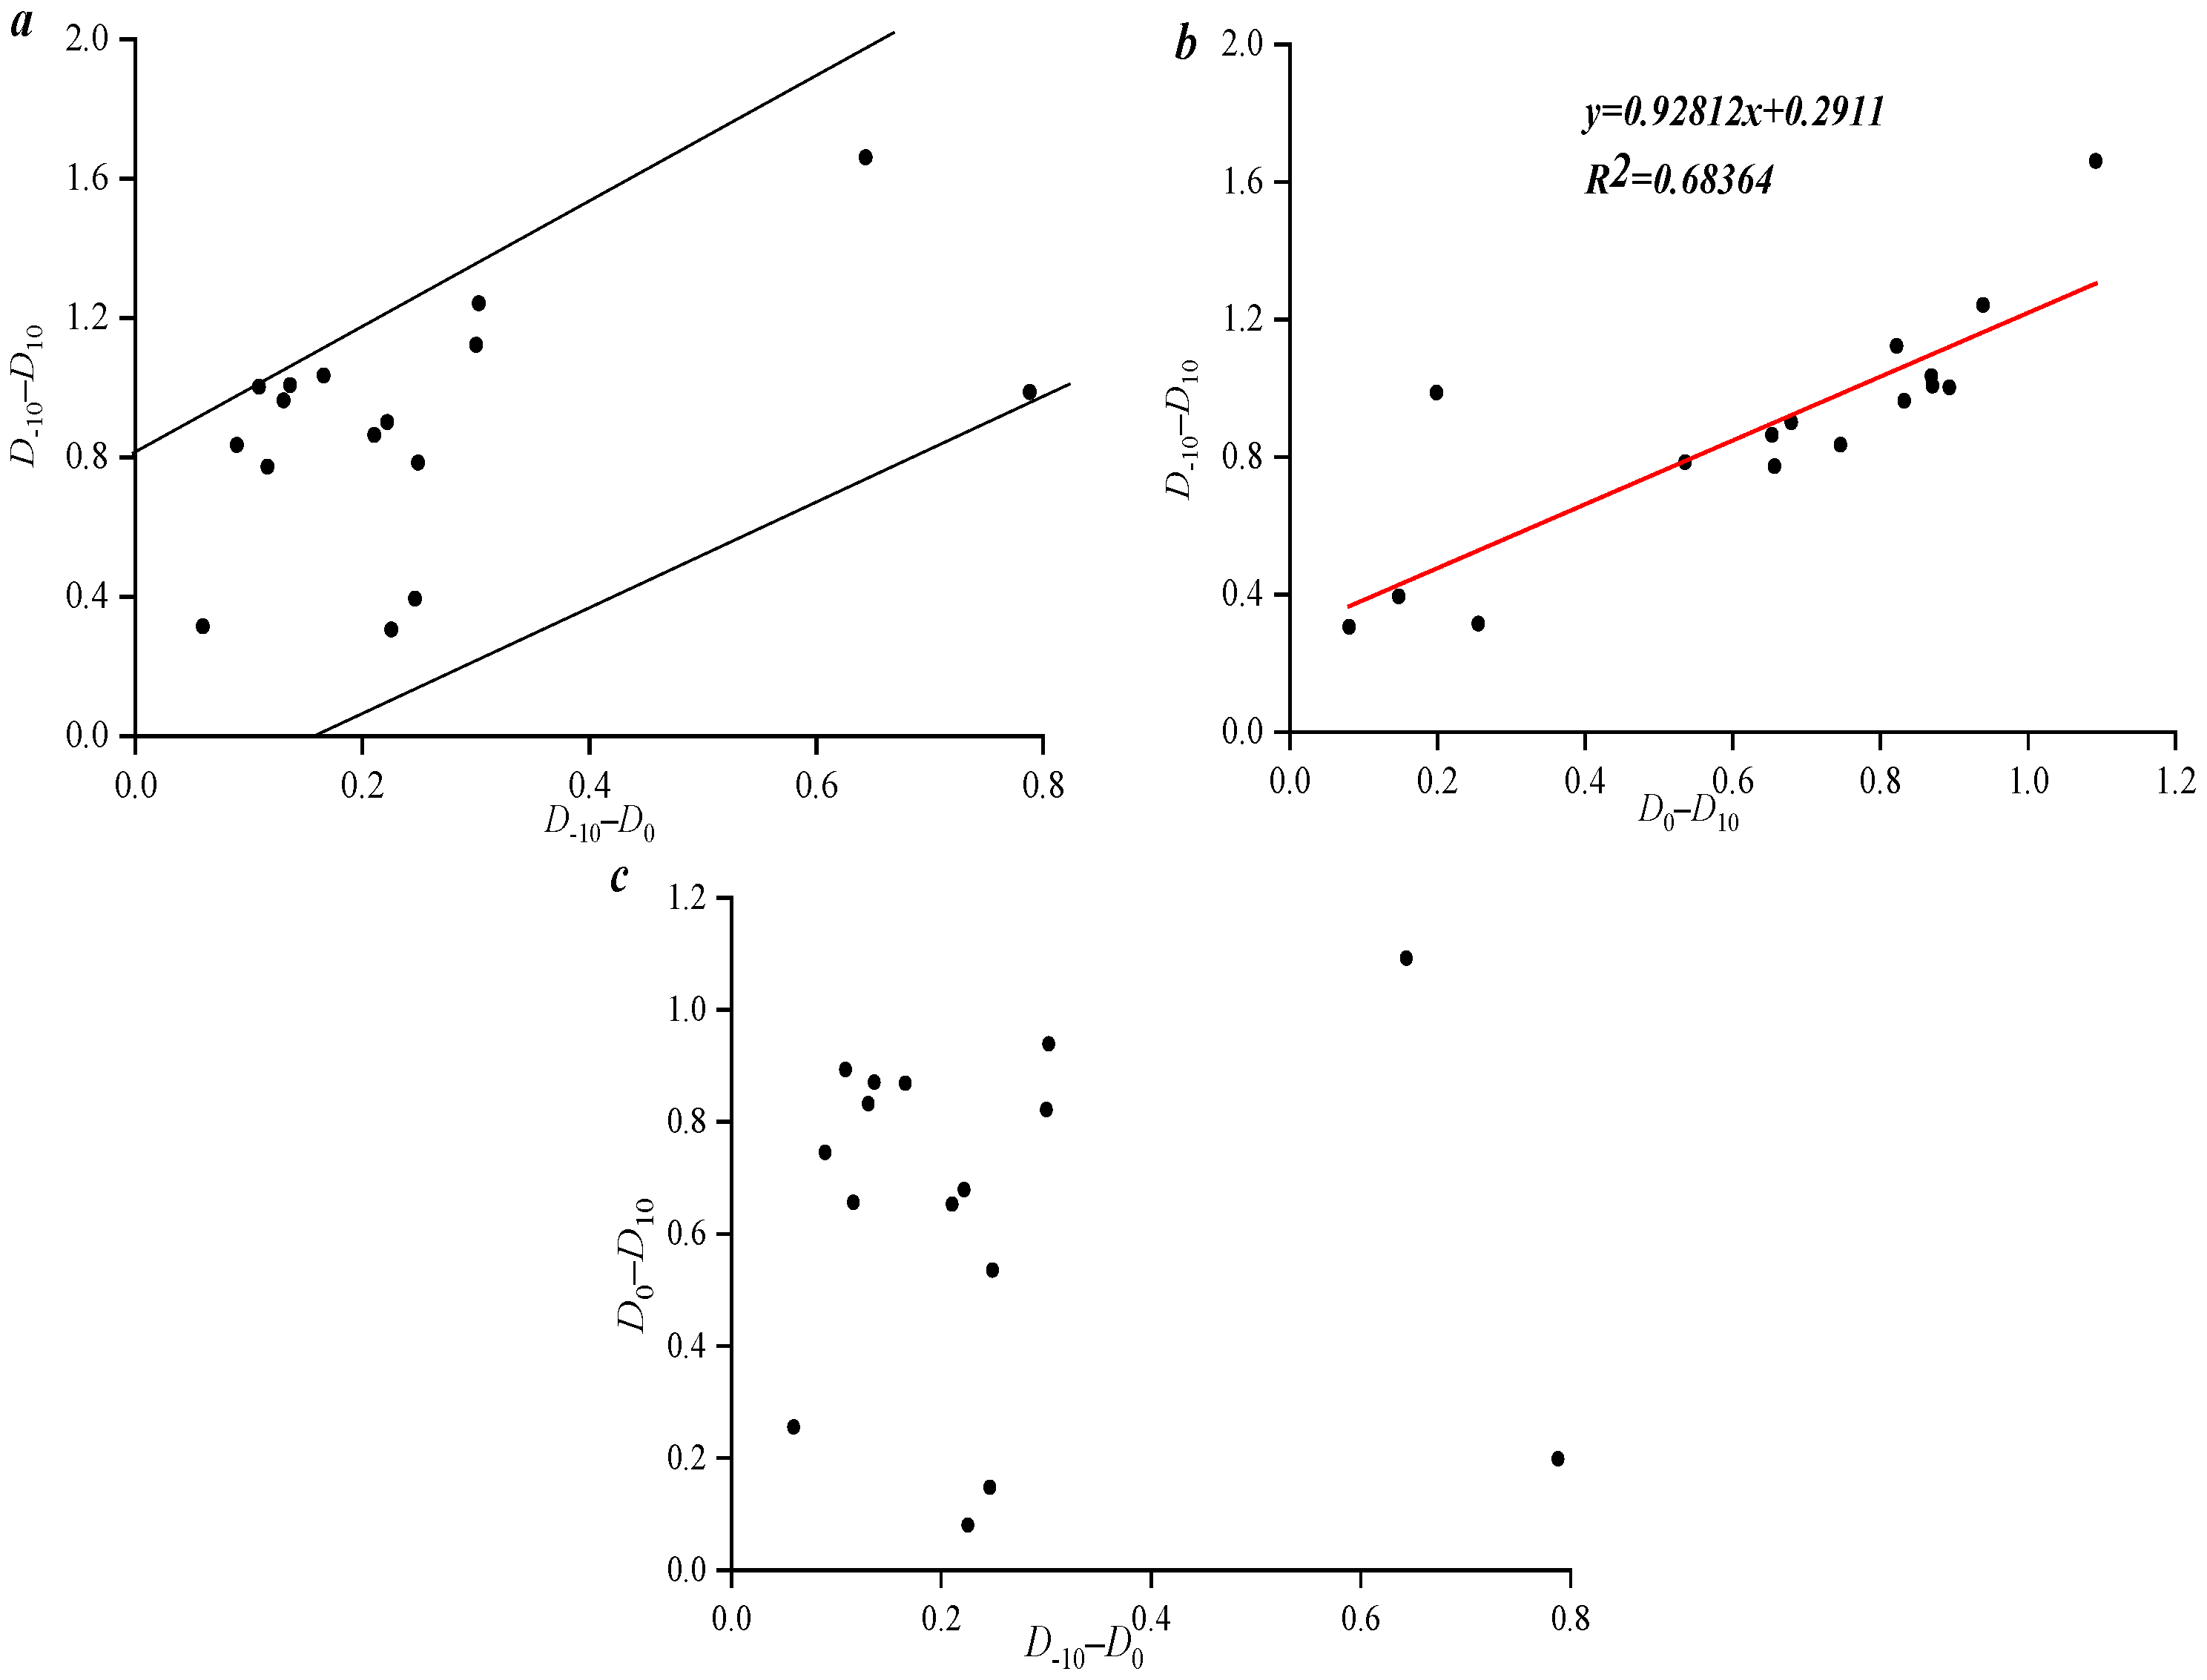
Figure 13 shows that there is no correlation between D−10D0 and D0D10, D−10D0 is positively correlated with D−10–D10, and D0D10 is positively correlated with D−10D10. The correlation between D−10D0 and D−10D10 is stronger. It indicates that the lower value area of pore volume areas controls the overall pore diameter distribution of coal reservoirs.

3.4. Influencing Factors of Fractal Dimension and Pore Permeability Variation

Figure 14a shows that there is a positive correlation between adsorption pore volume percentage and DM, and a negative correlation between adsorption pore volume percentage and DS. The results show that both the M-model and S-model can reflect the heterogeneity of seepage pore distribution. Figure 14b shows that the percentage of macropore volume has a negative correlation with DM and a positive correlation with DS. It shows that the M-model and S-model can reflect the heterogeneity of the macropore distribution. In conclusion, both the M-model and S-model can reflect the heterogeneity of the distribution of seepage pores and macropores during the mercury intrusion stage.
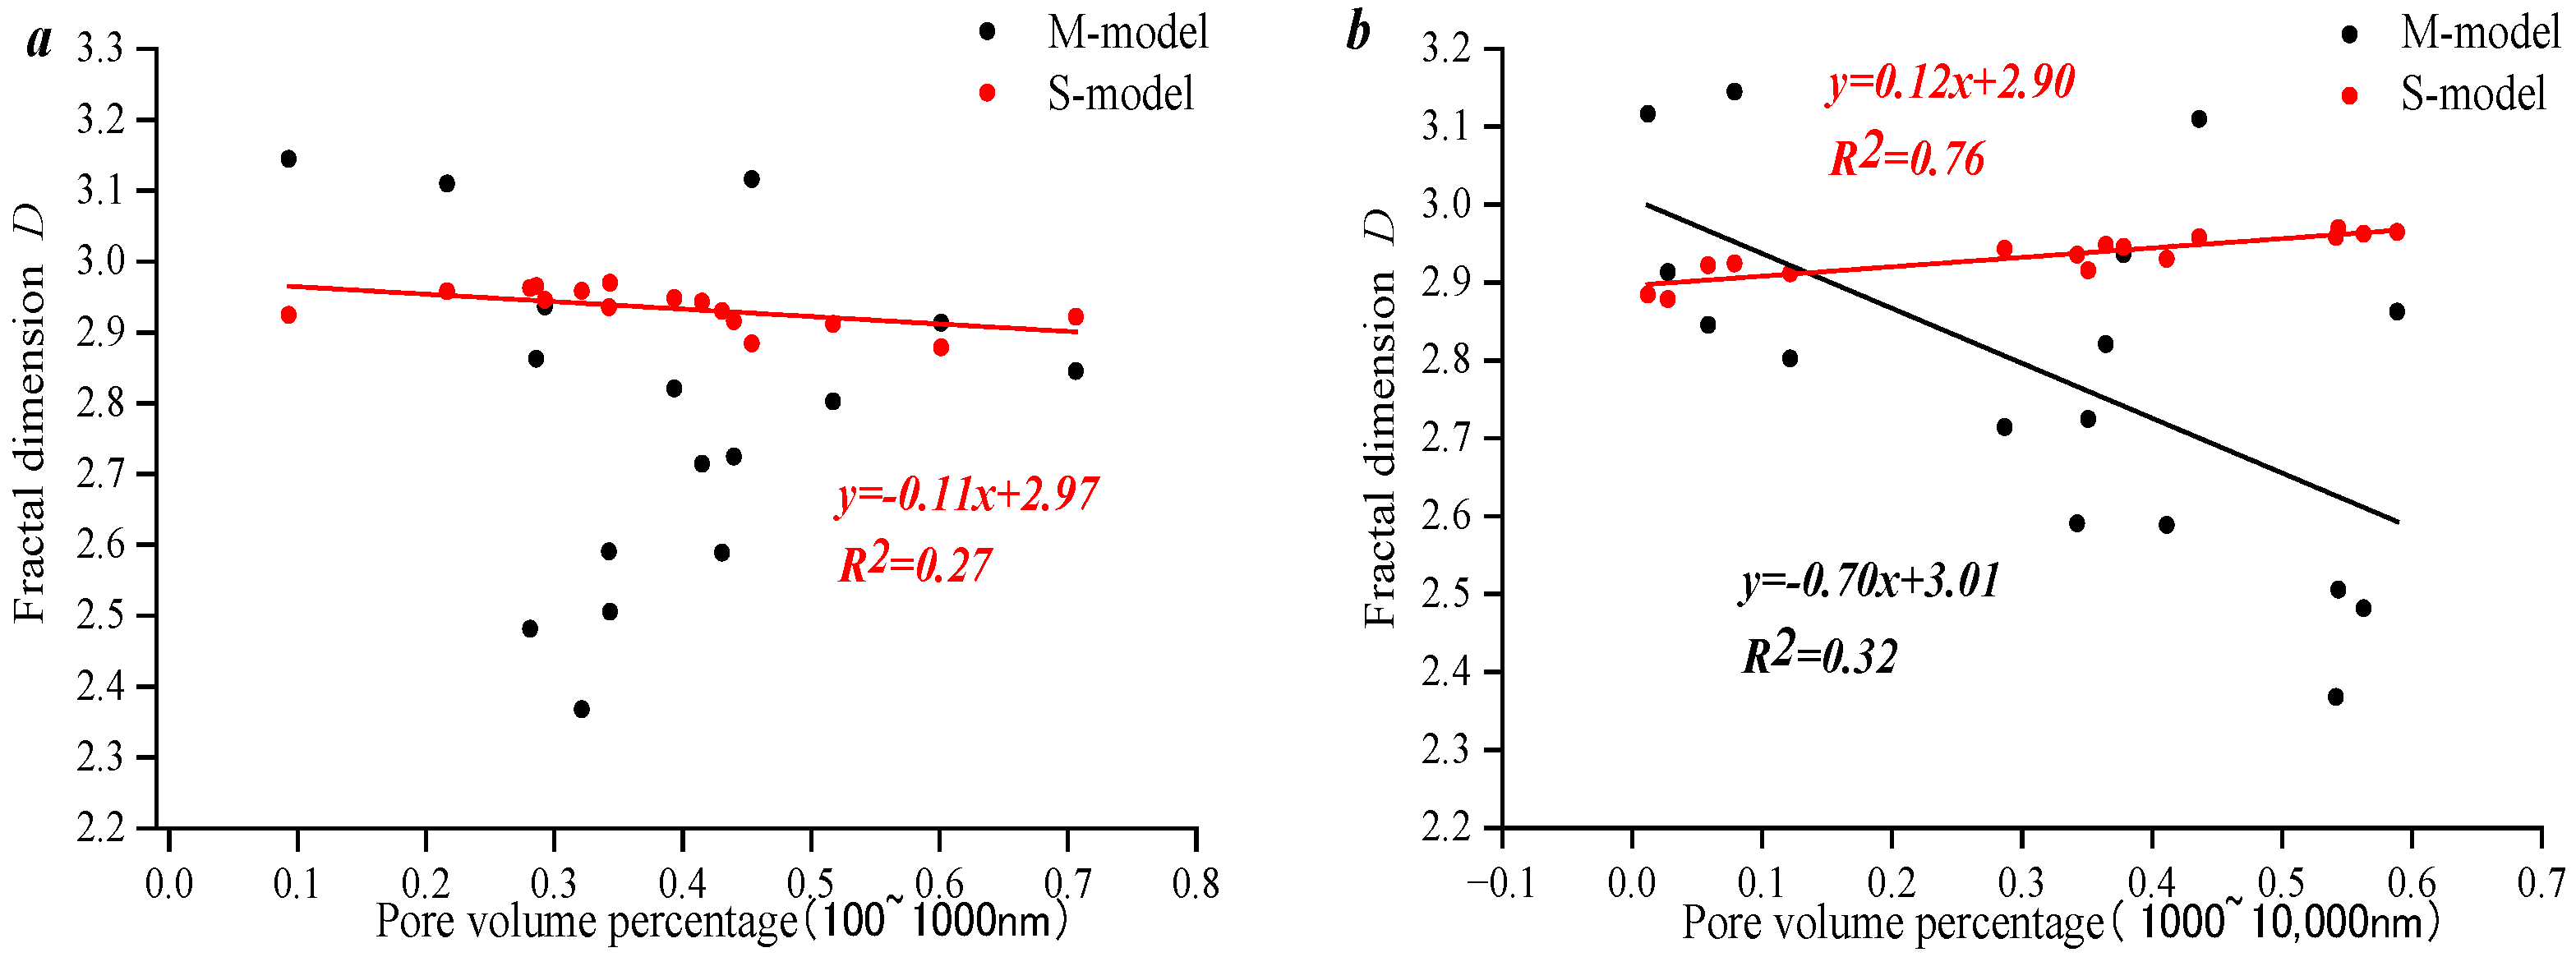
Figure 15a shows that there is no linear relationship between seepage pore volume percentage and DM, while there is a linear negative correlation between seepage pore volume percentage and DS, indicating that the heterogeneity of seepage pore distribution cannot be characterized by the M-model. Figure 15b shows that the percentage of macropore volume has a linear negative correlation with DM and a linear positive correlation with DS, indicating that the M-model can be used to characterize the heterogeneity of macropore distribution. In summary, the distribution heterogeneity of seepage pores and macropores can be characterized by the S-model in the mercury removal stage, and the results are consistent with those in the mercury intrusion stage. However, the M-model could not characterize the heterogeneity of pore size distribution at each stage, and the result was different from that at the mercury intrusion stage.
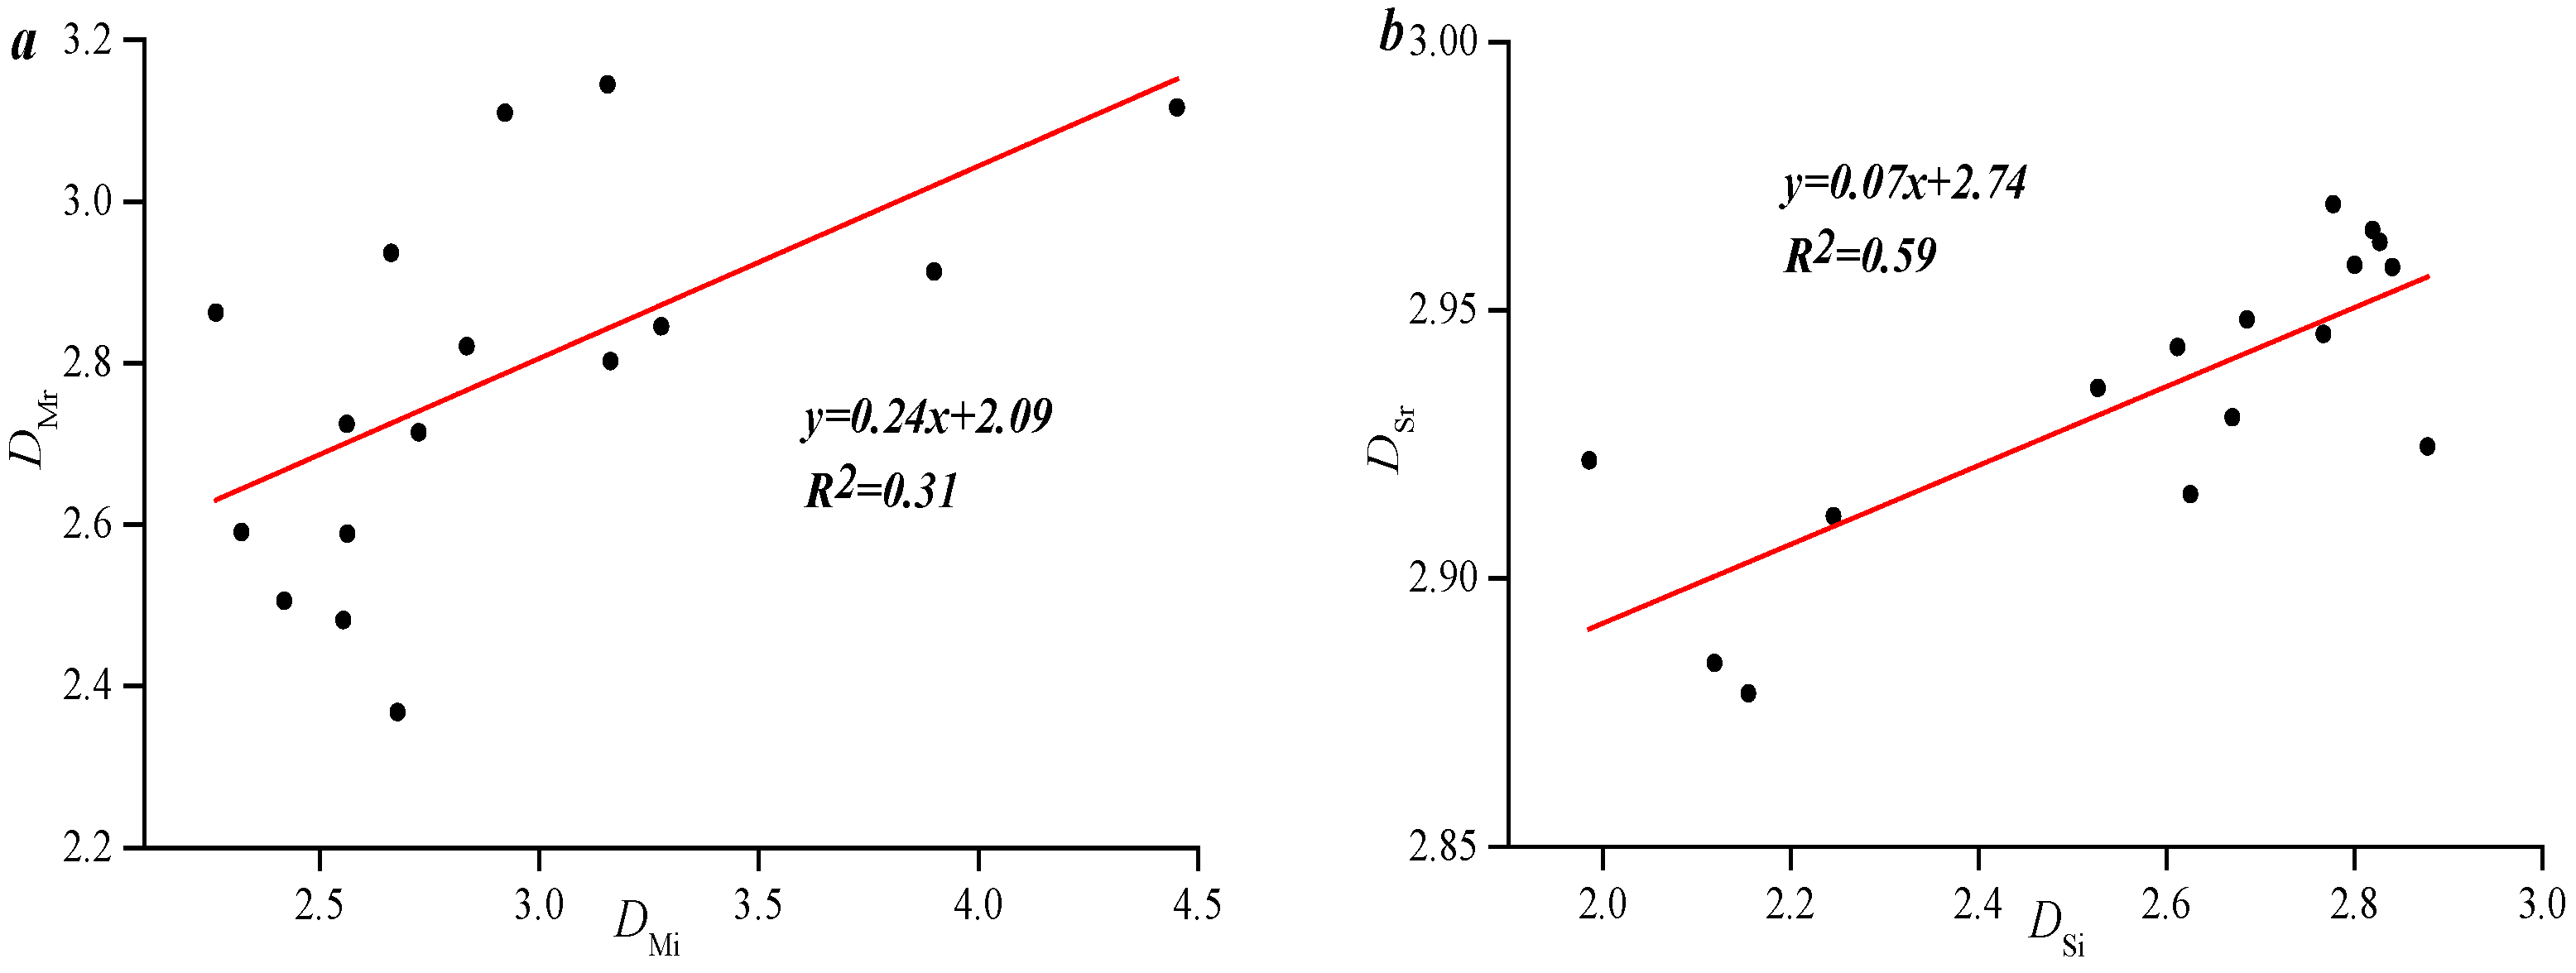
Figure 16a shows that there is a linear positive correlation between the fractal dimension DMi of the M-model in the mercury intrusion stage and the fractal dimension DMr of the M-model in the mercury removal stage. The fractal dimension DSi of the S-model in the mercury intrusion stage and DSr of the S-model in the mercury removal stage also show a linear positive correlation. This clarifies that the fractal characteristics of the M-model are similar in the mercury intrusion stage and the mercury removal stage, and the S-model is also similar in the characterization of the fractal characteristics of the mercury intrusion and mercury removal curves.
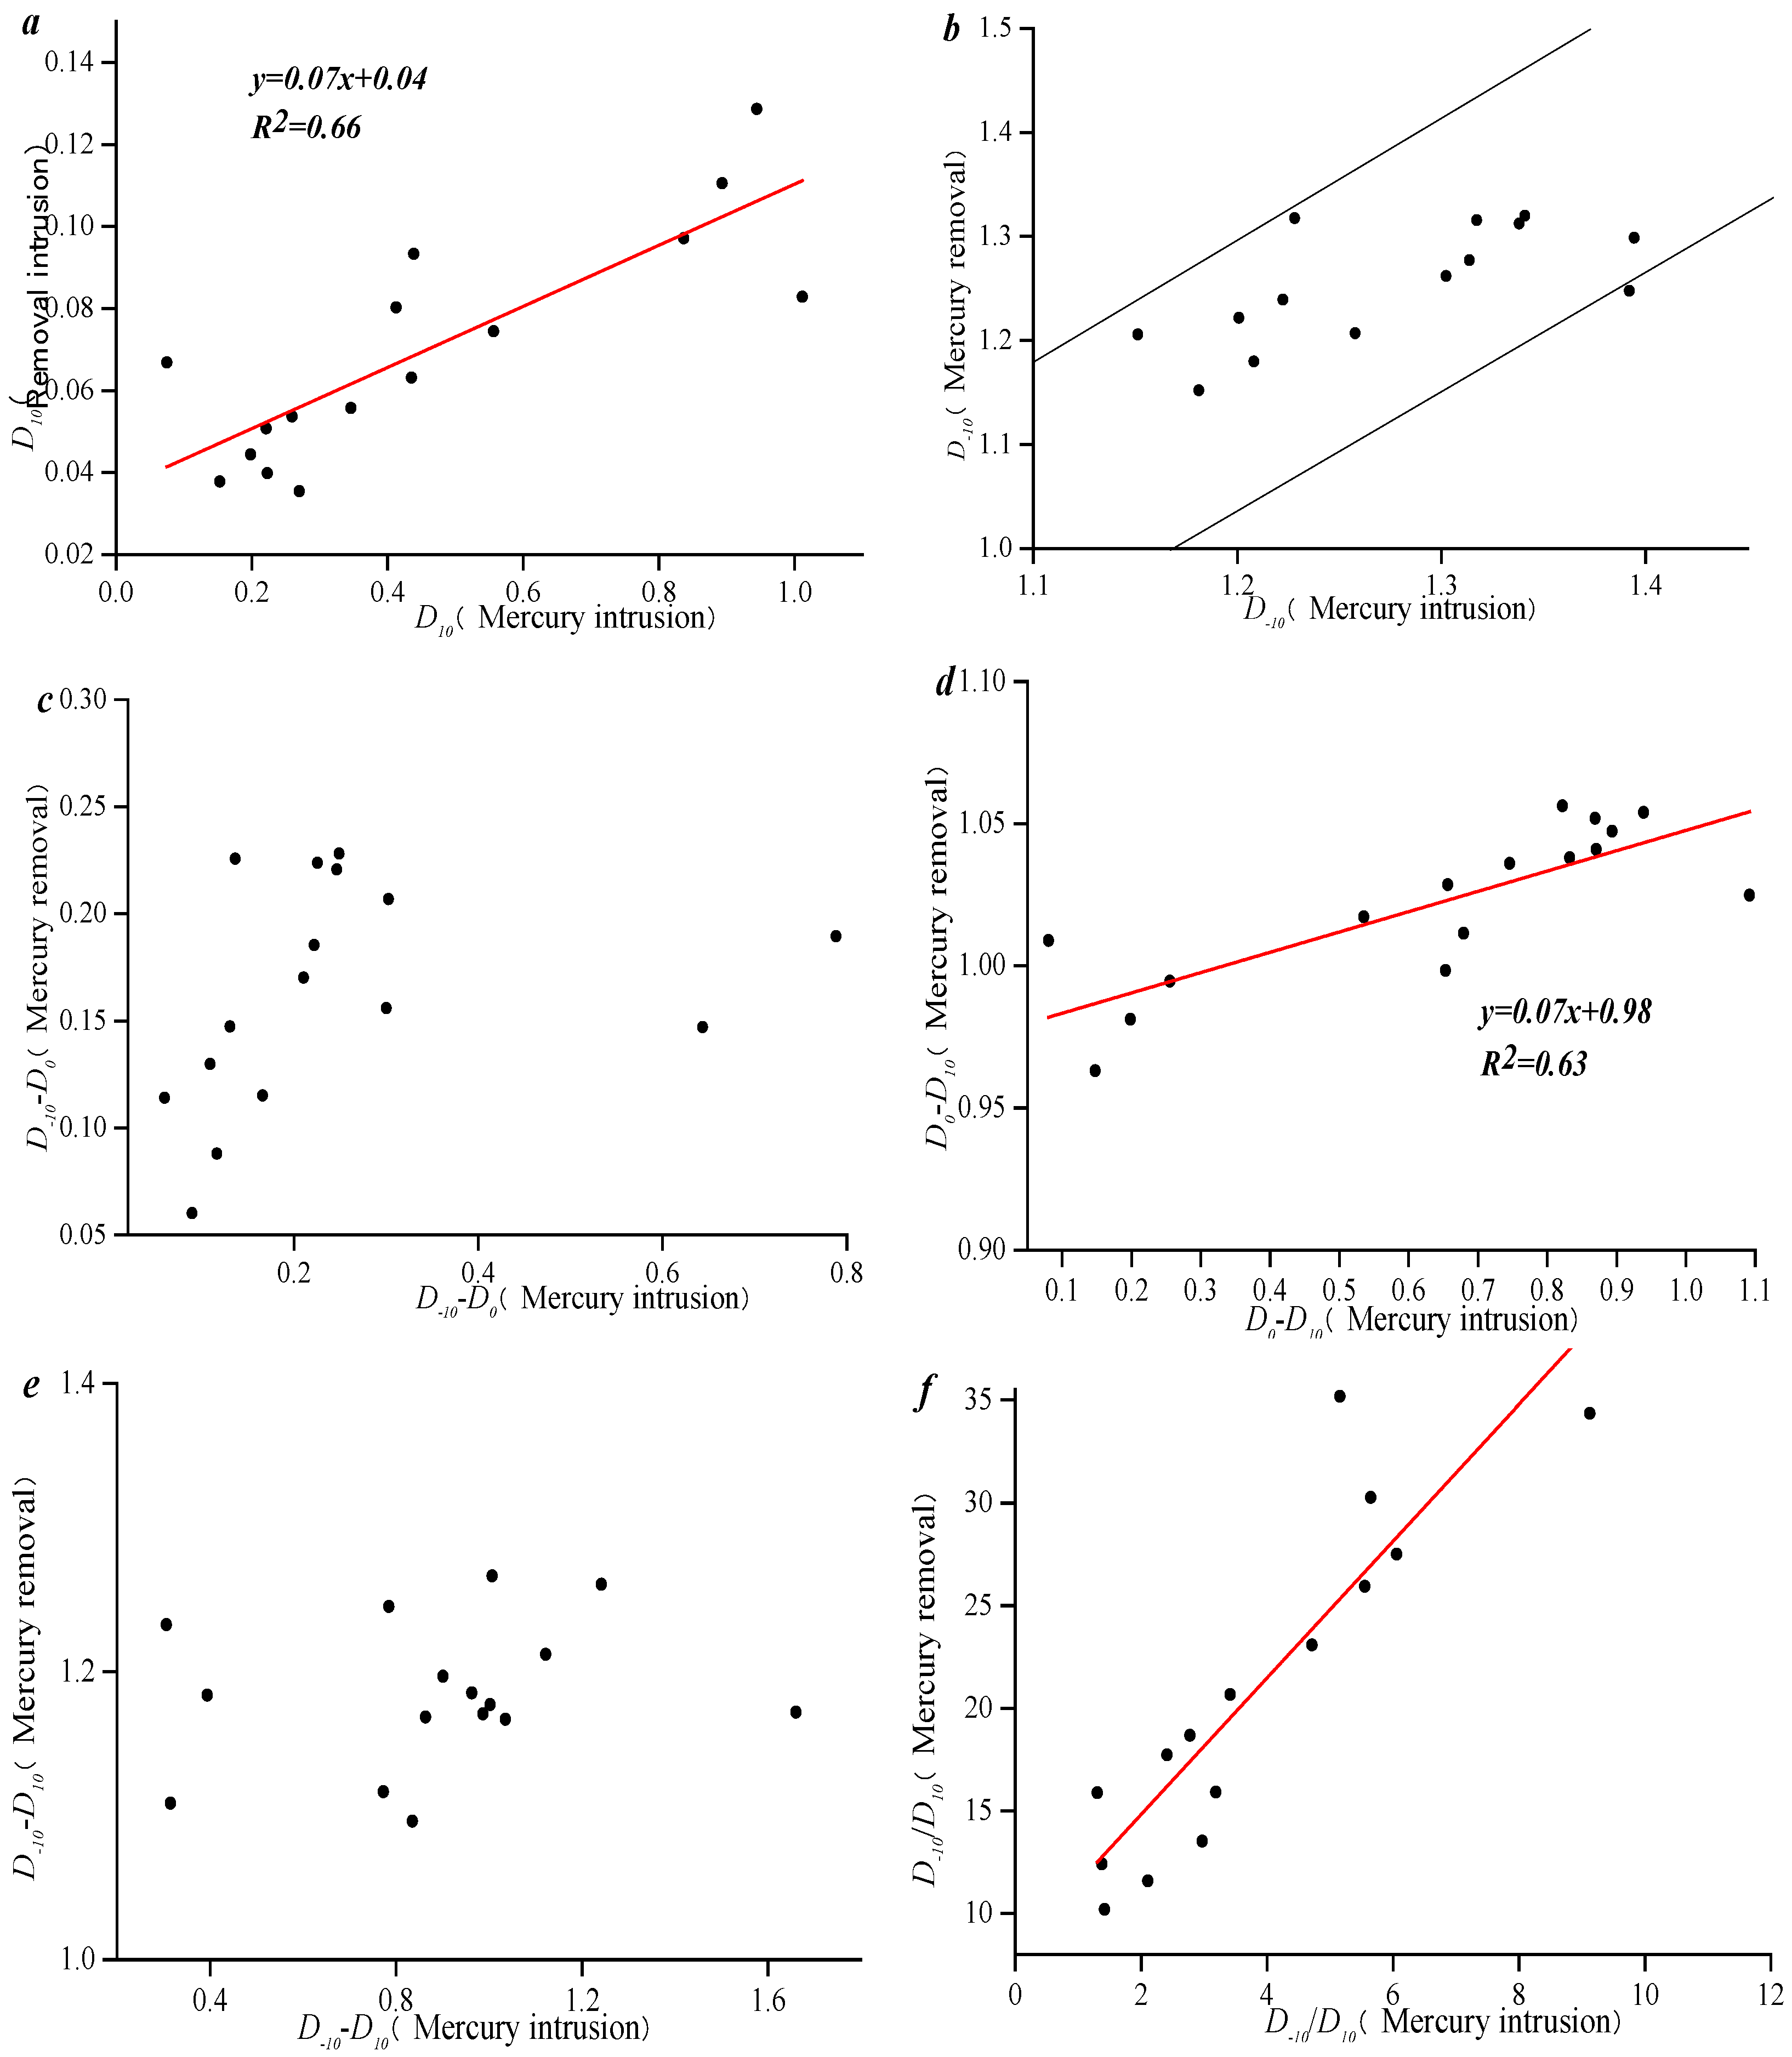
Figure 17 shows that the fractal dimension values D10, D−10, D−10/D10, D−10D10, and D0D10 of the multiple models in the mercury intrusion stage and the mercury removal stage are linear, while there is no correlation between D−10D0 and D−10D10.

3.5. Permeability Sensitivity by Using Overburden Pore Permeability Test

Figure 18 shows that the effective stress increases from 0 to 45 MPa, permeability shows a good exponential function decreasing trend, and the goodness of fit reaches the highest at 0.99. At the same time, the effect of effective stress on permeability has phases. When the effective stress reaches 30 MPa, permeability does not change significantly with stress and gradually it becomes stable. With the continuous increase in confining pressure, the compressibility of pore fractures gradually decreases, and the increase in stress only results in the closure of some tiny pores. Therefore, the permeability of coal samples shows a small change at the later stage of stress.
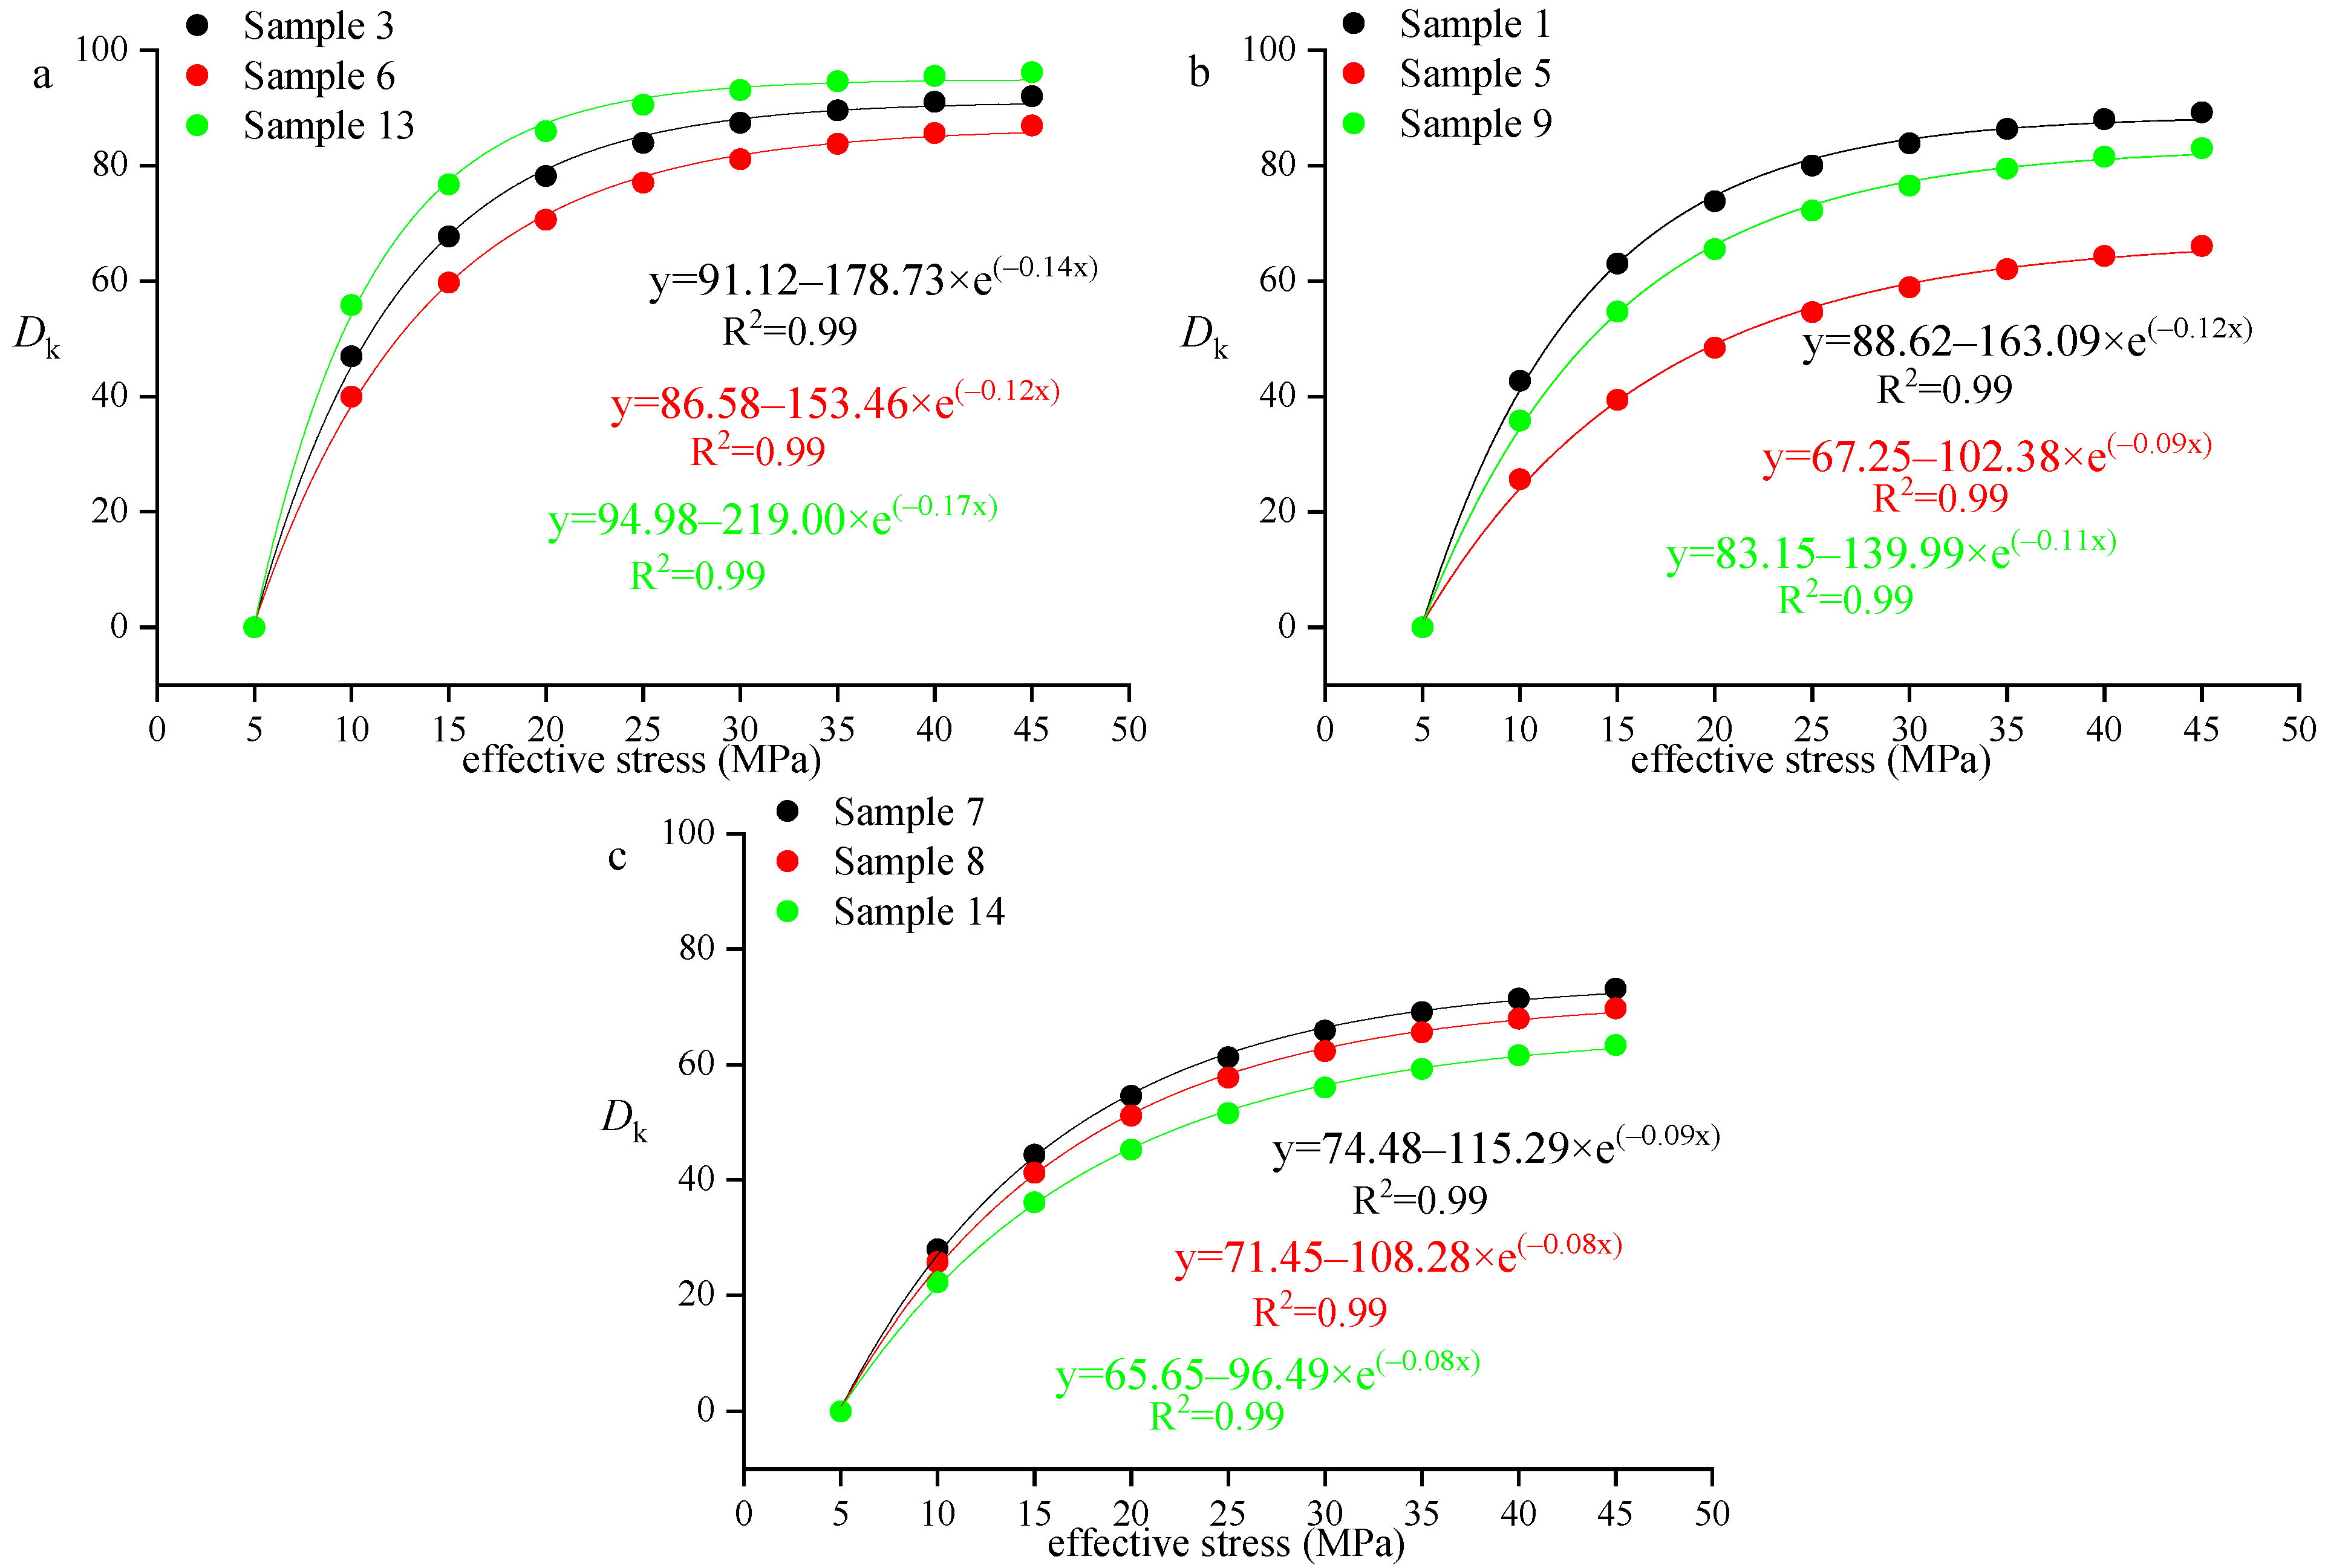
Figure 19 shows that the permeability loss rate of each sample ranges from 0.13 to 0.96. The permeability of Type A is the most sensitive to pressure, and the permeability loss rate can reach 96%. According to the analysis, due to the relatively more developed original pore fracture structure of the coal sample, the initial permeability is large. When the high-stress stage (45 MPa) is reached, the large amount of compressible space provided by the porous pores and fracture is fully compressed. For Type B/C, with poorly developed pore–fracture structure, the compressible space at the high-stress stage is provided by micropores such as adsorption pores, and the compression space is less, resulting in a relatively small permeability loss rate (Figure 19b,c).
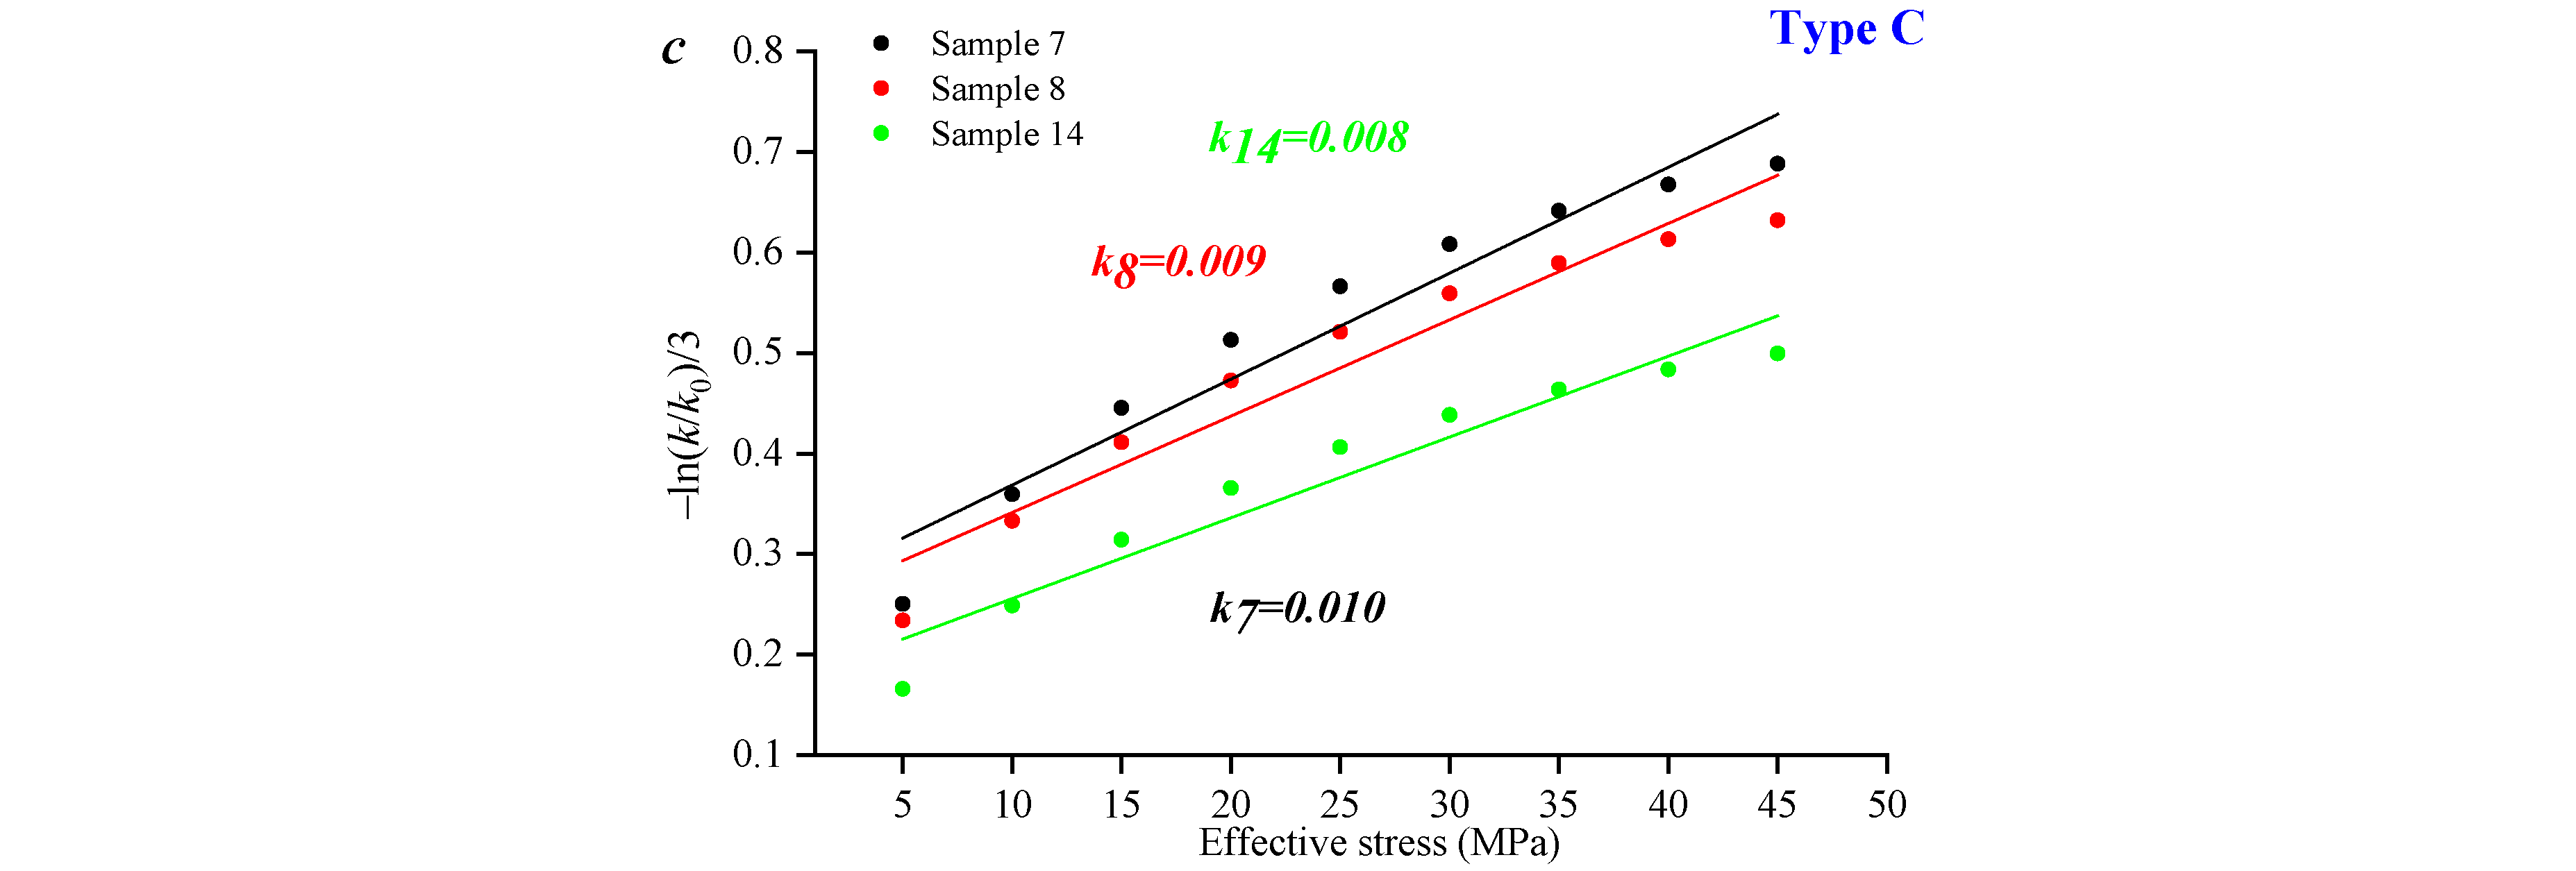
Compressibility could be obtained by using Equation (5). The results show that there is a positive linear correlation between pressure p and –ln(k/k0)/3. The compressibility of the Type A samples ranges from 0.016 to 0.026 Mpa−1, while that of the Type B samples ranges from 0.008 to 0.017, and that of the Type C samples ranges from 0.008 to 0.010. In general, the compressibility of the Type C samples was lower than that of the Type B and C samples (Figure 20), which was determined by the pore structure of the samples.
Figure 21 shows that the compressibility is negatively correlated with the pore volume at 1000–10,000 nm. It is not related to the fractal dimension of mercury intrusion and mercury removal. There is no relationship between compressibility and mercury intrusion fractal dimension and mercury removal fractal dimension, which may be because the compressibility of the sample is affected by the comprehensive pore structure.

4. Conclusions

In this paper, high-pressure mercury intrusion test curves of 16 coal samples from the Taiyuan Formation in the Linxing area are the research objects. Based on the fractal dimension values of mercury intrusion and retreat curves, the correlation among the two different fractal parameters is studied. Then, the permeability variation of different types of coal samples is studied using overlying pressure pore permeability tests. The correlation between the permeability variation of the coal samples and dimension values is explored, and the results are as follows.
(1)
Based on porosity and mercury removal efficiency, all coal samples can be divided into three types, that is, types A, B, and C. Among them, Type A samples are characterized by a lower total pore volume, with pore volume percentages ranging from 1000 to 10,000 nm not exceeding 15%.
(2)
During the mercury injection stage, both the M-model and S-model can reflect heterogeneity of seepage pore distribution. In the mercury removal stage, the S-model can characterize the distribution heterogeneity of seepage pores and macropores.
(3)
Among them, the Type A samples have the strongest sensitivity of permeability to pressure, with a permeability loss rate of up to 96%. The well-developed original pore and fracture structure of the coal sample is the reason for the initial permeability being relatively high.
(4)
The compressibility is only linearly negatively correlated with the pore volume between 1000 and 10,000 nm. There is no relationship between fractal dimension of mercury intrusion and fractal dimension of mercury retreat.

Author Contributions

Methodology, X.J.; software, B.M.; validation, J.Z.; formal analysis, D.X. and V.V.; investigation, Z.Q. All authors have read and agreed to the published version of the manuscript.

Funding

This research was sponsored by Research Fund of Shandong Coalffeld Geological Bureau (2022-004).

Data Availability Statement

Data are contained within the article.

Conflicts of Interest

Author Xuchao Jiang was employed by the company Beijing Tianma Intelligent Control Technology Co., Ltd. The remaining authors declare that the research was conducted in the absence of any commercial or financial relationships that could be construed as a potential conflict of interest.

Abbreviations

DSiThe fractal dimension is calculated based on the mercury intrusion curve and S single model.
DSrThe fractal dimension is calculated based on the mercury removal curve and S single model.
DkPermeability loss rate
DMiThe fractal dimension is calculated based on the mercury intrusion curve and M single model.
DMrThe fractal dimension is calculated based on the mercury removal curve and M single model.
CfPore compressibility coefficient under horizontal effective stress variation

References

  1. Tao, S.; Chen, S.; Pan, Z. Current status, challenges, and policy suggestions for coalbed methane industry development in China: A review. Energy Sci. Eng. 2019, 7, 1059–1074. [Google Scholar] [CrossRef]
  2. Zou, Q.; Chen, Z.; Cheng, Z.; Liang, Y.; Xu, W.; Wen, P.; Zhang, B.; Liu, H.; Kong, F. Evaluation and intelligent deployment of coal and coalbed methane coupling coordinated exploitation based on Bayesian network and cuckoo search. Int. J. Min. Sci. Technol. 2022, 32, 1315–1328. [Google Scholar] [CrossRef]
  3. Li, Z.; Ren, T.; Li, X.; Cheng, Y.; He, X.; Lin, J.; Qiao, M.; Yang, X. Full-scale pore structure characterization of different rank coals and its impact on gas adsorption capacity: A theoretical model and experimental study. Energy 2023, 277, 127621. [Google Scholar] [CrossRef]
  4. Li, Z.; Ren, T.; Li, X.; Qiao, M.; Yang, X.; Tan, L.; Nie, B. Multi-scale pore fractal characteristics of differently ranked coal and its impact on gas adsorption. Int. J. Min. Sci. Technol. 2023, 33, 389–401. [Google Scholar] [CrossRef]
  5. Hui, G.; Chen, Z.; Schultz, R.; Chen, S.; Song, Z.; Zhang, Z.; Song, Y.; Wang, H.; Wang, M.; Gu, F. Intricate unconventional fracture networks provide fluid diffusion pathways to reactivate pre-existing faults in unconventional reservoirs. Energy 2023, 282, 128803. [Google Scholar] [CrossRef]
  6. Qin, Y.; Moore, T.A.; Shen, J.; Yang, Z.; Shen, Y.; Wang, G. Resources and geology of coalbed methane in China: A review. Int. Geol. Rev. 2018, 60, 777–812. [Google Scholar] [CrossRef]
  7. Liu, Q.; Wu, X.; Wang, X.; Jin, Z.; Zhu, D.; Meng, Q.; Huang, S.; Liu, J.; Fu, Q. Carbon and hydrogen isotopes of methane, ethane, and propane: A review of genetic identification of natural gas. Earth-Sci. Rev. 2019, 190, 247–272. [Google Scholar] [CrossRef]
  8. Xue, Y.; Liu, J.; Ranjith, P.; Liang, X.; Wang, S. Investigation of the influence of gas fracturing on fracturing characteristics of coal mass and gas extraction efficiency based on a multi-physical field model. J. Pet. Sci. Eng. 2021, 206, 109018. [Google Scholar] [CrossRef]
  9. Malozyomov, B.V.; Golik, V.I.; Brigida, V.; Kukartsev, V.V.; Tynchenko, Y.A.; Boyko, A.A.; Tynchenko, S.V. Substantiation of drilling parameters for undermined drainage boreholes for increasing methane production from unconventional coal-gas collectors. Energies 2023, 16, 4276. [Google Scholar] [CrossRef]
  10. Li, Y.; Zhang, C.; Tang, D.; Gan, Q.; Niu, X.; Wang, K.; Shen, R. Coal pore size distributions controlled by the coalification process: An experimental study of coals from the Junggar, Ordos and Qinshui basins in China. Fuel 2017, 206, 352–363. [Google Scholar] [CrossRef]
  11. Zheng, S.; Yao, Y.; Liu, D.; Cai, Y.; Liu, Y. Characterizations of full-scale pore size distribution, porosity and permeability of coals: A novel methodology by nuclear magnetic resonance and fractal analysis theory. Int. J. Coal Geol. 2018, 196, 148–158. [Google Scholar] [CrossRef]
  12. Liu, Z.; Liu, D.; Cai, Y.; Yao, Y.; Pan, Z.; Zhou, Y. Application of nuclear magnetic resonance (NMR) in coalbed methane and shale reservoirs: A review. Int. J. Coal Geol. 2020, 218, 103261. [Google Scholar] [CrossRef]
  13. Tao, S.; Chen, S.; Tang, D.; Zhao, X.; Xu, H.; Li, S. Material composition, pore structure and adsorption capacity of low-rank coals around the first coalification jump: A case of eastern Junggar Basin, China. Fuel 2018, 211, 804–815. [Google Scholar] [CrossRef]
  14. Li, H.; Shi, S.; Lin, B.; Lu, J.; Ye, Q.; Lu, Y.; Wang, Z.; Hong, Y.; Zhu, X. Effects of microwave-assisted pyrolysis on the microstructure of bituminous coals. Energy 2019, 187, 115986. [Google Scholar] [CrossRef]
  15. Li, X.; Fu, X.; Tian, J.; Guan, W.; Liu, X.; Ge, Y.; Ranjith, P.; Wang, W.; Wang, M.; Liang, S. Heterogeneities of seepage pore and fracture of high volatile bituminous coal core: Implications on water invasion degree. J. Pet. Sci. Eng. 2019, 183, 106409. [Google Scholar] [CrossRef]
  16. Wang, G.; Qin, X.; Shen, J.; Zhang, Z.; Han, D.; Jiang, C. Quantitative analysis of microscopic structure and gas seepage characteristics of low-rank coal based on CT three-dimensional reconstruction of CT images and fractal theory. Fuel 2019, 256, 115900. [Google Scholar] [CrossRef]
  17. Li, S.; Qin, Y.; Tang, D.; Shen, J.; Wang, J.; Chen, S. A comprehensive review of deep coalbed methane and recent developments in China. Int. J. Coal Geol. 2023, 279, 104369. [Google Scholar] [CrossRef]
  18. Liu, S.; Sun, H.; Zhang, D.; Yang, K.; Wang, D.; Li, X.; Long, K.; Li, Y. Nuclear magnetic resonance study on the influence of liquid nitrogen cold soaking on the pore structure of different coals. Phys. Fluids 2023, 35, 012009. [Google Scholar] [CrossRef]
  19. Su, P.; Xia, Z.; Wang, P.; Ding, W.; Hu, Y.; Zhang, W.; Peng, Y. Fractal and multifractal analysis of pore size distribution in low permeability reservoirs based on mercury intrusion porosimetry. Energies 2019, 12, 1337. [Google Scholar] [CrossRef]
  20. Hu, Y.; Guo, Y.; Shangguan, J.; Zhang, J.; Song, Y. Fractal characteristics and model applicability for pores in tight gas sandstone reservoirs: A case study of the upper paleozoic in ordos basin. Energy Fuels 2020, 34, 16059–16072. [Google Scholar] [CrossRef]
  21. Zheng, S.; Sang, S.; Yao, Y.; Liu, D.; Liu, S.; Wang, M.; Feng, G. A multifractal-based method for determination NMR dual T2 cutoffs in coals. J. Pet. Sci. Eng. 2022, 214, 110488. [Google Scholar] [CrossRef]
  22. Feng, S.; Li, M.; Zhang, J.; Xu, G.; Vandeginste, V.; Zhang, P.; Ju, W. Single and multi-fractal dimension variation of tight sandstone by using centrifuge T2 spectral curve. Greenh. Gases-Sci. Technol. 2024, 14, 111–137. [Google Scholar] [CrossRef]
  23. Fu, H.; Tang, D.; Xu, T.; Xu, H.; Tao, S.; Li, S.; Yin, Z.; Chen, B.; Zhang, C.; Wang, L. Characteristics of pore structure and fractal dimension of low-rank coal: A case study of Lower Jurassic Xishanyao coal in the southern Junggar Basin, NW China. Fuel 2017, 193, 254–264. [Google Scholar] [CrossRef]
  24. Xu, X.; Meng, Z.; Wang, Y. Experimental comparisons of multiscale pore structures between primary and disturbed coals and their effects on adsorption and seepage of coalbed methane. J. Pet. Sci. Eng. 2019, 174, 704–715. [Google Scholar] [CrossRef]
  25. Wang, G.; Han, D.; Jiang, C.; Zhang, Z. Seepage characteristics of fracture and dead-end pore structure in coal at micro- and meso-scales. Fuel 2020, 266, 117058. [Google Scholar] [CrossRef]
  26. Jing, D.; Meng, X.; Ge, S.; Zhang, T.; Ma, M.; Tong, L. Reconstruction and seepage simulation of a coal pore-fracture network based on CT technology. PLoS ONE 2021, 16, e0252277. [Google Scholar] [CrossRef] [PubMed]
  27. Ju, Y.; Chen, J.; Wang, Y.; Gao, F.; Xie, H. Numerical analysis of hydrofracturing behaviors and mechanisms of heterogeneous reservoir glutenite, using the continuum-based discrete element method while considering hydromechanical coupling and leak-off effects. J. Geophys. Res.-Solid Earth 2018, 123, 3621–3644. [Google Scholar] [CrossRef]
  28. Yang, Y.; Wang, D.; Yang, J.; Wang, B.; Liu, T. Fractal analysis of CT images of tight sandstone with anisotropy and permeability prediction. J. Pet. Sci. Eng. 2021, 205, 108919. [Google Scholar] [CrossRef]
  29. Zhang, J.; Qin, Z.; Han, Y.; Wang, H.; Hou, M.; Yan, G.; Feng, G.; Zhang, X.; Yin, T.; Zhang, H.; et al. Pore-fracture distribution heterogeneity of shale reservoirs determined by using HPMI and LPN2 GA tests. Acta Geol. Sin. Engl. Ed. 2022, 96, 1659–1672. [Google Scholar] [CrossRef]
  30. Zhang, P.; Yin, Y.; Lu, S.; Li, J.; Chang, X.; Zhang, J.; Pang, Y.; Chen, G.; Liu, Y.; Li, Z. Insights into pore structures and multifractal characteristics of shale oil reservoirs: A case study from Dongying Sag, Bohai Bay Basin, China. Energy Fuels 2022, 36, 8224–8237. [Google Scholar] [CrossRef]
  31. Yao, P.; Zhang, J.; Qin, Z.; Fan, A.; Feng, G.; Vandeginste, V.; Zhang, P.; Zhang, X. Effect of pore structure heterogeneity of sandstone reservoirs on porosity–permeability variation by using single–multi-fractal models. ACS Omega 2024, 9, 23339–23354. [Google Scholar] [CrossRef] [PubMed]
  32. Wang, Z.; Ge, Z.; Li, R.; Zhou, Z.; Hou, Y.; Zhang, H. Coupling effect of temperature, gas, and viscoelastic surfactant fracturing fluid on the microstructure and its fractal characteristics of deep coal. Energy Fuels 2021, 35, 19423–19436. [Google Scholar] [CrossRef]
  33. Chu, P.; Xie, H.; Li, C.; Liu, Q.; Lu, Z.; Lu, J. Mechanism of desorption hysteresis in coalbed methane: Insights from microscopic pore properties and adsorption theory. Phys. Fluids 2024, 36, 012004. [Google Scholar] [CrossRef]
  34. Wang, H.; Wang, L.; Zheng, S.; Sun, Y.; Shen, S.; Zhang, X. Research on coal matrix pore structure evolution and adsorption behavior characteristics under different thermal stimulation. Energy 2024, 287, 129677. [Google Scholar] [CrossRef]
  35. Zhang, J.; Hu, Y. Comparative evaluation of pore structure heterogeneity in low-permeability tight sandstones using different fractal models based on NMR technology: A case study of benxi formation in the central Ordos Basin. Energy Fuels 2020, 34, 13924–13942. [Google Scholar] [CrossRef]
  36. Zhang, M.; Duan, C.; Li, G.; Fu, X.; Zhong, Q.; Liu, H.; Dong, Z. Determinations of the multifractal characteristics of the pore structures of low-, middle-, and high-rank coal using high-pressure mercury injection. J. Pet. Sci. Eng. 2021, 203, 108656. [Google Scholar] [CrossRef]
  37. Zhang, J.; Wei, C.; Zhao, J.; Ju, W.; Chen, Y.; Tamehe, L.S. Comparative evaluation of the compressibility of middle and high rank coals by different experimental methods. Fuel 2019, 245, 39–51. [Google Scholar] [CrossRef]
Figure 1. Parametric subsample results of high-pressure mercury testing.
Processes 12 01434 g001
Figure 2. Pressure–mercury curves of different samples and their pore distribution characteristics. (a,d) High pressure mercury intrusion curve and pore size distribution of type A sample; (b,e) High pressure mercury intrusion curve and pore size distribution of type B sample; (c,f) High pressure mercury intrusion curve and pore size distribution of type C sample.
Processes 12 01434 g002
Figure 3. Comparison of pore distribution characteristics of different types of samples. (a) Distribution of pores with pore sizes ranging from 1000 to 10,000 in different samples; (b) Distribution of pores with pore sizes ranging from 100 to 1000 in different samples; (c) Distribution of pores with pore sizes ranging from 2 to 100 nm in different samples.
Processes 12 01434 g003
Figure 4. Comparison of dimensionality values for different types of samples based on the M-model. (a) Single fractal dimension of type A sample M model; (b) Single fractal dimension of type B sample M model; (c) Single fractal dimension of type C sample M model; (d) Single fractal dimension.
Processes 12 01434 g004
Figure 5. Comparison of dimensionality values for different types of samples based on the S-model. (a) Single fractal dimension of type A sample S model; (b) Single fractal dimension of type B sample S model; (c) Single fractal dimension of type C sample S model; (d) Single fractal dimension.
Processes 12 01434 g005
Figure 6. Comparison of multiple fractal parameters based on different types of samples at the mercury inlet stage. (a) Multifractal characterization of pores in type A samples; (b) Multifractal characterization of pores in type B samples; (c) Multifractal characterization of pores in type C samples.
Processes 12 01434 g006
Figure 7. Comparison of multiple fractal characteristics of different types of samples at the mercury inlet stage. (a) Comparison of pore low value distinguishing shape dimension; (b) Comparison of pore high value distinguishing shape dimension; (c) Multiple fractal dimension.
Processes 12 01434 g007
Figure 8. Multi-fractal variation of different types of samples at the mercury inlet stage. (a) The linear relationship between D−10D10 and D−10D0; (b) The linear relationship between D−10D10 and D0D−10; (c) The linear relationship between D0D10 and D−10D0.
Processes 12 01434 g008
Figure 9. Comparison of dimensionality values for different types of samples based on removal curves. (a) Single fractal dimension of type A sample M model; (b) Single fractal dimension of type B sample M model; (c) Single fractal dimension of type C sample M model; (d) Single fractal dimension.
Processes 12 01434 g009
Figure 10. Comparison of dimensionality values for different types of samples based on the S-model. (a) Single fractal dimension of type A sample S model; (b) Single fractal dimension of type B sample S model; (c) Single fractal dimension of type C sample S model; (d) Single fractal dimension.
Processes 12 01434 g010
Figure 11. Multiple fractal characterization of sample pores based on mercury removal curves. (a) Multifractal characterization of pores in type A samples; (b) Multifractal characterization of pores in type B samples; (c) Multifractal characterization of pores in type C samples.
Processes 12 01434 g011
Figure 12. Multiple fractal characterization of sample pores based on mercury removal curves. (a) Comparison of pore low value distinguishing shape dimension; (b) Comparison of pore high value distinguishing shape dimension; (c) Multiple fractal dimension.
Processes 12 01434 g012
Figure 13. Multiple fractal parameters for different types of samples based on mercury removal curves. (a) The linear relationship between D−10D10 and D−10D0; (b) The linear relationship between D−10D10 and D0D−10; (c) The linear relationship between D0D10 and D−10D0.
Processes 12 01434 g013
Figure 14. Pore volume parameters with fractional dimension values based on mercury inlet curves. (a) The pore volume percentage is between 100~1000 nm; (b) The pore volume percentage is between 1000~10,000 nm.
Processes 12 01434 g014
Figure 15. Pore volume parameters with fractional dimension by using mercury removal curves. (a) The pore volume percentage is between 100~1000 nm; (b) The pore volume percentage is between 1000~10,000 nm.
Processes 12 01434 g015
Figure 16. Relationship between mercury inlet and removal fractal theory. (a) Relationship between DMr and DMi; (b) Relationship between DSr and DSi.
Processes 12 01434 g016
Figure 17. Multiple fractal parameter relationships based on mercury inlet and removal curves. (a) Relationship between D10 (Removal intrusion)and D10 (Mercury intrusion); (b) Relationship between D−10 (Mercury removal)and D−10 (Mercury intrusion); (c) Relationship between D−10D0 (Mercury removal)and D−10D0 (Mercury intrusion); (d) Relationship between D0D−10 (Mercury removal)and D0D−10 (Mercury intrusion); (e) Relationship between D−10D10 (Mercury removal)and D−10D10 (Mercury intrusion); (f) Relationship between D−10/D10 (Mercury removal)and D−10/D10 (Mercury intrusion).
Processes 12 01434 g017
Figure 18. Permeability variation with effective stress of different coal samples. (a) Permeability variation with effective stress of type A coal sample; (b) Permeability variation with effective stress of type B coal sample; (c) Permeability variation with effective stress of type C coal sample.
Processes 12 01434 g018
Figure 19. Dk varies with the effective stress of different coal samples. (a) Dk varies with the effective stress of type A coal sample; (b) Dk varies with the effective stress of type B coal sample; (c) Dk varies with the effective stress of type C coal sample.
Processes 12 01434 g019
Figure 20. Compression coefficients of different samples. (a) Compression coefficients of type A coal sample; (b) Compression coefficients of type B coal sample; (c) Compression coefficients of type C coal sample.
Processes 12 01434 g020aProcesses 12 01434 g020b
Figure 21. The correlation between compressibility and fractal dimension by using mercury intrusion, fractal dimension by using mercury removal, and pore volume. (a) The correlation between compressibility and fractal dimension by using mercury intrusion; (b) The correlation between compressibility and fractal dimension by using mercury removal; (c) The correlation between compressibility and pore volume.
Processes 12 01434 g021
Table 1. Pore diameter distribution of all the coal samples.
Sample No.Pore Volume PercentageTotal Pore Volume (cm3.g−1)
1000~10,000 nm100~1000 nm<100 nm
Sample 10.3509400.4398580.1626070.62
Sample 20.3425810.3425810.1094840.72
Sample 30.0585580.7061100.1967260.45
Sample 40.0276230.6013040.2818990.61
Sample 50.4114410.4305990.1215570.72
Sample 60.1216340.5171050.3223121.01
Sample 70.3646010.3935570.2028191.25
Sample 80.4364660.2164970.3034121.07
Sample 90.2867810.4149830.2422080.78
Sample 100.3781170.2927140.2518140.25
Sample 110.5435330.3433870.0617941.23
Sample 120.5628470.2810680.0939831.27
Sample 130.0789060.0930100.6342510.61
Sample 140.5886060.2859510.0651701.34
Sample 150.5416240.3213470.0751861.09
Sample 160.0121910.4537520.4745070.56
Disclaimer/Publisher’s Note: The statements, opinions and data contained in all publications are solely those of the individual author(s) and contributor(s) and not of MDPI and/or the editor(s). MDPI and/or the editor(s) disclaim responsibility for any injury to people or property resulting from any ideas, methods, instructions or products referred to in the content.