Article

A Study on Effect Analysis and Process Parameter Optimization of Viscous Acid Acidification in a Porous Heterogeneous Carbonate Reservoir

1
Cooperative Innovation Center of Unconventional Oil and Gas, Yangtze University, Wuhan 430100, China
2
Hubei Key Laboratory of Drilling and Production Engineering for Oil and Gas, Yangtze University, Wuhan 430100, China
3
School of Petroleum Engineering, Yangtze University, Wuhan 430100, China
*
Authors to whom correspondence should be addressed.
Processes 2024, 12(7), 1443; https://doi.org/10.3390/pr12071443
Submission received: 6 June 2024 / Revised: 3 July 2024 / Accepted: 8 July 2024 / Published: 10 July 2024
(This article belongs to the Section Energy Systems)

Abstract

:
The homogeneous acid etching of conventional acid in porous heterogeneous carbonate reservoirs leads to a large amount of consumption in the near-wellbore area, which makes the acidification effect often not ideal. In order to improve the acidizing effect of porous heterogeneous carbonate reservoirs, viscous acid is used to increase the stimulation of the target block in this paper. Through systematic experiments, the adaptability of the viscous acid in the four layers of the M reservoir in the target block was evaluated, and the MD and ME layers suitable for acidizing stimulation were determined in combination with physical property analysis. Finally, based on the geological characteristics and experimental data of the preferred layers, a two-scale acid wormhole growth radial model was established, and the construction parameters of acidizing stimulation were optimized. The results show that (1) The preferred viscous acid system has a dissolution rate of more than 95% for the rock powder in the four layers. When the matrix permeability is high, the effect of the acid wormhole is obvious and the permeability increase is higher. (2) The steel sheet corrosion and residual acid damage experiments showed that the acid system was not corrosive to the wellbore, and the reservoir damage rate of the residual acid after the reaction was low. (3) Based on the relationship between reservoir porosity and permeability and the position of edge and bottom water, the MD and ME layers with more potential for acidizing stimulation are selected. (4) The results of the numerical simulation show that the optimal acid pump rate of the MD and ME layers is 1.4 bpm and 1.0 bpm, and the acidizing fluid volume is 255 bbl, which can form effective acid wormholes, and the range of reservoir permeability transformation is the largest. The field application results show that the optimization scheme effectively improves the production of oil wells, verifies the practicability of the scheme, and provides a reference for the process optimization of viscous acid in the same type of porous heterogeneous carbonate reservoir stimulation.

1. Introduction

Carbonate rock is an important field for increasing oil and gas reserves and production [1,2,3]. However, due to its common characteristics of low permeability, high geothermal temperature, deep burial, and low natural production rate, although its development potential is huge, it also brings many challenges and difficulties to development work [4,5,6]. Compared with conventional reservoirs, carbonate reservoirs are characterized by poor overall physical properties, low porosity and permeability, narrow throats, poor connectivity, and strong heterogeneity [7]. In order to achieve sustained high/stable production, reservoir reconstruction measures need to be taken. Matrix acidification is an important measure for the stimulation of carbonate reservoirs [8,9]. Compared with acid fracturing, matrix acidification construction has obvious advantages in equipment requirements, use, construction costs, and related risks [10,11]. Compared with hydraulic fracturing measures, matrix acidification is more suitable for carbonate reservoir characteristics and rock mineral characteristics [12,13].
The M reservoir in the target block is a porous heterogeneous carbonate reservoir. The reservoir is vertically divided into four units: MB, MC, MD, and ME, in which the ME layer is close to the edge and bottom water. The M reservoir has medium-low porosity (4~24%) and low permeability (0.01~100 mD) and has high horizontal and vertical heterogeneity. The content of calcite in reservoir minerals is more than 96%, mixed with a small amount of clay minerals. The casting thin sections and SEM show that the pores are mainly moldic pores and intergranular pores, mixed with dissolution pores and a small number of micro-fractures. For such carbonate reservoirs, connectivity can be improved by communicating reservoir pores, thereby improving reservoir porosity and permeability characteristics to increase oil well production. The geometric shape, radius, distribution, and connectivity of pore throats in carbonate reservoirs are key factors affecting the reservoir space and seepage characteristics of reservoir rocks [14]. On the one hand, the acidification process can reduce the damage of solid particles, cement, etc., to the porous media of the reservoir. The main reservoir cements in the M reservoir are clay minerals, such as illite and kaolinite, as well as carbonate minerals and broken quartz. The acid can react with these rocks and minerals to dissolve and dredge the pores and throats of the reservoir, which can effectively improve the effect of reservoir stimulation. On the other hand, for porous heterogeneous carbonate rocks, when acidizing is carried out, due to the different sizes and shapes of reservoir rock pores, the acid injected into porous carbonate formations tends to flow in the pore-throat network and preferentially enters larger pores. The acid fluid reacts with the minerals in the pore throat wall and dissolves the minerals so that the pore throat is expanded and the acid fluid flows through the pore more easily. When the growth rate of large holes is much larger than that of small holes and gaps, a considerable amount of acid will flow into these large holes. Due to the flow-dissolution–flow cycle, wormholes will soon form along the acid path to form high-conductivity channels.
The research on the reaction between acid and carbonate rock can be traced back to 1895 when Standard Petroleum Company used hydrochloric acid to treat an oil well in the Lima area, Ohio [15]. The study of early rock acid etching focuses on the change law and influencing factors of the macro-reaction rate with the reaction environment. At present, scholars mostly use theoretical analysis, laboratory experiments, and numerical simulation. A lot of research has been carried out on acid-rock reactions. The main research contents include acid etching mechanism analysis, acid system development and performance evaluation, acid-rock reaction kinetic parameter determination, acid etching wormhole growth law exploration, acidification/acid fracturing model establishment, and acid etching morphology feature description [16,17]. At present, experimental methods, such as a rotating disk and flat plate flow, are still in use, but the research focus is gradually inclined to acid system development and process optimization. In order to better apply to actual production, it is necessary to improve the on-site construction system in combination with the reservoir’s physical properties.
In the process of acidizing stimulation of the carbonate reservoir, a reaction between the acid and reservoir that is too fast will lead to an uneven distribution of acid and a large amount of acid being consumed in the near-wellbore area, unable to communicate with the deep reservoir, and even lead to the collapse of the reservoir near the well. In this study, the acid used in the acidification of porous carbonate reservoirs is viscous acid. The viscous acid system uses a gelling agent to increase the viscosity of acidizing fluid, which can reduce the loss of acidizing fluid in the process of reservoir stimulation, reduce the mass transfer rate of H+, and then reduce the acid-rock reaction rate [18], extend the acid etching distance, and achieve a wider range of acidification.
The gelling agent of the viscous acid system usually uses an iron-based crosslinking agent. Yeager and Shuchart [19] discussed an in situ gelling acid based on an iron crosslinking agent, which forms a gel at a pH of about 2. However, iron may precipitate in the formation and cause damage. The presence of ferric iron can enhance sludge formation with heavy oil and also increase the corrosion rate. AlOtaibi [20] developed a non-iron-based crosslinking agent suitable for in situ high-strength gelled acid systems of 5~20 wt % HCl acidizing fluid. Through core displacement experiments and corrosion tests, it is shown that the gelled acid system is stable at a temperature of 275 °C, can form wormholes, and will not cause significant damage to the formation. Kalgaonkar [21] developed a gelling acid system based on new nanoparticles, which can work with up to 28% HCl at 300 °C, and the gelation phenomenon of the system is controlled by pH. Studies have shown that optimizing the acid system suitable for reservoir characteristics is an important prerequisite for successful acidification. Based on the above analysis, the adaptability evaluation experiment under reservoir conditions was carried out for the preferred viscous acid formula, and the process parameters of viscous acid in the acidizing stimulation of porous carbonate rocks were simulated and optimized. The combination of experiment and simulation provides an optimized reference for the reservoir stimulation of heterogeneous porous reservoirs.

2. Experimental Scheme for Adaptability Evaluation of Viscous Acid in the Target Reservoir

The relationship between porosity and permeability of the M reservoir shows that in the area where micro-fractures exist, the reservoir matrix is relatively dense, while the connectivity between the pore development areas is poor, resulting in low reservoir permeability, as shown in Figure 1a. According to the different permeability distribution ratios of the four layers in Figure 1b, the permeability distribution of the MD and ME layers is relatively homogeneous, and the porosity deviation ratio of the MB and MC layers is higher, but the overall permeability is generally poor.
The main mineral components of carbonate rocks are CaCO3 and Ca(Mg)CO3, which are easily reacted with hydrochloric acid [22]. Therefore, when using acidification technology, hydrochloric acid is often used as the acid system of the main acid [23,24]. Hydrochloric acid can be completely ionized into hydrogen ions (H+) and chloride ions (Cl) in an aqueous solution, and it is very suitable for the acidification of carbonate rocks due to its low cost and strong corrosion ability with regard to the formation [25]. Combined with the acidizing well data and reservoir characteristics of the M reservoir, the formula of the viscous acid system was selected as 20 wt% HCl + 0.6% ADJ-1 gelling agent + 1.0~1.5% ADH-1 corrosion inhibitor + 1.5% ADT-1 multi-function additive. Through a series of acid performance test experiments, the adaptability of the acid formula in the acidification process of each layer of the M porous carbonate reservoir is evaluated. The gelling agent used in this paper is a copolymer of acrylamide and dimethylami-noethyl methacrylate. This crosslinked acrylamide polymer has good shear stability and clay stability as a gelling agent. The relative molecular mass of the polymer is (1~6) × 106. Methylenebisacrylamide (concentration of less than 250 mg/L) was used as a crosslinking agent to thicken the hydrochloric acid, which can be compatible with various additives.
The acid performance test includes a basic performance test and an important index performance test. The basic performance experiments mainly include particle dissolution and acid corrosion steel sheet tests. Important indicators of the performance experiments include acid-rock reaction kinetics, acid flow, residual acid damage tests, and acid rheology experiments. The reservoir temperature is 203 °F, and the pressure is 3100 psi.

2.1. Particle Dissolution Experiment

The experimental steps were as follows: the rock sample was crushed, put into the drying box, dried at 221 °C until the weight was unchanged, and then weighed and recorded. The 1 g rock sample was placed in 20 mL acidizing fluid in a 203 °F water bath for 2 h. It was filtered with constant weight filter paper, dried to constant weight, weighed, and recorded; then, the dissolution rate was calculated.

2.2. Steel Sheet Corrosion Experiment

The corrosion inhibition effect of the corrosion inhibitor added in the acidizing fluid formula was studied, and the corrosion inhibition rate of the material was characterized by the corrosion rate of the steel sheet.
The experimental procedure was as follows: the amount of acidizing fluid per square centimeter of the surface area of the hanging piece was 20 cm3, and the prepared quantitative acidizing fluid was poured into a high-pressure reactor to maintain a pressure of 12 MPa. The temperature was increased to 90 °C at 3 °C/min~4 °C/min, the reaction was carried out for 4 h under normal pressure, and the corrosion was observed. The hanging piece was cleaned and weighed. The corrosion rate calculation equation is as follows:
v 1 = 10 6 m i A i × t ,
In the equation, v 1 is the single sheet corrosion rate, g/(m2·h); t is the reaction time, h; m i is the hanging piece corrosion loss, g; and A i is the hanging piece surface area, mm2.

2.3. Acid-Rock Reaction Kinetics Experiment

Acid-rock reaction kinetics describes the speed of chemical reaction after contact with various reaction substances. Acid-rock reaction kinetics can quantitatively describe the acid-rock reaction speed at different times and different acid concentrations in the acid-rock reaction process, determine the penetration distance of the acid, and then use it for acidification design optimization and acid system optimization. The experimental steps of acid-rock reaction kinetics include (1) rock plate preparation; (2) equipment heating; (3) acid-rock reaction experiment; and (4) the titration of residual acid concentration.
The calculation of the dynamic reaction rate of the acid rock is as follows:
J = 10 3 C 0 C 1 t 1 t 2 V S ,
where, J is the acid-rock dynamic reaction rate, mol/(cm2 × s); V is the volume of acid involved in the reaction, mL; t 1 is the acid-rock reaction start time, s; t 2 is the acid-rock reaction end time, s; and S is the acid-rock reaction contact area, cm2.

2.4. Acid Flow and Wormhole Formation Experiment

The acid flow experiment mainly adopts the method of core displacement. At a constant acid injection rate, the acid breakthrough PV and the core permeability before and after acid injection are counted. The CT scanner is used to analyze the wormhole morphology formed inside the core before and after the acid flow. Under the effect of dynamic acid injection, the effect of acid on reservoir stimulation is simulated.

2.5. Residual Acid Damage Experiment

In order to avoid secondary pollution to the formation caused by acidification measures, this paper carried out a test on the damage rate of residual acid to reservoir permeability after the acid-rock reaction. The injection sequence of fluid is formation water + residual acid + formation water. The degree of damage of residual acid to formation was analyzed by comparing the decrease in core permeability measured by formation water before and after residual acid injection.

3. Viscous Acid Performance Test Results and Analysis

3.1. Basic Performance of Acid Liquid Test Results and Analysis

According to the test results, after 2 h of reaction, the dissolution rate of viscous acid and rock powder in four layers is more than 95%. The dissolution rate of viscous acid in the carbonate reservoir in the target block is high, and the residue content is low. There is no problem that the target block cannot be dissolved by using this vicous acid formula for acidification stimulation. The selected acid formula is suitable for the stimulation of the M carbonate reservoir. The results of the corrosion test of the steel sheet show that the corrosion rate of the viscous acid on the casing of T-95 and C-110 is between 1.2286 and 1.4146 g/(m2·h), which is much lower than 5.00 g/(m2·h). The corrosion resistance of the viscous acid corrosion inhibitor is remarkable, which ensures construction safety.

3.2. Important Indicators of the Performance Test Results and Analysis

3.2.1. Acid-Rock Reaction Kinetics Experimental Results

Acid-rock reaction kinetics is a description of the chemical reaction rate after the contact of various reaction substances. Acid-rock reaction kinetics can quantitatively describe the acid-rock reaction rate at different times and different acid concentrations in the acid-rock reaction process to determine the acid dissolution time and penetration distance. Accurately provide kinetic parameters, such as the reaction rate constant, reaction order, reaction activation energy, and the H+ effective mass transfer coefficient, and then use them for acidification design optimization and acid system optimization. The test results show that the acid-rock reaction rates of the MB, MC, MD, and ME reservoirs are 1.7434 × 10⁻⁵ mol/cm2·s, 3.6652 × 10⁻⁵ mol/cm2·s, 2.8245 × 10⁻⁵ mol/cm2·s, and 2.9781 × 10⁻⁵ mol/cm2·s, respectively, as shown in the following Figure 2.
The linear regression of the acid-rock reaction rate and acid concentration is carried out, and the results are shown in Table 1. The reaction rate constant K is a kinetic parameter that reflects the speed of the reaction rate and the difficulty of the reaction. With the increase in formation depth (temperature), the reaction rate constant increases continuously, and the corresponding reaction rate also accelerates. However, due to the small difference in temperature of each layer, the rate increase is not obvious. The reaction order m reflects the influence of reactant concentration on the reaction rate. With the increase in formation depth, the influence of temperature on the difficulty of the acid-rock reaction gradually increases, while the influence of concentration on the difficulty of the acid-rock reaction gradually decreases. The activation energy of the reaction refers to the difference between the average energy of the activated molecule and the average energy of the reactant molecule. Its size can reflect the speed of the reaction and the difficulty of the reaction. The experimental results show that the reaction activation energy Ea of 20% hydrochloric acid and a natural core is 4350.7 J/mol.

3.2.2. Acid-Rock Reaction Heterogeneous Acid Etching Degree Analysis

The end faces of the core samples of the four layers after the reaction with the viscous acid were scanned, and the degree of heterogeneous acid etching of the acid-rock reaction was statistically analyzed to determine the effect of the acidizing fluid on different layers. Figure 3 is the CT scanning topography after the acid-rock reaction. The results show that the acid etching of the core end face of the MB layer is more homogeneous, followed by the MD layer, and the degree of heterogeneous acid etching of the MC and ME layers is stronger. Combined with the dissolution rate, porosity, and permeability density, it can be seen that the dissolution rate of the MB layer is the smallest, the core is relatively dense, and the dissolution process belongs to a relatively homogeneous end-face dissolution process. The dissolution rate of the MC and ME layers is faster and belongs to medium porosity and low permeability, and the dissolution end face is uneven. Through comprehensive analysis, it can be seen that the degree of difficulty and effect of acidification in the four layers are as follows: MB > MD > MC ≈ ME, but the overall performance shows a certain degree of heterogeneous acid etching.
At the same time, the 3D scanning experimental device was used to scan the end face of the core after the reaction, and the degree of heterogeneous acid etching of the reservoir core by the viscous acid was quantitatively analyzed. The results are shown in Figure 4. It can be found that the core corrosion depth of the MB layer is concentrated between 1.83 mm and 3.74 mm, which accounts for 68.56%. The core corrosion depth distribution of the MC layer has a large span, with a maximum of 17.88 mm, and the relatively concentrated area is between 1.94 mm and 3.96 mm, accounting for 51.90% of the depth range. The core corrosion depth of the MD layer is concentrated between 1.82 mm and 3.73 mm, accounting for 68.15%. In the core of the ME layer, the corrosion depth distribution span is large, and the maximum can reach 17.88 mm. The relatively concentrated area is between 2.6 mm and 6.67 mm, and the depth range accounts for 72.84%. The experimental results of CT scanning were further verified.

3.2.3. Acid Flow Experimental Results

In the process of acidizing construction, the acid liquid is injected into the formation through the wellbore under the condition that the fracture pressure of the reservoir is lower so that it reacts with the rock in the formation so as to improve the porosity and permeability of the formation and achieve the effect of removing pollution. Under appropriate injection conditions, the formation will form some narrow dominant channels with high conductivity, called wormholes. The wormhole can pass through the pollution zone around the wellbore and become a high-permeability channel connecting the wellbore and the formation, thus greatly reducing the resistance of the oil and gas flow to the wellbore. The formation of the acid wormhole is the most ideal result of the acidification process, which can improve the conductivity of the reservoir with the least amount of acid consumption. As shown in Table 2 and Figure 5, by comparing the number of acid breakthrough PV and liquid permeability before and after acid etching in the four layers of MB, MC, MD, and ME, it can be seen that MB with a low initial permeability cannot form effective acid wormholes. The cores of the MC, MD, and ME layers can form wormholes by acidification, and the larger the initial permeability, the larger the wormholes and the higher the permeability after acidification (such as the core of the MC layer, from 0.233 mD to 97.02 mD). According to the initial permeability, the size of the wormholes formed in the four layers is MC > ME > MD >> MB, as shown in Figure 6.

3.2.4. Residual Acid damage Experimental Results

The experimental results are shown in Table 3, and the damage rate of residual acid to the core of MB, MC, MD, and ME is low (<5%). They show that the cores of MB, MC, MD, and ME almost do not cause damage after being invaded by residual acid. They show that the acidizing fluid has a strong ability to dissolve the reservoir rock, and the products after the acidification reaction can be basically dissolved in the residual acid, which will not have a negative impact on formation.

3.2.5. Acid Temperature Resistance and Shear Resistance Experimental Results

In order to further determine the shear resistance of the viscous acid in the reservoir environment, the temperature resistance and shear resistance of the viscous acid system at a shear rate of 170 S−1 were tested. The results are shown in Figure 7. The results in Figure 7a show that the viscosity of the acidizing fluid is stable at 35.45 mPa·s when the experimental temperature is increased from room temperature to 120 °C. The results in Figure 7b show that when the temperature is constant at 90 °C, the viscosity of the acid is stable at 39.35 mPa·s, which is greater than the lower limit of 18 mPa·s required by the construction. It shows that the acidizing fluid has good apparent viscosity, temperature resistance, and shear resistance, which meets the requirements of acidification construction.

4. Acidification Construction Target Layer Selection

It can be seen in the third part that in the acid flow experiment, the MB layer core cannot form an effective acid wormhole, and the reaction rate of the MB layer core with the acid is much smaller than that of the three layers of MC, MD, and ME (about less than 1 time), and the heterogeneous acid etching degree of the MB layer acid-rock reaction end face is much lower than that of other layers, indicating that the porosity and permeability density of the MB reservoir lead to a lower acid-rock reaction rate, and the MB layer cannot achieve a better stimulation effect through acidification. Furthermore, the porosity and permeability of the four layers of the X-24 well, which will be acidized, are analyzed, and the results are shown in Table 4.
According to Table 4, the porosity of the MD and ME layers is better, but the permeability is generally poor. It is speculated that poor pore–throat connectivity leads to low permeability, which has the potential for acidification and stimulation. In addition, the ME layer is close to the edge and bottom water. Fracturing is easy to communicate with the edge and bottom water, resulting in water flooding the oil wells. Therefore, the ME layer only recommends acidification measures to increase production. The porosity deviation ratio of the MB and MC layers is too high, and there is a risk of difficult acid fluid injection or poor acidizing effect. Other measures, such as acid fracturing or hydraulic fracturing, can be tried. Combined with the results of the acidification experiments, the MD layer and the ME layer were selected for acidification.

5. Acidizing Construction Parameter Optimization Simulation and Application Effect Analysis

The factors affecting the expansion law of acid wormholes are reservoir parameters and construction parameters [26]. This acidification simulation mainly considers the influence of construction parameters on the expansion of acid wormholes in porous carbonate reservoirs. The acid pump rate and acidizing fluid volume were optimized reasonably.
The expansion of wormholes in the near-wellbore area is shown in Figure 8. The simulation inlet adopts a constant flow boundary to establish a two-scale acid wormhole growth radial model. The two-scale continuous model consists of the Darcy-scale model and the pore-scale model. The Darcy-scale model describes the flow, transport, and reaction consumption of solute in porous media, as well as the change in porosity with the etching reaction. The pore-scale model calculates the parameters used in the Darcy-scale model through empirical formulas, such as the mass transfer coefficient, permeability, pore radius, and pore-specific surface area with the dissolution process. The two-scale model has good result accuracy and solution stability at different time steps [27,28,29]. It is the most commonly used mathematical model to study the formation of wormholes in reactive flow. The different etching forms calculated according to it are basically consistent with the experimental results. However, the two-scale continuous model also has some limitations. For example, when using radial grids, the injected acid can only flow along the radius direction or the circumferential direction, so the wormhole can only expand along these two directions, reducing the randomness of wormhole growth. However, in the simulation of this study, the accuracy can basically meet the requirements. The field construction experience shows that the contact surface area between the acid and rock is large, the acidification time is very short, and the acidification radius is basically maintained at about 1 m. The parameters of the model are taken from the experimental results and the reservoir field data. The mesh is locally refined near the wellbore to ensure the convergence of the calculation process. In the process of optimizing the acid pump rate, the acid corrosion near the wellbore will change with the change in the acid pump rate. With the increase in simulation time, when the acid etching effect does not change significantly with time after a certain time, it is considered that the acid dissolution form at this time is the final effect of acid wormhole expansion under the condition of the acid pump rate.

5.1. Acid Pump Rate Optimization

The simulation results of the MD and ME layer acid pump rate optimization are shown in Figure 9. The reservoir permeability change is used to characterize the acid injection effect. When the acid pump rate is small, the diffusion in the pores plays a leading role, and the injected acid can almost react with the rock, resulting in a slow rate of acid dissolution and an increase in the amount of acid consumed. The acid mainly reacts with the rock at the injection end, showing a surface dissolution form. Only the permeability of the reservoir near the wellbore is improved and cannot penetrate the reservoir. When the acid pump rate is fast, the convection in the pores plays a leading role, and most of the acid liquid enters the deep reservoir before fully reacting with the rock; the acid wormhole cannot be formed, and the permeability improvement effect is not obvious. When the speed is moderate, the acid wormhole can be effectively formed to communicate with the deep reservoir, and the reservoir’s permeability can be improved to the maximum extent. It is recommended that the acid pump rate of the MD layer is 1.4 bpm and the acid pump rate of the ME layer is 1.0 bpm. Under this speed condition, the acid can fully react with the rock and form acid wormholes.

5.2. Acidizing Fluid Volume Optimization

The simulation results of acidizing fluid volume optimization for the acidification of the MD and ME layers are shown in Figure 10, and the change in reservoir permeability is also used to characterize the effect of acid injection. The acid solution enters the formation at a constant pump rate for acid etching, which is a commonly used acid injection method in on-site construction. Under the condition of the selected optimal pump rate, the volume of acid used increases with the increase in injection time. When the amount of acid is less, acidification only acts on a small area near the wellbore, and the corrosion morphology is more homogeneous. With the increase in the volume of acid, the radius of acidification increases, the contact time between the acid and rock increases, and the etching depth of the rock increases gradually. Due to the heterogeneity of the reservoir, the acid etching radius is more obvious in a specific direction, and the acid etching wormhole is gradually formed. The volume of acid injection continues to increase, the acid wormhole continues to expand, and the inlet pressure gradually decreases. When the pressure difference between the inlet and outlet cannot meet the established flow rate, the wormhole will stop expanding. It is considered that there is a critical value for the volume of acid used to expand the acid wormhole. The simulation results show that for the MD layer, when the volume of acid reaches 255 bbl, the morphology of the acid wormhole will no longer change significantly, and the reasonable volume of acid should be 255 bbl. For the ME layer, when the acidizing fluid volume reaches 225 bbl, the acidification effect is the best.
The ME layer requires less acidizing fluid volume than the MD layer. The analysis shows that the initial porosity of the ME layer is mostly preferred. The larger the initial average porosity of the formation, the greater the expansion of the acid in the core; the more obvious wormhole morphology can be formed, and the wormhole morphology is more complex. This is because the larger the initial average porosity of the formation, the less rock the wormhole needs to dissolve to break through the core; the acidizing fluid filtration loss and the filtration rate increase, the difficulty of wormhole expansion to the surrounding area is reduced, and it is easier to produce wormholes with complex morphology.

5.3. Acidizing Stimulation Effect Simulation Analysis

In order to compare the effect of acidification, the cumulative oil production of the X-24 well after acidification was simulated and predicted. Using the optimal acid pump rate and acidizing fluid volume obtained by the 5.2 simulation, the X-24 well was stimulated to increase production. There may be some problems in the process of dealing with real reservoirs. For example, the simulation ignores the influence of fractures that may exist in the reservoir. However, according to the data of this area, there are few fractures in the formation, so the influence can be ignored, and the simulation results still have guiding significance. After acidizing the MD and ME layers in the X-24 well, the predicted daily oil production is 1000 bbl/d and 600 bbl/d, respectively. As shown in Figure 11, assuming that the critical economic oil recovery rate is 200 bbl/d, the MD formation will produce 3650 days (1,217,680 bbl). The thickness of the ME reservoir is lower than that of the MD reservoir, and the formation of ME will last for 1095 days (251,100 bbl) at the critical economic oil recovery rate of 150 bbl/d. The simulation results show that viscous acid acidification can significantly increase the production of the X-24 well, which has a gradual decline in daily production, and obtain a better effect of increasing production.

6. Conclusions and Suggestions

In this paper, viscous acid is selected as the acid system for the stimulation and reconstruction of porous heterogeneous carbonate reservoirs with low porosity and permeability, strong heterogeneity, and poor effect of conventional acidification. Based on the systematic evaluation of the adaptability of viscous acid in the four layers of the M reservoir in the target block, combined with the analysis of the reservoir’s physical properties, the MD and ME layers suitable for acidification stimulation are clarified. Finally, based on the geological characteristics and experimental data of the preferred layers, a two-scale acid wormhole growth radial model was established, and the construction parameters of acidification were optimized. Finally, the effect of acidification stimulation was predicted. The main conclusions and recommendations are as follows:
  • The dissolution rate of the four layers is more than 95%. The dissolution rate is high, and the residue content is low. There is no problem that the reservoir cannot be stimulated by acidification. The experimental results of steel sheet corrosion and residual acid damage ensure the safety of acidizing construction, and there is no reservoir damage. The core damage rate of residual acid to the MB, MC, MD, and ME layers is low (<5%). It shows that the cores of MB, MC, MD, and ME almost do not cause damage after being invaded by residual acid.
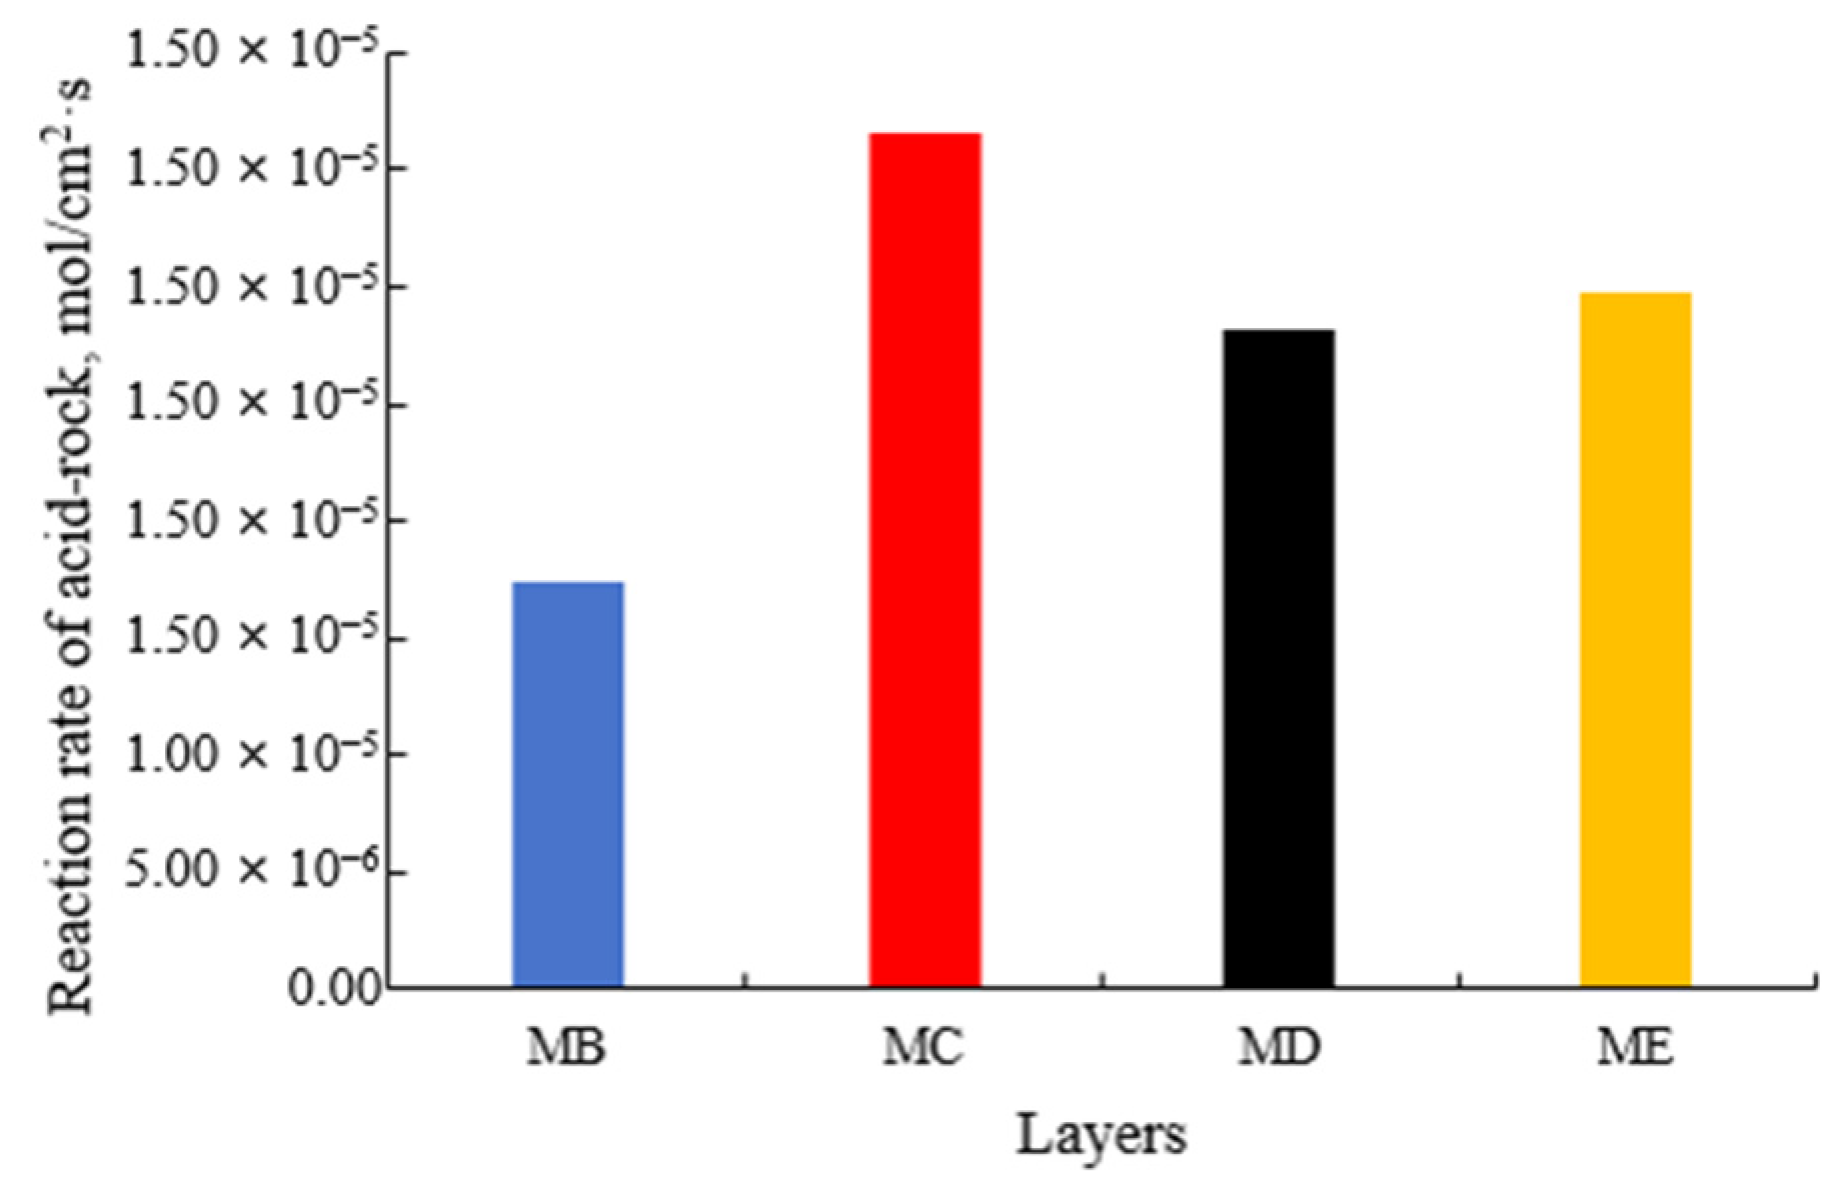
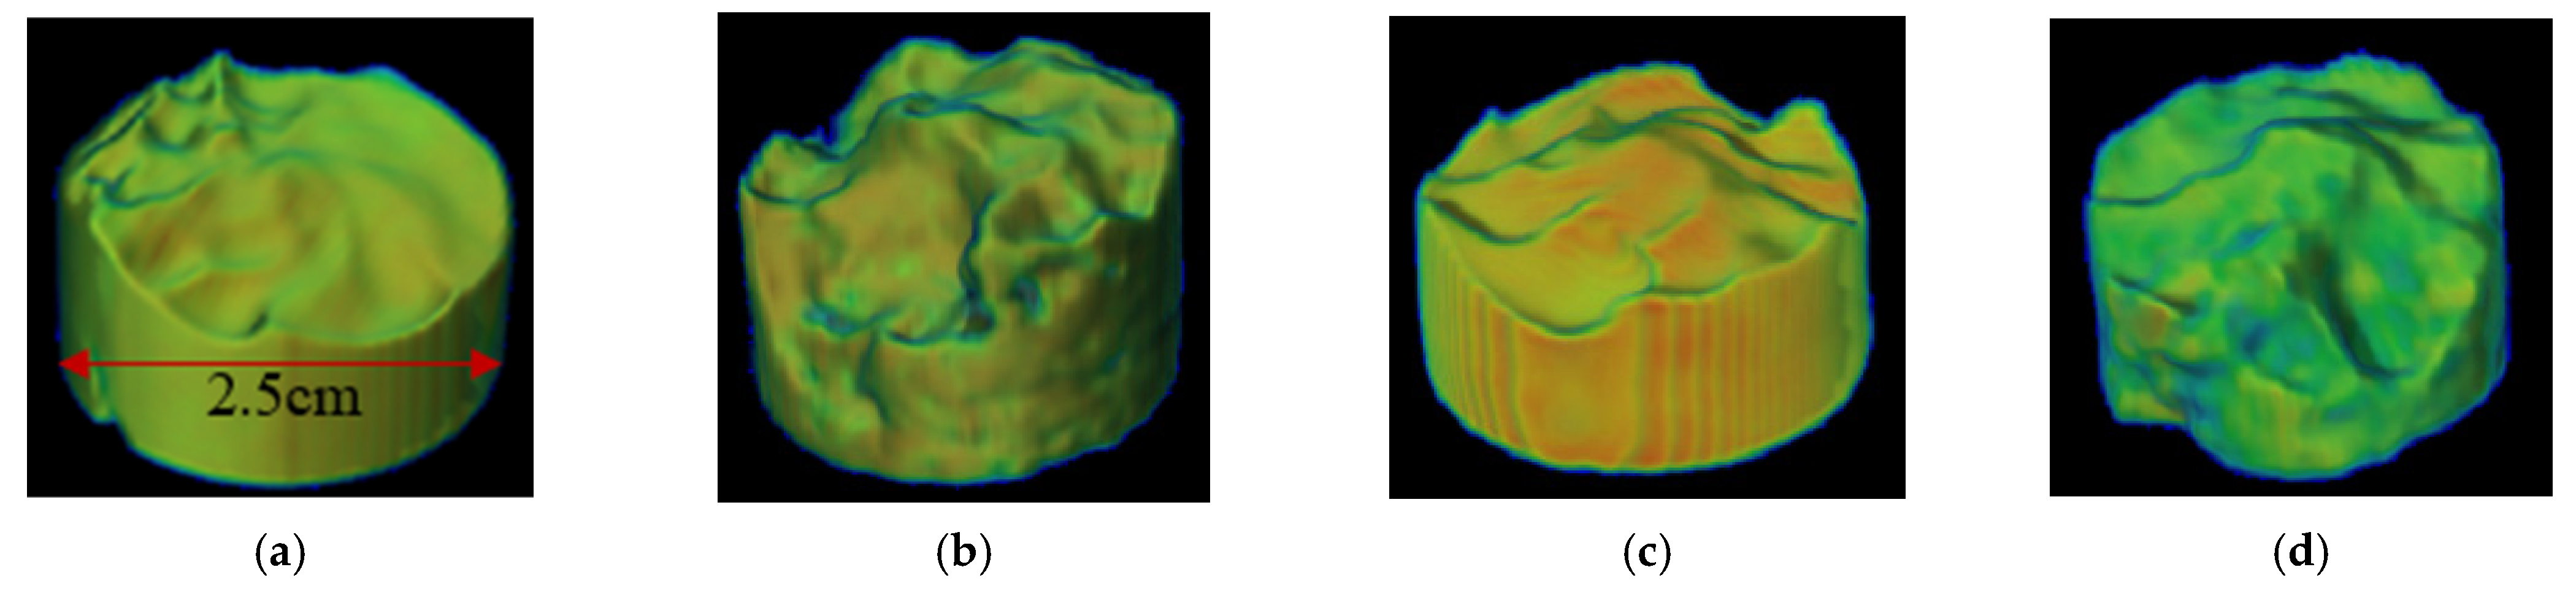
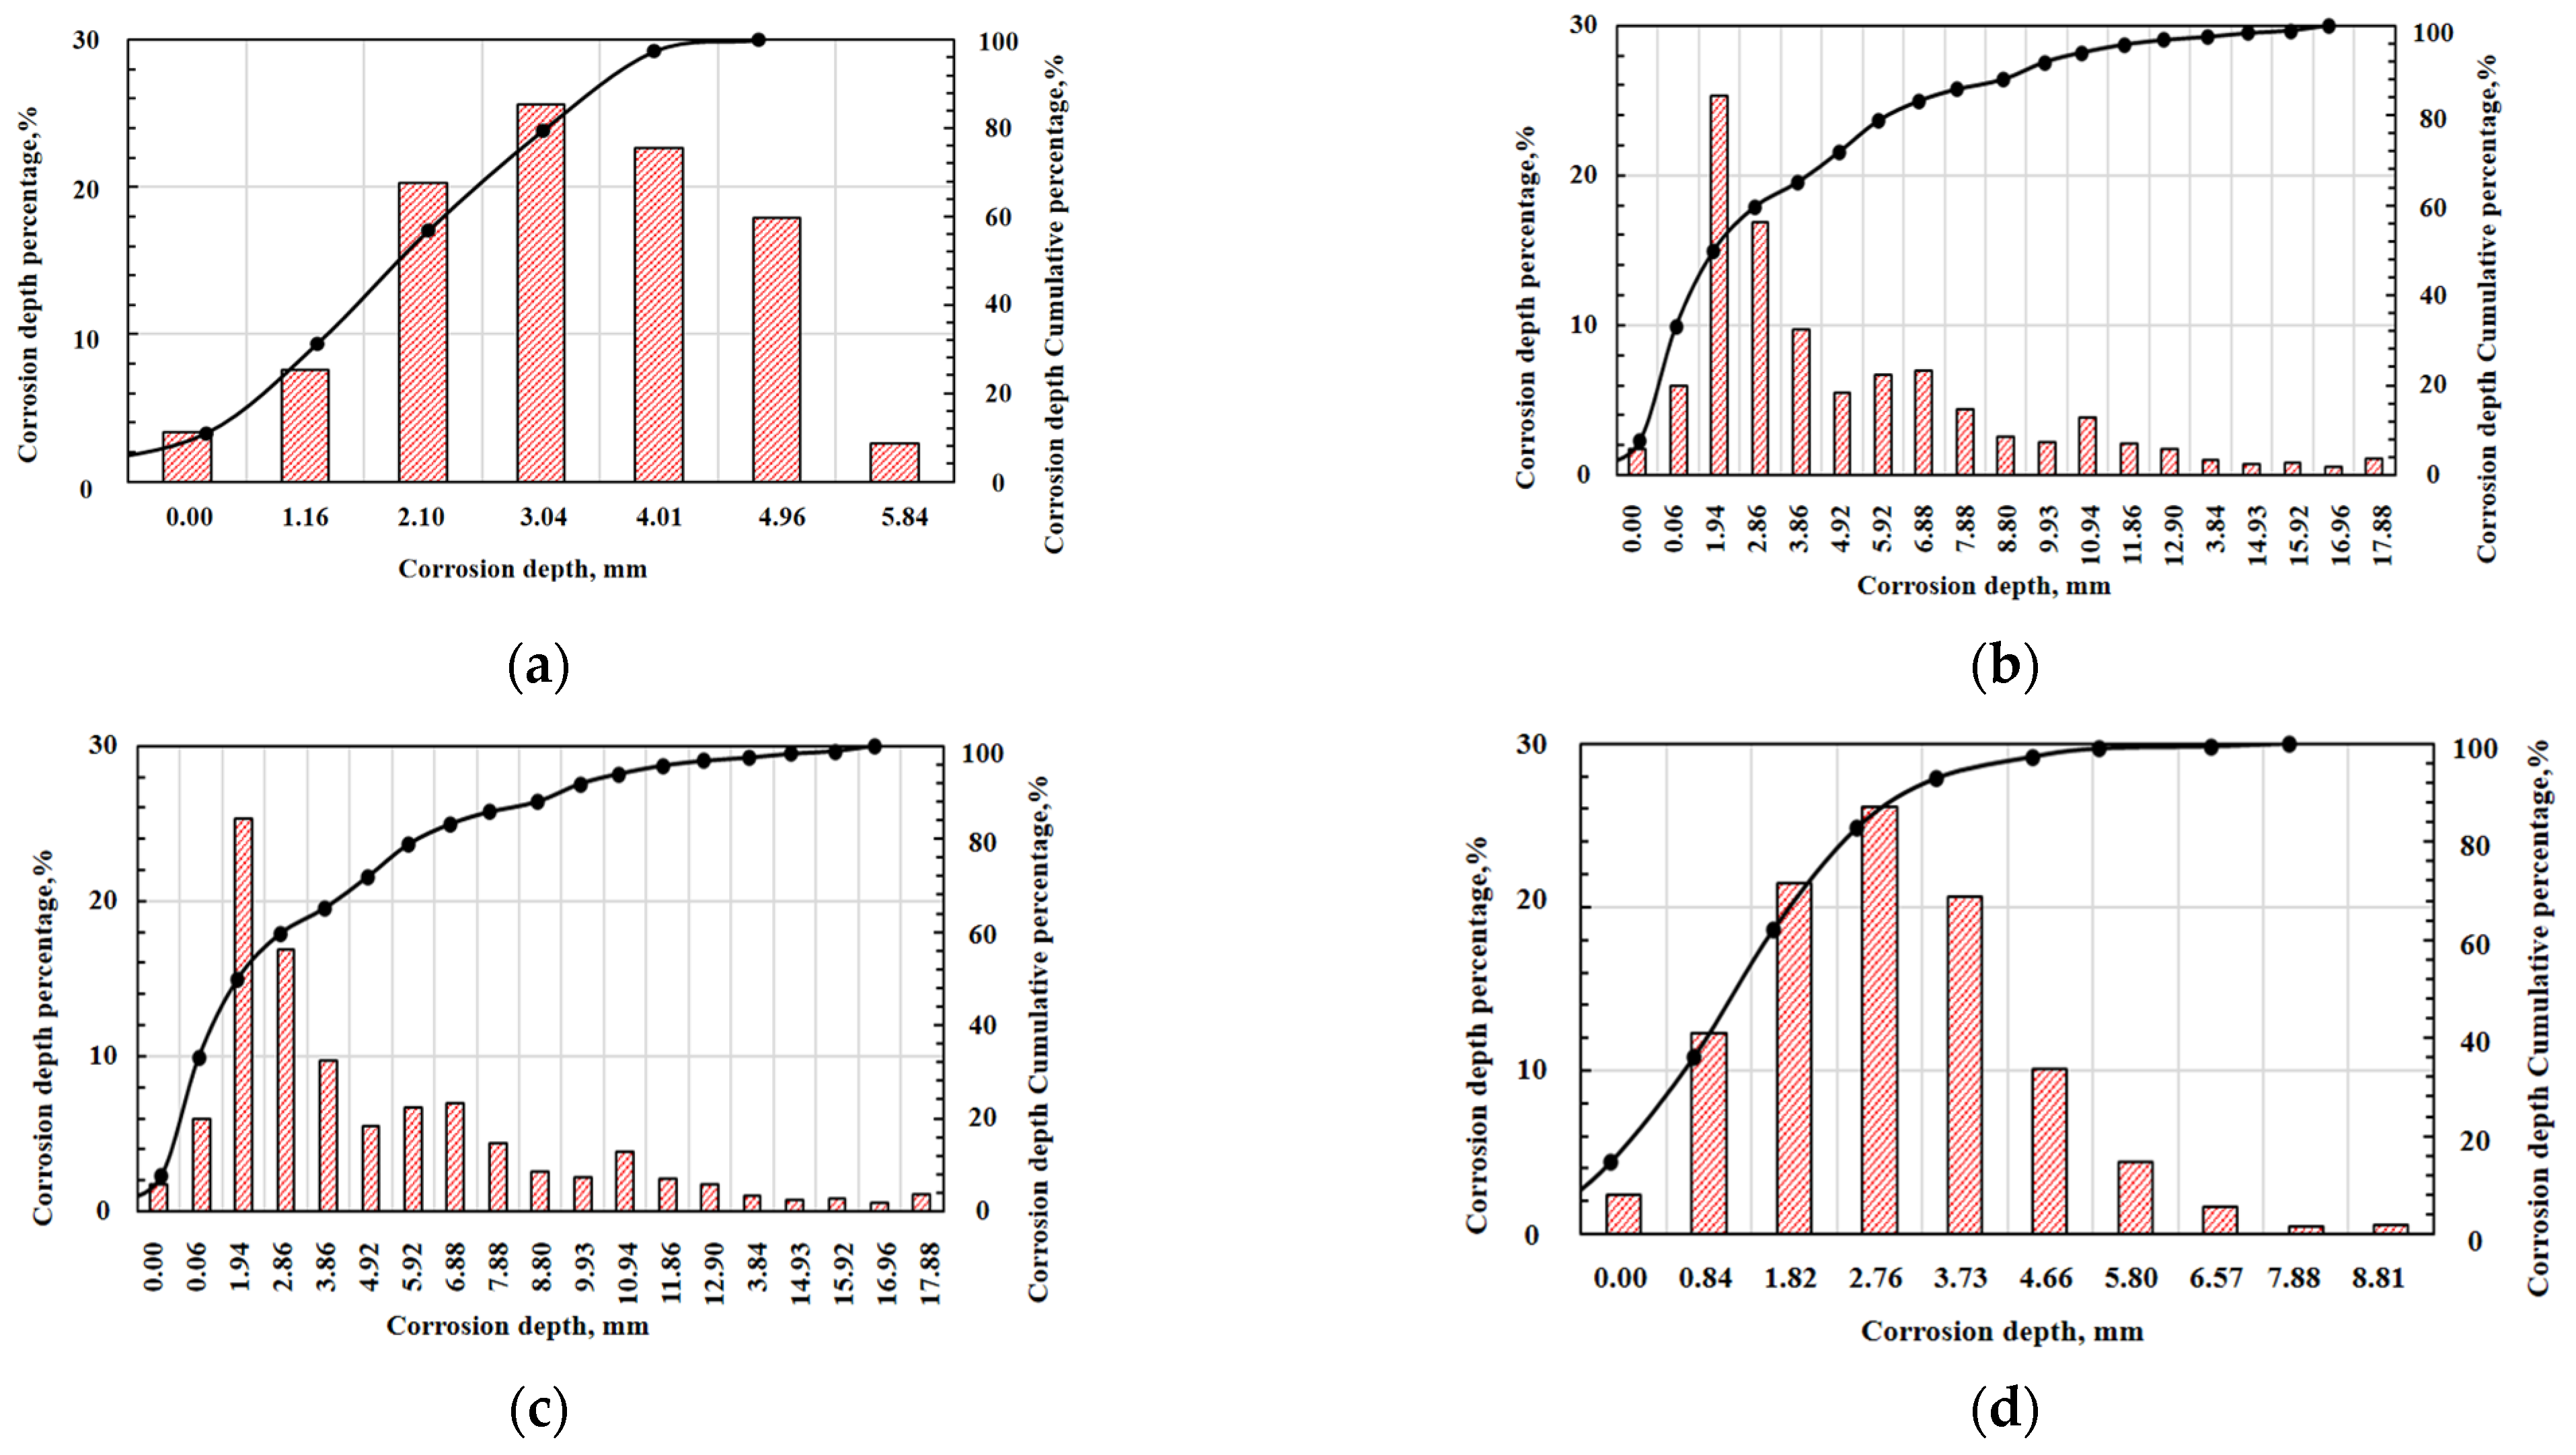
  • The experimental results of acid-rock reaction kinetics show that the reaction rates of the four reservoirs are 1.7434 × 10⁻⁵ mol/cm2·s, 3.6652 × 10⁻⁵ mol/cm2·s, 2.8245 × 10⁻⁵ mol/cm2·s, and 2.9781 × 10⁻⁵ mol/cm2·s, respectively. After acid etching, the corrosion concavity of the end face of each layer is different, and the uniformity degree of the four layers is MB, MD, MC, and ME in order from large to small. The activation energy of the reaction between the acid system and the natural core is about 4350 J/mol.
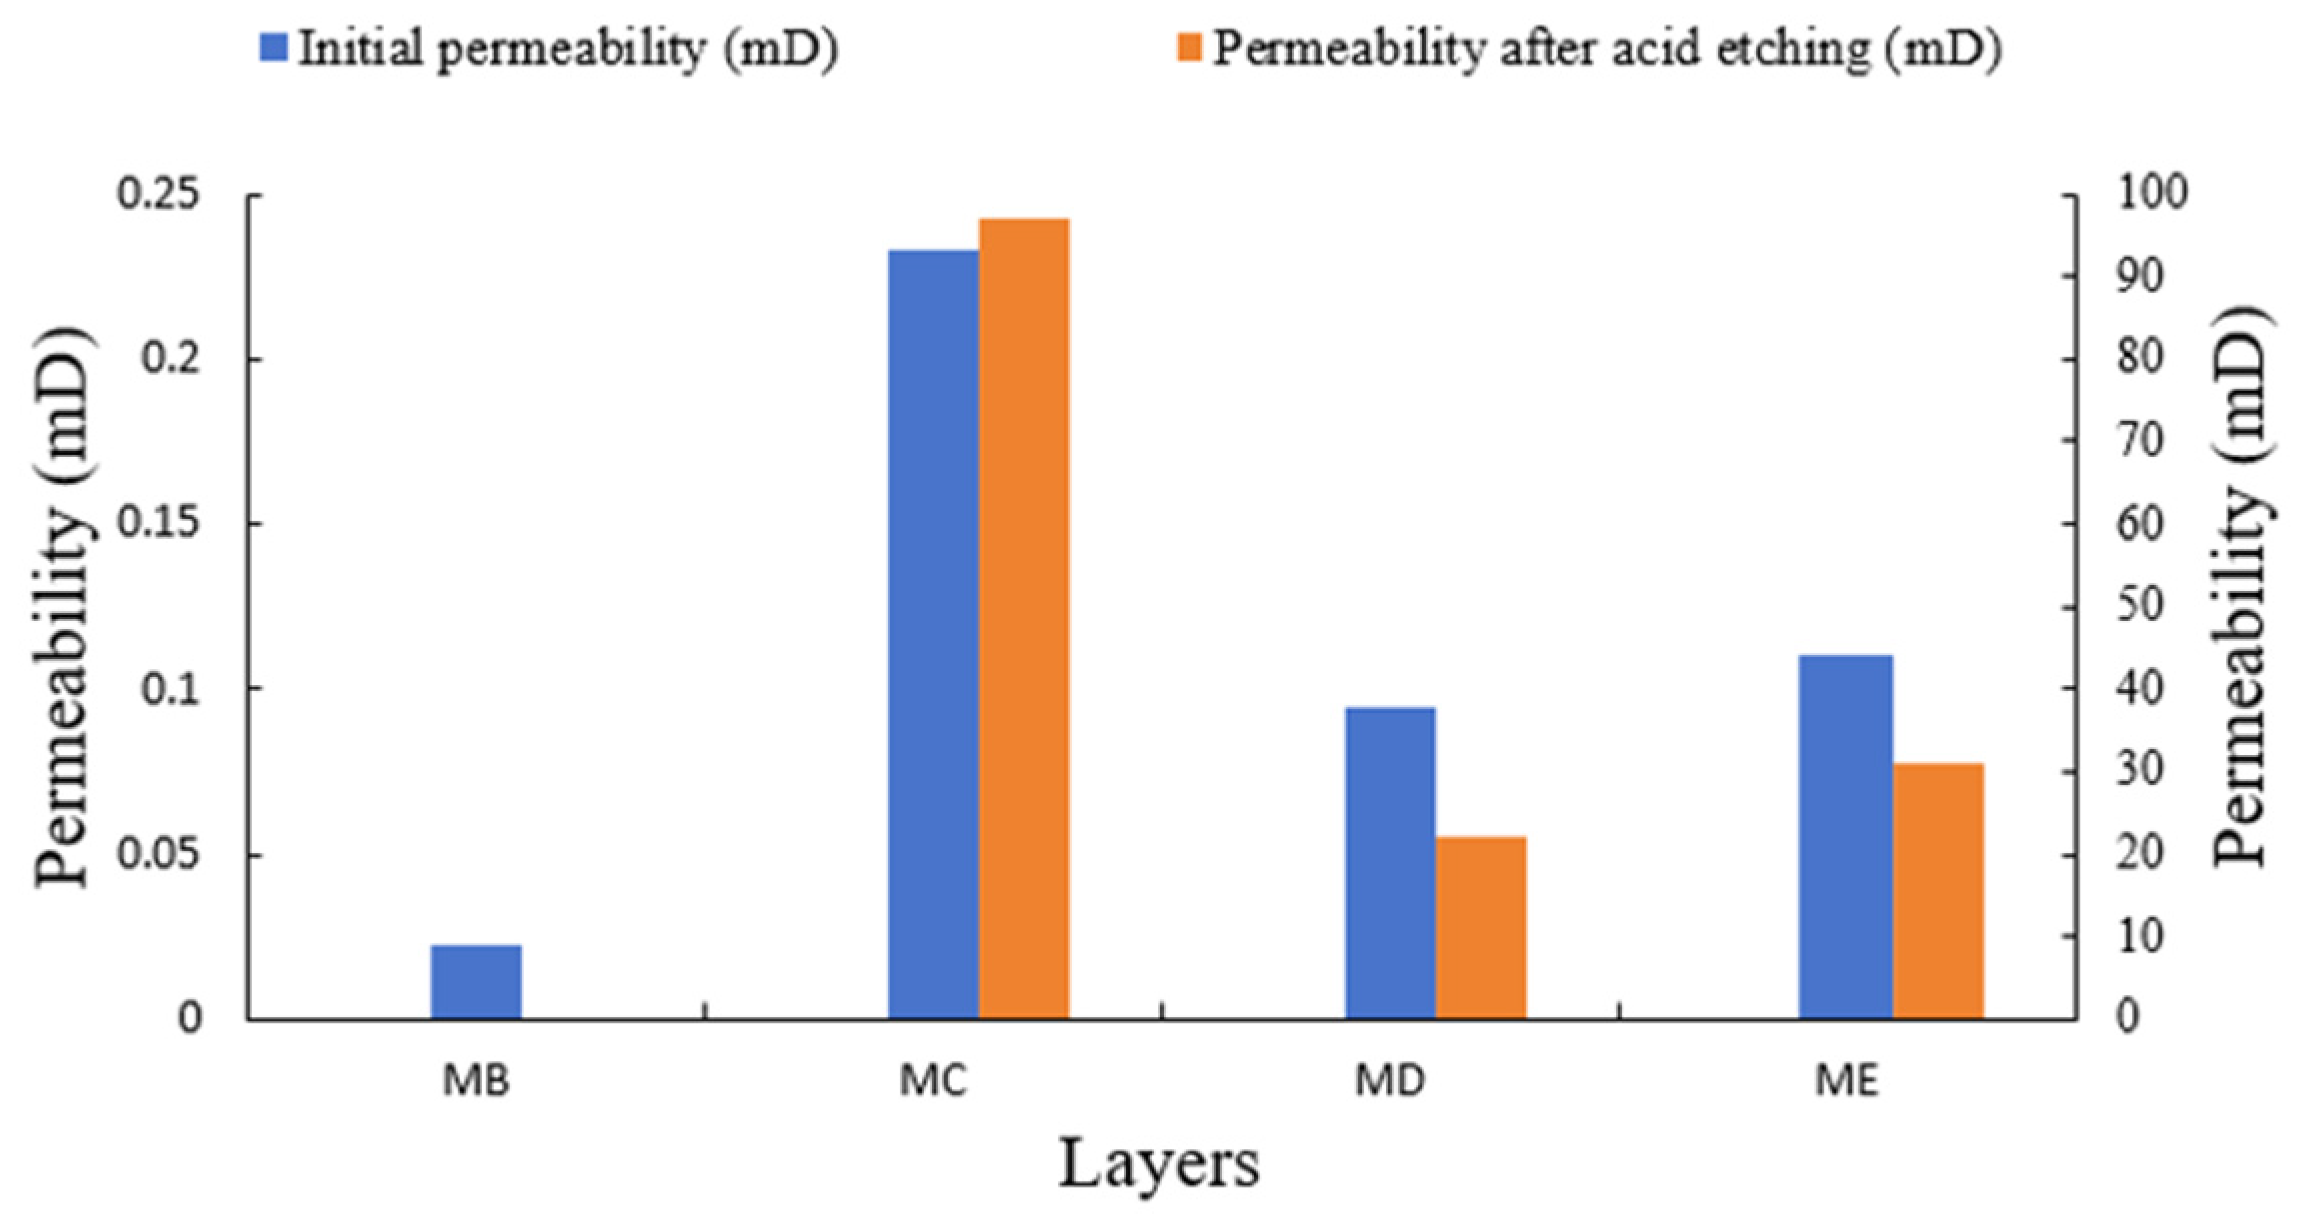
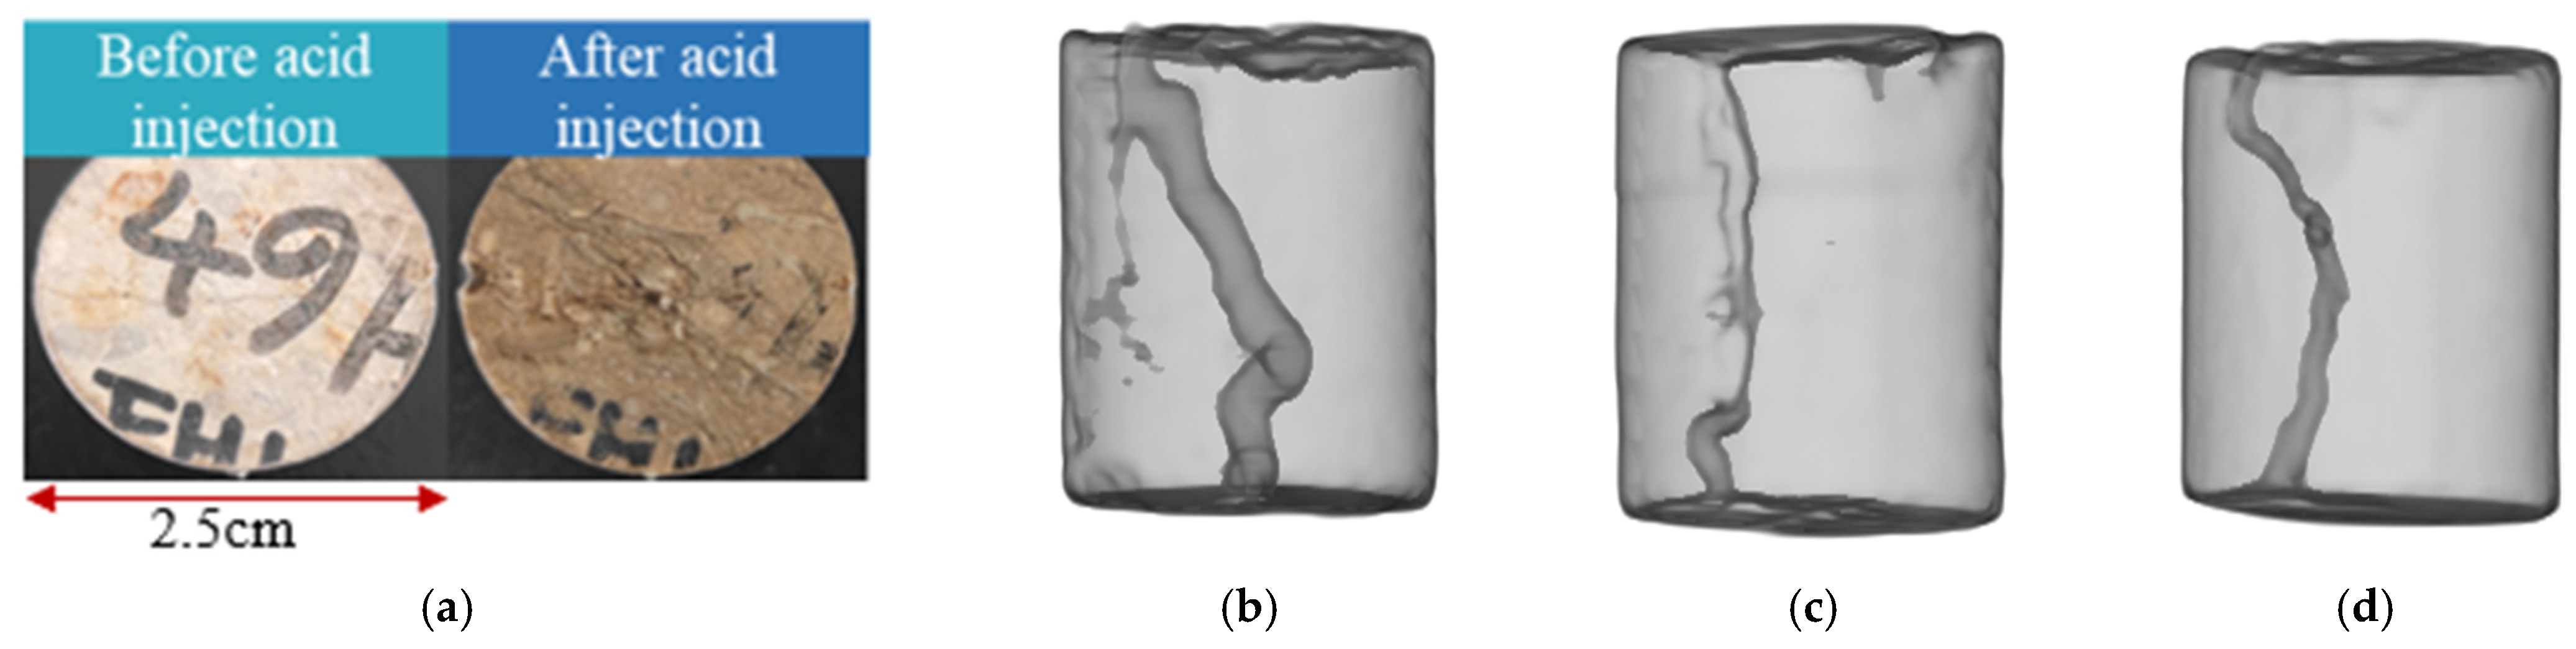
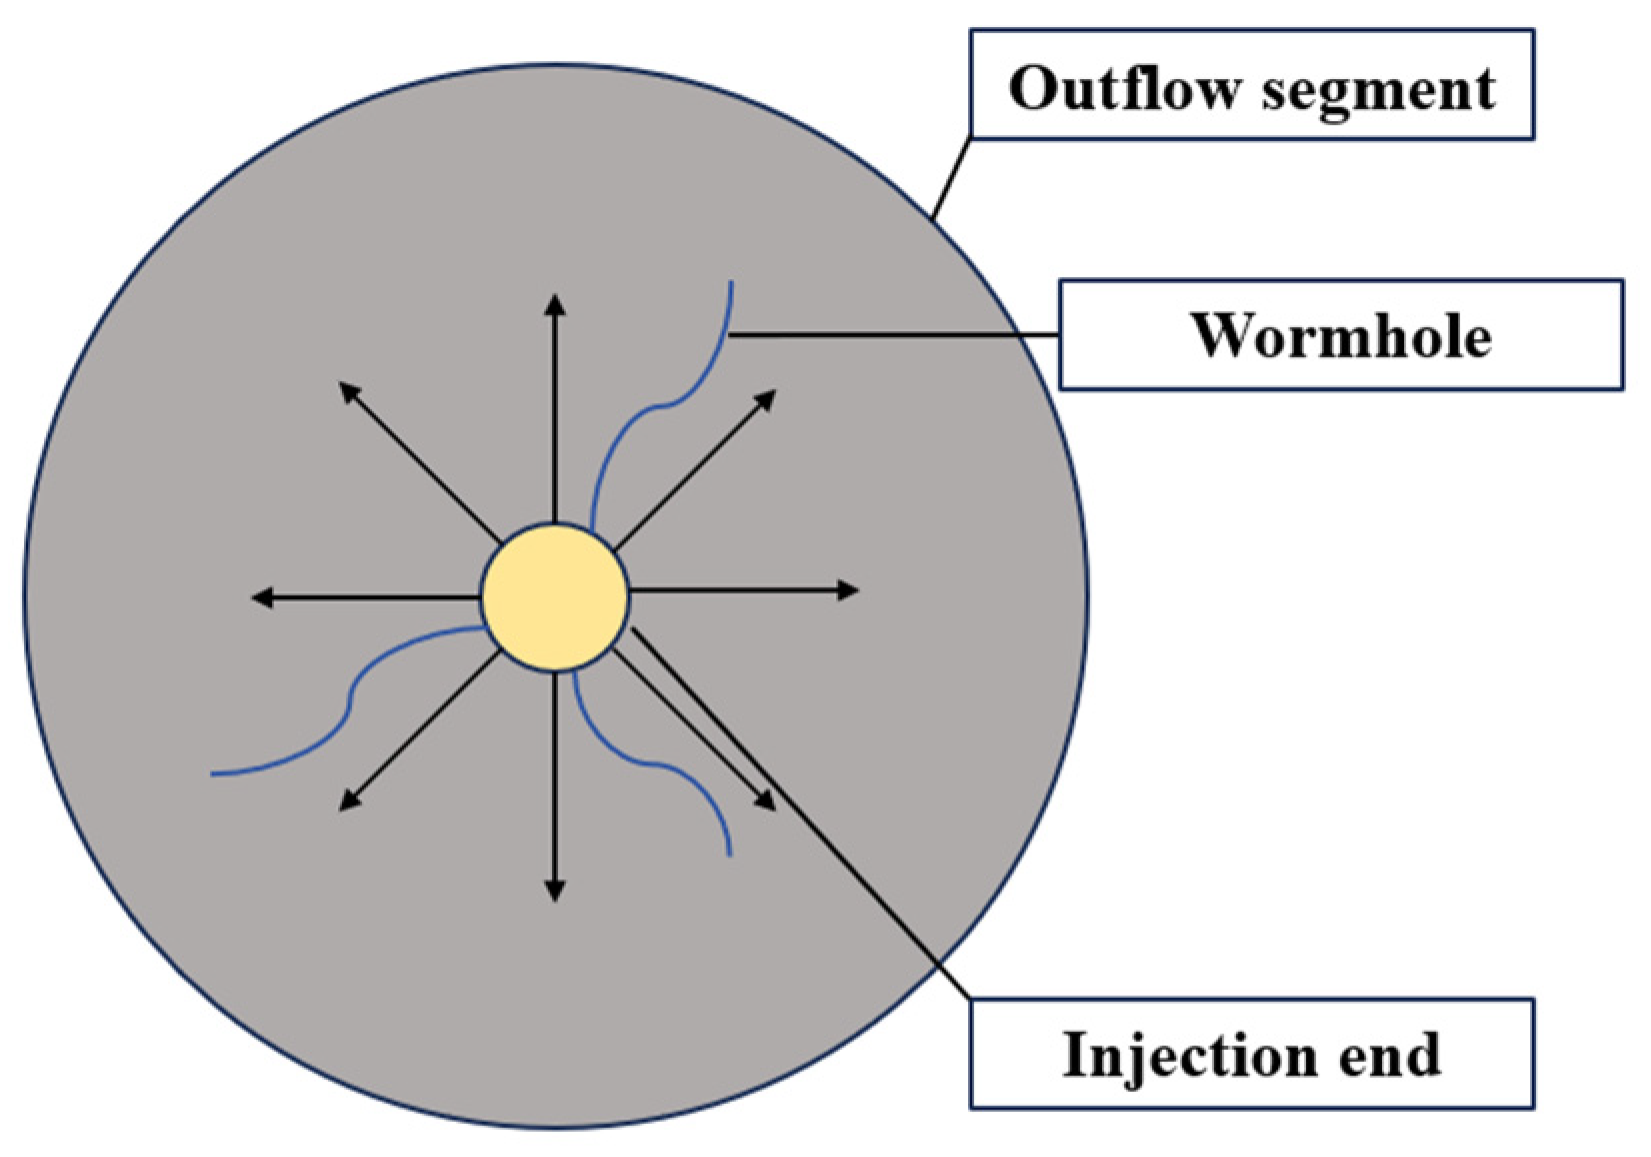
  • The results of the acid flow experiments show that MB with low initial permeability cannot form effective acid wormholes. The cores of the MC, MD, and ME layers can form wormholes by acidification. The larger the initial permeability, the larger the wormholes and the higher the permeability after acidification. According to the initial permeability, the size of the wormholes formed in the four layers is MC > ME > MD >> MB.
  • According to the distribution of reservoir porosity and permeability, the MD and ME layers are determined as the target layers of viscous acid acidification, and the acid pump rate and acidizing fluid volume are optimized by numerical simulation software. The simulation results of the acidizing stimulation effect show that viscous acid acidification can significantly increase the production of the MD and ME layers in the X-24 well with decreasing daily production and obtain a better stimulation effect. The viscous acid fully meets the needs of the acidizing field and has a good application prospect in the acidizing operation of porous heterogeneous carbonate reservoirs.

Author Contributions

Writing—original draft, methodology, investigation, and formal analysis: L.Z.; writing—review and editing, H.X., J.W. and H.J.; investigation, K.Z. and H.X. All authors have read and agreed to the published version of the manuscript.

Funding

This work is financially supported by the Open Foundation of Cooperative Innovation Center of Unconventional Oil and Gas, Yangtze University (Ministry of Education & Hubei Province) (No. UOG2024-004) and the National Natural Science Foundation of China (No. 52274028).

Data Availability Statement

The original contributions presented in the study are included in the article, further inquiries can be directed to the corresponding authors.

Acknowledgments

The authors thank China University of Petroleum (Beijing) for the support with the project experimental equipment.

Conflicts of Interest

The authors declare that they have no known competing financial interests or personal relationships that could have appeared to influence the work reported in this paper.

Nomenclatures

CTComputerized tomography
3DThree dimensions

References

  1. Xu, Z.-X.; Li, S.-Y.; Li, B.-F.; Chen, D.-Q.; Liu, Z.-Y.; Li, Z.-M. A review of development methods and EOR technologies for carbonate reservoirs. Pet. Sci. 2020, 17, 990–1013. [Google Scholar] [CrossRef]
  2. Sun, H.; Li, S.; Liu, Z.; Chang, B.; Shen, C.; Cao, W. EOR technologies for fractured-vuggy carbonate condensate gas reservoirs. Nat. Gas Ind. B 2023, 10, 352–360. [Google Scholar] [CrossRef]
  3. Farhadi, H.; Ayatollahi, S.; Fatemi, M. Impact of rock morphology on the dominating enhanced oil recovery mechanisms by low salinity water flooding in carbonate rocks. Fuel 2022, 324, 124769. [Google Scholar] [CrossRef]
  4. Zhao, W.; Wang, Z.; Jiang, H.; Fu, X.; Xie, W.; Xu, A.; Shen, A.; Shi, S.; Huang, S.; Jiang, Q. Exploration status of the deep Sinian strata in the Sichuan Basin: Formation conditions of old giant carbonate oil/gas fields. Nat. Gas Ind. B 2020, 7, 462–472. [Google Scholar] [CrossRef]
  5. Somoza, A.; García-Mayoral, M.F.; Soto, A. A formulation based on a cationic surface-active ionic liquid and an anionic surfactant for enhanced oil recovery at a carbonate reservoir. Fuel 2023, 346, 128363. [Google Scholar] [CrossRef]
  6. Galkin, S.V.; Martyushev, D.A.; Osovetsky, B.M.; Kazymov, K.P.; Song, H. Evaluation of void space of complicated potentially oil-bearing carbonate formation using X-ray tomography and electron microscopy methods. Energy Rep. 2022, 8, 6245–6257. [Google Scholar] [CrossRef]
  7. Catinat, M.; Brigaud, B.; Fleury, M.; Thomas, H.; Antics, M.; Ungemach, P. Characterizing facies and porosity-permeability heterogeneity in a geothermal carbonate reservoir with the use of NMR-wireline logging data. Geothermics 2023, 115, 102821. [Google Scholar] [CrossRef]
  8. Jora, M.Z.; de Souza, R.N.; da Silva Barbosa, M.; Speglich, C.; Sabadini, E. pH-responsive wormlike micelles for acid stimulation in carbonate reservoirs. J. Pet. Sci. Eng. 2022, 218, 110975. [Google Scholar] [CrossRef]
  9. Shi, Y.; Yu, L.; Chen, S.; He, Y.; Yang, X.; Duan, L.; Cai, J. Effects of L-glutamic acid, N, N-diacetic acid as chelating agent on acidification of carbonate reservoirs in acidic environments. J. Nat. Gas Sci. Eng. 2020, 82, 103494. [Google Scholar] [CrossRef]
  10. Akanni, O.; Nasr-El-Din, H. The accuracy of carbonate matrix-acidizing models in predicting optimum injection and wormhole propagation rates. In Proceedings of the SPE Middle East Oil & Gas Show and Conference, Manama, Bahrain, 8–11 March 2015. SPE-172575-MS. [Google Scholar]
  11. Alameedy, U.; A.Alrazzaq, A.A. Wormholes Models for the Optimum Matrix Acidizing in Mi4 Unit-Ahdeb Oil Field. J. Eng. 2022, 28, 34–55. [Google Scholar] [CrossRef]
  12. Prouvost, L.P.; Economides, M.J. Applications of real-time matrix-acidizing evaluation method. SPE Prod. Eng. 1989, 4, 401–407. [Google Scholar] [CrossRef]
  13. Zhao, K.; Xu, H.; Wang, J.; Jiang, H.; Zhang, L. Study on Optimization of Stimulation Technology of Heterogeneous Porous Carbonate Reservoir. Processes 2024, 12, 1191. [Google Scholar] [CrossRef]
  14. Du, M.; Yang, Z.; Jiang, E.; Lv, J.; Yang, T.; Wang, W.; Wang, J.; Zhang, Y.; Li, H.; Xu, Y. Using digital cores and nuclear magnetic resonance to study pore-fracture structure and fluid mobility in tight volcanic rock reservoirs. J. Asian Earth Sci. 2024, 259, 105890. [Google Scholar] [CrossRef]
  15. Egiebor, N.O.; Oni, B. Acid rock drainage formation and treatment: A review. Asia-Pac. J. Chem. Eng. 2007, 2, 47–62. [Google Scholar] [CrossRef]
  16. Zhou, F. Theory and Application of Diverting Acidizing and Acid Fracturing in Carbonate Reservoirs; Science Press: Beijing, China, 2021. [Google Scholar]
  17. Shen, X.; Wang, S.; Guo, J.; Chen, F.; Xu, B.; Wang, Z.; Liu, Y. Effect of carbon chain lengths of cationic surfactant on inhibition rate of acid-rock reaction. J. Pet. Sci. Eng. 2021, 196, 107793. [Google Scholar] [CrossRef]
  18. Gomaa, A. Proper design of polymer-based in-situ gelled acids to improve carbonate reservoir productivity. In Proceedings of the SPE Annual Technical Conference and Exhibition, Florence, Italy, 19–22 September 2010. SPE-141123-STU. [Google Scholar]
  19. Yeager, V.; Shuchart, C. In situ gels improve formation acidizing. Oil Gas J. 1997, 95. [Google Scholar]
  20. AlOtaibi, F.; Dahlan, M.; Khaldi, M.; AlGhamdi, A.; Al-Hulail, I. Evaluation of inorganic-crosslinked-based gelled acid system for high-temperature applications. In Proceedings of the SPE International Conference and Exhibition on Formation Damage Control, Lafayette, LA, USA, 19–21 February 2020. D021S009R004. [Google Scholar]
  21. Kalgaonkar, R.; Baqader, N. Surface modified nanoparticles based novel gelled acid system—A unique formation damage free well stimulation technology. In Proceedings of the International Petroleum Technology Conference, Riyadh, Saudi Arabia, 21–23 February 2022. D021S053R002. [Google Scholar]
  22. Wolf, K.; Easton, A.; Warne, S. Techniques of examining and analyzing carbonate skeletons, minerals, and rocks. In Developments in Sedimentology; Elsevier: Amsterdam, The Netherlands, 1967; Volume 9, pp. 253–341. [Google Scholar]
  23. Fan, Y.; Peng, H.; Chen, G.; Peng, J.; Han, H.; Qin, Y.; Wang, L.; Liu, D. Experimental study of the influences of different factors on the acid-rock reaction rate of carbonate rocks. J. Energy Storage 2023, 63, 107064. [Google Scholar] [CrossRef]
  24. Alameedy, U.; Fatah, A.; Abbas, A.K.; Al-Yaseri, A. Matrix acidizing in carbonate rocks and the impact on geomechanical properties: A review. Fuel 2023, 349, 128586. [Google Scholar] [CrossRef]
  25. Lucas, C.R.d.S.; Neyra, J.R.; Araújo, E.A.; da Silva, D.N.N.; Lima, M.A.; Ribeiro, D.A.M.; Aum, P.T.P. Carbonate acidizing—A review on influencing parameters of wormholes formation. J. Pet. Sci. Eng. 2023, 220, 111168. [Google Scholar] [CrossRef]
  26. Karimi, M.; Ayatollahi, S. A new insight into wormhole propagation prediction in carbonate matrix acidizing based on experimental approaches. Gas Sci. Eng. 2023, 116, 205039. [Google Scholar] [CrossRef]
  27. Maheshwari, P.; Ratnakar, R.; Kalia, N.; Balakotaiah, V. 3-D simulation and analysis of reactive dissolution and wormhole formation in carbonate rocks. Chem. Eng. Sci. 2013, 90, 258–274. [Google Scholar] [CrossRef]
  28. Ghommem, M.; Zhao, W.; Dyer, S.; Qiu, X.; Brady, D. Carbonate acidizing: Modeling, analysis, and characterization of wormhole formation and propagation. J. Pet. Sci. Eng. 2015, 131, 18–33. [Google Scholar] [CrossRef]
  29. Panga, M.K.R.; Ziauddin, M.; Balakotaiah, V. Two-scale continuum model for simulation of wormholes in carbonate acidization. AIChE J. 2005, 51, 3231–3248. [Google Scholar] [CrossRef]
Figure 1. The statistical results of porosity and permeability distribution in different layers of the M reservoir. (a) Statistical point diagram of the relationship between porosity and permeability of the M reservoir; (b) statistical histograms of different permeability distribution ratios of the four layers.
Processes 12 01443 g001
Figure 2. Acid-rock reaction rates of the four layers.
Processes 12 01443 g002
Figure 3. CT scanning morphology of the core end face after the acid-rock reaction in the four layers. (a) MB layer; (b) MC layer; (c) MD layer; (d) ME layer.
Processes 12 01443 g003
Figure 4. Statistics of 3D scanning corrosion depth distribution of the core end face after the acid-rock reaction in the four layers. (a) MB layer; (b) MC layer; (c) MD layer; (d) ME layer.
Processes 12 01443 g004
Figure 5. Permeability changes before and after acid etching in different layers.
Processes 12 01443 g005
Figure 6. CT scans of the acid wormholes in the cores of the four layers. (a) MB layer; (b) MC layer; (c) MD layer; (d) ME layer.
Processes 12 01443 g006
Figure 7. Variation of the apparent viscosity of viscous acid with time (170 s−1). (a) Viscous acid temperature resistance; (b) viscous acid shear resistance.
Processes 12 01443 g007
Figure 8. Expansion of the wormhole in the near-wellbore area.
Processes 12 01443 g008
Figure 9. Variation of acid wormholes in the MD and ME layers under different acid pump rates. (a) MD layer; (b) ME layer.
Processes 12 01443 g009
Figure 10. Changes of acid wormholes in the MD and ME layers under different acidizing fluid volumes. (a) MD layer; (b) ME layer.
Processes 12 01443 g010
Figure 11. Prediction results of daily oil production/cumulative oil production after the acidification of the MD and ME layers. (a) MD layer; (b) ME layer.
Processes 12 01443 g011
Table 1. Acid-rock reaction kinetic equation and reaction activation energy test results.
LayerReaction Rate Constant KReaction Order mReaction Kinetics EquationsReaction Activation Energy Ea
(J/mol)
MB6.78 × 10−83.98J = 6.78 × 10⁻⁸ C3.984350.7
MC6.72 × 10−83.96J = 6.72 × 10⁻⁸ C3.96
MD6.68 × 10−83.95J = 6.68 × 10⁻⁸ C3.95
ME6.66 × 10−83.94J = 6.66 × 10⁻⁸ C3.94
Table 2. The changes of permeability and breakthrough PV number before and after acid etching in different layers.
LayerDiameter (cm)Length (cm)Porosity (%)Initial Permeability (mD)Permeability After Acid Etching (mD)Breakthrough PV
MB2.5222.4023.170.023/Difficult to inject
MC2.5182.32118.780.23397.027.23
MD2.5122.20413.100.09522.167.97
ME2.5192.45110.320.11030.937.54
Table 3. Permeability changes before and after residual acid damage in different layers.
LayerDiameter (cm)Length (cm)Permeability before Damage (mD)Permeability after Damage (mD)Damage Rate (%)
MB2.4962.5020.0330.0323.03
MC2.4872.5957.4107.1303.78
MD2.5012.5222.4052.3542.12
ME2.4862.5461.0761.0433.01
Table 4. Description of porosity and permeability in different layers of the M reservoir in the X-24 well.
LayerDepth (m)Thickness (m)Description of Porosity and Permeability
MB2807.299.7(1) Permeability is generally poor (78%: 0.01~6.3 mD, 12%: 6.3~54.28 mD).
(2) The proportion of low to moderate porosity is high, followed by medium preference (56%: 2.17~10.48%, 44%: 11.38~26.53%).
MC2906.933.9
MD2940.855.4(1) Permeability is generally poor (84%: 0.08~7.81 mD, 16%: 10.57~25.79 mD).
(2) The proportion of moderately good porosity is in the majority (28%: 2.5~10.4%, 72%: 11.43~30.78%).
ME2996.282.1(1) Permeability was generally poor (41%: 0.01~7.55 mD, 59%: 17.71~127.61 mD).
(2) Porosity preference was predominant (18%: 3~9.8%, 82%: 16.16~30.78%).
Disclaimer/Publisher’s Note: The statements, opinions and data contained in all publications are solely those of the individual author(s) and contributor(s) and not of MDPI and/or the editor(s). MDPI and/or the editor(s) disclaim responsibility for any injury to people or property resulting from any ideas, methods, instructions or products referred to in the content.

