Article

Decoding the Effect of Synthesis Factors on Morphology of Nanomaterials: A Case Study to Identify and Optimize Experimental Conditions for Silver Nanowires

1
Department of Chemical and Biomolecular Engineering, Clarkson University, Potsdam, NY 13699, USA
2
Department of Industrial, Manufacturing and Systems Engineering, Texas Tech University, Lubbock, TX 79409, USA
3
Department of Biomedical Engineering, University of Houston, Houston, TX 77204, USA
*
Author to whom correspondence should be addressed.
Processes 2024, 12(7), 1487; https://doi.org/10.3390/pr12071487
Submission received: 28 May 2024 / Revised: 12 July 2024 / Accepted: 12 July 2024 / Published: 16 July 2024
(This article belongs to the Section Materials Processes)

Abstract

:
Silver nanowires (AgNWs) are one kind of nanomaterials for various applications such as solar panel cells and biosensors. However, the morphology of AgNWs, particularly their length and diameter, plays a critical role in determining the efficiency of energy storage systems and the transmittance of biosensors. Thus, it is imperative to study synthesis strategy for morphology control. This study focuses on synthesizing AgNWs through the solvothermal approach and aims to understand the individual and combined effects of three nucleants, NaCl, Fe(NO3)3 and NaBr, on the morphology of AgNWs. Using a modified successive multistep growth (SMG) approach and fine-tuning the nucleant concentrations, this study synthesized AgNWs with controllable aspect ratios, while minimizing the presence of undesirable byproducts like nanoparticles. Our results demonstrated the successful synthesis of AgNWs with favorable morphologies, including lengths of approximately 180 µm and diameters of 40 nm, thus resulting in aspect ratios of 4500. In addition, to assess the quality of the synthesized AgNWs, this work developed computational tools that uses MATLAB to automate the analysis of scanning electron microscope (SEM) images for detecting silver nanoparticles. This automated approach provides a quantitative analysis tool for material characterization and holds the promise for long-term evaluation of diverse AgNW samples, thereby paving the way for advancements in their synthesis and application. Overall, this study demonstrates the significance of morphology control in AgNW synthesis and presents a robust framework for material characterization and quality analysis.

1. Introduction

Metallic nanomaterials have recently gained significant attention due to their unique and enhanced properties at the nanoscale, which include distinctive characteristics, such as particle size distribution and morphology not observed in larger particles of bulk materials [1]. Due to their unique physical and chemical properties, metal nanomaterials, such as copper nanowires, gold nanoparticles, and silver nanowires (AgNWs), have been studied for various applications [2,3,4]. Particularly, AgNWs have attracted substantial attention for their exceptional electrical, thermal, optical, and mechanical properties, which make AgNWs favorable in many fields, such as (I) transparent conductive films (TCFs). AgNWs retain their conductivity at the nanoscale, making them ideal for applications like touch screens and displays where visibility and flexibility are essential. Additionally, these films achieve a low sheet resistance, enhancing the efficiency and performance of electronic devices [5,6,7]. (II) Sensors, AgNWs are crucial in sensor fabrication due to their superior conductivity, flexibility, transparency, large surface area, and functionalization versatility. These properties make them ideal for creating highly sensitive, responsive, and flexible sensors that can detect a wide range of stimuli, including gases, biomolecules, and mechanical deformation. Their ability to maintain functionality under mechanical stress and to be customized with specific chemical or biological molecules further enhances their application in advanced sensor technologies [8,9,10]. (III) Surface-enhanced Raman scattering, AgNWs are essential in fabricating surface-enhanced Raman scattering substrates due to their strong plasmonic properties, ability to create electromagnetic hot spots, and large surface area. These characteristics significantly enhance the Raman signal of adsorbed molecules, allowing for increased sensitivity and the detection of low analyte concentrations. The tunable dimensions of silver nanowires also enable precise control over the substrate’s optical properties, optimizing the enhancement effect for specific applications [11,12]. (IV) Transparent or flexible/stretchable electronics, AgNWs are pivotal in transparent and flexible/stretchable electronics, offering high electrical conductivity and transparency for applications like touch screens and solar cells. They provide flexibility, stretchability, and mechanical strength, crucial for wearable electronics and flexible displays, maintaining performance under deformation. Their large surface area enhances durability and performance in various electronic devices [13,14,15]. Finally, (V) memristors, AgNWs are integral to memristor fabrication, offering excellent electrical conductivity and a large surface area that enhances electrode–material interactions. They are versatile in various memristor architectures, including crossbar arrays, enabling unique switching behaviors for data storage and processing. Their scalability supports high-density memory arrays and complex integrated circuits, advancing computing and artificial intelligence applications [16,17].
In industry, silver nanowires are applied through various sophisticated techniques. Solution-based coating methods involve spraying nanowire suspensions [18] onto substrates for large-scale applications or spin-coating [19] for precise, high-precision surfaces. Dip coating [20] uniformly covers substrates by immersing them in nanowire solutions. They are also incorporated into polymer matrices [21] to bolster mechanical properties and environmental stability or blended with materials like graphene [22] to enhance conductivity, flexibility, and transparency in hybrid films. Layer-by-layer assembly methods include the Langmuir–Blodgett [23], which transfers nanowire monolayers onto substrates. These techniques underscore the versatility of silver nanowires in advancing industrial applications across diverse sectors.
The efficacy and potential applications of AgNWs are related to their morphology [24,25]. For example, the length of AgNWs plays a pivotal role in achieving high transmittance with minimal haze and a low sheet conductivity. This is because longer AgNWs build more efficient network structures as compared to shorter ones and fewer nanowires are required to achieve percolation, leading to lower sheet resistance at the same transmittance. Nanowires with smaller diameters increase the number density of nanowires at a given transmittance. This improves the connectivity within the network, enhancing conductivity while maintaining high transmittance [2].
A number of techniques have been developed for AgNW synthesis in the literature. Electrochemical deposition involves precise control over nanowire dimensions using an electrochemical cell setup, suitable for environmentally friendly production but requiring specific substrates and careful parameter control. Template-assisted synthesis enables the production of highly ordered nanowire arrays by using templates that dictate nanowire dimensions and alignment, although the process includes complex template removal steps. Seed-mediated growth facilitates the creation of uniform nanowires with controlled diameters and lengths by seeding the growth with nanoparticles, potentially increasing production costs. Solution-based synthesis methods, such as the reduction method, involve the reduction of silver ions in solution to form nanowires, offering straightforward and cost-effective industrial scaling but resulting in variations in nanowire morphology and size distributions. Vapor-phase growth via chemical vapor deposition (CVD) ensures a high purity and crystallinity by depositing silver atoms onto substrates under controlled gas phase conditions, but it demands a controlled atmosphere and is less scalable for large-area applications [26,27]. Recently, AgNW synthesis has been predominantly achieved through the popular polyol method due to its ability to produce high aspect ratio nanowires with good uniformity and scalability [28,29]. However, this method, while versatile, has limitations, thus hindering its broader applications. Various factors, like stirring speed, chemical injection speed, and the number of injections, can affect the morphology of AgNWs from polyol synthesis.
Unlike the polyol approach, the solvothermal method requires using a sealed reaction vessel. This closed synthesis environment offers distinct advantages to facilitate controlled crystal growth. Thus, there has been a notable shift towards the solvothermal method for AgNW synthesis [30,31]. In a pioneering study, the successive multistep growth (SMG) was developed [32]. In brief, previously synthesized AgNWs were incorporated into solutions made of silver nitrate and Polyvinylpyrrolidone (PVP) to serve as nucleation sites, thus facilitating the elongation of newly formed AgNWs. This sequential process was iteratively repeated seven times, which ultimately maximized the lengths and aspect ratios of AgNWs. However, other factors such as nucleants can influence the morphology and were not studied. For example, the appropriate selections of nucleants may promote the growth of thinner and longer AgNWs, which is advantageous for applications such as biosensors.
To address these knowledge gaps, the primary objective in this work was to investigate the effect of different nucleants on AgNW synthesis and to improve the SMG method, with the goals of increasing the average length, decreasing the average diameter, and minimizing the number of necessary sequential processes—all in pursuit of achieving a possible high aspect ratio. This work also aims to demonstrate that the modification of the SMG method, through optimizing the number of growth steps and the choice of nucleants, enables the controlled synthesis of AgNWs with a diverse spectrum of lengths and diameters. The uniquely tailored AgNWs possess potential for various applications that may have specific length or diameter requirements.
This study specifically focused on the effect of the varying concentrations of sodium chloride (NaCl), iron nitrate (Fe(NO3)3), and sodium bromide (NaBr) on AgNWs’ morphology. Experimental findings were also compared with those from the prior SMG method that used copper chloride. Compared to the literature, we found that the chloride ions (Cl) and bromide ions (Br) can reduce nanowires’ diameters, while the introduction of Fe3+ ions notably enhanced the uniformity of the synthesized nanowires’ structures [3,33,34]. This study was also able to synthesize ultra-long AgNWs with an average length of around 180 µm, and an average diameter of 40 nm, which gives an aspect ratio of 4500.
We also found that some experiments varying the concentrations of different nucleants have produced nanoparticles. Since our primary goal was to synthesize AgNWs, the presence of nanoparticles is deemed undesirable. The greater the quantity of nanoparticles in a sample, the less suitable it becomes for various applications requiring silver nanowires. It is thus imperative to evaluate the quality of AgNWs by focusing on the nucleants used for the experiments and their concentration. However, this quality evaluation process can be laborious and costly, especially on a large scale, and subject to varying interpretations influenced by individual experimentalists, since a large number of SEM images are often required. To enhance efficiency and precision, we have further developed a computational-tool assisted approach. The in-house computer code developed with MATLAB examines SEM images and automatically identifies silver nanoparticles, thus expediting the analysis while reducing the need for extensive manual analysis. Using the program, it becomes feasible to perform high-throughput examination of SEM images of AgNWs, regardless of the specific nucleants or methodologies used for material synthesis.

2. Materials and Methods

2.1. Materials

All chemicals used in this study were analytical grade and in their as-received states, without any additional purification processes. Ethylene glycol (EG, ≥99%), poly-vinylpyrrolidone (PVP, MW ~1.3 × 10⁶), silver nitrate (AgNO3, >99%), sodium bromide (NaBr, ≥99.99%), ethanol (C2H6O, ≥99.9%), iron (III) nitrate nonahydrate (Fe(NO3)3·9H2O, 99.99%), sodium chloride (NaCl, ≥99%) and copper (II) chloride dihydrate (CuCl2·2H2O, ≥99%) were purchased from Sigma–Aldrich (Burlington, MA, USA).

2.2. Overview of the Modified AgNW Synthesis

Figure 1 schematically shows AgNW synthesis following the SMG method [32]. Initially, 23.0 mmol of PVP were dissolved in 70 mL of EG at 100 °C under magnetic stirring (890 rpm). Simultaneously, 3.0 mmol of AgNO3 was dissolved in 10 mL of EG, and specific amounts of nucleants were dissolved in 20 mL of EG at 50 °C, while using magnetic stirring (600 and 1200 rpm, respectively). It was critical to ensure the complete dissolution to achieve a transparent and uniform solution. Subsequently, the EG solutions containing nucleants and AgNO3 were individually added into the EG solution containing PVP, followed by three minutes of stirring (i.e., step 1 in Figure 1). The resulting mixture was further transferred into a vacuum oven preheated to 150 °C, where it underwent an approximately 90-min reaction to promote the growth of AgNWs until the reaction was fully completed (i.e., step 2 in Figure 1). After the reaction, the solution was cooled down to room temperature and the resultant AgNWs were harvested via centrifugation at 8000 rpm for 10 min. The acquired AgNWs were dispersed in 20 mL of ethanol (i.e., step 3 in Figure 1). Following this, 10 mL of the resulting AgNW solution was subsequently separated (4.48 M AgNWs in ethanol) for the next growth phase. To synthesize longer AgNWs through the SMG method, these formed AgNWs (10 mL) were further combined with the same amount of AgNO3, nucleants, and the PVP solution for multistep growth (i.e., step 4 in Figure 1) and the whole process was repeated several times.

2.3. Quantitative Indicators for AgNW Synthesis

In our experiments, determining the appropriate moment to quench the reaction was vital. For example, color changes to the solution or a predefined time can be used. Relying solely on time and color changes proved insufficient due to variations in the experiments. We found that a few reactions surpassed the 90-min mark by 5–10 min, while others lagged behind by a similar amount of time, and some experiments resulted in desired color changes around 90-min. The subjective nature of color perception may also introduce potential inaccuracies, since different experimentalists may interpret colors differently. To mitigate this, an alternative approach was adopted and tested in this study. Specifically, pH values were used as a reliable indicator to determine the optimal termination point. By closely monitoring pH value changes, experiments were quenched when the pH dropped to around 3.8. This method provided a more accurate way to terminate reactions, thus minimizing the impact of subjective interpretations and human error.
For illustration, Figure 2 shows the pH changes during the synthesis of AgNWs for the first three steps of the modified SMG as examples. In the initial stage of the first step of the SMG, the mixture of PVP, AgNO3, and nucleants in EG was prepared and its pH was measured prior to placing the solution in the oven (time = 0 in Figure 2). Subsequently, the pH was measured at 10-, 20-, 40-, and 80-min marks during the reaction, and when the solution exhibited an opaque gray color (approximately 90-min mark into the experiment). For the first step of the SMG, a slight decrease in pH from 4.4 to 3.8 was observed. To validate the results, the solution was maintained in the oven for an additional 15 min after reaching the opaque gray color, during which the pH was measured two more times. The results confirmed that the pH remained at 3.8 upon the completion of the experiment, thus indicating the successful formation of AgNWs.
To confirm the possibility of using the pH as an indicator for reactions, we also measured pH changes for successive reactions of the SMG method and the pH changes for steps 2 and 3 are given in Figure 2 as examples. It is also important to note that the introduction of the previously synthesized AgNWs from the preceding batches into the PVP, AgNO3, and nucleants mixture solution resulted in a decrease in the initial solution’s pH. For example, the pH was found to be 3.5 right before placing the solution into the oven for reaction (time = 0) during step 2 of the SMG method. However, upon initiating the experiment in the oven, the pH exhibited an initial increase within the first 20 min, followed by a decreasing trend that changed from 4.6 to 3.8 in Figure 2. Similar to the first step of the SMG synthesis, the pH value reached 3.9 at an 80-min mark of the experiment and stabilized at 3.8 upon completion. The solution was subjected to an additional 15 min of reaction in the oven, during which the pH was measured twice and remained at 3.8.

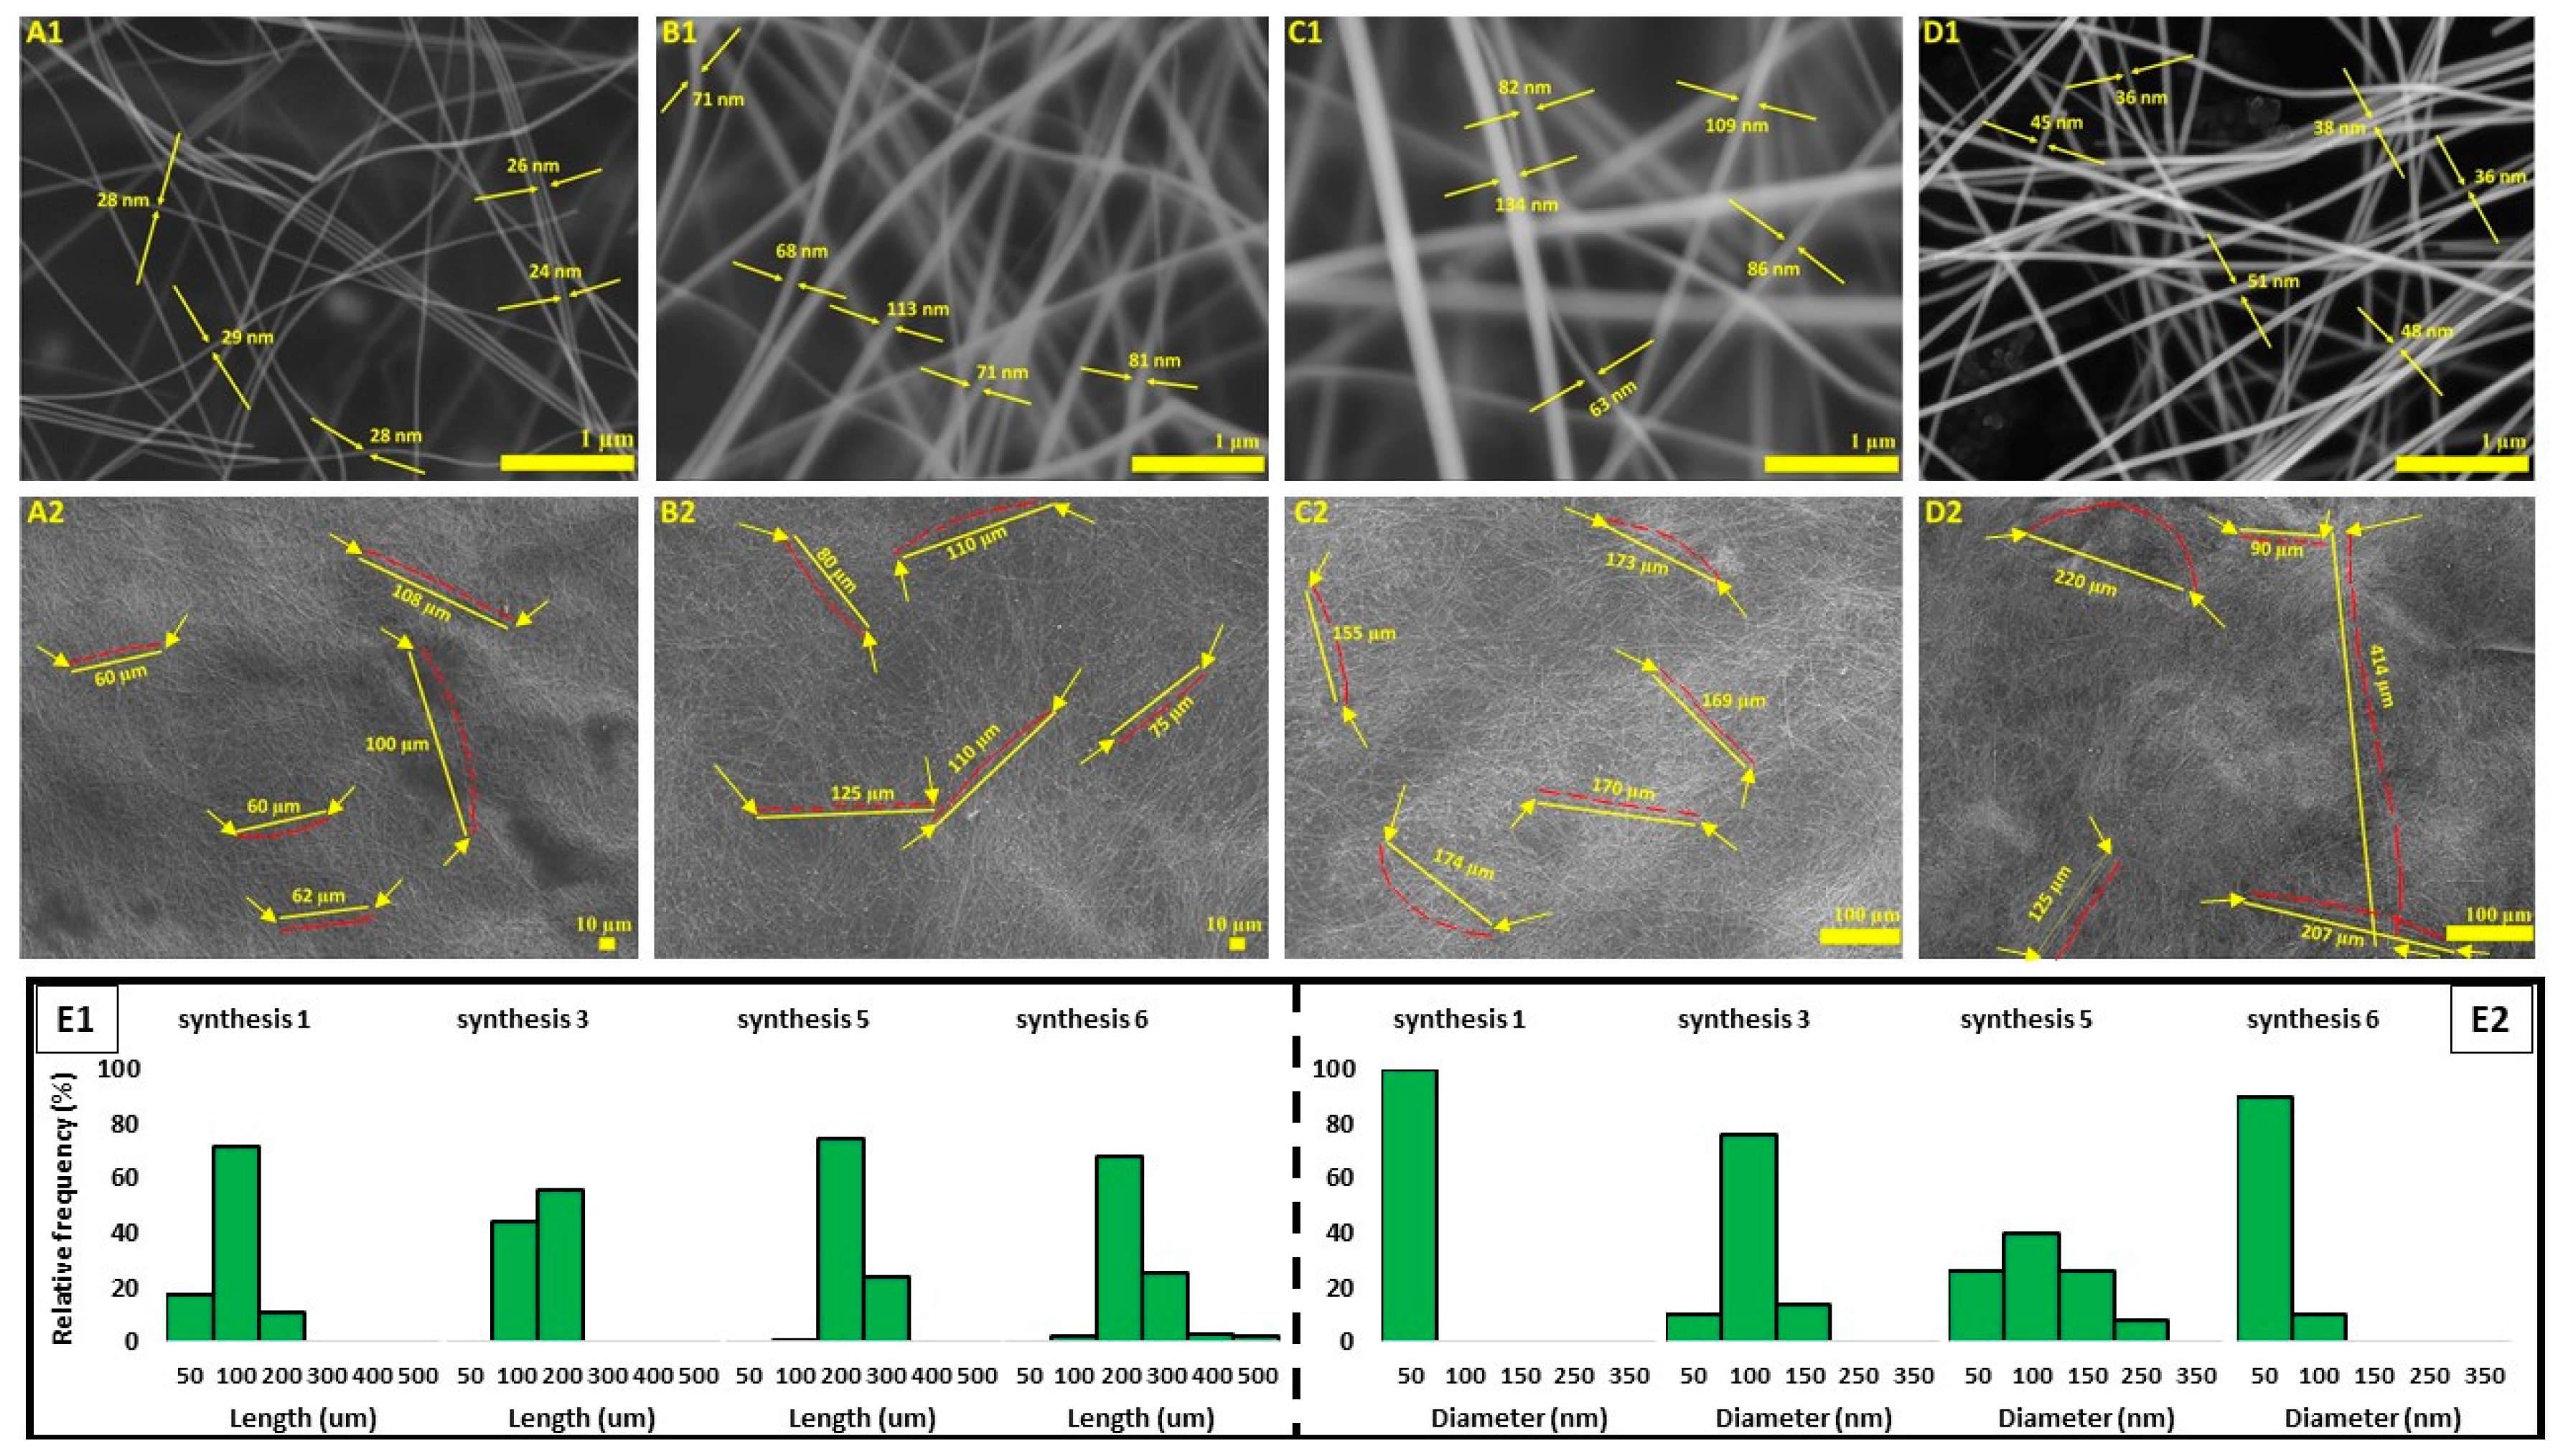
2.4. Materials Characterizations

The microstructures of the synthesized AgNWs were characterized using a scanning electron microscope (SEM) (JEOL JSM-7900FLV, Tokyo, Japan). For SEM imaging, a drop of AgNW dispersed in ethanol (4.48 M) was spread on a carbon coated SEM mount and the samples were dried in a preheated oven (100 °C) for 10 min. For measuring the length and diameter of the nanowires, the ImageJ software version 1.54f (Released in 2023) was used. The results of AgNW characterization are given in Section 3 below.

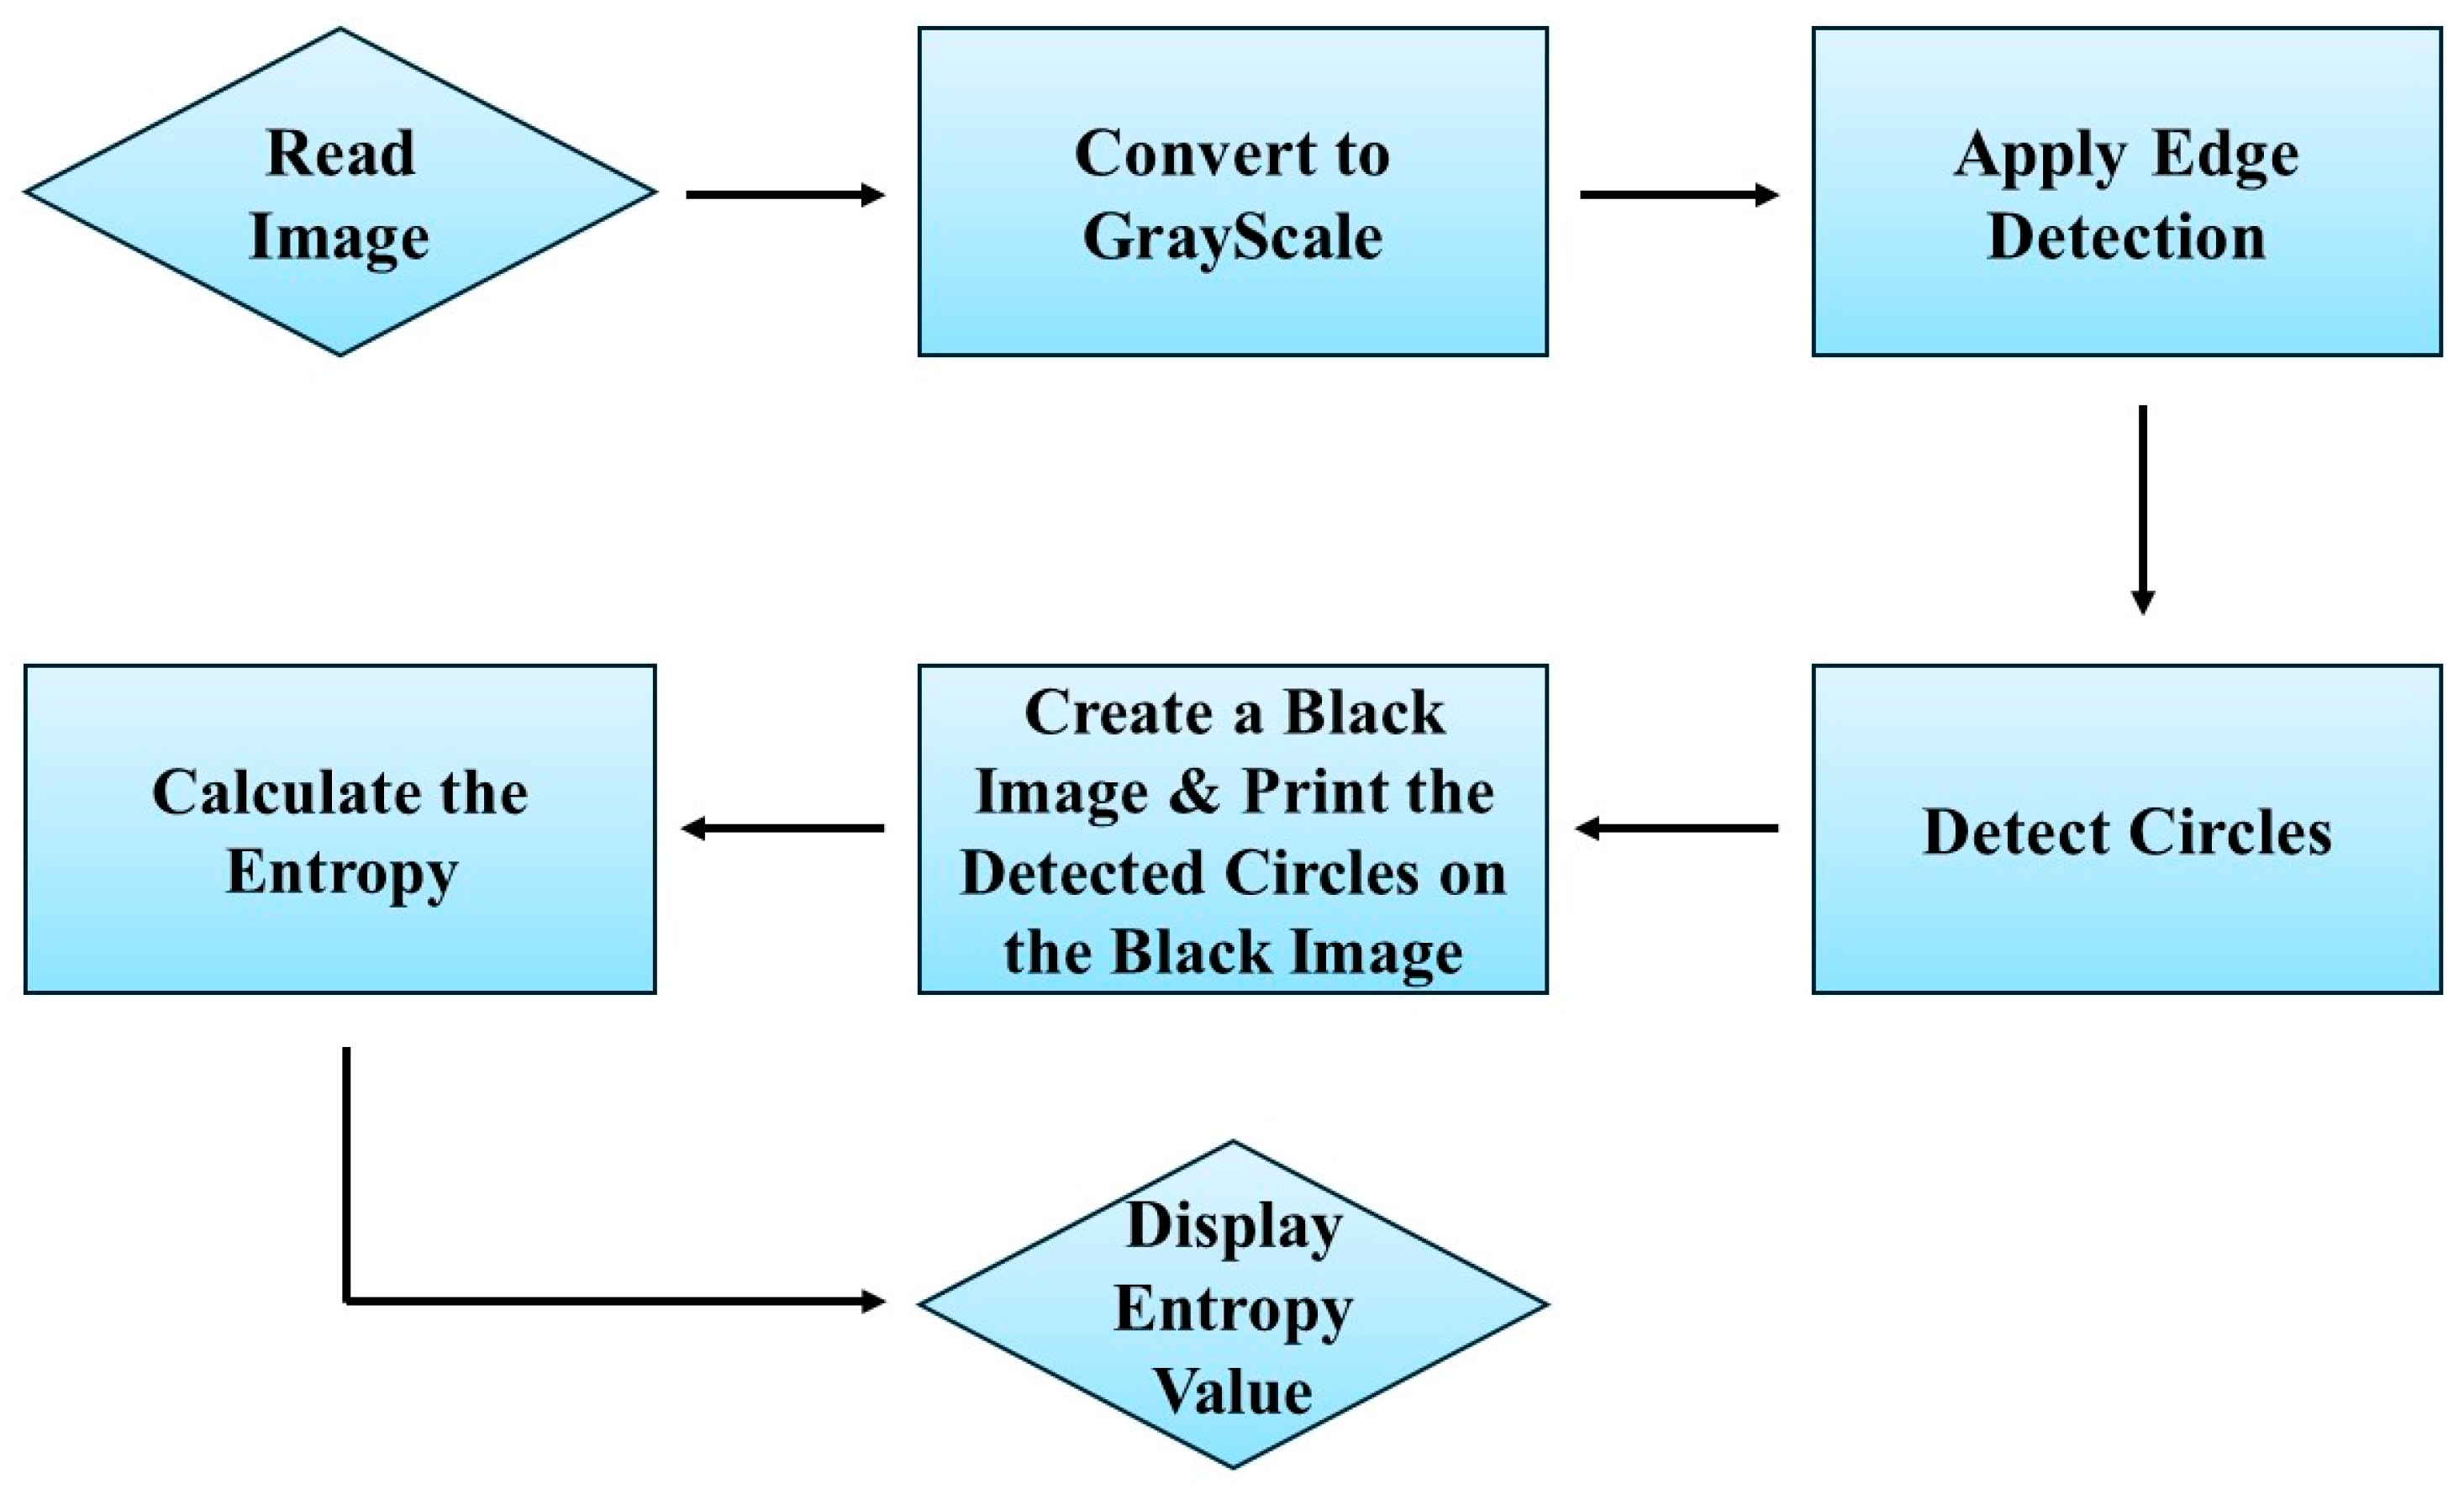
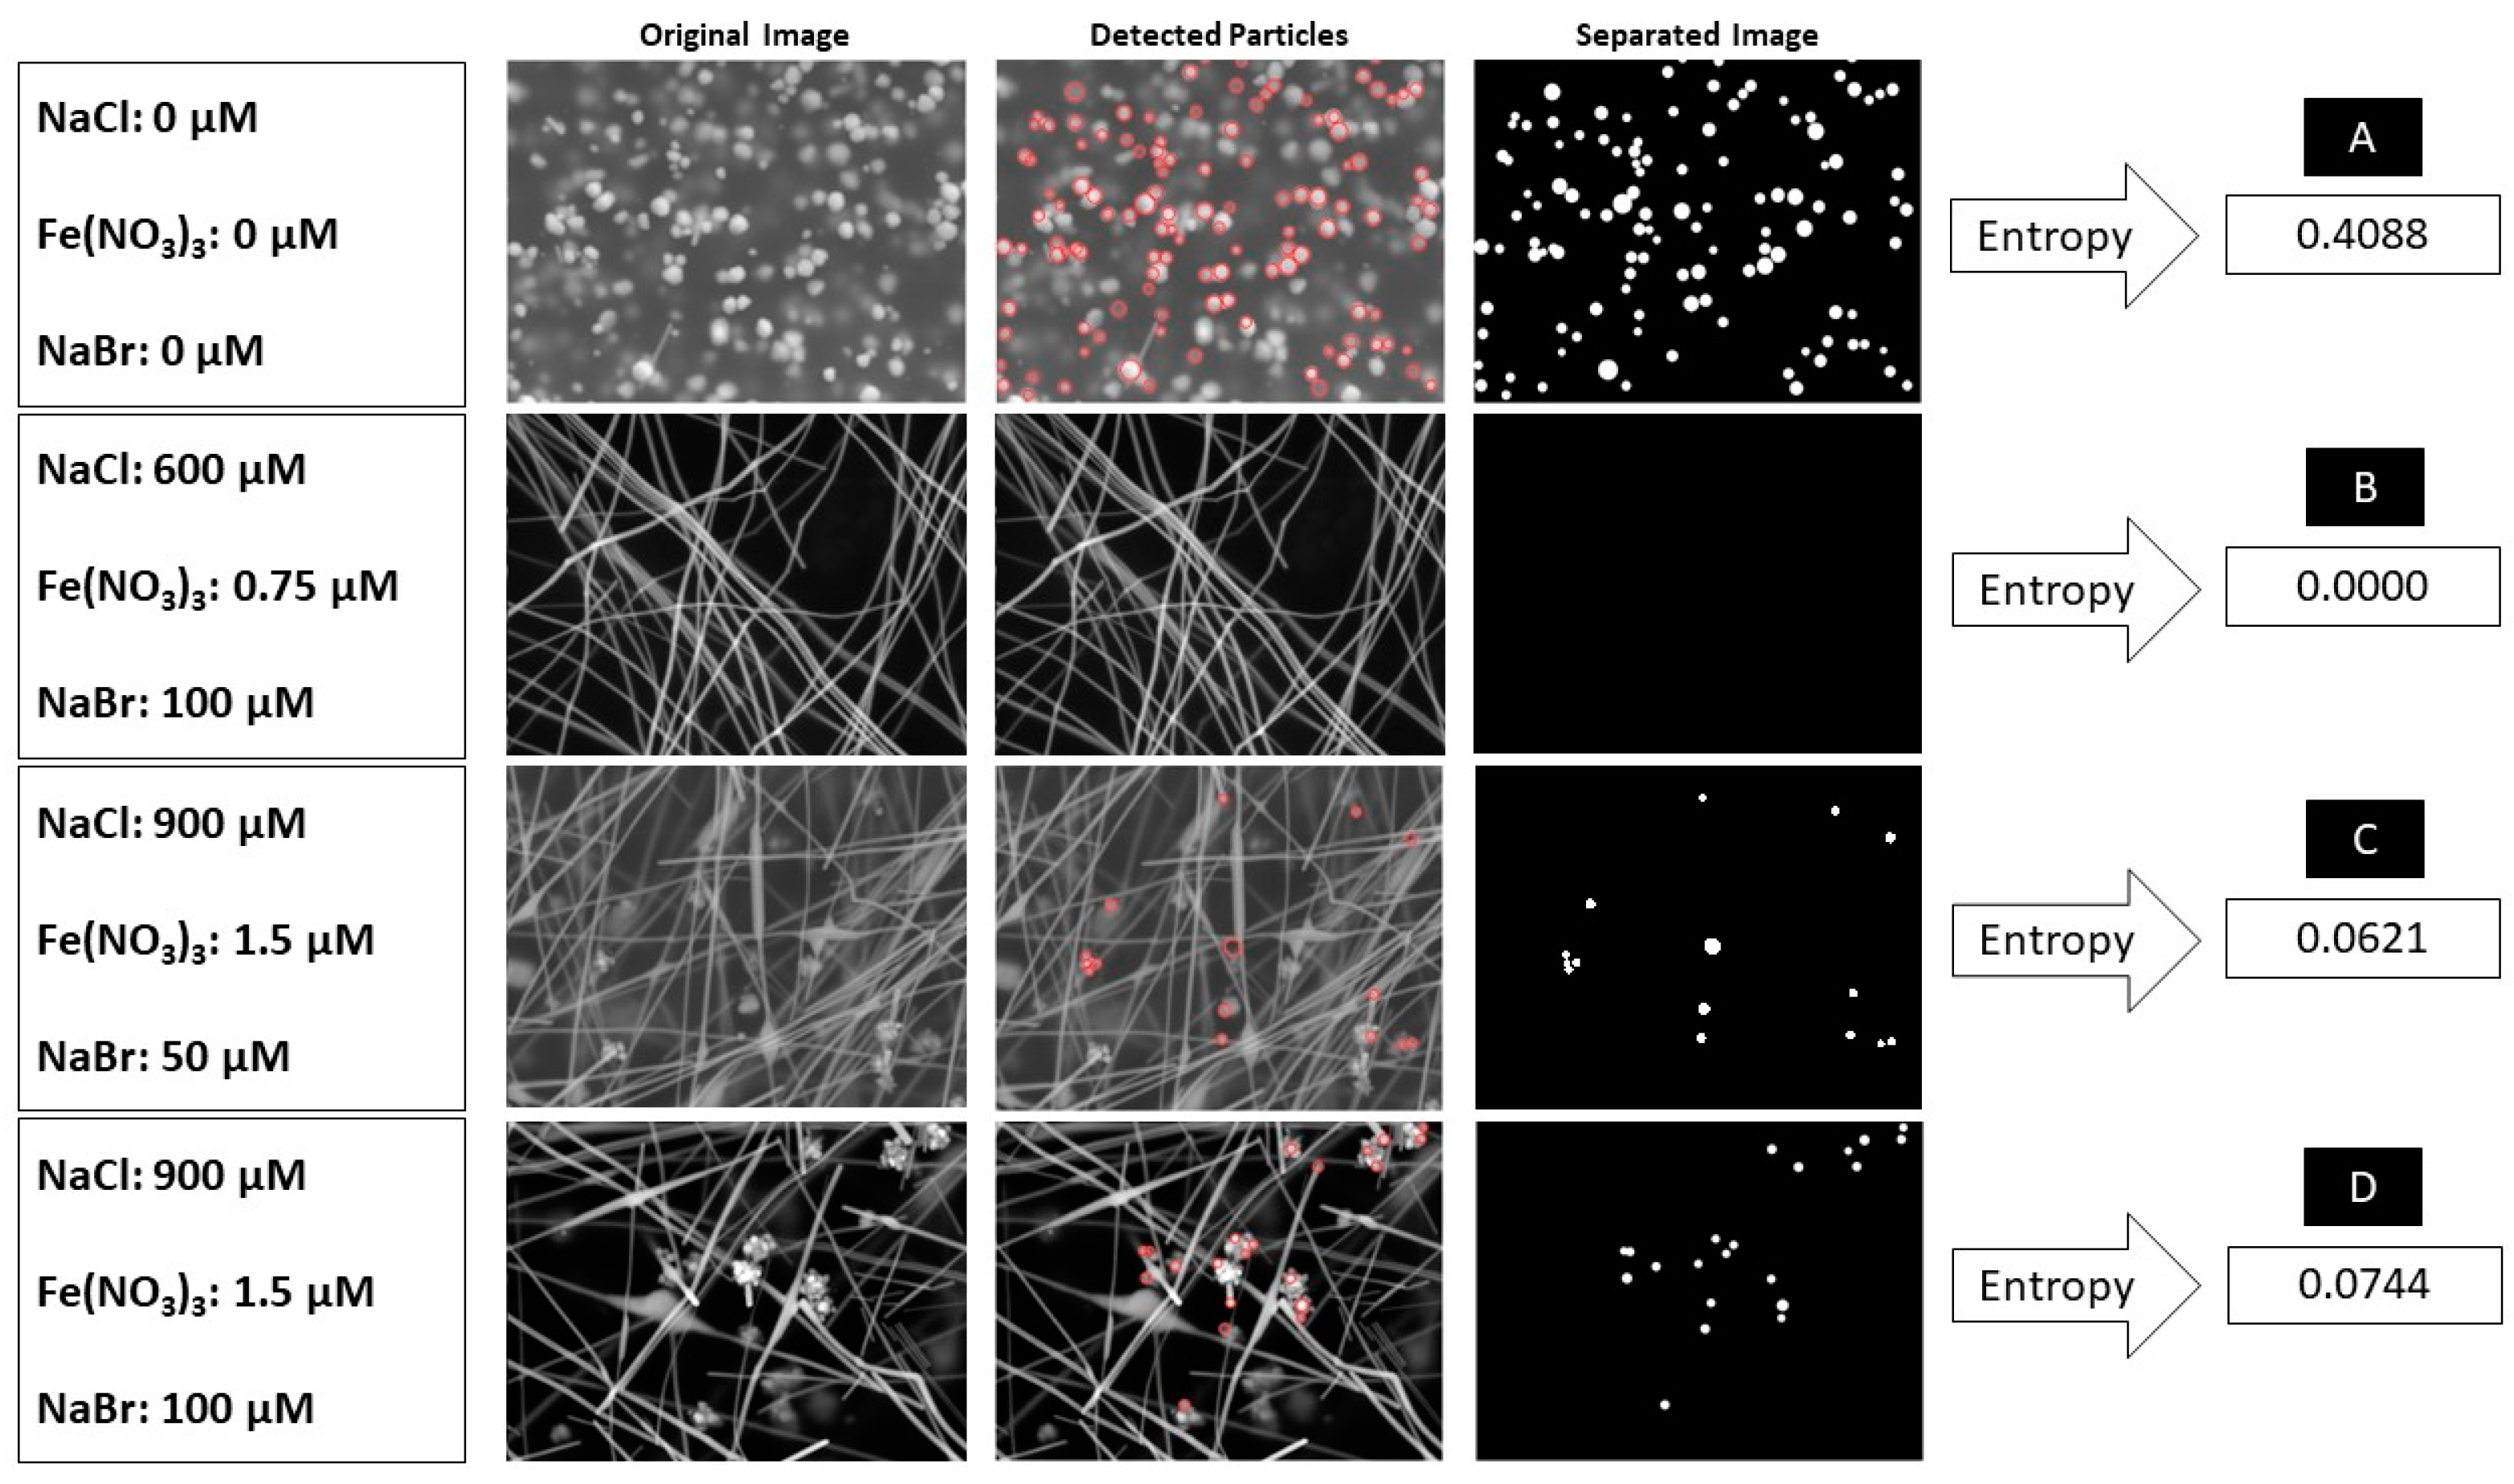
2.5. Entropy as an Indicator to Quantify Nanostructures

To automatically analyze SEM images for assessing the quality of synthesized materials, a software toolbox using MATLAB Release 2023b (R2023b) was developed. In brief, this script can identify circular nanoparticles in individual testing images, isolate nanoparticles from the original microscopic SEM images, and then restructure images by placing these identified circular nanoparticles on new images with a black background. Additionally, the toolbox can calculate the entropy of the restructured images. In this way, when an SEM image of AgNW is provided to the software, it will automatically provide a numerical value of entropy as an output. These entropy values can be used to quantify the quality of synthesized materials. For example, we found that a reconstructed images with many circular nanoparticles can result in a high entropy value, which means a high degree of disorders within the given image. As such, the entropy can be used to determine the presence of nanoparticles and quantitatively estimate the quality of the formed nanomaterials. On the contrary, a low entropy value indicates minimal disorder, thus suggesting that there are limited or minimal circular nanoparticles and the samples used for SEM imaging predominantly consist of AgNWs.
For our experiments, we found that the identified silver nanoparticles had radii ranging from 10 to 50 pixels, a size range consistent with the typical dimensions of nanoparticles observed in the collected SEM images. Based on this information and to ensure accuracy, the dimensions of all testing SEM images used to estimate entropy were first standardized to “1280 × 960” pixels before applying the MATLAB code in our work. A flowchart that illustrates the key steps of the tool is shown in Figure 3, which includes several procedures for identifying circular silver nanoparticles, isolating them, duplicating them against a black background, and calculating the entropy.
Specifically, to detect circular nanoparticles in SEM images, our software uses the Hough Circle Transform via the “imfindcircles” function, which segments circles from the background of microscopic images based on edge information. The edges are enhanced using the Canny edge detection algorithm (“edge” function). The range of radii for the circles is specified, and the detected circles are then drawn on a black image. To reconstruct a new image with nanoparticles filled with white, the toolbox uses a black image and fills the detected circular regions with white by updating the corresponding pixels and their values in the black image. To calculate entropy, the “entropy” function is used for restructured images. Results are given in Section 3.2 below for algorithm illustration.

3. Results and Discussion

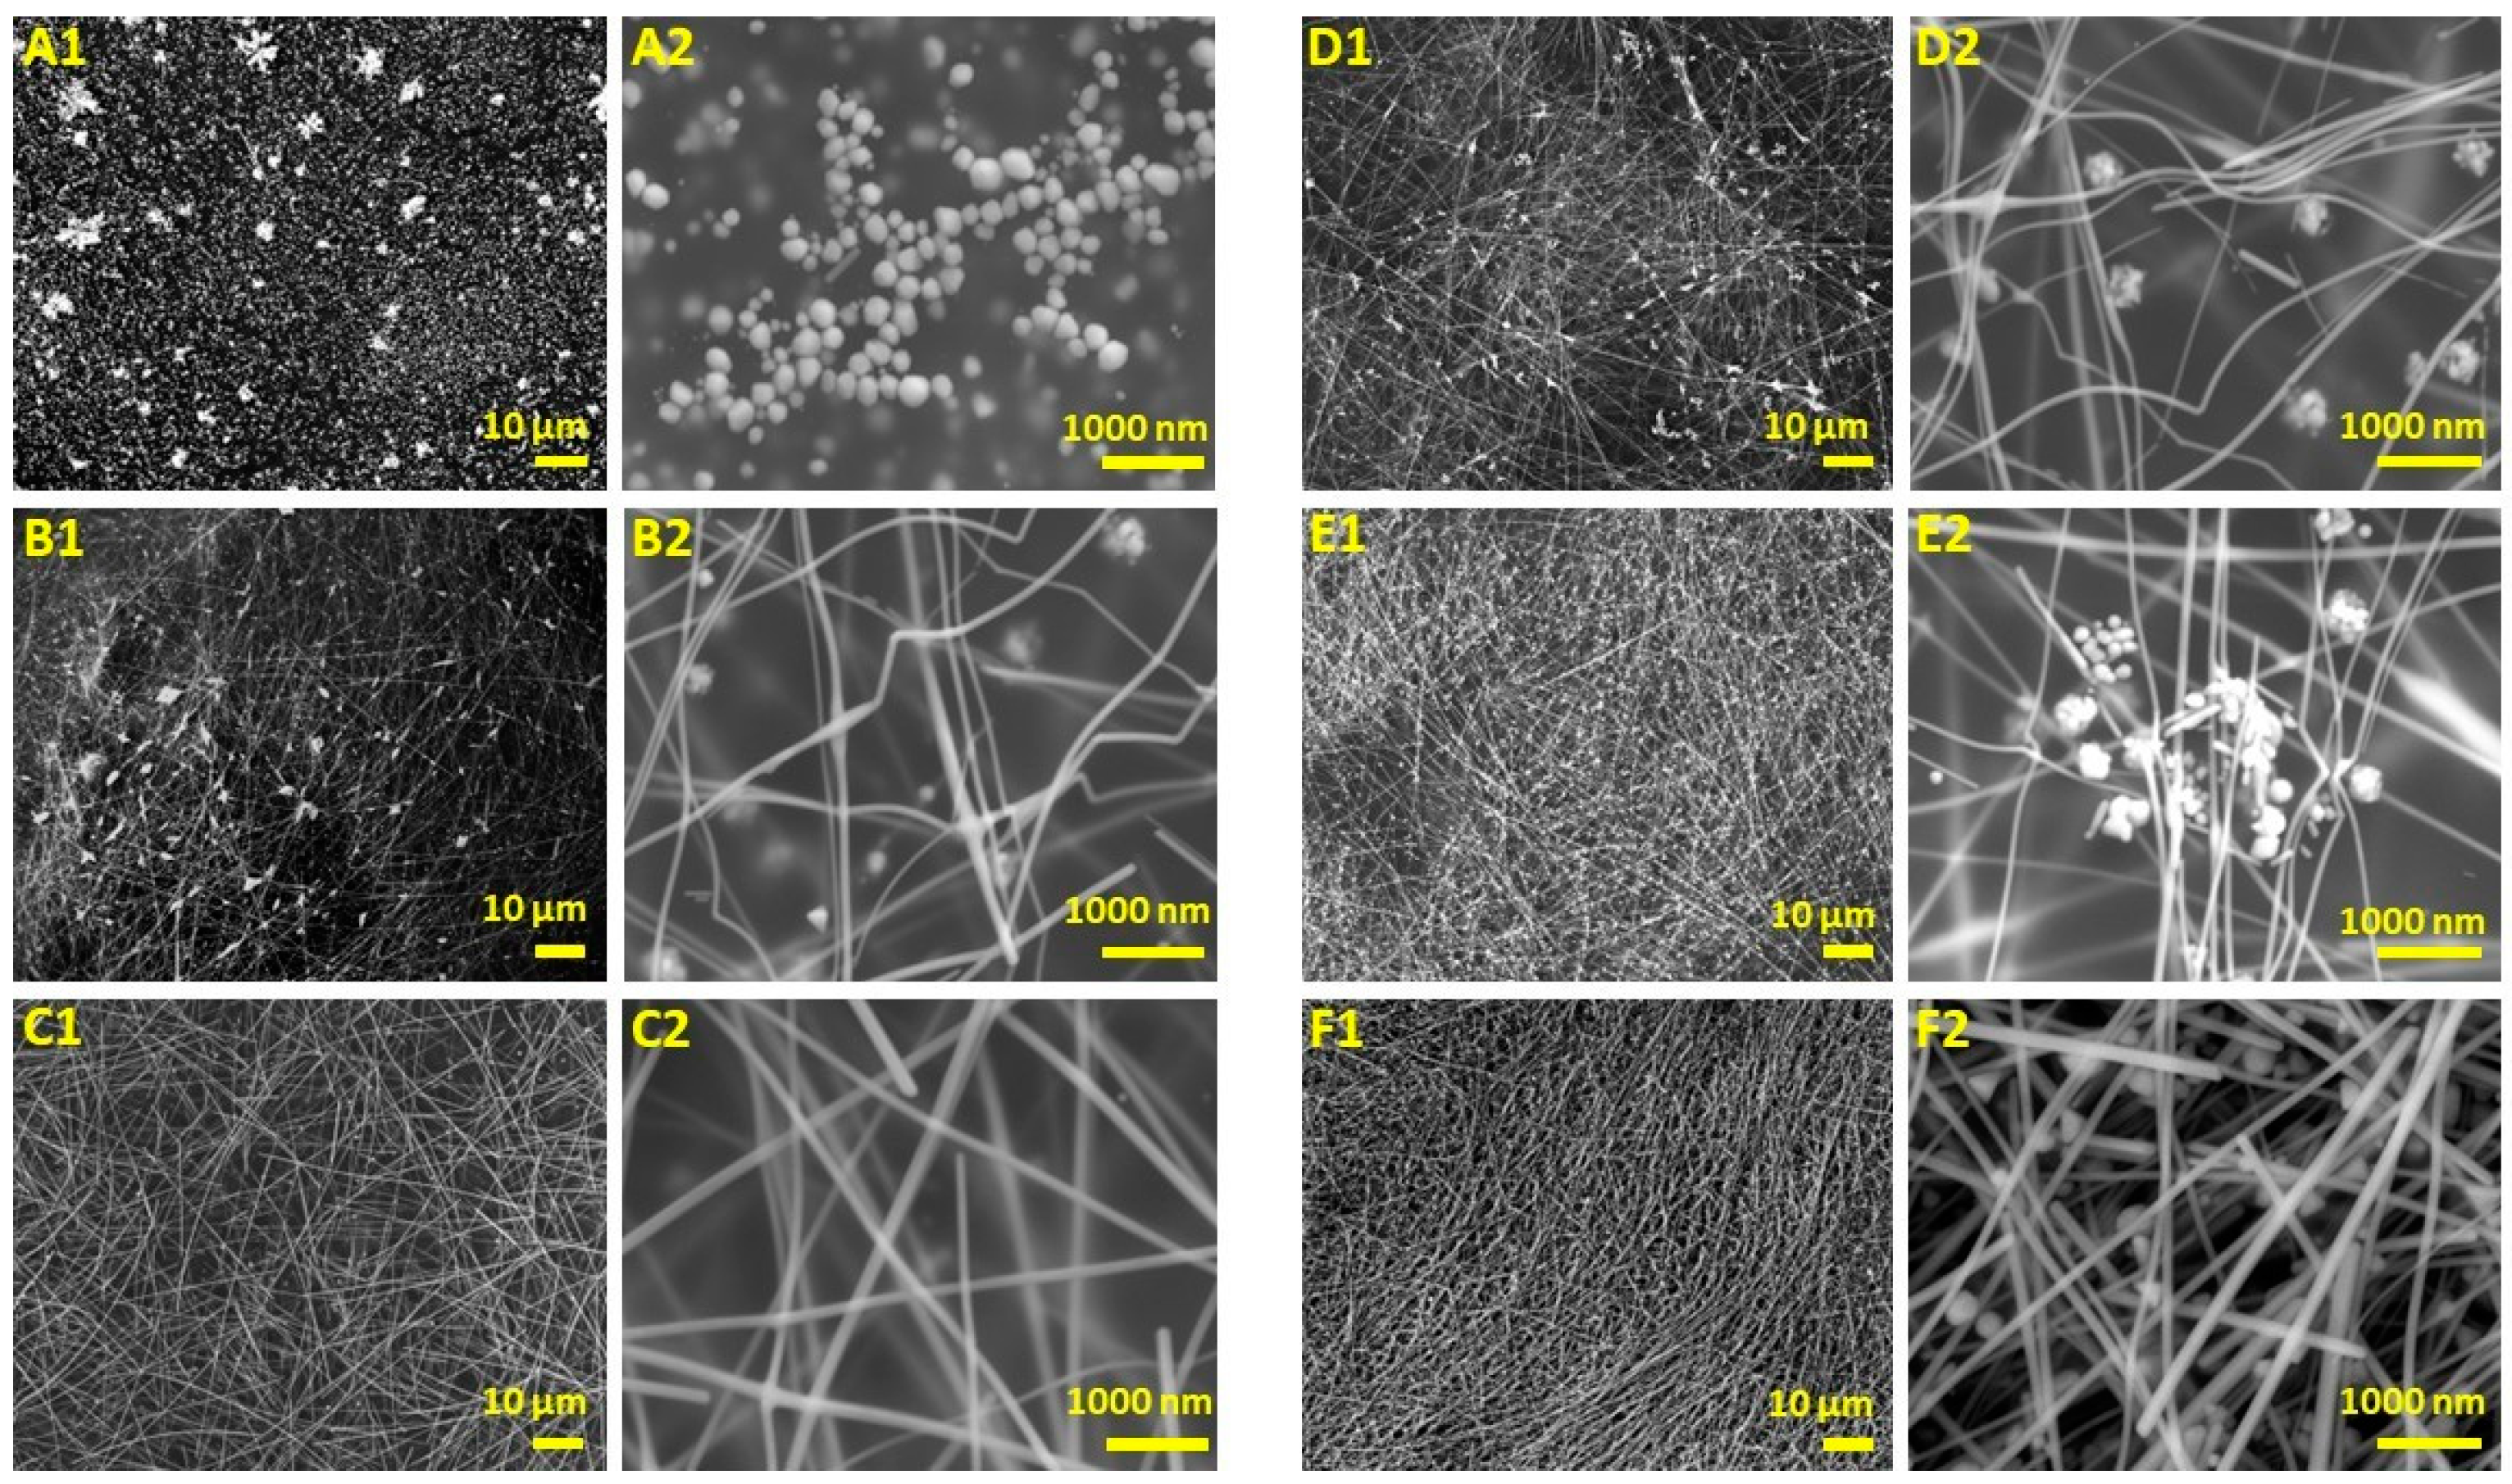
3.1. Effect of Nucleants on AgNW Synthesis

The presence of chloride ions (Cl), ferric (Fe3+), and bromide ions (Br) has favorable effects on the formation of AgNWs, such as increased lengths and reduced diameters, thus increasing the aspect ratio. The initial phase of our investigation centered on elucidating the role of Cl in controlling morphological features. In recent studies, NaCl has emerged as the prevailing source of Cl, serving as a key component for AgNW synthesis.
We conducted a systematic analysis encompassing five distinct concentrations of NaCl, 0, 300, 600, 900, and 1200 μM, and subsequently compared the morphology of synthesized samples. Moreover, our studies extended to AgNW synthesis and used copper chloride (CuCl2) as the chloride ion source, for which the concentration of CuCl2 was guided by the recommended parameters outlined in the work that introduced the SMG method [32]. Importantly, previous work substituted CuCl2 for NaCl as the chloride ion source. In Figure 4, SEM images of synthesized AgNWs at high and low magnifications, respectively, are given to compare the morphological features of samples formed with varying concentrations of NaCl and CuCl2.
As shown in Figure 4, the absence of chloride ions (Figure 4(A1,A2)) resulted in the generation of nanoparticles, with no observable formation of AgNWs. The possible reason is that the chloride ions effectively diminished the concentration of unbound silver cations within the reaction solution, accomplished through the formation of nano crystallites of AgCl. Hence, the pivotal role of chloride ions in decreasing the reaction rate which enables anisotropic growth is evident, thus promoting the genesis of AgNWs [35,36]. By introducing NaCl with a concentration of 300 μM, AgNWs were formed (Figure 4(B1,B2)). However, alongside AgNWs, silver nanoparticles and nanorods were also found. This phenomenon can be explained by the persistently rapid reaction rate, likely caused by inadequate formation of the AgCl compound [37]. We found that increasing the NaCl concentration to 600 μM (Figure 4(C1,C2)) facilitated the creation of AgNWs, with the least number of nanoparticles in comparison to other concentrations. These nanowires exhibited enhanced uniformity in both length and diameter. Conversely, when the NaCl concentration was increased to 900 μM (Figure 4(D1,D2)) and 1200 μM (Figure 4(E1,E2)), the formation of nanoparticles and nanorods resumed. Thus, it can be concluded that among the NaCl concentrations studied, 600 μM was proved to be the optimal level for producing uniform nanowires with minimal nanoparticles. In the context of synthesized AgNWs with CuCl2 (Figure 4(F1,F2)), it can be observed that alongside nanowires, nanoparticles were also formed. Additionally, analysis revealed that while the AgNWs produced with CuCl2 and 600 μM NaCl exhibited the same average diameter (~70 nm), the samples produced from 600 μM NaCl were almost twice the length of those synthesized with CuCl2 (~50 μm and ~27 μm, respectively). This substantial difference in length highlights the advantage of NaCl over CuCl2 as a favorable chloride source for AgNW synthesis.
Upon determining the optimal NaCl concentration, various concentrations of Fe(NO3)3 were introduced to investigate the impact of Fe3+ on the morphology of AgNWs. Specifically, 0.75 μM, 1.5 μM, and 2.5 μM of Fe(NO3)3 were individually added to the equal amounts of PVP and AgNO3, alongside 600 μM of NaCl. Several SEM images of samples from our experiments are given in Figure 5.
In Figure 5, it is evident that the introduction of Fe(NO3)3 led to the formation of nanoparticles alongside nanowires. However, at concentrations of 0.75 μM (Figure 5(A1,A2)) and 1.5 μM (Figure 5(B1,B2)) of Fe(NO3)3, the quantity of these nanoparticles was negligible compared to the nanowires. Conversely, when 2.5 μM of Fe(NO3)3 was used (Figure 5(C1,C2)), a significant number of nanoparticles were formed, disrupting AgNW synthesis. This could be potentially caused by the potent etching effect of high concentrations of Fe(NO3)3 [34].
In our experiments, we found that AgNWs synthesized with 0.75 μM and 1.5 μM of Fe(NO3)3 exhibited the desired morphology. To determine the most suitable concentration for synthesizing AgNWs with high aspect ratios, it is important to examine their length and diameter. When 0.75 μM of Fe(NO3)3 was used, the average length and diameter of the AgNWs were 75 μm and 44 nm, respectively (aspect ratio = 1700). This resulted in a length increase and diameter reduction, as compared to samples synthesized solely with 600 μM of NaCl (average length of 50 μm, average diameter of 70 nm, and an aspect ratio of ~700). These morphological changes increased the aspect ratio by 2.5 times, significantly improving the synthesis process. The addition of 1.5 μM of Fe(NO3)3 also enhanced the nanowires in comparison to using only NaCl, but with slightly shorter lengths (70 μm) and larger diameters (50 nm). Consequently, a combination of 0.75 μM of Fe(NO3)3 and 600 μM of NaCl was identified as the synthesis conditions to form AgNWs with an aspect ratio of 1700.
We further studied the impact of NaBr as the third nucleating agent on the morphology of AgNWs. When both NaCl and NaBr were used as nucleants during AgNW synthesis, a substantial quantity of AgCl and AgBr colloids formed in the initial stages of the reaction. These colloids hindered the reduction of Ag+ ions and created numerous nucleation sites. Consequently, this restricted the radial growth of AgNWs, leading to the formation of samples with an exceptionally small diameter [37,38,39]. This unique characteristic proves advantageous in the synthesis of AgNWs with high aspect ratios.
Motived by the roles of NaBr for AgNW formation, three concentrations of NaBr, 50 μM (Figure 6(A1,A2)), 100 μM (Figure 6(B1,B2)) and 200 μM (Figure 6(C1,C2)), were added separately to fixed amounts of NaCl (600 μM) and Fe(NO3)3 (0.75 μM) as the nucleant agents to study the effect of NaBr on the morphology of AgNWs. When 50 μM of NaBr was used, no significant alterations in the nanowires’ morphology were observed. It became evident that this concentration was insufficient to induce specific changes in the nanowires’ lengths or diameters, as compared to these working conditions where only NaCl and Fe(NO3)3 were utilized. However, a noteworthy transformation was observed upon increasing the NaBr concentration to 100 μM. This adjustment led to a remarkable increase in aspect ratios, accomplished by reducing the average diameter of the synthesized AgNWs from 44 nm to 29 nm. Despite a minor reduction in the average length (~68 μm), the aspect ratio was increased to approximately 2400. Remarkably, this ratio was 1.5 times greater than the results obtained using NaCl and Fe(NO3)3, as discussed above. Further studies with 200 μM of NaBr did not yield significant changes in diameter. Instead, it led to a decrease in the length of the synthesized AgNWs, consequently reducing the aspect ratio. In summary, it has been demonstrated that maintaining NaCl and Fe(NO3)3 concentrations at 600 μM and 0.75 μM, respectively, while introducing 100 μM of NaBr, resulted in the synthesis of AgNW with an aspect ratio of 2400. Figure 6(D1,D2)) illustrates the length and diameter frequency distribution of AgNWs synthesized using NaCl alone, NaCl and Fe(NO3)3, as well as with the three nucleants of NaCl, Fe(NO3)3, and NaBr, respectively.

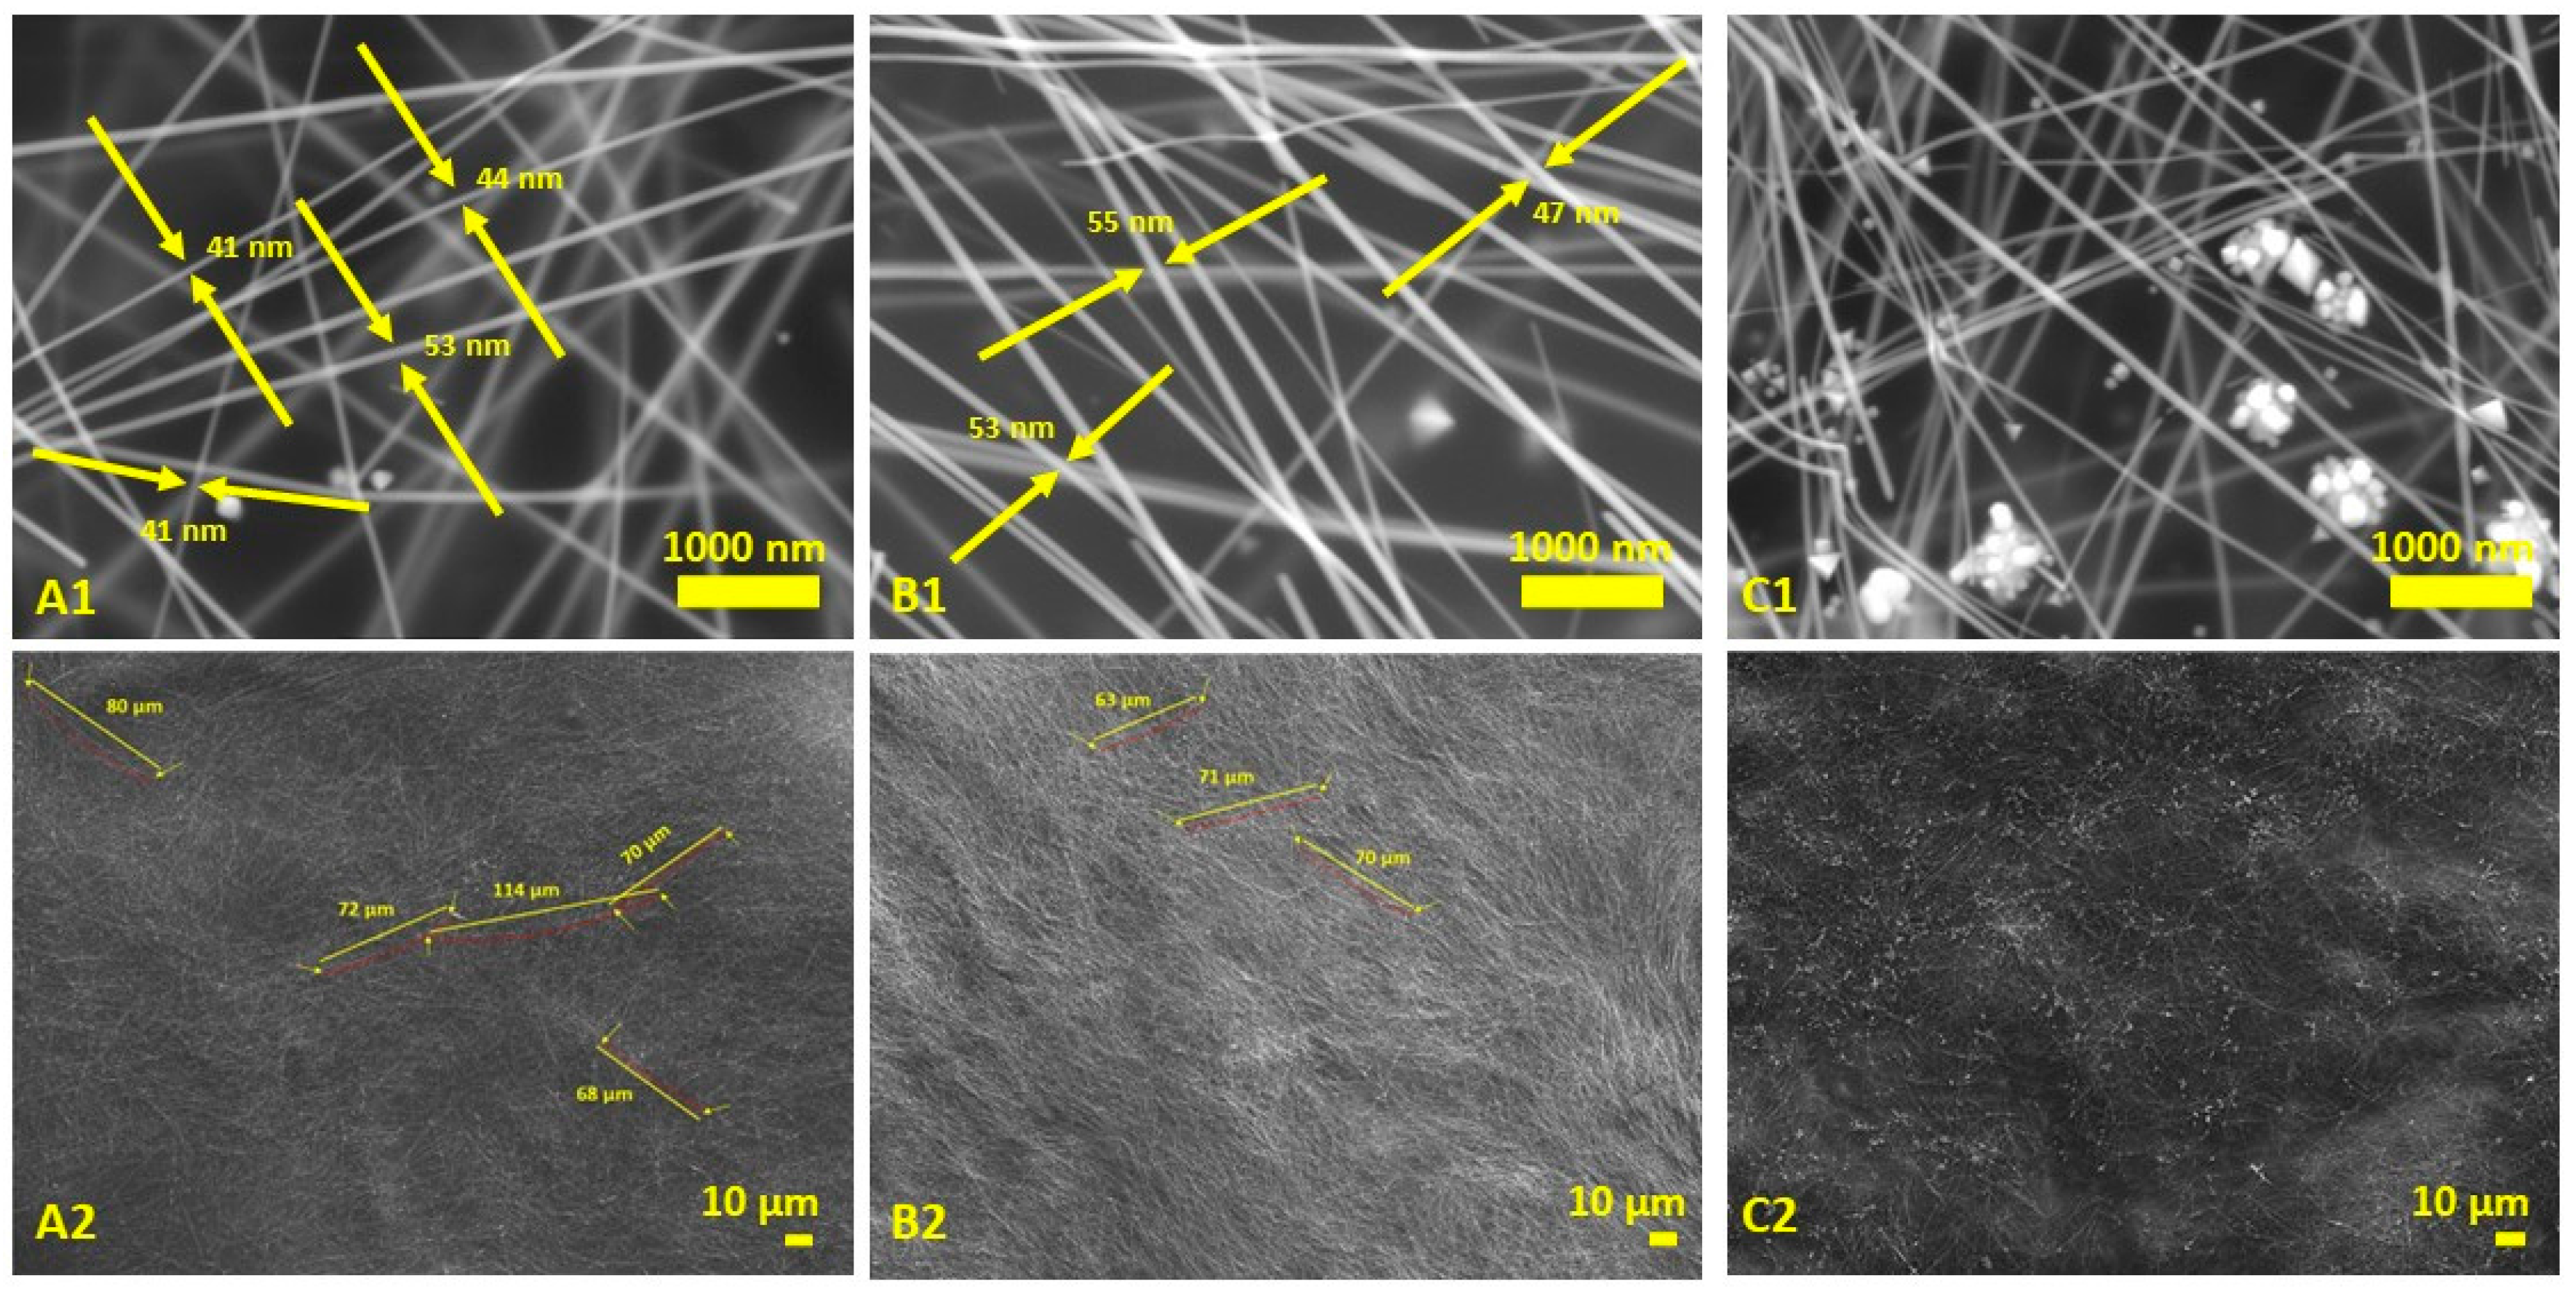
3.2. Entropy, Characterizations, and Analysis

In Section 3.1, the optimal concentration of NaCl to synthesize AgNWs with the most desirable morphology was firstly determined. Following this, the NaCl concentration was held constant to identify the optimal concentration of Fe(NO3)3, and subsequent fixation of concentrations ensued. Subsequently, the optimal concentration of NaBr, in combination with these controlled concentrations of NaCl and Fe(NO3)3, was identified. Although the optimum combinations of nucleant concentrations were determined, an exploration of various combinations was further conducted in this work by selecting three distinct concentrations for each nucleant: NaCl (300 μM, 600 μM, and 900 μM), Fe(NO3)3 (0.75 μM, 1.5 μM, and 2.5 μM), and NaBr (50 μM, 100 μM, and 200 μM), and by following a standard full factorial design of experiment (DOE). Our DOE analysis aimed to identify the individual and joint effect of nucleants on the morphology of AgNWs. Specifically, AgNWs were synthesized using all conceivable mixtures of these concentrations of different nucleants, and their properties, including average length, average diameter, aspect ratio, and average calculated entropy (as explained in Section 2.4), based on five SEM images of each sample with standard deviation (STD), were comprehensively analyzed and are given in Table 1.
As shown in Table 1, we found that samples 10, 11, and 14 exhibit the highest average lengths among the formed AgNWs, measuring 69, 68, and 58 μm, respectively. Notably, all three samples share a commonality with a NaCl concentration of 600 μM. Samples 10 and 11 share an identical Fe(NO3)3 concentration (0.75 μM). However, sample 11, characterized by a higher NaBr concentration, contributed to a great reduction in average diameter and consequently an increase in aspect ratio, as compared to sample 10. A comparison between samples 11 and 14, which share identical NaCl and NaBr concentrations, reveals that 0.75 μM of Fe(NO3)3 has a great effect in decreasing the average diameter and increasing the aspect ratio compared to 1.5 μM of Fe(NO3)3. The findings concerning average length, average diameter, and aspect ratio collectively affirm the accuracy of the optimal nucleant concentrations identified in the preceding section (i.e., the results for sample 11 in Table 1).
As in Table 1, entropy emerges as a pivotal parameter, closely linked to the uniformity of AgNWs and the absence of nanoparticles. As discussed in Section 2.4, a MATLAB-based software toolbox was developed for the automated numerical analysis of SEM images in this study. The outcomes, stratified into three primary categories based on entropy values—below 0.02, between 0.02 and 0.07, and above 0.07—reveal distinct characteristics of the samples: predominantly nanowires, a combination of nanowires and nanoparticles, or predominantly nanoparticles. The tabulated data in Table 1 illustrate that, among the array of synthesized samples, only numbers 4, 10, 11, 12, 14, and 16 exhibit entropy values below 0.02, thus signifying their predominantly AgNW composition. In contrast, the remaining samples exhibit a combination of nanowires and nanoparticles or are predominantly nanoparticles, rendering them unsuitable for AgNW synthesis. The obtained entropy value of sample 11, formulated with 600 μM of NaCl, 0.75 μM of Fe(NO3)3, and 100 μM of NaBr with its high aspect ratio, confirmed that it attains the optimal concentrations of nucleants. This composition fosters the synthesis of AgNWs characterized by the highest aspect ratio, heightened purity of nanowires, and minimized presence of nanoparticles, a noteworthy advancement in the pursuit of efficient AgNW synthesis.
Additionally, Figure 7 provides a visual representation explaining the operational procedure of the software toolbox. Process A (Figure 7) corresponds to a sample synthesized using PVP and AgNO3 without using any nucleants. Consequently, the absence of nanowires was notable, with only nanoparticles formed. The software toolbox initiated its analysis by identifying circular or semi-circular nanoparticles, which were highlighted with red circles. Subsequently, these identified nanoparticles were segregated, reproduced on a black background, and the entropy of the separated image was calculated, yielding a numerical value (0.4088). Higher entropy values were observed for samples with a higher count of nanoparticles.
Process B, as shown in Figure 7, indicates the results of sample 11 in Table 1, which was the optimal sample in our experimental dataset. In this scenario, the software toolbox did not detect nanoparticles, resulting in an entropy value of 0. In addition, process C, involving sample 22 from Table 1, illustrates the toolbox’s ability to detect and segregate nanoparticles from AgNWs. Meanwhile, process D, associated with sample 23, exhibited a higher calculated entropy, which could be attributed to a greater presence of nanoparticles as compared to sample 22 (process C).

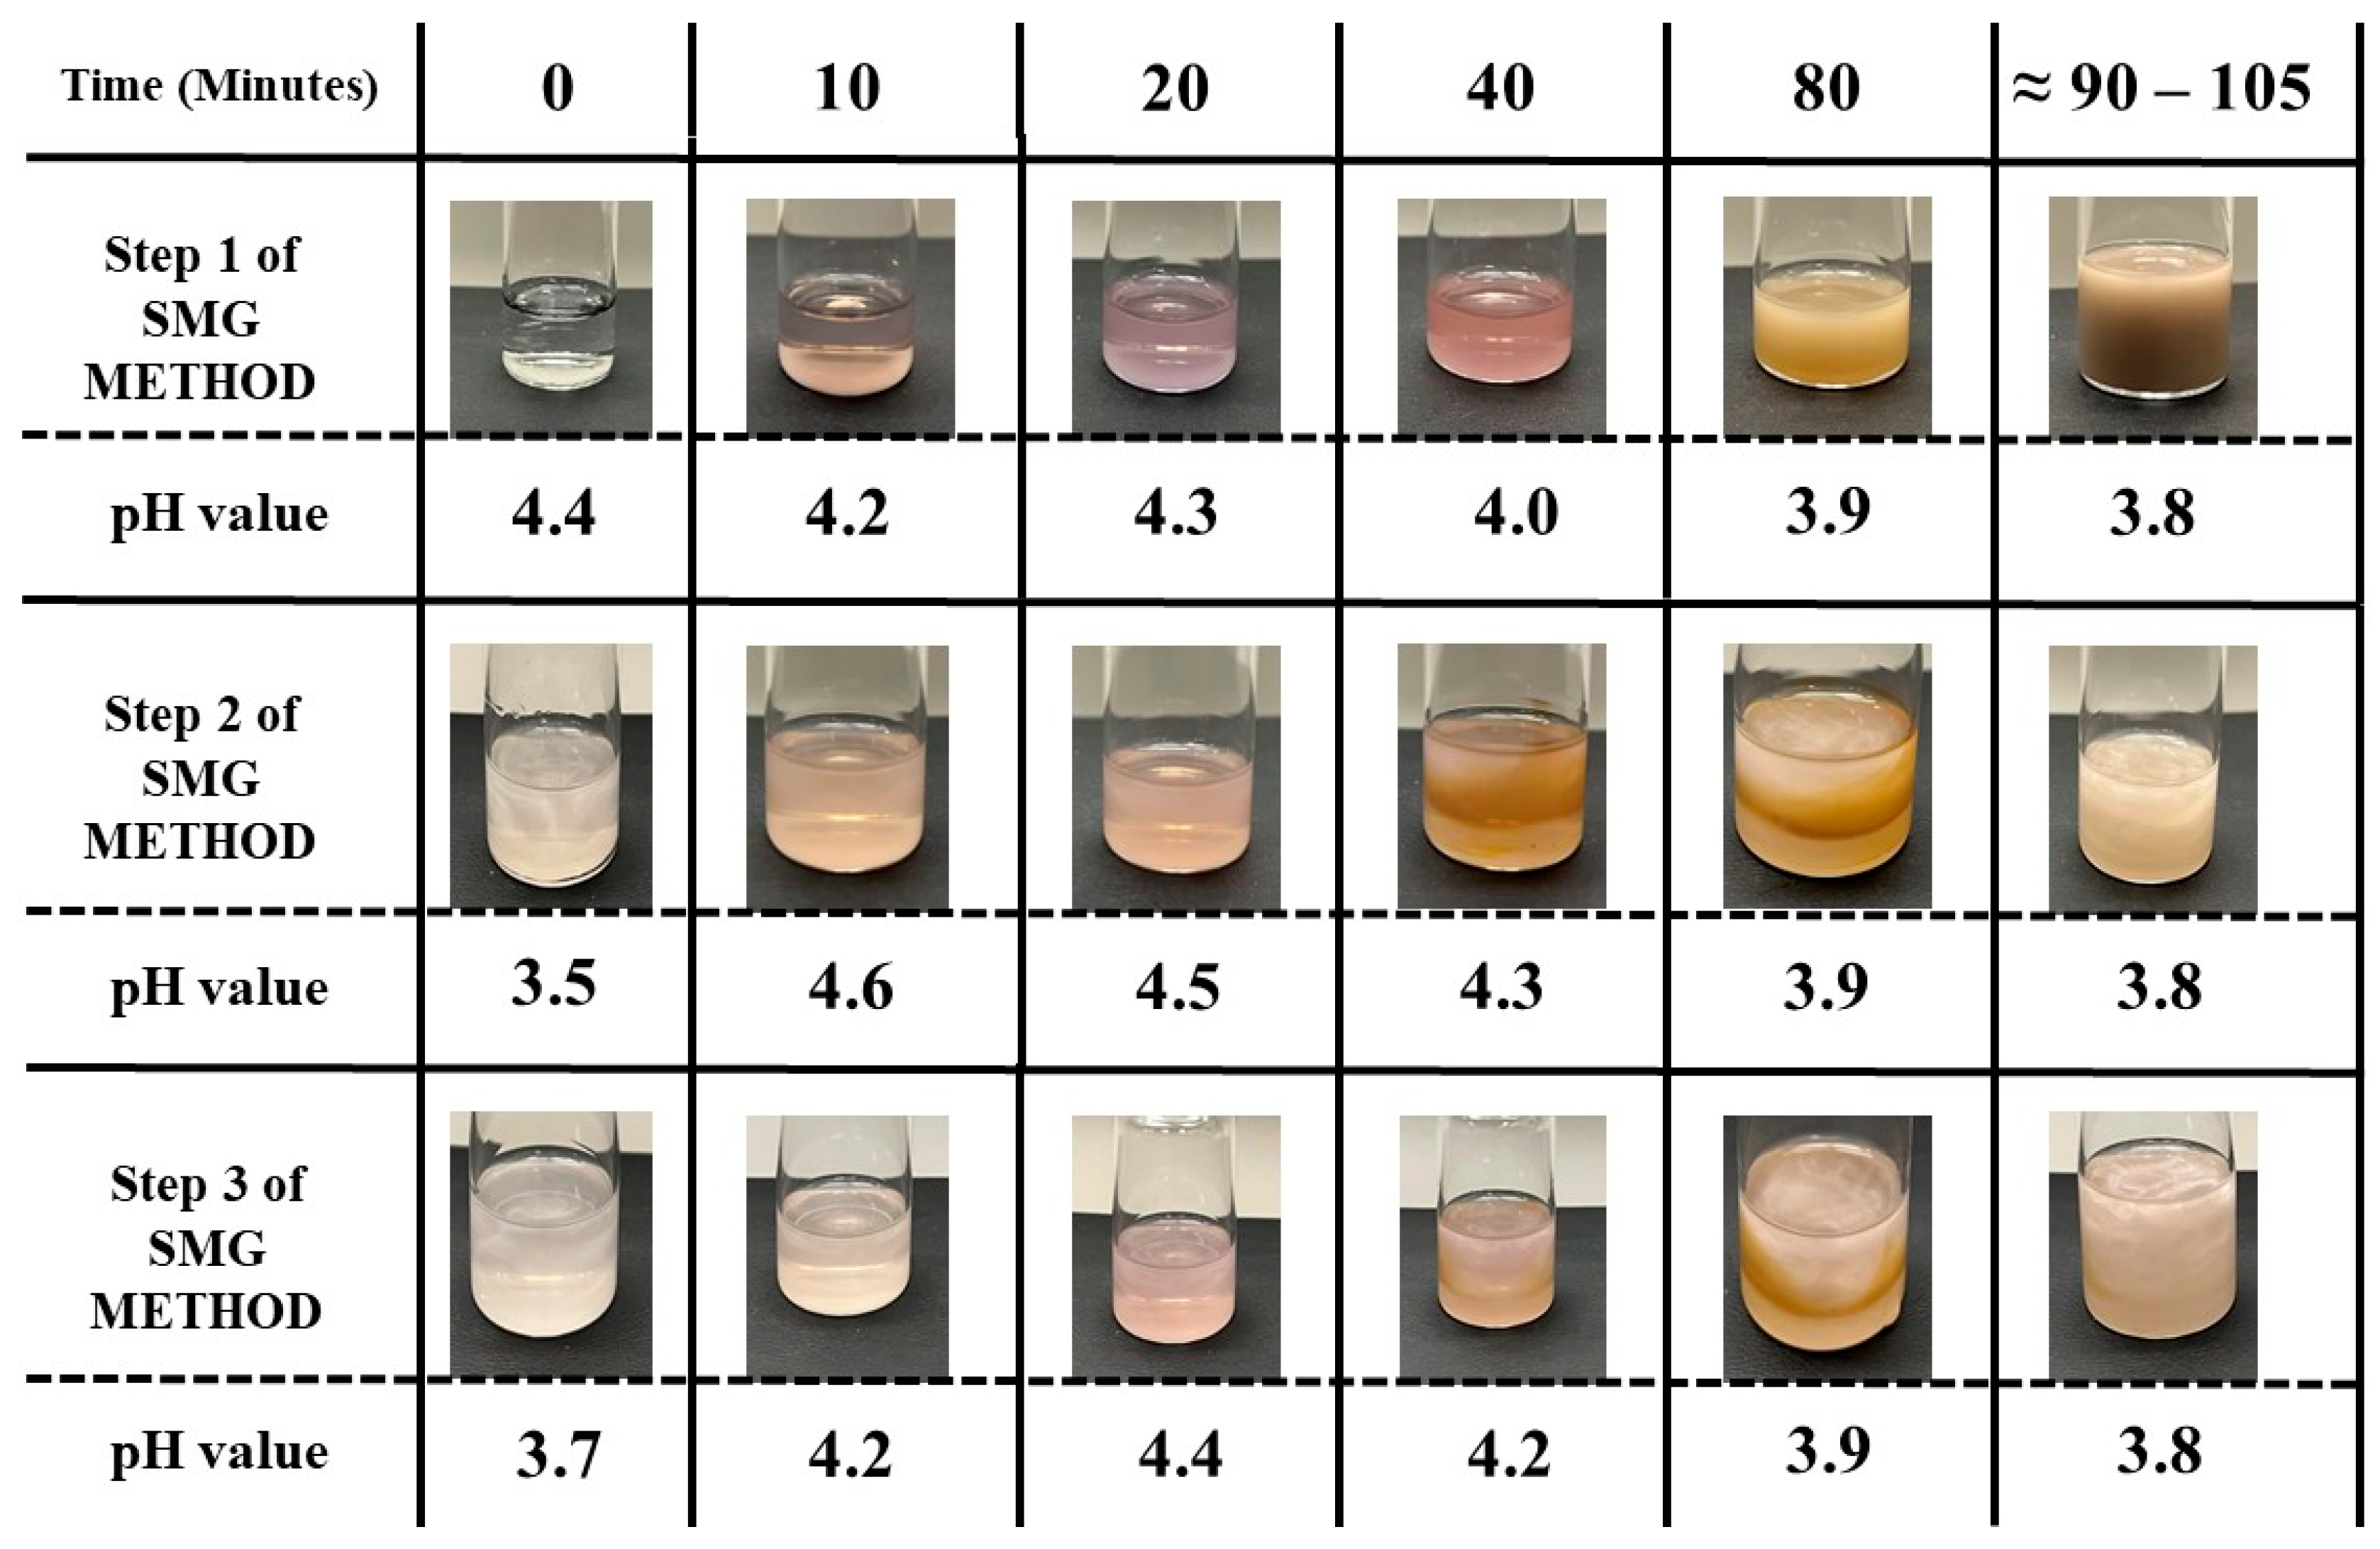
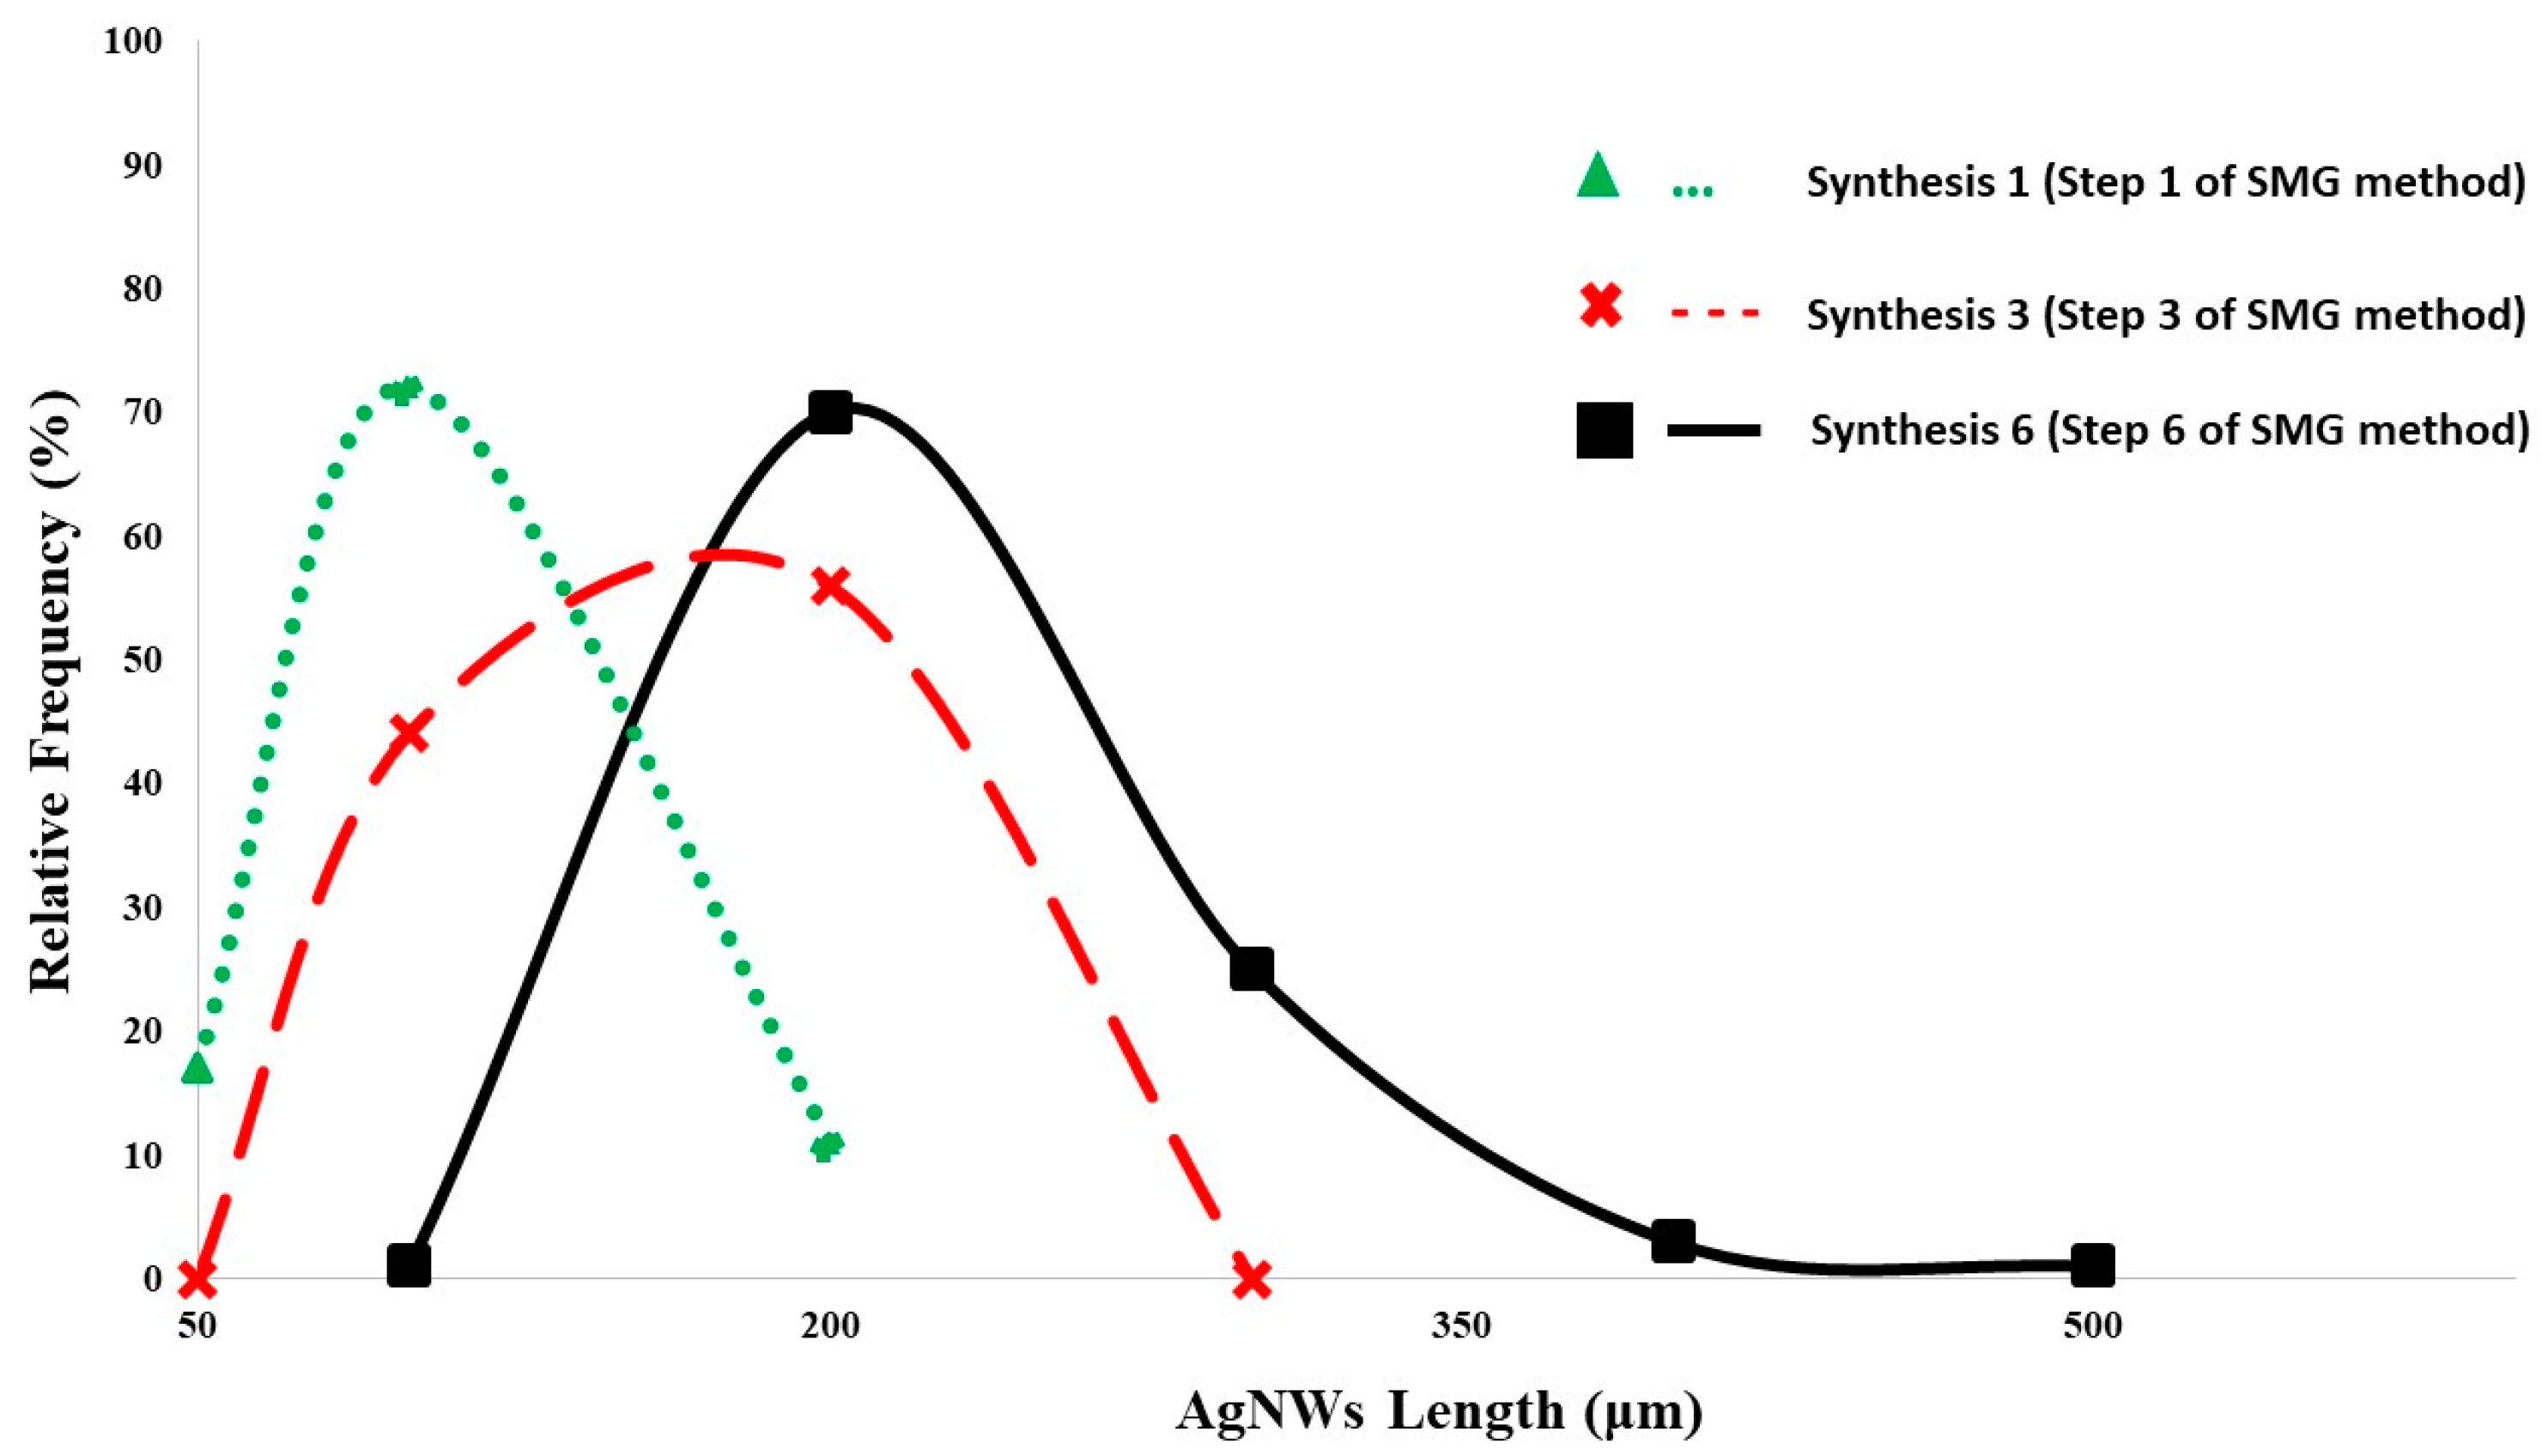
3.3. Successive Multistep Growth

Based on the discussion above, optimal concentrations of NaCl (600 μM), Fe(NO3)3 (0.75 μM), and NaBr (100 μM) were selected to synthesize AgNWs with the highest aspect ratio of 2400. Subsequently, the SMG method was adopted with seven consecutive steps to study the possibility for further improving the average length and aspect ratio. SEM images in Figure 8 show the results of AgNW samples for steps 1, 3, 5, and 6, respectively. In the initial step (Figure 8(A1,A2)), AgNWs were synthesized using the specified nucleant concentrations, resulting in an average length of 68 μm and an average diameter of 29 nm, as discussed in Section 3.2. By the third step (Figure 8(B1,B2)), the average length and diameter increased to 104 μm and 75 nm, respectively. Step 5 (Figure 8(C1,C2)) further enhanced the dimensions, reaching 171 μm and 85 nm for length and diameter, respectively. In the subsequent sixth step (Figure 8(D1,D2)), the highest aspect ratio of 4500 was achieved, with an average length of 178 μm and an average diameter of 40 nm. Although step 7 maintained a similar average diameter to step 6, we found the length was decreased to 123 μm. These findings indicate that performing the SMG method six times maximizes both the average length and aspect ratio. To validate the results, these experiments were repeated thrice. Figure 8(E1,E2) show the length and diameter frequency distribution in steps 1, 3, 5, and 6, respectively.
In addition, our results regarding the diameter of synthesized AgNWs (Figure 8(E2)) showed a significant increase in diameter in steps 3 and 5, followed by a notable decrease in step 6. This pattern can be explained through the processes of seeding and nucleation. Nucleation, a phenomenon where small clusters of atoms or nanoparticles (referred to as “seeds”) form and act as sites for further growth, plays a crucial role in this context [40]. For AgNW synthesis, seeding involves introducing a solution containing previously formed silver nanowires into the reaction mixture. These nanowires act as nucleation sites for the growth of new ones, thus guiding their growth in a specific direction. The presence of pre-formed silver nanowires as seeds influences the alignment and attachment of silver atoms, resulting in the formation of elongated nanowire structures [41], thus leading to an increase in both length and diameter. However, in subsequent processes of the sequential synthesis, a decrease in the diameter of the nanowires is observed. This reduction in diameter can be attributed to the increased quantity of the nucleation agent (as-synthesized nanowires). More nucleation sites are available due to a higher nucleation density, but the quantity of silver ions remains constant. As a result, each individual seed has a reduced amount of material available for further growth, thus leading to the formation of thinner nanowires [25].
To further compare the results from the individual reactions of the successive multistep growth, Figure 9 shows the evolution of the length distribution of AgNWs during the synthesis optimization process from step 1 to step 6. Notably, in the initial step of the SMG method (step 1), the peak of the distribution is approximately 100 μm. Subsequently, at step 3, a discernible shift is evident, with the peak ranging between 150 and 200 μm, indicative of an increase in the average length of AgNWs. Further optimization at step 6 results in another notable shift, thus reflecting a peak where the majority of AgNWs have lengths over 200 μm. Moreover, in step 6, AgNWs with lengths surpassing 400 μm are apparent. This nuanced progression in nanowire length distribution underscores the effectiveness of the SMG method in increasing the length of AgNWs.

4. Conclusions

The impact of varying combinations of Cl (sourced from NaCl), Fe3+ (sourced from Fe(NO3)3), and Br (sourced from NaBr) concentrations on the morphological properties of AgNW was systematically studied. Our experiments, aided by experimental design, allow for the selection of the optimal combinations of nucleants that can be tailored to specific applications, thus ensuring the synthesis of AgNWs with the desired average length, average diameter, and aspect ratio. Using the SMG method on a synthesized AgNW sample led to the formation of AgNWs measuring approximately 180 µm in length and 40 nm in diameter, resulting in an aspect ratio of 4500. For quantitative analysis, a MATLAB-based software toolbox was developed for the automated analysis of SEM images, facilitating the identification of silver nanoparticles and quantitative comparison of synthesized AgNW samples to determine nanoparticles. Furthermore, we introduced pH as an indicator for determining the precise termination indicator of AgNW synthesis, providing an alternative to the traditional color- or time-based methods. These findings provide insights and tools for the precise control and characterization of AgNWs, thus potentially improving their applicability across diverse technological domains.

Supplementary Materials

The following supporting information can be downloaded at: https://www.mdpi.com/article/10.3390/pr12071487/s1, Figure S1. Enlarged images to show synthesized silver nanowires. Figure S2. Enlarged images to show synthesized silver nanowires. Figure S3. Enlarged images to show synthesized silver nanowires.

Author Contributions

Conceptualization, A.N. and Y.D.; methodology, Y.D.; software, A.N.; validation, A.N., M.N. and M.M.; formal analysis, A.N. and Y.D.; investigation, A.N., M.N., M.M. and Y.D.; resources, A.N.; data curation, A.N.; writing—original draft preparation, A.N.; writing—review and editing, D.D. and Y.D.; visualization, A.N.; supervision, Y.D.; project administration, Y.D.; funding acquisition, Y.D. All authors have read and agreed to the published version of the manuscript.

Funding

This research was funded by the National Science Foundation, grant number 2426614 and 2143268.

Data Availability Statement

The raw data supporting the conclusions of this article will be made available from the corresponding author on request.

Conflicts of Interest

The authors declare no conflicts of interest.

References

  1. Jamkhande, P.G.; Ghule, N.W.; Bamer, A.H.; Kalaskar, M.G. Metal nanoparticles synthesis: An overview on methods of preparation, advantages and disadvantages, and applications. J. Drug Deliv. Sci. Technol. 2019, 53, 101174. [Google Scholar] [CrossRef]
  2. Li, Y.; Guo, S.; Yang, H.; Chao, Y.; Jiang, S.; Wang, C. One-step synthesis of ultra-long silver nanowires of over 100 μm and their application in flexible transparent conductive films. RSC Adv. 2018, 8, 8057–8063. [Google Scholar] [CrossRef] [PubMed]
  3. Wang, X.M.; Chen, L.; Sowade, E.; Rodriguez, R.D.; Sheremet, E.; Yu, C.M.; Baumann, R.B.; Chen, J.-J. Ultra-uniform and very thin ag nanowires synthesized via the synergy of cl, br and Fe3+ for transparent conductive films. Nanomaterials 2020, 10, 237. [Google Scholar] [CrossRef] [PubMed]
  4. Li, Y.; Yuan, X.; Yang, H.; Chao, Y.; Guo, S.; Wang, C. One-step synthesis of silver nanowires with ultra-long length and thin diameter to make flexible transparent conductive films. Materials 2019, 12, 401. [Google Scholar] [CrossRef] [PubMed]
  5. Zhu, R.; Chung, C.-H.; Cha, K.C.; Yang, W.; Zheng, Y.B.; Zhou, H.; Song, T.-B.; Chen, C.-C.; Weiss, P.S.; Li, G.; et al. Fused silver nanowires with metal oxide nanoparticles and organic polymers for highly transparent conductors. ACS Nano 2011, 5, 9877–9882. [Google Scholar] [CrossRef]
  6. Chu, X.; Wang, K.; Tao, J.; Li, S.; Ji, S.; Ye, C. Tackling the stability issues of silver nanowire transparent conductive films through FeCl 3 dilute solution treatment. Nanomaterials 2019, 9, 533. [Google Scholar] [CrossRef] [PubMed]
  7. Chen, Z.; Su, X.; Luo, H.; Ade, A.; Zhu, H.; Zhang, Y.; Yu, L. Transparent conductive film of silver nanowires employed for SERS detection of mercury ions. Mater. Chem. Phys. 2023, 309, 128335. [Google Scholar] [CrossRef]
  8. Shi, R.; Lou, Z.; Chen, S.; Shen, G. Flexible and transparent capacitive pressure sensor with patterned microstructured composite rubber dielectric for wearable touch keyboard application. Sci. China Mater. 2018, 61, 1587–1595. [Google Scholar] [CrossRef]
  9. Sun, S.; Maimaitiyiming, X. Silver nanowire/polyacrylamide/gelatin flexible stress, strain and temperature sensor. Colloids Surf. A Physicochem. Eng. Asp. 2023, 675, 131919. [Google Scholar] [CrossRef]
  10. Tu, S.; Ma, Y.; Shi, L.; Li, H.; Chen, M.; Wu, L. Aligned silver Nanowires/Polymer composite films for ultrasensitive and highly stretchable strain sensors. Chem. Eng. J. 2023, 473, 145075. [Google Scholar] [CrossRef]
  11. Koh, E.H.; Mun, C.; Kim, C.; Park, S.-G.; Choi, E.J.; Kim, S.H.; Dang, J.; Choo, J.; Oh, J.-W.; Kim, D.-H.; et al. M13 Bacteriophage/Silver Nanowire Surface-Enhanced Raman Scattering Sensor for Sensitive and Selective Pesticide Detection. ACS Appl. Mater. Interfaces 2018, 10, 10388–10397. [Google Scholar] [CrossRef]
  12. Wang, D.; Hua, H.; Liu, Y.; Tang, H.; Li, Y. Single Ag Nanowire Electrodes and Single Pt@Ag Nanowire Electrodes: Fabrication, Electrocatalysis, and Surface-Enhanced Raman Scattering Applications. Anal. Chem. 2019, 91, 4291–4295. [Google Scholar] [CrossRef] [PubMed]
  13. Liang, X.; Zhao, T.; Jiang, W.; Yu, X.; Hu, Y.; Zhu, P.; Zheng, H.; Sun, R.; Wong, C.-P. Highly transparent triboelectric nanogenerator utilizing in-situ chemically welded silver nanowire network as electrode for mechanical energy harvesting and body motion monitoring. Nano Energy 2019, 59, 508–516. [Google Scholar] [CrossRef]
  14. Kim, S.-W.; Kwon, S.-N.; Na, S.-I. Stretchable and electrically conductive polyurethane- silver/graphene composite fibers prepared by wet-spinning process. Compos. B Eng. 2019, 167, 573–581. [Google Scholar] [CrossRef]
  15. Dudem, B.; Kim, D.H.; Bharat, L.K.; Yu, J.S. Highly-flexible piezoelectric nanogenerators with silver nanowires and barium titanate embedded composite films for mechanical energy harvesting. Appl. Energy 2018, 230, 865–874. [Google Scholar] [CrossRef]
  16. Milano, G.; Pedretti, G.; Montano, K.; Ricci, S.; Hashemkhani, S.; Boarino, L.; Ielmini, D.; Ricciardi, C. In materia reservoir computing with a fully memristive architecture based on self-organizing nanowire networks. Nat. Mater. 2022, 21, 195–202. [Google Scholar] [CrossRef] [PubMed]
  17. Chopin, C.; de Wergifosse, S.; Marchal, N.; Van Velthem, P.; Piraux, L.; Araujo, F.A. Memristive and Tunneling Effects in 3D Interconnected Silver Nanowires. ACS Omega 2023, 8, 6663–6668. [Google Scholar] [CrossRef] [PubMed]
  18. Crêpellière, J.; Menguelti, K.; Wack, S.; Bouton, O.; Gérard, M.; Popa, P.L.; Pistillo, B.R.; Leturcq, R.; Michel, M. Spray Deposition of Silver Nanowires on Large Area Substrates for Transparent Electrodes. ACS Appl. Nano Mater. 2021, 4, 1126–1135. [Google Scholar] [CrossRef]
  19. van Berkel, S.; Klitzke, J.S.; Moradi, M.-A.; Hendrix, M.M.; Schmit, P.; van der Schoot, P.; Schrekker, H.S. Spin-coated highly aligned silver nanowire networks in conductive latex-based thin layer films. Thin Solid Films 2021, 724, 138599. [Google Scholar] [CrossRef]
  20. Sachse, C.; Müller-Meskamp, L.; Bormann, L.; Kim, Y.H.; Lehnert, F.; Philipp, A.; Beyer, B.; Leo, K. Transparent, dip-coated silver nanowire electrodes for small molecule organic solar cells. Org. Electron. 2012, 14, 143–148. [Google Scholar] [CrossRef]
  21. Karimi-Chaleshtori, R.; Nassajpour-Esfahani, A.; Saeri, M.; Rezai, P.; Doostmohammadi, A. Silver nanowire-embedded PDMS with high electrical conductivity: Nanowires synthesis, composite processing and electrical analysis. Mater. Today Chem. 2021, 21, 100496. [Google Scholar] [CrossRef]
  22. Giasafaki, D.; Mitzithra, C.; Belessi, V.; Filippakopoulou, T.; Koutsioukis, A.; Georgakilas, V.; Charalambopoulou, G.; Steriotis, T. Graphene-Based Composites with Silver Nanowires for Electronic Applications. Nanomaterials 2022, 12, 3443. [Google Scholar] [CrossRef] [PubMed]
  23. Tao, A.; Kim, F.; Hess, C.; Goldberger, J.; He, R.; Sun, Y.; Xia, Y.; Yang, P. Langmuir-Blodgett silver nanowire monolayers for molecular sensing using surface-enhanced Raman spectroscopy. Nano Lett. 2003, 3, 1229–1233. [Google Scholar] [CrossRef]
  24. Lagrange, M.; Langley, D.P.; Giusti, G.; Jiménez, C.; Bréchet, Y.; Bellet, D. Optimization of silver nanowire-based transparent electrodes: Effects of density, size and thermal annealing. Nanoscale 2015, 7, 17410–17423. [Google Scholar] [CrossRef] [PubMed]
  25. Bergin, S.M.; Chen, Y.-H.; Rathmell, A.R.; Charbonneau, P.; Li, Z.-Y.; Wiley, B.J. The effect of nanowire length and diameter on the properties of transparent, conducting nanowire films. Nanoscale 2012, 4, 1996–2004. [Google Scholar] [CrossRef] [PubMed]
  26. Kumar, A.; Shaikh, M.O.; Chuang, C.-H. Silver nanowire synthesis and strategies for fabricating transparent conducting electrodes. Nanomaterials 2021, 11, 693. [Google Scholar] [CrossRef]
  27. Ha, H.; Amicucci, C.; Matteini, P.; Hwang, B. Mini review of synthesis strategies of silver nanowires and their applications. Colloid Interface Sci. Commun. 2022, 50, 100663. [Google Scholar] [CrossRef]
  28. Wang, C.; Cheng, B.; Zhang, H.; Wan, P.; Luo, L.; Kuang, Y.; Sun, X. Probing the seeded protocol for high-concentration preparation of silver nanowires. Nano Res. 2016, 9, 1532–1542. [Google Scholar] [CrossRef]
  29. Zhang, P.; Wyman, I.; Hu, J.; Lin, S.; Zhong, Z.; Tu, Y.; Huang, Z.; Wei, Y. Silver nanowires: Synthesis technologies, growth mechanism and multifunctional applications. Mater. Sci. Eng. B 2017, 223, 1–23. [Google Scholar] [CrossRef]
  30. Li, Y.; Yuan, X.; Yang, H.; Chao, Y.; Guo, S.; Wang, C. Solvothermal synthesis of ultra-fine silver nanowires with a diameter about 20 nm and an aspect ratio approximately 2000 for highly conductive flexible transparent film. J. Mater. Sci. Mater. Electron. 2019, 30, 8883–8891. [Google Scholar] [CrossRef]
  31. Chen, D.; Qiao, X.; Qiu, X.; Chen, J.; Jiang, R. Convenient synthesis of silver nanowires with adjustable diameters via a solvothermal method. J. Colloid Interface Sci. 2010, 344, 286–291. [Google Scholar] [CrossRef] [PubMed]
  32. Lee, J.; Lee, P.; Lee, H.; Lee, D.; Lee, S.S.; Ko, S.H. Very long Ag nanowire synthesis and its application in a highly transparent, conductive and flexible metal electrode touch panel. Nanoscale 2012, 4, 6408–6414. [Google Scholar] [CrossRef] [PubMed]
  33. Wiley, B.J.; Xiong, Y.; Li, Z.-Y.; Yin, Y.; Xia, Y. Right bipyramids of silver: A new shape derived from single twinned seeds. Nano Lett. 2006, 6, 765–768. [Google Scholar] [CrossRef] [PubMed]
  34. Steeg, E.; Kirmse, H.; Rabe, J.; Kirstein, S. Silver iodide nanowires grown within tubular J-aggregates. J. Colloid Interface Sci. 2018, 530, 424–432. [Google Scholar] [CrossRef] [PubMed]
  35. Shin, H.S.; Yang, H.J.; Bin Kim, S.; Lee, M.S. Mechanism of growth of colloidal silver nanoparticles stabilized by polyvinyl pyrrolidone in γ-irradiated silver nitrate solution. J. Colloid Interface Sci. 2004, 274, 89–94. [Google Scholar] [CrossRef]
  36. Whitcomb, D.R.; Clapp, A.R.; Bühlmann, P.; Blinn, J.C.; Zhang, J. New Perspectives on Silver Nanowire Formation from Dynamic Silver Ion Concentration Monitoring and Nitric Oxide Production in the Polyol Process. Cryst. Growth Des. 2016, 16, 1861–1868. [Google Scholar] [CrossRef]
  37. Coskun, S.; Aksoy, B.; Unalan, H.E. Polyol synthesis of silver nanowires: An extensive parametric study. Cryst. Growth Des. 2011, 11, 4963–4969. [Google Scholar] [CrossRef]
  38. Ma, J.; Zhan, M. Rapid production of silver nanowires based on high concentration of AgNO3 precursor and use of FeCl3 as reaction promoter. RSC Adv. 2014, 4, 21060–21071. [Google Scholar] [CrossRef]
  39. Schuette, W.M.; Buhro, W.E. Silver chloride as a heterogeneous nucleant for the growth of silver nanowires. ACS Nano 2013, 7, 3844–3853. [Google Scholar] [CrossRef]
  40. Wu, K.-J.; Tse, E.C.; Shang, C.; Guo, Z. Nucleation and growth in solution synthesis of nanostructures—From fundamentals to advanced applications. Prog. Mater. Sci. 2022, 123, 100821. [Google Scholar] [CrossRef]
  41. Lin, J.-Y.; Hsueh, Y.-L.; Huang, J.-J.; Wu, J.-R. Effect of silver nitrate concentration of silver nanowires synthesized using a polyol method and their application as transparent conductive films. Thin Solid Films 2015, 584, 243–247. [Google Scholar] [CrossRef]
Figure 1. Step 1: PVP (23.0 mmol) was dissolved in 70 mL of EG. Simultaneously, AgNO3 (3.0 mmol) and nucleants were dissolved in separate EG solutions (10 mL and 20 mL, respectively) and these solutions were mixed. Step 2: The mixture was placed in a preheated vacuum oven at 150 °C for 90 min. Step 3: After cooling, AgNWs were harvested through centrifugation and dispersed in ethanol. Step 4: 10 mL of the solution was separated for subsequent reactions and combined with the same amount of AgNO3, nucleants, and PVP solution to synthesize longer AgNWs in further growth phases.
Processes 12 01487 g001
Figure 2. The pH measurements were collected for the first three steps of the SMG method. In step 1, the initial solution comprising PVP, AgNO3, and nucleants had a pH value of 4.4. Throughout the experiments, the pH gradually decreased, reaching 3.8. In step 2, the introduction of a small amount of synthesized AgNWs from the previous batch caused a decrease in pH to 3.5. However, upon commencing the experiment, the pH began to increase in the first 20 min, followed by a gradual decrease. Similar to step 1, the pH value reached 3.8 when the experiment was concluded and AgNWs were formed. The same pattern was observed in step 3 of the SMG method. The addition of synthesized AgNWs from the previous batch led to a decrease in pH. However, as soon as the experiments commenced, the pH value increased for the first 20 min before gradually decreasing and stabilized at 3.8 in our experiments. For all experiments, the solutions were kept inside the oven for an additional 15 min after reaching an opaque gray color (i.e., approximately 90 min into the experiments). During this time, pH measurements were taken two more times. In all instances, the pH remained stable at 3.8.
Processes 12 01487 g002
Figure 3. The flowchart illustrates the step-by-step image analysis for which the MATLAB code detects nanoparticles in SEM images, separates them, and calculates the entropy value to quantify the quality of materials synthesized using reconstructed images.
Processes 12 01487 g003
Figure 4. SEM images of AgNWs synthesized with different concentrations of NaCl (AE) and CuCl2 (F). The amount of NaCl is 0 μM (A1,A2), 300 μM (B1,B2), 600 μM (C1,C2), 900 μM (D1,D2) and 1200 μM (E1,E2), respectively. (F1,F2) show the SEM images of synthesized AgNWs with CuCl2.
Processes 12 01487 g004
Figure 5. SEM images of AgNWs synthesized with 600 μM of NaCl in combination with 0.75 μM (A1,A2), 1.5 μM (B1,B2), and 2.5 μM (C1,C2) of Fe(NO3)3, respectively. (Due to the high density of the produced silver nanowires, the nanowires chosen to demonstrate length (A2,B2) are marked with yellow lines and red dashes. In addition, for better clarity, two ends of each AgNW are shown with yellow arrows. Figure S1 in supplementary file shows enlarged (A2,B2)).
Processes 12 01487 g005
Figure 6. SEM images of AgNWs synthesized with 600 μM of NaCl, 0.75 μM of Fe(NO3)3, and 50 μM (A1,A2), 100 μM (B1,B2) and 200 μM (C1,C2) of NaBr. Length (D1) and diameter (D2) frequency distributions of AgNWs synthesized using NaCl alone, NaCl + Fe(NO3)3, and NaCl + Fe(NO3)3 + NaBr. (Due to the high density of the produced silver nanowires, the nanowires chosen to demonstrate length (A2,B2,C2) are marked with yellow lines and red dashes. In addition, for better clarity, two ends of each AgNW are shown with yellow arrows. Figure S2 in supplementary file shows enlarged (A2,B2,C2)).
Processes 12 01487 g006
Figure 7. The process of detecting circular silver nanoparticles, separating them, and reprinting them on a black screen using the developed software toolbox for samples containing 0 μM of NaCl, 0 μM of Fe(NO3)3 and 0 μM of NaBr (A), 600 μM of NaCl, 0.75 μM of Fe(NO3)3 and 100 μM of NaBr (B), 900 μM of NaCl, 1.5 μM of Fe(NO3)3 and 50 μM of NaBr (C) and 900 μM of NaCl, 1.5 μM of Fe(NO3)3 and 100 μM of NaBr (D) which were randomly selected from all synthesized samples in our experiments to demonstrate how the toolbox works.
Processes 12 01487 g007
Figure 8. SEM images of AgNWs synthesized with 600 μM of NaCl, 0.75 μM of Fe(NO3)3, and 100 μM of NaBr via SMG method at steps 1 (A1,A2), 3 (B1,B2), 5 (C1,C2) and 6 (D1,D2). Length (E1) and diameter (E2) frequency distributions of AgNWs synthesized in the mentioned steps. (Due to the high density of the produced silver nanowires, the nanowires chosen to demonstrate length (A2,B2,C2,D2) are marked with yellow lines and red dashes. In addition, for better clarity, two ends of each AgNW are shown with yellow arrows. Figure S3 in supplementary file shows enlarged (A2,B2,C2,D2)).
Processes 12 01487 g008
Figure 9. The evolution of the length distribution of AgNWs throughout the SMG method, spanning from the initial step to the sixth step.
Processes 12 01487 g009
Table 1. Average length, average diameter, aspect ratio, and average calculated entropy (with standard deviation) of all conceivable mixtures of different concentrations of NaCl, Fe(NO3)3 and NaBr.
DOE
No.
NaCl (µM)Fe(NO3)3 (µM)NaBr (µM)Length (µm)Diameter (nm)Aspect
Ratio
EntropyEntropy (STD)
13000.7550403611000.08980.0127
23000.7510032398000.05850.0104
33000.7520019229000.08430.0137
43001.550454410000.00810.0060
53001.5100403113000.06950.0088
63001.5200262610000.09680.0003
73002.55025377000.05810.0133
83002.5100363012000.05510.0123
93002.520018247500.09010.0176
106000.7550694914000.01190.0043
116000.75100682924000.00750.0062
126000.75200442915000.01410.0067
136001.55037448500.08780.0243
146001.5100584214000.00770.0031
156001.5200383610000.06190.0236
166002.55041479000.01510.0060
176002.5100504611000.05810.0072
186002.5200413711000.06340.0178
199000.755027495500.07290.0153
209000.75100464211000.05250.0083
219000.75200464011500.11640.0168
229001.55033438000.06290.0122
239001.510039439000.07810.0223
249001.5200483613000.10460.0088
259002.55032496500.07980.0168
269002.510030358500.06920.0071
279002.5200373810000.08370.0091
Disclaimer/Publisher’s Note: The statements, opinions and data contained in all publications are solely those of the individual author(s) and contributor(s) and not of MDPI and/or the editor(s). MDPI and/or the editor(s) disclaim responsibility for any injury to people or property resulting from any ideas, methods, instructions or products referred to in the content.

