Article

The Research on Microwave Drying Characteristics of Polyethylene Terephthalate Materials Based on Frequency and Power Tuning Technology

1
School of Electronics and Information Engineering, Sichuan University, Chengdu 610064, China
2
Yibin Industrial Technology Research Institute of Sichuan University, Yibin 644000, China
3
Sichuan Yibin Plastic Packaging Materials Co., Ltd., Yibin 644007, China
*
Authors to whom correspondence should be addressed.
Processes 2024, 12(7), 1488; https://doi.org/10.3390/pr12071488
Submission received: 16 June 2024 / Revised: 3 July 2024 / Accepted: 12 July 2024 / Published: 16 July 2024
(This article belongs to the Special Issue Microwave Applications in Chemistry and Industry)

Abstract

:
Polyethylene Terephthalate (PET), renowned for its exceptional physical and chemical properties, finds widespread use in our daily lives. However, conventional PET drying methods are time consuming and energy intensive. Leveraging microwave heating effects, we investigated drying characteristics concerning both microwave parameters and PET permittivity. The PET permittivity variation during heating is related to the microwave reflection at the incident port. Our innovative approach involves frequency and power tuning based on reflection. This method not only significantly improved heating uniformity and reduced temperature covariance (COVT) but also led to a more uniformly distributed temperature profile and a drastic reduction in energy consumption. Integrating precise and rapid frequency tuning, we compared our method’s efficiency with traditional approaches, revealing an impressive time savings of 2 h and an energy consumption limited to approximately less than 3 kWh/kg. Notably, our laboratory system’s logistic models of the Moisture Ratio (MR) related to rotary rates, masses, and powers whose averages of R-square are 0.9972, 0.9982, and 0.9977, respectively, which provide intriguing insights for industrial production forecasts during variable frequency PET drying.

1. Introduction

Drying plays a vital role in various industries, such as food processes, pharmaceuticals, and materials. In the packaging industry, especially with the growth in bottle markets, ensuring large-scale and high-quality production has become significant [1]. Microwave drying offers more advantages than traditional methods, i.e., less energy consumption, higher efficiency, and higher flexibility, because it transfers directly to the interior of materials, which has less path loss than drying processes using coal, electricity, or other fuels. However, microwaves need a balance between energy efficiency and thermal runaway. Due to the permittivity related to the moisture content (MC) and temperature, there is a sudden and intense rise, known as thermal runaway, which leads to melting, damage, or carbonization at a very low moisture content [2].
The solid-state generator (SSG) is an alternative source for microwave drying and has many advantages. The SSG precisely controls parameters such as frequency, power, and phase shift over time to improve uniformity and efficiency. In intelligent control systems, the SSG paves the way for a shift towards real-time control [3]. The superiority of magnetrons in industrial applications is inexpensive. However, non-uniform energy distribution will cause a higher consumption [4]. Studies by Robinson et al. have explored the system of solid-state power to enhance uniformity and efficiency, demonstrating that a frequency swept linearly from 2.25 to 2.65 GHz can improve the uniformity for paper loading in waste materials heating [5]. Additionally, complementary frequency heating strategies have been investigated, which use a frequency adjustment method to enhance heating uniformity. Comparisons between the sweeping frequency and the complementary frequency have shown that the latter allowed for efficiency and uniformity [6]. The frequency adjustment method has also been studied to improve the uniformity of temperature compared with the fixed-frequency cases [7,8]. Compared to magnetrons, SSGs are essential devices in microwave industry applications. Studies by C. Liu et al. have highlighted that the magnetron output characteristics were improved by a novel active distortion eliminator, which may be applied to drying [9]. Furthermore, for medical cannabis inflorescence drying, the multiple frequency-phase combination states of SSGs have enabled the control and prediction of moisture levels, which significantly reduced drying time from several days to a few hours when secondary metabolite compositions were preserved more than the traditional drying methods [10]. Those studies underscore that the real-time and selective control by the SSG can facilitate the development of microwave applications, which also showcased potential effects on enhancing efficiency and stability.
In 2019, PETs were the most widely utilized material for packaging, and it commanded a market value of USD 43.81 billion. It will arrive at a robust compound annual growth rate of 11%, about USD 68.33 billion, by 2023. PETs accounted for 8% of the yearly polymer production in 2021 [11]. PETs offer numerous advantages, including high transparency, reflectiveness, easy processing, and relatively lower cost, making it an especially appealing polymer and one of the most utilized materials in packaging applications [12]. Efficient drying of PETs is crucial as it directly impacts quality and yield before PETs can be molded into bottles or films. Hence, integrating microwave technology into the PET drying processes can meet manufacturing requirements for bottles, food packages, medical productions, and more.
To the best of our knowledge, no research has yet delved into elucidating the temperature and the MC variations of PETs based on microwave frequency and power tuning. Unlike traditional drying methods, temperature monitoring aims to forestall the occurrence of thermal runaway to ensure rapid and stable drying. It is particularly crucial to study the permittivity of PETs when the permittivity varies from a state of poor absorption capacity to a stronger one, which is attributed to the removal of water and the attainment of a threshold temperature. PET’s permittivity and the SSG’s microwave parameters played a significant role in the drying processes within the chamber. When numerous studies have addressed drying kinetics for fruits, foods, and vegetables [13,14,15,16], there has been a notable absence of research on polymer drying utilizing the SSGs. Therefore, the investigations on technology and characteristics of PETs based on microwave drying represent a significant gap between experiments and applications, which urgently needs to be settled in industry applications.
This study presents the tuning technology that involves the variations of microwave parameters over time to establish a relationship between the drying characteristics and microwave parameters for PET microwave drying. Filling in the gaps of PET microwave drying, we developed a laboratory-scale system to characterize the variations in the temperature and the MC based on microwave frequency and power tuning methods. Additionally, we gathered electricity consumption statistics to assess energy-saving levels. The microwave power was delivered through four coaxial waveguides fed by probes, introducing the spatial combination power inside the metal shield cavity. Subsequently, through numerous experiments, we investigated the comparisons of variable spatial distributions for different channels, which focused on evaluating the uniformity improvement and regularity prediction of PET microwave drying.

2. Microwave System Design

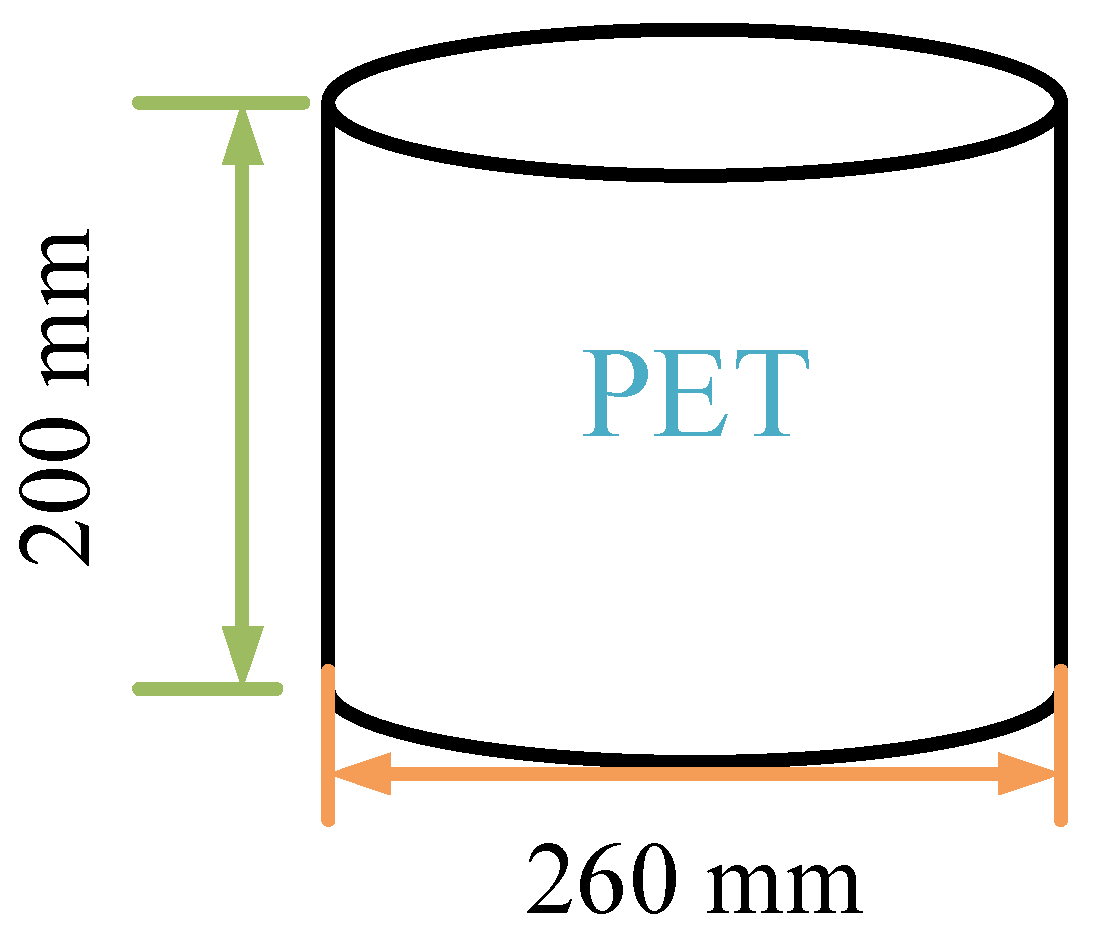
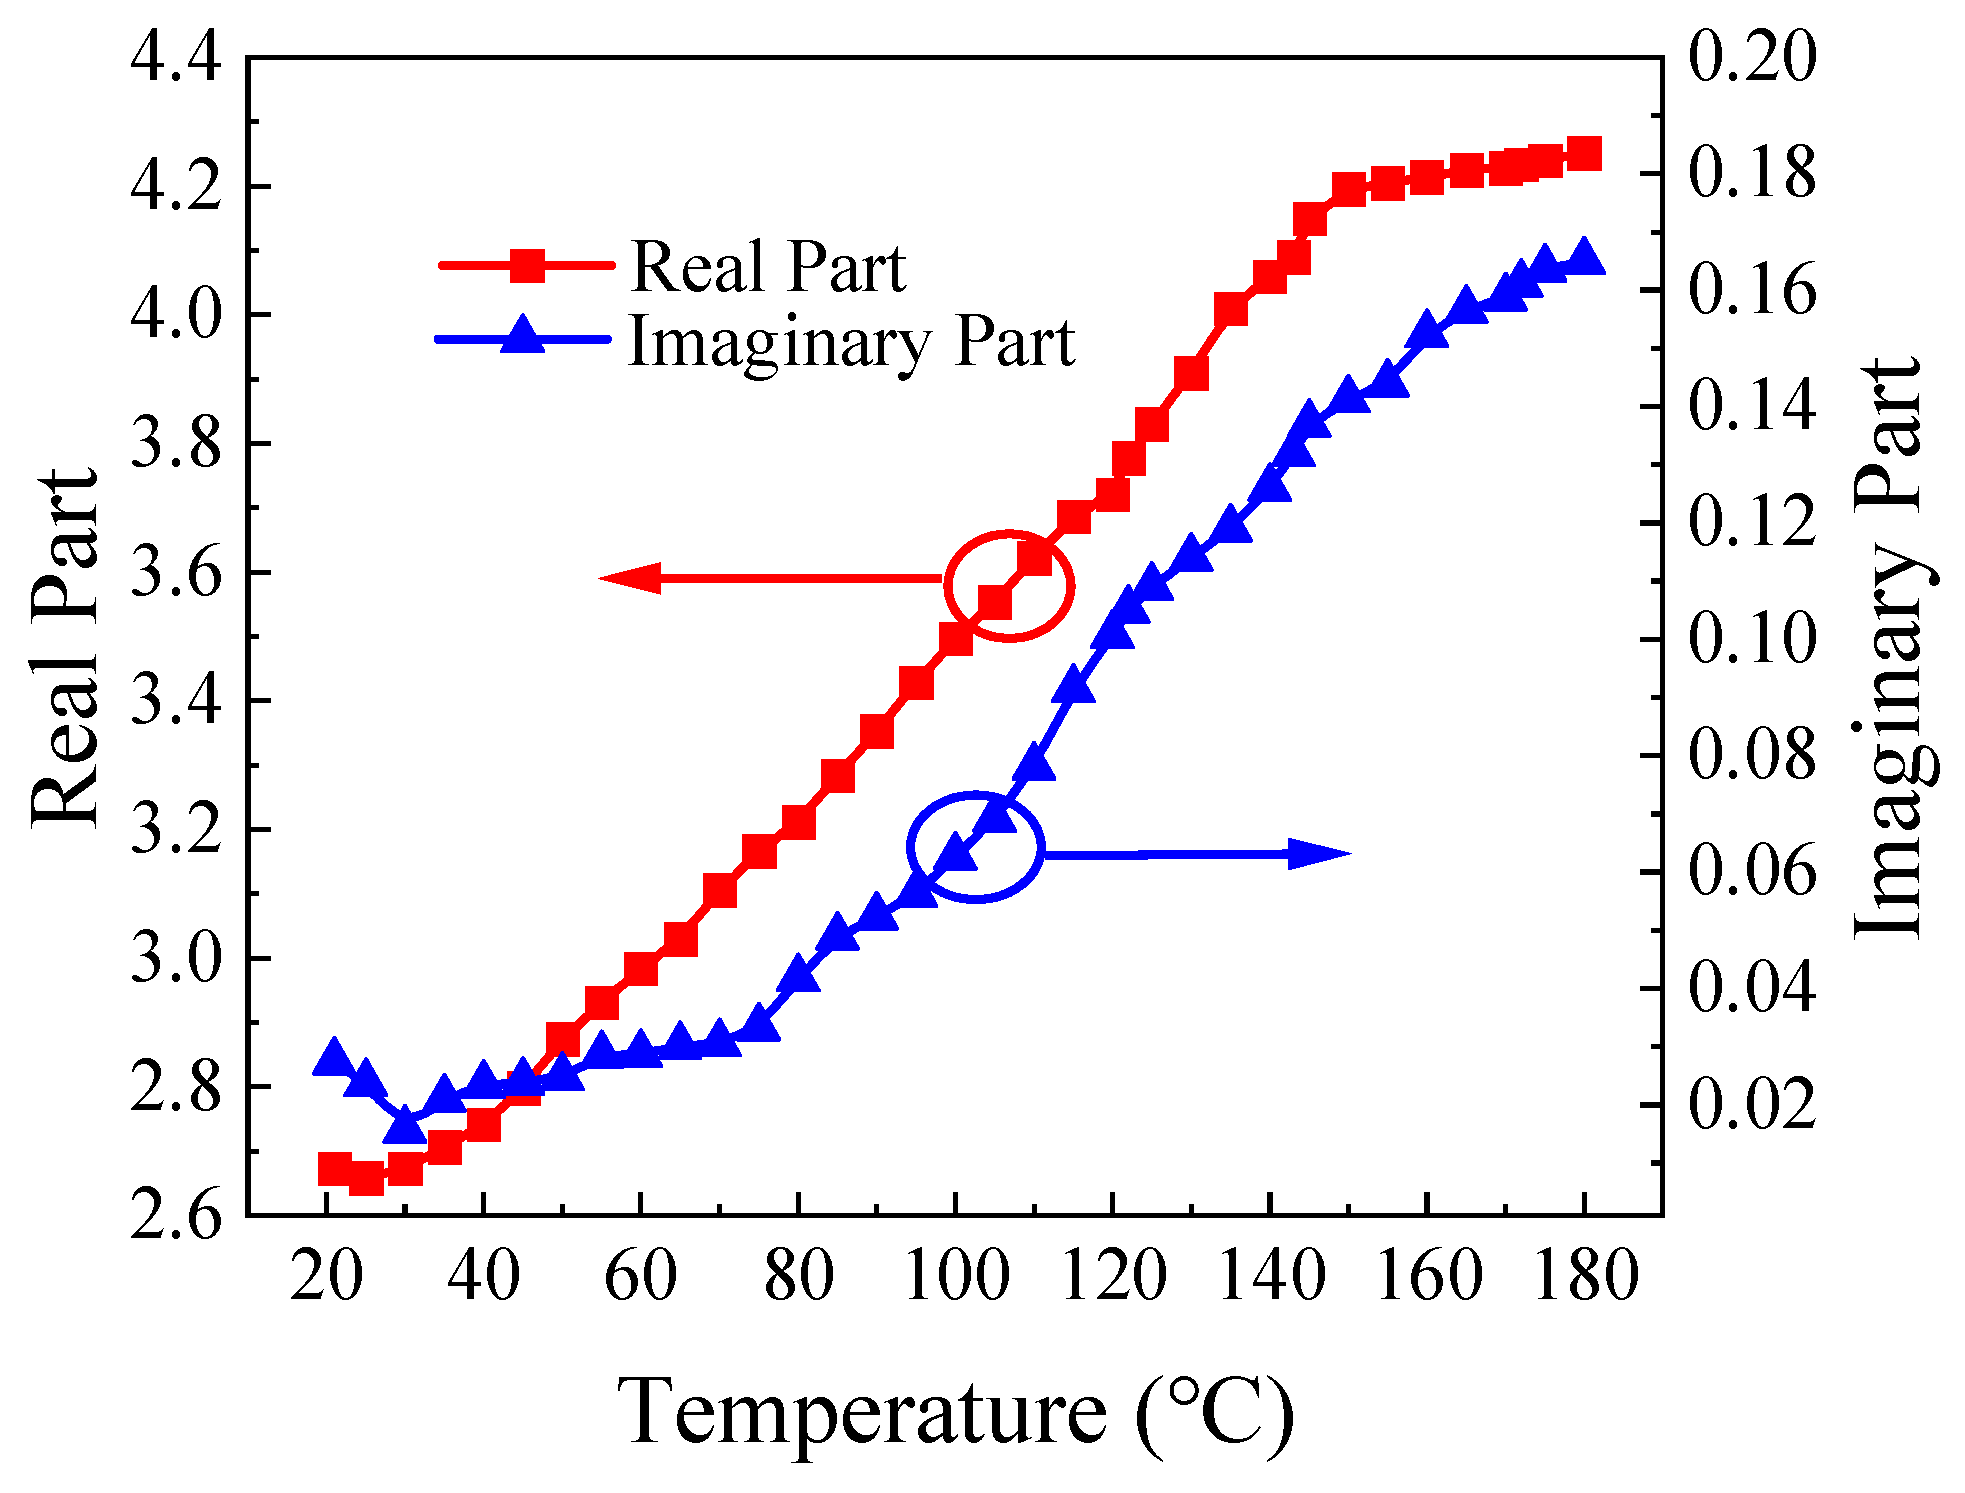
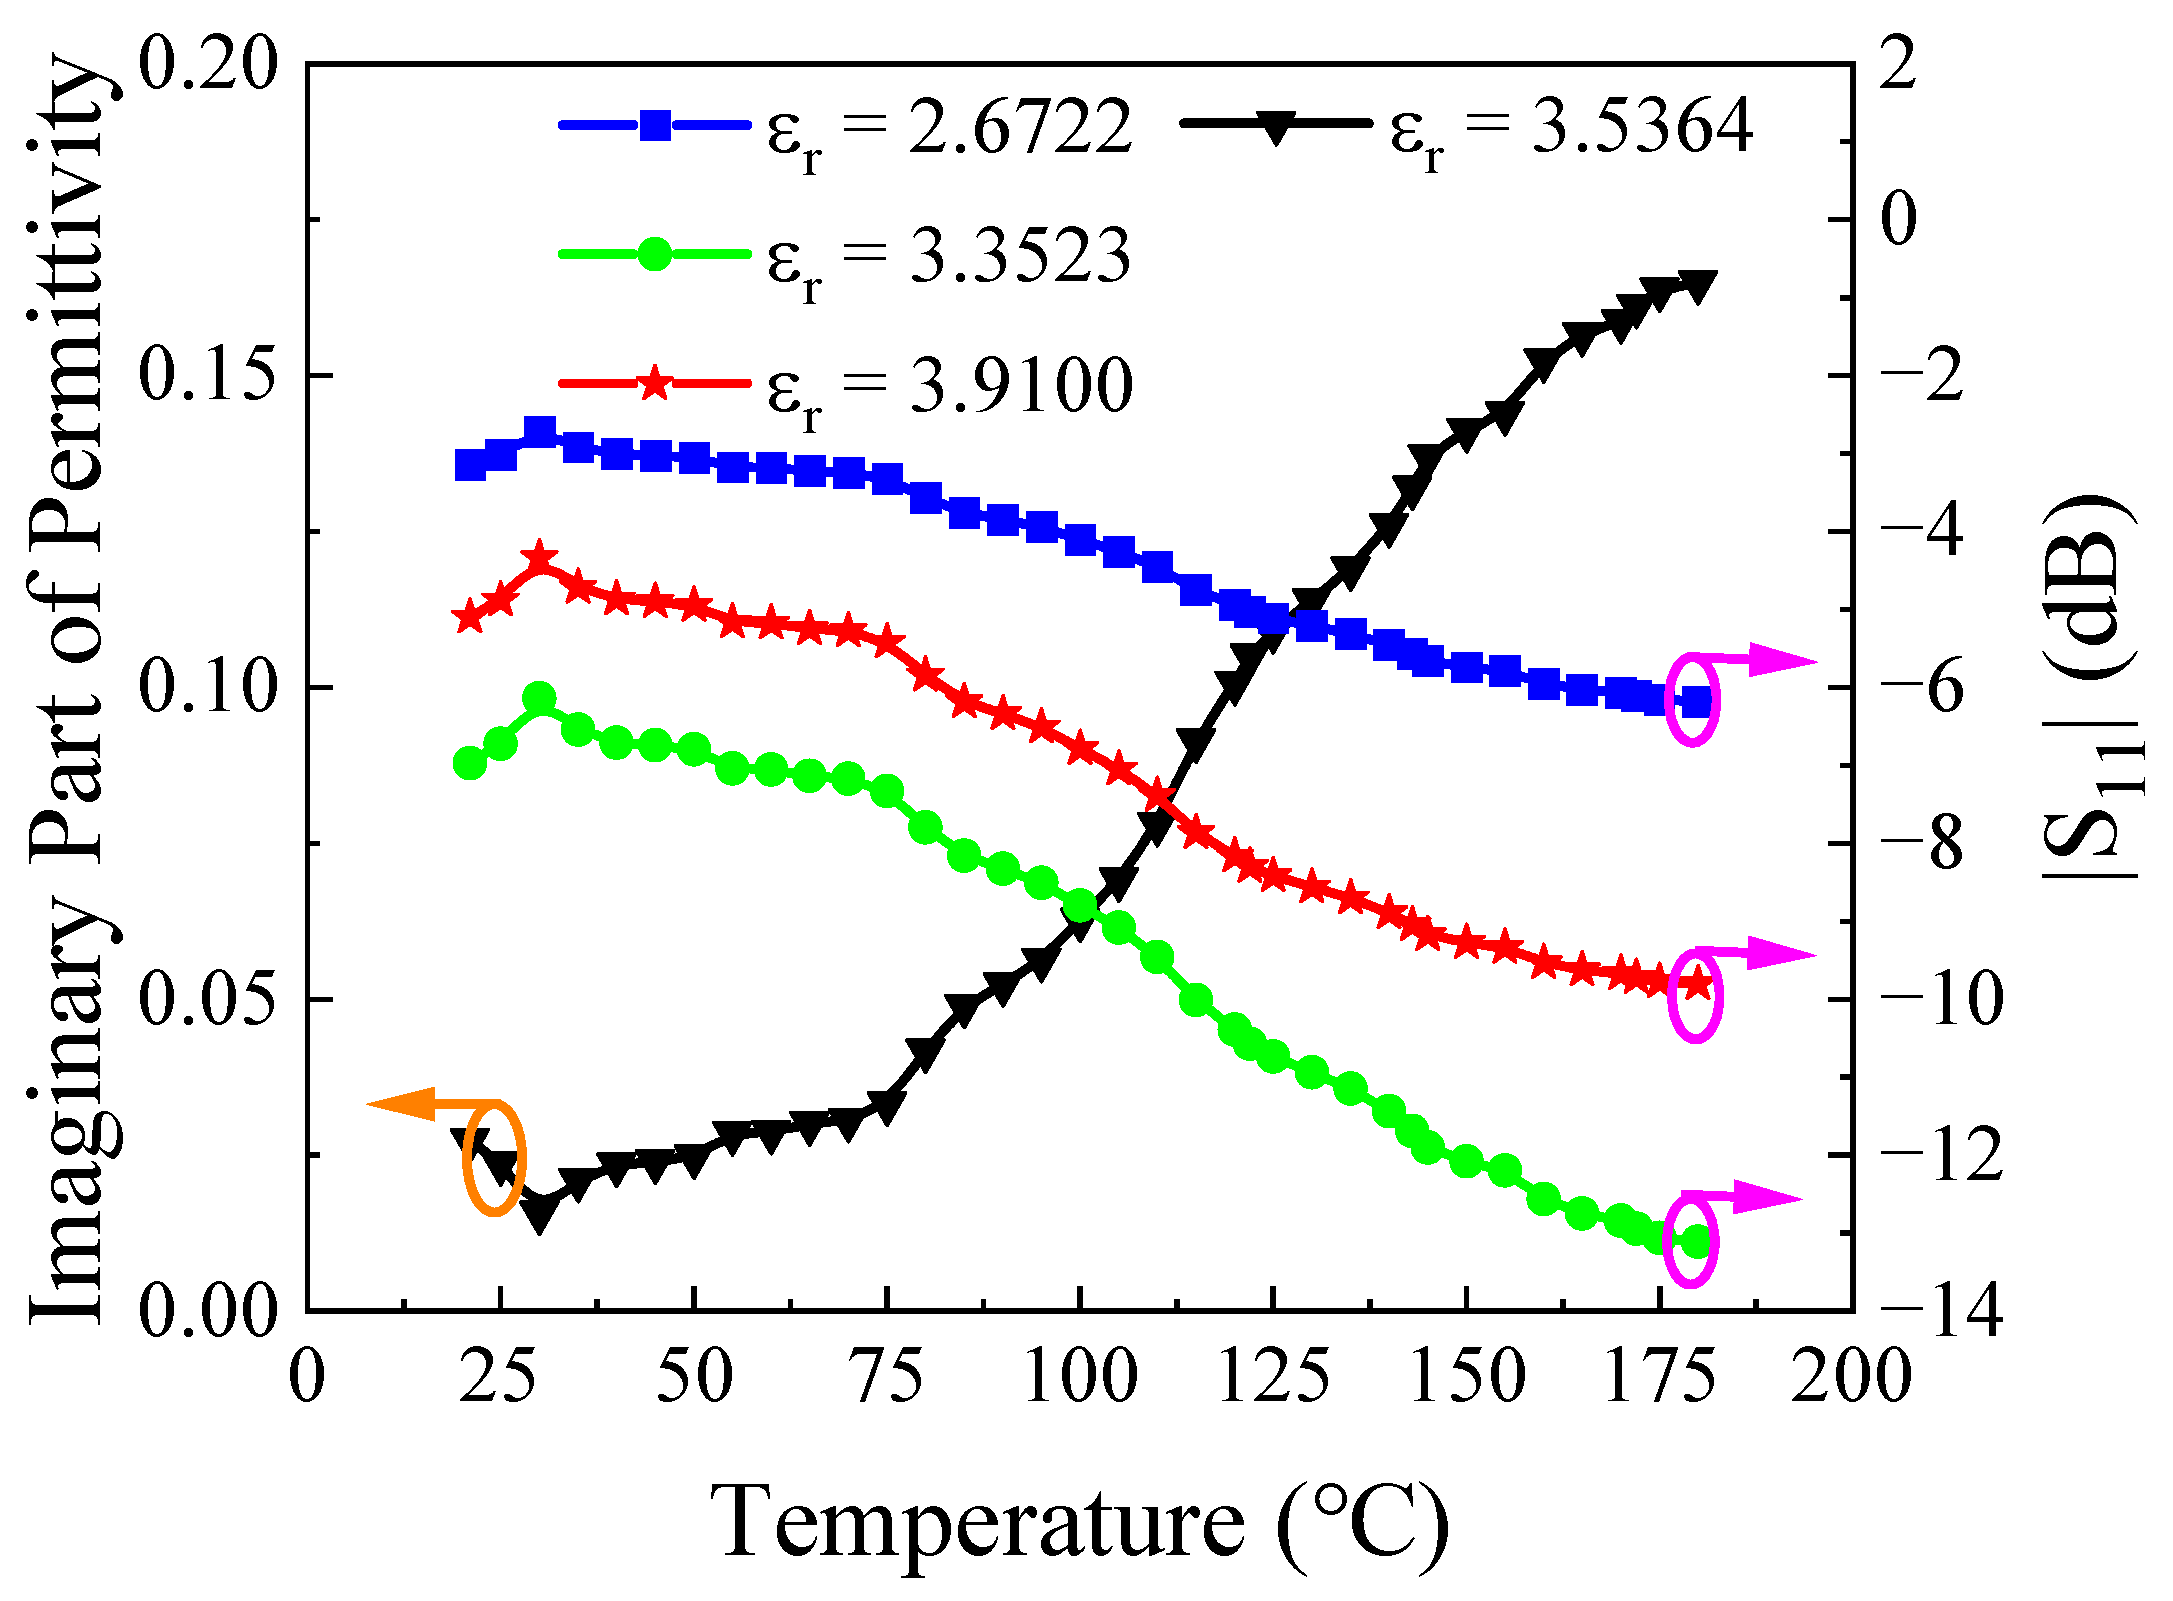
2.1. Characteristics of PET Materials

PET has excellent physical and mechanical properties, including robust mechanical strength, impact resistance, rigidity, toughness, friction resistance, and transparency [17]. Its outstanding chemical resistances, mechanical properties, thermal stabilities, transparencies, and gas insulations allow it to be a highly desirable material for packaging. Moreover, ethylene glycol, as raw material for PET production, is nearly half as inexpensive as products made with polybutylene terephthalate (PBT). Consequently, PETs are one of the lowest-cost materials among various engineering plastics with high performance.
Due to the presence of PET macromolecule groups, such as ester groups with strong hydrophilicity, the capacity to absorb water from the air during storage and transportation will influence the transparency of the product. The water may be attached to the surface of the PET materials. Before injection molding, raw PET materials must undergo drying [18]. PET microwave drying faces two main challenges: PETs are materials with low dielectric loss. Secondly, its initial MC is very low. The skin depth δ must be considered for low dielectric loss materials to ensure adequate energy absorption, as shown in Equation (1). The energy distributions can be controlled through frequency tuning for materials with a low MC.
δ = 1 π f μ σ
Here, f is an operating frequency, µ is the value of a magnetic conductivity, and σ is the value of a specific conductivity.

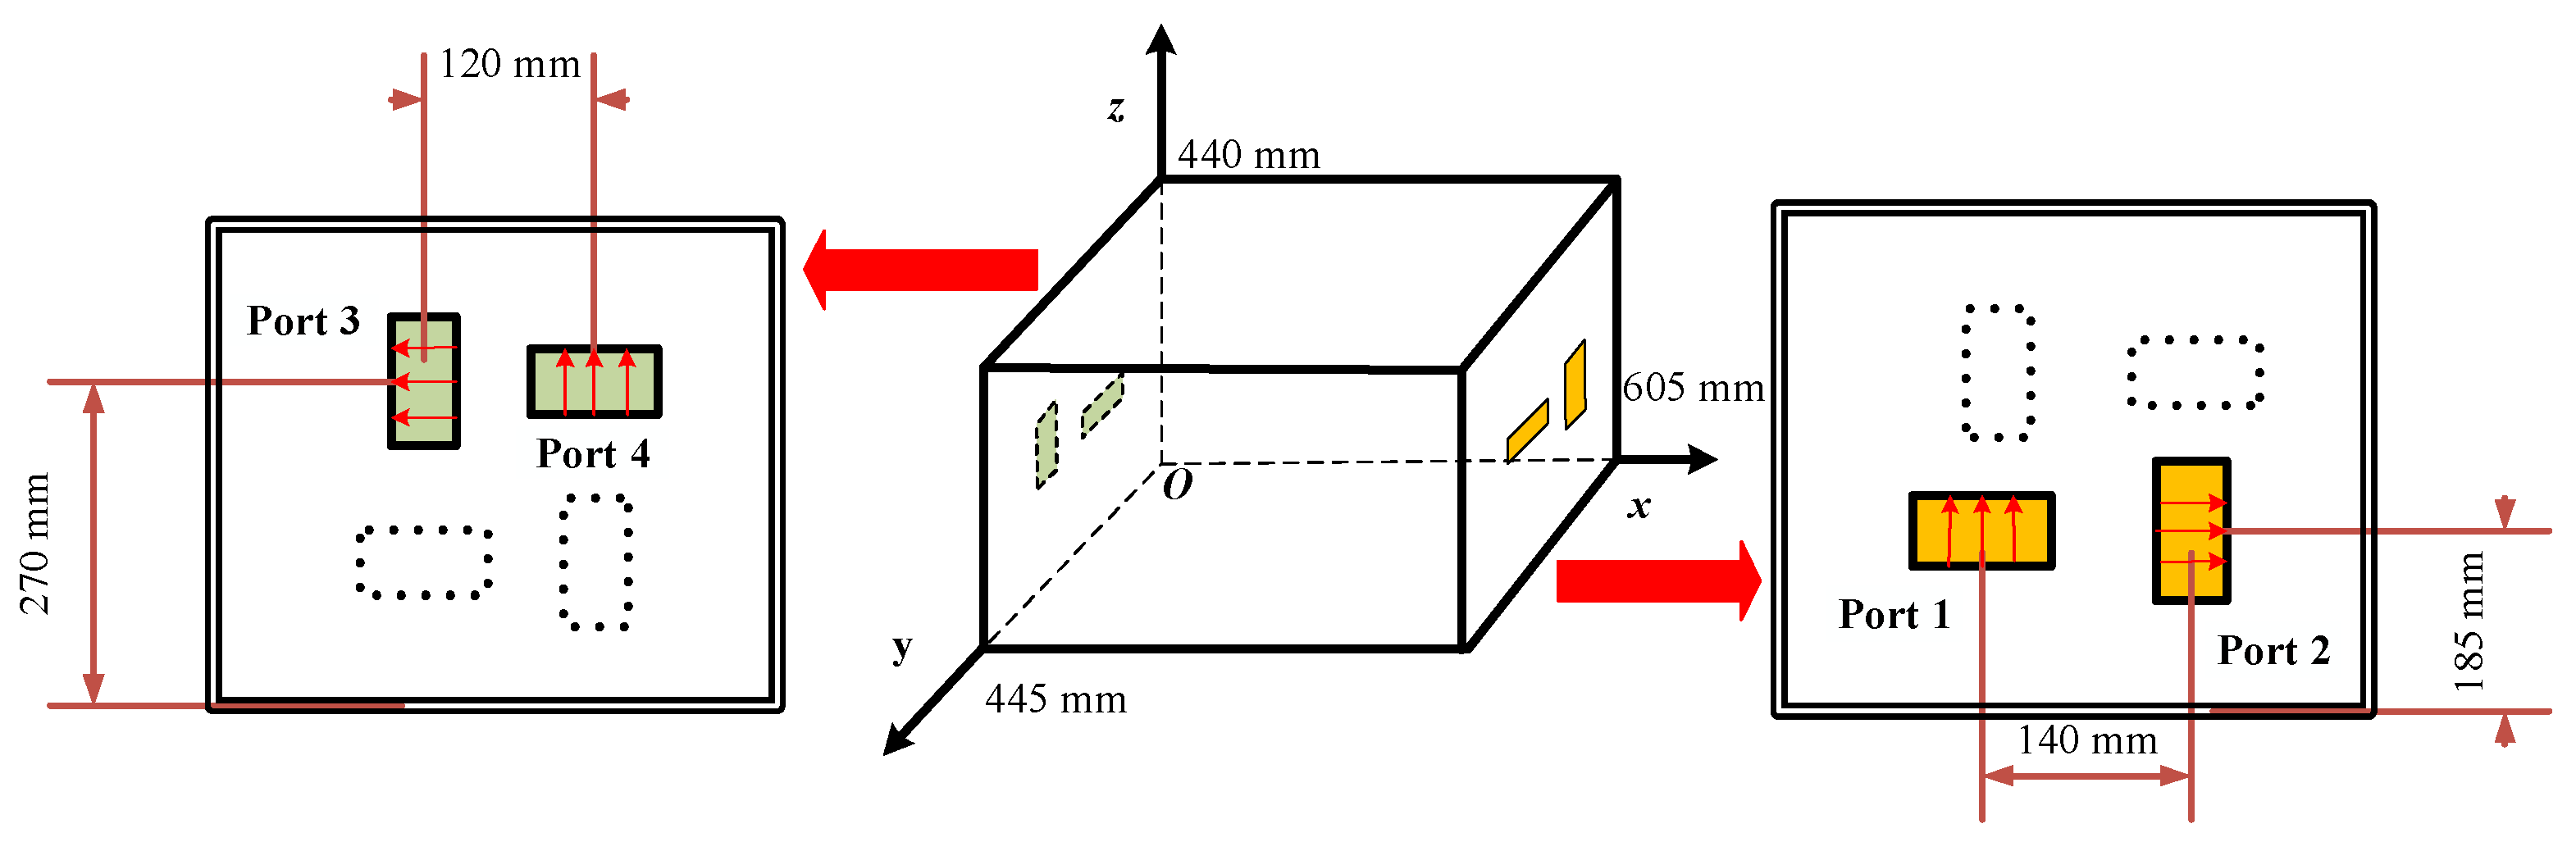
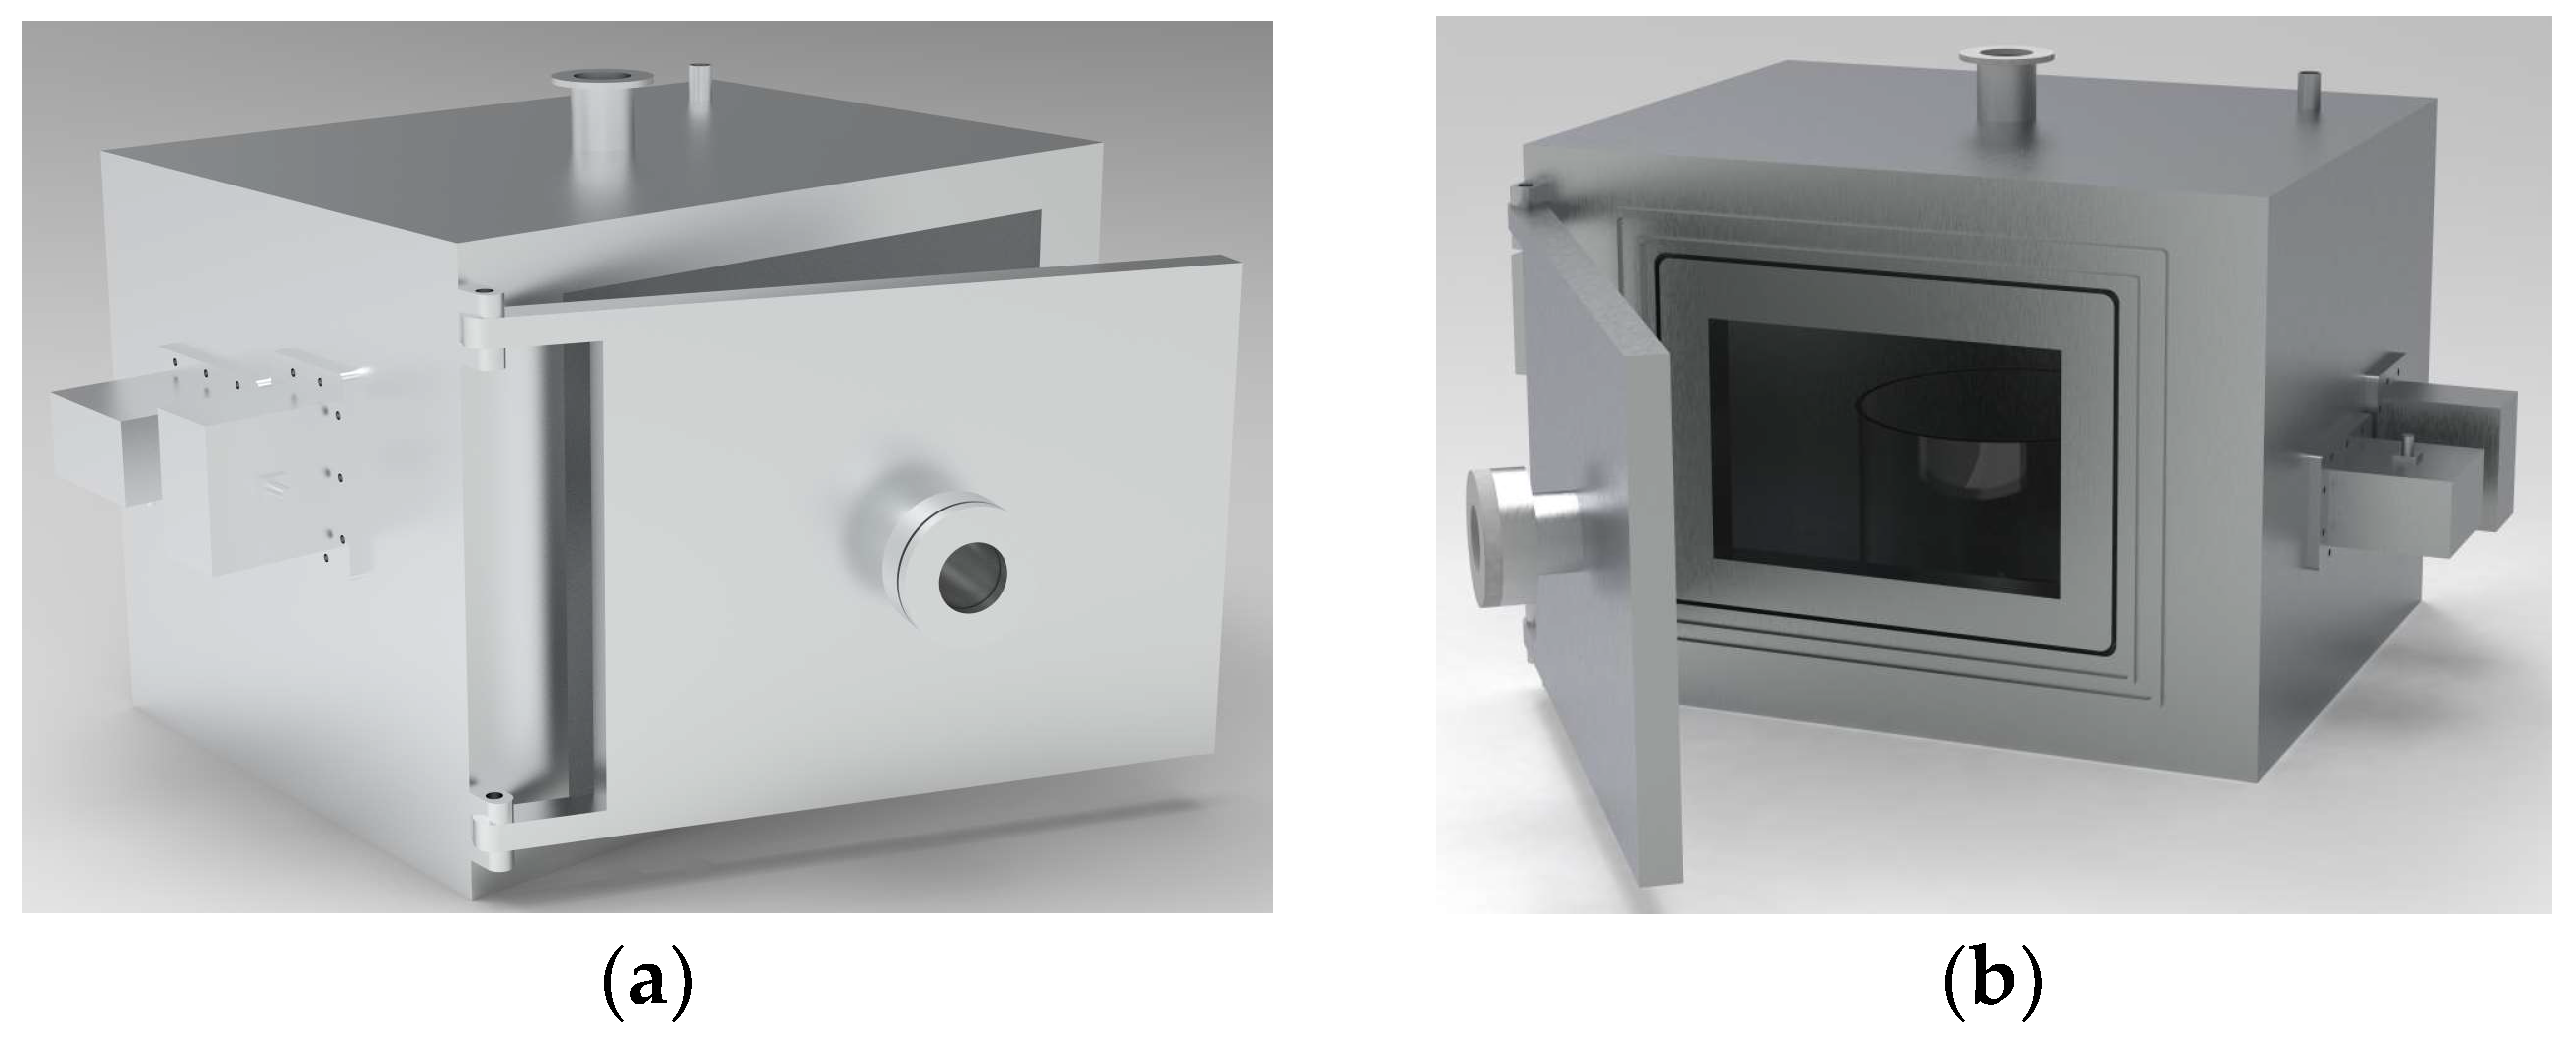
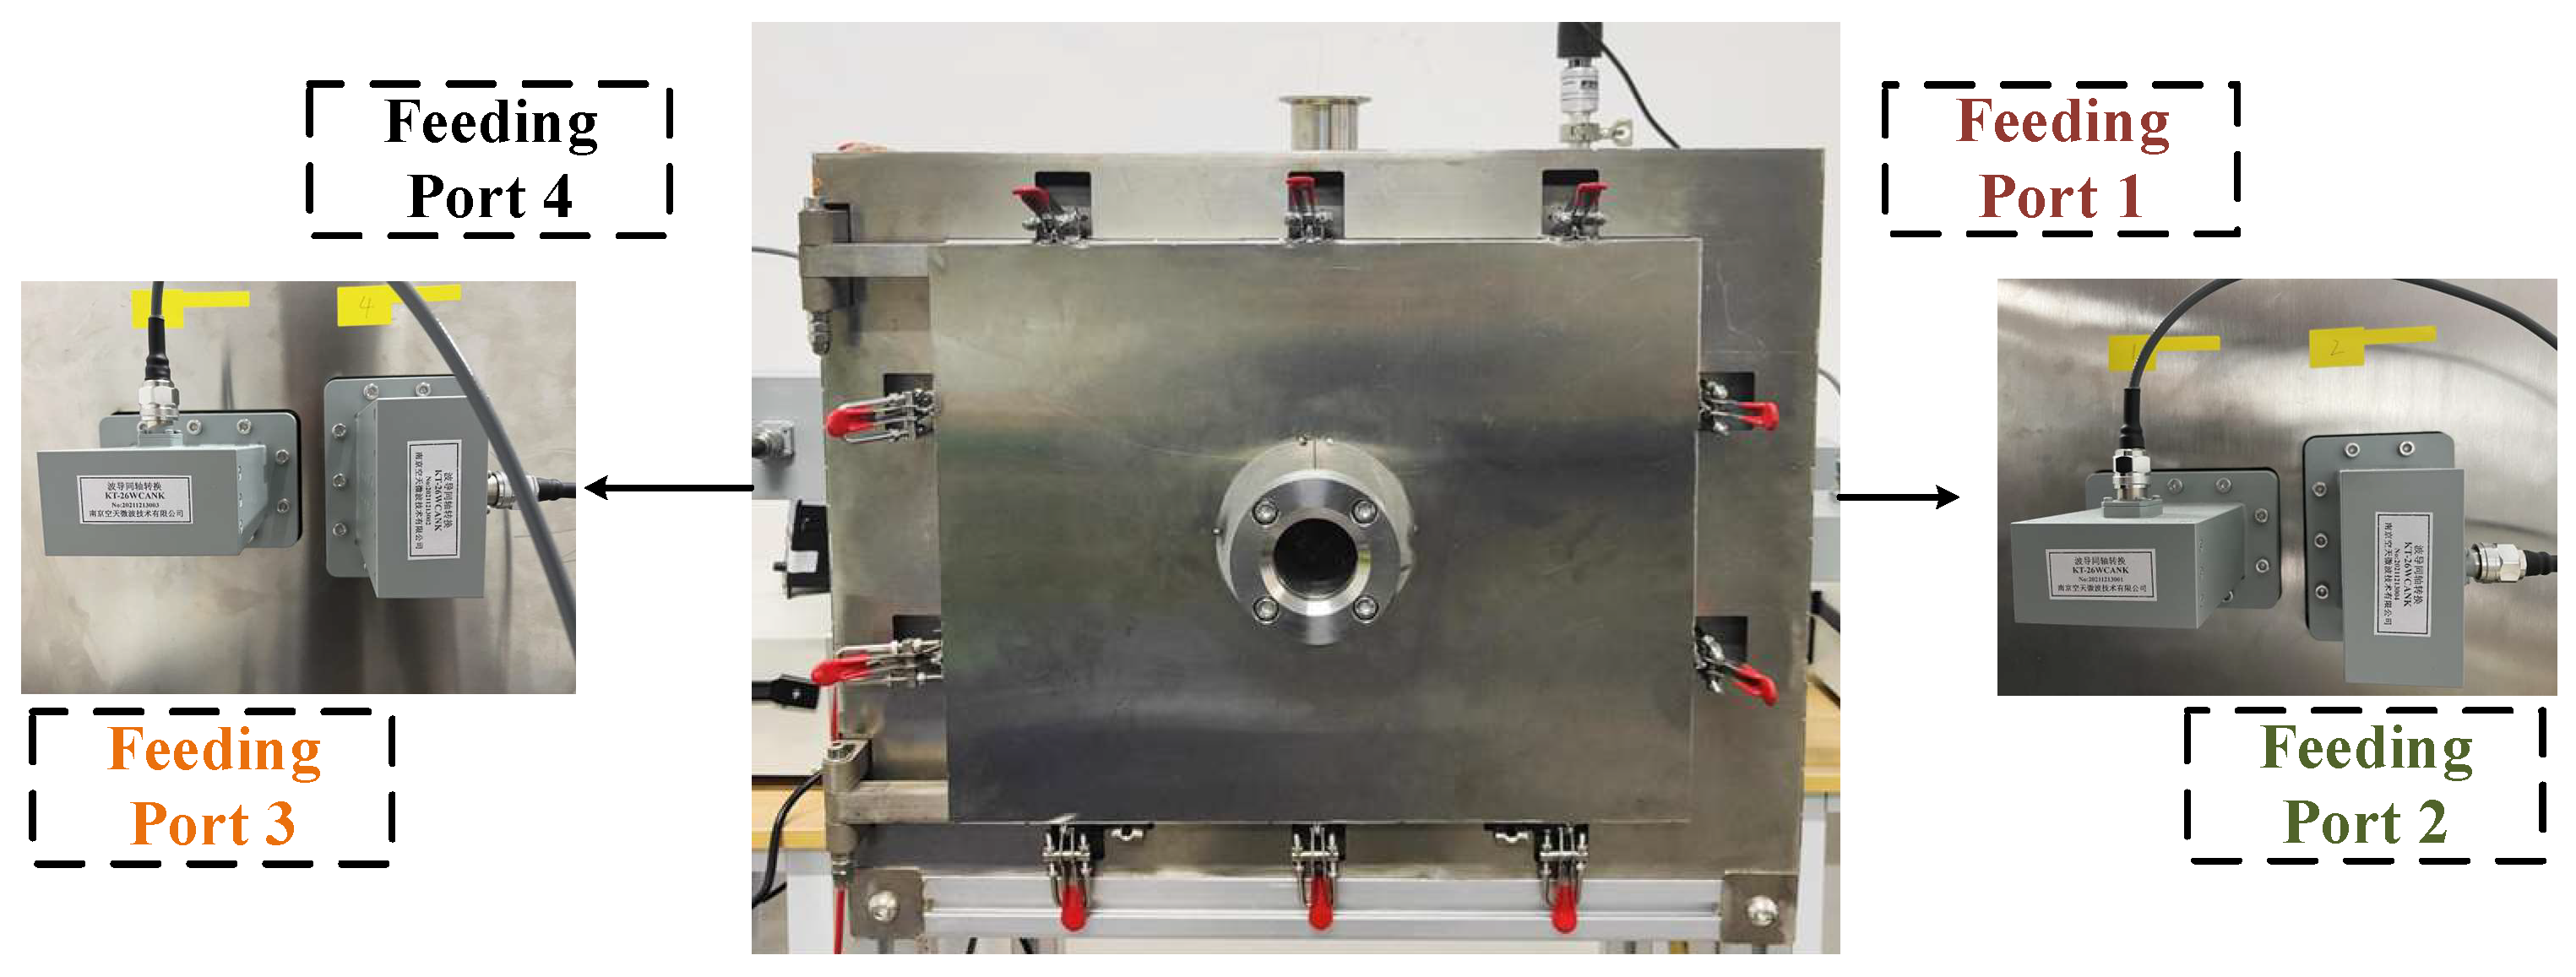
2.2. Microwave Drying Cavity Design

According to [19], PETs with a loss tangent of less than 0.02 exhibit low microwave power absorption capacity. Additionally, ensuring stability becomes more difficult as the temperature of PETs increases. The cavity dimensions were determined based on PET materials’ operating frequency and permittivity. The calculation method for various cavity dimensions with a resonant frequency between f1 and f2 is as follows [20]:
f 1 c 0 2 m a 2 + n b 2 + p l 2 f 2
where a, b, and l are the rectangular cavity’s length, width, and height, respectively, m, n, and p are the standing wave numbers in corresponding directions and c 0 is the speed of light in a vacuum. f1 = 2400 MHz and f2 = 2500 MHz were used for the ISM (Industry, Science, and Medicine) frequency regulation.
Combined with Equation (2) via the ergodic method in Python, the dimensions of the cavity were calculated at 0.605 m × 0.445 m × 0.440 m, which allows for the mode number of 81 during the frequency range from 2401.037 MHz to 2095.968 MHz.
As shown in Figure 1, we introduced four feeding ports to improve the heating uniformity. Two ports on the opposite side were perpendicular to each other to increase the isolation, which is similar to the adjacent situation. Port 1 was designed to be parallel to the horizon. Meanwhile, port 2 was perpendicular to port 1 with a gap of 140 mm. By simulation, the isolation between port 1 and port 2 is around 20 dB in the operating band.
Similarly, we designed port 3 and port 4 on the opposite side, perpendicular to each other. Considering other couplings, port 3 was perpendicular to port 1 with a height of 85 mm, whose gap distance from port 4 is 120 mm. The simulation results of isolation between two ports are greater than 10 dB. Its 3D model is shown in Figure 2. Meanwhile, power is put into a cylindrical quartz glass container for microwave heating. Thus, we make an equivalent heating model of the PET, as shown in Figure 3.
The uniformity of temperature is calculated by
C O V T = i = 1 n ( T i T ¯ ) 2 / n / ( T ¯ T 0 )
where T ¯ is the average temperature, T0 is the initial temperature, and Ti is the temperature of the specific point i, which is divided into n by gridding.
According to [21], we can establish the relationship between permittivity and power consumption, as shown in the Equations (4) and (5).
ε r = ε r j ε r
Here, ε r is the relative permittivity of PET, and ε r and ε r are the real and imaginary parts, respectively. For the PET, ε r = 2.6722 − 0.02739j at a normal temperature [19]. The microwave power absorbed by the PET per unit volume is denoted by P as
P = π f ε 0 ε E 2
where f is the operating frequency, E is the module value of the electric field intensity, and ε 0 is the permittivity value of the vacuum.
Based on reference [19], Figure 4 shows the relationship between permittivity and temperature. As temperature increases, both components of the permittivity non-linearly rise, potentially leading to a thermal runaway due to the positive feedback, i.e., a higher temperature leading to a higher loss and then absorbing more microwave power to an even higher temperature.
PET’s permittivity depends on temperature and frequency, and there is a nonlinear relationship between frequency, temperature, and permittivity.
Figure 5a shows that the 200 W input microwave power results at each port were simulated when the permittivity value was kept at 21 °C. The permittivity value of 180 °C was simulated, as shown in Figure 5b. During the frequency ranges from 2.46 GHz to 2.50 GHz, each port’s reflection decreased with the temperature increase. In the terminal drying phase, we can tune the frequency from 2.46 GHz to 2.50 GHz to reduce the reflection.
This shows that the reflections at feeding ports varied with the PET temperature, i.e., a frequency tunning strategy is appreciated to keep a lower port reflection. We can sense the PET permittivity from the S-parameter to guide the microwave drying. Between 2.46 GHz and 2.48 GHz, the S-parameter at each port is less than −10 dB.
During simulation, when one port is fed at 2.48 GHz, the permittivity varies with temperature, implying that the equivalent dissipation changes over time. Figure 6 displays the curves illustrating the variation of the imaginary and real parts’ influence |S11| on a one-to-one basis. Considering the smaller variation range of the permittivity real part, the effects of dissipation on the reflection coefficient are much stronger than those from impedance matching, which depends on the low dielectric loss characteristics of PETs. We compared the negative correlation of the imaginary part to |S11| at various real parts of 2.6722, 3.3523, and 3.9100.
Throughout the drying process, we can observe |S11| at different temperatures to reflect the variation of the imaginary and real parts of the permittivity. Furthermore, by reconstructing the permittivity using |S11|, we can establish the relationship between the cavity load and the input microwave power and frequency.
When the temperature is 180 °C, the absorbed microwave powers of PETs are augmented at the high-frequency range from 2.45 GHz to 2.5 GHz. This means we can adjust the frequency between 2.4 and 2.5 GHz to reduce reflection over drying time. Meanwhile, the S-parameter at 180 °C reflected that the reduced reflection power and the permittivity variations lead to thermal runaway. We can adjust frequency to improve efficiency since combining power control can reach a balance between time and quality.
We acquired the PET temperature distribution through multi-physical simulation, incorporating the variation of permittivity based on temperature. Figure 7 and Figure 8 illustrate the temperature distribution for fixed frequency and frequency adjustment, respectively. For fixed frequency, we simulated the temperature distribution at 2.414 GHz. Compared to variable frequencies changed from 2.4 GHz to 2.5 GHz with an interval of 10 MHz, the maximum temperature difference is more than 100 °C, which means uniformity is enhanced when inputting power is at 800 W and drying time is less than 60 min. After calculations, the COVT decreased from 55.63% to 34.65%, proving the uniformity improvement.
Simulating the scenario of frequency adjustment, it is evident that hot spots are evenly dispersed. Based on temperature analysis, the maximum temperature decreases from 400 °C to 280 °C, indicating that the temperature distribution with frequency adjustment is more uniform.

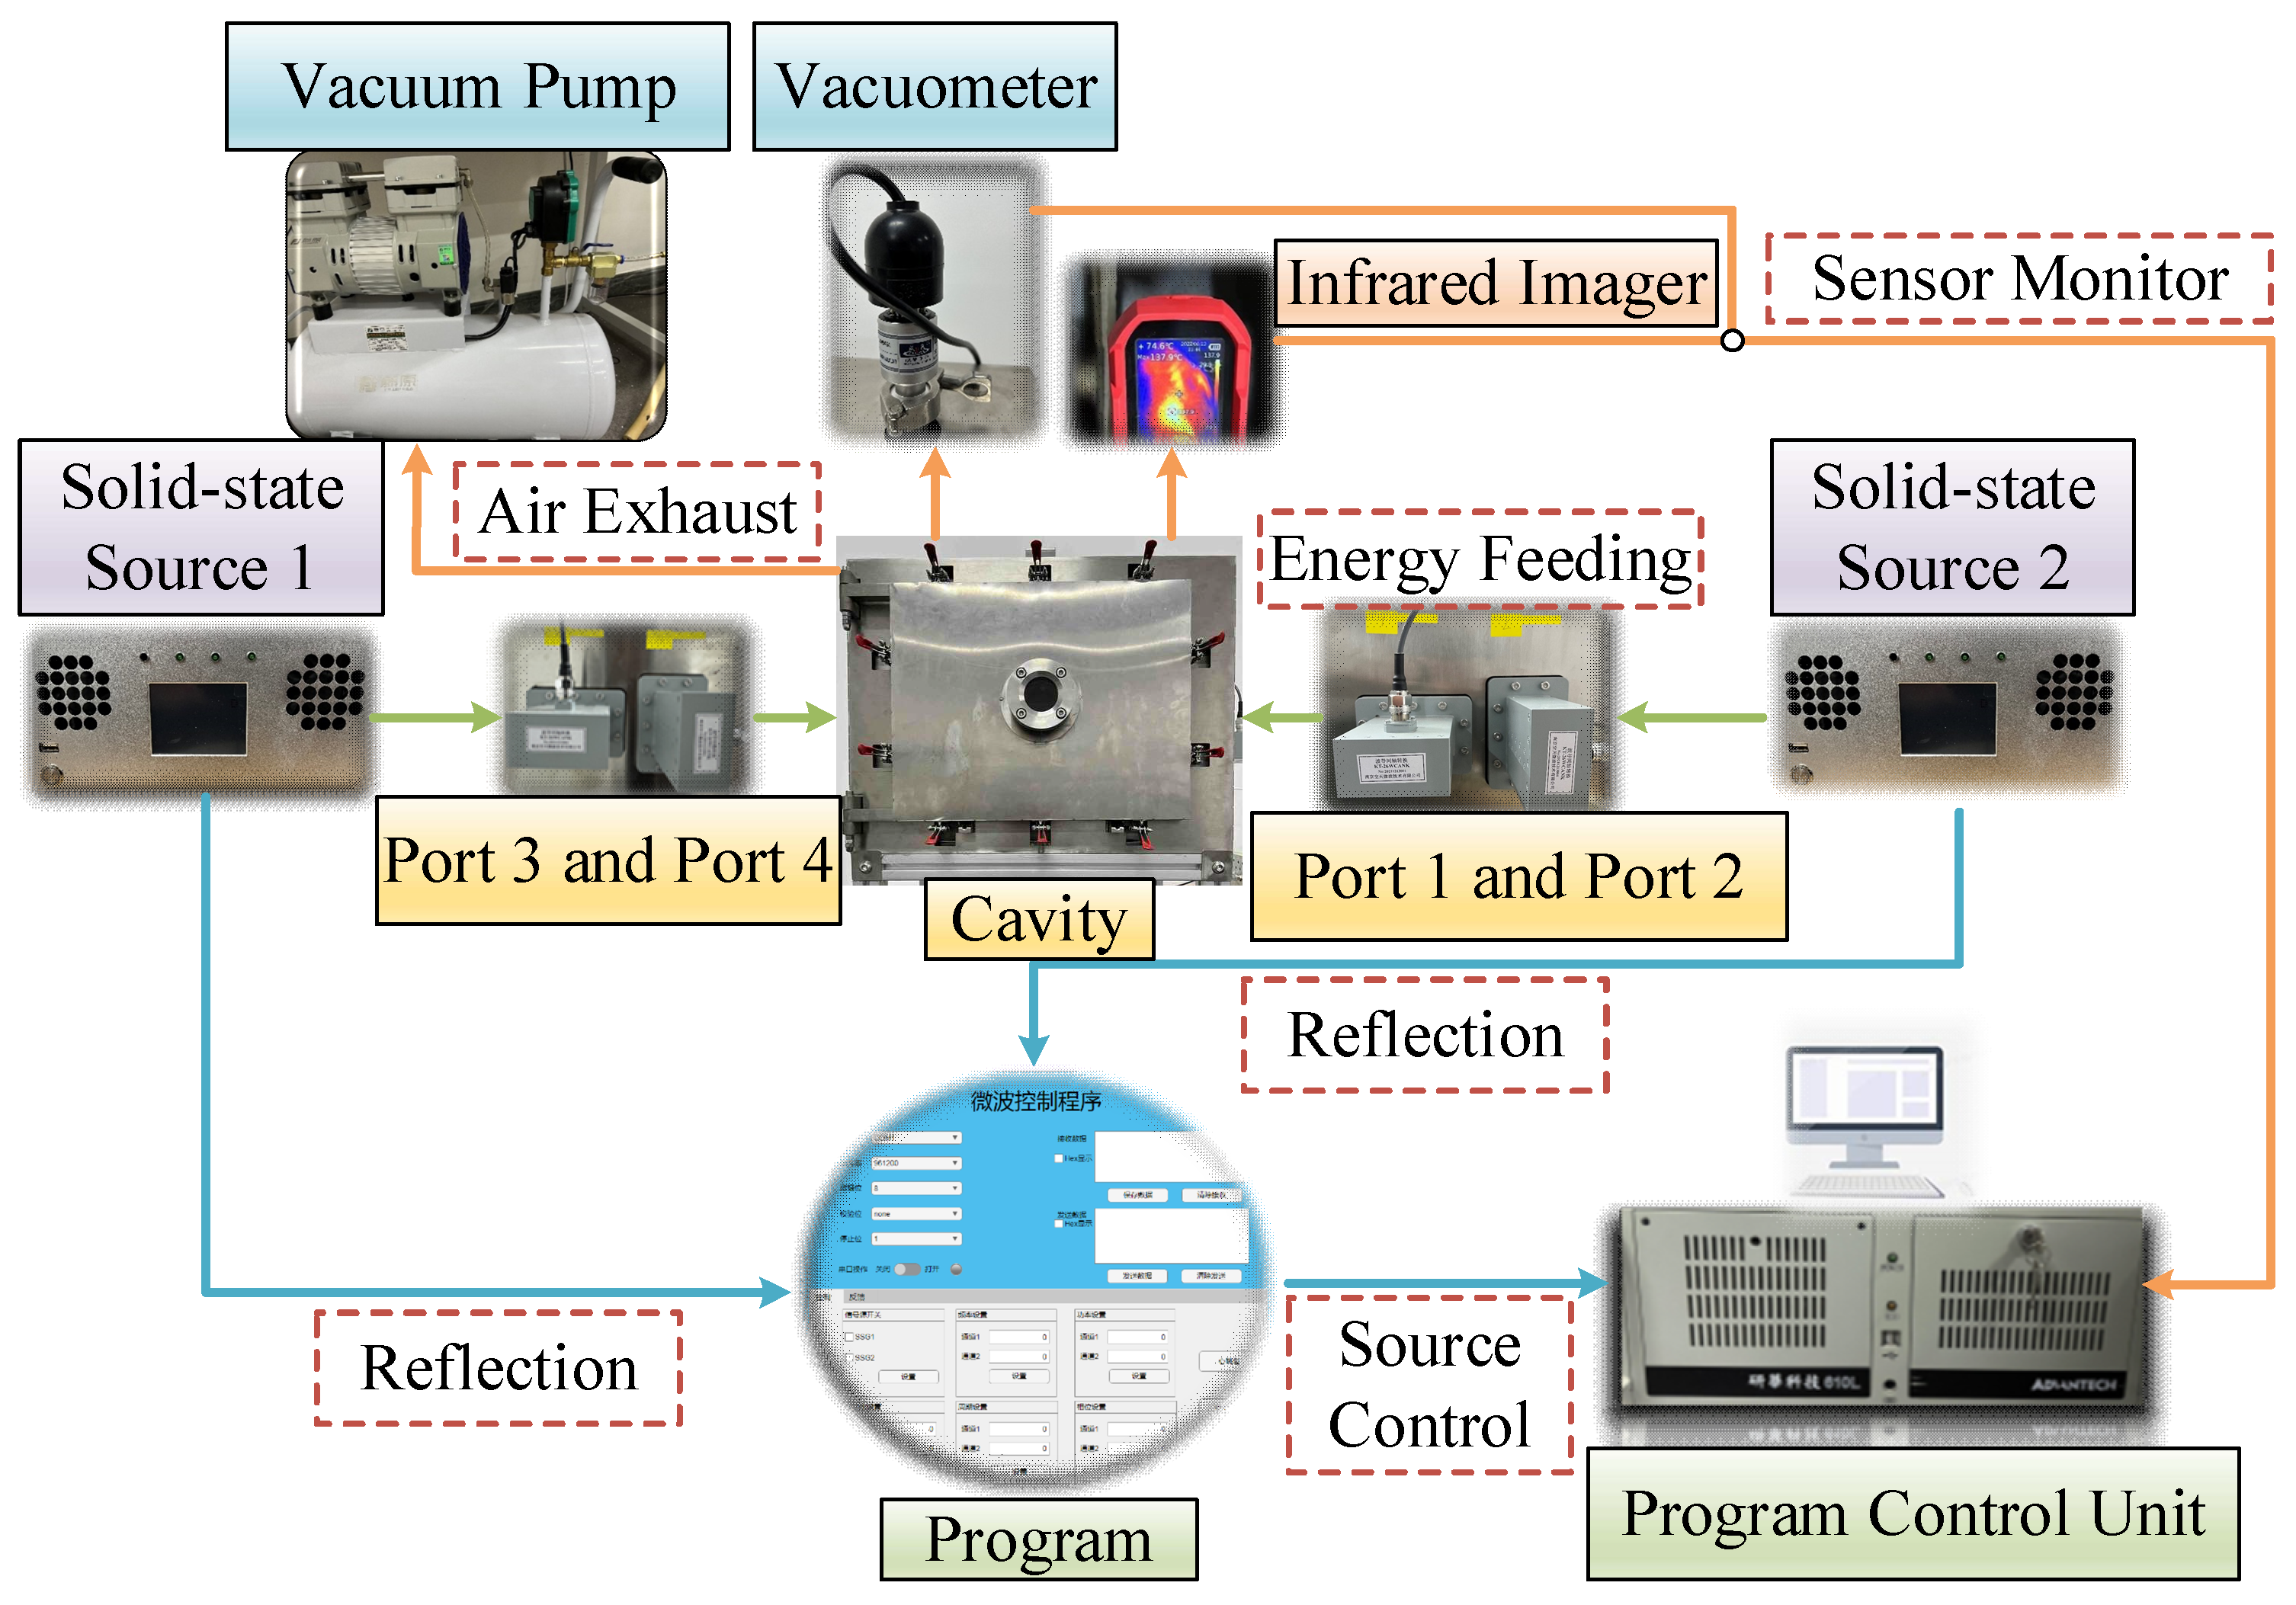
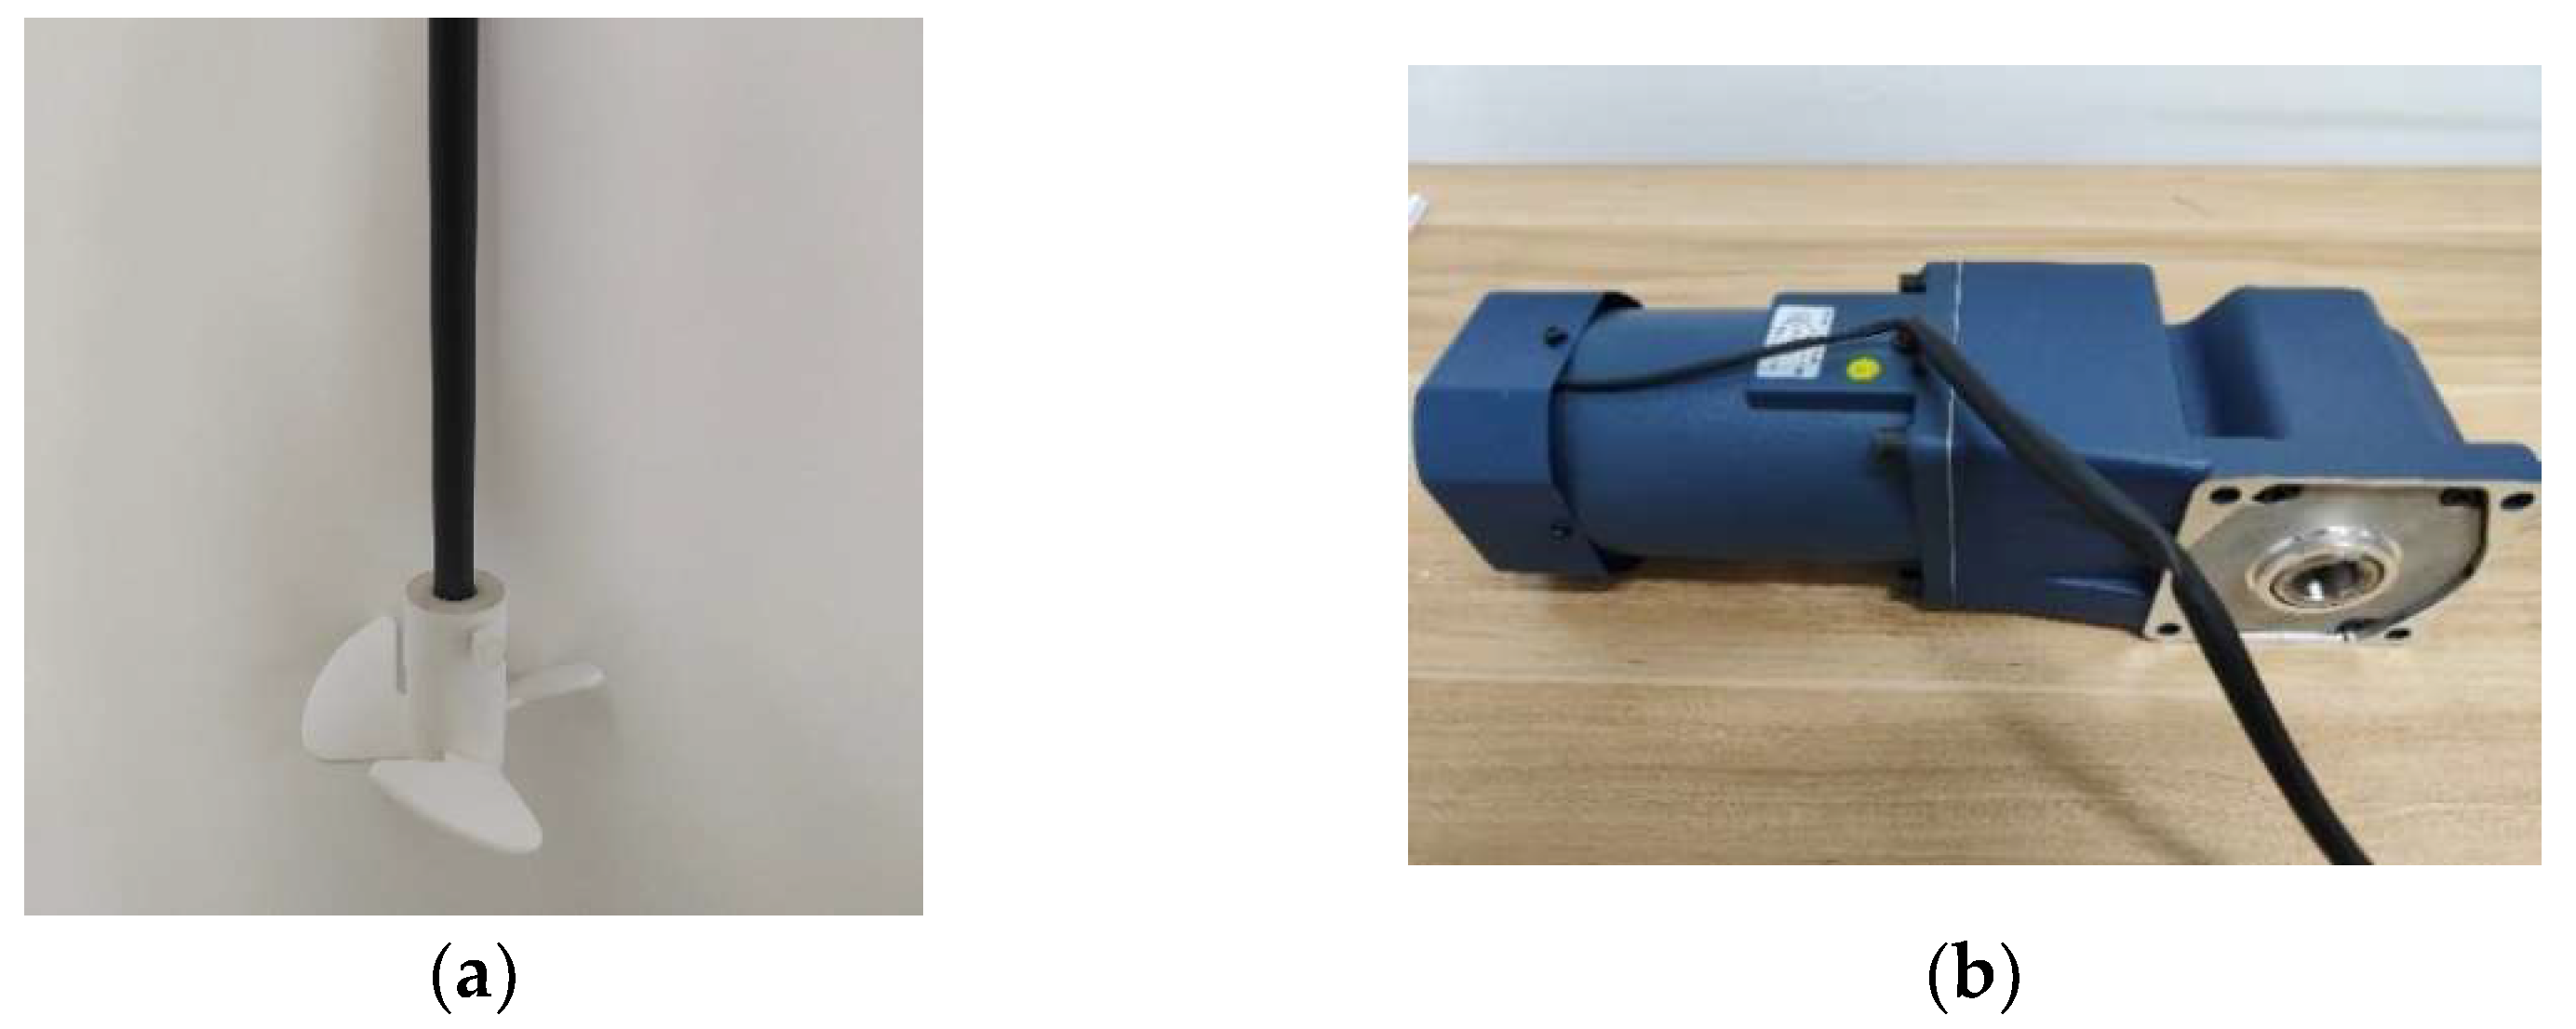
2.3. Experimental System Design

The experimental setup, as Figure 8 shows, comprised a vacuum pump for air exhaust, an SSG capable of generating frequencies ranging from 2400 MHz to 2500 MHz within the ISM band, a rectangular shielded metal cavity, and a computer for real-time control.
Those monitor data can reflect the drying process. Using a vacuum pump, the cavity was exhausted to −92 kPa, which is relative to standard atmospheric pressure (101.325 kPa). Two SSGs were placed on both sides to input four channels from 0 W to 250 W, controlled by the computer’s series ports (Figure 9).
The central frequency was designed to be 2450 MHz in both simulations and experiments. As per reference [22], the frequency adjustment interval (∆f) of approximately 3 MHz affects variations in electromagnetic field modes, although the frequency modulation step for the SSG is 0.01 MHz. The estimation is as follows:
Δ f = c 0 3 / 8 π V f 2
where c 0 is the speed of light in a vacuum, f is the operating frequency, and V is the metal cavity volume of 0.118 m3.
As depicted in Figure 10, observing windows were designed with a cut-off waveguide structure. Considering the coupling effects, four waveguide ports were arranged in pairs perpendicularly. The spatial combination of feeds influenced the variation in power distribution, which was subdivided into three situations: on the same side, directly opposite, and obliquely opposite. All BJ-26 waveguide ports were connected to waveguide–coaxial adapters connected to the SSG.
Compared to traditional microwave drying technology, magnetrons are commonly utilized in microwave energy industrial applications due to their numerous advantages, such as low cost and simplicity. However, the problem of microwave drying for PETs can be solved when the SSG emerges as a potential alternative generator. The SSG integrated into intelligent control systems can operate at various microwave parameter settings when each coaxial interface is capable of receiving the maximum input power of 250 W. Considering the requirement of industrial continuous production, a data transmission interface with a USB-type connector is set in the lower-left corner of the front panel to realize two-way data interactions.

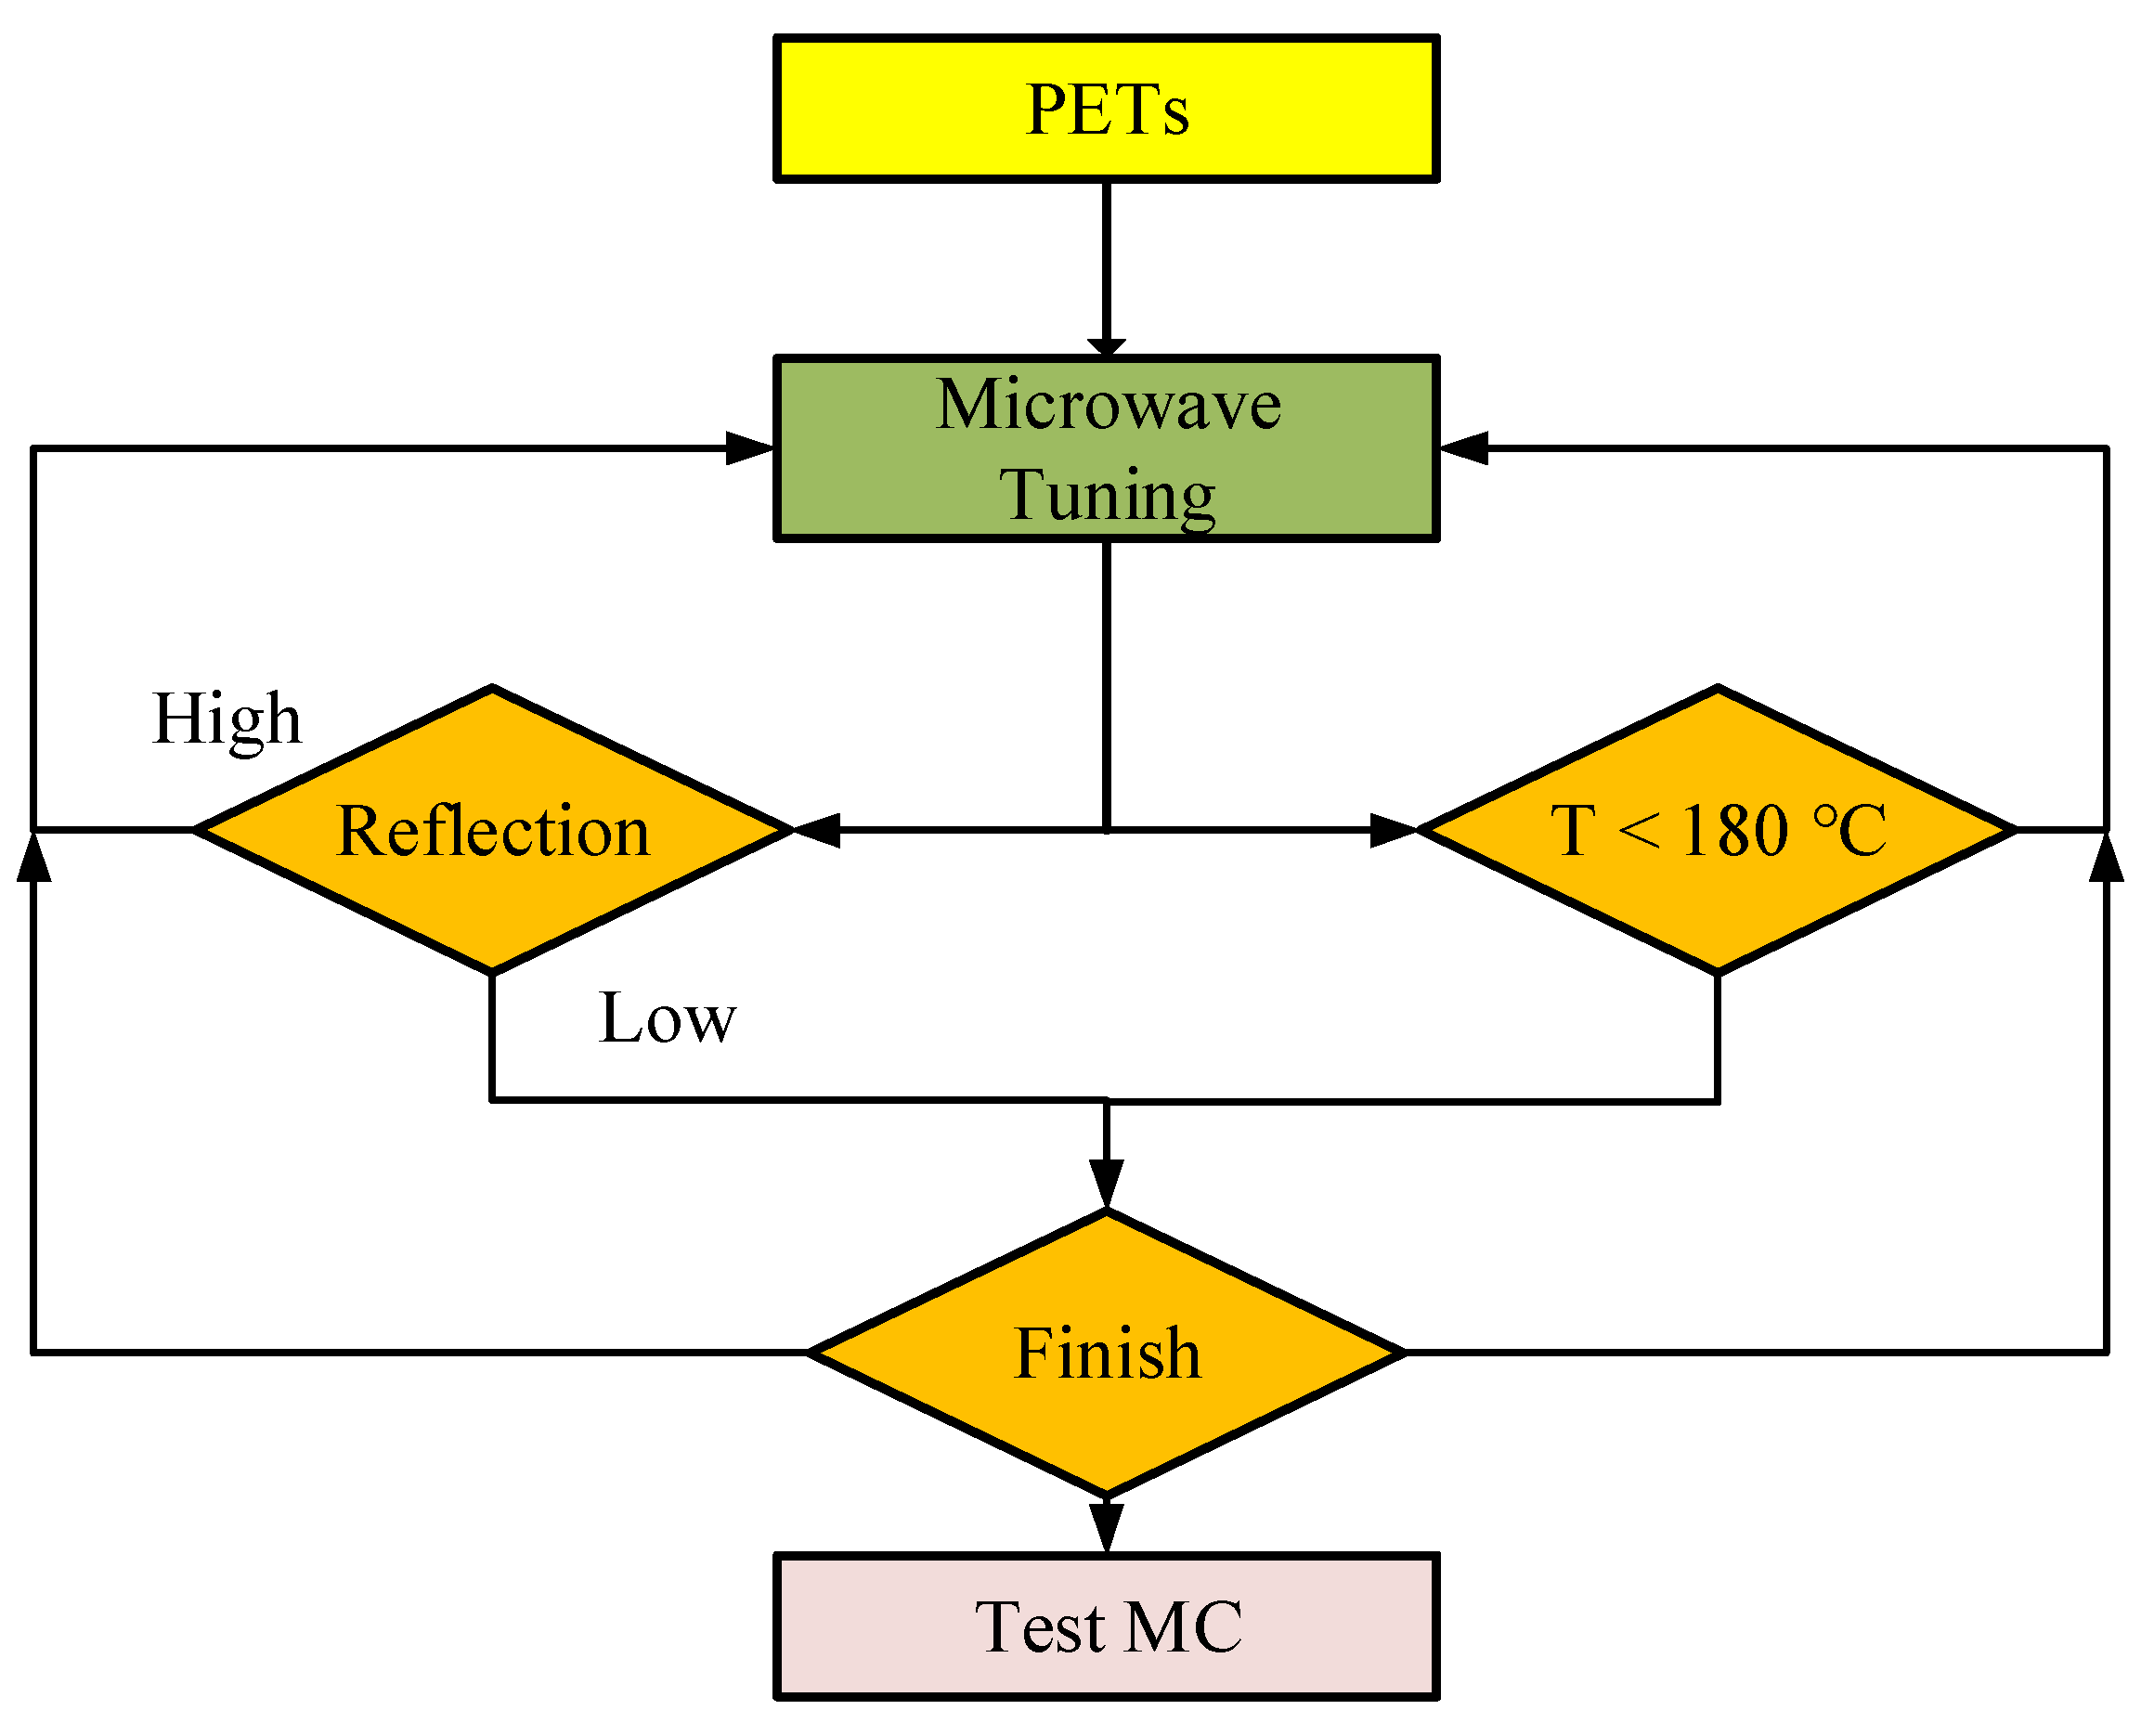
2.4. Experimental Method

In the microwave drying process, PET materials of identical volume and mass were subjected to drying over time when temperature and microwave reflection were observed via sensors with the tuning method.
Approximately 2 kg of PETs were initially loaded into a quartz glass disk when the load was laid flat on insulated cotton wool. The chamber door was then closed and locked with a switch to create a shielded environment and prevent microwave leakage. Microwave power was delivered into the chamber over time.
Subsequently, experiments were conducted at different frequencies to investigate the improvement effect on PET drying, as Figure 11 depicted. Based on frequency tuning technology, our experimental considerations involved isolating one, two, and four ports, revealing that frequency adjustment can affect uniformity and efficiency.
After confirming the interval, we conducted experimental research on frequency modulation, which is crucial for establishing drying kinetics for PET with low absorption capacity and water content. Mass and volume were held constant to minimize impedance variation. Due to the system’s symmetry, we initially tested the case of port 1 to establish connections among the MC, the temperature, and the frequency tuning groups.
As shown in Figure 12, the frequency tendency was illustrated by a curve in other coordinates. It is important to note that the equivalent permittivity of PET that is not realistically measured is mainly related to frequency and temperature. Therefore, reflection power can be considered as a change in dissipation when the input frequency remains constant for the last 5 min to suppress the frequency interface. The reflection power was averaged to highlight the relationship between reflection power and frequency.
We conducted the microwave experiment at 150 W power twice under the same conditions. The frequency tuning technology was selected as a frequency with reflected power less than 25 W. Considering the frequency range of the SSG, it increased from 2400 MHz to 2500 MHz every time.
When mass and volume remain identical overall, the equivalent load for the same frequency can be considered constant. This implies that we can identify the optimal frequency group to achieve the goal of continuous production in the drying industrial process.
In contrast, although materials are kept at the same level, we still can adjust frequency to obtain a more suitable reflection. As the temperature increases, the reflected powers decrease. We can lower the reflection in a broader frequency range in the late drying period.
However, we selected different frequencies in the two experiments because the adjustment principle depends on reflection. When the time is 35 min, the first frequency is 2485.5 MHz, but the second is 2432.9 MHz. At this moment, the reflection power difference is about 20 W.
The reflection power fluctuates around 15 W with increasing frequency, which indicates that the beneficial effect of dissipation has been enhanced through frequency adjustment.

3. Results

Based on permittivity variations, we performed many experiments to determine the frequency regulation strategy at each port. Measuring the variation of temperature and reflection power over time also reflects permittivity variations. Numerous experiments demonstrated the feasibility through various frequencies, powers, and feeding method combinations.

3.1. Multi-Port Feeding Method

PET was constrained to the same volume and mass of 2 kg for each microwave drying process. We compared the two-port and four-port feeding methods under the same input power. All experiments were conducted at a power of 500 W over 50 min when the operating frequency was 2.48 GHz.
We recorded temperature distributions every 5 min using an infrared thermometer (UTi-260B). The recorded temperatures are shown in Figure 13.
For the four-port feeding type, every port was fed by 125 W to ensure uniformity. As for the two-port feeding type, port 1 and port 2 were fed by 250 W.
With the port number increasing, the rising trend of the two-port type is steeper than that of the four-port one, which indicates that the port number increasing improved uniformity and stabilized when the temperature raised during the drying process. It is worth mentioning that the final temperature in both cases is essentially the same, which is caused by the capacity of absorption microwave energy increasing.

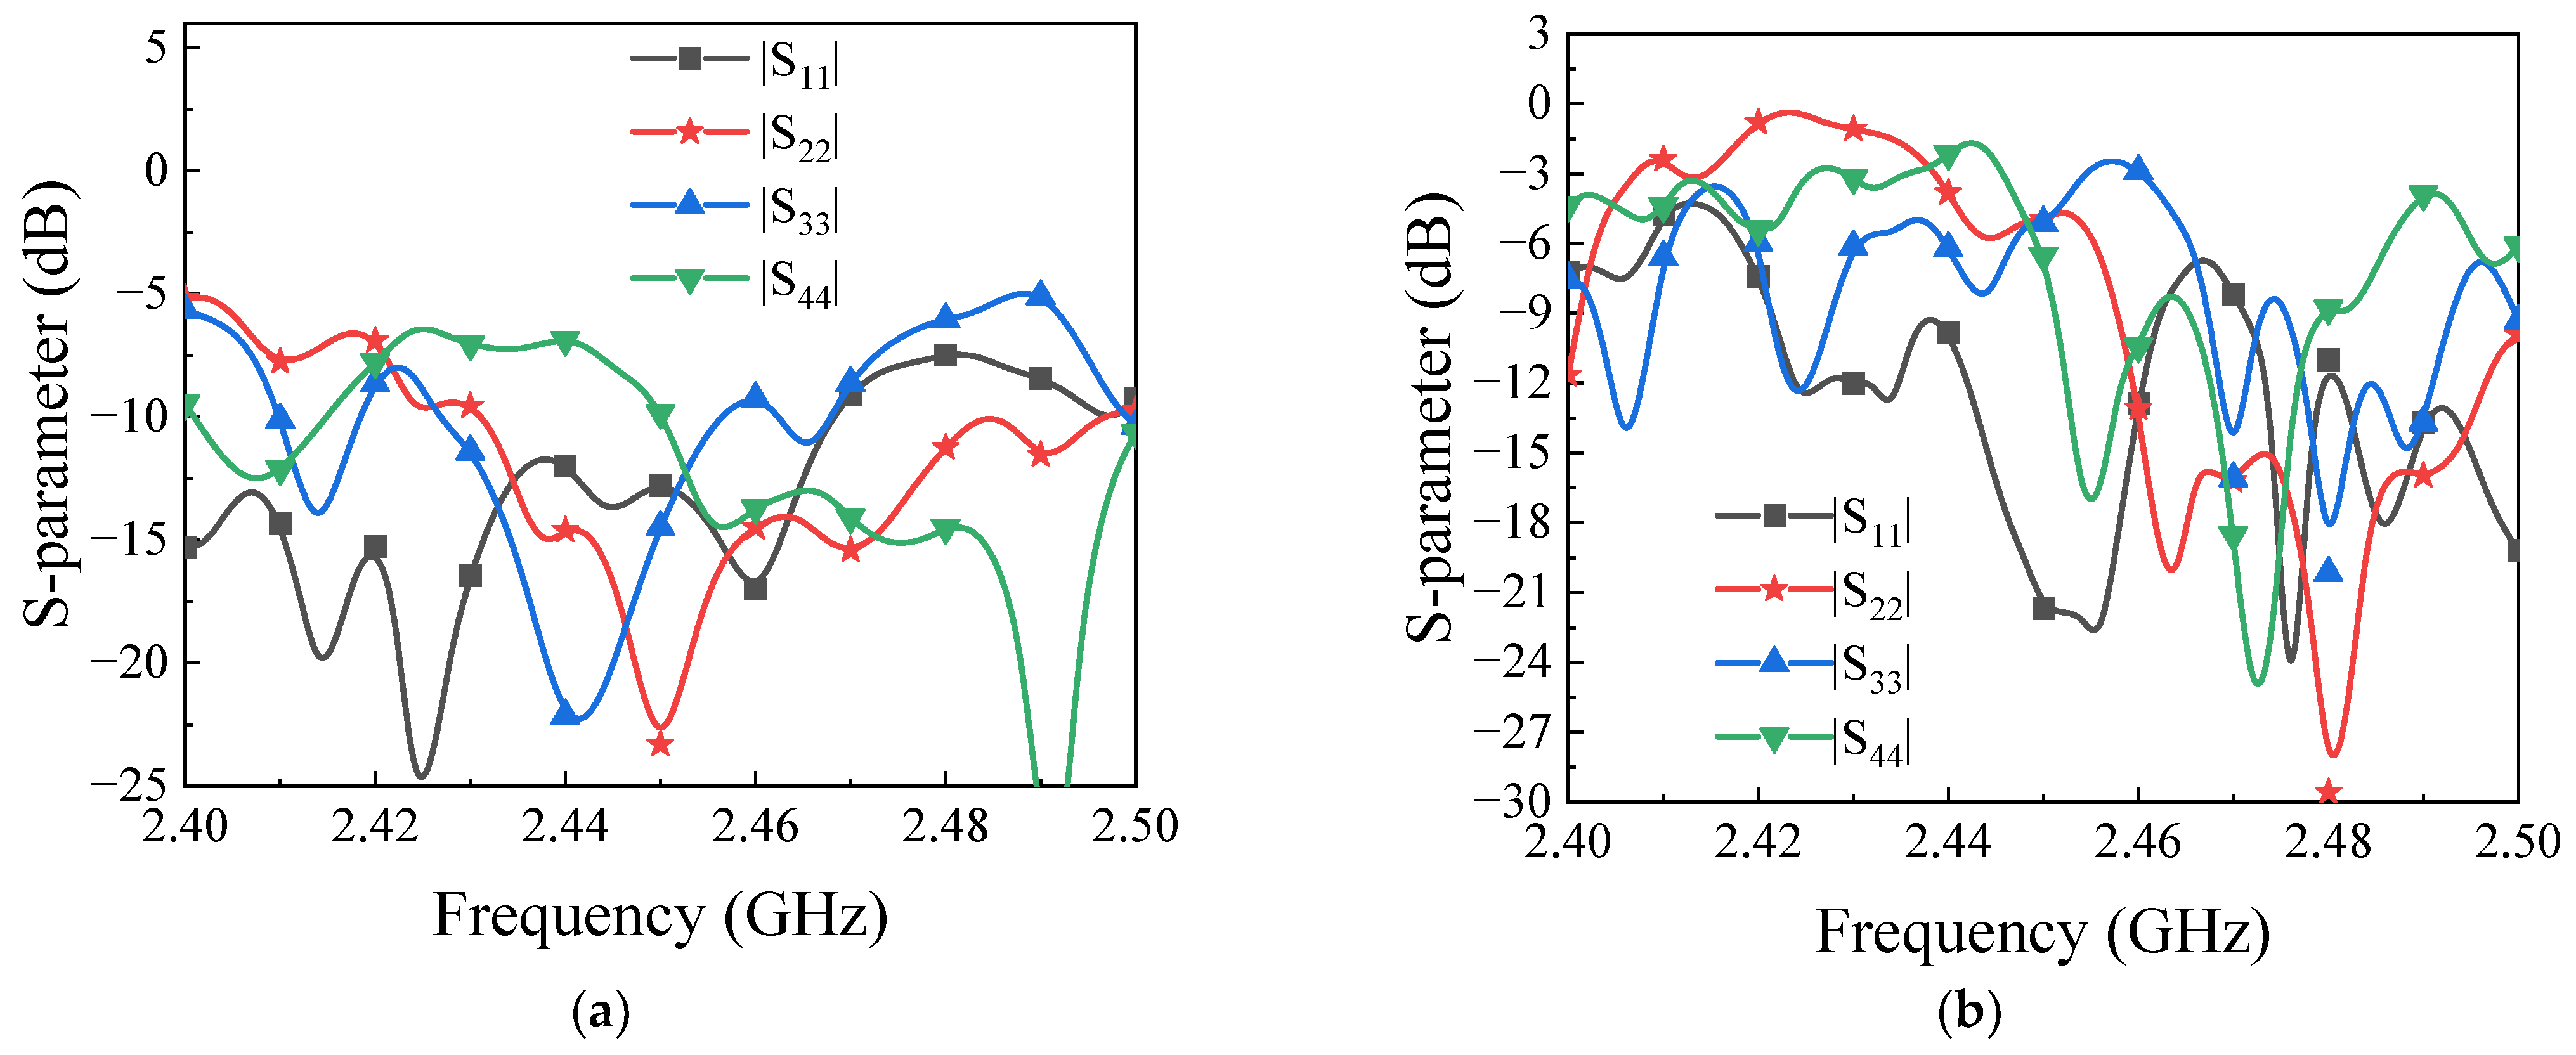
3.2. Frequency Tuning Method

Both fixed-frequency and variable-frequency drying were conducted with a four-port type when each port was fed by 200 W to dry 2 kg PETs. As depicted in Figure 14, the standard deviation of Figure 14a is 13.85 larger than 12.92 in Figure 14b, which is consistent with fixed-frequency drying exhibiting a clear boundary between hot and cold spots. However, the standard deviation may be influenced by the measurement error. Conversely, the microwave drying process observed a more even color distribution and lower temperature differences, 30.9 °C less than 49.6 °C at 2.48 GHz.
We obtained the average temperature data, shown in Figure 15, through the quantification indices program. In both cases, temperatures are directly proportional to drying time. The temperature curve of the variable-frequency method is smoother than the fixed-frequency method; thereby, the advantages of frequency adjustment have been proved.

3.3. Frequency Interval Tuning

By employing an intermittent on–off approach, the temperature can be controlled below the threshold of thermal runaway. However, the total energy is much more limited, making balancing efficiency and energy saving challenging. In practice, simple switch control only affects the global temperature in the cavity, which is the least effective method to improve uniformity. We require a method to alter the location and energy of hot spots, ensuring that the maximum temperature remains below a certain threshold.
Based on the SSG, we conducted experiments investigating the drying performance correlation to port number. A relationship exists between interval time, drying time, and drying effectiveness in a single-port system. To determine the appropriate interval time ∆t and drying time t, we established ∆t/t2 to represent the drying effect. Numerous experiments were conducted and are presented in Table 1.
When the inputting power is the same, the MC will decrease with the decrease in the ∆t/t2 value. However, drying time significantly influences the likelihood of thermal runaway occurring over time, especially at 100 W and 250 W. It indicates that decreasing the interval time allows for a gentler temperature trend. Particularly, when the temperature exceeds approximately 160 °C–170 °C, the likelihood of thermal runaway occurring in melting increases with the increase in the ∆t/t2 value, as depicted in Figure 16.
Based on the MC results, two optimum combinations for achieving uniformity and drying efficiency can be identified: (1) When the power is set at 150 W for 60 min with an interval of 5 min and (2) when the power is set at 250 W for 36 min with an interval of 3 min. These combinations corresponded to the MC values of 0.04% and 0.02%, respectively.
To verify the optimum interval time, we conducted tests at 150 W with an interval of 5 min. Table 2 shows that, as the value of ∆t/t2 increased, the temperature range varied from around 111.2 °C to 71.2 °C when the MC rose from 0.22% to 0.24%. Utilizing frequency tuning technology improved temperature uniformity. On the other hand, the results of the duration of 10 min in processes showed insensitivity in improving drying performance.

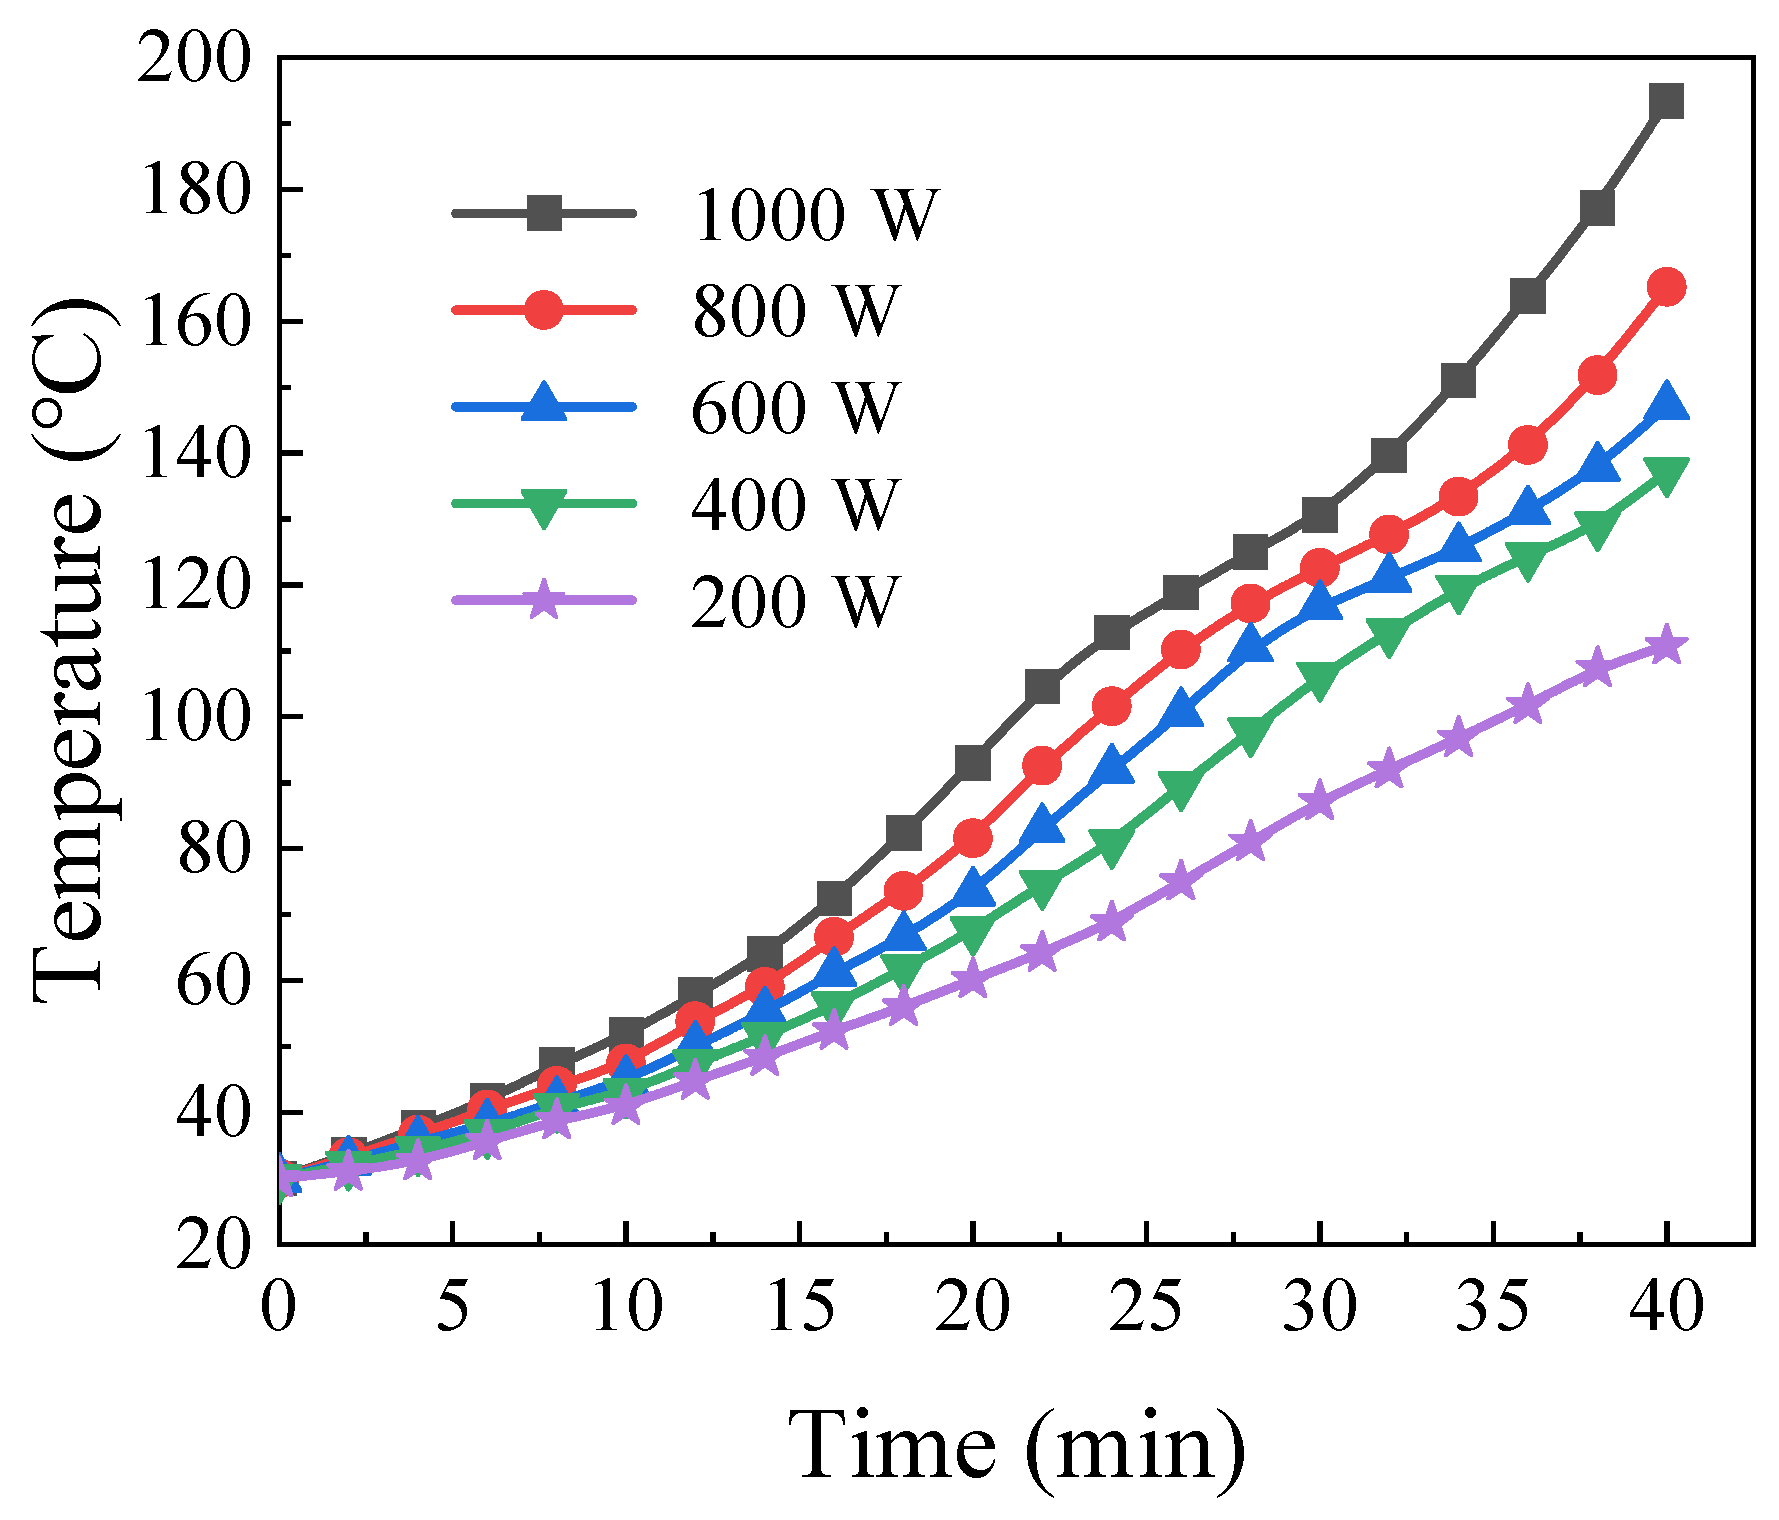
3.4. Optimal Microwave Power

Adopting the four-port feeding method, we conducted numerous experiments at each port with power levels of 50 W, 100 W, 150 W, 200 W, and 250 W, respectively. The recorded temperatures are shown in Figure 17. When the total power is set to 1000 W, the temperature reaches 193.4 °C in 40 min. However, the higher the input power, the higher the reflection power consumed.
Hence, compared to variable powers, the temperature rises more steeply with an increased input power level. Achieving a balance between extending drying time and avoiding thermal runaway can be accomplished through frequency adjustment with a smaller ∆t/t2 that is 0.00125 when the frequency range is from 2400 MHz to 2500 MHz with an adjustment interval of 10 MHz.
We conducted numerous experiments at the same ∆t/t2 value and mass of 2 kg to fit the trend of temperature rise at various power levels. We observed that the higher the input power, the steeper the equivalent slope when the temperature was constant at 200 °C for 40 min. The final slope reached a steady state at 200 W, indicating that thermal runaway is less likely to occur at low power levels.
When the drying temperature reaches 160 °C, PET’s permittivity surges, accompanied by a rapid increase in temperature. Consequently, monitoring permittivity by reflection and temperature becomes imperative to maintain drying stability.

4. Discussion

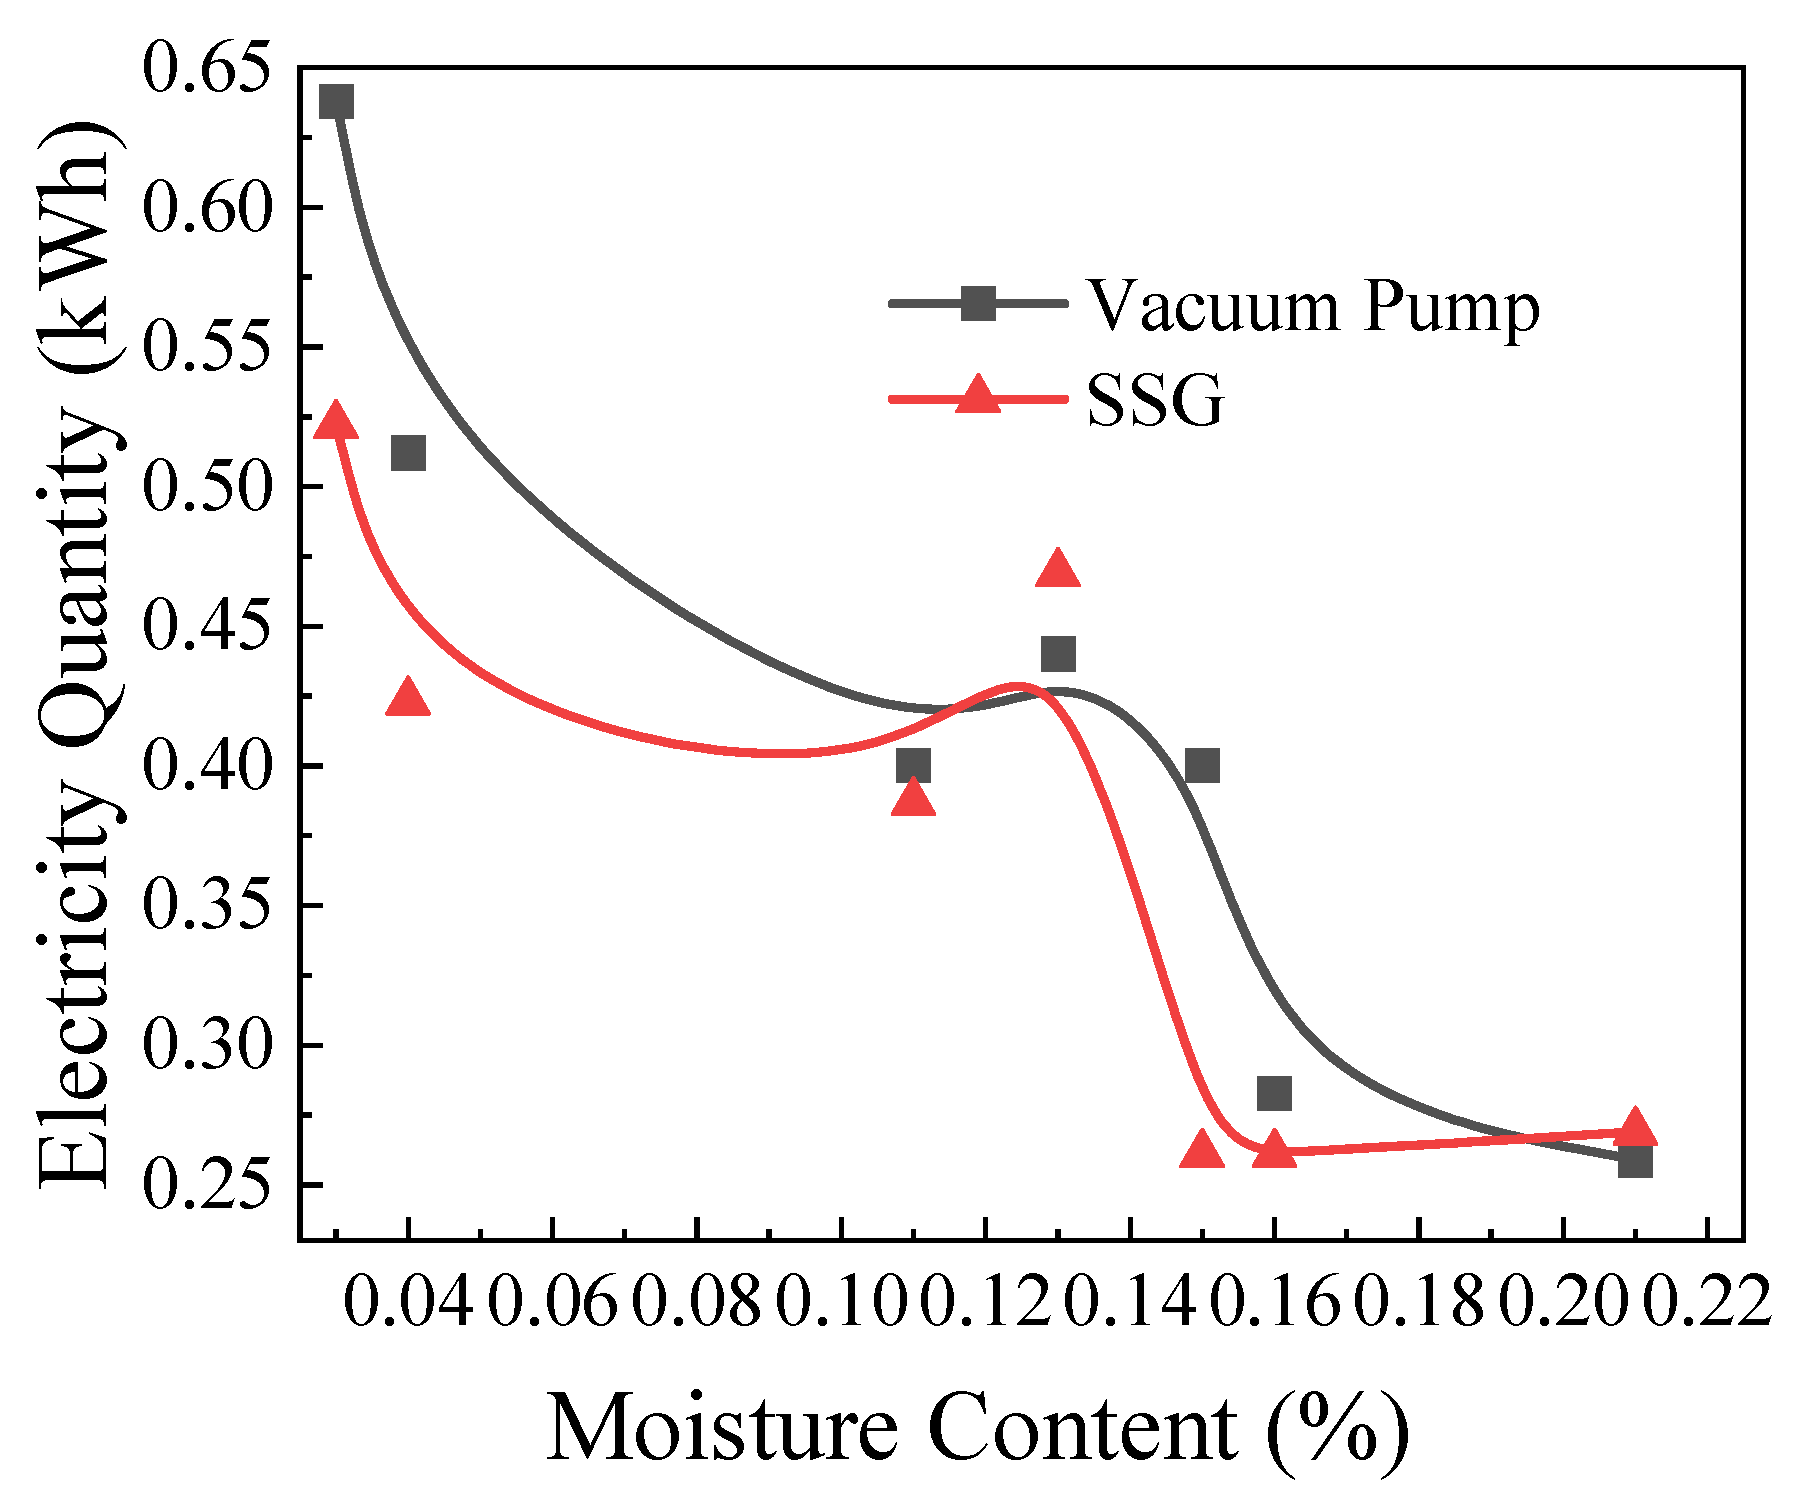
4.1. Electricity Consumption

To further assess the advantages of the adjustment method for PET drying, we measured the electricity quantity using an electricity meter. As depicted in Figure 18, electricity quantities were recorded when each port of the SSG was set at 150 W, and microwave drying time was restricted to approximately one hour. When power was at 150 W, the MC values were negatively correlated to the drying times and the electricity quantities. However, for an MC of 0.13%, reflection augmentation will consume more energy due to the higher reflection in the whole band, which may be caused by awkward frequency tuning.
It is worth noting that the vacuum pump’s variation tendency is consistent with the SSG one. When power is at 150 W, the vacuum pump’s contribution to energy consumption exceeds that of the SSG.
For different masses, energy consumption can be evaluated by reasonably selecting microwave power and heating time. When all four ports are operated, the electricity quantity will be around 2.726 kWh for approximately 2 kg of PETs, whose vacuum pump part is about 0.638 kWh, and the value of the single SSG part is around 0.522 kWh.
Figure 19 illustrates that the consumption increased as the MC values decreased at 250 W. At this stage, microwave power has been fully utilized through adjustment of frequency and time. The energy consumption for one kilogram of PET is approximately 0.61 kWh when reaching a drying limit of 0.02%.
Compared to [23], we reduced drying time to less than 2 h. Furthermore, there is a balance between input power and electricity consumption, indicating that poor absorption resulting from missing the optimal frequency or the occurrence of thermal runaway can deteriorate drying efficiency. When four ports were fed by 250 W separately, less reflection could reduce the electricity quantity from 2.726 kWh/kg to 1.561 kWh/kg due to less drying time, which was caused by lower reflection. It was related to permittivity.
Due to energy consumption being a vital index to embody economic and environmental benefits, we defined Q as
Q = P t M
where P is power in kW, t is working hours, and M is the mass of PETs. Considering other accessories, including a computer, sensor, and electromechanical device, our energy consumption is less than 3 kWh/kg.
Table 3 shows that, compared with those other works, this method for PET drying has a prominent energy conservation.

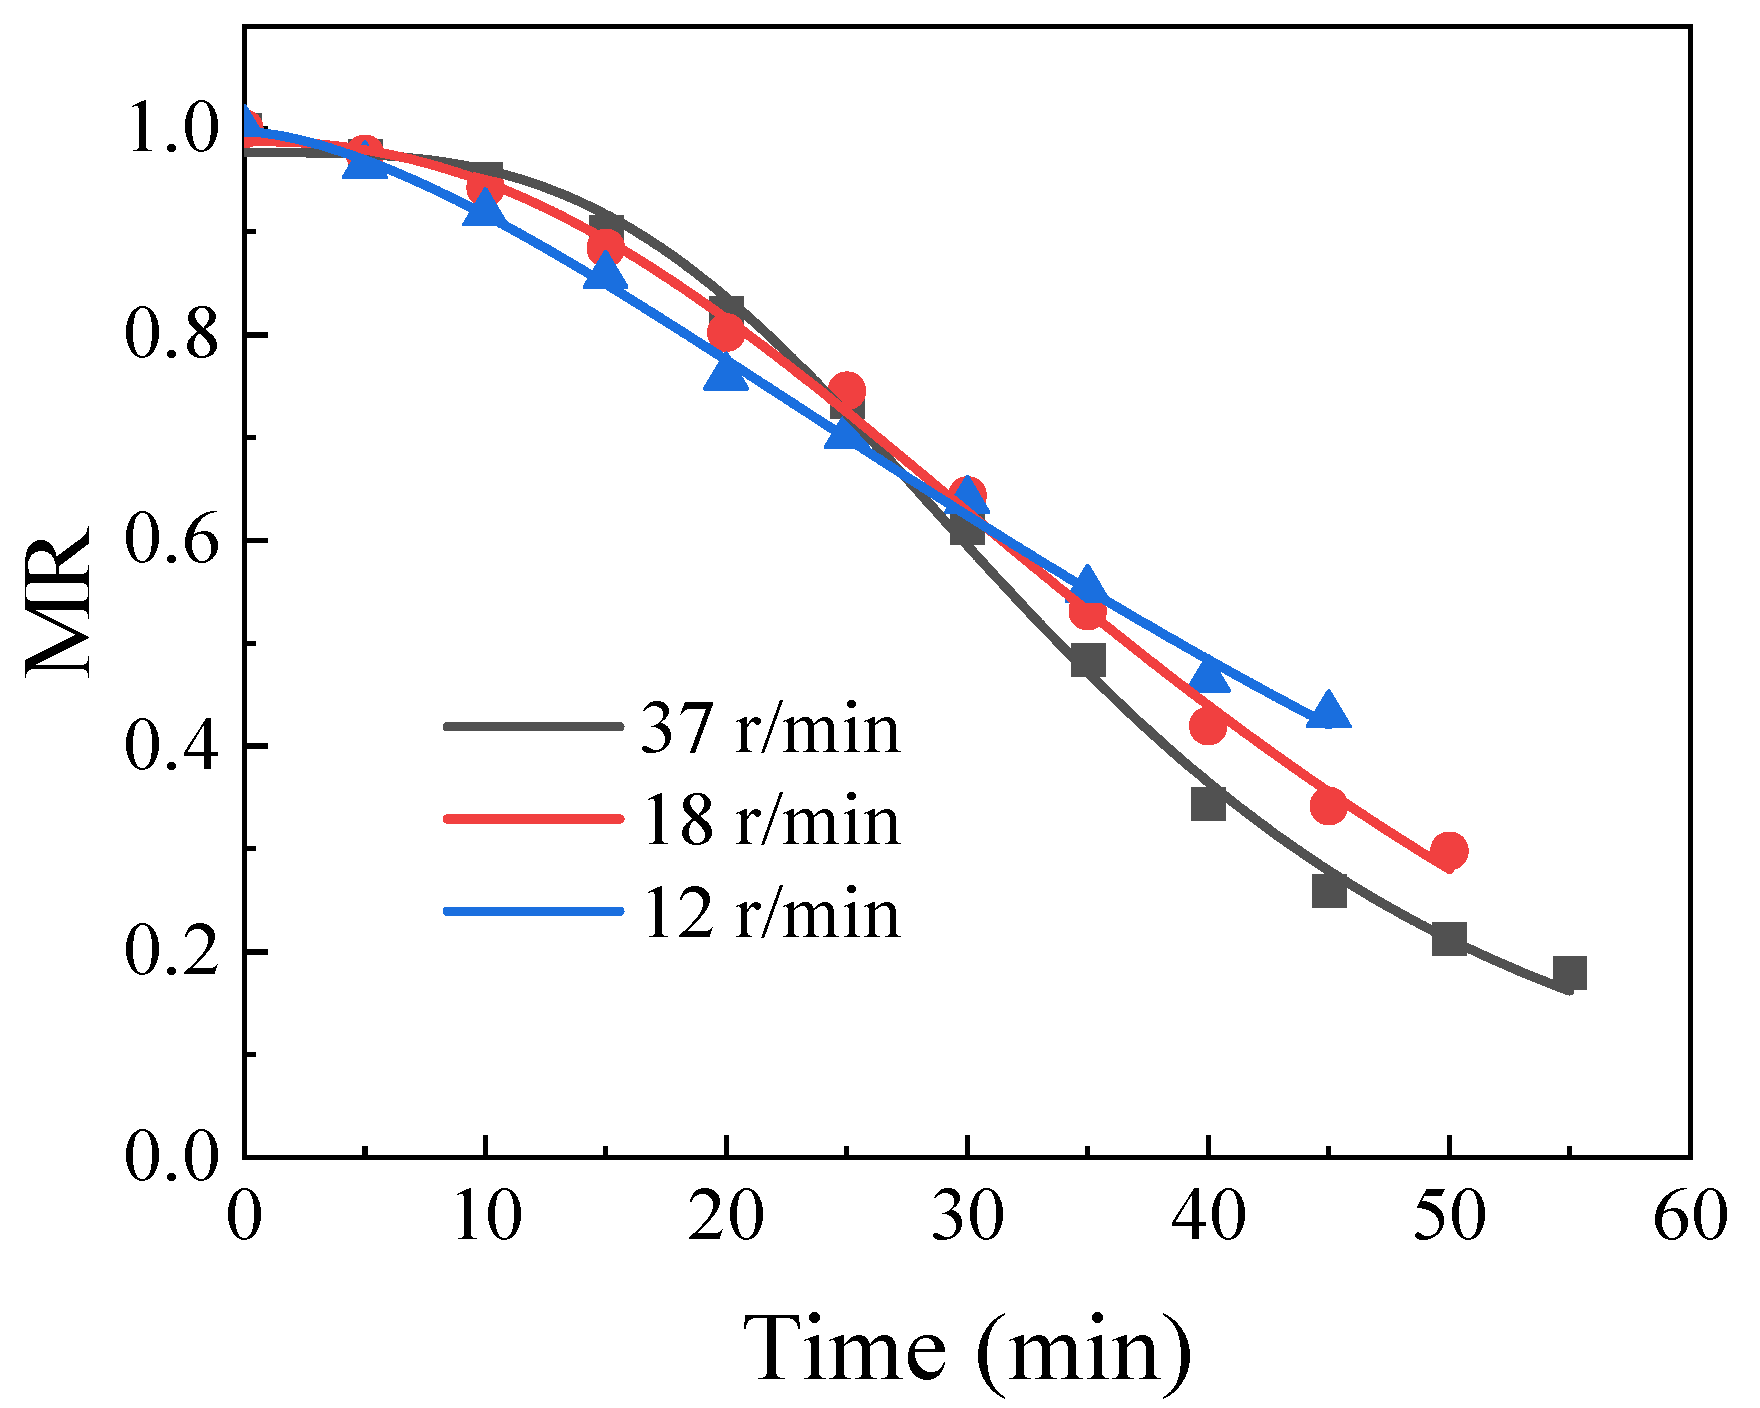
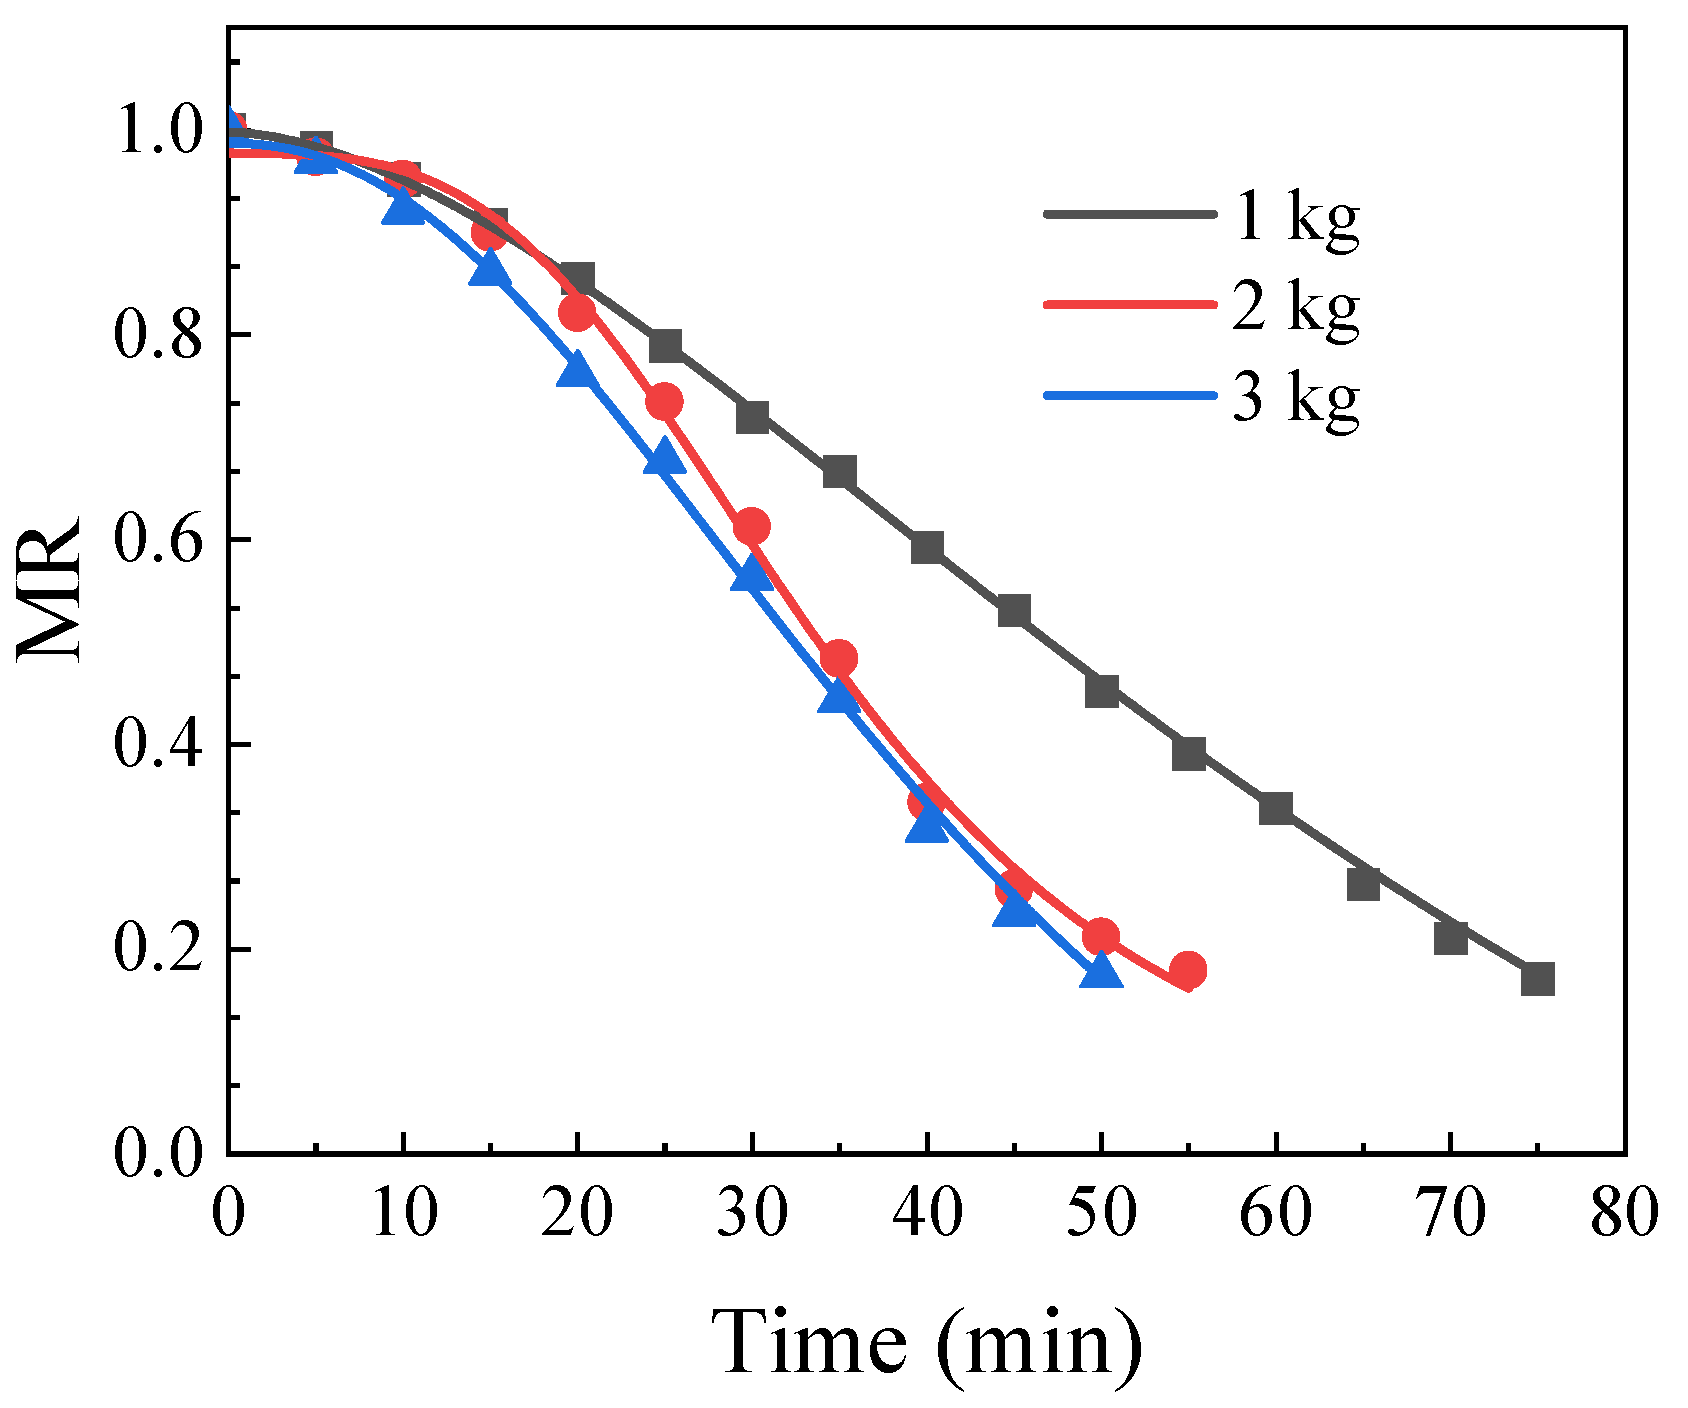
4.2. Normalized Value of MC

Further, we established a relationship between the normalized MC and drying time under different rotation speeds and power circumstances to predict drying effects.
We defined the MR as
M R = M t M e M 0 M e
where Me is the MC value at equilibrium when the drying process is nearing its end, which is close to 0 theoretically. Mt is the MC value when time is at t, and M0 is the initial value.
Combined with rotation, the uniformity of the temperature and the MC distribution will be evener. To reduce system error and sampling error, we measured the MR at variable rotation rates with frequency adjustment, which proved the directly proportional relationship between the rate of descent and rotation rate. Moreover, we tested the MR at different microwave powers when the rotation rate was fixed to determine the optimal drying power.
According to the logistic model, we obtained the relationship between the MR and time in variable rotation rate and power. The logistic model is
M R = A 2 + A 1 A 2 1 + x x 0 p
where coefficients A1, A2, x 0 , and p are shown in Table 4, Table 5, and Table 6, respectively. A1 presented that the initial value of the MR when x = 0, which should be close to 1. A2 presented that the final value of the MR should be close to 0. x 0 is the drying time when M R = ( A 1 + A 2 ) / 2 .
As for p, it is a constant derived by the logistic equation:
M R = d M R d x = A 1 A 2 p x p 1 x 0 p 1 + x x 0 p 2
M R x = x 0 = d M R d x = A 1 A 2 p 4 x 0
p = 4 x 0 M R ( x 0 ) A 2 A 1
When A2 < A1, the MC will decline gradually over time.
Furthermore, combining with the application, we studied the variations of the MC over time when the rotation speed was 37 r/min, 18 r/min, and 12 r/min in the late drying period to avoid thermal runaway, which was for a lower probability of melting. The poker bar was designed as shown in Figure 20. Teflon fabricated the rod section, and the fan parts are made of PPS materials.
The data obtained from many experiments were fitted in Figure 21, Figure 22, and Figure 23, respectively, through the logistic model.
We studied the effect of rotation rate at 800 W when drying time was limited to 60 min for 2 kg of PETs. By calculating the error of different rotation rates, the R-square of 37 r/min, 18 r/min, and 12 r/min are 0.99739, 0.9970, and 0.99721, respectively. When drying time reaches around 30 min, the decreasing rate of the MR becomes faster.
When the mass is less than 3 kg, the downtrend of the MC variations will be smoother as mass increases. The R-square of 1 kg, 2 kg, and 3 kg is 0.99911, 0.99739, and 0.99822, respectively, when each port is fed by 200 W.
Similarly, the R-square of 800 W, 600 W, and 400 W is 0.99739, 0.99855, and 0.99717 at 2 kg, respectively. The rate of descent increases with the increase in input power. In summary, efficiency promotion can be implemented by increasing the rotation rate and input power controlled within one hour through the frequency adjustment method. Due to the fitted metrics of the logistic model close to 1, we can explain the values of A1, A2, x 0 , and p to predict the tendencies.

5. Conclusions

Establishing fitted equations for the MR signifies that we can predict microwave drying time with a tuning method. It is significant for industrial applications to improve efficiency and reduce drying time during microwave drying.
In this study, we discovered that the parameters, including the number of ports, frequency variations, the ratios of interval period to time ∆t/t2, and microwave powers, can affect the temperature, the electricity consumption, and the MC variations. Regarding the number of ports, a positive correlation exists between port number and uniformity, which indicates that large-scale rapid drying devices can be achieved by increasing the number of ports. Conversely, the new index of ∆t/t2 shows that the ratios of interval period to time are inversely proportional to drying efficiency. We can improve the efficiency by increasing the value of ∆t/t2.
Finally, based on the reflection monitoring and frequency tuning method, we conducted numerous experiments to summarize the MR variation curves and evaluate the drying effect on different rotation rates, masses, and powers. Using this system, the data can be applied to predict the drying time requirement, the final MC value, and the electricity quantity for future industrial applications, which is fitted by the logistic model with the R-square value of nearly 0.99. Further, we can adjust the tuning strategy for industrial manufacture using a real-time closed-loop system.
Additionally, electricity quantity is reduced to less than 3 kW/kg when we consider the skin depths of large-scale systems and consumption of another device within 1 h, which is meaningful for energy conservation and emission reduction efforts in PET processing.

Author Contributions

C.L. (Chongwei Liao) conceptualized and designed the study while collecting and analyzing data. R.T. contributed to part of the experiment implementation and validation. W.Z. helped in the simulation and programming for the study. Z.H. studied microwave sources and designed a partial experimental apparatus. C.W. and C.L. (Changjun Liu) established the direction of the research while critically revising it for important intellectual content. All authors approved the final version of the manuscript and agreed to be accountable for all aspects of the work to ensure that questions related to the accuracy or integrity of any part of the work are appropriately investigated and resolved. All authors have read and agreed to the published version of the manuscript.

Funding

This work was supported in part by the National Natural Science Foundation of China under Grant 62071316 and U2015A22, and the Sichuan Science and Technology Program under Grant 2024YFHZ0282.

Data Availability Statement

The original contributions presented in the study are included in the article; further inquiries can be directed to the corresponding author.

Conflicts of Interest

Author Chuanlong Wang was employed by the company Sichuan Yibin Plastic Packaging Materials Co., Ltd. The remaining authors declare that the research was conducted in the absence of any commercial or financial relationships that could be construed as a potential conflict of interest. The Sichuan Yibin Plastic Packaging Materials Co., Ltd. had no role in the design of the study; in the collection, analyses, or interpretation of data; in the writing of the manuscript, or in the decision to publish the results.

References

  1. Nisticò, R. Polyethylene terephthalate (PET) in the packaging industry. Polym. Test. 2020, 90, 106707. [Google Scholar] [CrossRef]
  2. Shen, L.; Zhou, J.; Zhang, X. In situ investigation of the thermal characteristics of microwave resonance-induced focused hotspots in dimers for improving microwave heating uniformity. Case Stud. Therm. Eng. 2024, 54, 104052. [Google Scholar] [CrossRef]
  3. Atuonwu, J.C.; Tassou, S.A. Quality assurance in microwave food processing and the enabling potentials of solid-state power generators: A review. Food Eng. 2018, 234, 1–15. [Google Scholar] [CrossRef]
  4. Sickert, T.; Kalinke, I.; Christoph, J.; Gaukel, V. Microwave-Assisted Freeze-Drying with Frequency-Based Control Concepts via Solid-State Generators: A Simulative and Experimental Study. Processes 2023, 11, 327. [Google Scholar] [CrossRef]
  5. Robinson, M.C.; Molles, J.A.; Yakovlev, V.V.; Popovic, Z. Solid-State Power Combining for Heating Small Volumes of Mixed Waste Materials. IEEE J. Microw. 2023, 3, 881–893. [Google Scholar] [CrossRef]
  6. Yang, R.; Fathy, A.E.; Morgan, M.T.; Chen, J. Development of a complementary-frequency strategy to improve microwave heating of gellan gel in a solid-state system. Food Eng. 2022, 314, 110763. [Google Scholar] [CrossRef]
  7. Wang, S.; Shen, Y.; Liao, C.; Jing, J.; Liu, C. A Novel Injection-Locked S-Band Oven Magnetron System Without Waveguide Isolators. IEEE Trans. Electron Devices 2023, 70, 1886–1893. [Google Scholar] [CrossRef]
  8. Dinani, S.T.; Feldmann, E.; Kulozik, U. Effect of heating by solid-state microwave technology at fixed frequencies or by frequency sweep loops on heating profiles in model food samples. Food Bioprod. Process. 2021, 127, 328–337. [Google Scholar] [CrossRef]
  9. Wang, S.; Zhao, Y.; Chen, X.; Liu, C. A Novel Stability Improvement Method of S -Band Magnetron Systems Based on Its Anode Current Feature. IEEE Trans. Microw. Theory Tech. 2024, 1–10. [Google Scholar] [CrossRef]
  10. Uziel, A.; Milay, L.; Procaccia, S.; Cohen, R.; Burstein, A.; Sulimani, L.; Shreiber-Livne, I.; Lewitus, D.; Meiri, D. Solid-State Microwave Drying for Medical Cannabis Inflorescences: A Rapid and Controlled Alternative to Traditional Drying. Cannabis Cannabinoid Res. 2024, 9, 397–408. [Google Scholar] [CrossRef]
  11. Barnard, E.; Arias, J.J.R.; Thielemans, W. Chemolytic depolymerisation of PET: A review. Green Chem. 2021, 23, 3765–3789. [Google Scholar] [CrossRef]
  12. Gerassimidou, S.; Lanska, P.; Hahladakis, J.N.; Lovat, E.; Vanzetto, S.; Geueke, B.; Groh, K.J.; Muncke, J.; Maffini, M.; Martin, O.V.; et al. Unpacking the complexity of the PET drink bottles value chain: A chemicals perspective. J. Hazard Mater. 2022, 15, 128410. [Google Scholar] [CrossRef] [PubMed]
  13. Lv, W.Q.; Li, D.; Lv, H.; Jin, X.; Han, Q.H.; Su, D.B.; Wang, Y.C. Recent development of microwave fluidization technology for drying of fresh fruits and vegetables. Trends Food Sci. Technol. 2019, 86, 59–67. [Google Scholar] [CrossRef]
  14. Chang, H.-C.; Chen, S.-D. Study on Microwave Freeze-Drying of Krill. Processes 2024, 12, 1366. [Google Scholar] [CrossRef]
  15. Wang, G.; Zhang, K.; Huang, B.; Zhang, K.; Chao, C. Microwave Drying of Sewage Sludge: Process Performance and Energy Consumption. Processes 2024, 12, 432. [Google Scholar] [CrossRef]
  16. Carvalho, G.R.; Monteiro, R.L.; Laurindo, J.B.; Augusto, P.E.D. Microwave and microwave-vacuum drying as alternatives to convective drying in barley malt processing. Innov. Food Sci. Emerg. Technol. 2021, 73, 102770. [Google Scholar] [CrossRef]
  17. Askar, M.K.; Al-Kamaki, Y.S.; Hassan, A. Utilizing polyethylene terephthalate PET in concrete: A review. Polymers 2023, 15, 3320. [Google Scholar] [CrossRef] [PubMed]
  18. Da Silva, F.Z.; Bastos, I.C. Study on heat exchangers and industrial absorption column for drying polyethylene terephthalate. Chem. Ind. Chem. Eng. Q. 2023, 29, 129–139. [Google Scholar] [CrossRef]
  19. Lebaudy, P.; Estel, L.; Ledoux, A. Microwave heating of poly(ethylene terephthalate) bottle preforms used in the thermoforming process. J. Appl. Polym. Sci. 2008, 108, 2408–2414. [Google Scholar] [CrossRef]
  20. Korhummel, S.; Rosen, A.; Popović, Z. Over-moded cavity for multiple-electronic-device wireless charging. IEEE Trans. Microw. Theory Tech. 2014, 62, 1074–1079. [Google Scholar] [CrossRef]
  21. Wei, W.; Shao, Z.; Qiao, R.; Chen, W.; Zhou, H.; Yuan, Y. Recent development of microwave applications for concrete treatment. Constr. Build. Mater. 2021, 269, 121224. [Google Scholar] [CrossRef]
  22. Hill, D.A. Electromagnetic Fields in Cavities: Deterministic and Statistical Theories; John Wiley Sons: Hoboken, NJ, USA, 2009. [Google Scholar] [CrossRef]
  23. Stoughton, P. Guidelines for Drying PET. Plast. Technol. 2014, 60, 50–55. [Google Scholar]
  24. Hubbard, B.R.; Putman, L.I.; Techtmann, S.; Pearce, J.M. Open Source Vacuum Oven Design for Low-Temperature Drying: Performance Evaluation for Recycled PET and Biomass. J. Manuf. Mater. Proc. 2021, 5, 52. [Google Scholar] [CrossRef]
  25. Hu, C.; Piva, R.; Shen, B. Application of low energy consumption turbofan hot air dryer in PET plastic drying. Mach. China 2022, 3, 56–58. [Google Scholar]
Figure 1. A schematic view of the cavity.
Processes 12 01488 g001
Figure 2. The 3D graph of the cavity. (a) The view of port 3 and port 4. (b) The view of port 1 and port 2.
Processes 12 01488 g002
Figure 3. The dimensions of the sample.
Processes 12 01488 g003
Figure 4. The imaginary and real parts of the PET permittivity with respect to temperature [19].
Processes 12 01488 g004
Figure 5. S-parameter between 2400 MHz and 2500 MHz. (a) Temperature is at 21 °C. (b) Temperature is at 180 °C.
Processes 12 01488 g005
Figure 6. |S11| related to the PET permittivity at 2.48 GHz.
Processes 12 01488 g006
Figure 7. Simulated temperature distribution at 2.414 GHz. (a) Three cross sections; (b) horizontal cross section.
Processes 12 01488 g007
Figure 8. Simulated temperature distribution with frequency tuning. (a) Three cross sections; (b) horizontal cross section.
Processes 12 01488 g008
Figure 9. The microwave drying system.
Processes 12 01488 g009
Figure 10. Microwave drying cavity with feeding ports.
Processes 12 01488 g010
Figure 11. The scheme of drying for PET.
Processes 12 01488 g011
Figure 12. Reflected power (left) and frequency variations (right) during microwave drying conducted twice.
Processes 12 01488 g012
Figure 13. Comparison between temperature variations of 2-port and 4-port microwave feeding.
Processes 12 01488 g013
Figure 14. Comparison of temperature distribution at 30 min. (a) At 2.48 GHz. (b) Variable frequency.
Processes 12 01488 g014
Figure 15. Temperature variations under variations and a fixed frequency microwave drying.
Processes 12 01488 g015
Figure 16. PET melting regions are marked by red circles. (a) # 9 * in Table 1 when the maximum temperature is 196 °C. (b) # 2 * in Table 1 when the maximum temperature is 220 °C.
Processes 12 01488 g016
Figure 17. Variations of the average temperature at various microwave powers.
Processes 12 01488 g017
Figure 18. Electricity consumption at microwave power of 150 W.
Processes 12 01488 g018
Figure 19. Electricity consumption at microwave power of 250 W.
Processes 12 01488 g019
Figure 20. The physical picture of the stirring device. (a) The stirring paddle. (b) The rotary motor (Welldone Transmission 61K120R9U).
Processes 12 01488 g020
Figure 21. The curve is fitted by the logistic model when variations of the MR are at different rotated speeds.
Processes 12 01488 g021
Figure 22. Curves are fitted by the logistic model when variations of the MR occur at different masses.
Processes 12 01488 g022
Figure 23. The curve is fitted by the logistic model when the variations of the MR are at different input powers.
Processes 12 01488 g023
Table 1. Drying effect for different interval times on final moisture content.
TypePower
(W)
Mass
(g)
t/t2
(1/min)
t
(min)
Moisture
(%)
#110016960.0400500.32
#2 *10016760.0310750.20
#310017350.0014550.04
#415017350.0391600.13
#515016740.0014600.04
#625018060.0139120.21
#725017560.0050200.21
#825017800.0022300.07
#9 *25017830.0015360.02
Note: * means “melting”.
Table 2. Drying effects on the final moisture content when power was at 150 W.
t/t2
(1/min)
Power
(W)
Mass
(g)
Temperature
(°C)
Moisture
(%)
0.0056150196971.20.24
0.00141501969111.20.22
0.00101501969107.20.22
Table 3. Comparing energy consumption with the conventional method.
WorkQ
(kWh/kg)
Time
(min)
[24]4060
[25]1860
This work2.72660
Table 4. Logistic model of variable rotation rates.
A1A2 x 0 p
0.97706−0.008534.651273.27773
0.98816−0.009144.748522.28254
0.99751−0.013456.116671.61805
Table 5. Logistic model of variable masses.
A1A2 x 0 p
0.99811−0.5308278.675221.73389
0.977170.0483036.302103.49797
0.98715−0.2078849.195672.42808
Table 6. Logistic model of variable powers.
A1A2 x 0 p
0.98871−0.007634.65283.2772
0.99043−0.018251.40572.0707
1.01010.0012150.47371.3933
Disclaimer/Publisher’s Note: The statements, opinions and data contained in all publications are solely those of the individual author(s) and contributor(s) and not of MDPI and/or the editor(s). MDPI and/or the editor(s) disclaim responsibility for any injury to people or property resulting from any ideas, methods, instructions or products referred to in the content.

