Review

A Review of the Utilization of CO2 as a Cushion Gas in Underground Natural Gas Storage

1
School of Petroleum Engineering, Northeast Petroleum University, Daqing 163318, China
2
Key Laboratory of EOR, Ministry of Education, Northeast Petroleum University, Daqing 163318, China
3
No. 3 Gas Production Plant of Changqing Oilfield Company, Xi’an 710018, China
*
Author to whom correspondence should be addressed.
Processes 2024, 12(7), 1489; https://doi.org/10.3390/pr12071489
Submission received: 24 June 2024 / Revised: 9 July 2024 / Accepted: 14 July 2024 / Published: 16 July 2024
(This article belongs to the Section Energy Systems)

Abstract

:
A cushion gas is an indispensable and the most expensive part of underground natural gas storage. Using CO2 injection to provide a cushion gas, not only can the investment in natural gas storage construction be reduced but the greenhouse effect can also be reduced. Currently, the related research about the mechanism and laws of CO2 as a cushion gas in gas storage is not sufficient. Consequently, the difference in the physical properties of CO2 and CH4, and the mixing factors between CO2 and natural gas, including the geological conditions and injection–production parameters, are comprehensively discussed. Additionally, the impact of CO2 as a cushion gas on the reservoir stability and gas storage capacity is also analyzed by comparing the current research findings. The difference in the viscosity, density, and compressibility factor between CO2 and CH4 ensures a low degree of mixing between CO2 and natural gas underground, thereby improving the recovery of CH4 in the operation process of gas storage. In the pressure range of 5 MPa–13 MPa and temperature range of 303.15 K–323.15 K, the density of CO2 increases five to eight times, while the density of natural gas only increases two to three times, and the viscosity of CO2 is more than 10 times that of CH4. The operation temperature and pressure in gas storage should be higher than the temperature and pressure in the supercritical conditions of CO2 because the diffusion ability between the gas molecules is increased in these conditions. However, the temperature and pressure have little effect on the mixing degree of CO2 and CH4 when the pressure is over the limited pressure of supercritical CO2. The CO2, with higher compressibility, can quickly replenish the energy of the gas storage facility and provide sufficient elastic energy during the natural gas production process. In addition, the physical properties of the reservoir also have a significant impact on the mixing and production of gases in gas storage facilities. The higher porosity reduces the migration speed of CO2 and CH4. However, the higher permeability promotes diffusion between gases, resulting in a higher degree of gas mixing. For a large inclination angle or thick reservoir structure, the mixed zone width of CO2 and CH4 is small under the action of gravity. An increase in the injection–production rate intensifies the mixing of CO2 and CH4. The injection of CO2 into reservoirs also induces the CO2–water–rock reactions, which improves the porosity and is beneficial in increasing the storage capacity of natural gas.

1. Introduction

Natural gas is an important strategic energy source for countries around the world [1]. This is reflected in three main ways. Firstly, natural gas has a higher price–performance ratio than oil, coal, etc. Secondly, natural gas brings greater economic benefits. Finally, natural gas is a cleaner fossil fuel. The seasonal and geographical differences, as well as supply–demand contradictions, have led to the increasing significance of natural gas for emergency peak shaving and strategic reserves. Building underground natural gas storage is one of the most effective ways to solve the supply–demand contradiction [2,3]. The most important types of gas storage in underground reservoirs are depleted oil and gas reservoirs (e.g., Dagang Oilfield Dazhangtuo Storage, New York City Oilfield Gas Storage in the U.S.), aquifer reservoirs (e.g., Kentucky Underground Storage in the U.S., Kasimov Underground Storage in Russia), salt cavern reservoirs (e.g., Jintan Storage in Jiangsu Province), and so on [4,5]. As shown in Figure 1, according to the International Gas Union (IGU), a total of 715 underground natural gas storage facilities have been constructed in 37 countries in the world, and 672 are being operated. The total working capacity is 3530 × 108 m3, accounting for about 11.7% of the current global natural gas consumption [6]. Meanwhile, 95% of the world’s underground natural gas storage is mainly distributed in North America, the European Union, and Russia. The underground natural gas storage demand in various regions of the world is listed in Table 1. By 2030, the global natural gas demand will increase to 5030 × 108 m3, and 183 new underground natural gas storage facilities will be required, as well as 1406 × 108 m3 of extra working gas to meet the future peak demand [7].
Under a certain temperature and pressure, the amount of natural gas that can be held in an underground natural gas storage facility is called the reservoir capacity, of which 25% to 75% will be retained as a cushion gas in the reservoir during operation. A cushion gas is used to inhibit the flow of formation water, provide pressure for the production of working gas, and ensure the stability of the reservoir (Figure 2) [8,9,10]. In the early days, most gas storage facilities, both domestically and internationally, used natural gas as a cushion gas. When the gas storage is abandoned, natural gas as a cushion gas is not extracted, which leads to serious capital deposition [11]. To reduce the investment cost of gas storage and enhance natural gas recovery, countries such as America and France have attempted to use inert gas as a cushion gas to replace natural gas [12]. However, there is a mixing problem between working gas and inert gas. Thus, the gas mixing phenomenon was analyzed by using a 3D model of the mixing gas before the project’s implementation, to ensure the quality of natural gas production [13,14,15,16,17]. After this, France carried out pre-inflation tests and simulated the gas storage characteristics using 3D network modeling to predict the mixing of the working gas and cushion gas in the formation. Moreover, they successfully replaced the original natural gas with 20% nitrogen (N2) as a cushion gas in the Saint Clair Sur Epte reservoir, and no N2 was detected during gas production [12]. Blicharski et al. proposed a convection–diffusion equation that was described in porous media in a mixed phase [18]. In addition, gas–gas displacement was carried out in the well area of Wierzchowice gas storage, and the simulation results were in agreement with the actual data. The mixing zone varies from tens of meters to 200 m. N2 as a cushion gas reduces the initial construction cost of gas storage. However, in the process of high-intensity injection–production peak shaving, the similar physical properties of natural gas and N2 render them easy to mix, and the recovery and enthalpy of natural gas are reduced. In more serious cases, the dynamic characteristics of the gas storage are changed, resulting in local blockage [19]. Therefore, it is particularly important to find a cheap gas with a large difference in physical properties compared to CH4 (the main component of natural gas) for use as a cushion gas.
Oldenburg et al., in a study aimed at improving natural gas recovery, pointed out that when the reservoir temperature was slightly higher than the critical temperature of CO2, the movement process in the gas reservoir was more inclined towards CO2 displacing CH4 [20]. During the displacement, an inclined mixed-phase transition zone was formed, and there was no extensive mixing. Oldenburg also proposed that the CO2 trapped inside the gas storage could be used as a cushion gas, which reduces the investment cost of underground natural gas storage to a certain extent [21,22]. Kim et al. compared the performance of N2 and CO2 as cushion gases for underground natural gas storage [23]. The results showed that when 20% of the cushion gas was replaced by N2 or CO2, N2 reduced the gas production index by about 10%, and CO2 reduced it by about 5%. CO2 is more suitable for a cushion gas than N2 in terms of the production index. Mu et al. analyzed the physical properties of CO2, CH4, and their mixtures, which proved the feasibility of CO2 as a cushion gas for underground natural gas storage [24]. It was noticed that the porosity, permeability, cushion gas ratio, and gas production rate had significant effects on the mixing degree and CH4 recovery. Sadeghi et al. used the heating value (HV) of gas production as an index to determine the mixing degree of natural gas and CO2 [25]. The effects of the injection–production parameters and the properties of the gas and rock on the HV of gas production were studied. Although the HV of the produced gas decreased with an increase in impurities, it cannot be used as an indicator for the analysis of the mixing degree of the working gas and cushion gas. In the later stage of gas production, the heating value of the CO2 cushion gas’ migration near the wellbore was also reduced. The artificial neural network (ANN) model developed by Helland et al. can accurately predict the key parameters in the operation of underground natural gas storage [26]. Under single-well injection–production conditions, the reservoir thickness and permeability are considered the most important parameters affecting the CO2 mole fraction up to 1%. Under seasonal injection–production and continuous CO2 injection conditions, the CO2 injection rate and the locations of the CH4 injection wells have a significant impact on the control of CO2 production in the seasonal cycle.
At present, the mechanism of CO2 as a cushion gas is not fully understood, and the research work is still in the exploratory stage. Thus, it is necessary to summarize the research progress regarding CO2 as a cushion gas, providing a valuable reference for engineering practice involving CO2 as a cushion gas. Regarding the environmental protection problems caused by the development of the natural gas industry and thermal power generation, CO2 as a cushion gas creates a win–win situation. It can save not only investment funds but also carbon storage and reduce the greenhouse effects [27,28]. In this paper, the effects of the physical properties of CO2, CH4, and their mixtures, as well as the geological conditions and injection–production parameters, on the mixing degree of CO2 as a cushion gas are discussed. The influence of CO2 as a cushion gas on the reservoir capacity and reservoir stability under high-intensity injection–production conditions for gas storage is analyzed. Finally, based on a summary of the literature research, the challenges of CO2 as a cushion gas are listed. The specific discussion content is shown in Figure 3.
Figure 2. Schematic diagram of UGS [24].
Processes 12 01489 g002

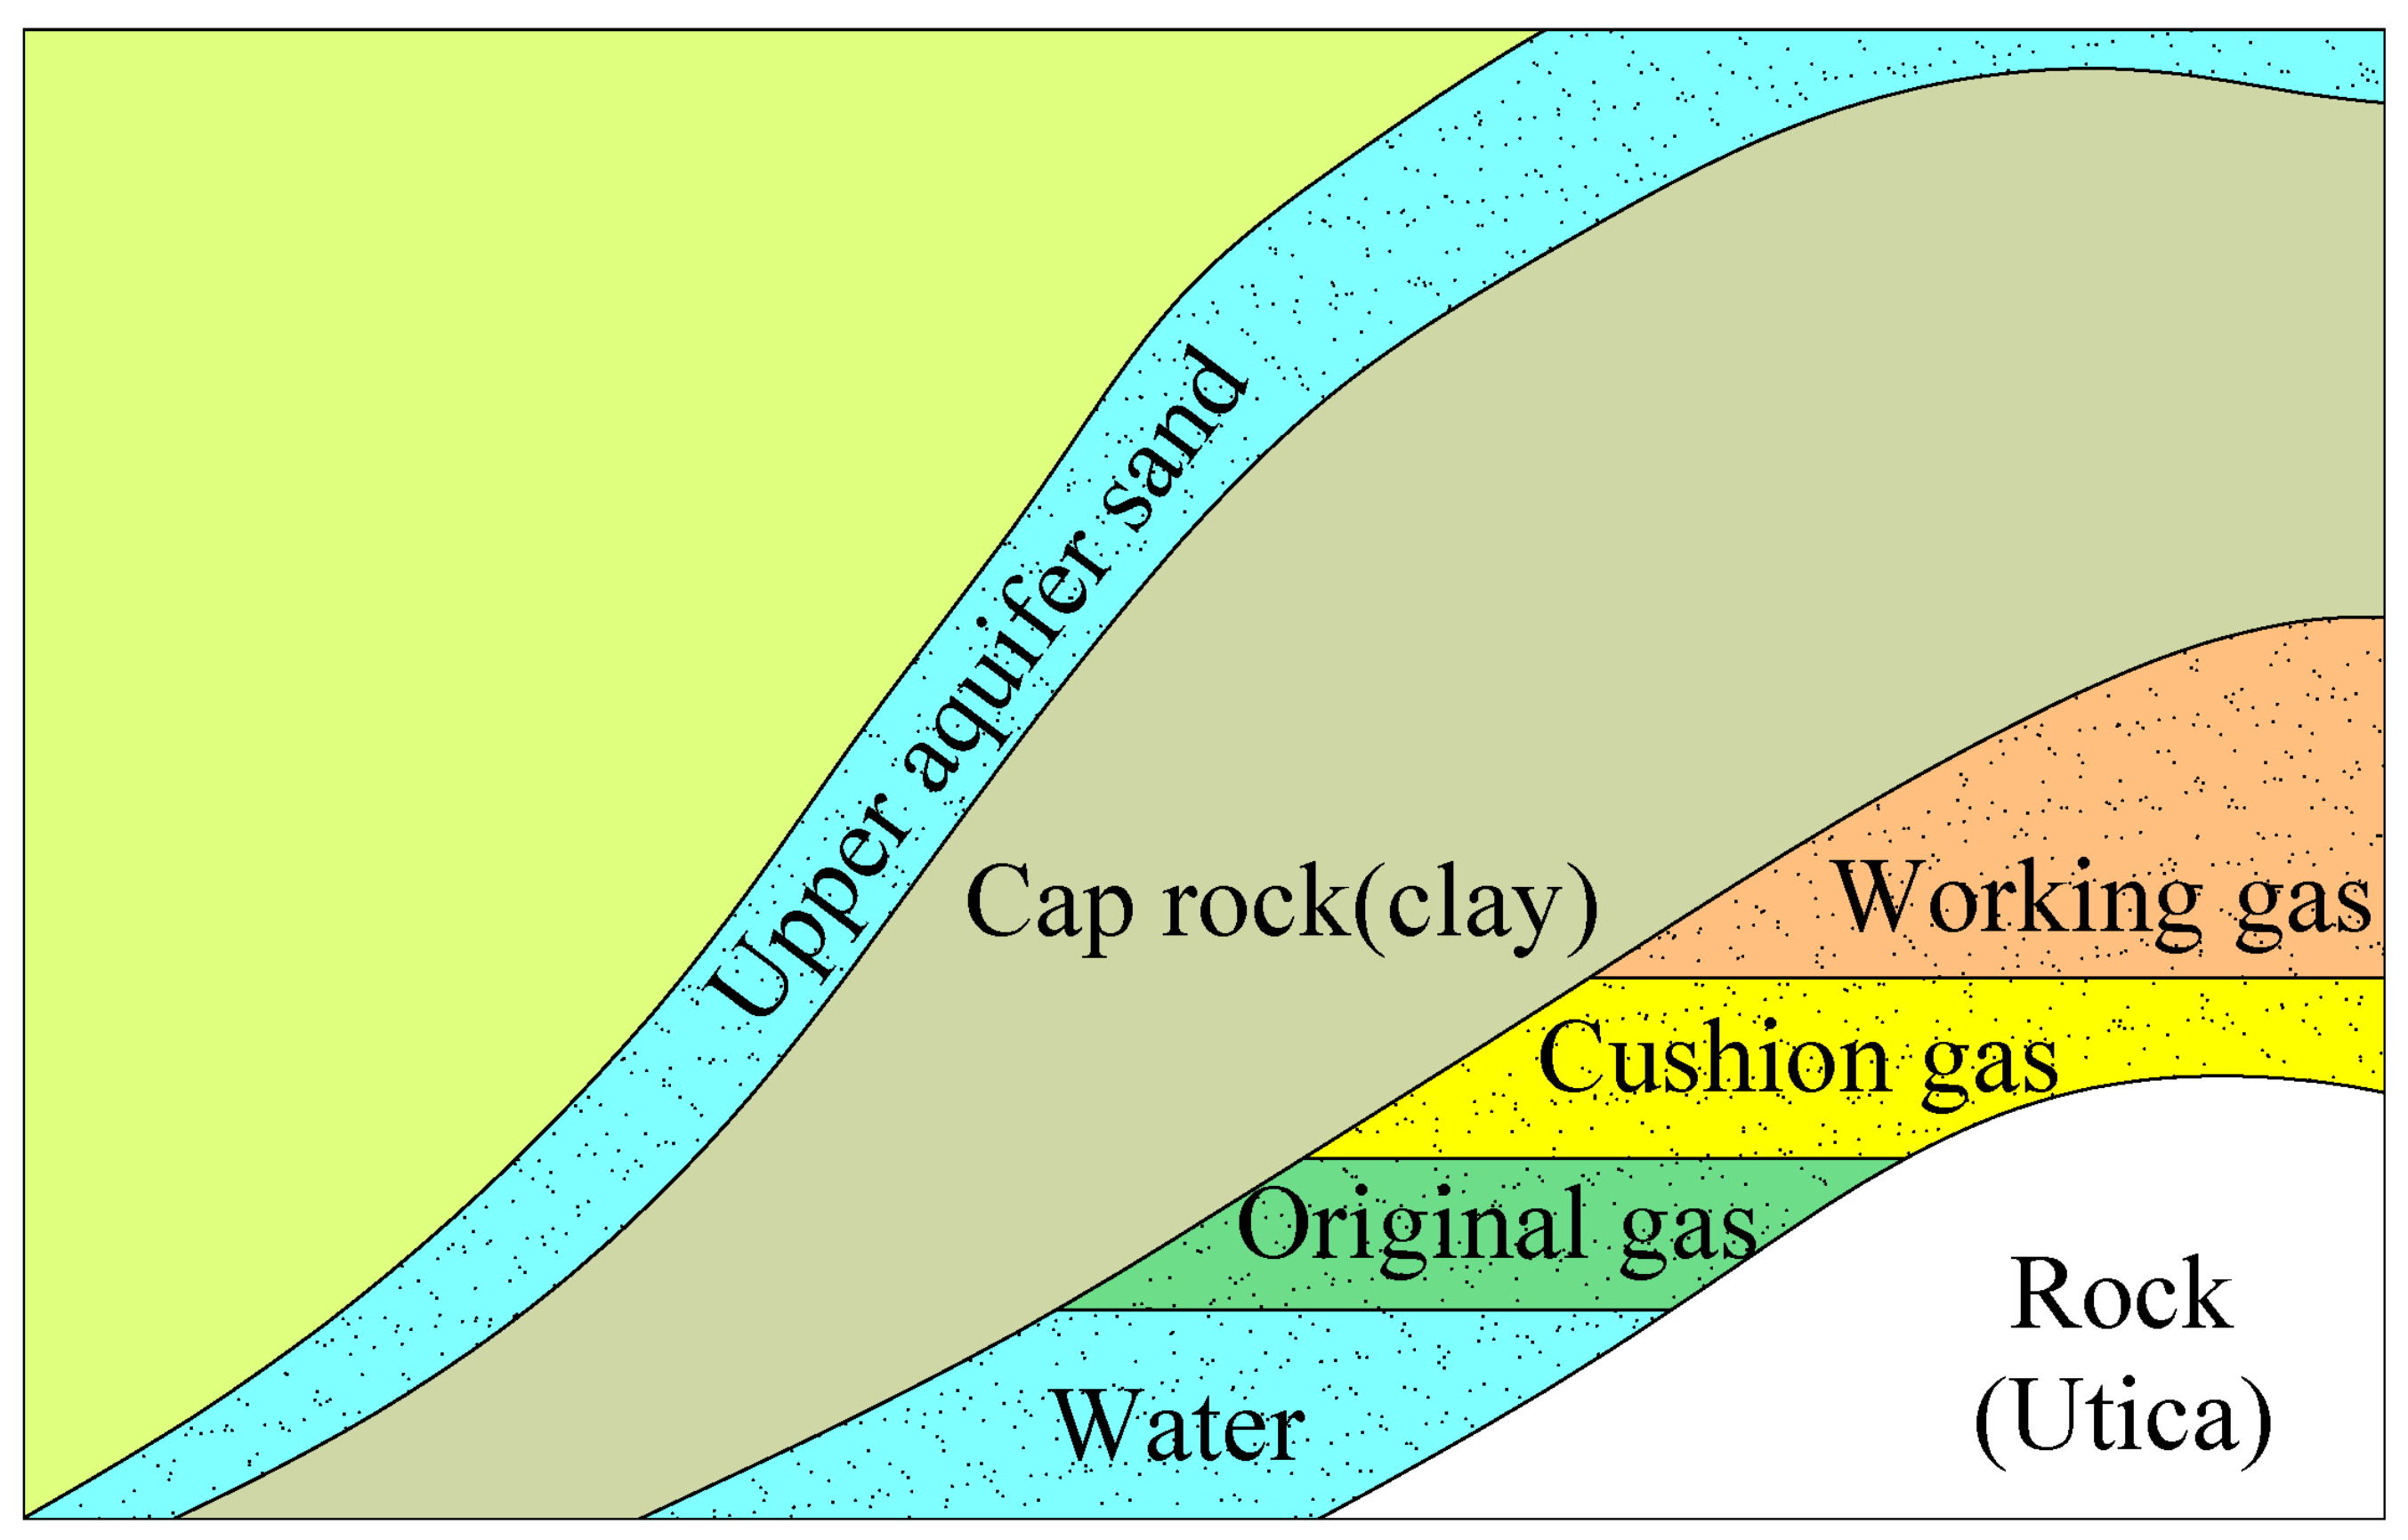
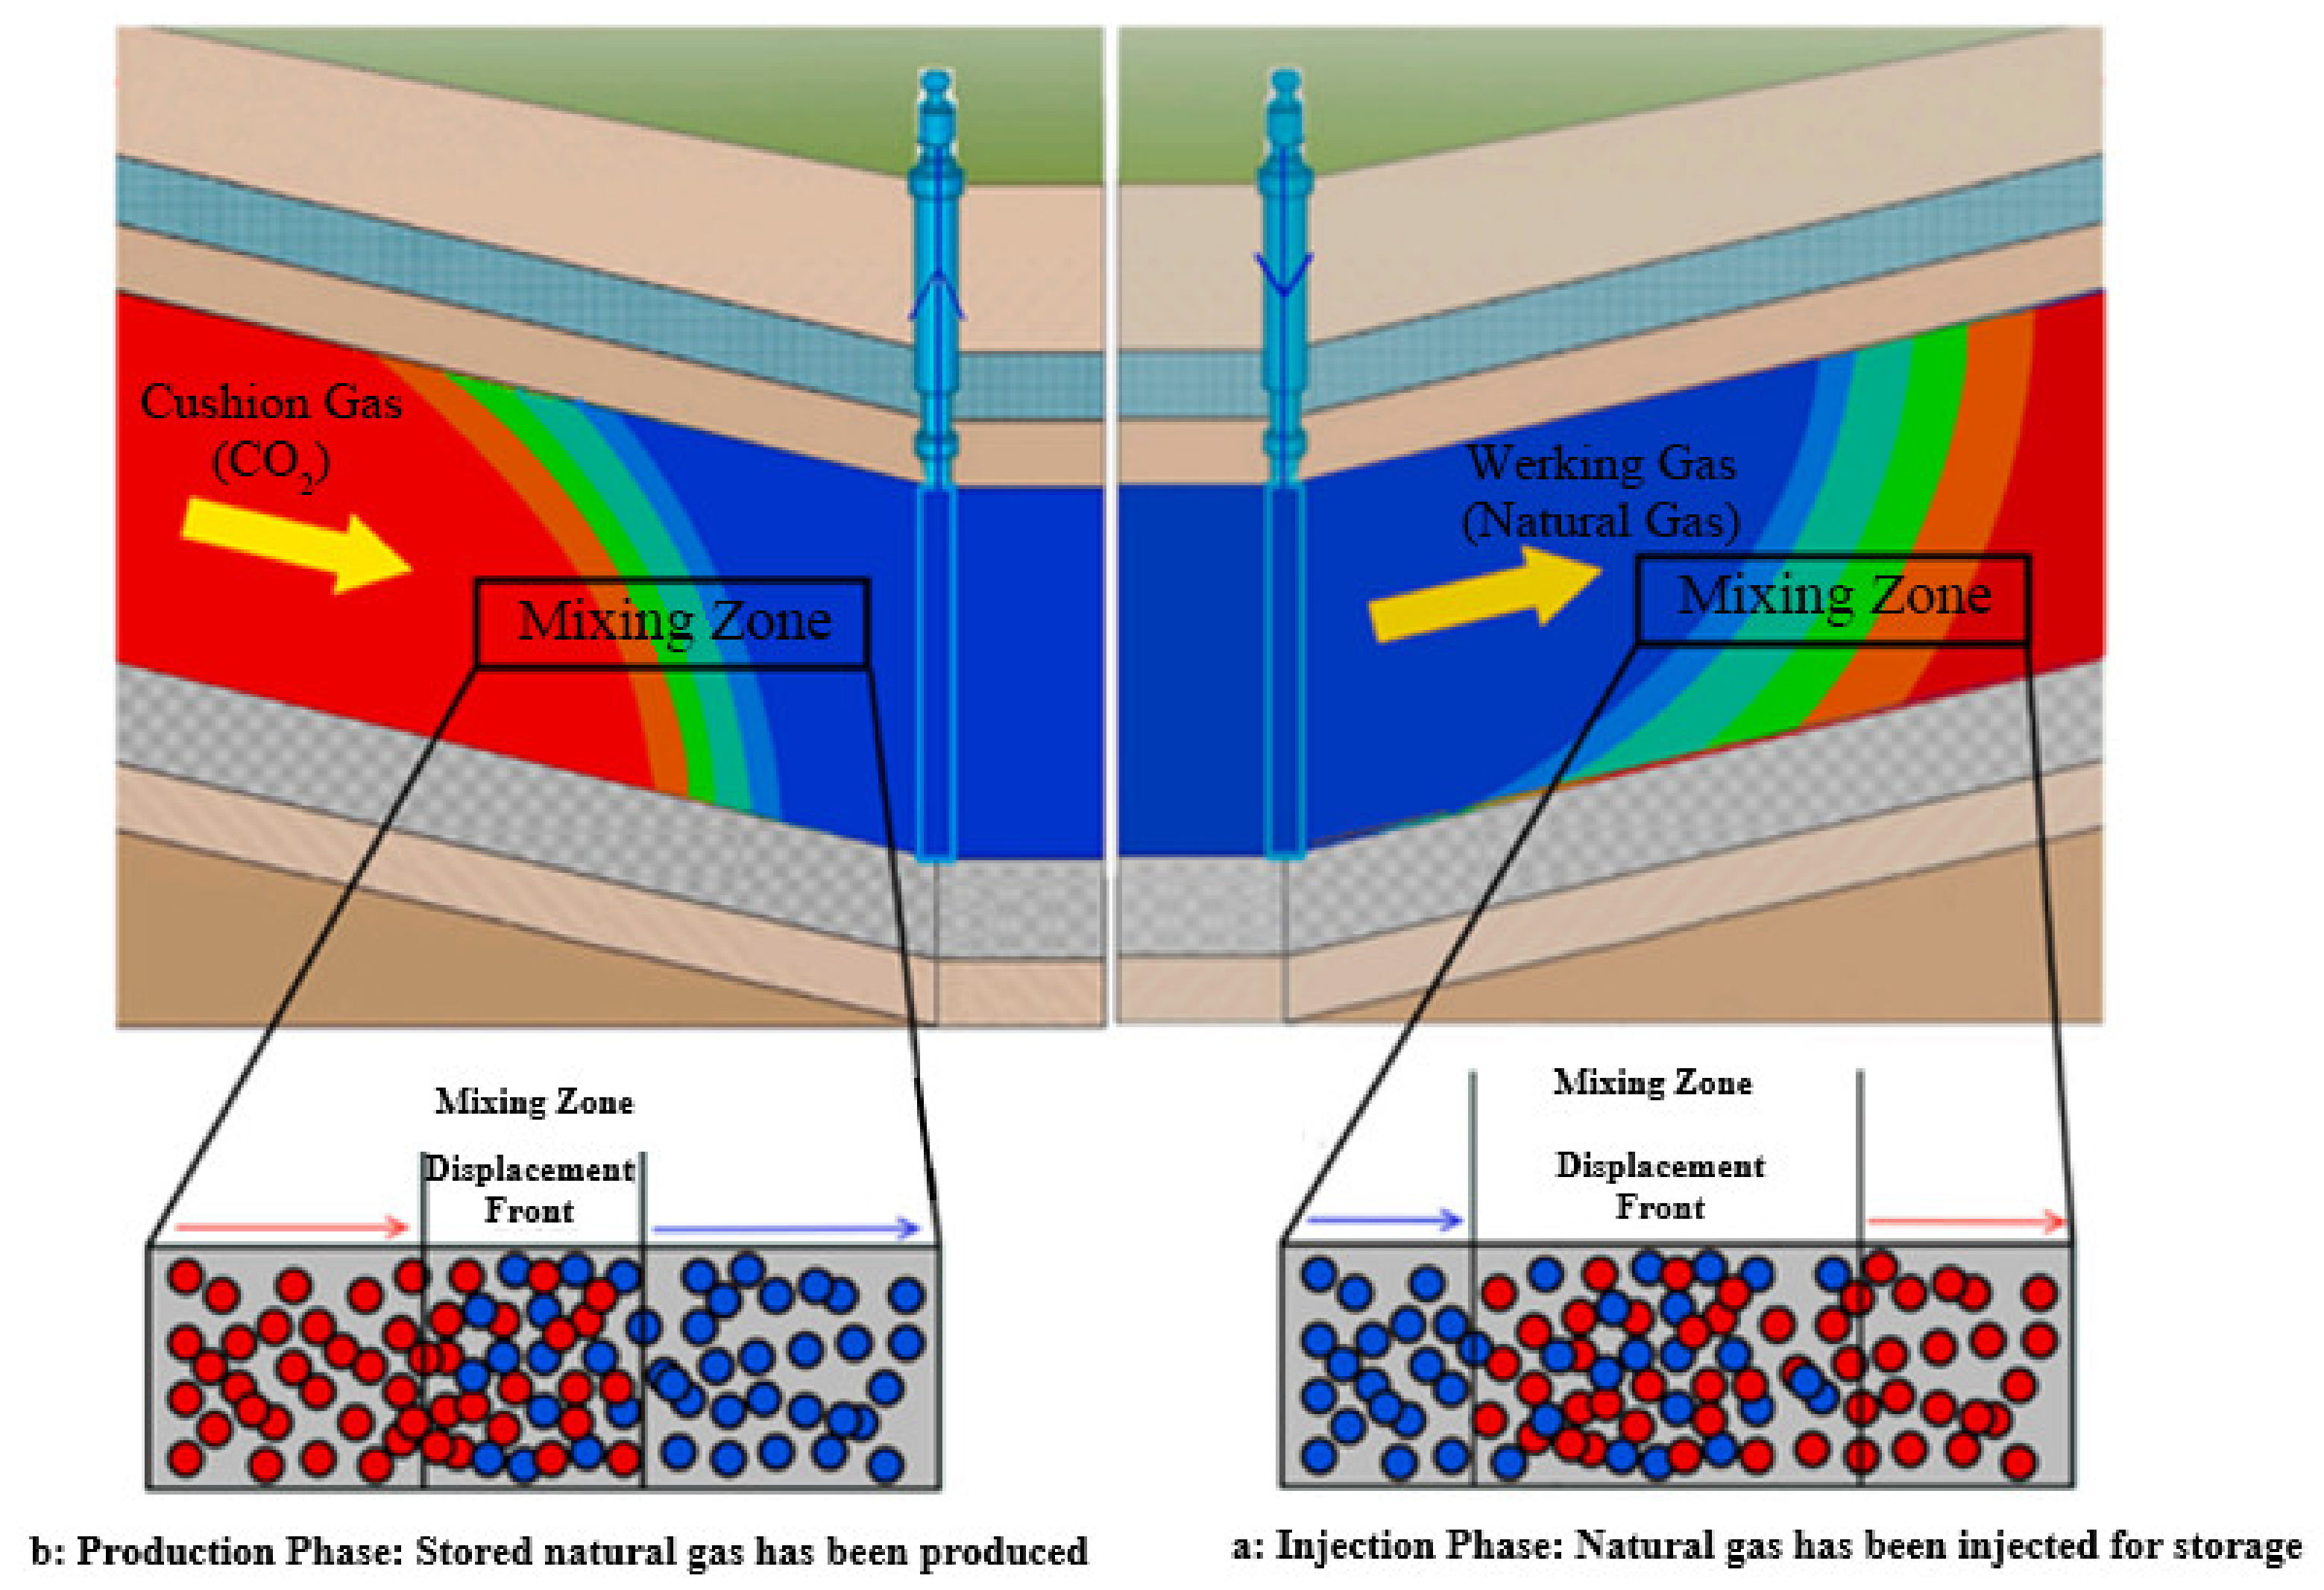
2. The Mechanism of CO2 as a Cushion Gas in Underground Natural Gas Storage

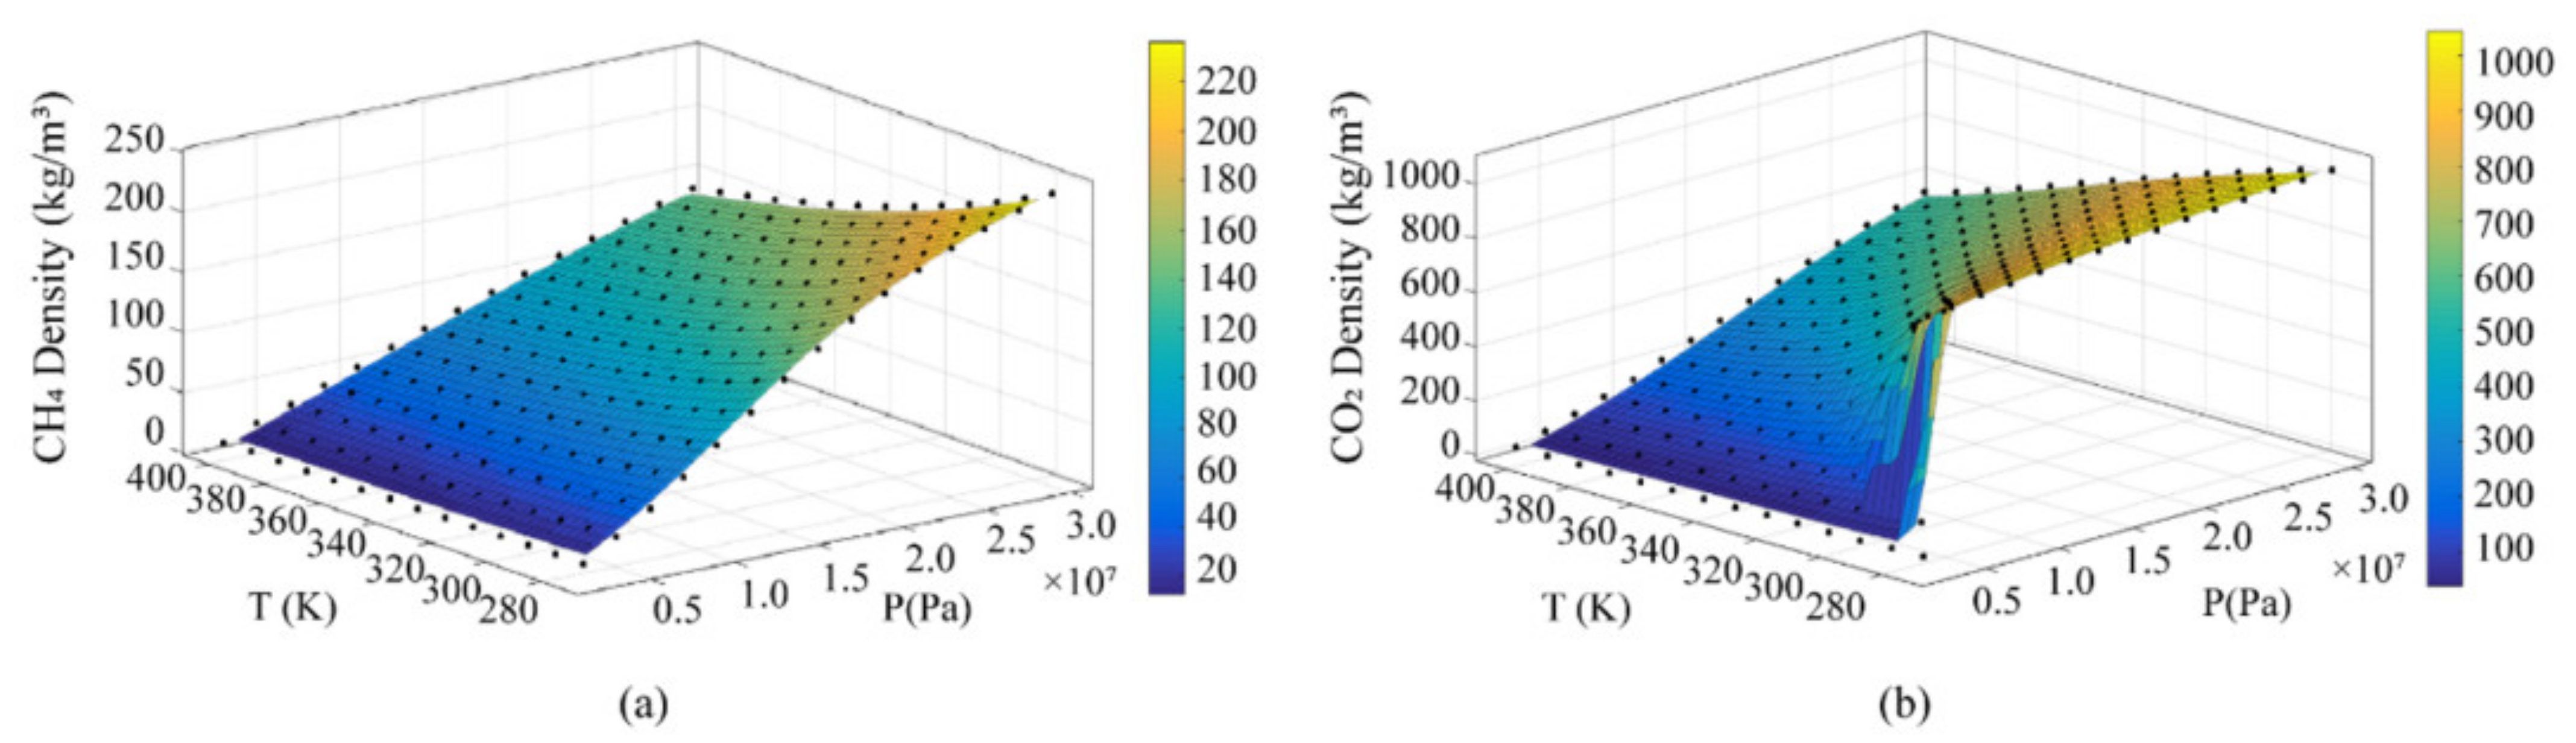
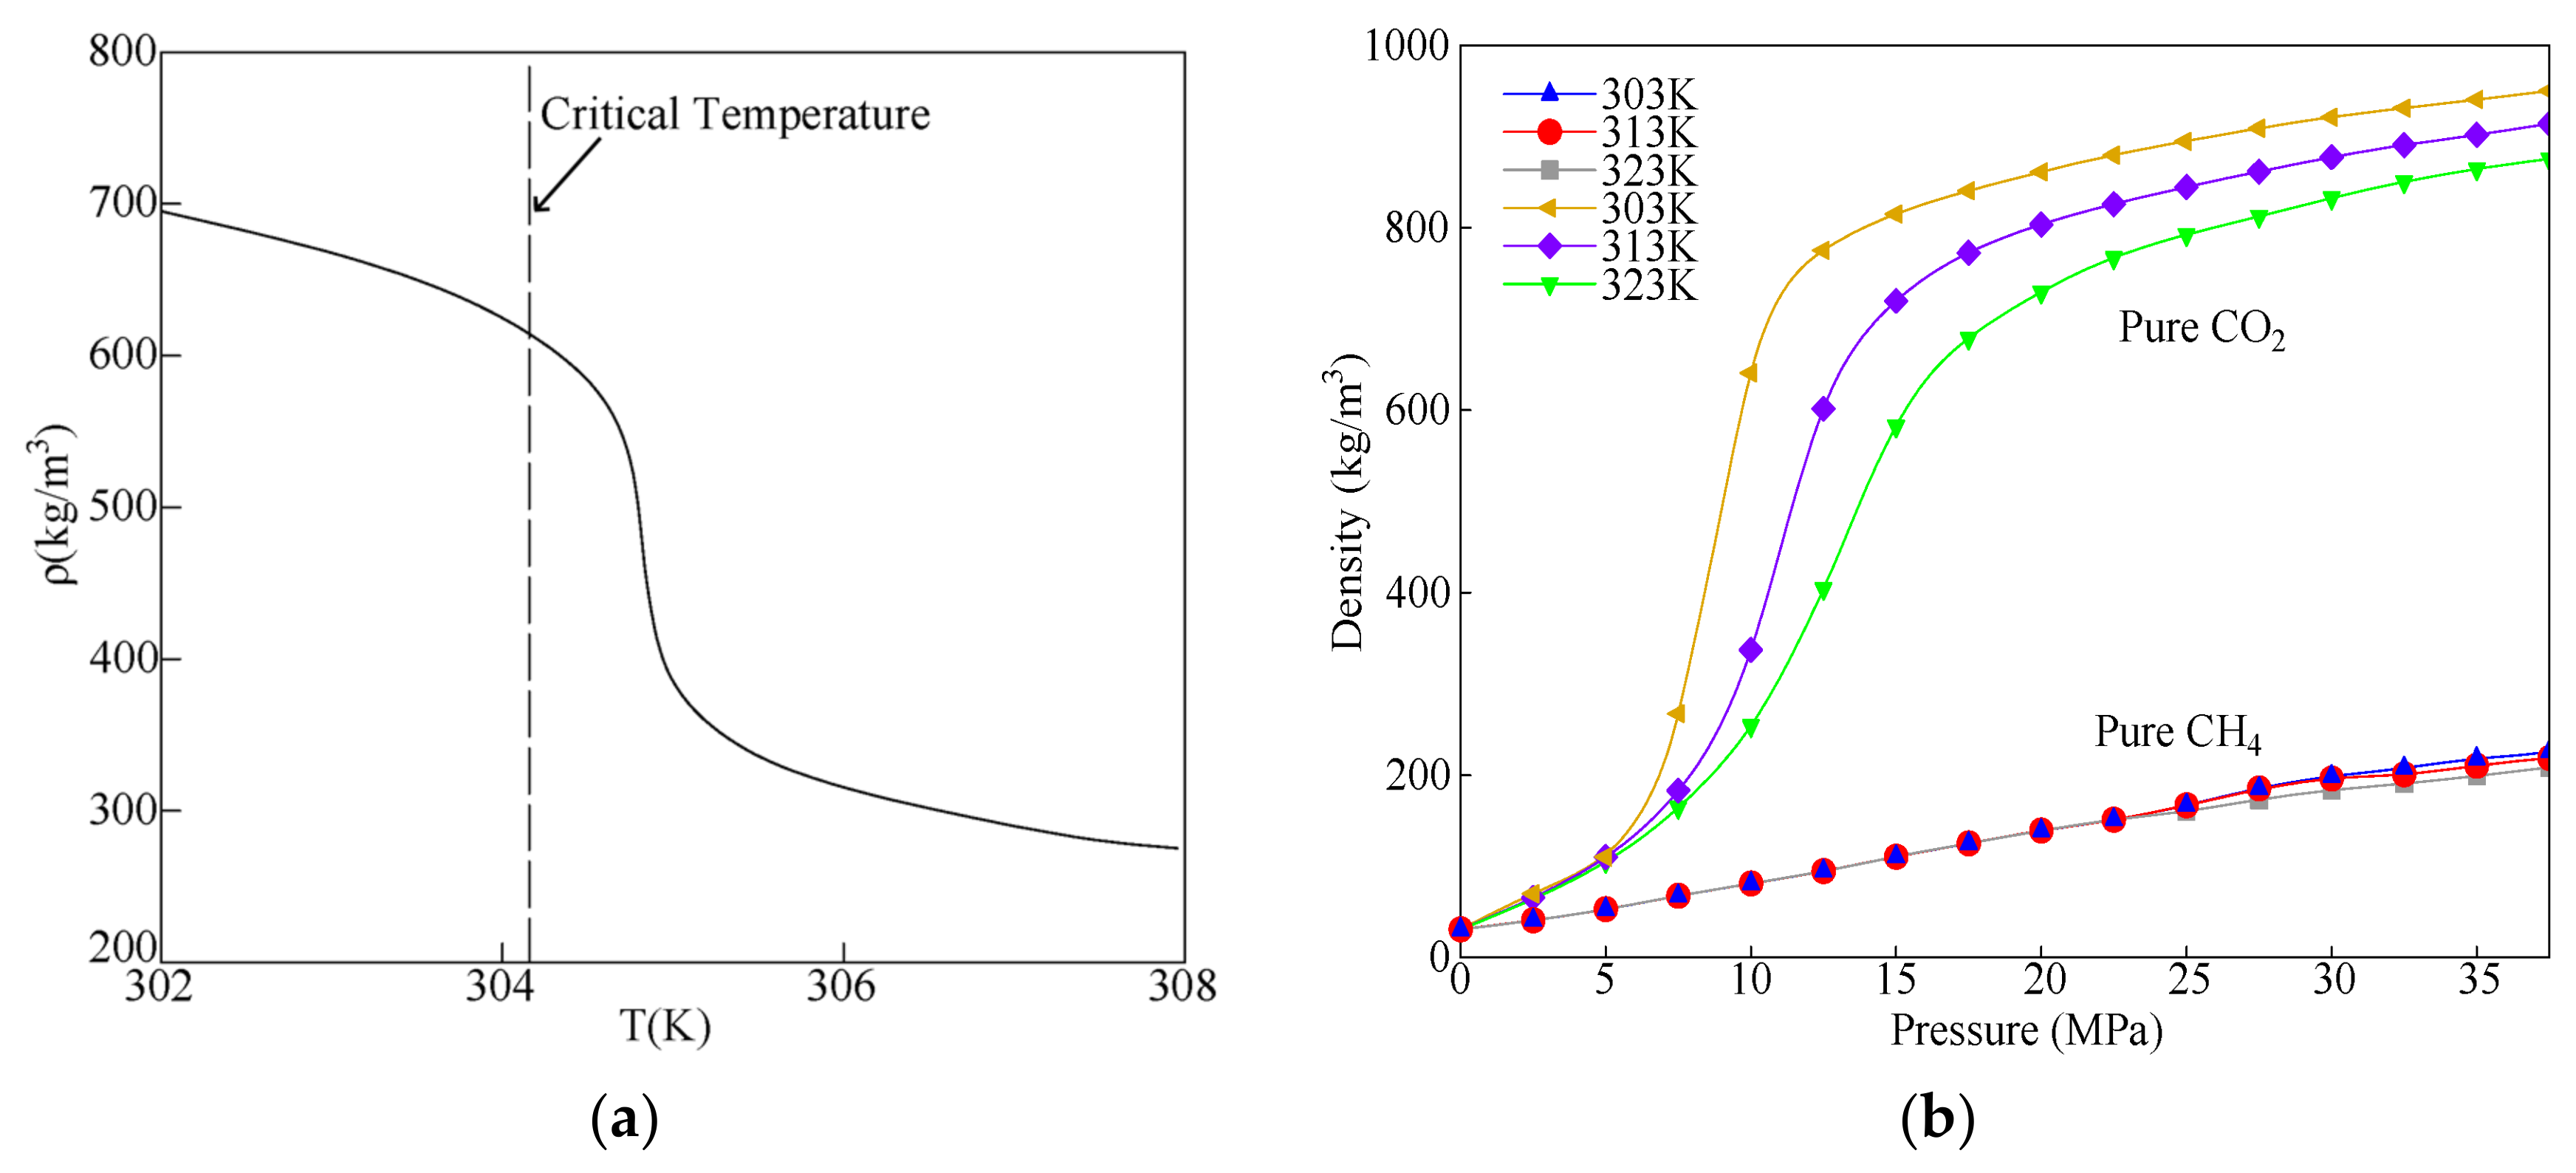
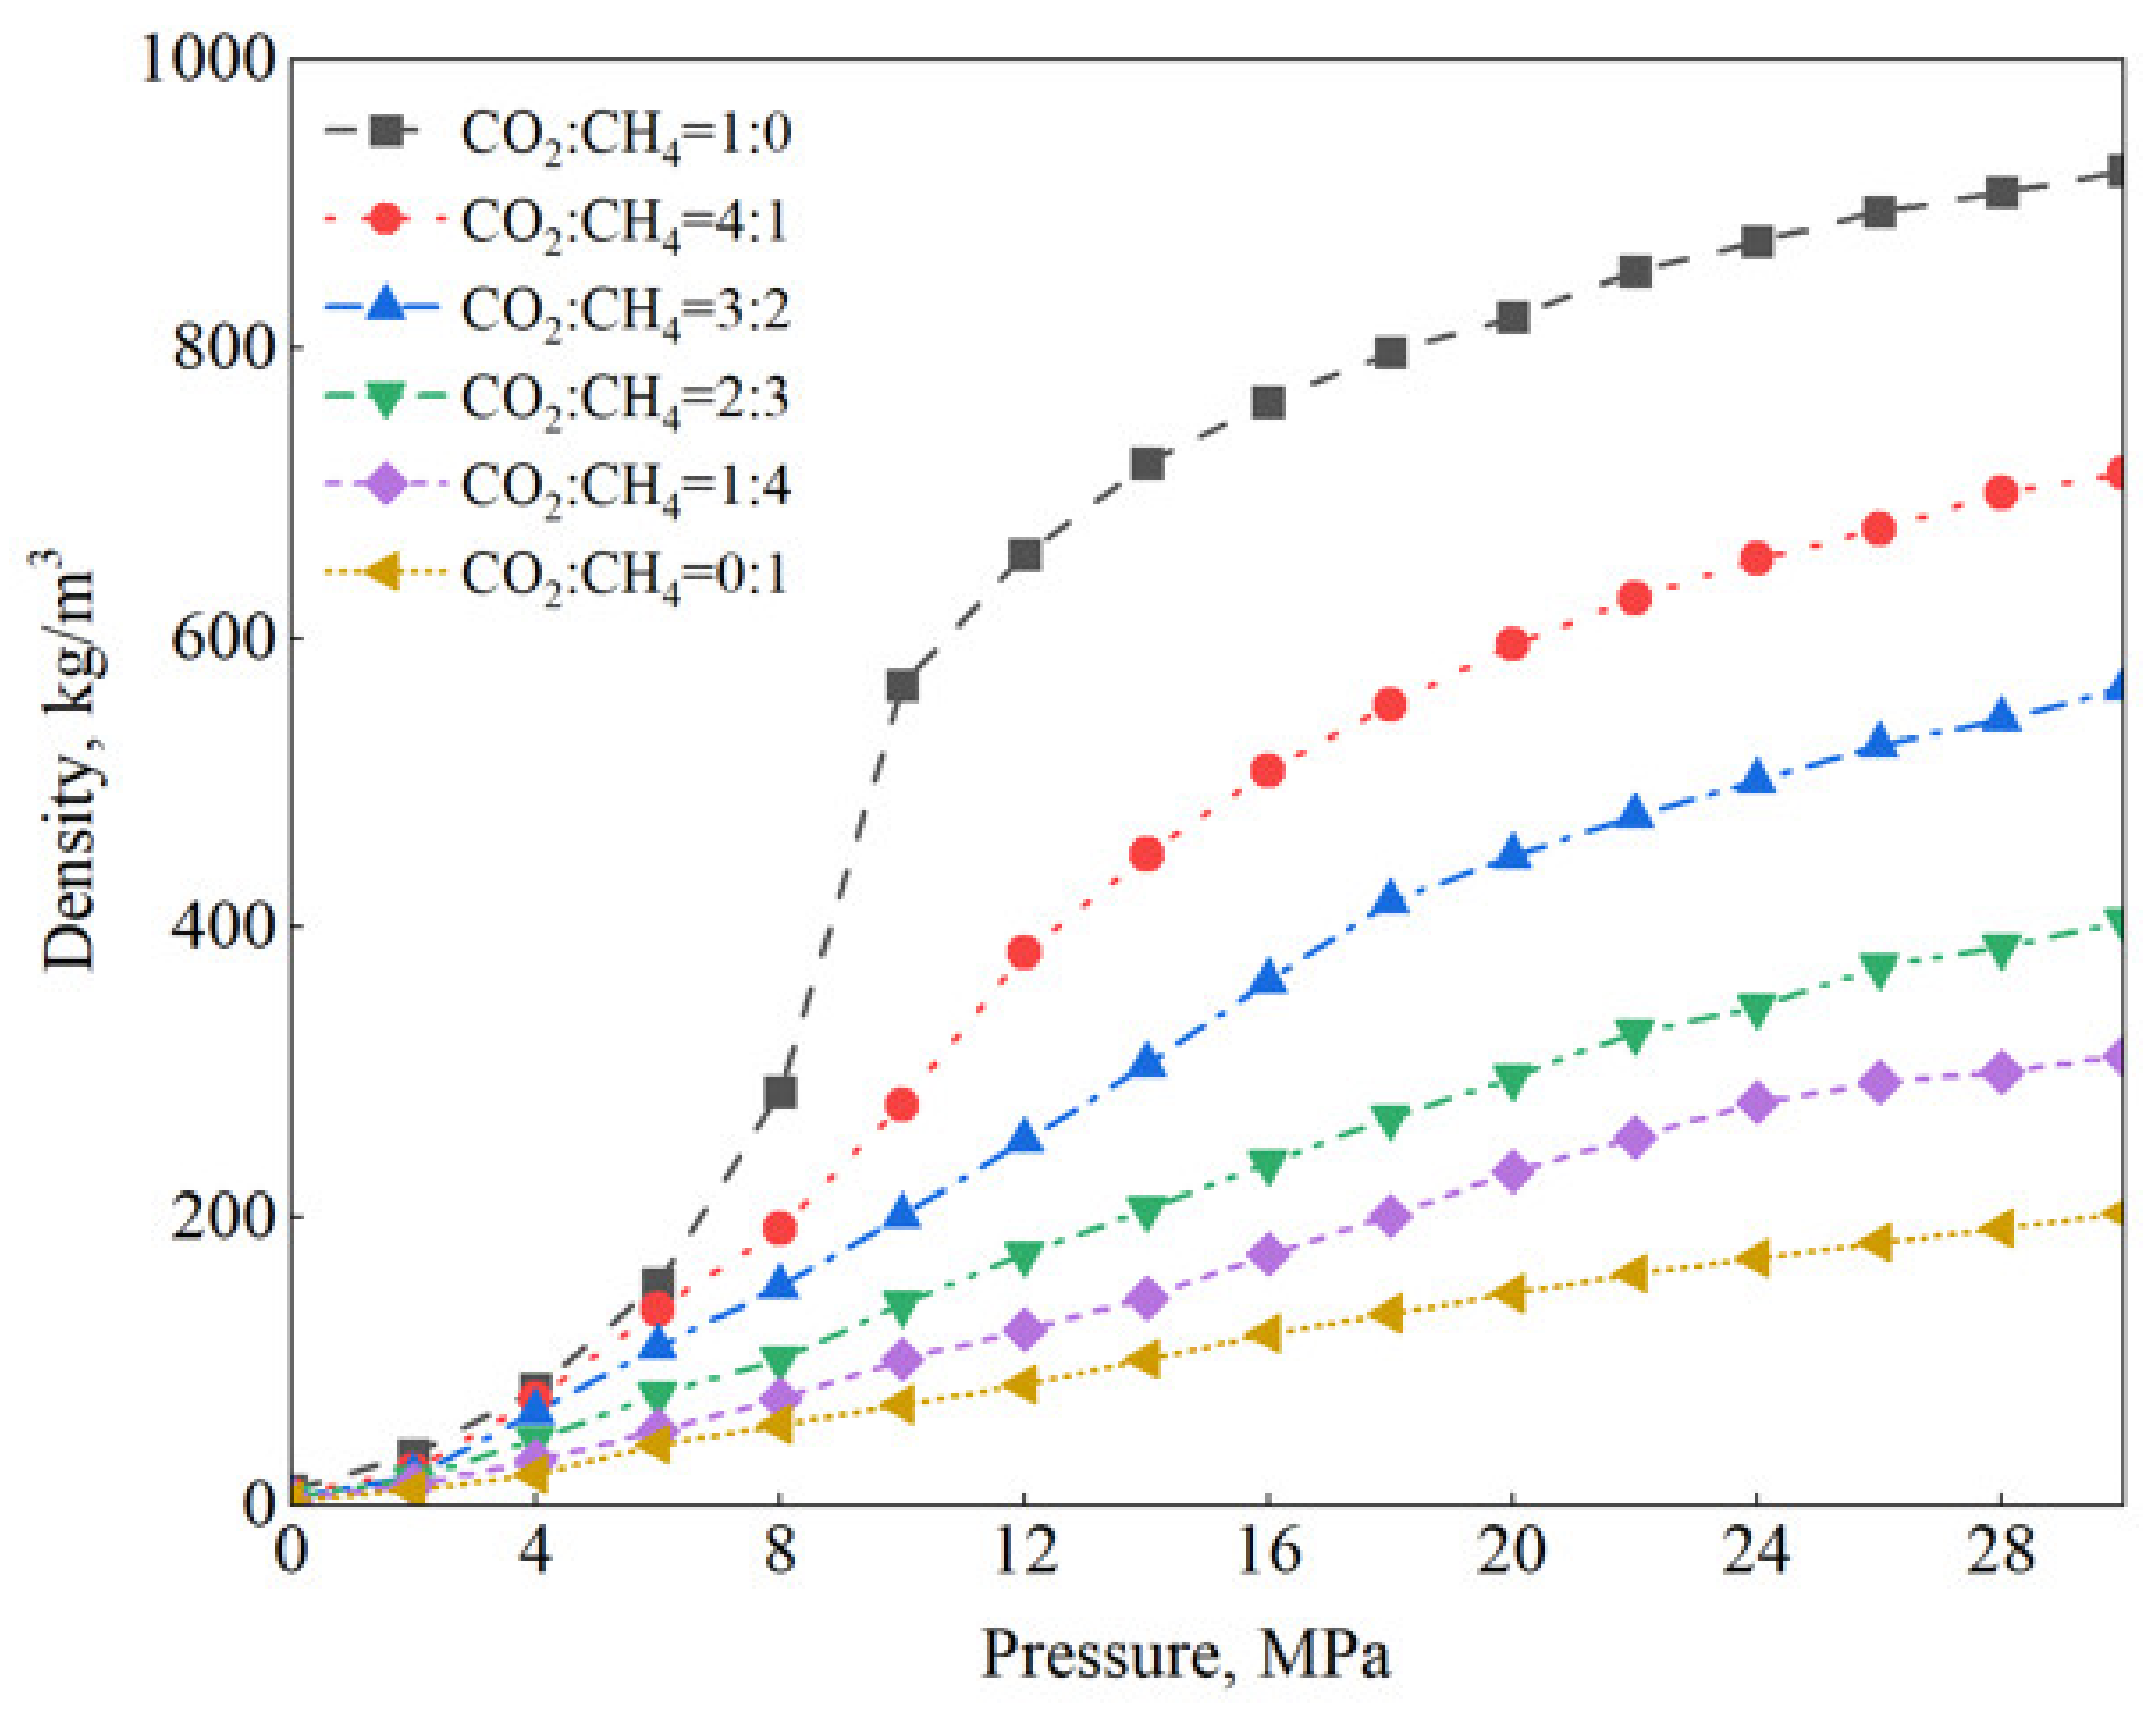
2.1. Density Differences

The density difference between CO2 and CH4 leads to significant stratification between the two types of gases, ensuring the purity of the produced natural gas during the production process and improving the natural gas recovery. The density changes of CO2 and CH4 with the temperature and pressure are shown in Figure 4. The density of CH4 increases linearly with the increasing temperature and pressure (Figure 4a). However, the physical change laws of the CO2 density are different from those of CH4. The changes in the CO2 phase state and density are more significant after reaching the critical conditions (304.65 K, 7.38 MPa) within the gas storage (Figure 4b). The density of CO2 increases five to eight times, while the density of CH4 only increases two to three times within the pressure and temperature ranges of 5 MPa to 13 MPa and 303.15 K to 323.15 K [29].
The changes in the CO2 density with the increase in the reservoir temperature under 7.5 MPa are shown in Figure 5a. It is noticed that the density of CO2 shows an abnormal reduction after the supercritical temperature (Tc, 304.15 K) of CO2. When the actual temperature (T) is over the Tc, the density of CO2 decreases obviously. Ma et al. compared the densities of CO2 and CH4 at different temperatures [32]. The density changes of CO2 and CH4 with pressure under the temperatures of 303 K, 313 K, and 323 K are shown in Figure 5b. Because of the higher density of CO2, the injected CO2 is retained at the bottom of the gas storage facility, and the mixing degree of CO2 with CH4 is reduced. The density of CH4 is not affected by temperature changes, and the density of CH4 increases linearly with increasing pressure. However, the impact of the temperature on the density of CO2 is not significant, but the pressure leads to an important impact on the CO2 density. By calculating the Benedict–Webb–Rubin–Starling (BWRS) equation of state, the density variation curve with pressure was obtained under different mixing ratios of CO2 and CH4 at 40 °C, as shown in Figure 6. The density of a mixed gas of CO2 and CH4 has a great correlation with the gas composition and pressure. After adding a small amount of CH4 to CO2, the density sharply decreases, and the rate of decrease slows down as the CH4 fraction increases [33].

2.2. Viscosity Differences

The viscosity difference between CO2 and CH4 leads to the different flow abilities of the two gases in the reservoir. The viscosity changes of CO2 and CH4 with the temperature and pressure are consistent with Figure 4. The viscosity of CH4 increases linearly with the increasing temperature and pressure. The variation law of the CO2 viscosity is similar to that of the CO2 density. The viscosity of CO2 surpasses that of CH4 by more than 10 times in the pressure and temperature ranges of 5 MPa to 13 MPa and 303.15 K to 323.15 K [29]. As shown in Figure 7, due to the higher viscosity of CO2 compared to CH4, fingering phenomena can easily occur in the stage of working gas injection, which also leads to the expansion of the mixing zone between CO2 and CH4. During the CH4 production stage, the high viscosity of CO2 causes it to displace CH4 with low viscosity via a piston-like displacement method. This leads to a reduction in the mixing zone of CO2 and CH4 compared with that in the CH4 injection stage, and, due to the low migration rate of CO2 itself, the phase interface in the mixing zone is more stable. Simulating CO2 as a cushion gas via experiments on the long core process under CO2 supercritical conditions, Li et al. found that the displacement process of CH4 by CO2 injection exhibited some characteristics of piston displacement and formed a stable and narrow mixing zone [13]. However, the relatively high viscosity characteristics of CO2 also carry risks. When CO2 is injected into the reservoir as a cushion gas, the low fluidity of CO2 can easily affect the stability of the wellbore due to the need for higher injection pressure. Sharif et al. discussed the impact of CO2 injection on the wellbore integrity [36]. When CO2 is injected into the reservoir from the injection wells, a larger pressure gradient is generated because of the higher viscosity of CO2, which exerts pressure on the wellbore and seriously threatens its integrity.
The changes in the viscosity of CO2 and CH4 with the increase in the reservoir temperature under 10.3 MPa are shown in Figure 8a. As the temperature increases, the viscosity of CO2 decreases linearly initially and then tends to plateau, but it remains higher than the viscosity of CH4. However, the upward trend of the CH4 viscosity is not obvious [37]. The study of the viscosity of CO2 and CH4 gas mixtures is shown in Figure 8b. The trend of its change is consistent with the density change trend in Figure 5.

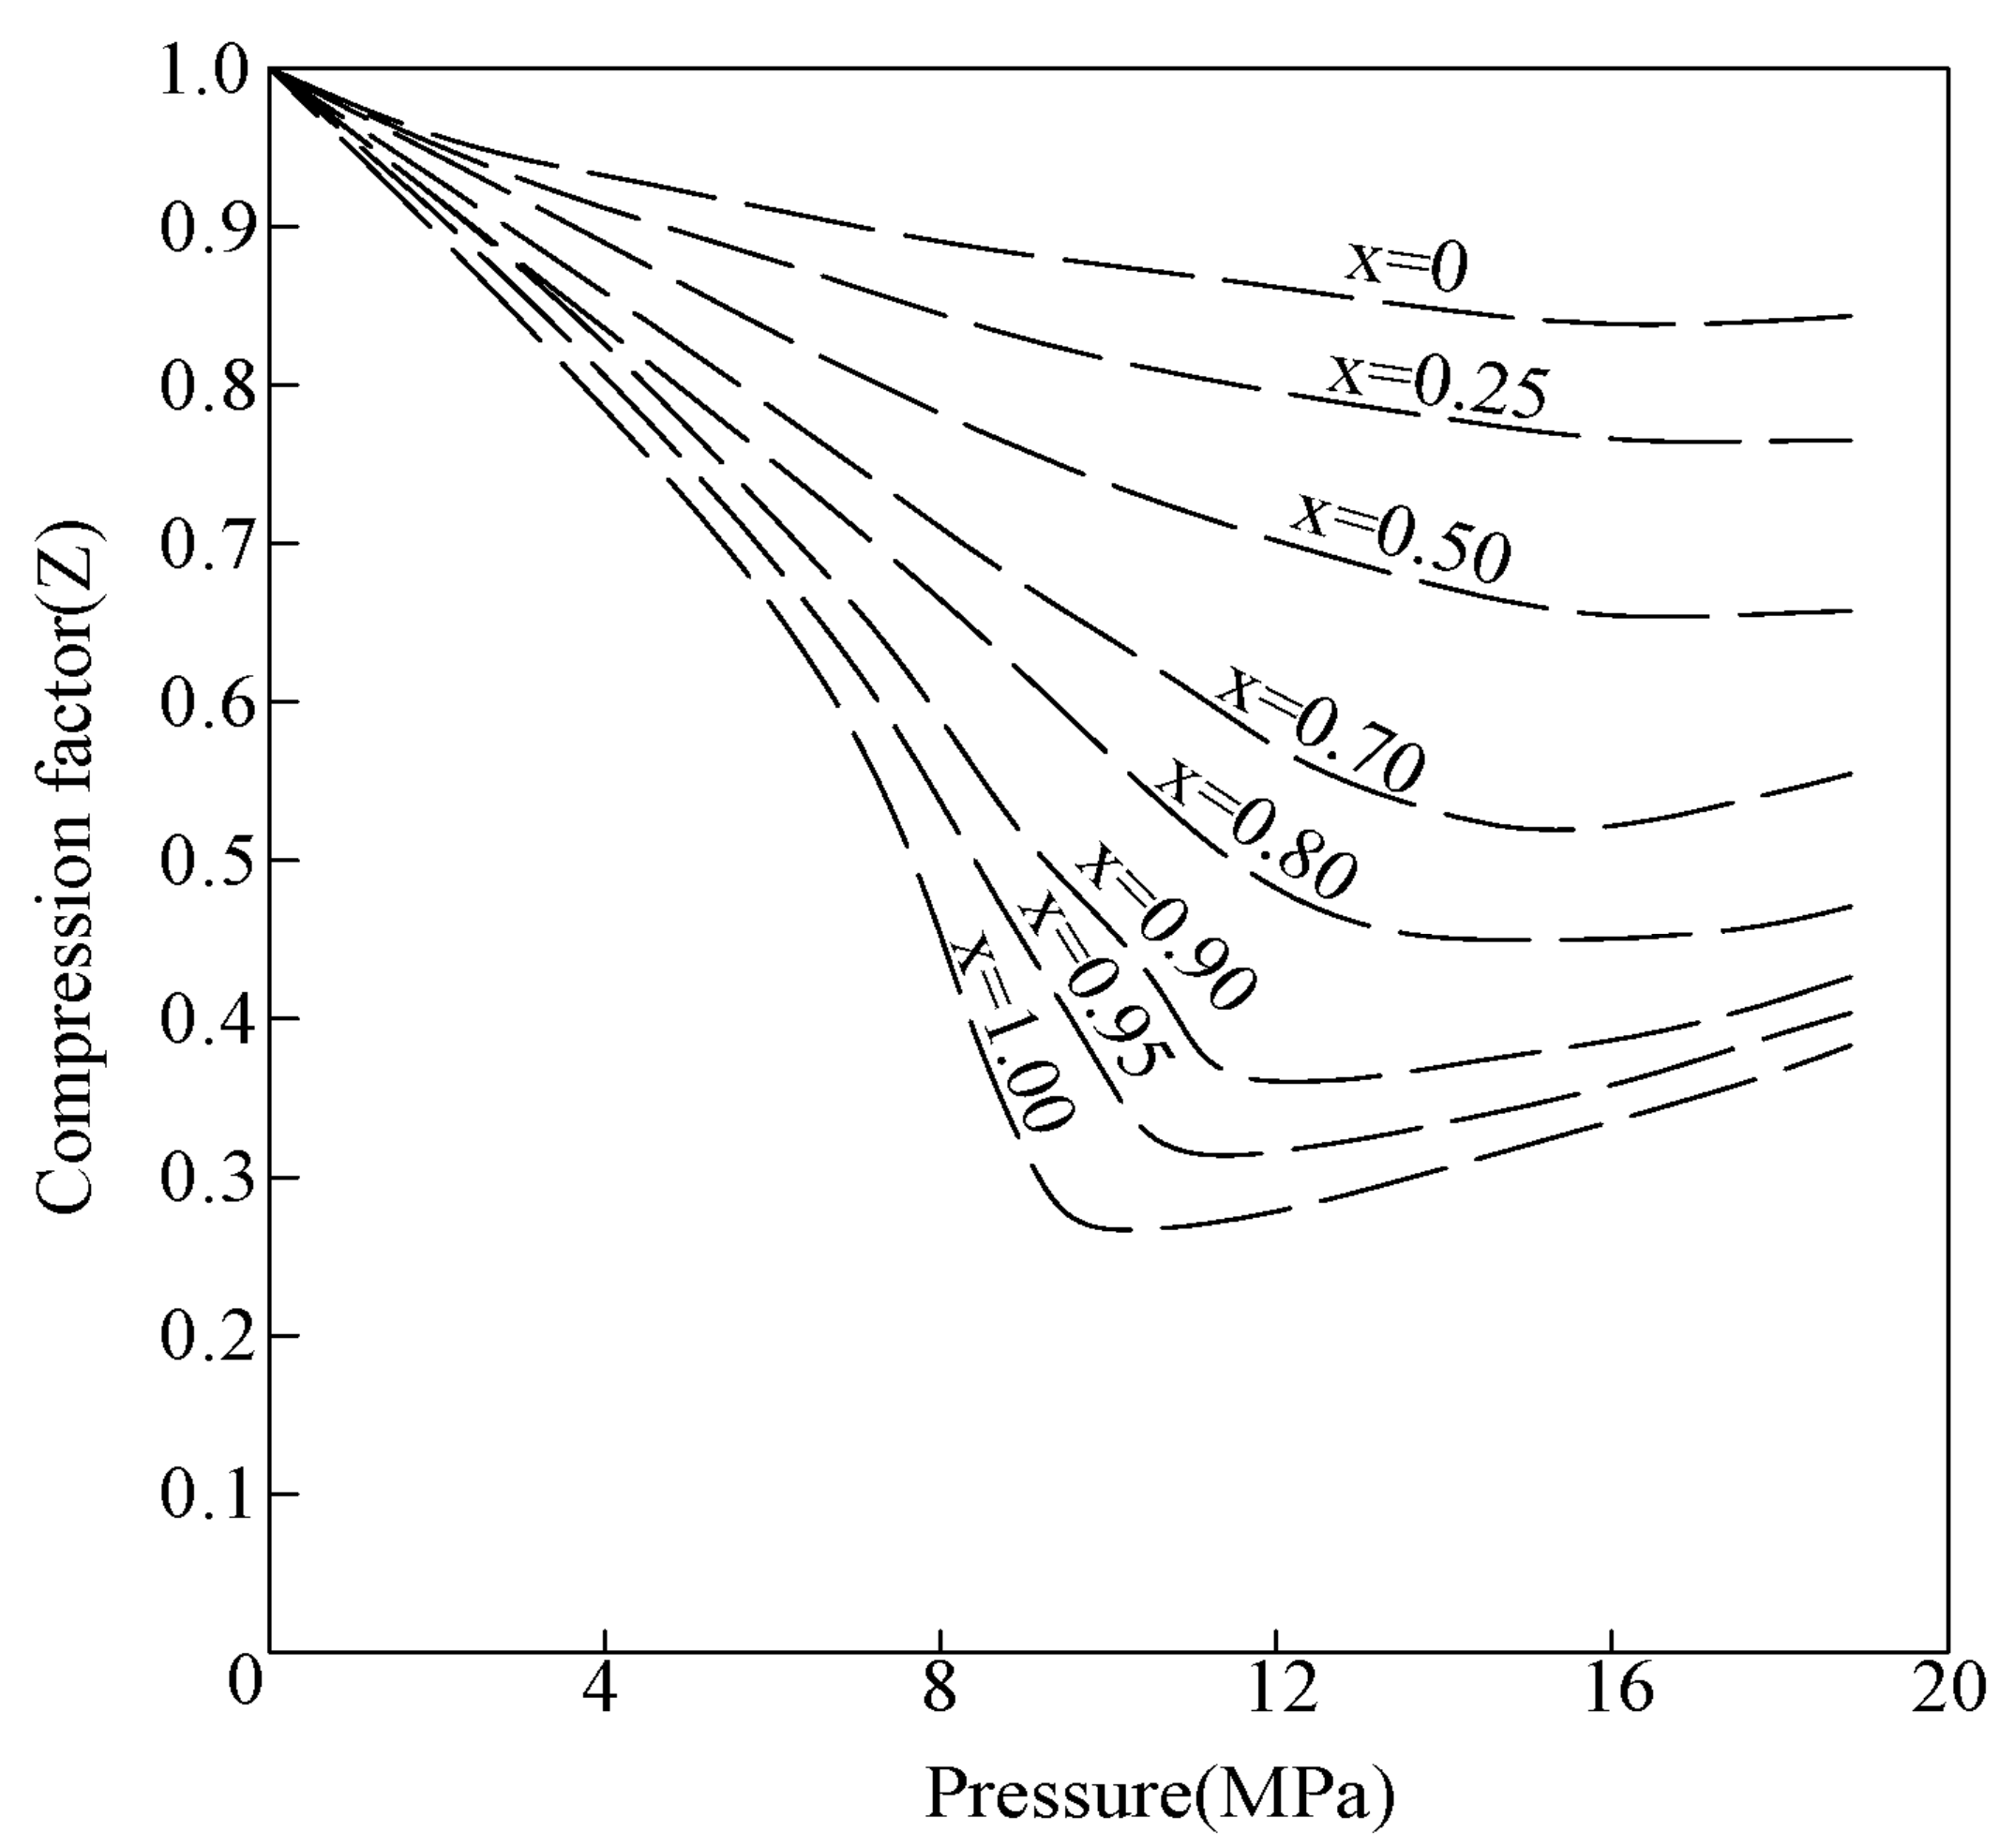
2.3. Compressibility Differences

The compression factor difference between CO2 and CH4 leads to the different storage capacities of the two gases in the reservoir. The changes in the CO2 and CH4 compression factors with increasing pressure are shown in Figure 9. In the pressure and temperature ranges of 0 MPa to 20 MPa and 313.15 K, the compression factor of CH4 varies from 1 to 0.85, while that of CO2 gas changes from 1 to 0.3, which indicates that the compressibility of CO2 is higher than that of CH4. The higher compressibility of CO2 provides greater storage space for working gas injection (Zhang et al. [38]). Due to the faster expansion of CO2 compared to CH4, during the production process of CH4 by depressurization, the highly compressible CO2 also provides sufficient energy for CH4 production [36,39,40]. However, the changes in the CO2 compression factor decrease after the temperature exceeds 313.15 K; therefore, the advantage of high CO2 compressibility is reduced [41]. In addition, the high compressibility of CO2 enables it to have a larger storage capacity, which is very valuable for carbon capture, storage, and environmental protection.

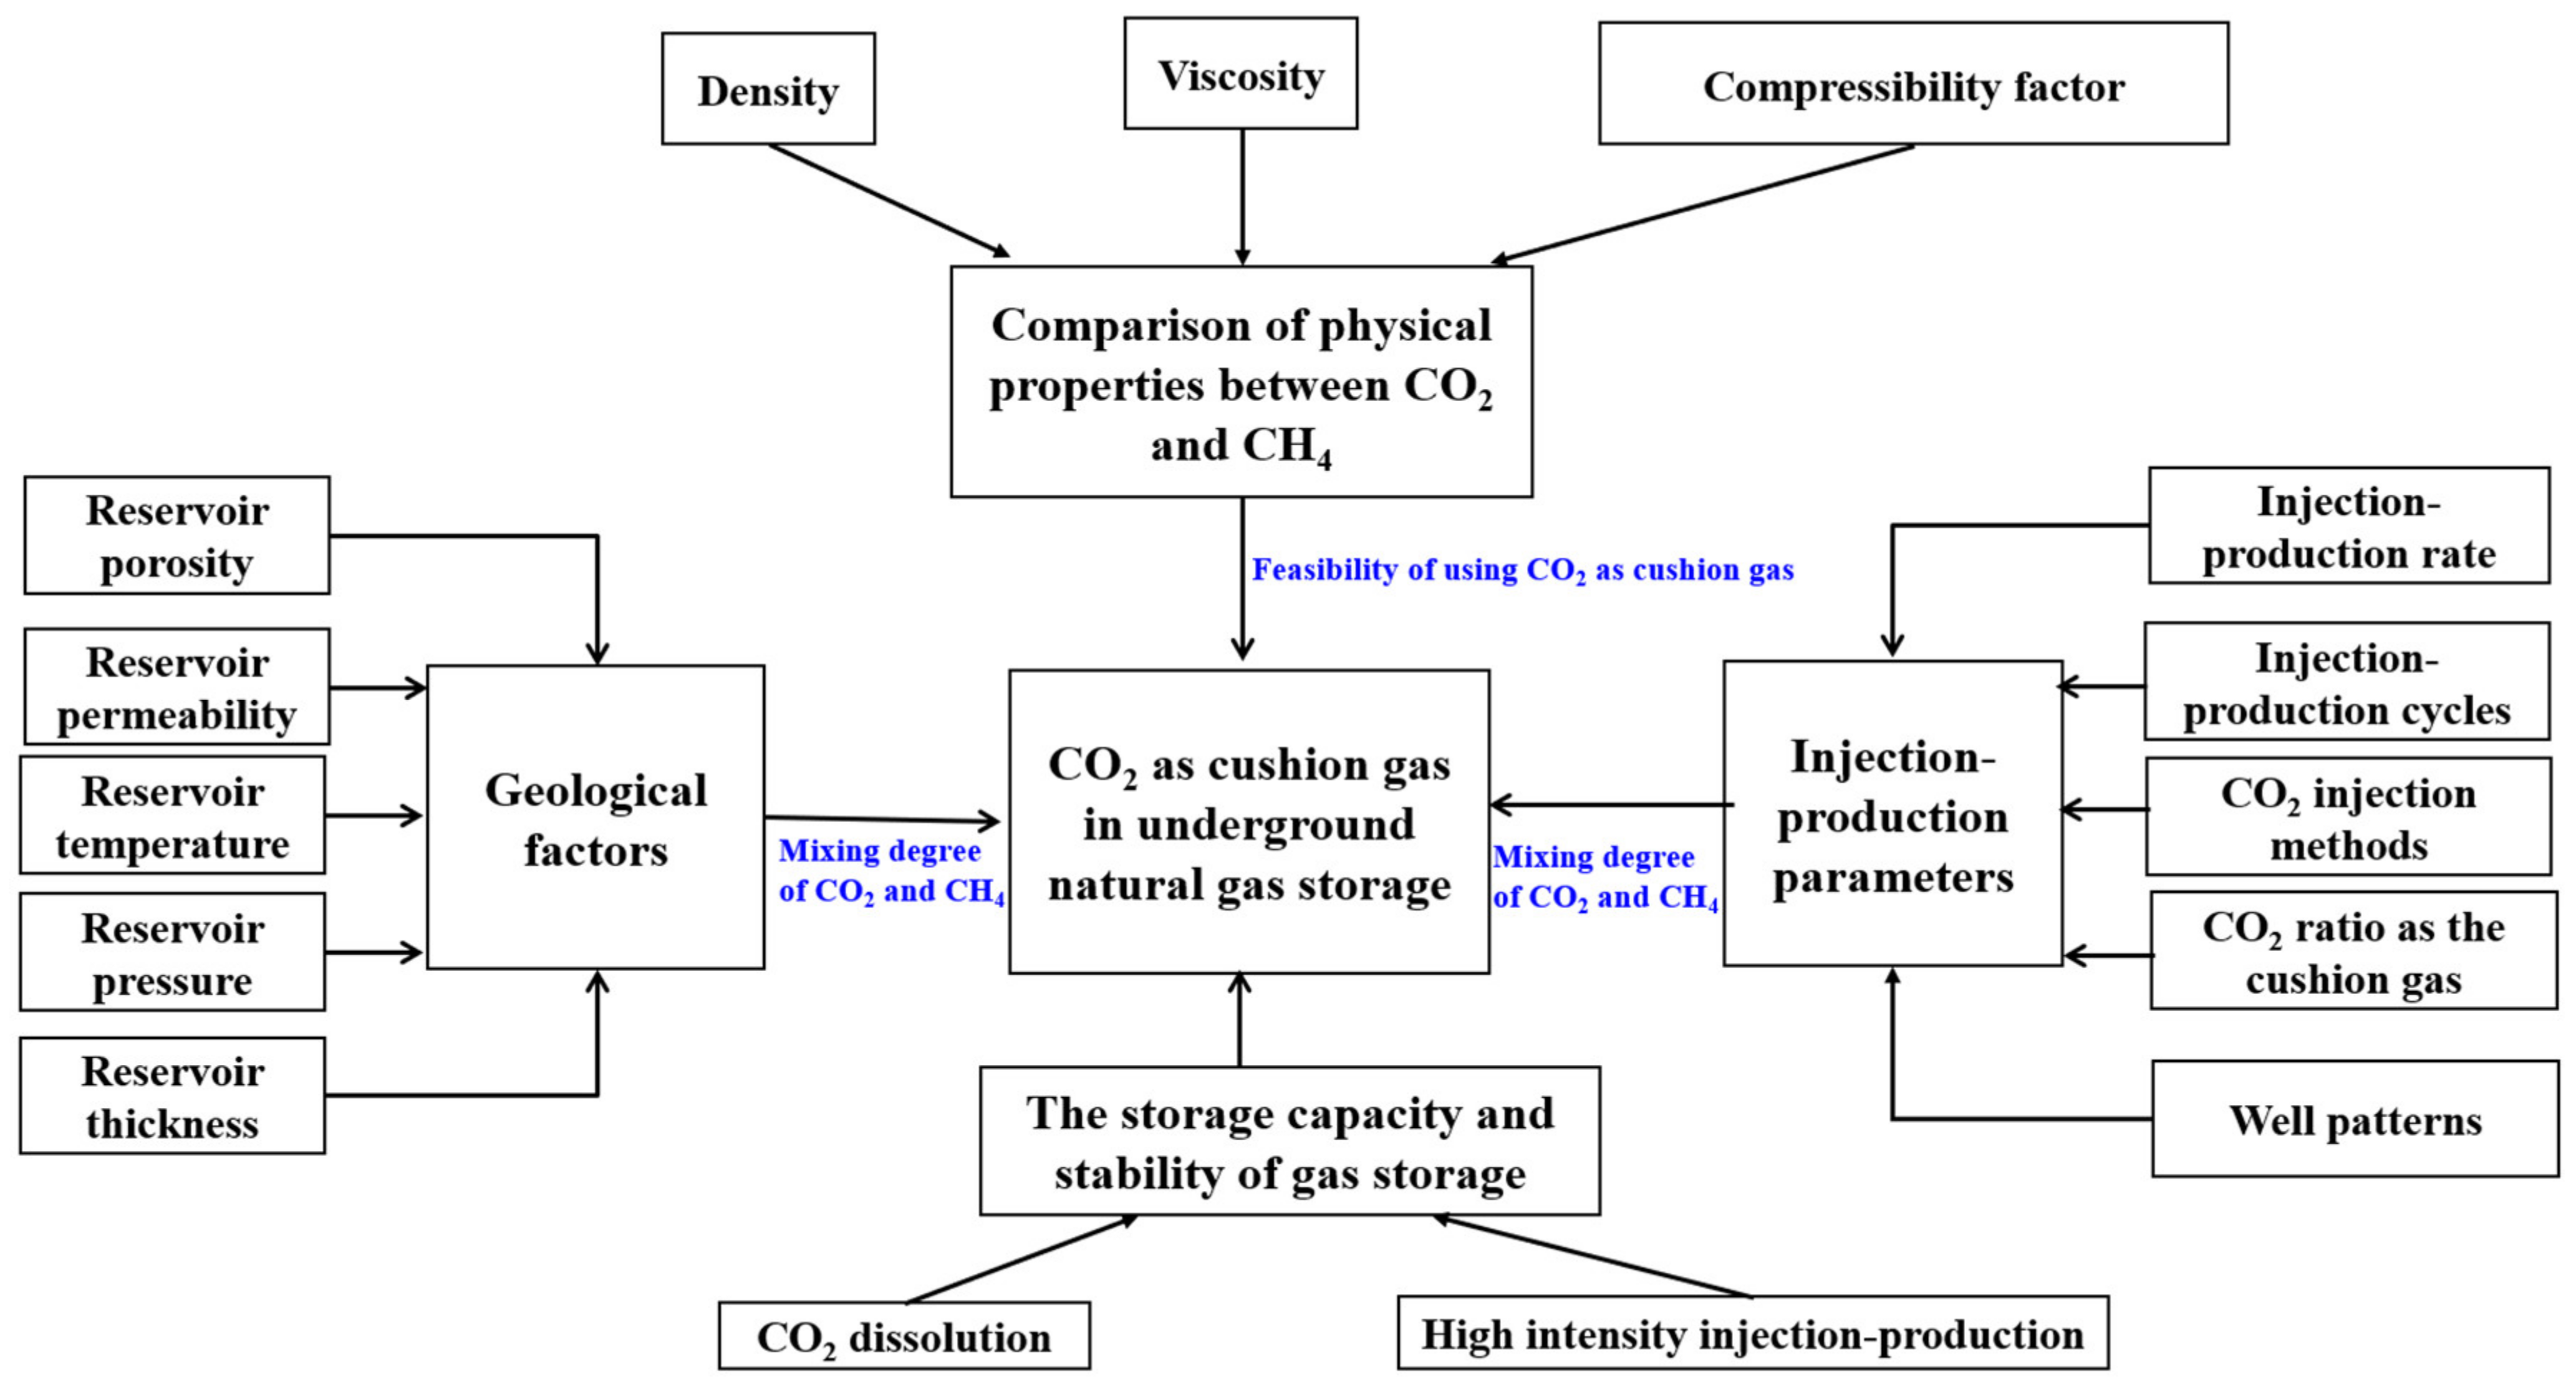
3. Influencing Factors of CO2 as a Cushion Gas to Enhance CH4 Recovery

3.1. Geological Factors

3.1.1. Reservoir Porosity

The porosity determines the migration and diffusion abilities of the cushion gas and working gas in the pore spaces of reservoirs. The larger the porosity, the faster the diffusion between the gas molecules, resulting in the stronger mixing and diffusion abilities of the two gases. However, the migration speed and the development of the mixed gas zone are slowed in a reservoir with CO2 and CH4. By simulation, Hu and Sadeghi showed that an increase in porosity reduces the mixing of the produced gas and cushion gas [36,40]. Based on the simulation of the injection of CO2 as a cushion gas for reservoirs with different porosities, Wang’s results indicated that the porosity of the CO2 cushion gas reservoir was 10%, and the molar content of CO2 in the recovered working gas was significantly higher than that at other porosities (Figure 10) [15]. At the end of natural gas production, the molar content of CO2 in the CH4 produced is close to a certain value. This is due to the small pores, which reduce the space for gas activity and increase the flow rates of CO2 and CH4, accelerating the degree of mixing. Moreover, the gas production quickly reaches its limit, and the CO2 cushion gas around the production well breaks through earlier and is extracted [42]. To control the development of the mixed gas zone, the amount of CO2 cushion gas should be appropriately reduced with the reduction in the reservoir porosity.

3.1.2. Reservoir Permeability

The injection–production capacity of the working gas in underground gas storage is limited by the permeability of the reservoir. Generally speaking, the higher the permeability of a reservoir, the easier the gas molecules diffuse and the higher the degree of gas mixing. Li pointed out that lower reservoir permeability inhibits the gas production quality and gas mixing with a higher pressure difference, which also causes greater stress on the injection–production well [43]. Hu pointed out that, from an economic perspective, it is appropriate to choose a permeability that significantly reduces the production of working gas [40]. Based on a comprehensive analysis of the economic and gas mixing levels with actual engineering parameters, Li and Hu pointed out that an appropriate permeability level is beneficial for CH4 production. In addition, Sharif compared the results of Cao, Mu, and Namdar and found that the permeability was positively correlated with the gas flow speed, as shown in Figure 11 [25,37,44,45]. The higher permeability leads to the easier occurrence of the viscous fingering phenomenon during the process of the gas storage operation. Especially when CO2 is used as a cushion gas, the fingering phenomenon is more obvious. For gas storage in an aquifer formation, because the CO2 is partially dissolved in water, with an increase in the gas injection pressure, a higher volume of CO2 cushion gas is required [24]. During the natural gas production process, CO2 is released from the formation water [42].

3.1.3. Reservoir Temperature

It is known that the temperature affects the physical properties of CO2 and CH4. A higher reservoir temperature leads to an increase in the diffusion coefficient of the gas molecules, affecting the degree of mixing between CO2 and CH4. Wang and Li explored the influence of the temperature on the mixing degree of CO2 and CH4 through numerical simulation methods. The simulation results indicated that as the temperature increased, the change in the CO2 molar content in the produced working gas was small [15,43]. Cao et al. pointed out that, during the production stage of the working gas, the width of the mixed gas zone decreases with an increase in temperature [46]. This is due to the high reservoir pressure caused by the increase in temperature, which increases the dynamic viscosity of the gas, thus reducing the mixing degree of CO2 and CH4. The width of the mixed gas zone increases after CH4 injection, which is because molecular diffusion plays a dominant role and the diffusion coefficient is high, but the changing trend of the mixed gas zone is not obvious (Figure 12). This is consistent with the simulation results of the multi-component seepage mathematical model established by Ma et al. [32]. Although the temperature of the reservoir changes during the operation of the gas storage facility, it has almost no effect on the degree of mixing of CO2 and CH4.

3.1.4. Reservoir Pressure

The reservoir pressure dominates the flow of gas, and the pressure changes directly affect the operation efficiency of gas storage and the CH4 recovery. An increase in pressure leads to a decrease in the molecular diffusion coefficient, which affects the physical properties of the gases, including the density, viscosity, and compression factor, etc. [44]. Li and Hu et al. showed that when the reservoir pressure is lower than the supercritical pressure of CO2, the diffusion of CO2 molecules intensifies, resulting in a greater degree of mixing between CO2 and CH4 [40,43]. When the reservoir pressure is higher than the supercritical pressure of CO2, the degree of mixing between CO2 and CH4 decreases because of the phase changes of CO2. Wang suggested that, in actual production, regardless of whether the CO2 cushion gas is injected from the edge or bottom of the gas storage facility, the pressure of the gas storage should not be too low, and the proportion of the working gas in the gas storage facility should also be controlled [15]. The possible reason for this situation is that the proportion of working gas is too high and the pressure drops too quickly during working gas production. Once the rate of the pressure change in the gas storage facility is too high, the mixing degree of CO2 and CH4 is intensified. Therefore, in the production process of the working gas, the gas production pressure should be monitored within a reasonable range, and the lower pressure limit should be above the CO2 supercritical pressure.

3.1.5. Reservoir Thickness

In terms of storage capacity, the thicker the reservoir, the more advantageous the increase in the CH4 storage volume. Ma et al. conducted simulations to evaluate the degree of mixing between CO2 and CH4 under various reservoir thicknesses, specifically 22, 50, and 100 m [32]. Additionally, a comparison was performed to determine the significance of gravity’s influence on the mixing process, as illustrated in Figure 13. Without considering the effect of gravity, the phase interface of the mixed gases is almost perpendicular to the horizontal reservoir, ignoring the influence of the density differences between the two gases (Figure 13b). Considering the influence of gravity, the dip angle distribution of the mixed phase interface is about 26°, 16°, and 11°, and the distribution area of CH4 is in an inverted cone shape in the model with reservoir thicknesses of 22 m, 55 m, and 100 m, respectively. As the thickness of the reservoir increases, the degree of mixing of CO2 and CH4 decreases. The distribution of the CO2 cushion gas is cone-shaped in the process of CH4 production, driving the working gas towards the production well. Compared with the flow speeds of gases in thick reservoirs, the gas flow rate in thin reservoirs is faster, which leads to stronger CO2 intrusion along the CH4 production direction between CO2 and CH4 [13]. Therefore, for thin reservoirs, the CH4 recovery rate should be reduced reasonably to produce a purer working gas.

3.2. Injection–Production Parameter Factors

3.2.1. Injection–Production Rate

The operating characteristics of underground natural gas storage reflect high-intensity injection–production, making the mixing of CO2 and CH4 easier. The injection–production rate has a significant impact on the development of mixed gas zones and the quality of the working gas produced. In the CH4 injection stage of gas storage, the segmented injection method is better than the continuous injection method. Hu et al. pointed out that a smaller injection rate should be used to inject the working gas in the initial stage of gas storage [40]. In the middle stage, the injection rate can be appropriately increased, and, in the final stage, the injection rate can be steadily reduced. This segmented gas injection method can effectively ensure smooth advancement and reduce the disturbance of the mixing zones of CO2 and CH4. The production rate of CH4 is also one of the most important parameters in gas storage. A higher gas production rate leads to a rapid decrease in the formation pressure, which is unfavorable for the operation of gas storage. Li and Sadeghi et al. discussed the effects of different gas production rates on the mixing degree of CO2 and CH4 by controlling the recovery pressure difference [36,43]. The results show that the faster the CH4 recovery rate, the higher the CO2 concentration in the produced mixed gases and the faster the development of the mixed gas zone, as shown in Figure 14. Therefore, a smaller gas production rate is more favorable for the enhanced quality of the produced working gas. Otherwise, the gas production rate of CH4 should meet the requirements of natural gas peak shaving. The optimum gas production rate should be the minimum gas production rate while satisfying the peak shaving requirements.

3.2.2. Injection–Production Cycles

The injection–production cycles of the gas storage have a significant impact on the mixture degree of the working gas and CO2. Wang and Li pointed out that, after the fourth injection–production cycle, the CO2 content in the produced working gas was about 50 times higher than that in the first injection–production cycle [15,43]. The average reservoir pressure decreases by 0.6 MPa for gas storage after four injection–production cycles. As shown in Figure 15, Niu simulated the injection–production cycles of CO2 as a cushion gas in fractured underground natural gas storage [45]. It was found that as the injection–production cycle was prolonged, the mixing degree increased for CO2 and CH4, and the mixing gas zone gradually approached the CH4 production well. The injection–production cycles intensified the gas disturbance in the gas storage facility, and the range of mixed gas zones increased accordingly. However, the mixed gas zone is still in a layered distribution, which is the result of gravity due to the density difference between CO2 and CH4. To reduce the impact of the injection–production cycles on the degree of mixing, after each injection and production stage, the well should be shut down for some time before proceeding to the next cycle of injection–production, which is more conducive to controlling the mixed gas zone.

3.2.3. CO2 Injection Methods

The mixing degree of CO2 and CH4 is also influenced by the injection mode of CO2 as a cushion gas. Normally, two methods of CO2 cushion gas injection are used during gas storage. ① The gas storage facility is filled via CO2 injection until the pressure reaches the designed value, and then natural gas is injected from the central area of the gas container. With the continuous injection of natural gas, the pore spaces are gradually occupied by CH4, displacing CO2 and forming a central concentration area of natural gas. ② The CO2 as a cushion gas is injected from the edge well, and natural gas is injected from the central well. As shown in Figure 15 and Figure 16, if CO2 is filled from the central area of gas storage as a cushion gas, there is a large amount of CO2 cushion gas near the natural gas production well at the initial CH4 production moment. When a large amount of natural gas is injected and produced at this time, the fluid flow within the reservoir will be more intense, intensifying the mixing degree between the natural gas and CO2. However, if the CO2 cushion gas is injected from the edge area of the gas storage facility, this reduces the mixing between CH4 and CO2 caused by the violent fluid flow when simulating peak shaving injection and production during gas storage [47,48]. Because the cushion gas is produced or consumed by the dissolution of CO2 in water or oil, a certain cushion gas supplement is needed in the process of natural gas injection–production to maintain the gas storage pressure.

3.2.4. CO2 Cushion Gas Ratio

The ratio of the supercritical CO2 in the total gas content of the gas storage has an important impact on the operation of the gas storage facility. Sadeghi et al. analyzed the content variation of CO2 and CH4 in the produced working gases under different CO2 ratios as cushion gases [25]. The results showed that a higher ratio of CO2 as a cushion gas led to a significant increase in the CO2 content in the produced gases. The produced CH4 does not meet the enthalpy value standard after the CO2 content ratio is over 30%. However, a higher ratio of CO2 as a cushion gas maintains higher pressure in the gas storage, which reduces the adsorption of CH4 on rock surfaces. In a numerical simulation, Hu and Li pointed out that when the CO2 cushion gas ratio is 30%, the CH4 recovery is higher, but the CO2 content in the produced working gas also increases significantly [13,40]. When the cushion gas ratio is 20%, the degree of CH4 recovery is close to that under the condition of a 30% ratio of CO2 in the gas storage, and the mixing degree with the cushion gas ratio of 10% is less than 3%. Thus, the effect is better when the CO2 cushion gas ratio is 20%. Niu analyzed the ratio of CO2 cushion gas in fractured depleted gas storage and found that the most suitable ratio of CO2 cushion gas was between 19.5% and 32.5%, and the edge injection of CO2 was adopted to prevent the CO2’s premature breakthrough [45]. The mixing degree of CO2 and CH4 will not affect the peak shaving of the storage operation.

3.2.5. Well Patterns

Zhang et al. considered the impact of the well location (edge wells and central wells) of CO2 injection on the mixing degree of CO2 and CH4 [38]. The results showed that when CO2 was injected from the edge well, the CO2 displaced the remaining CH4 towards the central well. This not only improved the CH4 recovery but also reduced the cost of gas storage. In addition, the escape of the working gas from the edge wells is also prevented by the CO2 stored at the edge of the reservoir. When using a central well to inject CO2, the CO2 displaces the remaining CH4 to the edge of the reservoir, increasing the degree of mixing between CO2 and CH4. Comparing the above two CO2 injection methods, the CO2 content in the working gas produced via the central wells is 37.1% higher than that with the edge well method in a five-point well pattern. Compared with the storage effect in reservoirs using CO2 injection from the top and bottom, the results showed that the CO2 molar content in the working gas produced by the top CO2 cushion gas injection method was 1.1% higher than that of the bottom method at the end of working gas production. This is because when the CO2 cushion gas is injected from the bottom, the CO2 is mainly concentrated at the bottom of the reservoir, and the mixed gas zone slowly migrates upwards with the injection–production process of the working gas. When the CO2 is injected at the top, it is mainly concentrated in the middle and upper parts of the reservoir. The location of the mixed gas zone is higher within the reservoir, resulting in higher molar content of CO2 when producing CH4.
In summary, after the injection of the CO2 cushion gas, it is more inclined to settle between the CH4 working gas and the formation water, i.e., at the gas–water contact (GWC) area. Thus, the CO2 injection location should be away from the methane operation area with perforations with the lowest fluid flow properties, i.e., low permeability close to the GWC area [44].
The research results on the reservoir characteristics and operating parameters of CO2 as a cushion gas are listed in Table 2.

4. The Storage Capacity and Stability of Gas Storage

When the CO2 cushion gas is injected into the gas storage facility, a part of the CO2 reacts with the formation water to generate carbonate (H2CO3), bicarbonate (HCO3), and carbonate (CO32−), resulting in an acidic environment, which induces the CO2–water–rock interaction [50,51,52]. Mineral dissolution and precipitation will also be generated during the CO2 injection process, leading to changes in the reservoir pore structure and volume and affecting the reservoir stability and gas storage capacity. In CO2 flooding indoor experiments, Zhao et al. showed that as the contact time increased between the CO2 and rock, the percentage of small pores and large pores in the reservoir increased, and the permeability and hydrophilicity also increased [53]. The change in rock permeability is mainly due to the CO2–water–rock reaction, which changes the wettability of the rock and reduces the capillary resistance. Gu et al. pointed out that most mineral dissolution occurred in the upper rock during an interaction experiment focusing on CO2–rock–fluid with the reason being that CO2 is preferentially injected and dissolved from the upper location [54]. During the CO2 displacement process, some precipitates and particles migrate downward to the reservoir, which blocks the pores and reduces the effect of CO2 dissolution. Therefore, the increment in the pore volume from the top to the bottom of the rock core gradually decreases and remains unchanged near the outlet section. The permeability of the upper section of the core increases by 20.07%, while that of the lower section of the core decreases by as much as 33.61%. The impact of CO2 as a cushion gas on the reservoir stability is more commonly referred to in terms of CO2 geological storage. Using X-ray diffraction (XRD), scanning electron microscopy (SEM), a triaxial rock experimental system, and a core displacement experimental setup, Zhao et al. studied the effects of CO2 dissolution on the reservoir rocks, pore structure, and other factors. The experimental results showed that the pore structure of the core changed significantly during CO2 injection [55]. During CO2 injection and production, the bedding planes or microcracks within the rocks promote the dissolution reactions (Figure 17). During the CH4 production process, the fast pressure release of the reservoir increases the probability of microcracks forming and spreading, potentially resulting in crack propagation or even complete fracturing. Due to the dissolution of the cementitious materials, fillers, and mineral components that make up the rock particles, the pores within the reservoirs become larger. The cementitious materials are damaged, the rock core becomes loose, and even microcracks occur, which leads to a significant decrease in the mechanical strength of the rock core.
The periodic injection and production of gas storage will also affect the CH4 recovery in subsequent gas storage and production. Several conclusions have been drawn from multiple cycles of gas–water mutual displacement experiments: (1) multi-cycle gas–water mutual displacement leads to an increase in the relative permeability of the gas phase and residual gas saturation in the gas–water coexistence zone, while the relative permeability of the water phase decreases; (2) during the operation of gas storage, the reciprocating migration of the edge and bottom water causes the formation of many dead gas zones in the pore space of the reservoir, leading to a decrease in the effective gas storage capacity; (3) for reservoirs with widely developed fractures, certain water blocking damage occurs during multiple cycles of gas–water driving, and the effectiveness of reservoir capacity utilization is reduced [56,57,58,59,60,61,62]. By conducting indoor displacement experiments, Xiong et al. implemented multiple cycles of injection–production to explore the relationship between the storage capacity and injection–production cycles [49]. The results showed that the gas saturation gradually increased as the injection–production cycles increased. The gas saturation in the first, second, third, fourth, and fifth cycles increased by 7.81%, 8.5%, 22.01%, 9.24%, and 2.13%, respectively. After five cycles, the gas saturation reached 50.61%. After the third cycle of injection–production, the increase in the storage capacity decreased, indicating that the storage capacity remained stable after three cycles of injection–production. In the fourth and fifth cycles, the effect of gas on oil and water removal weakened, and the storage space increased slowly, approaching the maximum storage capacity. This is because, in multiple injection production cycles of gas storage, some pores previously occupied by water and crude oil are occupied by the injected gas. Frequent injection–production leads to continuous changes in the reservoir temperature, pressure, and geological structure, resulting in changes in the injection–production capacity and storage capacity [44,45,46,47,54]. Due to the influence of the water and oil content, the maximum storage capacity of a depleted reservoir can only reach half of the entire storage space.

5. Conclusions and Challenges

(1) Because of the differences in the physical properties of CO2 and CH4, such as the density, viscosity, and compressibility, the mixing degree of CO2 and CH4 is rather low under natural gas storage. Compared with the viscosity of CH4, the viscosity of CO2 is higher, therefore reducing the migration rate of CO2 and enhancing the CO2 sweep volume. When CO2 is used as a cushion gas in storage, more working gas can be stored. Under the influence of gravity, CO2 naturally deposits at the bottom of the gas storage facility, also ensuring efficient segregation and preventing gas mixing. During the gas production process, CO2 provides a sufficient driving force for the working gas and supplies the energy within the storage system.
(2) For low-porosity and high-permeability gas reservoirs, reducing the injection volume of CO2 as a cushion gas is an effective measure to control the mixing of CH4 and CO2. The temperature change also has a certain effect on the gas mixing. The higher reservoir temperature promotes the diffusion between gas molecules, therefore increasing the mixing degree of CO2 and CH4. However, the influence of the temperature on the mixing degree of the gases is limited. Compared with gas storage with CO2 as a cushion gas within a small-dip-angle and thin reservoir, the thick geological structure and large inclination angle are more suitable for the use of CO2 as a cushion gas. This conclusion provides a reference for the engineering practice focused on using CO2 as a cushion gas.
(3) Injecting CO2 from the bottom of the edge well as a cushion gas is the best injection method to prevent CO2 from mixing with CH4. The optimal proportion of CO2 cushion gas is 19.5–32.5% within natural gas storage. The segmented injection method can ensure the stable advancement of the mixed gas zone.
(4) CO2 injection also induces a CO2–water–rock interaction, which causes a change in the reservoir stability. Under the long-term operation of CO2 injection and CH4 production, mineral dissolution and precipitation exist simultaneously. The reservoir stability decreases with multiple cycles of injection–production. The CO2–water–rock reaction causes an increase in the pore volume and enhances the reservoir storage capacity.
(5) When the oil–gas–water three-phase fluid exists, the underground seepage law does not fully conform to the conventional Darcy seepage. However, this has caused great uncertainty about the accuracy of simulation results on the use of CO2 as a cushion gas for underground natural gas storage.

Author Contributions

S.D. is mainly responsible for paper indeas, writing, and editing. M.B. is mainly responsible for the guidance, English writing, and supervision of the paper. Y.S. mainly procided further confirmation and detailed description of the methodology during the paper revision process. Y.Z. mainly analyzes and organizes the data in detailin the paper. D.Y. mainly collected and organized papers. All authors have read and agreed to the published version of the manuscript.

Funding

This work is supported by the National Natural Science Foundation of China (Grant No.: 52174020).

Conflicts of Interest

Authors Yukai Shi, Yuan Zha and Deng Yan were employed by the No. 3 Gas Production Plant of Changqing Oilfield Company. The remaining authors declare that the research was conducted in the absence of any commercial or financial relationships that could be construed as a potential conflict of interest. The company had no role in the design of the study; in the collection, analyses, or interpretation of data; in the writing of the manuscript, or in the decision to publish the results.

References

  1. Tian, G. China natural gas development report. Nat. Gas Ind. 2021, 41, 68. [Google Scholar]
  2. Lei, H. Opportunities and challenges to the construction of underground gas storage in China. Oil Gas Storage Transp. 2018, 37, 728–733. [Google Scholar]
  3. Wei, G.Q.; Zheng, Y.L.; Qiu, X.S.; Sun, J.C.; Shi, L.; Lai, X. Geological theory and application of underground gas storage in China. Acta Pet. Sin. 2019, 40, 1519–1530. [Google Scholar]
  4. Bai, M.X.; Sun, J.P.; Song, K.P.; Reinicke, K.M.; Teodoriu, C. Evaluation of mechanical well integrity during CO2 underground storage. Environ. Earth Sci. 2015, 73, 6815–6825. [Google Scholar] [CrossRef]
  5. Bai, M.X.; Reinicke, K.M.; Song, K.P. An overview of hydrogen underground storage technology and prospects in China. J. Pet. Sci. Eng. 2014, 124, 132–136. [Google Scholar] [CrossRef]
  6. Zhang, G.X.; Li, B.; Zheng, D.W.; Ding, G.S.; Wei, H.; Qian, P.S.; Li, C. Challenges to and proposals for underground gas storage (UGS) business in China. Nat. Gas Ind. 2017, 37, 153–159. [Google Scholar] [CrossRef]
  7. Ding, G.S. Developing trend and motives for global underground gas storage. Nat. Gas Ind. 2010, 30, 59–61+117. [Google Scholar]
  8. Ding, G.S.; Wei, H. Review on 20 years’ UGS construction in China and the prospect. Oil Gas Storage Transp. 2020, 39, 25–31. [Google Scholar]
  9. Bai, M.X.; Song, K.P.; Li, Y.; Reinicke, K.M. Development of a novel method to evaluate well integrity during CO2 underground storage. SPE J. 2015, 20, 628–641. [Google Scholar] [CrossRef]
  10. Bai, M.X.; Sun, J.P.; Song, K.P.; Reinicke, K.M.; Li, L.; Qiao, Z. Well Completion and integrity evaluation for CO2 injection wells. Renew. Sustain. Energy Rev. 2015, 45, 556–564. [Google Scholar] [CrossRef]
  11. Foh, S.E. The Use of Inert Gas as Cushion Gas in Underground Storage: Practical and Economic Issues; Institute of Gas Technology: Chicago, IL, USA, 1991. [Google Scholar]
  12. Laille, J.P.; Molinard, J.E.; Wents, A. Inert Gas Injection as Part of the Cushion of the Underground Storage of Saint-Clair-Sur-Epte, France; SPE Gas Technology Symposium: Dallas, TX, USA, 1988. [Google Scholar]
  13. Li, G.T.; Song, G.H.; Zhang, J.; Wen, Q.H.; Zhang, Q. Theoretical discussion of carbon dioxide as cushion gas for underground gas storage tank. Nat. Gas Explor. Dev. 2008, 61–63. [Google Scholar]
  14. Liu, A. Numerical Simulation of CO2 as Cushion Gas in Aquifer Underground Gas Storage; Southwest Petroleum University: Chengdu, China, 2015. [Google Scholar]
  15. Wang, Y.J. Feasibility Study on CO2 as Cushion Gas in Depleted Gas Storage; Southwest Petroleum University: Chengdu, China, 2014. [Google Scholar]
  16. Hu, S.Y.; Li, Y.K.; Wang, Z.W.; Peng, G.Q. Research status and prospect of deplated oil-gas reservoir storage using CO2 as the cushion gas. Oil Gas Storage Transp. 2016, 35, 130–139. [Google Scholar]
  17. Hitoshi, K.; Yoshiyuki, T.; Yoshikazu, N.; Masaki, I.; Kazuitsu, I.; Yuji, S. Underground storage of carbon dioxide in depleted natural gas reservoirs and in useless aquifers. Eng. Geol. 1993, 34, 175–179. [Google Scholar]
  18. Jaxek, B.; Czeslaw, R. The gas mixing process in underground gas storages—The “Wierzchowice” UGS case. Arch. Min. Sci. 2008, 53, 53–62. [Google Scholar]
  19. Tan, Y.F. Numerical solution of gas mixing questions in underground gas storage. Nat. Gas Ind. 2003, 23, 102–105. [Google Scholar]
  20. Oldenburg, C.M.; Benson, S.M. CO2 Injection for Enhanced Gas Production and Carbon Sequestration; SPE International Petroleum Conference and Exhibition in Mexico: Villahermosa, Mexico, 2002. [Google Scholar]
  21. Oldenburg, C.M. Carbon Sequestration in Natural Gas Reservoirs: Enhanced Gas Recovery and Natural Gas Storage; Lawrence Berkeley National Laboratory: Berkeley, CA, USA, 2003; pp. 1–8. [Google Scholar]
  22. Oldenburg, C.M. Carbon dioxide as cushion gas for natural gas storage. Energy Fuels 2003, 17, 240–246. [Google Scholar] [CrossRef]
  23. Kim, J.; Choi, J.; Park, K. Comparison of nitrogen and carbon dioxide as cushion gas for underground gas storage reservoir. Geosyst. Eng. 2015, 18, 163–167. [Google Scholar] [CrossRef]
  24. Mu, L.; Liao, X.; Yu, Q.; Hao, L.; Zhang, J.; Zhao, J.; Wu, J. Study on Operation Strategy of Aquifer Underground Gas Storage Using CO2 as Cushion Gas; Carbon Management Technology Conference: Houston, TX, USA, 2019. [Google Scholar]
  25. Sadeghi, S.; Sedaee, B. Mechanistic simulation of cushion gas and working gas mixing during underground natural gas storage. J. Energy Storage 2022, 46, 103885. [Google Scholar] [CrossRef]
  26. Helland, J.O.; Friis, H.A.; Assadi, M.; Nagy, S. Machine learning for underground gas storage with cushion CO2 using data from reservoir simulation. IOP Conf. Ser. Mater. Sci. Eng. 2023, 1294, 012058. [Google Scholar] [CrossRef]
  27. Huang, L. CO2 Geological Storage and Utilization. Atmosphere 2023, 14, 1166. [Google Scholar] [CrossRef]
  28. Liu, Y.L.; Hu, T.; Rui, Z.H.; Zhang, Z.; Du, K.; Yang, T.; Birol, D.; Erling, H.S.; Farshid, T.; Andrey, A. An integrated framework for geothermal energy storage with CO2 sequestration and utilization. Engineering 2023, 30, 121–130. [Google Scholar] [CrossRef]
  29. Belonoshko, A.; Saxena, S.K. A molecular dynamics study of the pressure-volume-temperature properties of supercritical fluids: II. CO2, CH4, CO, O2, and H2. Geochim. Cosmochim. Acta 1991, 55, 3191–3208. [Google Scholar] [CrossRef]
  30. Setzmann, U.; Wagner, W. A new equation of state and tables of thermodynamic properties for methane covering the range from melting line to 625 K at pressures up to 100 MPa. J. Phys. Chem. Ref. Data 1991, 20, 1061–1155. [Google Scholar] [CrossRef]
  31. Span, R.; Wagner, W. A New Equation of State for Carbon Dioxide Covering the Fluid Region from the Triple-Point Temperature to 1100 K at Pressures up to 800 MPa. J. Phys. Chem. Ref. Data 1996, 25, 1509–1596. [Google Scholar] [CrossRef]
  32. Ma, J.L.; Li, Q.; Kempka, T.; Kühn, M. Hydromechanical response and impact of gas mixing behavior in subsurface CH4 storage with CO2-based cushion gas. Energy Fuel 2019, 33, 6527–6541. [Google Scholar] [CrossRef]
  33. Du, S.Y.; Bai, M.X.; Zhang, Z.C.; Liu, J.Y. Research status of CO2 as cushion gas in underground natural gas storage. Appl. Chem. Ind. 2023, 52, 2387–2391+2396. [Google Scholar]
  34. Imre, A.; Ramboz, C.; Kraska, T.; Deiters, U.K. Anomalous fluid properties of carbon dioxide in the supercritical region: Application to geological CO2 storage and related hazards. Environ. Earth Sci. 2015, 73, 4373–4384. [Google Scholar] [CrossRef]
  35. Kunz, O.; Klimeck, R.; Wagner, W.; Jaeschke, M. The GERG-2004 wide-range equation of state for natural gases and other mixtures. In GERG Technical Monograph; Publishing House of the Association of German Engineers: Düsseldorf, Germany, 2007. [Google Scholar]
  36. Sharif, S.; Hamed, N.; Arezou, J. Utilization of CO2 and N2 as cushion gas in underground gas storage process: A review. J. Energy Storage 2023, 67, 107596. [Google Scholar]
  37. Nuhu, M.; Abubakar, J.A.; Godpower, C.E.; Salihu, M.S.; Donatus, E.E.; Muhammad, K.A. Alternating N2 gas injection as a potential technique for enhanced gas recovery and CO2 storage in consolidated rocks: An experimental study. J. Pet. Explor. Prod. Technol. 2020, 10, 3883–3903. [Google Scholar]
  38. Zhang, R.H.; Chen, S.N.; Hu, S.Y.; Zhao, Y.L.; Zhang, B.N.; Wang, R.H. Numerical simulation and laboratory experiments of CO2 sequestration and being as cushion gas in underground natural gas storage reservoirs. J. Nat. Gas Sci. Eng. 2021, 85, 103714. [Google Scholar] [CrossRef]
  39. Belousov, A.; Lushpeev, V.; Sokolov, A.; Sultanbekov, R.; Tyan, Y.; Ovchinnikov, E.; Shvets, A.; Bushuev, V.; Islamov, S. Hartmann–sprenger energy separation effect for the quasi-isothermal pressure reduction of natural gas: Feasibility analysis and numerical simulation. Energies 2024, 17, 2010. [Google Scholar] [CrossRef]
  40. Hu, S.Y.; Hu, X.R.; Li, Y.K.; Ma, J.X. Feasibility analysis about taking CO2 as cushion gas for gas storage rebuilt upon depleted gas reservoirs. Reserv. Eval. Dev. 2018, 8, 56–59. [Google Scholar]
  41. Son, T.N.; Tan, C.N.; Hyunsang, Y.; George, E. Geomechanical study and wellbore stability analysis for potential CO2 storage into devonian and silurian formations of delaware basin. In SPE Oklahoma City Oil and Gas Symposium/Production and Operations Symposium; SPE: Kuala Lumpur, Malaysia, 2023. [Google Scholar]
  42. Bondarenko, A.V.; Islamov, S.R.; Mardashov, D.V. Features of oil well killing in abnormal carbonate reservoirs operating conditions. In Proceedings of the 15th Conference and Exhibition Engineering and Mining Geophysics. European Association of Geoscientists and Engineers, Gelendzhik, Russia, 22–26 April 2019; pp. 629–633. [Google Scholar]
  43. Li, Y.K. The Impact of Reservoir Properties and Operating Conditions on Mixing of CO2 Cushion and Natural Gas in Storage Reservoirs; Southwest Petroleum University: Chengdu, China, 2017. [Google Scholar]
  44. Namdar, H.; Khodapanah, E.; Tabatabaei-Nejad, S.A. Comparison of base gas replacement using nitrogen, flue gas and air during underground natural gas storage in a depleted gas reservoir. Energy Sources Part A 2020, 42, 2778–2793. [Google Scholar] [CrossRef]
  45. Niu, C.K. Seepage Displacement and Operating Simulation of Fractured Underground Natural Gas Storage Reservoir; Harbin Institute of Technology: Harbin, China, 2016. [Google Scholar]
  46. Cao, C.; Liao, J.X.; Hou, Z.M.; Xu, H.C.; Faisal, M.; Wu, X.N. Utilization of CO2 as cushion gas for depleted gas reservoir transformed gas storage reservoir. Energies 2020, 13, 576. [Google Scholar] [CrossRef]
  47. Tan, Y.F.; Zhan, C.H.; Cao, L.; Lin, T. Gas mixing mechanism taking CO2 as cushion gas and feasibility of operation control. Nat. Gas Ind. 2005, 25, 105–107. [Google Scholar]
  48. Lee, B.; Michael, G.K. A generalized thermodynamic correlation based on three-parameter corresponding states. AIChE J. 1975, 21, 510–527. [Google Scholar] [CrossRef]
  49. Xiong, Y.; Xu, H.G.; Li, H.; Li, J.D.; Zhu, Y.B. Indoor experimental study on the mechanism of capacity change of gas storage in waste oil reservoir. Sci. Technol. Eng. 2015, 15, 173–176. [Google Scholar]
  50. Jan, K.; Lukasz, K.; Stanislaw, N. Numerical simulation study on underground gas storage with cushion gas partially replaced with carbon dioxide. Energies 2023, 16, 5248. [Google Scholar] [CrossRef]
  51. Dumitrache, L.N.; Suditu, S.; Ghețiu, I.; Pană, I.; Brănoiu, G.; Eparu, C. Using numerical reservoir simulation to assess CO2 capture and underground storage, case study on a romanian power plant and its surrounding hydrocarbon reservoirs. Processes 2023, 11, 805. [Google Scholar] [CrossRef]
  52. Gravanis, E.; Ernestos, S. A working model for estimating CO2-induced uplift of cap rocks under different flow regimes in CO2 sequestration. Geomech. Energy Environ. 2023, 33, 100433. [Google Scholar] [CrossRef]
  53. Zhao, M.G.; Yang, Y.Z.; Yang, H.Y. Changes of rock properties in CO2 flooding. Sci. Technol. Rev. 2013, 31, 50–52. [Google Scholar]
  54. Gu, L.B.; Li, Z.P.; Hou, X.L. Experimental research of reservoir physical changes induced by CO2 flooding. J. Oil Gas Technol. 2007, 3, 258–260+513. [Google Scholar]
  55. Zhao, R.B.; Sun, H.T.; Wu, Y.S.; Zhao, C.F.; Yue, X.A. Laboratory study on the effect of carbon dioxide storage on formation rock. Sci. Sin. 2010, 40, 378–384. [Google Scholar]
  56. Wang, X.M.; Guo, P.; Jiang, F.G. The physical simulation study on the gas-drive multiphase flow mechanism of aquifer gas storage. Nat. Gas Geosci. 2006, 17, 597–600. [Google Scholar]
  57. He, X.L.; Huang, S.J.; Sun, C.W.; Xu, J.J.; Zhang, X.J.; Yang, X.P. Gas-water relative permeability variation in multi-cycle injection-production of underground gas storage in flooded depleted gas reservoir. Oil Gas Storage Transp. 2015, 34, 150–153. [Google Scholar]
  58. Zhang, Q. Experimental study of seepage law of fractured carbonate gas storage injection and production. In Statue of Seepage Fluid Mechanics; Chinese Academy of Science: Beijing, China, 2015. [Google Scholar]
  59. Ding, Y.H.; Zhang, Q.; Zheng, D.W.; Wang, X.M.; Shi, L.; Li, C.; Xu, H.C. Seepage laws in converting a microfissure-pore carbonate gas reservoir into a UGS. Nat. Gas Ind. 2015, 35, 109–114. [Google Scholar]
  60. Shi, L.; Liao, G.Z.; Xiong, W.; Gao, S.S.; Geng, T. Gas-water percolation mechanism in an underground storage built on a water-drive sandstone gas reservoir. Nat. Gas Ind. 2012, 32, 85–87. [Google Scholar]
  61. Xie, J.; Liang, H.Z.; Guo, R.; Wang, J.K.; Wang, M.Q.; Duan, Y.J. Research status of the fluid displacement mechanism during the multi-rounds strong injection-production for the carbonate rock underground gas storage. Period. Ocean. Univ. China 2018, 48, 88–95. [Google Scholar]
  62. Wang, J.K.; Zhang, J.L.; Ding, F. Initial gas full component simulation experiment of Ban-876 underground gas storage. J. Nat. Gas Sci. Eng. 2014, 18, 131–136. [Google Scholar] [CrossRef]
Figure 1. Regional distribution of underground natural gas storage [6].
Processes 12 01489 g001
Figure 3. The process diagram for the use of CO2 as a cushion gas for natural gas underground storage.
Processes 12 01489 g003
Figure 4. Density differences with the change in temperature and pressure [30,31,32]. (a) The density of CH4; (b) the density of CO2.
Processes 12 01489 g004
Figure 5. (a) The isobaric density of CO2 at 7.5 MPa [34]. (b) The effect of a temperature of 303 K, 313 K, and 323 K on the density of CO2 and CH4 [35].
Processes 12 01489 g005
Figure 6. The density change of the CO2 and CH4 mixture with different ratios at 313.15 K.
Processes 12 01489 g006
Figure 7. The effect of the CO2 viscosity on the mixing zone. (a) Working gas injection stage; (b) production working gas stage [36].
Processes 12 01489 g007
Figure 8. (a) The changes in the viscosity of CO2 and CH4 with temperature at 10.3 MPa [37]. (b) The viscosity change of the CO2-CH4 mixture at 313.15 K.
Processes 12 01489 g008
Figure 9. Relation between density and compression factor of CO2 and CH4 mixture (313.15 K); x—molar content of CO2 in a binary mixture [13].
Processes 12 01489 g009
Figure 10. Effect of porosity on CO2 content in produced gas [15].
Processes 12 01489 g010
Figure 11. The effect of permeability changes on the mixing of CO2 and CH4 [25,37,44,45].
Processes 12 01489 g011
Figure 12. Thickness variation of the mixing zone at different temperatures [46].
Processes 12 01489 g012
Figure 13. (a) The fluid dynamics coupling model was used to calculate the distribution of a mixed zone with a reservoir thickness of 22 m after natural gas injection for 30, 90, and 180 days, considering gravity effects. (b) Without considering the gravity effect, the fluid dynamics coupling model was used to calculate the distribution of a mixed zone with a reservoir thickness of 22 m after natural gas injection for 30, 90, and 180 days. (c) The fluid dynamics coupling model was used to calculate the distribution of a mixed zone with a reservoir thickness of 50 m after natural gas injection for 30, 90, and 180 days, taking into account the gravity effect. (d) The fluid dynamics coupling model was used to calculate the distribution of a mixed zone with a reservoir thickness of 100 m after natural gas injection for 30, 90, and 180 days, taking into account the gravity effect. (Blue represents CO2 cushion gas, red represents natural gas, and the remaining colors indicate mixed zones. Natural gas is injected into the reservoir from a distance of 3 m from the upper left corner [32].)
Processes 12 01489 g013
Figure 14. CO2 content in produced gas at different recovery rates [43].
Processes 12 01489 g014
Figure 15. Mixing zone in different periods (filled with CO2 in all UGS) [45].
Processes 12 01489 g015
Figure 16. Mixing zone in different periods (filled with CO2 in marginal zone of UGS) [45].
Processes 12 01489 g016
Figure 17. Scanning electron microscopy (SEM) images before and after core dissolution. (a) Before core dissolution, (b) after core dissolution, (c) before plagioclase feldspar dissolution, (d) after plagioclase feldspar dissolution, (e) before CO2 solution exfoliation, (f) after CO2 solution exfoliation [55].
Processes 12 01489 g017
Table 1. Demand for underground natural gas storage in various regions of the world (unit: 108 m3) [7].
Region/Year200520102015202020252030
Commonwealth of Independent States (CIS) Countries136014801560165017301770
North America116013401530162017201870
Europe7909301090121012901350
Asia–Pacific region20204080100120
Asia102050120200210
Latin America and the Caribbean01010203040
Middle East000203040
Africa000102030
Table 2. Several studies on the geological reservoir characteristics and operational parameters of CO2 as a cushion gas.
Type of Gas StorageCO2 Cushion Gas PercentageReservoir PropertiesStorage ConditionsCO2 Content in Recovered Gas
/mol%
Reference(s)
Thickness
/m
PorosityPermeability
/mD
Temperature
/K
Pressure
/MPa
Aquifer gas storage10–30100.05–0.25100–5003138.44.1–40.8[24]
Donghae gas reservoir0–2030.480.2Kh: 50–120
Kv: 10
303.15–323.155.170.2–9.1[44]
Depleted gas storage2030.480.2Kh: 50
Kv: 10
366.485.176.2[23]
Depleted gas storage10–257 layers0.1–0.425–500308.15–328.1540.05–30[15]
Depleted gas storage10–4060.1–0.2510–50313.158–120–24[16]
Depleted gas storage46.675.60.2123.7341.489.29–15.00.1–1.3[36]
Aquifer gas storageSaturation100.2121–1073313.15124.1–20.4[49]
Depleted gas storageSaturation220.31013313.150Not mentioned specifically[20,32]
Fractured depleted gas storage7–9132.4–75.6φ: 10.55
φf: 6.07
600387.457.5Not mentioned specifically[45]
Aquifer gas storage10–4036 grids0.17224362.1541–26[50]
Disclaimer/Publisher’s Note: The statements, opinions and data contained in all publications are solely those of the individual author(s) and contributor(s) and not of MDPI and/or the editor(s). MDPI and/or the editor(s) disclaim responsibility for any injury to people or property resulting from any ideas, methods, instructions or products referred to in the content.

