Article

Effect of Nozzle Quantity on the Flow Field Characteristics and Grinding Efficiency in a Steam Jet Mill

1
School of Environment and Resource, Southwest University of Science and Technology, Mianyang 621010, China
2
Key Laboratory of Solid Waste Treatment and Resource Recycle, Ministry of Education, Southwest University of Science and Technology, Mianyang 621010, China
3
School of Mechanical Engineering, Sichuan University of Science and Engineering, Yibin 644000, China
*
Author to whom correspondence should be addressed.
Processes 2024, 12(7), 1500; https://doi.org/10.3390/pr12071500
Submission received: 24 June 2024 / Revised: 9 July 2024 / Accepted: 16 July 2024 / Published: 17 July 2024

Abstract

:
A steam jet mill (SJM), which employs industrial waste heat steam as a gas source, is a widely utilized apparatus for the pulverization of fly ash. To achieve elevated single-machine grinding capacity, efficiency improvement research based on structural optimization should be conducted. In this study, numerical simulations and industrial experiments are carried out on SJMs equipped with three and six nozzles (hereinafter referred to as N3 and N6, respectively) to study the influence of nozzle quantity on the flow field and grinding efficiency. The numerical simulation results indicate that, under the N3 structure, particles can achieve a higher impact velocity in the comminution area and improve the kinetic energy of a single impact. In the conveying area, the airflow diffusion is better, resulting in an upward flow field that is more uniform. The classification area shows an increase in the uniformity of the flow field and a significant reduction in the local vortex structure, which is beneficial for accurate particle classification. In the interim, industrial experiments demonstrate that the N3 structure can markedly enhance the processing capacity and energy efficiency of the system. The smaller the feed particle size, the more pronounced the efficiency improvement.

1. Introduction

The global production of solid industrial waste is increasing and poses an ever-growing burden on the environment [1,2,3]. For instance, in China, the annual net increment of fly ash production is approximately 20,000 tons (calculated as the disparity between 600 million tons produced and 400 million tons utilized) [4], thereby leading to an accumulative stockpile of around 3 billion tons [5]. The ineffective management of such a considerable amount of fly ash not only causes the occupation of precious land resources but also contributes to the pollution of groundwater, air, and ecosystems [6,7]. It is essential to recognize fly ash as a resource instead of waste to facilitate its comprehensive utilization. Despite the development of a diverse array of technologies for the treatment of solid waste, comminution remains a crucial prerequisite for the recovery and reuse of such waste materials [8,9,10]. However, traditional mechanical grinding methods are characterized by high energy consumption and limited capacity [11], so they cannot meet the requirements of industrial solid waste processing. Therefore, a cost-effective and highly efficient grinding technology is urgently needed. In recent years, a novel technique utilizing a steam jet mill (SJM) in conjunction with industrial waste heat to coprocess industrial solid waste has been proposed, opening new opportunities for waste heat utilization and solid waste disposal [12,13]. However, SJM is a type of air flow grinding system, and high energy consumption and low grinding efficiency are unavoidable challenges. Therefore, to identify the optimal number of nozzles for reducing energy consumption and improving grinding efficiency in SJM, this study investigates SJMs with different numbers of nozzles. The findings provide valuable insights for optimizing SJMs using a scientific approach.
SJM is a fluidized bed opposed jet mill utilizing superheated steam as the grinding medium [14,15,16]. Freed from the constraints imposed by air compressors, the design of large-capacity SJMs becomes inherently feasible. However, large-scale design is not simply a matter of scaling up equipment proportionally; rather, it needs a reconfiguration of dimensions based on the principles of air jet milling theory. Current research on SJMs predominantly focuses on their applications and operational parameters [15,17], with comminution theory and design largely based on principles derived from fluidized bed opposed jet mills [18,19,20]. In the realm of air classifier studies, the dimensions of the grinding area, the height of the conveying area, and the aspect ratio of the classification region collectively determine the comminution performance of a jet mill. Notably, the size of the grinding area is governed by the distance between the nozzles and the center of the grinding chamber. Wang et al. [21] reported that nozzle spacing is correlated with comminution efficiency and effectiveness, with the optimal nozzle spacing being dependent on the properties of the material being processed. Following comminution, particles are conveyed via the conveying area to the classifier [22]. However, research on the conveying area remains relatively sparse, with its height and diameter primarily determined through engineering experience. Upon reaching the classification region, the characteristics of the swirling flow field generated by the classifier significantly affect its classification performance. In classifier studies, Benedikt Koeninger et al. [23] utilized high-velocity photography to observe the gas–solid flow behavior surrounding a classifier, highlighting the complexity of such flows and the critical importance of an appropriate gas-to-solid concentration ratio for the classifier’s efficient operation. The selection of classifier dimensions typically begins with an analysis of the forces acting upon particles, which serves to derive a formula for particle cut size, guiding the design process [24]. Although the effect of nozzle number on the efficiency of pneumatic comminution has not yet been explored in current research, relevant studies have been conducted on other jet mills. Luczak et al. [25] demonstrated that a reduction in nozzle count can lead to an enlargement of the grinding area, thereby enhancing comminution efficiency.
To investigate the effect of nozzle number on the grinding efficiency of SJMs, this study initially utilizes numerical simulations to analyze the flow field characteristics within the grinding, conveying, and classification areas for SJMs equipped with three and six nozzles (hereinafter referred to as N3 and N6, respectively). Industrial trials are then conducted to compare the production performance and energy consumption of N3 and N6 in fly ash processing. The research provides a theoretical reference and practical application value for improving the efficiency of fly ash or other solid waste treatment on a large scale.

2. Materials and Methods

2.1. Fly Ash Grinding System

The LNGS-10T pulverization system is configured as shown in Figure 1. The system is located next to a power plant in Zunyi, Guizhou, China, designed and built by Southwest University of Science and Technology and Mianyang Liuneng Powder Equipment Co., Ltd. It consists of a raw material hopper, screw conveyor, SJM, high-temperature dust collector, and high-negative-pressure blower. During operation, the screw feeder transports fly ash from the storage hopper to the SJM for pulverization. The compliant fly ash is collected in the high-temperature belt filter collector and then conveyed as a finished product through the screw conveyor. Among these components, the feed hopper serves the function of storing and conveying materials to the SJM for processing. The SJM, in turn, is responsible for grinding the materials efficiently. The power gas required is supplied by the steam generator, ensuring the necessary energy for the system. The dust collector plays a crucial role in collecting the crushed materials, maintaining a clean and safe working environment. Additionally, the induced blower serves the purpose of creating a negative pressure environment essential for the optimal operation of the entire system.
Before the experiment, the system is preheated with steam to a temperature of 280 °C, and a pressure in the range of 0.1–0.2 MPa, to ensure that the internal temperature of the system rises above 100 °C to avoid condensation of water vapor. Throughout the experimental process, the number of nozzles used is changed via valves, while the classifier velocity is adjusted via a frequency converter. The negative pressure in the system is regulated by a high-pressure-induced draft fan, and the feed amount is controlled by adjusting the frequency of the screw feeder machine. The material levels in the feed hopper and the bag collector are indicated by weight measurements from load cells installed for monitoring purposes.

2.2. SJM

Figure 2 presents diagrams of the N3 and N6 structures. They include components such as the steam inlet, material feed inlet, classifier wheel, airflow outlet, and outer cylinder. On the basis of the varying functions within the device, the interior is divided into distinct regions: the grinding area equipped with nozzles, the conveying area that transports particles to the classifier, and the classification area surrounding the classifier.
In this experiment, the steam consumption rate of N3 (Figure 2a) and N6 (Figure 2b) is 10 tons/h. To ensure the mass flow rate of steam is equal, the throat diameter of N6 is smaller than that of N3, resulting in a shorter actual distance from the nozzle exit to the center of the grinding chamber for N6. However, the dimensionless distance remains the same for both and is 20 times the throat diameter. Dimensionless distance X is defined as
X = D / d c
where D represents the actual distance from the nozzle exit to the center of the grinding chamber, in units of mm; dc denotes the throat diameter of the nozzle, in units of mm.
Figure 3 shows the structural parameters of the nozzle. From the Figure 3, it can be seen that the Laval nozzle is mainly composed of a stabilizing section, a converging section, and a diverging section, designed with appropriate structural parameters to achieve supersonic flow state. The structural parameters of the two nozzles used in this study are shown in Table 1. Under the same inlet conditions, the mass flow rate of a single nozzle in N6 is 0.43 kg/s, while in N3 it is 0.86 kg/s.
During the experiment, the nozzle inlet is connected to a high-pressure, high-temperature steam, generating supersonic jets that fluidize and accelerate incoming material entering from the feed port. This material is then ground in the region where the airflows converge and conveyed by the ascending airflow to the classifier. Material that meets the particle size requirement passes through the classifier and exits the equipment, whereas unsatisfactory material is reintroduced into the high-velocity jet zone for further comminution. This process is repeated until the desired particle size is achieved.

2.3. Experimental Conditions and Materials

The experimental parameters for the SJMs used in this test are presented in Table 2. It should be pointed out that the classifier velocity will increase as the desired particle size decreases. For a desired particle size of d90 = 45 μm, the classifier velocity is 360 rpm. When the desired particle size is d90 = 10 μm, the classifier velocity is 760 rpm.
To assess the influence of varying feed particle size on pulverization efficiency, two types of fly ash with distinct particle size profiles are selected as experimental materials for comparative analysis of the production output and energy consumption associated with N3 and N6. The fly ash has a density of 2400 kg/m3, with the following respective particle size distributions: d50 = 28.292 μm, d90 = 77.853 μm, and d50 = 10 μm, d90 = 45 μm.

2.4. Numerical Simulation

During operation, the SJMs operate at elevated temperatures, with substantial variations in steam pressure and temperature occurring in proximity to the nozzles. Fly ash is dispersed throughout the grinding chamber under the influence of air currents, making direct measurement of the flow field challenging. Consequently, this study resorts to numerical simulations to analyze the distributional characteristics of the flow field within the SJMs.

2.4.1. Fluid Governing Equations

In consideration of the strong swirling flow field generated by the classifier, the RNG k-ε turbulence model is adopted in this study to describe the steam flow, with the following equations [26]:
ρ k t + ρ k u j x j = x j μ + μ t σ k k x j + G k ρ ε
ρ ε t + ρ ε u j x j = x j μ + μ t σ k ε x j + ρ C 1 S ε ρ C 2 ε 2 k + υ ε
In Equations (2) and (3), Gk represents the turbulent kinetic energy generated by the mean velocity gradient; C1 and C2 are constants; and σ k and σ ε are the turbulent Prandtl numbers for turbulent kinetic energy k and dissipation rate ε, respectively.
Given the high steam velocities and substantial variations in pressure and temperature within the grinding area, water vapor can be considered an ideal compressible gas (PV = nRT). The continuity equation and N-S equations for such a scenario are as follows [27]:
ρ t + ρ u j x j = 0
ρ u i t + ρ u i u j x j = p x j + τ j i x j + S l i
Equations (4) and (5) represent the mass conservation equation and momentum conservation equation for the airflow, respectively. Here, ρ denotes the density of water vapor, uj indicates the velocity components in the x, y, and z directions of the Cartesian coordinate system, and Sli represents other source terms.

2.4.2. Mesh and Boundary Conditions

The simulation in this study utilized a large industrial-scale SJM, where the sizes of the classifier and nozzle exhibit considerable variation. To mesh effectively, the hex-core mesh method of unstructured meshing was employed. Figure 4 shows the mesh and boundary conditions of SJM in numerical simulations. Tetrahedral mesh overlays were specifically applied to the boundaries of the SJM, while ortho-hexahedral mesh filled the remaining areas. Within the SJM, the flow field near the nozzle and classifier undergoes significant variations. The flow near the nozzle experiences supersonic conditions, resulting in notable changes in pressure, density, and temperature. Conversely, the flow near the classifier is characterized by a strong cyclonic state. Given these distinctive characteristics, the mesh was refined in these regions to accurately capture the intricate flow details surrounding the nozzle and classifier. This meshing strategy was crucial in capturing the complex flow dynamics within the SJM, particularly in regions where flow behavior undergoes drastic changes. In conclusion, the total number of meshes utilized in the study amounts to approximately 9.37 million.
The power gas employed in SJM is superheated steam, and the physical property parameters undergo remarkable variations during high-velocity flow. Consequently, corresponding numerical models are utilized to delineate the density, specific heat, viscosity, and heat transfer coefficient of superheated steam in this paper, primarily aimed at addressing the alteration of water vapor physical property parameters throughout compressible flow. The specific settings are presented in Table 3.
During the simulation, a pressure inlet boundary condition is applied to the nozzle inlet, with a total pressure of 1.0 MPa and a temperature of 260 °C, and a pressure outlet boundary condition is set at the outlet, with a static pressure of −3 kPa; the classifier rotation velocity was set to 360 rpm.

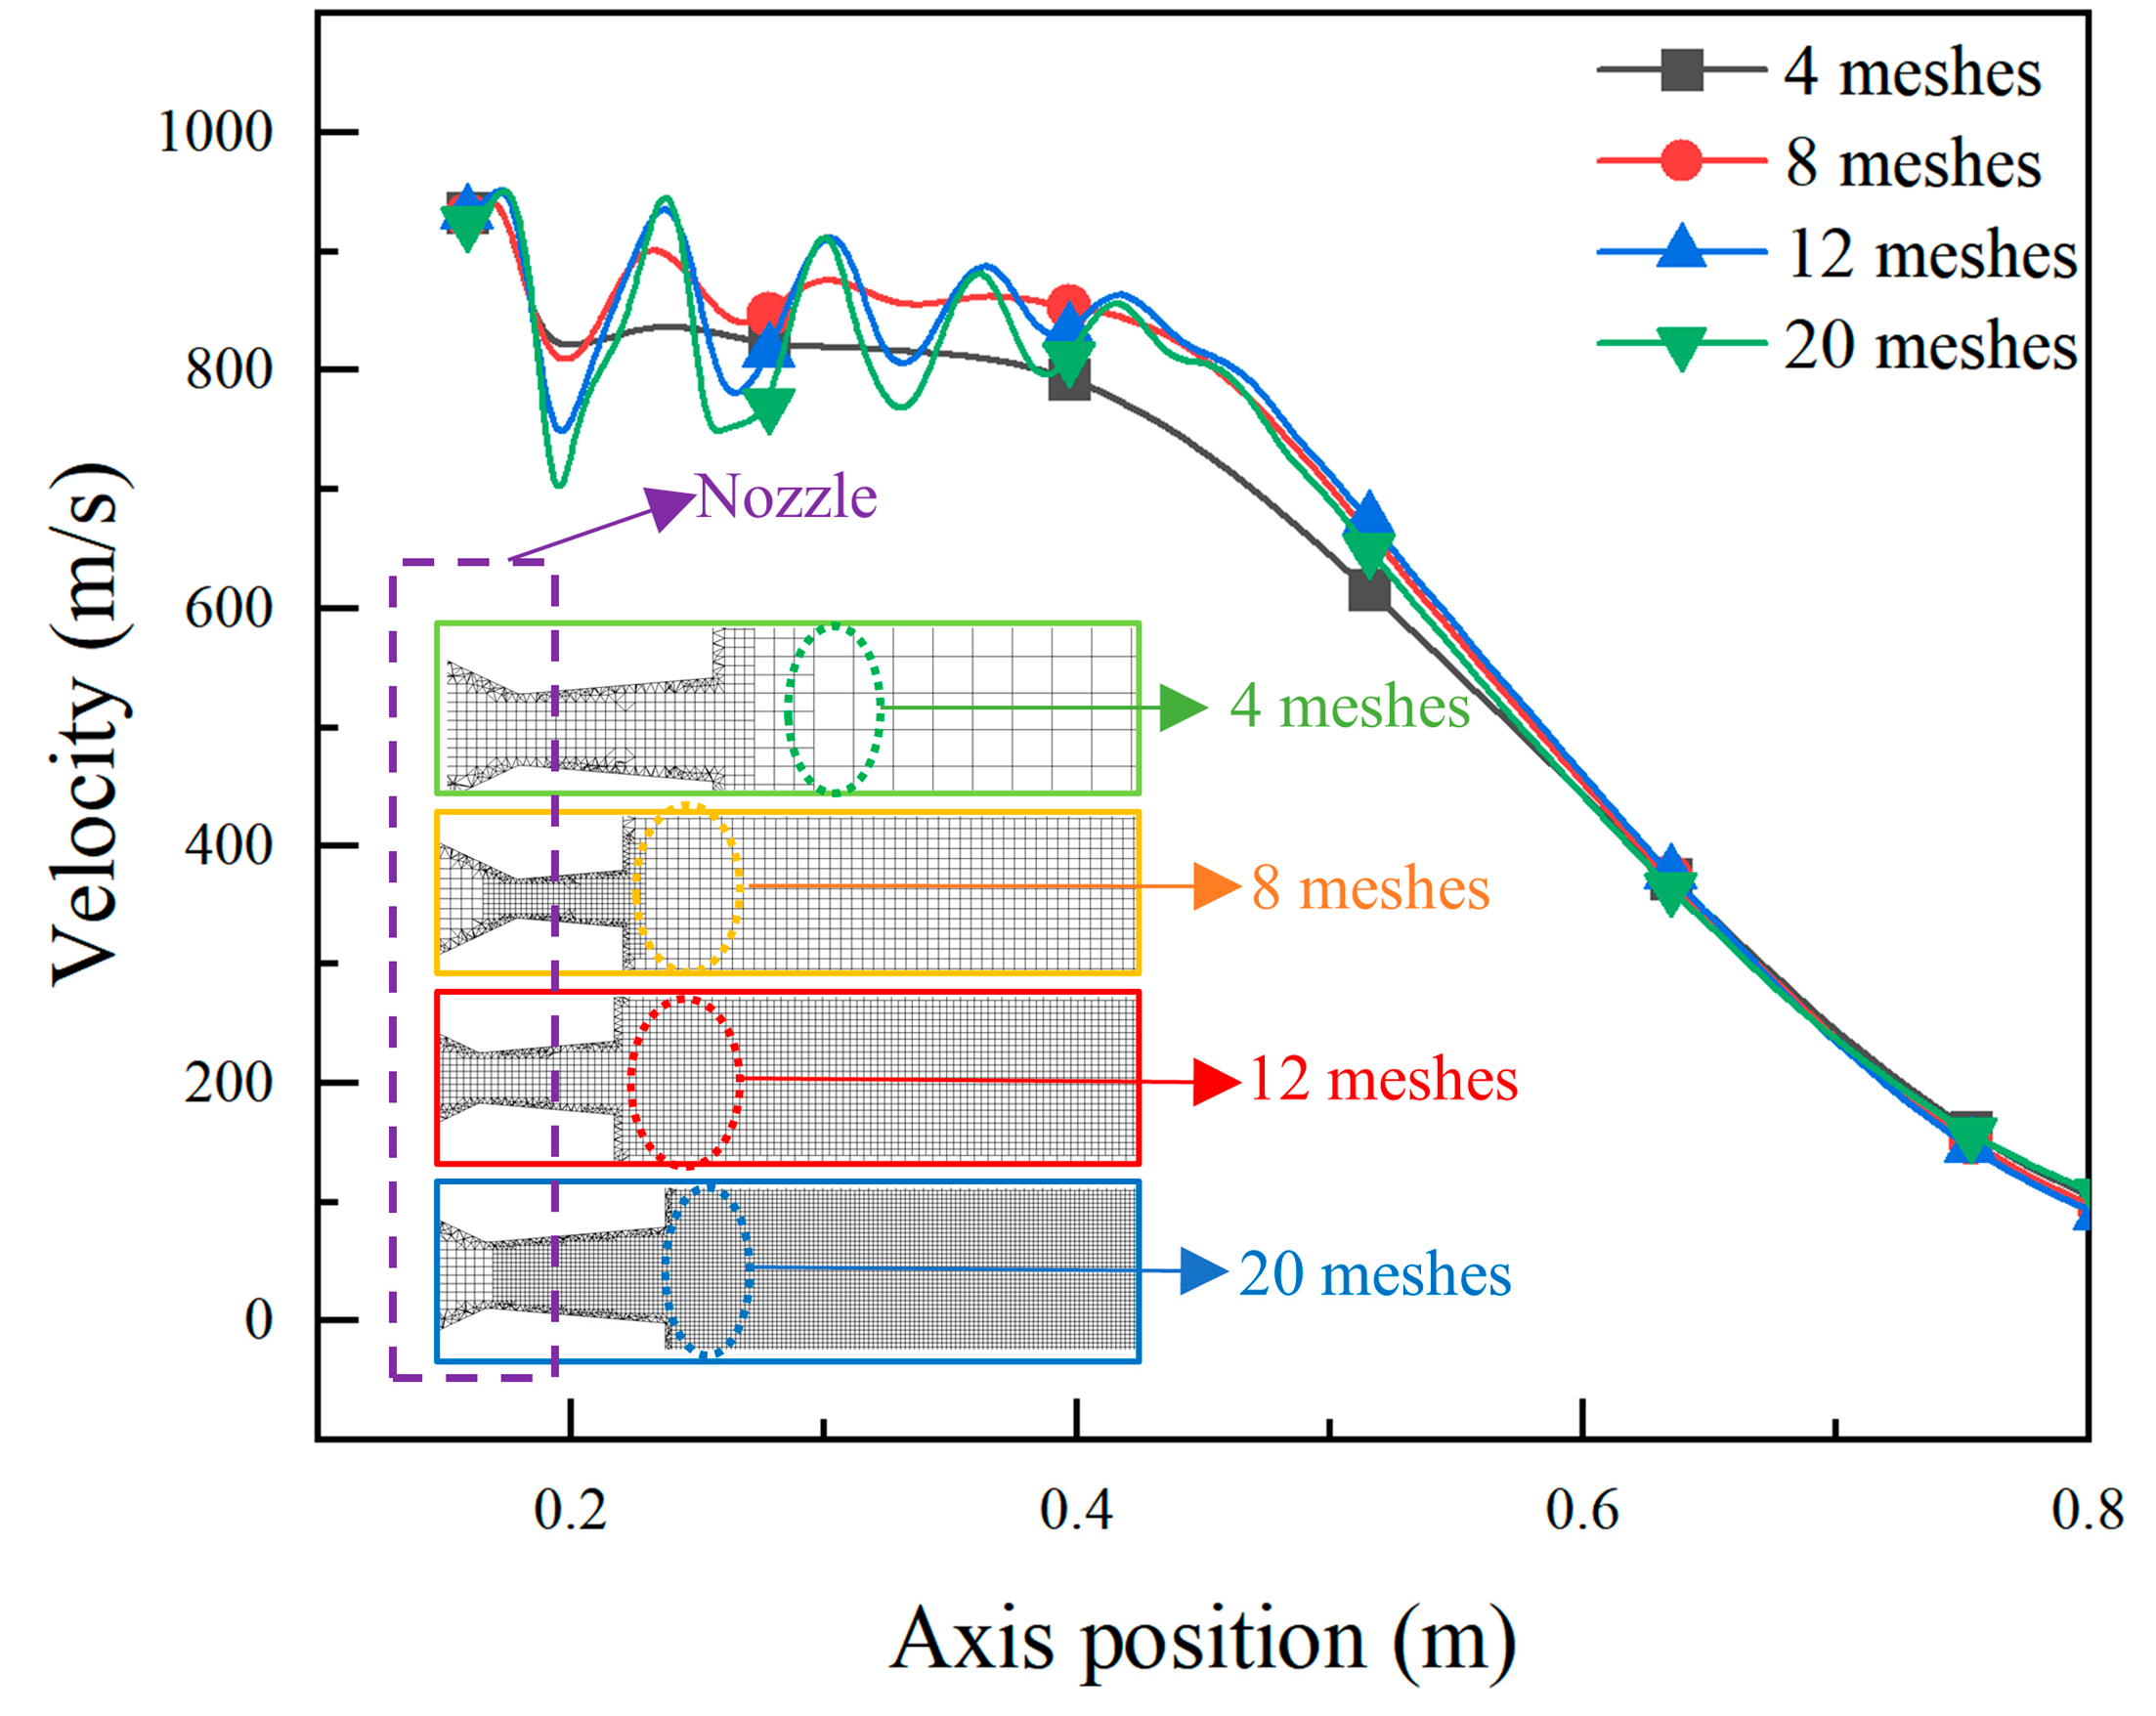
2.4.3. Mesh Independence Verification and Calculation Method

The number of meshes usually affects the accuracy of the numerical simulation results. Therefore, before meshing, we verified the mesh independence of the supersonic flow near the nozzle to identify the relationship between the number of meshes and the accuracy. Figure 5 shows the velocity distribution on the nozzle exit center axis for different mesh numbers. From the Figure 5, it can be seen that as the number of meshes filled in the nozzle outlet increases, the more consistent the trend in the velocity change is, and the distribution of the steam velocity on the axis is basically the same when the mesh is 12 versus 20. Therefore, to take into account the efficiency of the calculation and the accuracy of the results, this paper uses 12 meshes to fill the nozzle outlet, and the specific mesh division is shown in Figure 4.
After mesh-independence validation, a simulation of SJMs was performed using Fluent 19.0 code. To ensure accuracy, pressure, density, turbulence, and energy flux terms are all discretized using a second-order updraft scheme.

3. Results and Discussion

3.1. Numerical Simulation Results

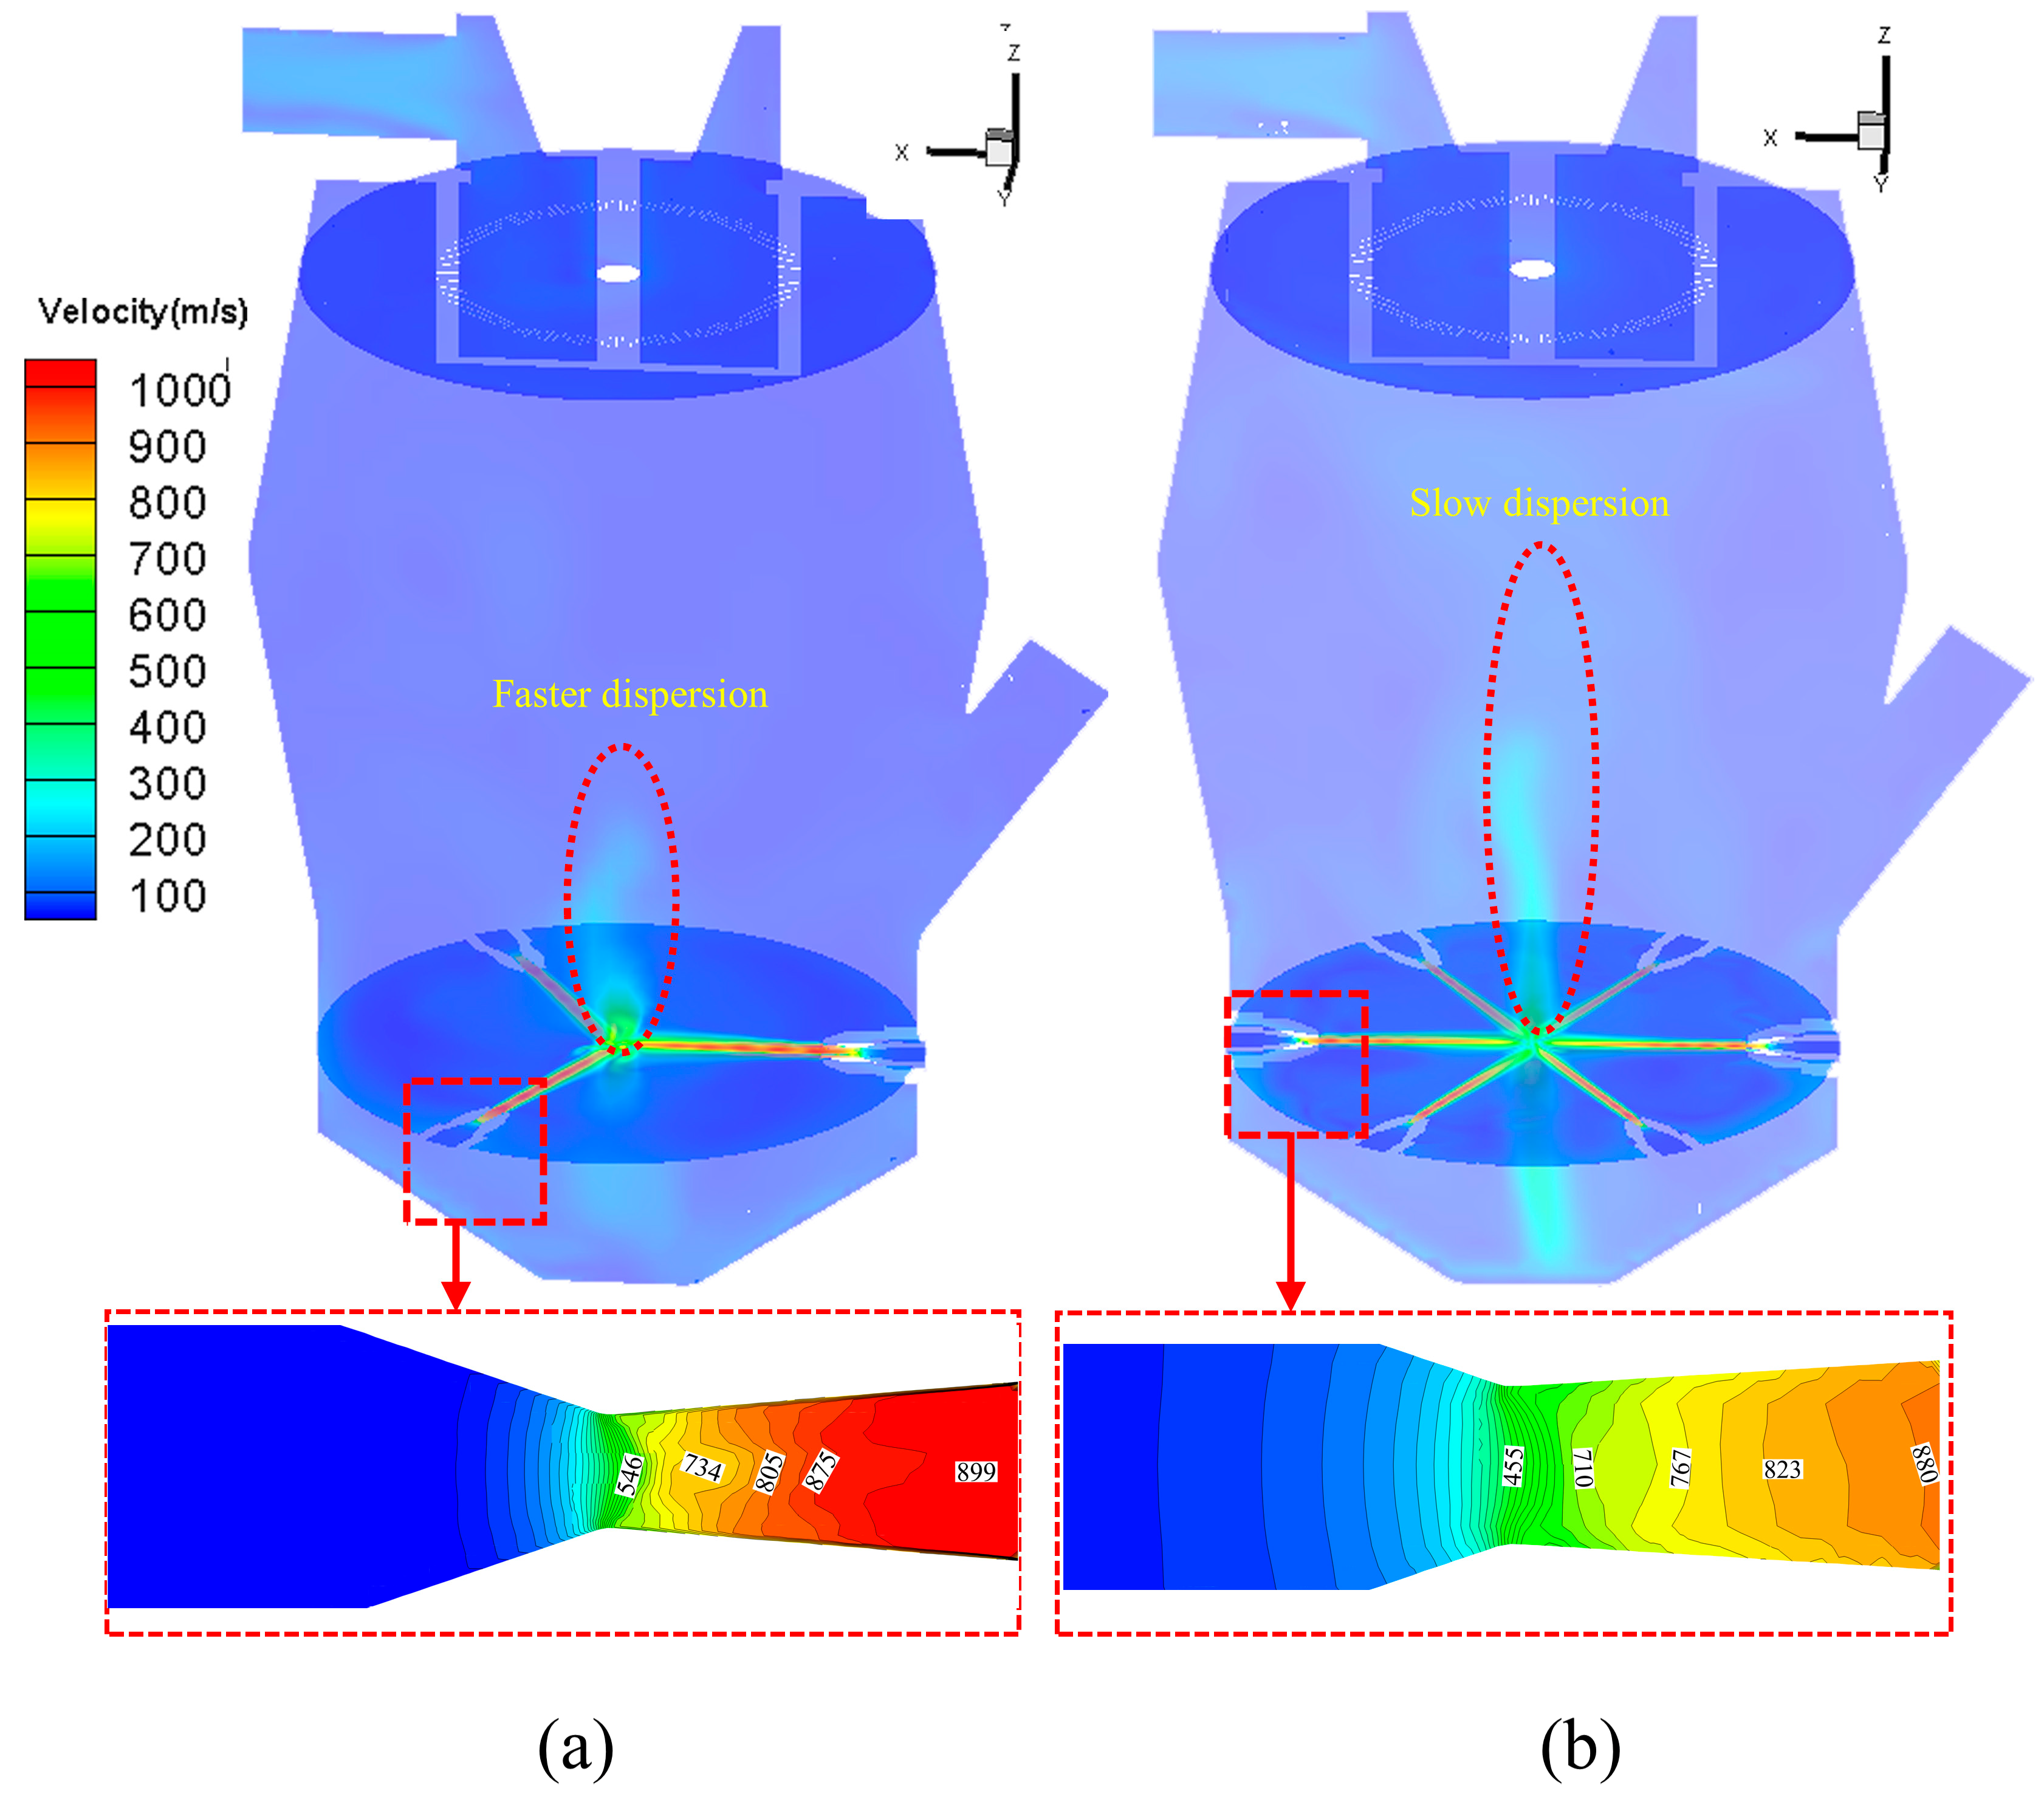
3.1.1. Flow Field Analysis of SJMs

During the grinding process, particles acquire the kinetic energy required for grinding from the air stream, with flow field characteristics exerting a significant influence on comminution efficiency [28]. However, an increase in the number of nozzles not only induces changes within the grinding area but may also affect the conveying and classification areas. Hence, this study utilizes computational fluid dynamics (CFD) to simulate the flow field characteristics of the SJMs operating at a mass flow rate of 10 Tons/hour under configurations with three and six nozzles. The analysis aims to examine the flow field attributes within the grinding, conveying, and classification areas, thereby assessing the advantages and disadvantages of N3 and N6 in terms of their grinding performance from the fluid dynamic perspective.
Figure 6 illustrates the velocity distribution within the interiors of N3 and N6 SJMs. Once the steam traverses through the Laval nozzles in N3 and N6, it shapes a supersonic jet with peak nozzle exit velocities attaining 967 and 889 m/s respectively, as depicted in the rectangular box in Figure 6. The disparity in velocity is ascribed to the nozzle parameters. In line with the data in Table 2, the ratio of the nozzle outlet to the throat diameter of N3 is greater than that of N6, and it possesses a higher Mach number; therefore, N3 displays a higher velocity at the nozzle outlet. The high-velocity steam flowing out of the nozzle will converge and collide at the center of the crushing chamber, giving rise to two air streams, one along the direction of gravity and the other opposed to the direction of gravity. The former facilitates the fluidization of fly ash, while the latter provides propulsion for its entry into the classification area. Within the conveying area, the deceleration of the upward flow in N3 is more pronounced than in N6, which produces a faster dispersion of the flow (as shown by the elliptical box in Figure 6a), resulting in a shorter travelling distance of the flow before it diffuses into the grinding chamber. When using six nozzles, the supersonic jet carries a greater volume of steam to the point of air stream collision, resulting in a more concentrated post-collision airflow with slower dispersion (as shown by the elliptical circle in Figure 6b). Consequently, in consideration of the velocity distributions of N3 and N6 alone, the air flow within the conveying area of N6 is more concentrated and exhibits weaker dispersion, potentially leading to a higher concentration and velocity of fly ash entering the classification area. At the bottom of the SJMs, the air stream produced by N6 exacerbates particle fluidization, increasing the concentration of particles around the supersonic jet and thereby reducing the average kinetic energy obtained by the particles and lowering the grinding efficiency.

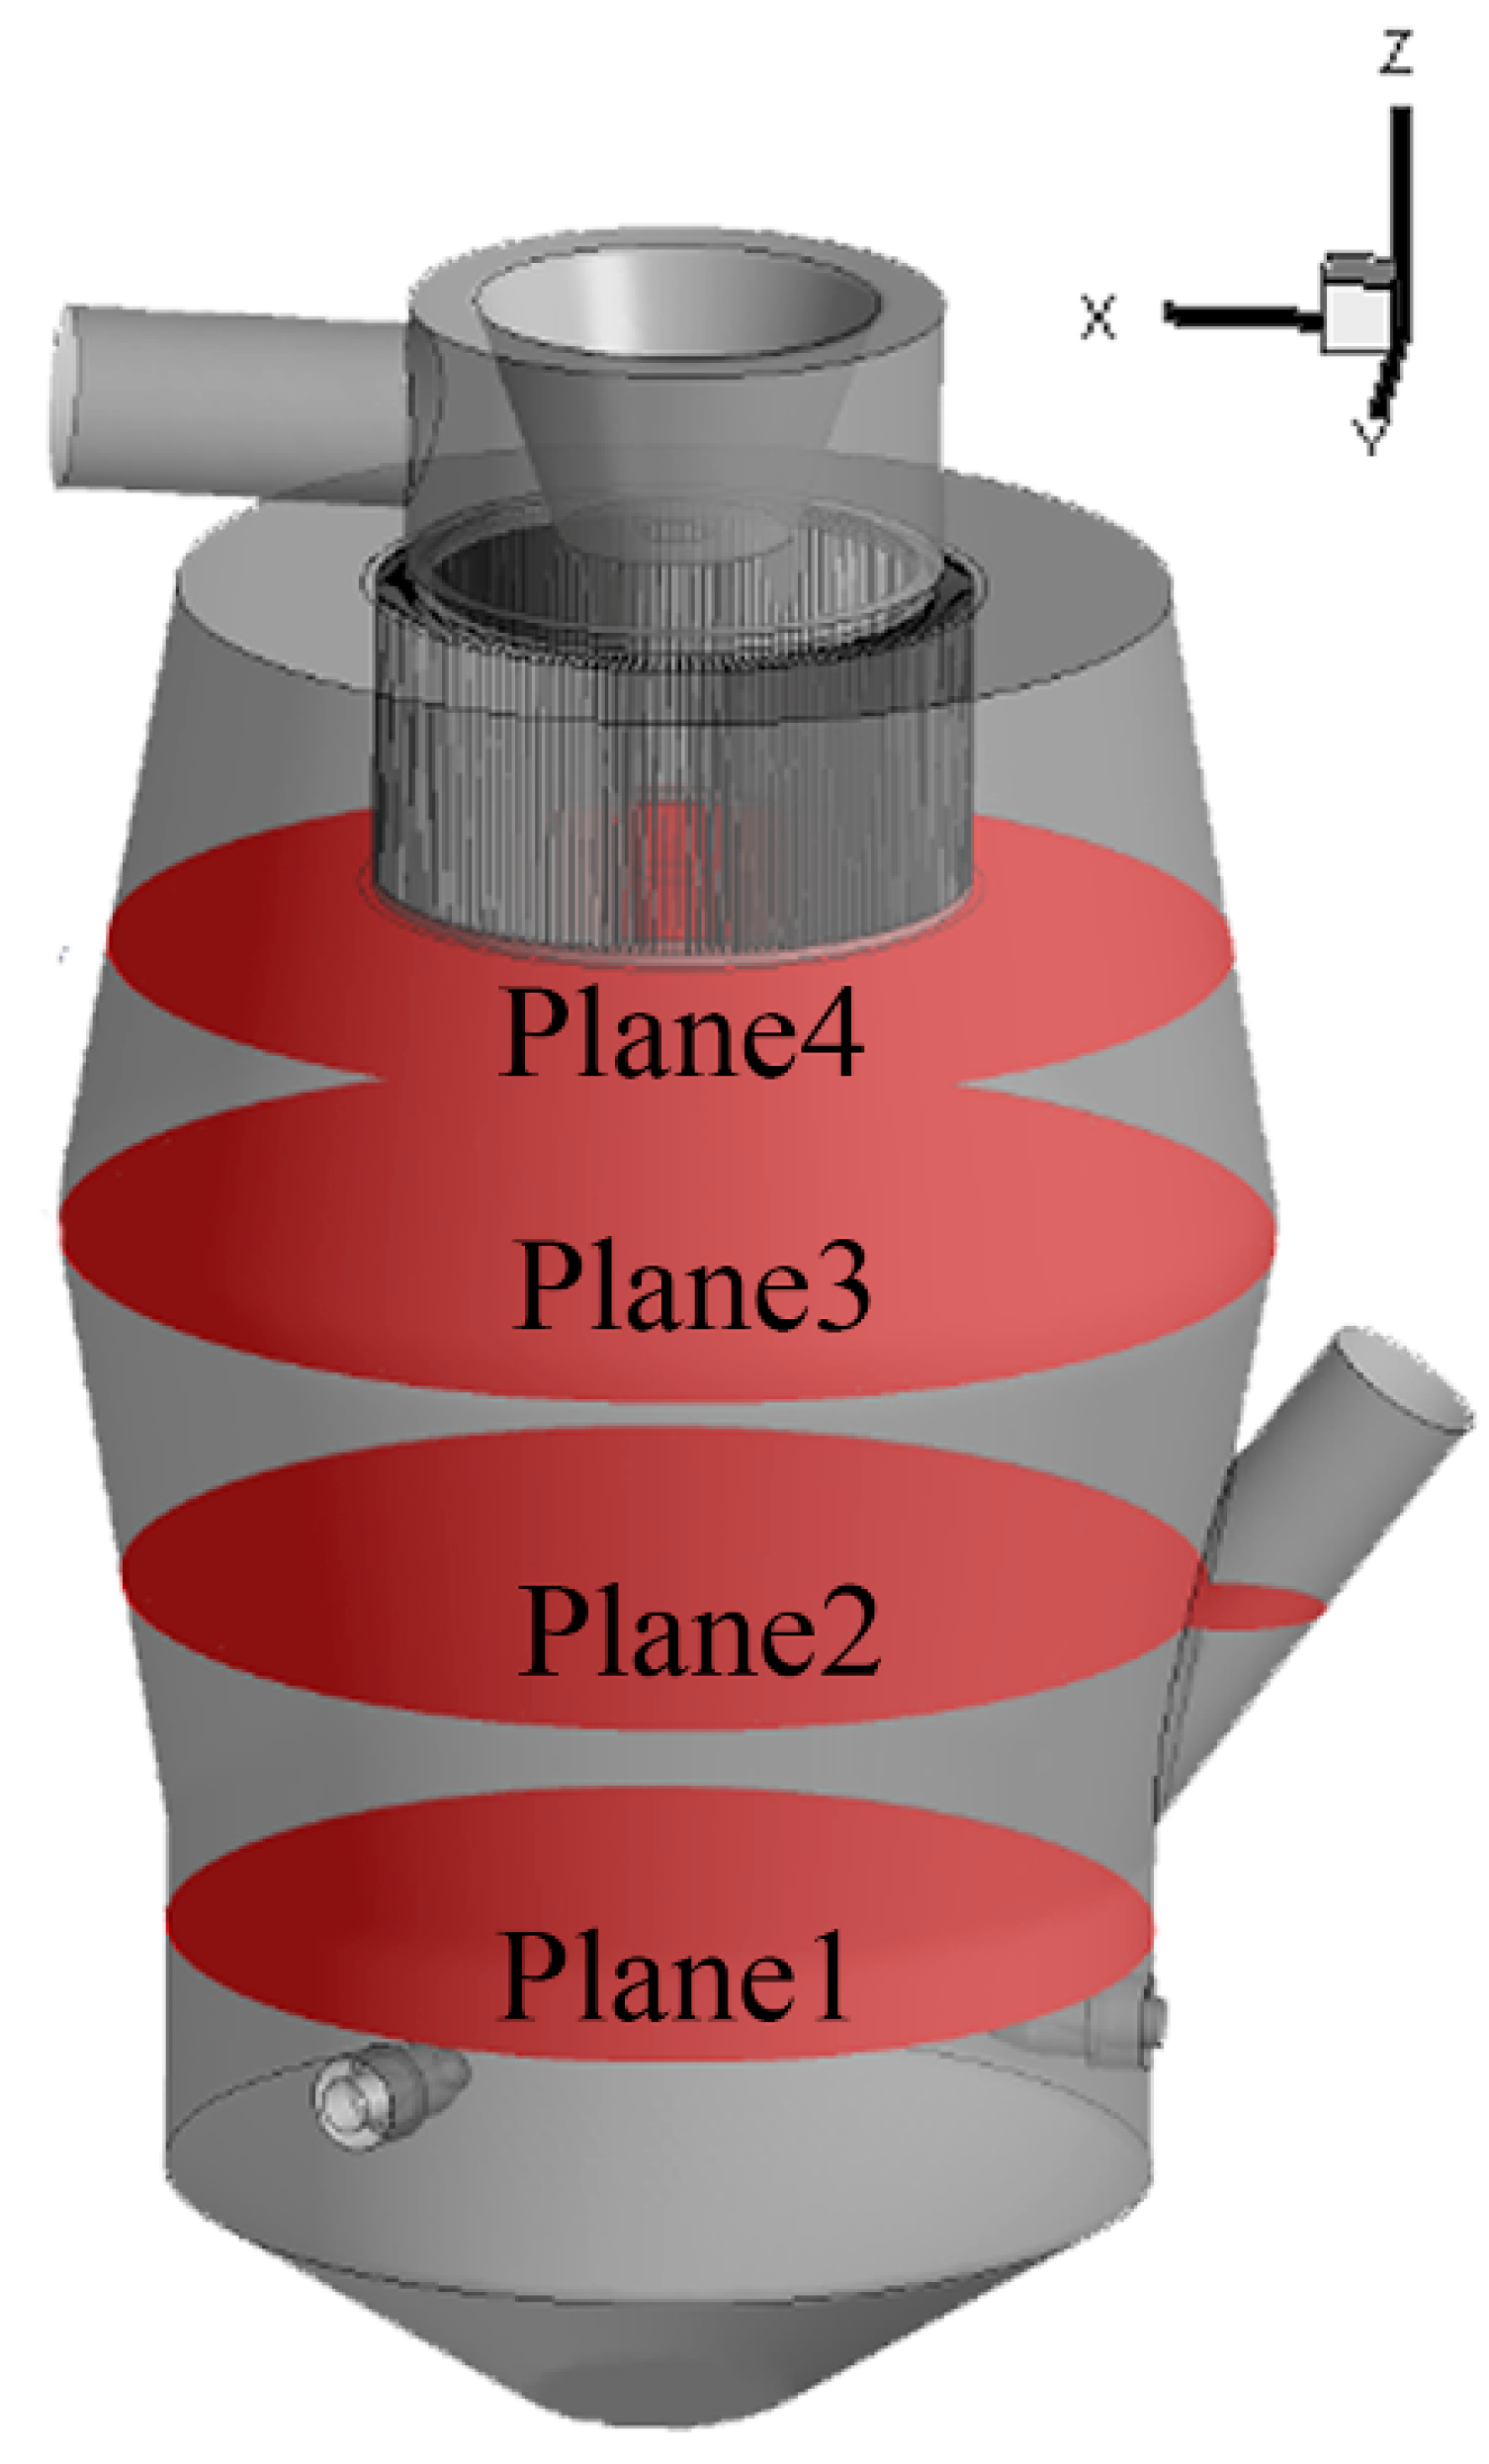
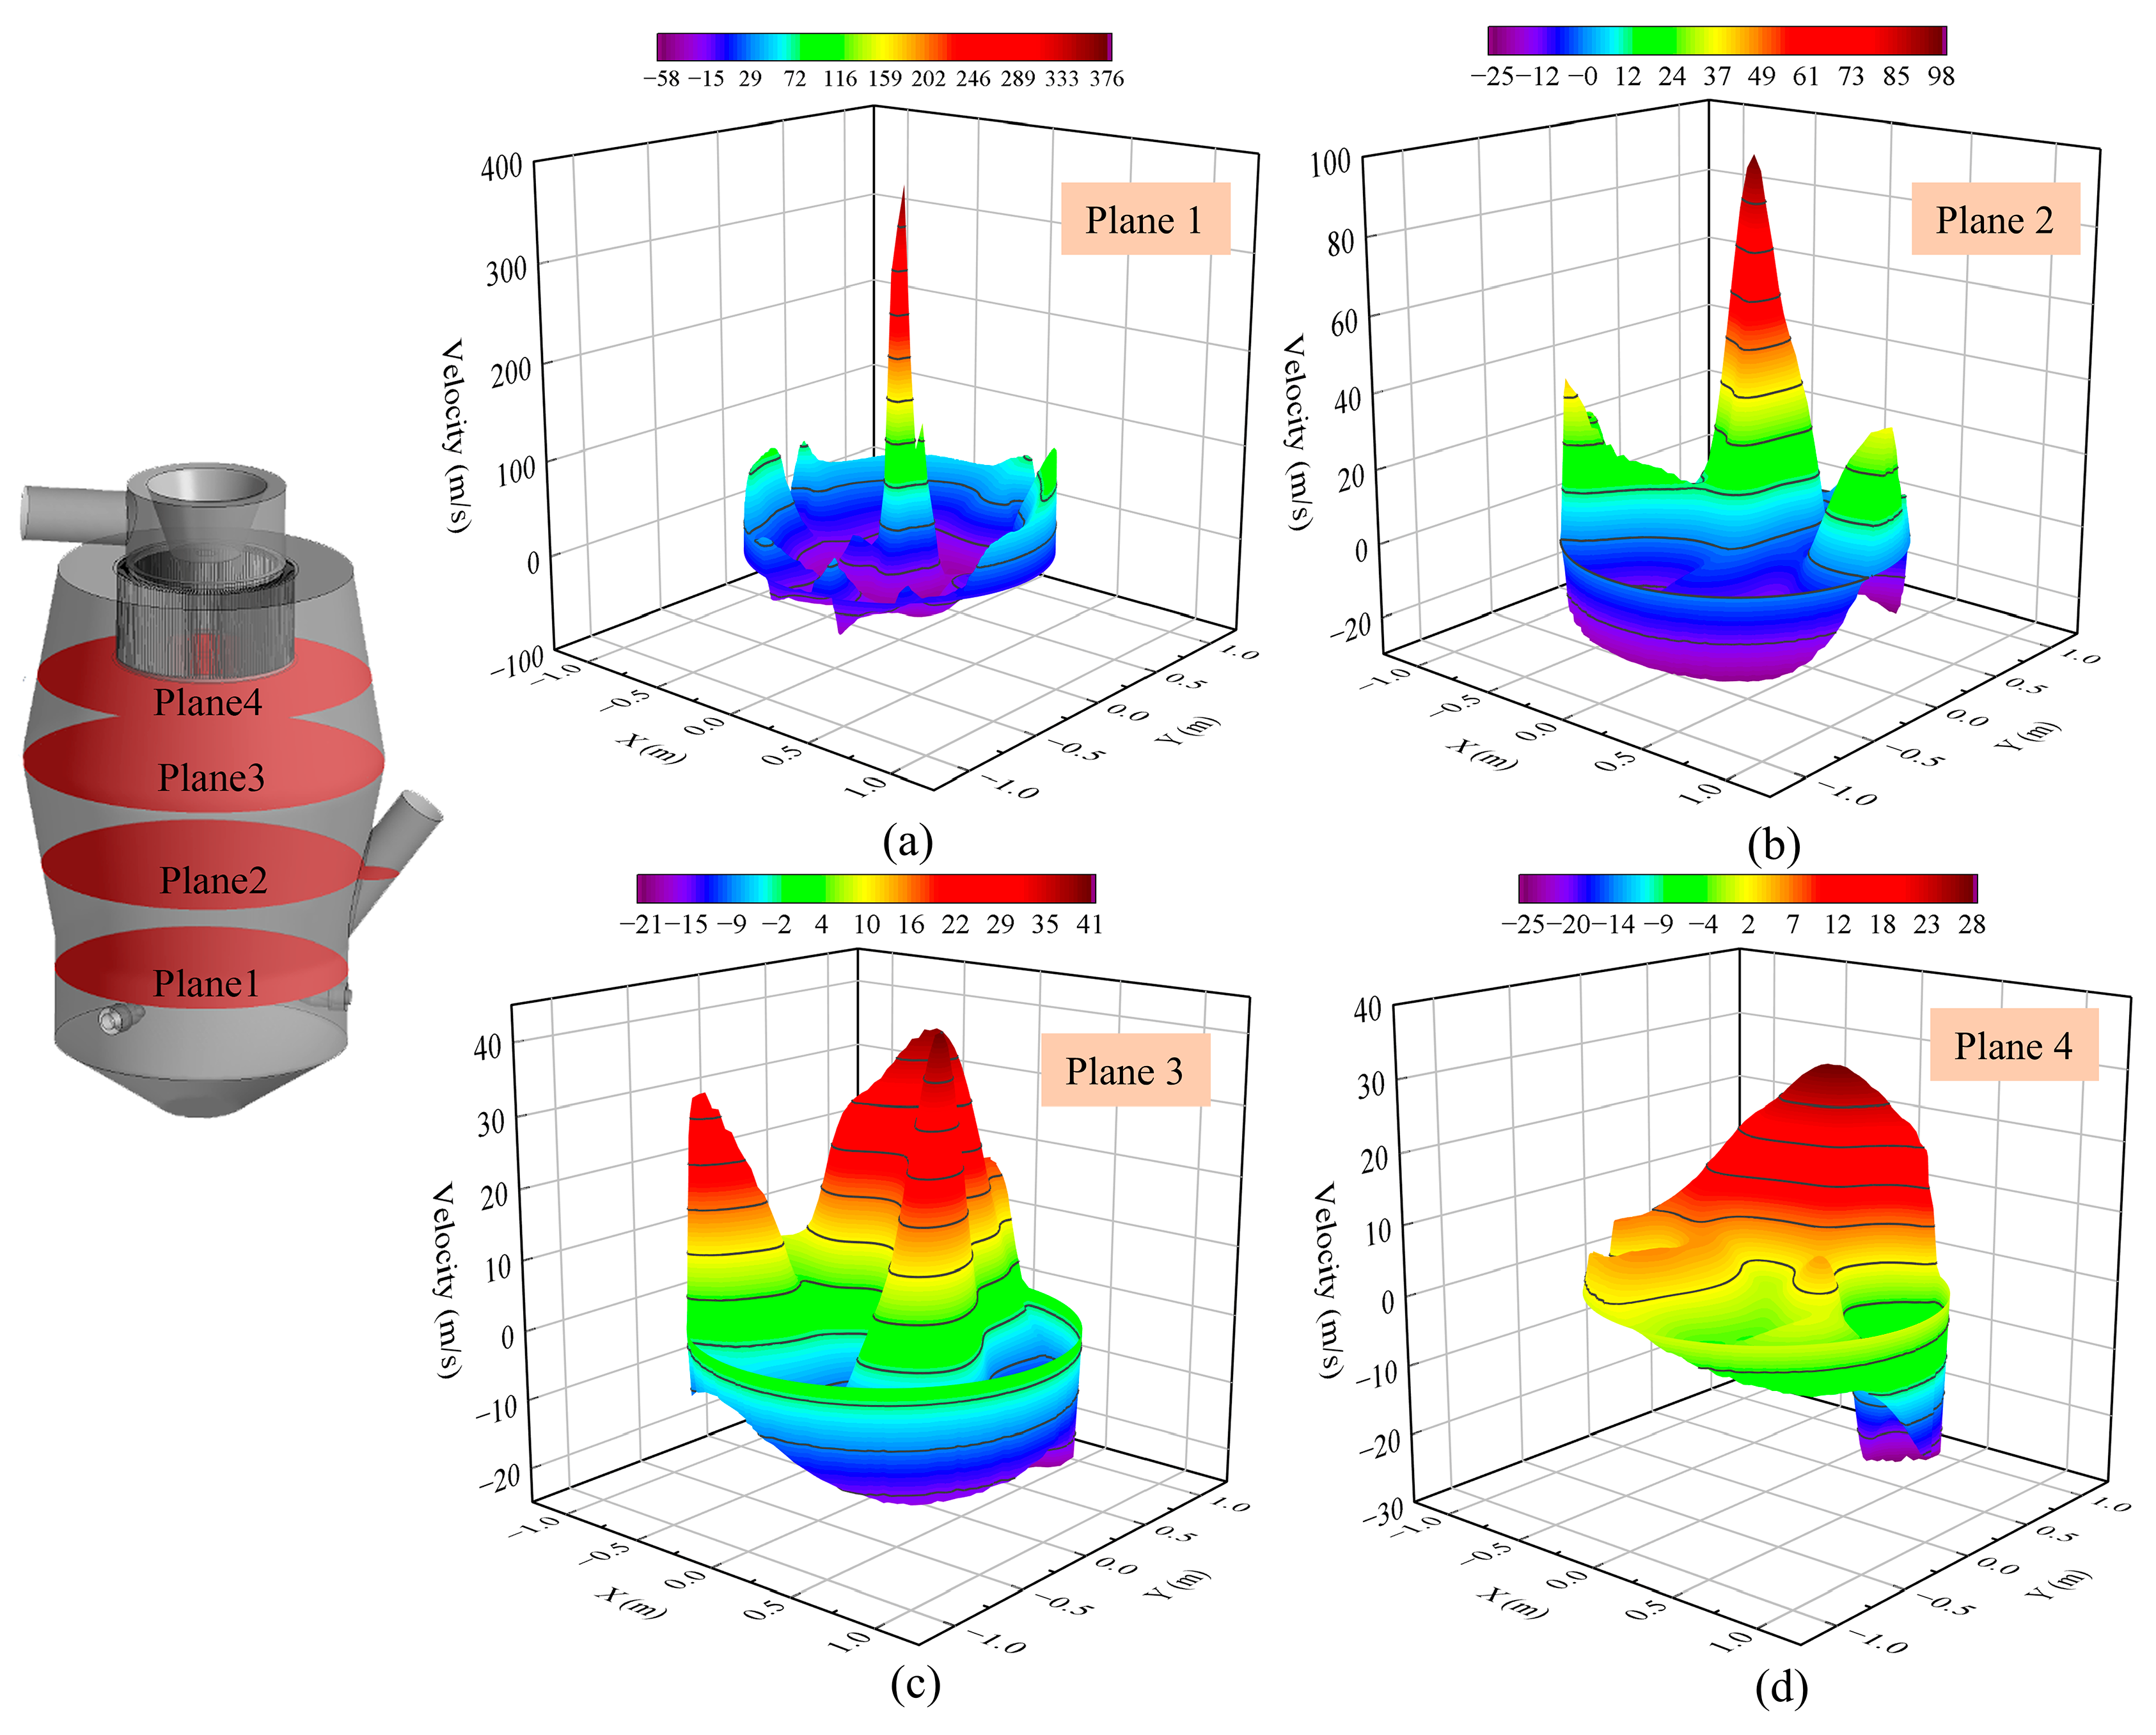
3.1.2. Effect of Nozzle Quantity on the Ascending Velocity in the Conveying Area

In SJMs, the ascending velocity is responsible for driving the particles to the classifier, and in this paper, the ascending velocity is the component of the velocity in the z-axis direction. The uniformity and magnitude of the ascending gas flow velocity within the conveying area directly affect the particle concentration and velocity in the vicinity of the classifier, significantly influencing the classification accuracy [29]. To discuss the distribution of ascending airflow velocities within the conveying areas of N3 and N6 SJMs, four planes (P1–P4) are selected within the conveying areas, as depicted in Figure 7. Planes P1, P2, P3, and P4 are located at distances of 200, 729, 1312, and 1829 mm, respectively, from the center of the nozzle exit, with Plane P4 positioned 100 mm below the base of the classifier wheel.
Figure 8 and Figure 9 present the distribution of ascending airflow velocities on different height planes within the conveying areas of N3 and N6, respectively. Positive values of the ascending velocity indicate upward flow, while negative values indicate downward flow. The results show that in all four planes, the steam velocity distribution exhibits a central peak surrounded by lower values, with higher velocity observed closer to the nozzle exit and a decline in the central ascending velocity as the plane approaches the classifier bottom. This attenuation is attributed to the dispersion-induced decay of the airflow velocity. Near the wall at any given height plane, the ascending velocity is negative, indicating airflow toward the nozzle direction. Thus, the flow of steam within the conveying area is a dynamic process characterized by upward and downward flows, conducive to the cyclical movement of particles. Although the patterns of ascending velocity distribution are similar for N3 and N6 at corresponding height planes, N6 consistently exhibits higher values numerically. N6 entrains a greater volume of air, causing steam accumulation in the central region and an increase in local velocity. However, excessive ascending velocity in the central region of N6’s conveying area can lead to higher and uneven particle concentrations around the classifier, thereby increasing its load and compromising the classification efficiency. Therefore, if multiple nozzles are employed, consideration must be given to the amount of air entrained by each nozzle, as well as the potential benefits of increasing the height of the conveying area to achieve uniform and slow airflow entering the classifier.

3.1.3. Effect of Nozzle Quantity on the Flow Field in the Grinding Area

The grinding area, serving as the primary region for particle acceleration and fragmentation, experiences flow field changes that directly influence the pulverization effectiveness of SJMs [30]. The grinding area is the region containing the nozzle, which is filled with high-velocity flowing steam. In order to compare the velocity characteristics of the grinding areas of N3 and N6, the velocity of the steam in Plane 1-1″ in Figure 4 was extracted and analyzed. Figure 10 presents the velocity and streamline distributions in the central plane of the nozzles for N3 and N6 SJMs. The results indicate that within the grinding area, with the Mach number of the nozzles being unchanged and only the individual nozzle flowrate modified, the maximum steam velocities achieved by the two nozzle configurations differ negligibly and exhibit similar velocity distributions, with virtually no velocity decay prior to the convergence at the center of the airflow. From a streamline perspective, the N3 configuration shows a more organized flow pattern compared to N6 due to the higher steam injection in N6, the closer spacing of nozzles, and increased mutual interference between air streams. The dotted red circle marked in Figure 10 illustrates that N3 exhibits five vortices, while N6 displays seven. Excessive vortices can lead to particle agglomeration in the flow field, which is detrimental to particle acceleration. Therefore, while N3 and N6 may not differ significantly in velocity distribution, it is apparent that from a streamline viewpoint, N3 outperforms N6.
To efficiently analyze the ejection capabilities of N3 and N6 nozzles, the mass flow rates of steam entrained by the supersonic jets formed by each type of nozzle are extracted from the simulation results, as presented in Table 4. The results indicate that the steam flow carried by a single nozzle in N3 is 0.663 kg/s, which is 0.296 kg/s higher than that in N6. The total steam entrainment of six nozzles in N6 is 2.204 kg/s, representing a 16.06% increase compared with the three nozzles in N3, thus explaining the observation in Section 3.1.1 and Section 3.1.2 of a higher and more concentrated ascending airflow velocity following collision in N6. Although a greater steam entrainment can carry a larger number of particles into the supersonic jet region for acceleration, it also increases the load on the supersonic jet. Such an increase potentially leads to insufficient kinetic energy per particle to achieve fracture in a single collision, necessitating multiple collisions for effective comminution.
As the SJM pulverizes fly ash, particles acquire kinetic energy from high-velocity steam. The velocity obtained by the particles directly correlates with their collision strength with other particles, ultimately enhancing the pulverization process. To compare the particle acceleration behavior between N3 and N6, the Discrete Phase Model (DPM) in Fluent software is employed to analyze particle velocity. During the analysis, the particles have a density of 2400 kg/m3 and are released from the nozzle outlet.
Figure 11 depicts the axial velocity at the single-nozzle exit and the velocity distribution of particles with varying diameters for N3 and N6. The variation patterns of the axial velocity at the single-nozzle exit for N3 and N6 are fundamentally similar, with fluctuations in the core region of the jet attributed to shock waves generated by pressure mismatch at the nozzle exit. Likewise, the velocity variations experienced by the particles follow a comparable trend, with a distinction that particles of equal diameter attain different maximum velocity at the axis; in N3, particles of equal diameter reach a higher velocity (50 m/s higher than those in N6). Although the dimensionless distance from the nozzle exit to the center of the grinding chamber is identical, the throat diameter of N3 is larger, resulting in a longer actual acceleration path for the particles and consequently higher velocities. The assumption of particles being released from the center of the nozzle exit deviates from reality, but it still holds some value in analyzing the acceleration characteristics of particles.

3.1.4. Effect of Nozzle Quantity on the Flow Field in the Classification Area

The performance of the flow field within the classification area significantly influences the precision and efficiency of SJMs [31]. A stable and uniform velocity is a prerequisite for efficient classification, but an increase in the number of nozzles leads to an augmented total ejection volume, potentially resulting in overly rapid and unevenly distributed ascending velocities within the conveying area, which may affect the flow field surrounding the classifier and impair its performance.
To analyze the flow field characteristics within the grading area, the vapor velocity and streamline distributions in the 1-1″ plane depicted in Figure 4 were extracted. Figure 12 presents the velocity cloud map and streamline diagram on a midplane of the classifier. The results show that N3 develops a more pronounced vortex, rotating around the classifier; by contrast, in N6, small vortices that form near the wall interfere with the motion of the vortical flow around the classifier (as shown by the circles in Figure 12b). Such interference causes particles to accumulate within these vortices and leads to locally elevated particle concentrations and reduced classification efficiency.
Figure 13 presents streamline diagrams of the airflow around the classifier in the cross sections of the N3 and N6 SJMs. The exact location of the cross section is shown in Figure 13a. In the case of N3, the flow lines entering the classifier are more orderly, with no vortices forming in the vicinity of the classifier blades, which is the uniform gas flow phenomenon shown by the red circle in Figure 13a. Under these conditions, particles following the airflow exhibit a more uniform distribution of concentration and velocity. Conversely, when the number of nozzles is increased to six, numerous vortices emerge near the classifier blades, as highlighted by the red circles in Figure 13b, which results in a disordered gas flow. These vortices lead to a decrease in airflow uniformity, trapping particles within the vortices, which is detrimental to the classification process. Consequently, in the case of N6, the classification area flow field contains a greater number of vortices than that in N3, resulting in decreased uniformity and ultimately a lower classification efficiency for the classifier.

3.2. Experimental Result

3.2.1. Effect of Nozzle Quantity on Fly Ash Grinding Production and Energy Consumption

Based on the analysis of numerical simulation results in Section 3.1.1, Section 3.1.2, Section 3.1.3 and Section 3.1.4, N3 exhibits superior flow field distributions in the grinding, conveying, and classification areas compared with N6, suggesting that N3 possesses stronger pulverization capabilities than N6. To validate the accuracy of these numerical findings, comparative experiments are conducted on an industrial-scale SJM for ultrafine grinding of fly ash using N3 and N6 configurations. During the experiments, identical feed particle size distributions are used for the fly ash, with d50 = 28.29 μm and d90 = 77.85 μm, and the target particle sizes after grinding are set to d50 = 10–12 μm and d90 = 45 μm. To quantify the relationship between steam consumption and fly ash production, the energy consumption rate η is defined as
η = Mg/Ms
where η stands for the energy consumption rate; Mg represents the total steam consumption, measured in units of t; and Ms indicates the total fly ash production, expressed in units of ton.
To validate the accuracy of the numerical findings mentioned above, experiments were conducted under identical conditions, with the inlet total pressure set at 1.0 MPa, the temperature at 260 °C, and the outlet pressure at −3 kPa. Table 5 presents the experimental results of pulverizing fly ash using N3 and N6 at a classifier velocity of 360 rpm. N3 and N6 produce fly ash with particle size distributions of d50 = 10–12 μm and d90 = 45 μm. The difference lies in the fact that N6 consumes 0.59 t of steam per ton of finished powder, whereas N3 requires only 0.36 t of steam per ton. Although N6 has a 3.5% higher hourly steam consumption rate than N3, its hourly production rate decreases by 14.7%. Consequently, N3 demonstrates not only superior flow field performance to N6 but also higher actual fly ash production with lower steam consumption. These findings substantiate the feasibility of evaluating the pulverization performance of SJMs on the basis of their flow field characteristics.

3.2.2. Influence of Feed Particle Size on Grinding Efficiency

In steam jet milling, feed particle size can influence grinding efficiency. Section 3.1.3 reveals that, given a longer actual acceleration distance in N3, particles of the same size attain higher velocities compared with those in N6. However, in Section 3.2.1, the coarser feed particle size of fly ash leads to lower velocities being achieved by N6 when accelerating larger particles, weakening the intensity of collisions and potentially reducing grinding efficiency. Consequently, to determine the grinding efficiency of different-particle-size fly ashes in N3 and N6, experiments are conducted using raw ash (with d90 ≤ 77 μm) and Grade 1 fly ash (with d90 ≤ 45 μm) separately to produce ultrafine fly ash (with d90 ≤ 10 μm), thereby establishing the relationship between energy consumption and output. In the experiment, the classifier velocity was changed to 760 rpm, and the other conditions were unchanged.
Figure 14 presents the energy consumption rates and production capacity for preparing d90 ≤ 10 μm ultrafine fly ash using N3 and N6 to pulverize raw ash (d90 ≤ 77 μm) and Grade 1 fly ash (d90 ≤ 45 μm). Figure 14a shows that when the feed particle size is d90 ≤ 77 μm, the energy consumption rate of N3 is 6.0% lower than that of N6, while the output of fly ash is 9.8% higher. For a feed particle size of d90 ≤ 45 μm (Figure 14b), the energy consumption rate of N3 is 8.1% lower than that of N6, and the output is 13.7% higher. Under the same feed particle size, the disparity in fly ash production and energy consumption rates is relatively minor. Comparison of different particle sizes at the same nozzle count shows that a smaller feed particle size leads to decreased energy consumption and increased production, indicating that reducing the feed particle size can enhance the grinding efficiency of the SJM, consistent with conclusions drawn in the literature [32]. Although the numerical differences in energy consumption rates and production capacity between N3 and N6 for producing ultrafine fly ash are less pronounced than those in the experiments in Section 3.2.1, generally, N3 exhibits a lower energy consumption rate and a higher production rate. The difference becomes more apparent when the feed particle size is reduced. During the preparation of d90 ≤ 10 μm fly ash, an increase in classifier velocity raises the gas–solid concentration within the SJM, reducing the average kinetic energy acquired by particles. When the feed particle size is small, three nozzles can provide a larger particle velocity, the single collision kinetic energy of particles is greater than that with six nozzles, and the grinding effect is better. Consequently, the flow field advantage of N3 becomes less evident. Particles must be repeatedly conveyed to the grinding area for collisions, with the fragmentation of particles being more reliant on the number of collisions rather than the intensity of a single collision. Therefore, N3 and N6 can be employed to obtain ultrafine fly ash, but N3 outperforms N6 in terms of the energy consumption rate and production capacity.

4. Conclusions

To analyze the effect of the number of nozzles on the grinding efficiency of fly ash, the flow field of N3 and N6 was evaluated by CFD simulation in this study, and an experiment involving grinding fly ash with different numbers of nozzles was carried out for the first time on a large industrial SJM. The following main conclusions are drawn.
The numerical results show that, in terms of flow field performance, N3 outperforms N6 in the grinding, conveying, and classification areas. The grinding area provides higher particle collision velocities, the conveying area has more uniform and gentle airflow velocity, and the classification area shows a pronounced vortex movement with uniform air intake.
The experimental results show that, compared with N6, N3 shows significantly higher efficiency in producing fly ash with d90 ≤ 45 μm, consuming 3.5% less steam per hour and achieving a 14.7% higher production rate.
For the preparation of ultrafine fly ash with d90 ≤ 10 μm, the energy consumption rate and production capacity of N3 are better than those of N6 with d90 ≤ 45 μm and d90 ≤ 77 μm feed particle sizes, and which increase with the decrease in feed particle size.
When grinding fly ash using a large-scale SJM, reducing the number of nozzles can enhance the equipment performance and grinding efficiency.
In the design of large fluidized bed jet mills, due to the differing numbers of nozzles used at the same flow rates, significant fluctuations in the flow field distribution occur within the grinding chamber, which has a noticeable effect on the grinding efficiency. Especially with different product particle size requirements, carefully matching the ratio between the nozzle number and the flow rate can significantly increase grinding efficiency and save energy. This study, which focuses on steam jet milling of fly ash, serves as a reference and will facilitate future studies of large-scale fluidized bed jet mills.

Author Contributions

S.H.: carried out the experiment, analyzed the data, and wrote the manuscript; H.L. and Z.W.: research and investigation, methods, draft revision; Y.Z. and X.Y.: error checking; M.Z., H.C. and H.W.: experimental conjecture verification, method. All authors have read and agreed to the published version of the manuscript.

Funding

The authors gratefully acknowledge the financial support provided by the Natural Science Foundation of China (52204286).

Data Availability Statement

The original contributions presented in the study are included in the article, further inquiries can be directed to the corresponding author.

Conflicts of Interest

The authors declare no conflict of interest.

References

  1. Yang, H.; Huang, Q.; Xu, Y.; Xiang, R.; Liu, Y. Release potential, neglected leakage and reduction countermeasures of COD and Ammonia in MSWLs. Sci. Total Environ. 2024, 926, 171894. [Google Scholar] [CrossRef] [PubMed]
  2. Xu, F.; Xiao, J.; Ye, S.; Liu, W.; Yang, M.; Yao, Z.; Zhong, Q. Closed-loop cleaning treatment system—Resource recovery of coal gangue, Energy Sources. Part A Recover. Util. Environ. Eff. 2024, 46, 5236–5253. [Google Scholar]
  3. Yang, J.; Chen, C.; Chen, S.; Ren, Y.; Lu, J. Resource utilization of drinking water treatment aluminum sludge in green cementing materials: Hydration characteristics and hydration kinetics. J. Environ. Sci. 2024, 144, 236–248. [Google Scholar] [CrossRef] [PubMed]
  4. Luo, Y.; Wu, Y.; Ma, S.; Zheng, S.; Zhang, Y.; Chu, P.K. Utilization of coal fly ash in China: A mini-review on challenges and future directions. Environ. Sci. Pollut. Res. 2021, 28, 18727–18740. [Google Scholar] [CrossRef] [PubMed]
  5. Xing, L.; Li, X.; Cao, P.; Luo, J.; Jiang, H. Stepwise extraction and utilization of silica and alumina from coal fly ash by mild hydrothermal process. Process Saf. Environ. Prot. 2024, 182, 918–929. [Google Scholar] [CrossRef]
  6. Li, G.; Li, M.; Zhang, X.; Cao, P.; Jiang, H.; Luo, J.; Jiang, T. Hydrothermal synthesis of zeolites-calcium silicate hydrate composite from coal fly ash with co-activation of Ca(OH)2-NaOH for aqueous heavy metals removal. Int. J. Min. Sci. Technol. 2022, 32, 563–573. [Google Scholar] [CrossRef]
  7. Upadhyay, S.K.; Edrisi, S.A. Developing sustainable measures to restore fly-ash contaminated lands: Current challenges and future prospects. Land Degrad. Dev. 2021, 32, 4817–4831. [Google Scholar] [CrossRef]
  8. Jiang, X.; Lang, L.; Liu, S.; Mu, F.; Wang, Y.; Zhang, Z.; Han, L.; Duan, S.; Wang, P.; Li, J. Stabilization of iron ore tailing with low-carbon lime/carbide slag-activated ground granulated blast-furnace slag and coal fly ash. Constr. Build. Mater. 2024, 413, 134946. [Google Scholar] [CrossRef]
  9. Zhang, L.; Wang, Q.; Song, R.; Liu, C.; Chen, Y.; Zhao, H.C.; Lu, X. Preparation and Application of Slag-Based Catalyst for Steelmaking. Steel Res. Int. 2024, 95, 2300755. [Google Scholar] [CrossRef]
  10. He, H.; Yang, B.; Wu, D.; Gao, X.; Fei, X. Applications of crushing and grinding-based treatments for typical metal-containing solid wastes: Detoxification and resource recovery potentials. Environ. Pollut. 2022, 314, 120034. [Google Scholar] [CrossRef]
  11. Rodríguez-Torres, I.; Tuzcu, E.T.; Reyes, I.A.; Rosales, G. A quantitative study between HPGR and cone crusher aided ball mill grinding: Mathematical modeling by evaluating the possible microfracture effect produced by HPGR technology and cone crusher. Physicochem. Probl. Miner. Process. 2023, 60, 177620. [Google Scholar] [CrossRef]
  12. Zhang, M.; Chen, H. Steam jet mill—A prospective solution to industrial exhaust steam and solid waste. Environ. Sci. Pollut. Res. 2018, 25, 17842–17854. [Google Scholar] [CrossRef] [PubMed]
  13. Xu, Z.; Hu, D.; An, R.; Lin, L.; Xiang, Y.; Han, L.; Yu, Y.; Ning, L.; Wu, J. Preparation of superfine and semi-hydrated flue gas desulfurization gypsum powder by a superheated steam powdered jet mill and its application to produce cement pastes. Case Stud. Constr. Mater. 2022, 17, e01549. [Google Scholar] [CrossRef]
  14. Lu, J.; Fu, Y.; Yu, H.; Wang, H.; Wang, Z.; Chen, H. Effect of relative humidity on the desulfurization performance of calcium-based desulfurizer. J. Environ. Sci. 2024, 138, 179–188. [Google Scholar] [CrossRef] [PubMed]
  15. Zhang, Q.; Huang, D.; Zhang, X.; Lin, L.; Wang, Z.; Tang, W.; Qiang, X. Improving the properties of metakaolin/fly ash composite geopolymers with ultrafine fly ash ground by steam-jet mill. Constr. Build. Mater. 2023, 387, 131673. [Google Scholar] [CrossRef]
  16. Wang, Z.; Li, H.; Chen, H.; Lv, J.; Leng, H.; Xiao, J.; Wang, S. Effects of grinding and dehydration on kaolin in a steam jet mill. CLAY Miner. 2021, 56, 75–84. [Google Scholar] [CrossRef]
  17. Juan, L.; Yu, F.; Lihua, H.; Deliang, T.; Haiyan, C.; Belzile, N.; Yuwei, C. Preparation of a new high-performance calcium-based desulfurizer using a steam jet mill. J. Hazard. Mater. 2020, 389, 121914. [Google Scholar] [CrossRef] [PubMed]
  18. Rao, Z.; Kou, F.; Wang, Q.; Lei, X.; Zhao, J.; Ming, J. Effect of superfine grinding chestnut powder on the structural and physicochemical properties of wheat dough. Int. J. Biol. Macromol. 2024, 259, 129257. [Google Scholar] [CrossRef] [PubMed]
  19. Xu, P.W.; Yuan, X.F.; Zhao, B. Jet milling improves the polyphenol dissolution profile and biological activities of the hemp seed shell. Food Biosci. 2024, 57, 103497. [Google Scholar] [CrossRef]
  20. Bortun, A.; Bortun, M.; Brown, B.; Madynski, J. Effect of High-Energy Milling on Ceria-Zirconia’s Redox Properties. Catalysts 2023, 13, 1511. [Google Scholar] [CrossRef]
  21. Wang, Y.; Peng, F. Parameter effects on dry fine pulverization of alumina particles in a fluidized bed opposed jet mill. Powder Technol. 2011, 214, 269–277. [Google Scholar] [CrossRef]
  22. Santos, D.A.D.; Baluni, S.; Bück, A. Eulerian Multiphase Simulation of the Particle Dynamics in a Fluidized Bed Opposed Gas Jet Mill. Processes 2020, 8, 1621. [Google Scholar] [CrossRef]
  23. Koeninger, B.; Spoetter, C.; Romeis, S.; Weber, A.P.; Wirth, K.E. Classifier performance during dynamic fine grinding in fluidized bed opposed jet mills. Adv. Powder Technol. 2019, 30, 1678–1686. [Google Scholar] [CrossRef]
  24. Otwinowski, H. Modeling the multi-stage classification in a fluidized bed jet mill. Part. Sci. Technol. 2014, 32, 399–403. [Google Scholar] [CrossRef]
  25. Luczak, B.; Müller, R.; Kessel, C.; Ulbricht, M.; Schultz, H.J. Visualization of flow conditions inside spiral jet mills with different nozzle numbers—Analysis of unloaded and loaded mills and correlation with grinding performance. Powder Technol. 2019, 342, 108–117. [Google Scholar] [CrossRef]
  26. Scott, L.; Borissova, A.; Burns, A.; Ghadiri, M. Effect of grinding nozzles pressure on particle and fluid flow patterns in a spiral jet mill. Powder Technol. 2021, 394, 439–447. [Google Scholar] [CrossRef]
  27. Chen, C.; Liu, Y.; Tang, J.; Zhang, H. Effect of nozzle pressure ratios on the flow and distribution of abrasive particles in abrasive air jet machining. Powder Technol. 2022, 397, 117114. [Google Scholar] [CrossRef]
  28. Chen, J.; Li, X.; Lu, Y.; Lin, L.; Wang, J.; Huang, S.; Yan, C.; Zhang, M.; Chen, H. Particle size controllable jet milling technology for efficiently recycling titanium-bearing blast furnace slag: Numerical simulation and industrial test. J. Clean. Prod. 2020, 247, 119144. [Google Scholar] [CrossRef]
  29. Lee, H.W.; Song, S.; Kim, H.T. Improvement of pulverization efficiency for micro-sized particles grinding by uncooled high-temperature air jet mill using a computational simulation. Chem. Eng. Sci. 2019, 207, 1140–1147. [Google Scholar] [CrossRef]
  30. Zhao, Q.Q.; Schurr, G. Effect of motive gases on fine grinding in a fluid energy mill. Powder Technol. 2002, 122, 129–135. [Google Scholar] [CrossRef]
  31. Sun, Z.; Liang, L.; Liu, C.; Zhu, Y.; Zhang, L.; Yang, G. CFD simulation and performance optimization of a new horizontal turbo air classifier. Adv. Powder Technol. 2021, 32, 977–986. [Google Scholar] [CrossRef]
  32. Zbronski, D. Analysis of the influence of selected parameters process on the performance of fluidized bed opposed jet mill. Part III. Comminution mechanism of grains. Gospod. Surowcami Miner. 2008, 24, 19–25. [Google Scholar]
Figure 1. Fly ash pulverization and collection system for an SJM.
Processes 12 01500 g001
Figure 2. Diagrams of the SJM structures: (a) N3, (b) N6.
Processes 12 01500 g002
Figure 3. Nozzle design parameters.
Processes 12 01500 g003
Figure 4. Mesh and boundary conditions: (a) SJM mesh, (b) Classifier centre plane mesh, (c) Nozzle centre plane mesh.
Processes 12 01500 g004
Figure 5. Velocity distribution in axial direction with different numbers of meshes.
Processes 12 01500 g005
Figure 6. Internal velocity distribution within the SJMs: (a) N3, (b) N6.
Processes 12 01500 g006
Figure 7. Velocity monitoring planes in the conveying area.
Processes 12 01500 g007
Figure 8. Ascending velocity at various monitoring planes within the conveying area of N3: (a) Plane1, (b) Plane2, (c) Plane3, (d) Plane4.
Processes 12 01500 g008
Figure 9. Ascending velocity at various monitoring planes within the conveying area of N6: (a) Plane 1, (b) Plane 2, (c) Plane 3, (d) Plane 4.
Processes 12 01500 g009
Figure 10. Velocity and streamlines on a plane within the grinding area of SJMs: (a) N3, (b) N6.
Processes 12 01500 g010
Figure 11. Axial flow velocity distribution of the flow and particles: (a) N3, (b) N6.
Processes 12 01500 g011
Figure 12. Streamlines on the midplane of the classifier: (a) N3, (b) N6.
Processes 12 01500 g012
Figure 13. Streamline distribution on a cross-sectional plane of the classification area: (a) A-A″ plane (b) N3, (c) N6.
Processes 12 01500 g013
Figure 14. Capacity and energy consumption rates of N3 and N6, (a) Feed particle size d90 ≤ 77 μm, (b) Feed particle size d90 ≤ 45 μm.
Processes 12 01500 g014
Table 1. Parameters for the nozzles.
Parameters for the NozzlesNozzle of N3Nozzle of N6
dl (mm)9090
L (mm)241241
L1 (mm)92103
ɸ (·)3737
ɑ (·)97
h (mm)22
dc (mm)27.519.5
de (mm)43.526
Mass flow rate (kg/s)0.860.43
Table 2. Experimental parameters for the SJMs.
Parameters for the SJMsN3N6
Steam pressure (MPa)11
Nozzle throat diameter (mm)27.518
Nozzle exit (mm)3425
Steam temperature (°C)260260
Outlet pressure (kPa)−3−3
Classifier velocity (rpm)360(760)360(760)
Steam mass flow rate (tons/h)1010
Table 3. Parameter settings for superheated steam.
Parameters for the SteamModel Description or Constant
Density (kg/m3)Ideal gas
Piecewise-polynomial
Kinetic-theory
Sutherland
18.01534
Specific heat (J/(kg·K))
Thermal conductivity (w/(m·k))
Viscosity (kg/(m·s))
Molecular weight (kg/kmol)
Table 4. Nozzle entrainment rates of N3 and N6.
Type of SJMNozzle QuantitySingle-Nozzle Entrainment Rate (kg/s)Total Entrainment Amount (kg/s)
N330.6631.899
N660.3672.204
Table 5. Grinding experimental results for SJMs.
Type of SJMd90
(μm)
Capacity
(Tons/h)
Steam Consumption (ton)Energy Consumption Rate
N64525.55325.580.59
N329.96226.120.36
Disclaimer/Publisher’s Note: The statements, opinions and data contained in all publications are solely those of the individual author(s) and contributor(s) and not of MDPI and/or the editor(s). MDPI and/or the editor(s) disclaim responsibility for any injury to people or property resulting from any ideas, methods, instructions or products referred to in the content.

