Article

Economic Optimization of Thermal Insulation Thickness for Insulated and Electrically Traced Pipelines in Drilling Applications

1
School of Resource Engineering, Heilongjiang University of Technology, Jixi 158100, China
2
School of Architecture and Civil Engineering, Northeast Petroleum University, Daqing 163318, China
*
Author to whom correspondence should be addressed.
Processes 2024, 12(7), 1506; https://doi.org/10.3390/pr12071506
Submission received: 14 June 2024 / Revised: 2 July 2024 / Accepted: 11 July 2024 / Published: 17 July 2024
(This article belongs to the Topic Energy Extraction and Processing Science)

Abstract

:
This study presents an economic optimization model for determining the optimal insulation thickness for both thermal insulation and electric tracing pipelines. Using Life-Cycle Cost (LCC) analysis, optimization research was conducted under various working conditions to identify the most cost-effective insulation thickness. Factors such as pipe diameter, operational duration, drilling fluid temperature, and heat cost were analyzed to assess their impact on the economic thickness of the insulation layer, specifically within the unique environment of drilling sites. The results provide the economic thickness and total cost for both insulated and electrically traced pipelines under different scenarios. For instance, for a DN100 pipe with rock wool insulation operating for 3600 h, the economic thickness of the electrically traced pipe insulation was determined to be 5.18 cm greater per unit length compared to the non-electrically traced pipe, resulting in an additional cost of 19.36 CNY/m. These findings offer valuable insights for optimizing pipeline insulation in drilling applications.

1. Introduction

Surface pipelines are crucial components in the drilling process. Insulating these pipelines reduces heat loss, ensures the circulation of drilling fluid during winter, and extends operational shutdown times [1]. By 2022, the annual consumption of thermal insulation materials in the petroleum and petrochemical industries accounted for approximately 25% of the total consumption in China [2]. Effective insulation design reduces heat loss, improves energy utilization, and enhances economic benefits [3,4]. Various thermal insulation materials are available, including soft insulation materials (e.g., glass wool, rock wool) and hard insulation materials (e.g., calcium silicate) [5,6]. Soft materials are preferred due to their low thermal conductivity, cost-effectiveness, and ease of application [7]. Compared with rigid insulation materials, the thermal conductivity of rock wool and glass wool (at room temperature, calcium silicate is about 0.05 W/m·K and rock wool and glass wool are about 0.04 W/m·K) is low; they have a low price and fewer heat leakage problems; and they are light-weight, soft, easy to cut in construction, and widely used in pipeline thermal insulation [8]. Optimizing pipeline insulation design using thermodynamic simulations and empirical formulas can significantly reduce heat loss, save energy, and improve economic efficiency [9,10]. Several studies have explored the performance of these materials under different conditions. To provide a clearer overview, we have categorized these studies based on their focus and presented the comparative findings in Table 1.
In order to ensure the transportation safety of oil products in winter (temperature range is −2–22 °C, humidity range is 60–81%), electric tracing belts are widely used in pipeline insulation [17]. An electric tracing zone is a device that converts electrical energy into heat energy to compensate for heat loss, keeps the medium temperature (maintained at 80 °C) within the working temperature range (−40–150 °C), and ensures the safe operation of the system [18]. Electric tracing belts can solve the problem of oilfield heat preservation and anti-freezing, thereby ensuring stability and safety in the production process. Electric tracing belts have the characteristics of high thermal efficiency and energy saving; at the same time, the installation and construction of electric accompanying heat tape is relatively simple, and it can be transformed and upgraded on the basis of not changing the original pipeline [19].
According to the working principle, electric tracing zones can be categorized into constant-power electric tracing zones and self-limiting-temperature electric tracing zones. Constant-power electric tracing maintains a consistent power output regardless of temperature changes. It is further divided into two subcategories: (1) The series electric tracing zone, in which configuration the heating cables are connected in series, means that the current flows through each segment of the cable sequentially, providing uniform heat distribution along the length of the pipeline. (2) In the parallel electric tracing zone, the heating cables are connected in parallel. Each segment of the cable operates independently, allowing for localized heating adjustments. Self-limiting-temperature electric tracing adjusts its power output based on the temperature of the surrounding environment. As the temperature increases, the power output decreases, preventing overheating and conserving energy [20]. Wang et al. [21] established a temperature field calculation model for electric tracing in wellbores and oil pipelines. They optimized the length and intensity of the tracing zone to ensure efficient heat distribution. The study’s methodology involved creating a numerical simulation to analyze temperature profiles along the pipeline, and the results showed that optimizing the tracing zone length and intensity significantly improved thermal efficiency and reduced energy consumption. Li et al. [22] proposed using a combination of insulation materials and heating cables to prevent water pipes from freezing. The methodology included a comparative analysis of different heating methods. The results demonstrated that this combined method could save approximately CNY 5 million compared to steam heating, highlighting the cost-effectiveness and energy efficiency of the approach. Ma et al. [23] used the design of electric tracing for a coastal oil depot as a case study. They calculated the heat loss of the pipeline and designed the appropriate length, type, and voltage level of the electric tracing system. The methodology involved detailed thermal calculations and simulations to determine the optimal design parameters. The results indicated that the properly designed electric tracing system effectively minimized heat loss and ensured operational reliability. Luo et al. [24] introduced the principles of electric tracing belt design and analyzed the rationality of self-limiting electric tracing pipe schemes based on engineering examples. The methodology included both theoretical analysis and practical engineering applications. The results showed that self-limiting electric tracing pipes were highly effective in preventing overheating and conserving energy, proving their practicality in various industrial applications. Yu et al. [25] developed a prediction formula for the average fluid temperature under normal transmission and shut-down conditions of long submarine transmission heat tracing pipelines. The methodology involved extensive data collection and statistical analysis to derive the formula. The results provided a reliable tool for predicting temperature variations in submarine pipelines, ensuring efficient thermal management during both operational and non-operational periods.
There are several methods for calculating the thickness of pipe insulation: (1) The economic thickness method finds the insulation thickness that minimizes the total cost over the pipeline’s lifecycle, including installation, energy savings, and maintenance costs. (2) The maximum allowable heat loss method determines the insulation thickness needed to keep heat loss below a specified limit, ensuring the pipeline maintains the desired temperature. (3) The thermal conductivity method selects insulation materials based on their ability to conduct heat. Using materials with low thermal conductivity allows for effective insulation with thinner layers. (4) The empirical formula method uses formulas based on experimental data to estimate insulation thickness, considering factors like ambient temperature, pipe diameter, fluid temperature, and wind speed [26]. Ai [27] developed a model for calculating the optimal insulation thickness for square pipes. This model considered factors like surface heat loss, outer surface temperature, and the temperature drop of the fluid inside the pipe. These findings showed that optimizing these factors helps minimize energy loss and maintain the desired fluid temperature, leading to significant energy savings. Guo et al. [28] used the allowable temperature drop method to find the best insulation thickness. They aimed to keep the temperature drop of the fluid within acceptable limits. The results showed that setting a specific allowable temperature drop allowed for the calculation of the necessary insulation thickness to maintain the fluid temperature along the pipeline. Li et al. [29] focused on the outer surface temperature to determine insulation thickness. Their research indicated that controlling the outer surface temperature minimizes heat loss and ensures safety. They found that optimizing insulation thickness can achieve better energy efficiency and safety standards. Luo [30] applied the maximum allowable heat loss method to calculate insulation thickness. The goal was to limit heat loss from the pipeline to a maximum value. Luo’s study showed that capping heat loss helps optimize insulation thickness for efficient thermal performance and energy conservation.
The economic thickness method, which considers the economic cost of insulation, is a commonly used method for calculating insulation at present. The methods commonly used in the economic thickness method include Life-Cycle Cost (LCC), Life-Cycle Assessment (LCA), and the Combined Economic and Environmental Method (CEEM). Açıkkalp et al. [31] proposed using the Combined Economic and Environmental Method (CEEM) to determine the economic thickness of pipeline insulation and compared the results of Life-Cycle Cost (LCC) and Life-Cycle Assessment (LCA). The study found that the economic thickness obtained using CEEM was between the values calculated by LCC and LCA. Specifically, the annual energy-saving cost using CEEM was twice that of the LCC calculation, with economic thickness values ranging from 25 mm to 35 mm. Fan et al. [32] analyzed the effects of investment, operation, and environmental costs on the insulation layer thickness of buried pipelines. The study compared the effects of using coal, oil, and natural gas as fuel on insulation thickness. The results indicated that using natural gas as fuel reduced the total cost by approximately 15%, with insulation thicknesses ranging from 40 mm to 60 mm. Salem et al. [33] optimized the insulation layer thickness calculation model with the goals of minimizing total costs and maximizing energy savings. The results showed that the optimal insulation thickness ranged from 70.7 mm to 130.4 mm, depending on the specific conditions and parameters considered. Li et al. [34] established a thermal insulation layer calculation model aimed at minimizing costs, and they analyzed the effects of heating costs, insulation material prices, and interest rates on the insulation layer thickness. The study reported optimal insulation thickness values between 50 mm and 100 mm, with variations based on the economic parameters used. Zhang et al. [35] analyzed the influence of pipe diameter on life-cycle cost and economic thickness. The results showed that with increasing pipe diameter, both the life-cycle cost and economic thickness decreased. For instance, for pipe diameters ranging from DN50 to DN300, the economic thickness decreased from 60 mm to 30 mm. Li et al. [36] studied the impact of insulation thickness on total cost and compared the heat loss costs between economic thickness and original thickness. The study found that optimizing insulation thickness could reduce total costs by up to 20%, with economic thicknesses ranging from 45 mm to 75 mm. Zhang et al. [37] calculated the optimal insulation thickness, energy-saving benefits, and investment payback period for three typical district heating pipelines under various conditions, including different nominal pipe diameters, fuel types, insulation materials, and buried depths. The optimal insulation thicknesses ranged from 55 mm to 120 mm, with payback periods varying from 3 to 7 years.
The primary innovation of our study lies in the application of the economic thickness model to electric heat tracing pipelines. Electric heat tracing is widely used to ensure that the circulating flow of drilling fluid remains heated, particularly in high-power electric heat tracing zones. However, there is a scarcity of research on the optimal combination of electric heat tracing and insulation materials in drilling pipelines. In actual production processes, the use of high-power electric heat tracing often leads to resource wastage. To save energy, it is necessary to choose an effective electric heat tracing and insulation structure. While there is extensive research on the design of thermal insulation layers for ground insulation pipelines, there are few studies focused on the design of thermal insulation layers for central electric tracing pipelines in drilling sites. The objectives of this research are as follows: (1) To determine the optimal insulation thickness for both thermal insulation and electric tracing pipelines. (2) To analyze the impact of various independent parameters—including pipe diameter, operational duration, drilling fluid temperature, and heat cost—on the economic thickness of the insulation layer. (3) To use Life-Cycle Cost (LCC) analysis in the methodology to evaluate the total cost of the insulation system over its life cycle. This paper addresses this gap by conducting optimization research on the thermal insulation structure of drilling pipelines, thereby providing engineering technical support and a scientific basis for drilling sites.

2. Method

Applying thermal insulation materials to the exterior of pipelines effectively prevents the drilling fluid inside from freezing. According to [38], industrial equipment must be insulated if the external surface temperature exceeds 50 °C or if process requirements necessitate minimizing temperature reduction or delaying medium condensation. The insulation design should be based on process requirements and a balance of technical and economic considerations. Typically, the economic thickness method is used to calculate the required insulation thickness, and for smaller required thicknesses, the maximum allowable heat loss method is used for verification. This study employs the economic thickness method within the framework of Life-Cycle Cost (LCC) analysis to determine the most cost-effective insulation thickness for pipelines. LCC analysis evaluates the total cost of an insulation system over its entire lifecycle, including initial investment, operational, and maintenance costs. This method is widely used in engineering to assess the economic viability of different insulation thicknesses. By considering all associated costs, LCC analysis helps identify the insulation thickness that minimizes total expenditure. While extensive research exists on the design of thermal insulation layers for ground pipelines, there are few studies focused on the design of insulation layers for central electric tracing pipelines in drilling sites. This paper addresses this gap by conducting optimization research on the thermal insulation structure of drilling pipelines, thereby providing engineering technical support and a scientific basis for drilling sites.

2.1. Economic Thickness Method for Insulated Pipelines

The thickness obtained by minimizing the annual average total cost of the insulation layer throughout its entire lifecycle is the economic thickness. The annual average total cost of the insulation layer mainly consists of two parts: the initial investment annual sharing cost and the annual heat loss cost. For single-layer insulation pipelines, the calculation formula for the initial investment annual sharing cost is mainly as follows [3]
H = π 4 × d 2 2 d 1 2 × β 1 P + P + π d 2 β 2 P 1 + P 2
where d2 is the outer diameter of the insulation pipe and d1 is the inner diameter of the insulation pipe. β1 is the tax and loss coefficient of the insulation layer, set at 1.10; this value accounts for the expected losses due to taxation and the inherent inefficiencies in material usage that may occur during the installation process. This coefficient is slightly above 1 to conservatively estimate the non-ideal conditions that might affect the insulation performance. P is the unit price of insulation layer materials and current market rates for rock wool and glass wool were utilized, quoted at 380 CNY/m3 and 300 CNY/m3, respectively. These prices reflect the average costs obtained from multiple supplier quotes, ensuring that our cost estimates are robust and reflect current market conditions. P′ is the construction cost of the insulation layer, priced at 264 CNY/m3; this parameter includes labor, equipment uses, and incidental materials necessary for the installation of the insulation. This cost was benchmarked against recent construction projects within similar industrial settings to ensure accuracy. β2 is the tax and loss coefficient of the protective layer; this coefficient was set at 1.3 to account for the additional costs associated with taxation and potential material wastage, which is slightly higher due to the complexities involved in applying and securing the protective layer. P1 is the unit price of the protective layer, and this article takes 3.5 CNY/m2 for this value; P2 is the construction cost of the protective layer, which is set at 40 CNY/m2 in this article.
P a = S × L × H
where S is the average annual amortization rate of investment loans, in %, which can be calculated using Formula (3) [4].
S = i 1 + i N 1 + i N 1
where S is the average annual amortization rate of investment loans, in %; i is the initial investment annual interest rate for which, in this article, 10% is taken; and N is the number of years of repayment for investment loans, usually considered as the service life of the pipeline. This article selects 10 years for this variable.
For insulated pipelines, the annual heat dissipation loss cost of the insulation layer is
P h = 3.6 × 10 6 × π d 2 L q P f τ
where q is the heat loss per unit area of the outer surface of the insulation layer, in W/m2, which can be solved according to Formula (5); Pf is the energy price, in CNY/GJ, which can be solved according to Formula (6); and τ is the average annual operating time of the insulated pipeline, in h.
q = t s   t a i r d 2 2 λ b l n d 2 d 1 + 1 h 0
where ts is the temperature of the outer wall of the pipeline, in °C; tair is the average outdoor temperature, in °C; and λ b is the thermal conductivity of the outer surface of the insulation, in W/(m °C).
P f = 1000 C 1 × C 2 × P F q F × η B
where C1 is the operating condition coefficient for which, in this article, 1.4 is taken; C2 is the alpha coefficient; PF is the fuel to factory price, in CNY/t; qF is the low-level heat generation of the fuel received, in kJ/kg; and ηB is the boiler thermal efficiency, taken as 0.76 in this article.
To ensure the minimum annual average cost P0 of the insulation layer, the outer diameter of the insulation pipeline is solved as follows:
P 0 d 2 = P a d 2 + P h d 2 = 0
After collation,
d 2 l n d 2 d 1 = 3.795 × 10 3 P f λ b τ t s   t a i r 1 2 λ b / h 0 d 2 S β 1 P + P + 2 β 2 P 1 + P 2 / d 2 2 λ b h 0
The economic thickness is
δ = d 2 d 1 2

2.2. Economic Thickness Method of Electric Tracing and Insulation Pipeline

For the electric tracing heat preservation pipeline, the calculation formula of the initial investment annual cost allocation is mainly as follows:
P a = N × L × H + A 1
where N is the annual average amortization rate of an investment loan, in %, the calculation formula for which is mainly shown in (11); A1 is the cost of heating elements required for heating tracing per unit length of the pipeline, in CNY/m, and its calculation formula is shown in (13):
N = i e 1 + i e n 1 + i e n 1
i e = 1 + i 1 1 + i 2 1
where ie is the effective annual interest rate, in %; i1 is the annual interest rate, in %; and i2 is the rate of electricity price increase, in %. In this paper, the rate of electricity price increase ie = i1.
A 1 = π d 2 t s t 1 d 2 2 λ b l n d 2 d 1 × A 2 A 3
where t1 refers to the external ambient temperature, in °C, which is generally the lowest limit temperature in the antifreeze pipeline area. In order to ensure the safety of the design, the temperature outside the insulation layer is selected to be consistent with the ambient temperature, and the lowest limit temperature is −30 °C. A2 indicates the unit price of the heating cable. The value is 32.85 CNY/m. A3 indicates the power per unit length of the heating cable, in W/m.
The power of the electric tracing zone is selected according to the heat dissipation Q of the pipeline: the heat dissipation per unit length of the pipeline multiplied by the safety factor is calculated as the heat loss for the selection of the electric tracing belt, taking into account the influence of wind speed and extremely low temperature on pipeline insulation. The safety factor is taken as 1.1–1.2, as shown below:
A 3 = 1.2 Q
Q = π d 2 t s t a i r d 2 2 λ b l n d 2 d 1 + 1 h 0
For electric tracing and insulation pipes, the annual heat loss cost
P h = 10 3 × π d 2 L B τ t s t a i r d 2 2 λ b l n d 2 d 1 + 1 h 0
where B is the electricity price, in CNY/(kW·h).
In order to ensure the minimum annual average cost P0 of the insulation layer, the outer diameter of the insulation pipeline is solved:
N L π 2 d 2 β 1 P + P + π β 2 P 1 + P 2 A 2 t s t 1 1.2 h 0 t s t a i r C 2 C 1 + 1 h 0 2 = 10 3 π L B τ t s t a i r d 2 2 λ b 1 h 0
C 1 = d 2 2 λ b l n d 2 d 1
C 2 = C 1 d 2 + 1 2 λ b C 1 2

3. Results and Discussion
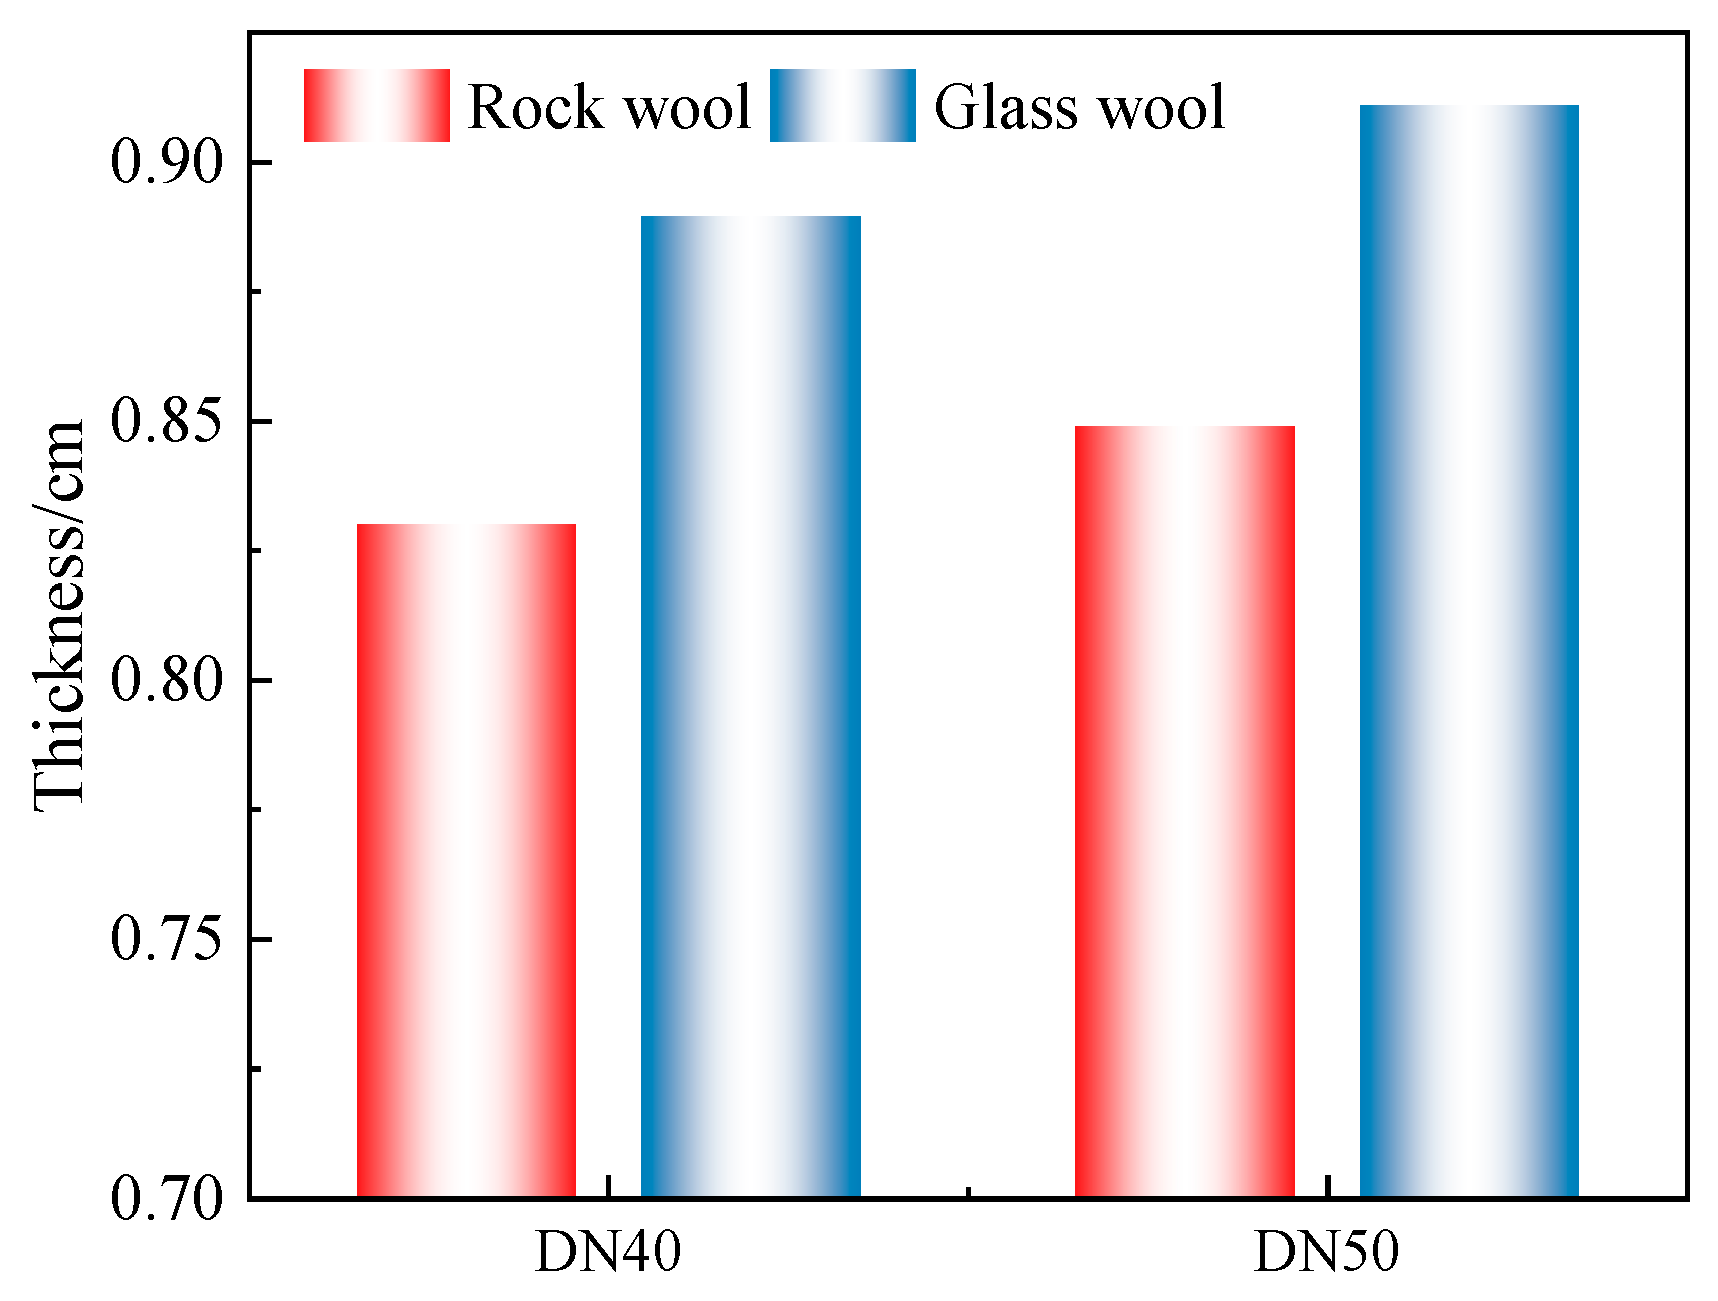
3.1. Validation

The heat transfer and pressure drop characteristics of drilling fluid flow in the surface pipeline during circulation are crucial parameters for determining the appropriate insulation thickness. The model, based on the calculation procedure for drilling fluid flow in the surface pipeline, was validated using Fluent software (2020R2). The validation involved solving the temperature distribution of water-based drilling fluid at the pipeline outlet under the same conditions: a DN40 pipeline with a length of 100 m. The validation results, shown in Figure 1, indicate that our model’s calculations align well with the Fluent data, with a maximum error of 2.82%. For the numerical calculations in this chapter, the external environmental parameters were set as follows: an ambient temperature of −20 °C, a wind speed of 2 m/s, an initial fluid temperature of 20 °C, a thermal conductivity of the pipe wall of 48 W/(m·°C), a specific heat capacity of 483 J/(kg·°C), and a density of 7850 kg/m3.

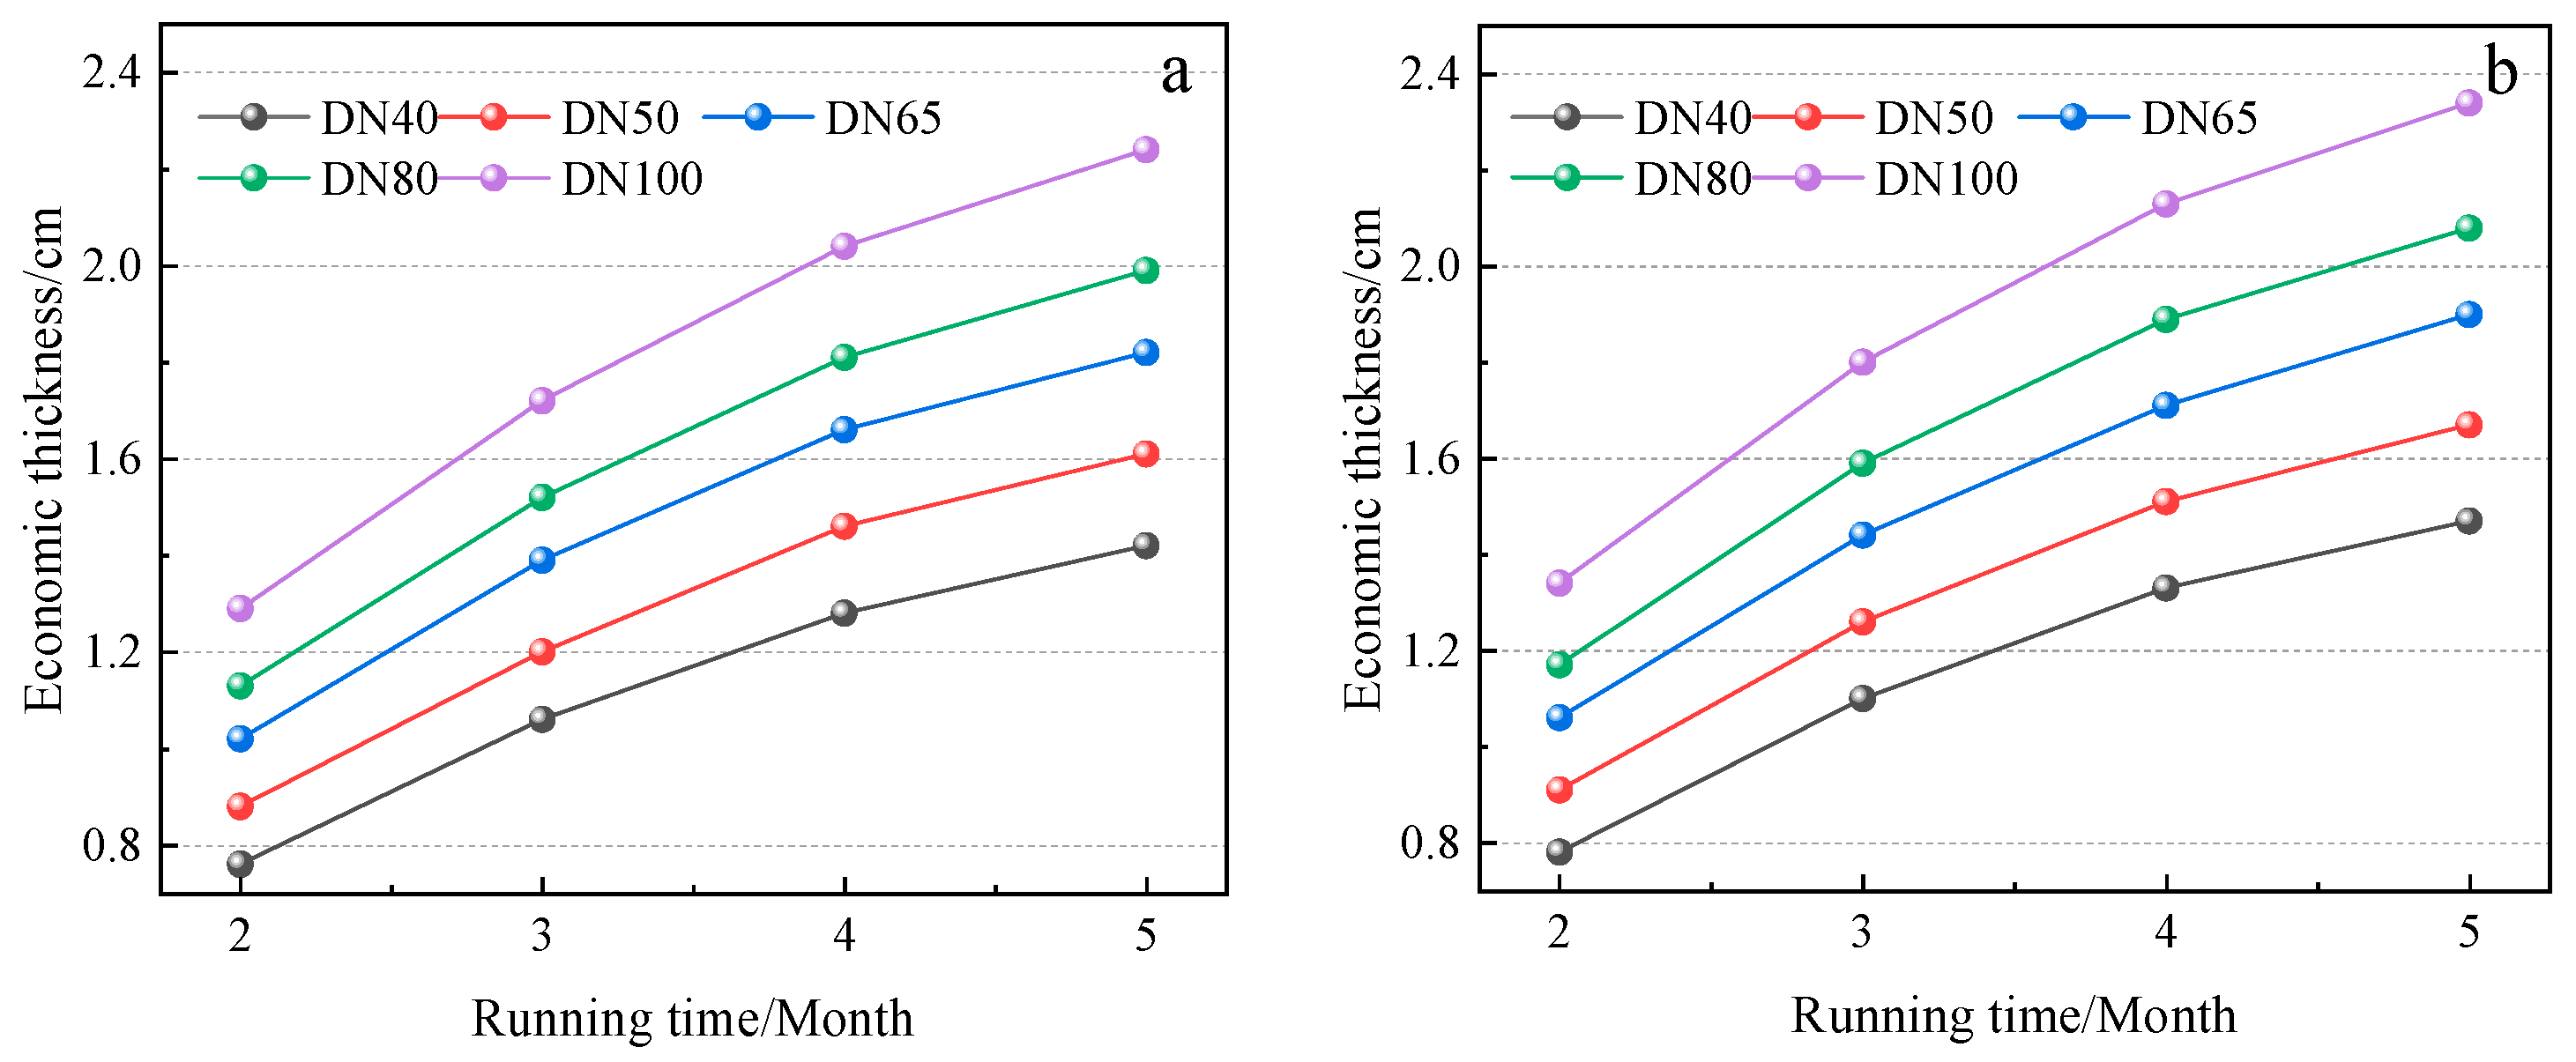
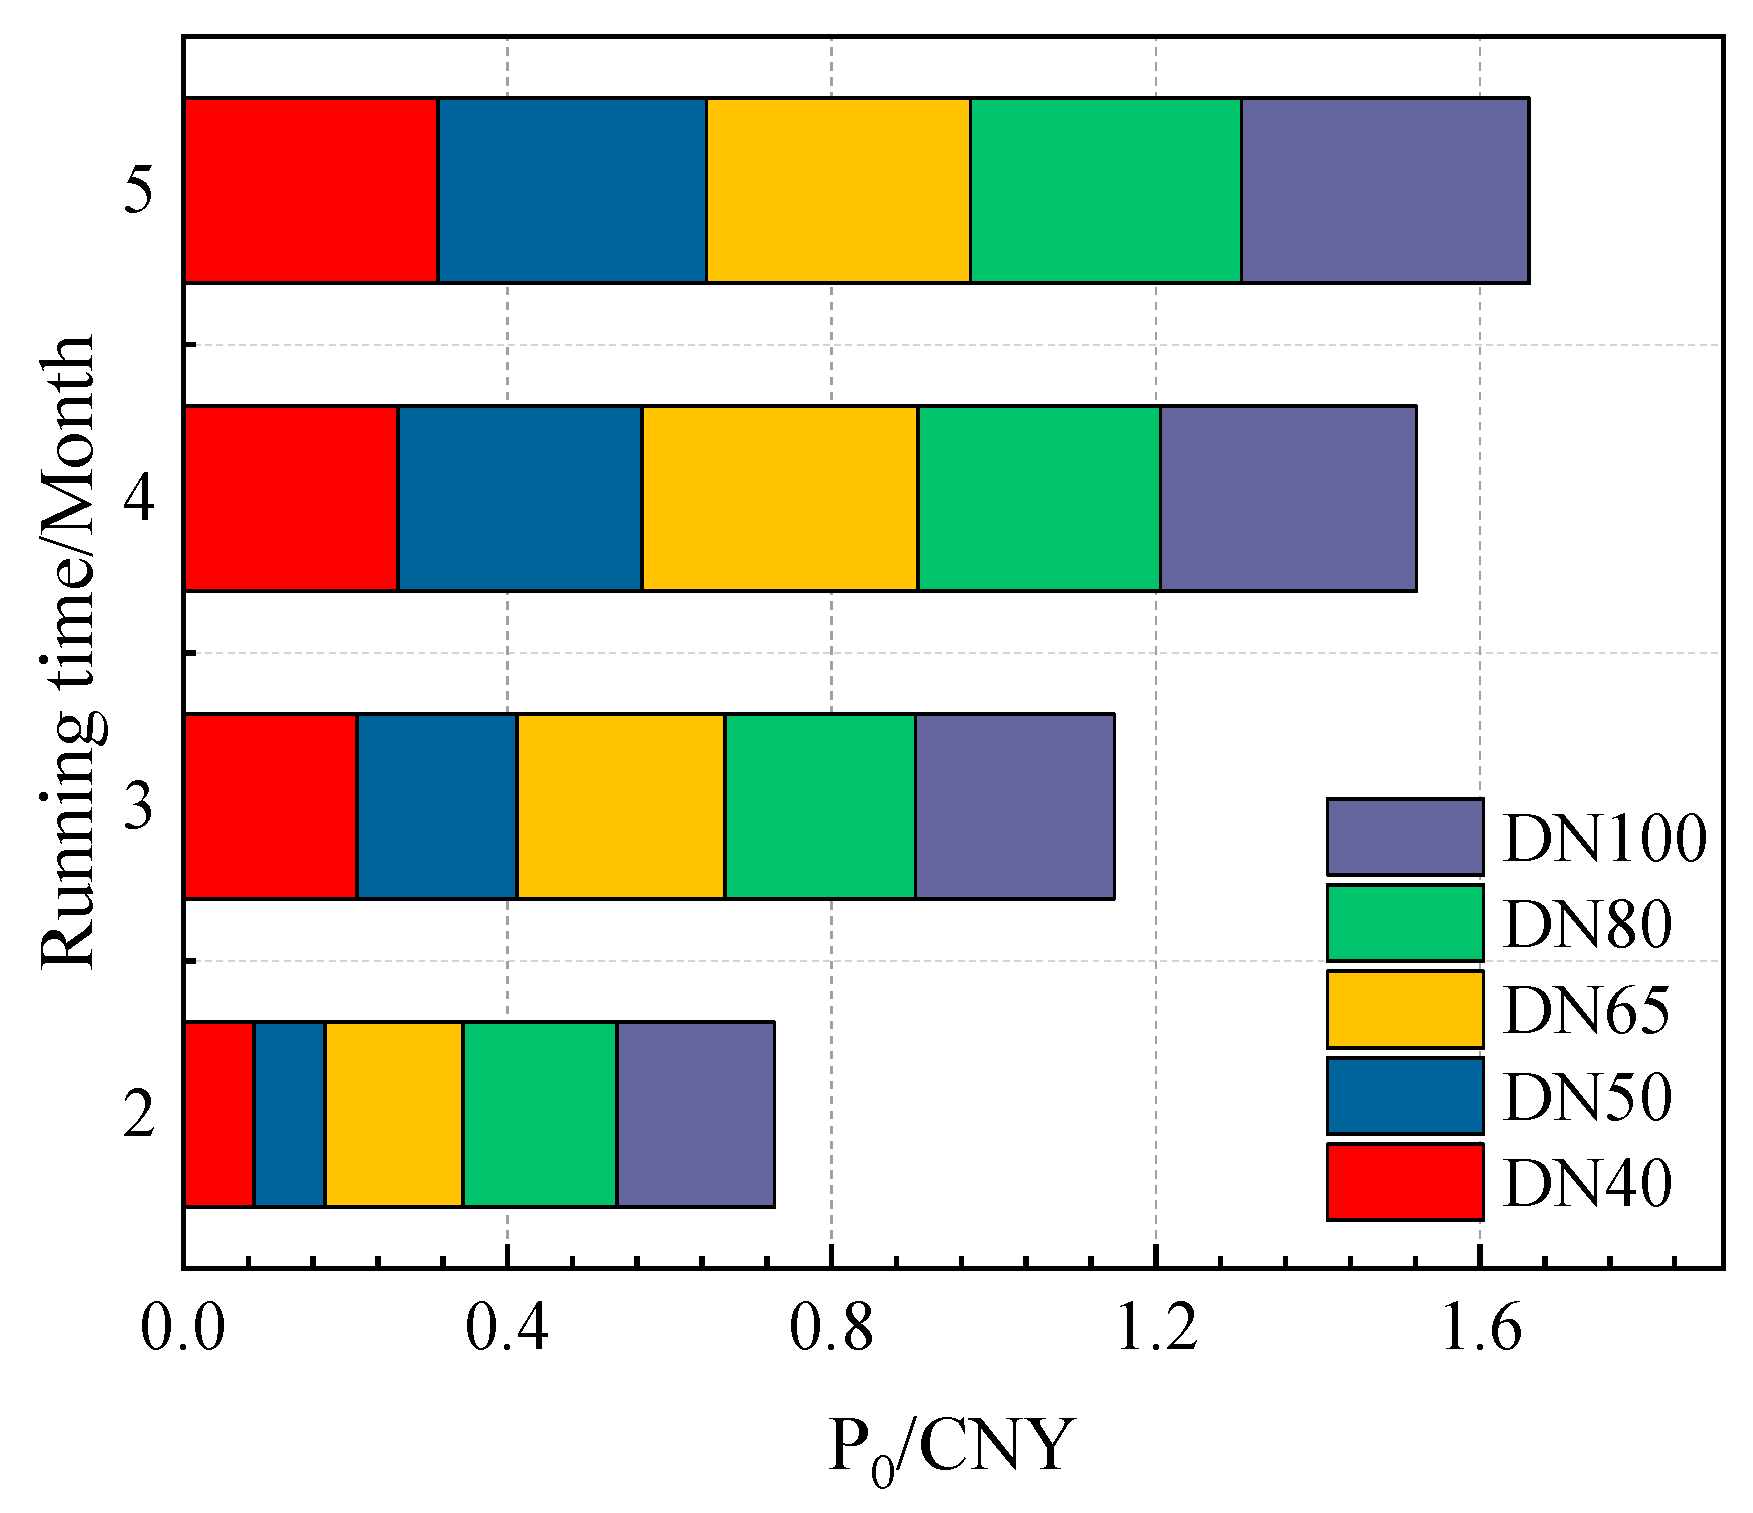
3.2. Effect of Pipe Diameter on Economic Thickness and Cost

3.2.1. Insulated Pipes

Unlike conventional heating pipelines, whose operational periods are predefined, the operational duration of drilling fluid circulation systems is dictated by real-time production conditions at drilling sites. Consequently, this study investigates the influence of varying operational durations on the economic thickness of surface pipeline insulation. Figure 1 illustrates how the average drilling fluid temperature of 20 °C affects the economic thickness across various pipeline diameters. The dimensions of the insulated pipe—specifically its diameter—and the duration of operation significantly impact the economic thickness. This thickness generally increases as both the operational duration and pipe diameter expand. This trend is due to escalating heat dissipation costs, which, in turn, necessitate an increased insulation thickness to maintain efficiency. As depicted in Figure 2a for a DN100 pipeline, extending the operational period from 1440 h (approximately 2 months, marking the onset of insulation deployment in November) to 3600 h (about 5 months) results in the economic thickness of rock wool insulation escalating from 1.29 cm to 2.24 cm. Similarly, when comparing different pipeline diameters during a constant operational period of 3600 h, the economic thickness rises from 1.42 cm in a DN40 pipe to 2.24 cm in a DN100 pipe. Moreover, Figure 2b reveals variations in economic thickness between different insulation materials. Over an operational span of 3600 h, the economic thickness for a DN100 glass wool pipe exceeds that of a rock wool pipe by 0.1 cm. This discrepancy is primarily attributed to differences in the thermal conductivity and cost per unit of the materials; rock wool, possessing lower thermal conductivity and a higher cost, results in a thinner economic thickness compared to glass wool. These findings underscore the critical influence of operational duration and pipe diameter on the optimal insulation thickness, highlighting the need for tailored insulation strategies based on specific operational and material characteristics.
If the thickness obtained via the economic thickness method is small in engineering practice, the rationality of economic thickness should be checked according to the maximum allowable heat loss. The maximum allowable heat loss was selected according to Appendix B of the national standard [35]. Since the external surface temperature of the pipeline in this section cannot correspond to the data in Appendix B one for one, the maximum allowable heat loss at different running times was linearly fitted with a fitting degree of 0.99933, and the fitting formula was obtained as follows:
Q = 55.6 + 1.00443 t 9.28571 × 10 4 t 2
After calculation, when the running time is 1440 h, the heat loss of DN40 and DN50 rock wool and glass wool insulation pipes under economic thickness is greater than the maximum allowable heat loss. Therefore, the maximum allowable heat loss should be selected as the index to design the insulation thickness under this working condition. The economic thickness method should be used in other working conditions. Table 2 and Table 3 list the heat loss under the economic thicknesses of rock wool and glass wool pipes with different pipe diameters.
Figure 3 illustrates the insulation thickness required to stay within the maximum allowable heat loss for DN40 and DN50 pipelines, utilizing both rock wool and glass wool as insulation materials. This comparison is specifically for a fixed running time of 1440 h. The data indicate that insulation thickness correlates positively with pipe diameter; larger diameters necessitate greater insulation thickness to maintain thermal efficiency. For instance, the insulation thickness for a DN50 rock wool pipe is 0.85 cm, marginally thicker by 0.02 cm than that for a DN40 pipe. Furthermore, the figure demonstrates that under conditions of maximum allowable heat loss, glass wool insulation requires a thicker layer compared to rock wool. This is attributed to the higher thermal conductivity of glass wool; despite equal heat dissipation losses, glass wool’s thermal properties require a thicker barrier to achieve the same insulative performance. In quantitative terms, the insulation thickness for a DN50 glass wool pipe is 7.30% thicker than its rock wool counterpart. This distinction highlights the critical role material properties play in determining the appropriate insulation thickness for optimizing energy efficiency in pipeline systems.
Figure 4 delineates the total costs associated with the insulation layer for different pipe diameters, categorized into initial investment and ongoing heat loss costs. This analysis reveals that the total cost escalates with both running time and pipe diameter. Specifically, the initial investment cost for a DN100 rock wool pipe rises from CNY 0.92 to 24.47% when the operation extends from 1440 to 3600 h. Concurrently, the cost attributable to heat loss surges by CNY 4.37, an increase of 73.57% over the same period, illustrating that the total cost is directly proportional to the running time. The comprehensive cost analysis for the same DN100 rock wool pipeline shows an overall increase in the total cost per unit length of CNY 5.3, or 54.70%, as the running time expands from 1440 to 3600 h. Additionally, as the pipe diameter enlarges, the required insulation thickness also increases, thereby raising both the initial investment and heat loss costs. For instance, at the 3600 h mark, the total cost per unit length for a DN40 rock wool pipe is 36.63% less than that of a DN100 pipe, clearly demonstrating the impact of pipe diameter on cost dynamics. This detailed breakdown underscores the significant economic factors that must be considered in the design and material selection for pipeline insulation systems.
Figure 5 presents a comparative analysis of the total costs associated with rock wool and glass wool pipe insulations per unit length. The analysis underscores that the cost differential between the two materials escalates proportionally with both pipe diameter and operational duration. Specifically, the total cost for glass wool insulation exceeds that of rock wool due to its higher thermal conductivity, which necessitates a thicker insulation layer. This increased thickness, in turn, augments both the initial investment and the heat loss costs associated with glass wool insulation. Quantitatively, for a DN100 pipe, the total cost per unit length for glass wool insulation is higher than that for rock wool by CNY 0.19 at 1440 h of operation, which further widens to CNY 0.35 at 3600 h. These data effectively illustrate how material properties such as thermal conductivity influence the economic implications of insulation choices over varying operational durations.

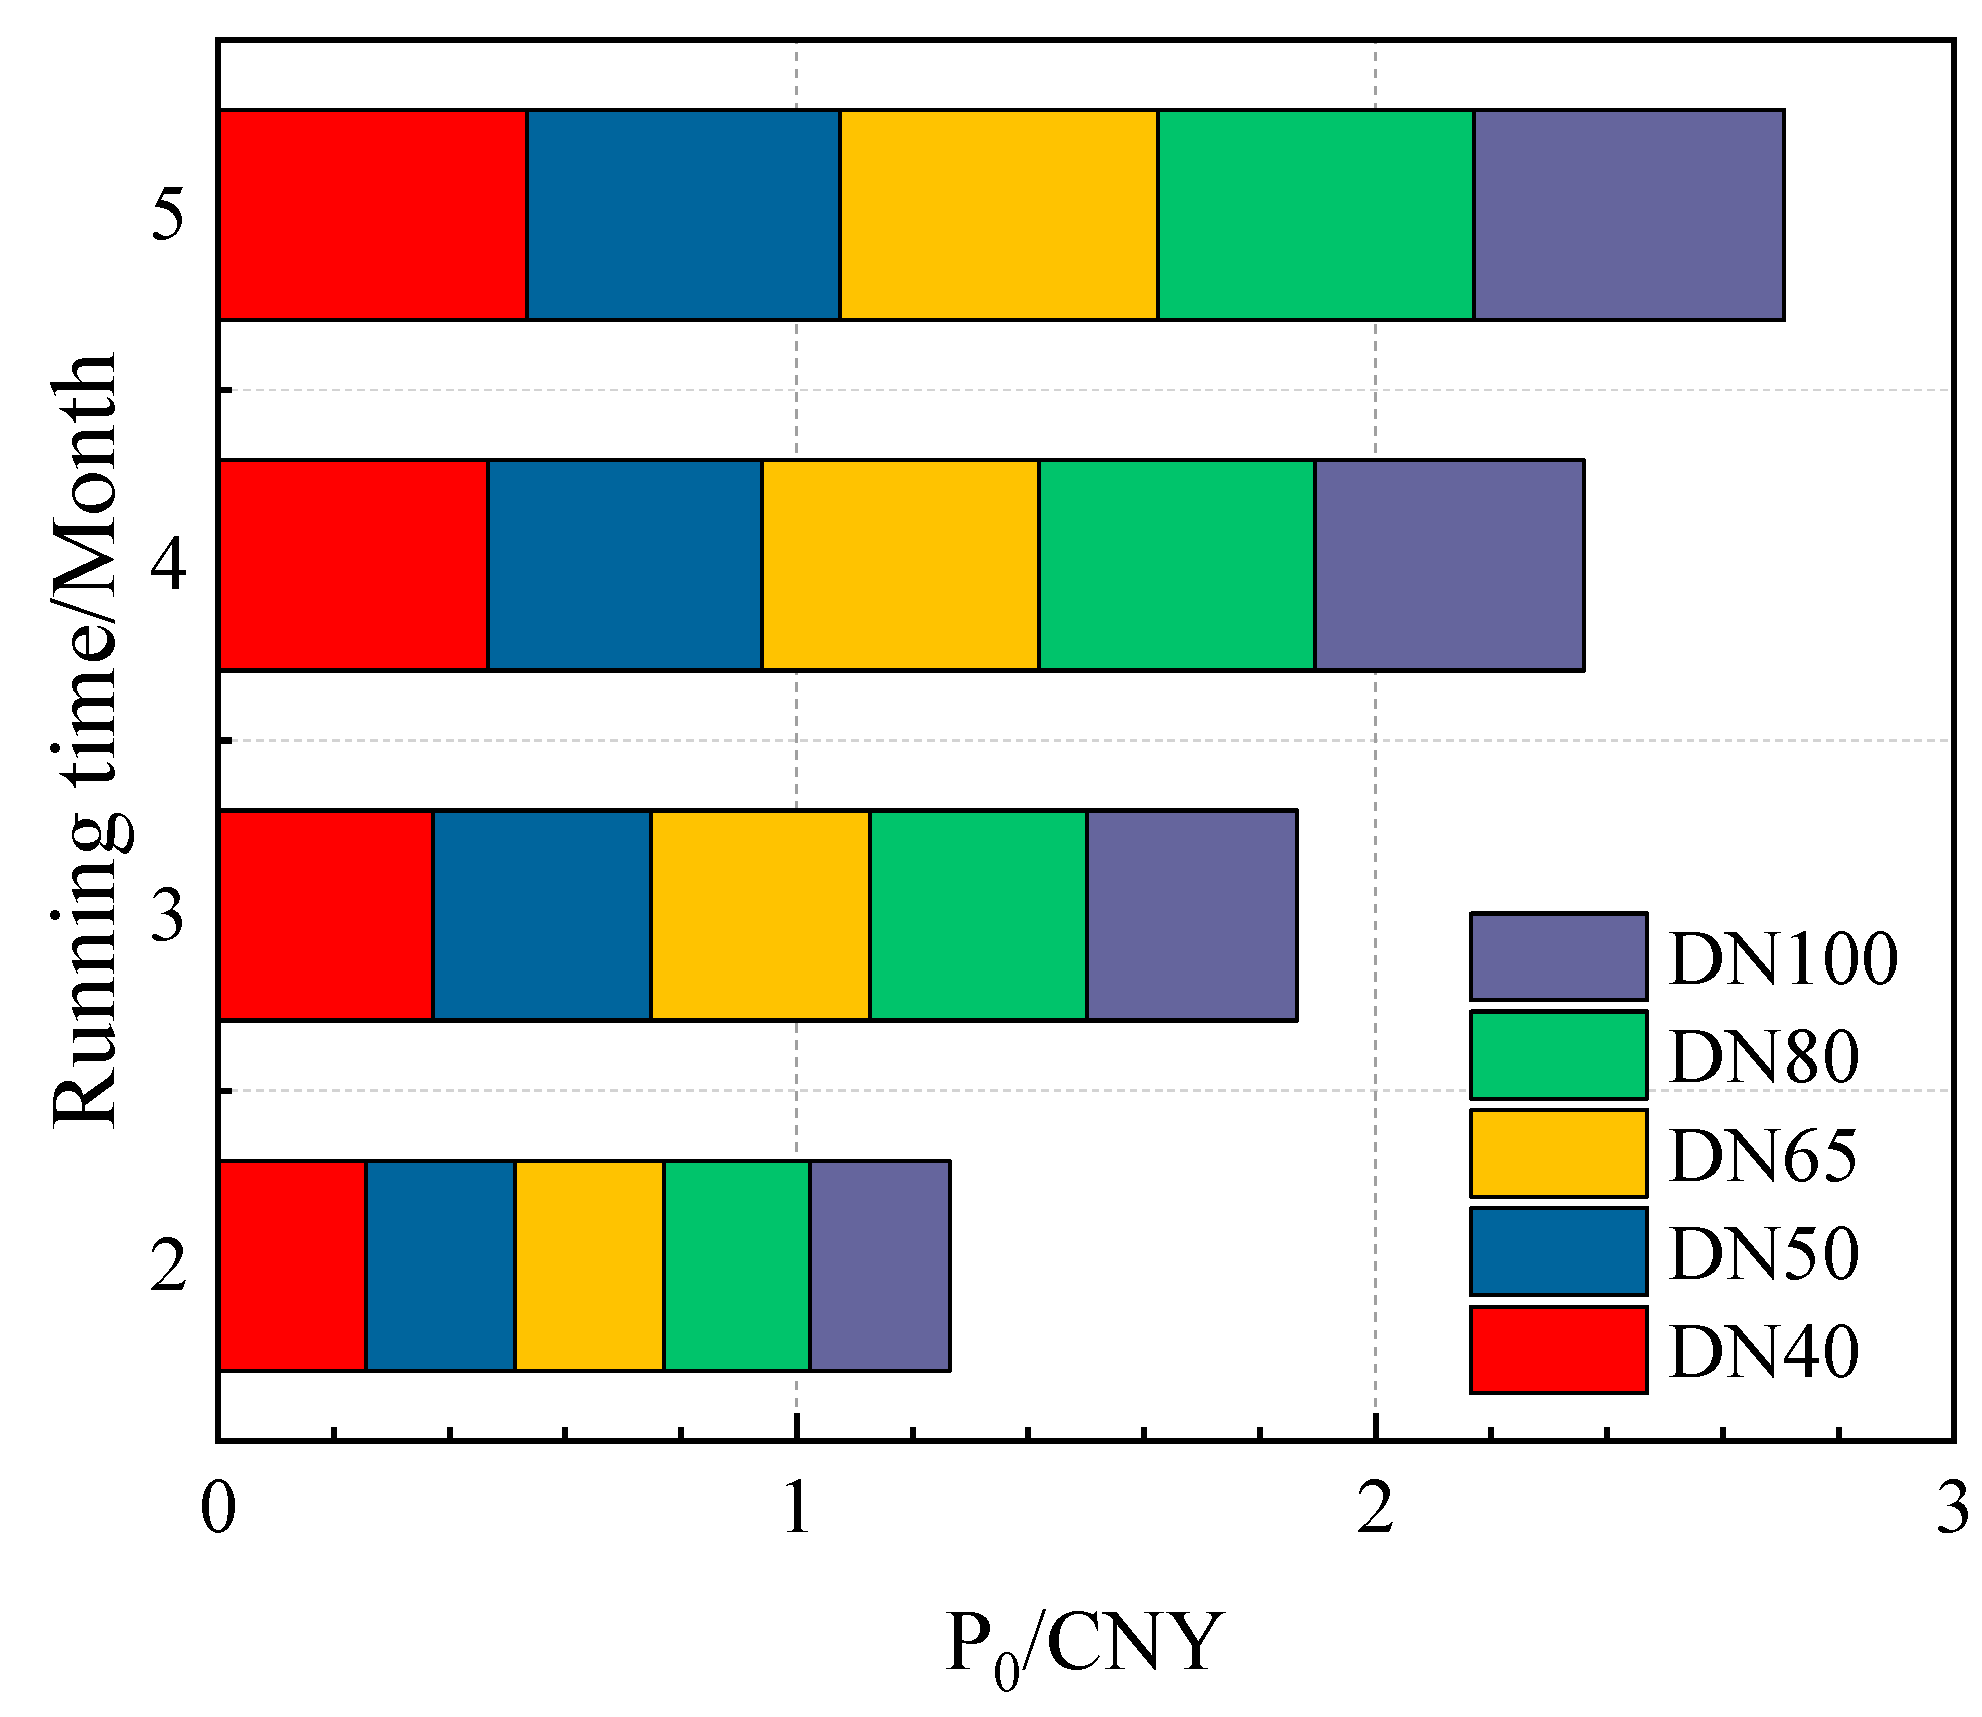
3.2.2. Electric Tracer Pipes

The relationship between the economic thickness of insulation and operational factors such as running time and pipe diameter is similarly observed in electric tracing insulation pipes. Figure 6 illustrates the economic thickness variations for electric tracing insulation pipes made of rock wool and glass wool across different pipe diameters. Notably, the economic thickness increases in proportion to both the running time and the pipe diameter, emphasizing the significant role of pipe diameter on the initial investment costs of the insulation layer. For instance, for a DN100 electric tracing rock wool pipe, increasing the running time from 1440 h to 3600 h leads to a rise in economic thickness from 4.91 cm to 7.42 cm, an increase of 51.12%. Similarly, when the running time is maintained at 3600 h and the pipe diameter is altered from DN40 to DN100, the economic thickness escalates from 5.77 cm to 7.42 cm, marking a 28.60% increase.
Furthermore, Figure 6a,b reveal that the economic thickness of the electric tracing glass wool pipe is consistently greater than that of its rock wool counterpart. Specifically, at a running time of 3600 h and a diameter of DN100, the economic thickness of the glass wool pipe exceeds the rock wool pipe by 0.56 cm. This greater thickness in electric tracing pipes, compared to non-electric tracing pipes using the same insulation material, can be attributed to the additional costs associated with converting electricity into heat in the tracing process. For example, the economic thickness for the DN100 rock wool electric tracing pipe is 5.18 cm higher than that for a non-electric tracing pipe at the same running time and diameter. These findings underscore the critical impact of operational parameters and material properties on the design and cost-effectiveness of pipeline insulation in thermal management systems.
Because the heat dissipation of the electric tracing pipe can be compensated by the electric tracing belt, the economic thickness of the electric tracing pipe is no longer checked. The total cost of electric tracing rock wool and electric tracing glass wool pipes with different pipe diameters per unit length is shown in Figure 7. It can be seen from the figure that the total cost of the thermal insulation of non-electric heat tracing pipes is the same as the relationship between pipe diameter and running time; the total cost of the thermal insulation layer of electric heat tracing pipes is also proportional to pipe diameter and running time. With the increase in pipe diameter, the initial investment cost of the thermal insulation layer and heat dissipation loss cost increase, the total cost increases in the thermal insulation layer, and the increase in heat dissipation costs after the increase in running time leads to the increase in total cost. When the running time is 3600 h and the pipe type is changed from DN40 to DN100, the total cost of the insulation layer per unit length of the power tracing rock wool pipeline was increased from CNY 24.82 to CNY 26.77 (7.86%), CNY 29.23 (17.77%), CNY 31.30 (26.11%), and CNY 34.71 (39.85%) respectively. When the running time is increased from 1440 h to 3600 h, the total cost of the insulation layer of the DN100 electric heating tracing rock wool pipeline per unit length is increased by 42.02% from CNY 24.44 to CNY 34.71. Taking the running time of 3600 h and the DN100 rock wool as insulation material as an example, since the initial investment cost and heat loss cost of electric heating tracing are higher than those of non-thermal insulation pipes, the total cost per unit length of electric heating tracing pipes is CNY 19.72 higher than that of non-electric heating tracing pipes.
Figure 8 illustrates the variation in the total cost per unit length between electric heating tracing rock wool and glass wool pipelines. As depicted in Figure 7a,b, the economic thickness for the electric heating tracing glass wool pipeline exceeds that of the rock wool pipeline. This is attributed to glass wool’s higher thermal conductivity, which leads to increased heat loss costs. Consequently, both the economic thickness and the initial investment costs for glass wool are higher, resulting in a greater overall cost compared to the rock wool pipeline. Moreover, Figure 8 highlights that the difference in total cost becomes more pronounced with extended running times. Specifically, as the running time extends from 1440 h to 3600 h, the disparity in the total cost per unit length for a DN100 pipeline increases from CNY 0.24 to CNY 0.54. This trend underscores the significant impact of insulation material properties and operational duration on the cost-effectiveness of electric heating tracing systems. The increasing divergence in cost with longer running times emphasizes the need for the careful selection of insulation materials based on both thermal performance and economic considerations.

3.3. Effect of Average Drilling Fluid Temperature on Economic Thickness and Cost

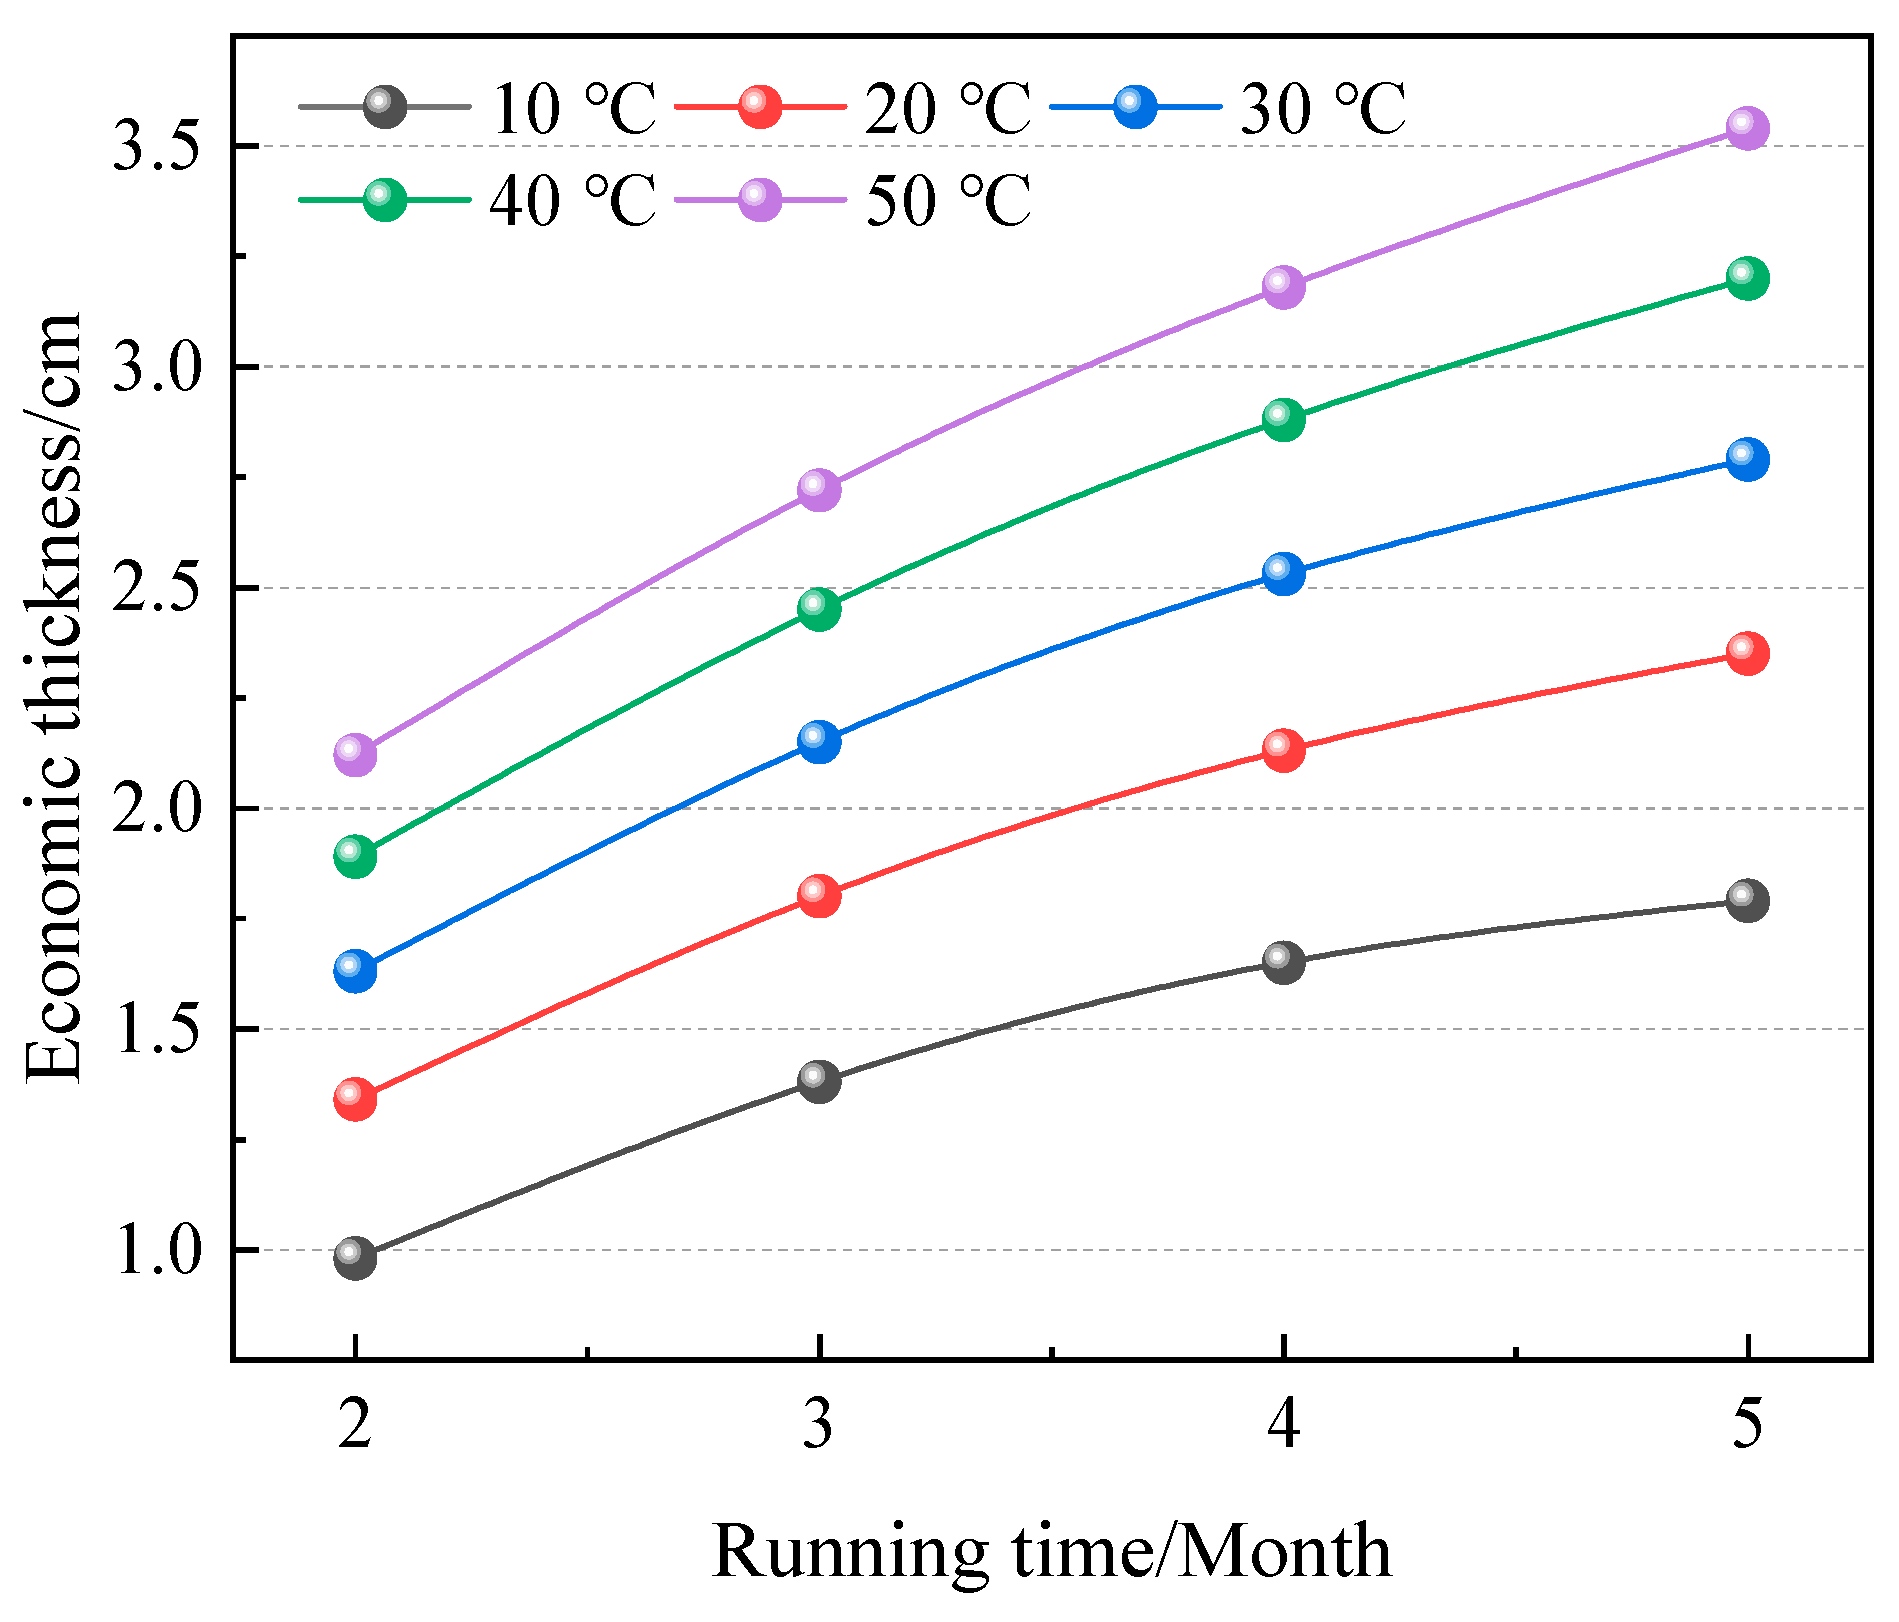
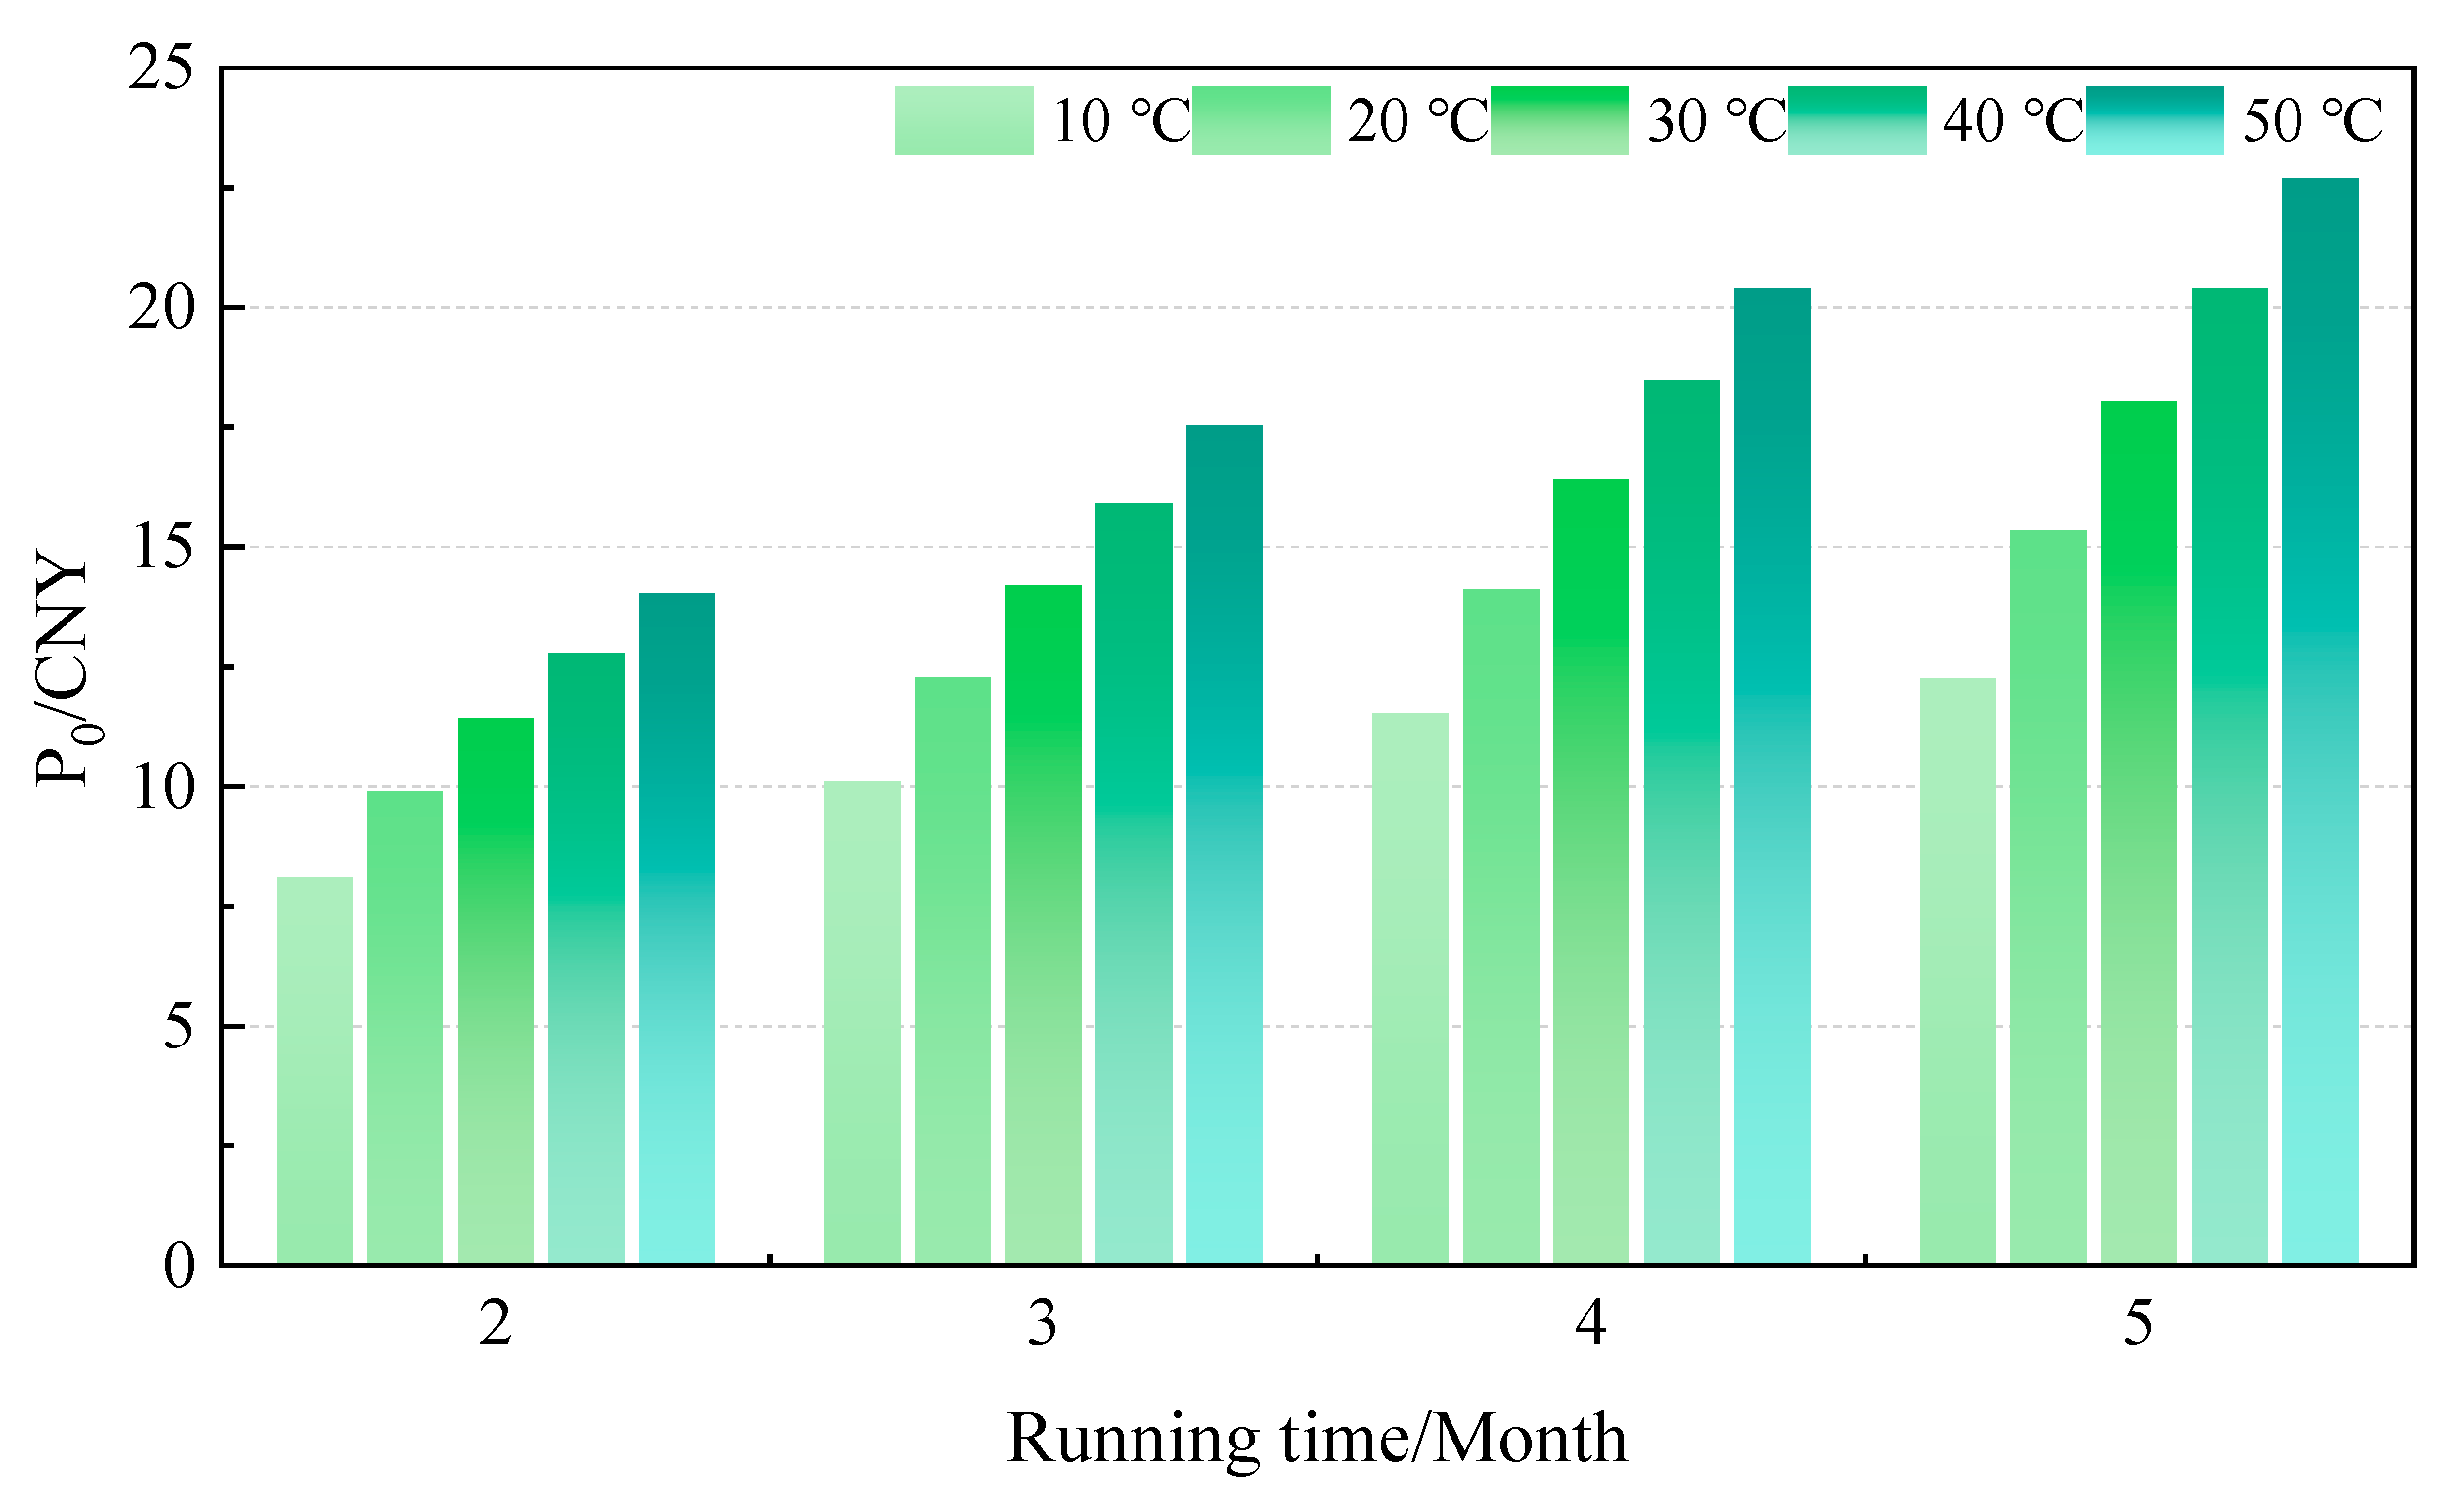
3.3.1. Insulated Pipes

The average drilling fluid temperatures are 10 °C, 20 °C, 30 °C, 40 °C, and 50 °C, respectively. The economic thickness of glass wool pipes per unit length when the pipe type is DN100 is shown in Figure 9. It can be seen from the figure that the average drilling fluid temperature has an important influence on the economic thickness of insulation. With the increase in temperature, the heat loss cost of the insulation layer increases, the economic thickness increases, and the increase rate decreases gradually. Taking the running time of 3600 h as an example, when the average drilling fluid temperature is increased from 10 °C to 50 °C, the economic thickness of the insulation layer per unit length was increased from 1.79 cm to 2.35 cm (31.28%), 2.79 cm (55.87%), 3.20 cm (78.77%), and 3.54 cm (97.77%), respectively.
The heat loss per unit length and at different average drilling fluid temperatures under the economic thickness of the glass wool pipe is less than the maximum allowable heat loss, as shown in Table 4. Therefore, the economic performance is selected as the index to optimize the insulation thickness, and the optimization results of insulation thickness are shown in Figure 9. As can be seen from Table 4, with the increase in average drilling fluid temperature, heat loss also increases. This is mainly because the increase in drilling fluid temperature increases the temperature difference with the external environment, thus increasing the heat loss. Take the running time of 3600 h as an example. When the drilling fluid temperature increased from 10 °C to 20 °C, 30 °C, 40 °C, and 50 °C, the heat loss of the insulation pipeline increased from 28.18 W/m2 to 34.39 W/m2 (22.04%), 39.56 W/m2 (40.38%), 43.50 W/m2 (54.36%), and 47.32 W/m2 (67.92%), respectively.
The total cost of DN100 glass wool pipe with different average drilling fluid temperatures per unit length is shown in Figure 10. When the drilling fluid temperature is 10 °C, 20 °C, 30 °C, 40 °C, and 50 °C respectively, the total cost of insulation per unit length is CNY 12.27, CNY 15.33, CNY 18.02, CNY 20.41, and CNY 22.68, respectively. After the drilling fluid temperature increases, the thickness of the insulation layer increases and the initial investment cost and heat loss cost of the insulation layer increase, resulting in an increase in the total cost.

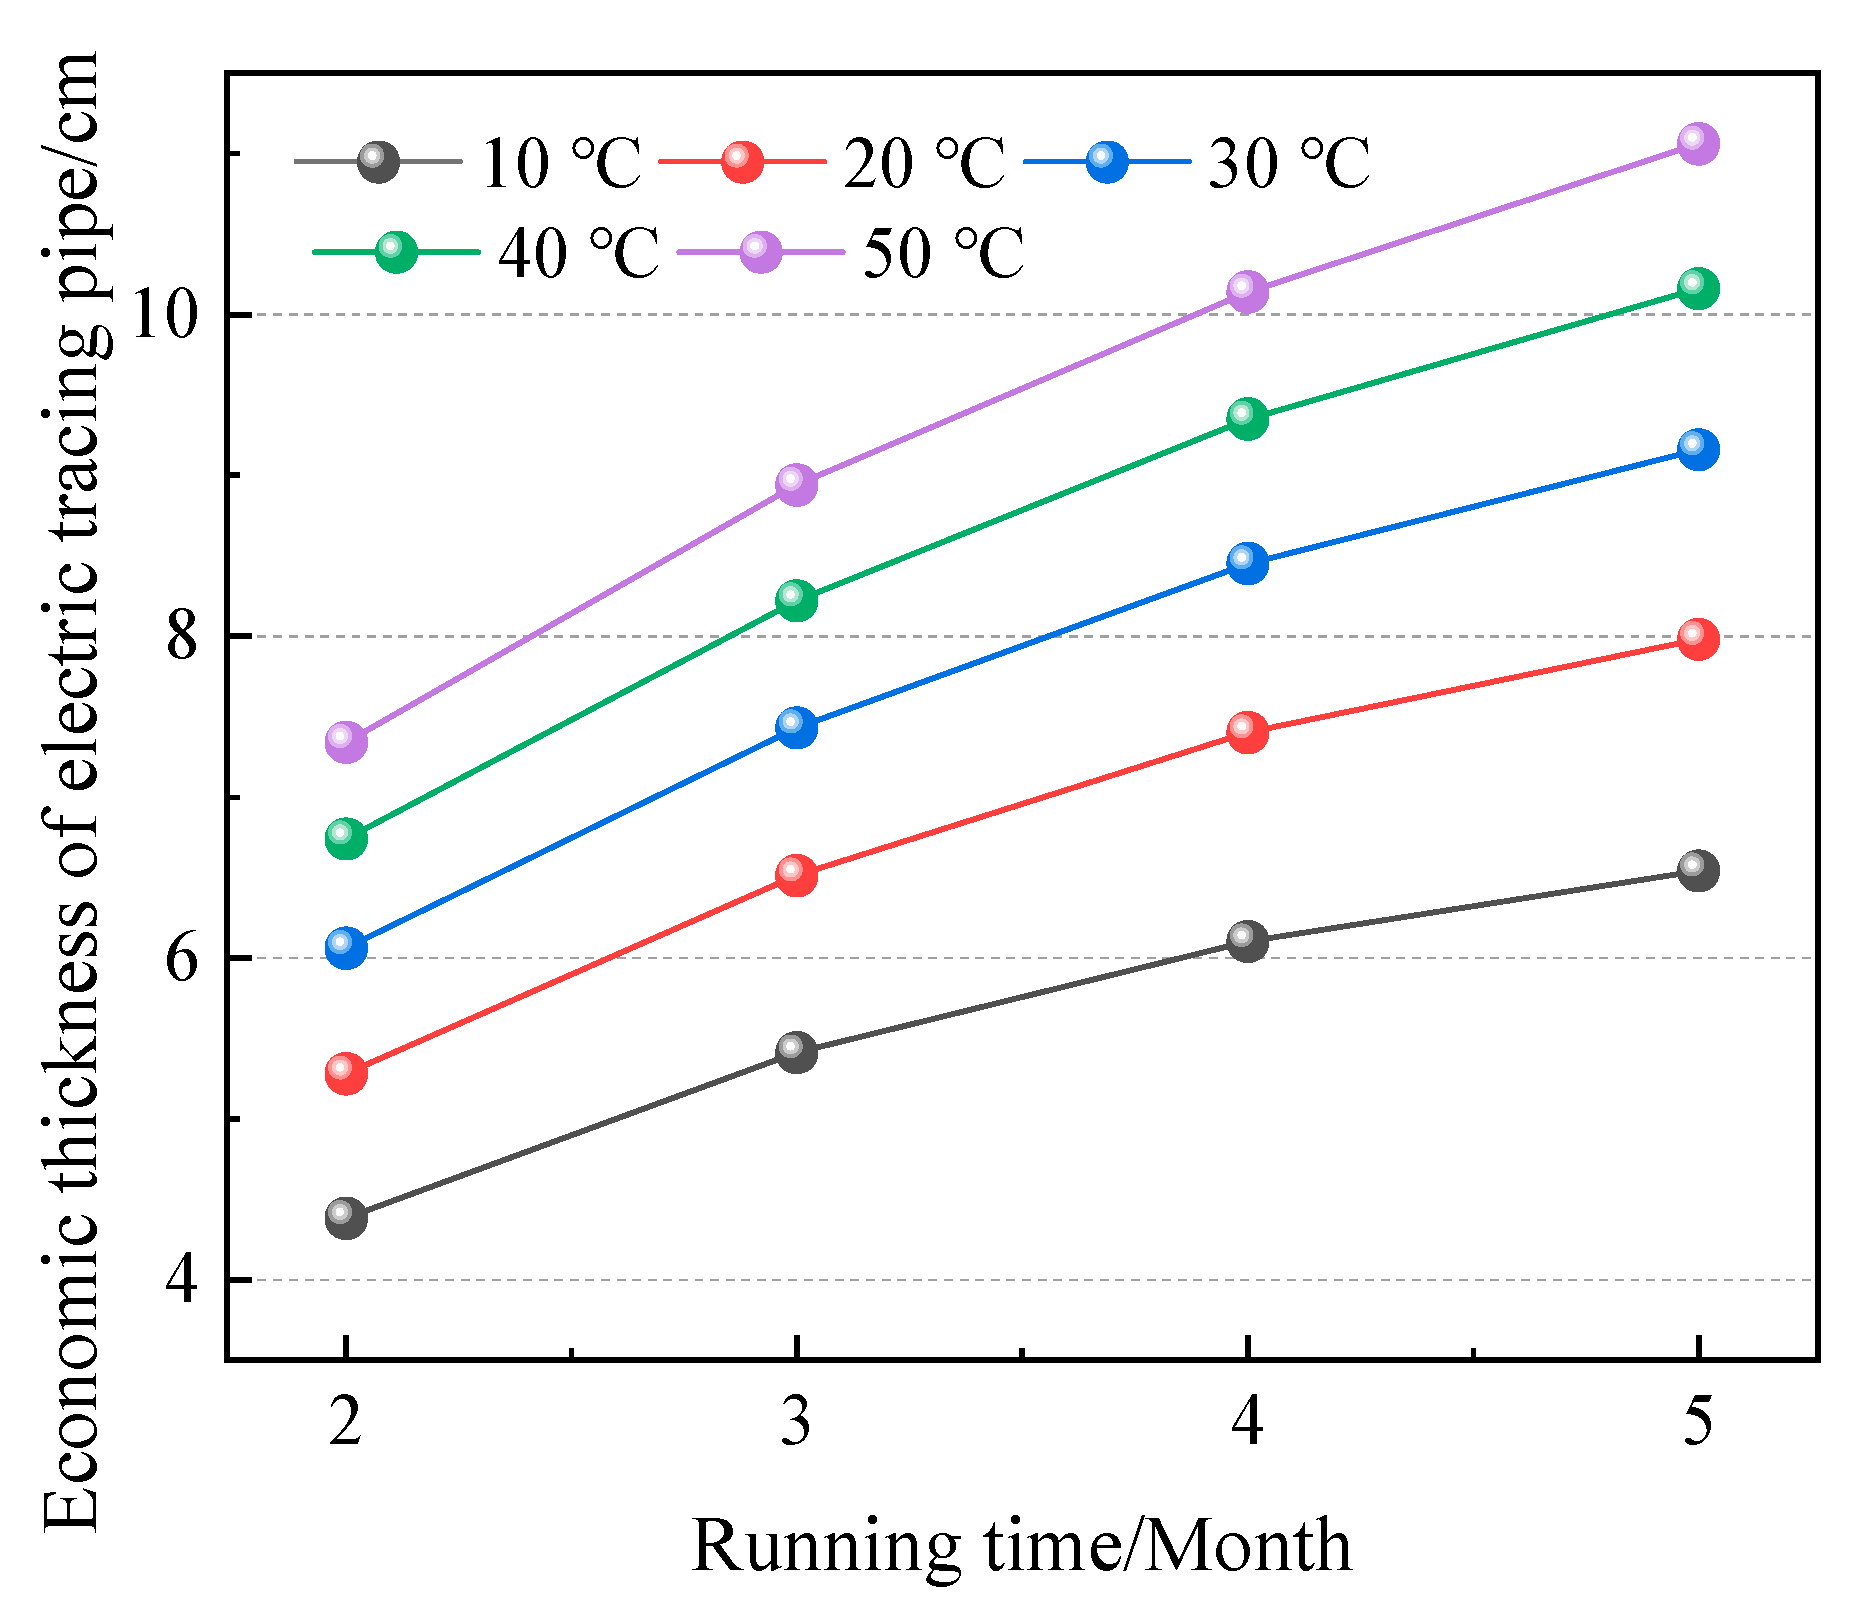
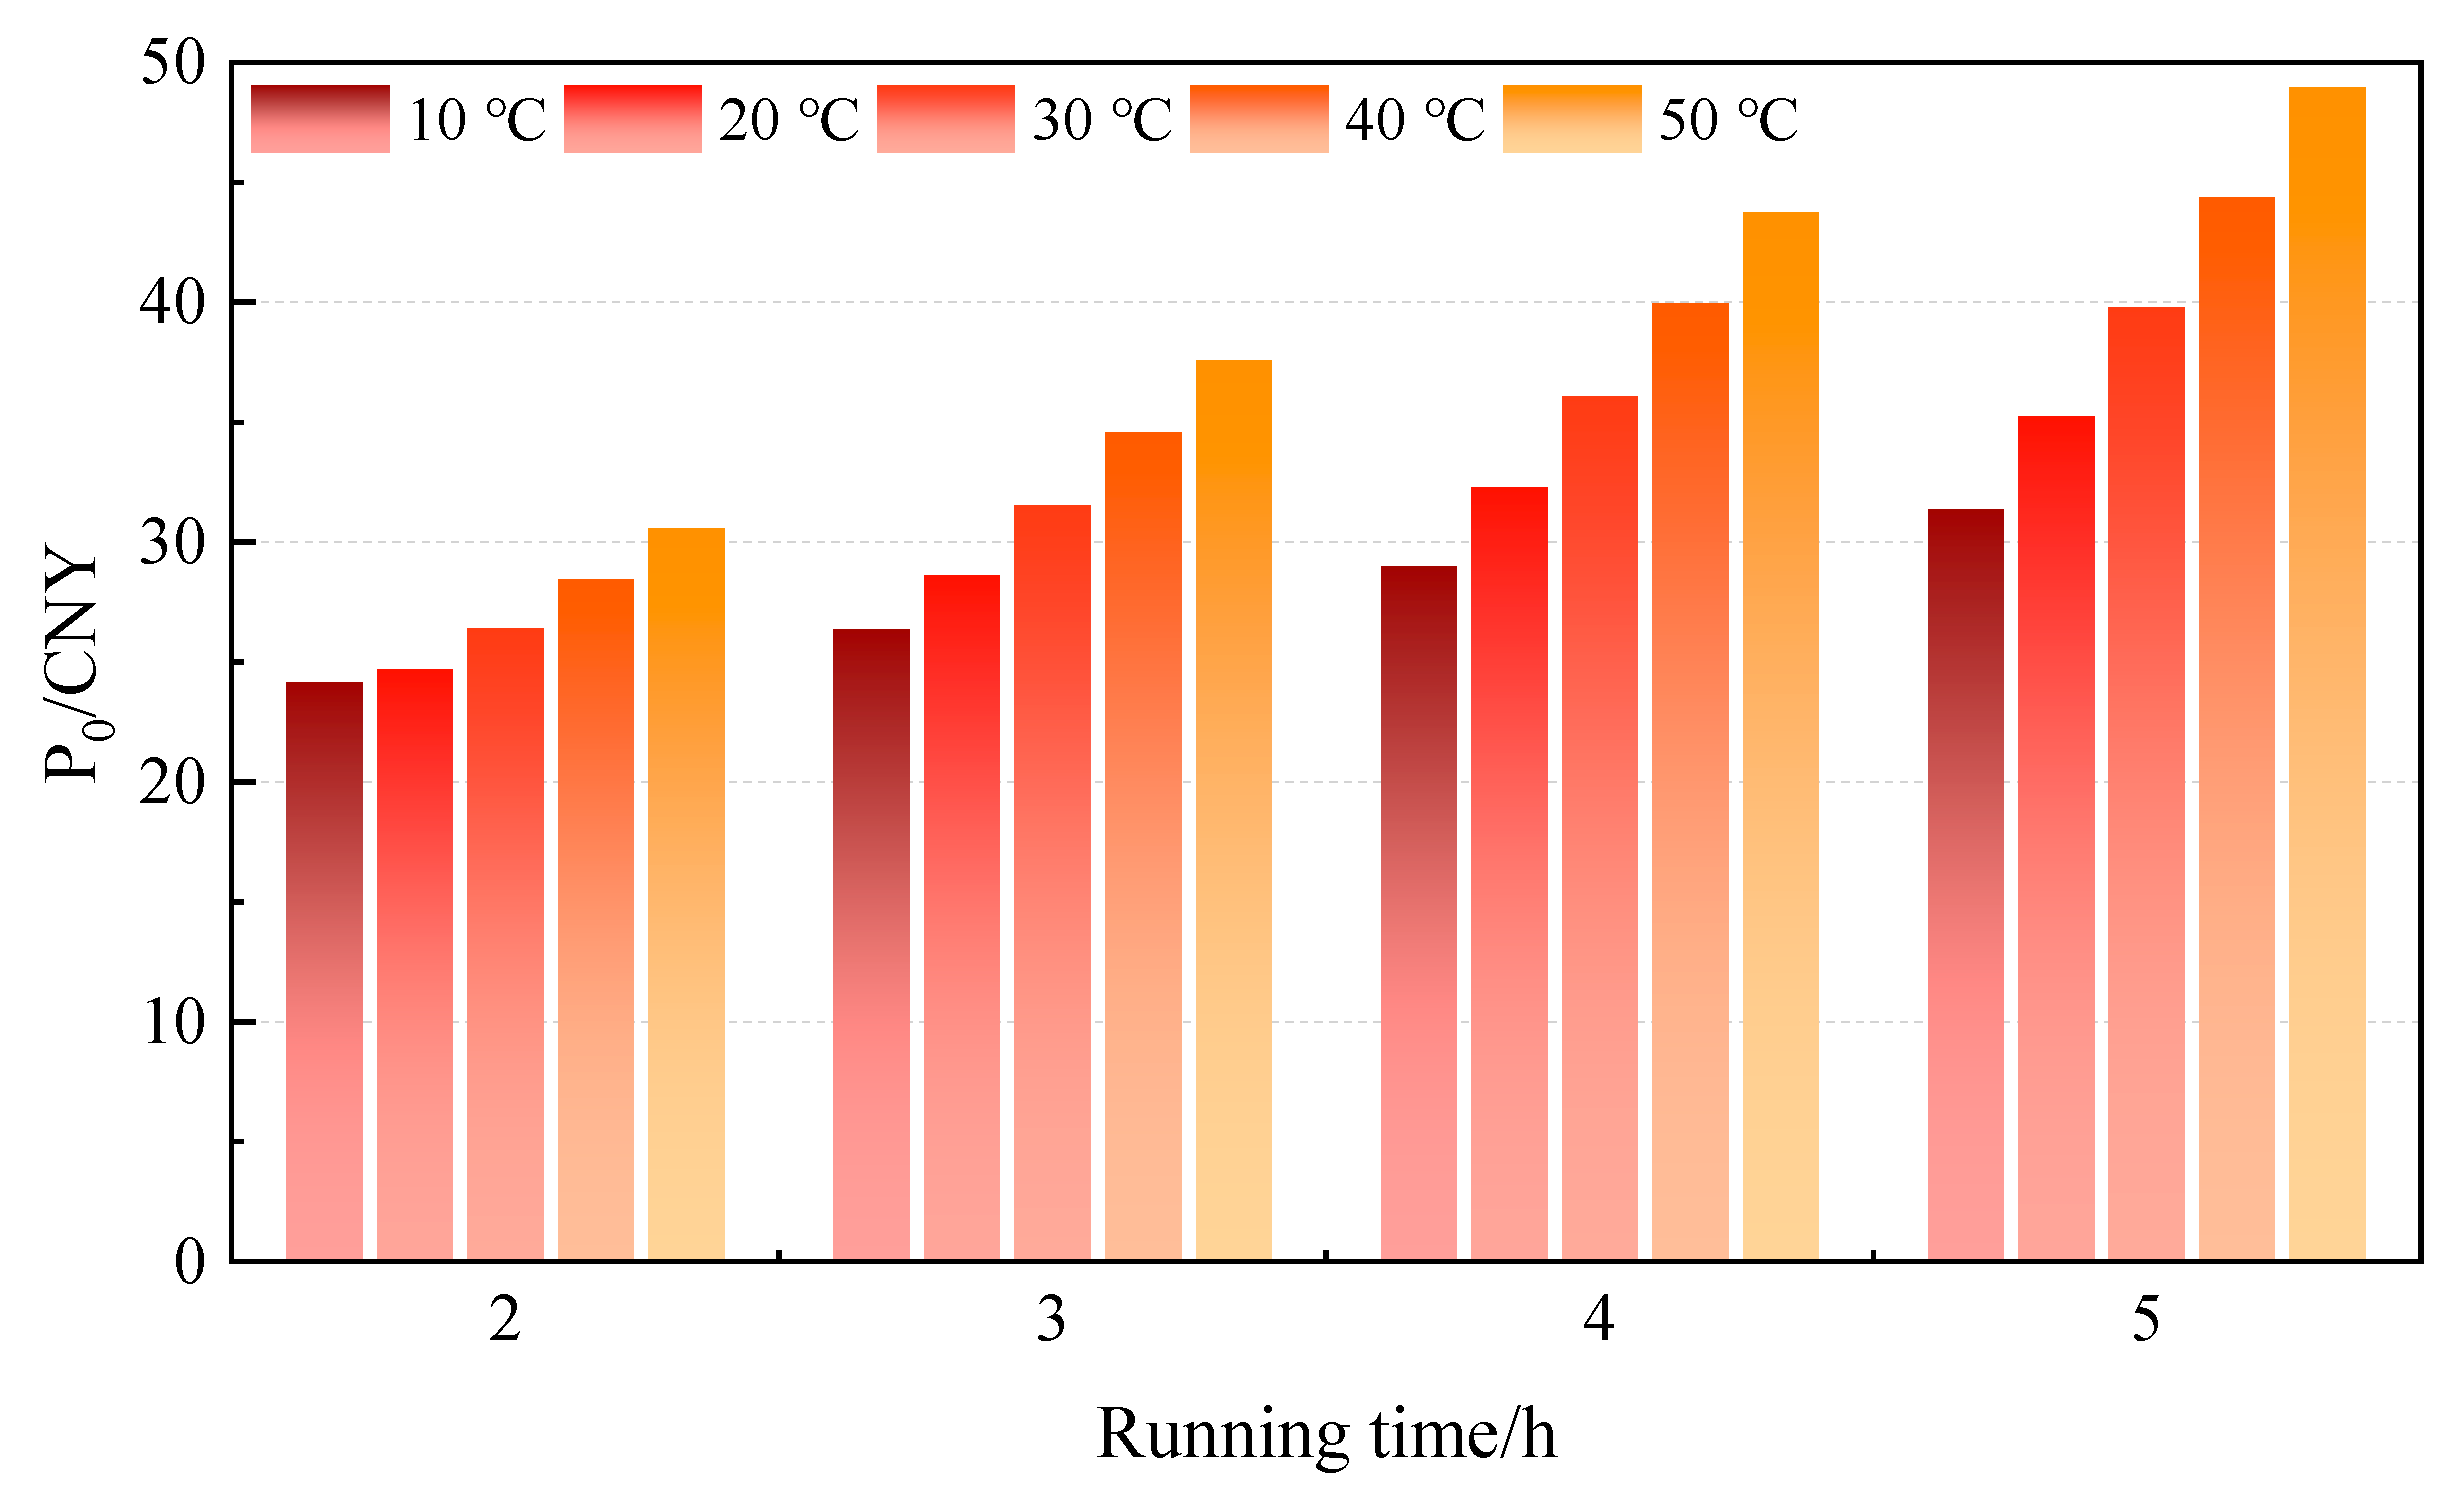
3.3.2. Electric Tracer Pipes

Figure 11 shows the economic thickness of the DN100 electric heating tracing glass wool pipe when the average drilling fluid temperature is 10 °C, 20 °C, 30 °C, 40 °C, and 50 °C, respectively. Similar to the relationship between the economic thickness of insulation pipes and the average temperature of drilling fluid, the average temperature of drilling fluid has an important influence on the economic thickness of electric tracing pipes, and the economic thickness of electric tracing pipes increases with the increase in the average temperature of drilling fluid. Taking the running time of 3600 h as an example, when the average drilling fluid temperature increased from 10 °C to 50 °C, the economic thickness of the electric heating tracing pipe increased from 6.54 cm to 11.06 cm, by 69.11%. After the average drilling fluid temperature increases, the heat loss cost of the insulation layer of the electric tracing pipe increases, resulting in an increase in its economic thickness.
When the average temperature of drilling fluid is 10 °C, 20 °C, 30 °C, 40 °C, and 50 °C, respectively, the cost of the insulation layer of the DN100 electric heating tracing glass wool pipe per unit length is shown in Figure 12. After the average temperature of the drilling fluid increases, the temperature difference between the drilling fluid and the external environment gradually increases and the cost of heat dissipation increases, thus increasing the total cost of the thermal insulation layer. Meanwhile, it can be seen from the above research that the increase in the average temperature of drilling fluid also increases the economic thickness of the pipeline, resulting in an increase in the initial investment cost of the thermal insulation layer and the cost of heat dissipation loss, thus increasing the total cost. When the drilling fluid temperature increases from 10 °C to 50 °C, respectively, the total cost of insulation per unit length increases by CNY 3.88 (12.37%), CNY 8.43 (26.87%), CNY 13.05 (41.60%), and CNY 17.60 (56.10%).

4. Conclusions

This study introduces an economic optimization model for thermal insulation layers tailored for both traditional thermal insulation and electric tracing pipelines, specifically designed for drilling operations. Our comprehensive analysis underscores the profound influence of pipe diameter, running time, insulation material, and drilling fluid temperature on the economic thickness of insulation layers, providing critical guidelines for the development of cost-effective and efficient insulation systems under a variety of operational conditions.
(1)
The data reveal that both the pipe diameter and the running time substantially affect the economic thickness of the insulation. Notably, when operating for 3600 h with drilling fluid temperatures between 10 °C and 50 °C, the economic thickness per unit length of the insulation layer increases dramatically by 97.77% from 1.79 cm.
(2)
The thermal conductivity of the insulation material and the temperature of the drilling fluid are pivotal in determining the economic thickness. High values of these parameters necessitate increased insulation thickness to maintain efficiency. The optimal design thickness should, therefore, be established based on the maximum allowable heat loss to ensure operational efficiency.
(3)
Similar trends observed in thermal insulation pipelines are evident in electric tracing pipelines, where the economic thickness escalates with increases in pipe diameter, running time, insulation material, and fluid temperature. Additionally, the economic thickness of electric tracing pipelines surpasses that of non-electric tracing pipelines, leading to higher costs per unit length in the electric tracing systems.
(4)
For a pipeline with a running time of 3600 h using DN100 rock wool insulation, the total cost per unit length for the electric tracing pipeline is notably higher, by CNY 19.72, than that for the non-electric tracing pipeline.
(5)
The findings from this study highlight the critical need to tailor insulation designs to the specific operational conditions and environmental requirements of drilling sites. Future research should focus on exploring new materials and advanced technologies to further enhance the cost-effectiveness and thermal efficiency of insulation systems in such challenging environments.

Author Contributions

M.X.: conceptualization, methodology, investigation, data curation, writing—original draft preparation; R.Y.: methodology, software, writing—reviewing and editing; M.G.: visualization, investigation, writing—reviewing and editing; K.W.: supervision, writing—reviewing and editing; Z.Y.: software, investigation. All authors have read and agreed to the published version of the manuscript.

Funding

The financial support for this paper was provided by the Heilongjiang Province’s Key Research and Development Project (2023ZXJ06A04) and the Heilongjiang Province “Double First-Class” Discipline Collaborative Innovation Achievement Project (LJGXCG2023-108).

Data Availability Statement

The original contributions presented in this study are included in the article; further inquiries can be directed to the corresponding authors.

Acknowledgments

The authors thank the editors and anonymous reviewers for their help in revising and improving the article.

Conflicts of Interest

The authors declare that they have no known competing financial interests or personal relationships that could have appeared to influence the work reported in this paper.

References

  1. Wang, D. Heat loss along the pipeline and its control measures. SN Appl. Sci. 2023, 5, 2. [Google Scholar] [CrossRef]
  2. Guan, Z.; Qin, M.; Wang, H.; Xia, Y.; Zhang, Y.; Jiang, Y. Thermal insulation and underlayer corrosion in petroleum and petrochemical industries. Mater. Prot. 2022, 55, 154–163. (In Chinese) [Google Scholar]
  3. De Rosa, M.; Bianco, V. Optimal insulation layer for heated water pipes under technical, economic and carbon emission constraints. Energy 2023, 270, 126961. [Google Scholar] [CrossRef]
  4. Liu, H.; Bai, L.; Guo, Y. Sensitivity analysis of factors affecting heat loss in horizontal direct buried heating pipeline. J. Jilin Jianzhu Univ. 2020, 37, 41–48. [Google Scholar]
  5. Yan, Q.; Meng, Z.; Luo, J.; Wu, Z. Experimental study on improving the properties of rock wool and glass wool by silica aerogel. Energy Build. 2021, 247, 111146. [Google Scholar] [CrossRef]
  6. Zheng, Q.; Wang, W. Calcium silicate based high efficiency thermal insulation. Br. Ceram. Trans. 2000, 99, 187–190. [Google Scholar] [CrossRef]
  7. Zhong, S. Study on Thermal Insulation and Heat Dissipation Performance of Thermal Steam Pipeline and Its Influence on Economy. Ph.D. Thesis, Zhejiang University, Hangzhou, China, 2019. [Google Scholar]
  8. Bahadori, A. Chapter Three—Material Selection for Thermal Insulation. In Thermal Insulation Handbook for the Oil, Gas, and Petrochemical Industries; Gulf Professional Publishing: Houston, TX, USA, 2014; pp. 239–301. [Google Scholar]
  9. Lee, L.; Ingenhoven, P.; Saw, W.L.; Nathan, G.J.G. The techno-economics of transmitting heat at high temperatures in insulated pipes over large distances. Appl. Energy 2024, 358, 122634. [Google Scholar] [CrossRef]
  10. Balzamova, E.Y.; Balzamov, D.S.; Bronskaya, V.V.; Minnegalieva, C.B.; Khairullina, L.E.; Khabibullina, G.Z.; Ignashina, T.V.; Kharitonova, O.S. Analysis of the issue of the selection, operation and improvement of thermal insulation materials for pipelines of heating networks. J. Phys. Conf. Ser. 2021, 2094, 052028. [Google Scholar] [CrossRef]
  11. Daşdemir, A.; Ertürk, M.; Keçebaş, A.; Demircan, C. Effects of air gap on insulation thickness and life cycle costs for different pipe diameters in pipeline. Energy 2017, 122, 492–504. [Google Scholar] [CrossRef]
  12. Zhou, T.; Gao, J.; Sun, Z.; Li, J.; Zhang, J. Application of aerogel felt in pipeline insulation. Petrochem. Des. 2019, 36, 64–66+8. [Google Scholar]
  13. Wu, J.; Wang, H.; Gu, J. Study on thermal insulation structure characteristics of new prefabricated overhead thermal insulation pipeline. Dist. Heat. 2019, 40, 140–144. [Google Scholar]
  14. Wang, Y.P.; Tu, Z.T.; Yuan, L.Y. Analysis of thermal energy storage optimization of thermal insulation material and thermal insulation structure of steam pipeline. Therm. Sci. 2020, 24, 3249–3257. [Google Scholar] [CrossRef]
  15. Wu, R.; Zhang, Y.; Shen, J. Analysis of Influencing factors on thermal insulation Performance of Multi-layer Reflection Structure of Pipeline. Pipeline Technol. Equip. 2022, 2, 24–27. [Google Scholar]
  16. Shammazov, I.; Karyakina, E. The LNG Flow Simulation in Stationary Conditions through a Pipeline with Various Types of Insulating Coating. Fluids 2023, 8, 68. [Google Scholar] [CrossRef]
  17. Zhang, L. Fault analysis and Main points of on-site supervision and inspection of thermal insulation of electric trace in oil and gas field pipelines. China Pet. Chem. Stand. Qual. 2021, 41, 43–44. [Google Scholar]
  18. Hong, Z.; Zhong, F.; Yang, C. Design and Selection of thermal insulation and electric tracing for tower solar thermal power station system. Turbine Technol. 2023, 65, 262–264. [Google Scholar]
  19. Yang, R.S.; Xu, D.; Duan, C.; Ge, Y.Y.; Zhang, M.R. Calculation and Analysis on Thermodynamics Calculation of Nature-Gas Pipelines with Electric Heat Tracing. Appl. Mech. Mater. 2013, 2715, 91–96. [Google Scholar] [CrossRef]
  20. Lardear, J.L. Control of self-regulating heating cable for use in pipeline heating applications. IEEE Trans. Ind. Appl. 1991, 27, 1156–1161. [Google Scholar] [CrossRef]
  21. Wang, Z.; Liang, J.; Wang, M. Engineering design of oil recovery and transportation with electric heat tracing. J. Univ. Pet. China Nat. Sci. Ed. 1998, 22, 38–40+115. [Google Scholar]
  22. Li, Y.F.; Chow, W.K. Optimum insulation-thickness for thermal and freezing protection. Appl. Energy 2005, 80, 23–33. [Google Scholar] [CrossRef]
  23. Ma, D.; Gao, B. Selection and design of electric heat tracing. Shandong Chem. Ind. 2014, 43, 113–117. [Google Scholar]
  24. Luo, H. Design and application of electric heat tracing in petrochemical instruments and pipelines. Chem. Autom. Instrum. 2022, 49, 538–541+551. [Google Scholar]
  25. Yu, J.H.; An, C.; Tang, Q.S.; Zhang, J.X.; Zhang, Y. Heat transfer characteristics of subsea long-distance pipeline subject to direct electrical heating. Geoenergy Sci. Eng. 2024, 234, 212679. [Google Scholar] [CrossRef]
  26. Li, X. Research on Thickness Optimization and Economy of Thermal Insulation Layer of Direct-Buried Steam Pipeline. Master’s Thesis, Yanshan University, Qinhuangdao, China, 2021. [Google Scholar]
  27. Ai, Z. Research on Optimal Design of Pipeline Insulation Structure. Master’s Thesis, Changsha University of Science and Technology, Changsha, China, 2010. [Google Scholar]
  28. Guo, Z.; Mo, G.; Zhang, T.; Yue, M.; Liu, Z.; Li, C.; Zhang, X. Thickness design of thermal insulation layer for long-distance overground oil pipeline. J. Yangtze Univ. Nat. Sci. Ed. 2021, 18, 90–97. [Google Scholar]
  29. Li, S.; Liu, B.; Qi, J.; Liu, L.; Li, Q. Design of insulation layer thickness for overhead high temperature oil pipeline. Contemp. Chem. Ind. 2011, 40, 97–99. [Google Scholar]
  30. Luo, S. Discussion on the influence of heat insulation and insulation on the operation of pipelines in petrochemical enterprises. Guangdong Chem. Ind. 2018, 45, 178–179. [Google Scholar]
  31. Açıkkalp, E.; Yerel Kandemir, S. Optimum insulation thickness of the piping system with combined economic and environmental method. Energy Sources Part A Recovery Util. Environ. Eff. 2018, 40, 2876–2885. [Google Scholar] [CrossRef]
  32. Fan, S.H.; Chang, M.L.; Wang, S.X.; Quan, Q.; Wang, Y.; Li, D. Study on the Economic Insulation Thickness of the Buried Hot Oil Pipelines Based on Environment Factors. Comput. Model. Eng. Sci. 2020, 124, 45–59. [Google Scholar] [CrossRef]
  33. Salem, E.A.; Khalil, M.F.; Sanhoury, A.S. Optimization of insulation thickness and emissions rate reduction during pipeline carrying hot oil. Alex. Eng. J. 2021, 60, 3429–3443. [Google Scholar] [CrossRef]
  34. Li, F.; Jie, P.F.; Fang, Z.; Wen, Z.M. Determining the optimum economic insulation thickness of double pipes buried in the soil for district heating systems. Front. Energy 2020, 15, 170–185. [Google Scholar] [CrossRef]
  35. Zhang, T.H.; Li, A.Q.; Hari, Q.; Li, X.P.; Rao, Y.D.; Tan, H.Y.; Du, S.H.; Zhao, Q.X. Economic thickness and life cycle cost analysis of insulating layer for the urban district steam heating pipe. Case Stud. Therm. Eng. 2022, 34, 102058. [Google Scholar] [CrossRef]
  36. Li, P.; Ge, S.; Abudukelmu Paerhat, T.; Manhong, L.D. Influence of thermal parameters of heavy oil surface steam pipeline and optimization of thermal insulation thickness. Therm. Sci. Technol. 2022, 21, 144–150. [Google Scholar]
  37. Zhang, L.Y.; Zhang, Q.Z.; Yang, X.H.; Hooman, K. Thermo-Economic Assessment on Insulation Conditions of the Buried Heating Pipeline for District Heating. Heat Transf. Eng. 2023, 44, 1140–1156. [Google Scholar] [CrossRef]
  38. GB 50264-2013; Design Code for Thermal Insulation Engineering of Industrial Equipment and Pipelines. China Planning Publishing House: Beijing, China, 2013.
Figure 1. C++ and Fluent Validation Results.
Processes 12 01506 g001
Figure 2. Economic thickness of insulation under different pipe types: (a) rock wool and (b) glass wool.
Processes 12 01506 g002
Figure 3. Insulation layer thickness under the maximum allowable heat losses of DN40 and DN50 rock wool and glass wool pipes.
Processes 12 01506 g003
Figure 4. Total cost of insulation thickness per unit length of different pipeline models: (a) rock wool and (b) glass wool.
Processes 12 01506 g004
Figure 5. Differences in the total cost of two kinds of pipe insulation.
Processes 12 01506 g005
Figure 6. Economic thickness of the insulation of the power-off tracing pipes of different pipeline models: (a) rock wool and (b) glass wool.
Processes 12 01506 g006
Figure 7. Total cost of the insulation layer thickness of the power-off tracing pipes for different pipe types: (a) rock wool and (b) glass wool.
Processes 12 01506 g007
Figure 8. Difference in the total cost of the insulation layer thickness of two kinds of electric heating tracing pipe.
Processes 12 01506 g008
Figure 9. Economic thickness of insulation layer at different average drilling fluid temperatures.
Processes 12 01506 g009
Figure 10. Total cost per unit length of insulation layer thickness under different average drilling fluid temperatures.
Processes 12 01506 g010
Figure 11. Economic thickness of electric heating tracing pipe with different average drilling fluid temperatures.
Processes 12 01506 g011
Figure 12. Total cost of the insulation layer of electric tracing pipelines under different average drilling fluid temperatures.
Processes 12 01506 g012
Table 1. Thermal performance investigation of various thermal insulation materials.
StudyFocusMaterial(s) UsedOverall
Thermal
Resistance (m2·K/W)
Thermal
Conductivity
(W/m·K)
Overall
Thickness (mm)
Findings
Daşdemir et al. [11]Effect of air gapVarious1.50.04100Air gap in large-diameter pipes significantly impacts insulation thickness.
Zhou et al. [12]Composite insulation structureAerogel, traditional2.00.01850Proposed composite insulation structure with aerogel coupled with traditional materials.
Wu et al. [13]Insulation material comparisonSoft
(glass wool, etc.)
1.80.03480Summarized advantages and proposed new overhead insulation pipeline structure.
Wang et al. [14]Stability of insulationAerogel, gel2.50.0260Recommended using 10 mm aerogel for inner layer and 50 mm gel for outer layer.
Wu et al. [15]Reflective insulationReflective screens2.20.02270Designed multi-layer reflective heat insulation structure for pipelines.
Shammazov et al. [16]Insulation coatingPU foam2.10.02565Found that PU foam insulation could increase fluid temperature by 0.61 K.
Table 2. Heat loss under economic thickness of rock wool pipe with different pipe diameters.
Running Time/hHeat Loss of Economic Thickness of Different Pipe Diameters/W/m2
DN40DN50DN65DN80DN100
144081.06 73.09 65.66 60.85 55.07
216065.97 60.33 53.92 50.42 45.86
288055.51 50.29 45.67 42.79 39.04
360047.49 43.24 39.47 36.87 33.67
Table 3. Heat loss under economic thickness of glass wool pipe with different pipe diameters.
Running Time/hHeat Loss of Economic Thickness of Different Pipe Diameters/W/m2
DN40DN50DN65DN80DN100
144084.02 75.38 67.51 62.81 56.74
216067.87 61.45 55.67 51.61 46.96
288057.07 51.98 47.43 43.87 40.06
360049.02 44.58 40.46 37.77 34.53
Table 4. Heat loss of economic thickness of glass wool pipe at different average drilling fluid temperatures.
Running Time/hAverage Drilling Fluid Temperatures/°C
1020304050
144045.43 56.74 65.80 73.09 79.54
216038.71 46.96 53.52 59.21 64.19
288033.13 40.06 45.56 50.21 54.54
360028.18 34.39 39.56 43.50 47.32
Disclaimer/Publisher’s Note: The statements, opinions and data contained in all publications are solely those of the individual author(s) and contributor(s) and not of MDPI and/or the editor(s). MDPI and/or the editor(s) disclaim responsibility for any injury to people or property resulting from any ideas, methods, instructions or products referred to in the content.

