Article

Cloning, Expression and Enzymatic Characterization of Pectin Methyl Esterase from Populus trichocarpa and Its Application

1
Key Laboratory of Medicinal and Edible Plants Resources Development of Sichuan Education Department, School of Pharmacy, Chengdu University, Chengdu 610106, China
2
School of Life Science, Leshan Normal University, Leshan 614000, China
3
State Key Laboratory of Tree Genetics and Breeding, Chinese Academy of Forestry, Beijing 100091, China
*
Authors to whom correspondence should be addressed.
Processes 2024, 12(7), 1511; https://doi.org/10.3390/pr12071511
Submission received: 25 June 2024 / Revised: 12 July 2024 / Accepted: 14 July 2024 / Published: 18 July 2024
(This article belongs to the Section Catalysis Enhanced Processes)

Abstract

:
The pectin methyl esterase gene from Populus trichocarpa (PtPME) was successfully cloned through PCR amplification and subsequently inserted into the expressing vector pMAL-c5e for successful expression in Escherichia coli BL21 (DE3). Initially, we determined the primary enzymatic properties of PtPME, a pectin methyl esterase derived from Populus trichocarpa. Notably, this enzyme exhibits a higher affinity towards citrus pectin, with an esterification degree exceeding 60%. Furthermore, this enzyme’s optimal reaction temperature and pH were found to be 30 °C and 8, respectively. Importantly, its exceptional stability under neutral conditions highlights its potential application in the industrial production of low-ester pectin.

1. Introduction

Due to its gel properties and thickening and stabilizing effects, pectin has gained extensive utilization in food processing and production with the rapid progress and development of technology since the 20th century [1,2]. Pectin, a type of complex cell wall polysaccharide, comprises homogalacturonan (HG), rhamnogalacturonan-I (RG-I), and rhamnogalacturonan-II (RG-II) [3]. It is present in the primary cell walls of plant tissues and forms these walls along with cellulose and hemicellulose. Homogalacturonan (HG), a linear polymer composed of α-1,4-linked-D-galacturonic acid, is the backbone for various pectins that exhibit distinct sidechains decorating the galacturonic acid structure [4]. Regarding solubility, pectin is present in plant tissues in three distinct forms: protopectin, pectic acid, and water-soluble pectin. These variations arise from differences in the number and positioning of methoxyl groups [3]. The esterification reactions take place at the C-6 carboxyl group of the pectin backbone, and the degree of esterification (DE value) represents the molar ratio between methyl esterified galacturonic acid residues at C-6 and the total galacturonic acid content. Following regulations outlined in the Food Chemicals Codex (FCC), a DE value exceeding 50% defines high-methoxyl pectin (HMP), while lower values correspond to low-methoxyl pectin (LMP) [5].
Pectinases, responsible for the enzymatic degradation of pectin, exhibit remarkable diversity due to the intricate complexity of their substrate [6]. These enzymes are widely distributed among various organisms, including yeast, bacteria, fungi, plants, and insects. Notably, bacterial sources contribute to approximately 35% of pectinase production, fungi and yeast account for 55%, and plant or animal sources represent a mere 15% [7]. Compared to pectinases derived from microorganisms, the isolation and purification of pectinases obtained from animals and plants present challenges due to the potential coexistence of other proteases and inhibitors, limited yield, and prolonged processing time. Therefore, further advancements and investigations are warranted.
Based on the distinct catalytic effects of pectinase on its substrate, pectinases can be categorized into three groups: pro-pectinase, depolymerase (including hydrolase and transaminase), and pectinesterase. The first type of pro-pectinases is typically found in unripe fruits and catalyzes the conversion of insoluble pro-pectinases into soluble pectin forms. The second class of depolymerases comprises hydrolases and lyases, with the former being further categorized into polygalacturonase (PG) and polymethylgalacturonase (PMG), both acting on α-1,4 glycosidic bonds. This enzymatic action results in the generation of polygalacturonic acid and polymethylgalacturonic acid. Pectin aminotransferases include polygalacturonate lyase (PGL) and polymethyl galacturonatelyase (PMGL), which cleave alpha-1,4-glucosidic bonds through a transfer reaction to produce unsaturated galacturonic acid. The third type is pectin esterase (PE), also referred to as pectin methyl esterase, which functions as a carboxylate esterase that acts on the methyl ester group of the pectin galactose main chain, leading to de-esterification and resulting in the production of pectin acid and methanol. Subsequently, this product undergoes further catalysis by PG and lyase [8]. A multigene family encodes pectin methyl esterase (PME) and plays crucial roles in seed germination, fruit ripening, and stress response [9].
HMP can undergo de-esterification through acid, amide, and enzymatic methods to yield LMP. The pectin esterase isolated from Aspergillus juponicus via DEAE cellulose column chromatography has been demonstrated to efficiently convert high methoxy pectin into low methoxy pectin, resulting in the formation of a robust gel upon the combination with calcium ions. Optimal gel strength is achieved at a methoxy content of 6.3%, a calcium concentration of 41.8 mg/g pectin, and a pH value of 3.5 [2,10].
However, to our knowledge, limited research has been conducted on the enzymatic properties of pectin methylase derived from Populus trichocarpa. In this study, we amplified a pectin methylase gene (PtPME, Potri.004G128820) from Populus trichocarpa cDNA and purified the PtPME protein using recombinant protein expression technology. Our investigation focused on characterizing its enzymatic properties, providing a novel avenue for large-scale low-ester pectin production through domestic and international enzymatic means.

2. Materials and Methods

2.1. Strains, Plasmids and Reagents

The cloned strain Trans-T1 and the expression strain Escherichia coli BL21 (DE3) were purchased from Quanshi Jin Biotechnology Co., Ltd. (Shanghai, China). The pMAL-c5e expression plasmid was procured from New England Biolabs (Ipswich, MA, USA). Ex-Taq DNA polymerase, pEASY-T3 Cloning Kit, restriction endonucleases NdeI-HF, Not I-HF, T4 DNA ligase were purchased from TransGen Biotech (Beijing, China); Gold Mix, DNA Marker, Plasmid Extraction Kit, DNA Gel Recovery Kit were obtained from Kingtech Biotechnology Co., Ltd. (Chengdu, China). SDS-PAGE gel kit, protein molecular quality standard was purchased from Zoman Biotechnology Co., Ltd. (Beijing, China). Chemical reagents such as glucose, peptone, sodium chloride, yeast extract, disodium hydrogen phosphate, Tris, IPTG, ampicillin, kanamycin were purchased from Sangon Biotech (Shanghai, China). Affinity chromatographic packing: Amylose Resin High-Flow were purchased from NEW ENGLAND Biolabs, Beijing,China.

2.2. Molecular Cloning

The Phytozome v13 database (Populus trichocarpa v4.1 Genome) was searched using the Blast search program (https://phytozome-next.jgi.doe.gov/blast-search, accessed on 20 December 2022) with Arabidopsis thaliana pectin methylesterase 31 protein (Gen Locus: AT3G29090) as the query sequence. A highly similar sequence, Potri.004G128820, was identified. CDD program (https://www.ncbi.nlm.nih.gov/Structure/cdd/wrpsb.cgi, accessed on 20 December 2022) revealed the domain structure of the pectinesterase superfamily, and the gene could encode methyl pectin enzyme protein. Based on Potri.004g128820 cDNA sequence, Primer 5.0 software was used to design a pair of primers (PtPME-EX1:5′-ACATATGATGGCTAGTCGAGTGGTG-3′, PtPME-EX2: 5′-TGCG GCCGCCTATGCGGAGTATGGAAT-3′, NdeⅠ and NotⅠ) to amplify the coding region. Total RNA was isolated from mixed tissues (leaves, buds, stems, and phloem) of Populus trichocarpa using the RNAprep Pure Plant Kit (DP441, TIANGEN, Beijing, China). The first cDNA was synthesized with the PrimeScript 1st strand cDNA Synthesis Kit (TaKaRa, Dalian, China), and PCR was performed in a volume of 50 μL containing about 1 μL of the first strand cDNA, GoldenStarR T6 Super PCR Mix (TSINGKE, Chengdu, China) 45 μL, with 10 pmol per primer (PtPME-EX1 and PtPME-EX2). The PCR conditions were optimized as follows: initial denaturation at 98 °C for 5 min, followed by cycling at 98 °C for 20 s, then annealing at 55 °C for 40 s and extension at 72 °C for 60 s for 35 cycles; finally extended at 72 °C for 5 min. TIANgel Midi Purification Kit DP209 (TIANGEN, Beijing, China) was used to recover the PCR product (about 951 bp) from the agarose gel and cloned it into the pEASY-T3 vector (TransGen Biotech, Beijing, China) and sequenced in both directions. The resulting pEASY-T3 vector containing the PtPME gene was named pEASY-T3/PtPME.

2.3. Sequence Analysis

The BLAST program (http://www.ncbi.nlm.nih.gov/BLAST/, accessed on 20 December 2022) was employed for sequence alignment. The SignalP-5.0 server (https://services.healthtech.dtu.dk/services/SignalP-5.0/, accessed on 20 December 2022) was utilized to predict the signal peptide. Compute pI/Mw tool (http://web.expasy.org/compute_pi/, accessed on 20 December 2022) was employed to predict mature proteins’ amino acid sequence, isoelectric point, and theoretical molecular weight. The protein sequence was subjected to a domain analysis of the membrane structure using TMHMM-2.0 (https://services.healthtech.dtu.dk/service.phpTMHMM-2.0, accessed on 20 December 2022) for PtPME. Protein sequence secondary structure prediction was performed using SOPMA (http://www.ibcp.fr/predict.html, accessed on 20 December 2022). The protein sequence of PtPME was aligned with other PME using the ClustalX v2 software (European Bioinformatics Institute, Cambridgeshire, UK) [11], followed by manual adjustment using BioEdit v7.2 [12]. Sequence divergence and phylogenetic analysis were conducted using MEGA 11 [13]. The genetic relationships between PtPME and other PME were established through the neighbor-joining (NJ) phylogenetic tree reconstruction method, employing 1000 bootstrap replicates in MEGA 11.

2.4. Expression and Purification of Recombinant PtPME

The pMAL-c5e vector was utilized for the expression of the PtPME protein. The pEASY-T3/PtPME plasmid was digested with NdeI and NotI, and the resulting fragment was isolated and inserted into the NdeI and NotI sites of the pMAL-c5e vector to ensure proper reading frame alignment. Subsequently, E. coli BL21 cells were transformed with these constructed plasmids. Colonies containing appropriate inserts were identified through sequencing analysis. E. coli BL21 cells were then transformed with the pMAL-c5e/PtPME plasmid and cultured overnight, followed by a 1:100 dilution and cultivation at 16 °C until reaching an optical density (A600) of 0.6. Isopropyl β-D-thiogalactoside (IPTG) was added to achieve a final concentration of 0.3 mM in the medium, which was further incubated for 20 h at 16 °C. After centrifugation at 5000× g for 3 min at 4 °C, the bacteria were resuspended in binding buffer (20 mmol/L Tris-HCl, 200 mmol/L NaCl, 1 mmol/L EDTA, pH 7.4) and sonicated on ice using an ultrasonic crusher. The resulting cell homogenate was centrifuged at 10,000× g for 10 min at 4 °C. Subsequently, the entire bacterial solution and its supernatant and precipitate were analyzed using SDS-PAGE. The remaining supernatant was loaded onto a column packed with Amylose Resin High-Flow (NEW ENGLAND Biolabs, Beijing, China), pre-equilibrated with a binding buffer. The overexpressed proteins bound to the Amylose Resin High-Flow column were eluted using elution buffer (20 mM Tris-HCl, 1 mM EDTA, 10 mM maltose, pH 7.4). Finally, purified recombinant proteins were desalted in a Millipore protein concentrate tube (MerckMillipore, Darmstadt, Germany) containing a buffer of pH 7.4 composed of Tris-HCl (20 mM).

2.5. Enzyme Activity Assay of Recombinant PtPME

The PME activity was assessed by quantifying methanol production, one of the PME process’s reaction products. Subsequently, methanol reacted with formaldehyde generated by ethanol oxidase, and its activity was determined using quantitative colorimetry. In comparison to alternative detection methods, this approach exhibits enhanced sensitivity [14]. The enzyme activity of PtPME was determined by the improved Deytieux Belleau C method [15,16]. The specific steps are as follows: The reaction tube was supplemented with 308 μL of 0.2 M phosphate buffer (pH 8.0), 80 μL of an 8 mg/mL substrate solution, 4 μL of ethanol oxidase, and 8 μL of recombinant PtPME solution followed by thorough mixing. The resulting reaction mixture was incubated at a temperature of 30 °C for 30 min to allow PtPME to catalyze the de-esterification process, converting high-ester pectin into methanol, which was subsequently oxidized to formaldehyde by ethanol oxidase. After completion of the reaction, Nash reagent containing ammonium acetate, acetylacetone and acetic acid was added and allowed to react further at a temperature of 65 °C for 15 min. The absorbance at wavelength λ = 412 nm was measured using boiling inactivated recombinant enzyme solution as a reference within the same reaction system. One unit (U) of PME activity corresponded to the amount of enzyme capable of releasing one micromole (1 μmol) of methanol per minute. A BCA protein rapid assay kit detected the protein concentration.

2.6. Biochemical Characterization of the Purified Recombinant PtPME

The substrate specificity of PtPME for high-ester pectin and low-ester pectin was determined using the abovementioned method. The effect of temperature on PtPME activity was assessed at various temperatures (10, 20, 30, 40, 50, and 60 °C) following the described methodology. The dependence of PtPME activity on pH was investigated across a range of pH levels (pH 3.0 to 10.0) while maintaining the optimal reaction temperature. The thermal stability of PtPME was evaluated by incubating the enzyme at intervals of 10 °C from 10 °C to 60 °C for durations ranging from one to five hours. pH stability was determined by subjecting the enzyme-containing buffer to different pH levels (pH 3.0 to 10.0) for one to five hours before assessing PtPME activity using the abovementioned method at the optimum temperature.
The metal ions Ni2+, Mn2+, K+, Mg2+, Ca2+, Ba2+, and Cu2+, as well as the chemical reagents EDTA, SDS, DTT, and urea, were added to the reaction system at final concentrations of 1 mmol/L and 5 mmol/L, respectively. This was performed to investigate these additives’ impact on enzyme activity. The enzyme activity without any additives served as a baseline (100%), and under optimal reaction conditions, the relative enzyme activity of pectin methyl esterase was determined.
The enzyme kinetic parameters of PtPME were determined at various concentrations of high-ester pectin solution under optimal reaction conditions. The Lineweaver–Burk double inverse method was used to plot the enzyme kinetic parameters, with the inverse of substrate concentration as the horizontal coordinate and the inverse of enzyme activity as the vertical coordinate. By determining the intersection with the coordinate axes, where −1/Km represents horizontal axis intercept and 1/Vmax represents vertical axis intercept, Km and maximum reaction rate Vmax of PtPME were calculated.

2.7. Orthogonal Experiments

The effect on enzyme activity was further investigated to determine the optimal combination of levels by considering pH, reaction temperature, and pectin concentration as three variables based on single-factor experiments. The experiment followed an L9 (33) orthogonal table design with three levels for each factor. The details of the orthogonal experimental table are presented in Table 1.

2.8. Determination of Esterification Degree

The esterification was determined using the NaOH method, following the procedure described by Chaiwarit, T. et al. with some modifications [17]. A 0.05 g sample of high-ester pectin (Apple source, esterification degree greater than 60%) was weighed and placed in a 250 mL conical flask, followed by the addition of 20 mL of buffer solution (pH = 8, containing 0.2 mmol/L sodium dihydrogen phosphate and 0.2 mmol/L disodium hydrogen phosphate). The flask was sealed and gently swirled until complete dissolution (avoiding excessive agitation), after which high-ester pectin and PtPME (9.95 U/g) were reacted at 30 °C for 30 min to produce de-esterified pectin. Finally, three drops of phenolphthalein indicator (5 g/L) were added. The solution was titrated using a 0.1 mol/L NaOH solution until a faint pink hue emerged, and the volumes V0 and V1 of NaOH consumed for the blank and sample, respectively, were recorded to represent the initial degree of titration. Proceed by adding 20 mL of 0.5 mol/L NaOH, tightly sealing the container, and vigorously shaking it for 20 min to generate methylated pectin. Subsequently, approximately 60 mL of 0.5 mol/L HCl was added to the mixture, and the mixture was shaken thoroughly until the red color disappeared. Then, three drops of phenolphthalein indicator were added and titrated with 0.1 mol/L NaOH until a slight pink hue reappeared; this volume was recorded as V2. The degree of esterification (DE) can be calculated as follows:
DE = V 2 V 1 +   V 2 V 0   ×   100 %

2.9. Homology Modelling

The crystal structure data of (PDB:1gq8.1.A) pectin methylesterase from carrot were employed as the template, and the PtPME structure model was constructed using the SWISS-MODEL homology modelling approach. This identified structure served as a basis for generating the PtPME structure model. The three-dimensional structural image was generated utilizing the Swiss-PDB Viewer 4.0.4 software.

2.10. Molecular Docking

The protein structure of PtPME was modelled using SWISS-MODEL (https://swissmodel.expasy.org/). Four types of pectin substrate polysaccharides, namely HG, RGI, RGII, and XGA, were selected as ligands for docking simulations from the PubChem database. The minor structural units for these substrates were identified as follows: HG-unit (PubChem SID: 405237445), RG I-Unit (PubChem SID: 405236857), RG II-Unit (PubChem SID: 405235978), and XGA-unit (PubChem SID: 405236961). Additionally, two small-molecule pectin methyl esterase inhibitors—epigallocatechin gallate (EGCG) (PubChem SID: 65064) [18] and phenylephrine (PE) (PubChem CID: 6041) [19] were included as ligands (Figure 1) in the docking simulations using AutoDock v4.2.6 software(Center for Computational Structural Biology, La Jolla, CA, USA) with a Lamarck genetic algorithm and semi-empirical scoring function. The resulting docking outcomes were analyzed using PyMol v2.6 (Schrödinger Inc., San Diego, CA, USA) and Discovery Studio2.1 (BIOVIA, Omaha, NE, USA).

2.11. Statistical Analysis

The experimental results were expressed as the mean of three replicate determinations and standard deviation (SD). All statistical data analyses were performed using Excel 2021 (Microsoft, Redmond, WA, USA), Minitab v17.1 (Minitab LLC, State College, PA, USA), and GraphPad Prism 8 (GraphPad, Boston, MA, USA).

3. Results and Discussion

3.1. Cloning and Sequence Analysis of PtPME Gene

The PtPME cDNA fragment was amplified using the PtPME-EX1/PtPME-EX2 primers, as depicted in Figure 2. The PtPME cDNA comprises a 948 bp open reading frame (lacking a stop codon) that encodes a peptide of 316 residues with a predicted molecular weight (Mw) of 35.42 kDa and an isoelectric point pI of 6.31. The nucleic acid sequence of this cDNA aligns with the CDS sequence of Potri.004G128820 obtained from the Phytozome database. The gene structure analysis revealed the presence of three non-coding regions and three coding regions. Homology analysis using the BLAST program (https://blast.ncbi.nlm.nih.gov/Blast.cgi, accessed on 20 December 2022) revealed significant similarity to plant PtPMEs. BLAST results showed that the protein had high homology with seed plant, including 89.56% homology of grape pectinesterase 31(VvPME31-RVW80869.1) [20], 87.97% homology of Citrus sinensis pectinesterase 31(CsPME31-XP_006482635.1), 86.44% homology of Capsicum baccatum pectinesterase 31(CbPME31-PHT35232.1) [21], 85.76% homology of Bauhinia chinensis hypothetical protein L6164_007505(BvHP-KAI4346624.1) [22]; The similarity with the Arabidopsis hypothetical protein AXX17-AT5G19650(AtHP-OAO92854.1) [23], E. coli pectinesterase (EcoPE-MQK21754.1) [24], Aspergillus niger pectin methylesterase(AnPME-AXH37591.1) is relatively low [5], which is 47.62%, 46.15%, 36.4%, respectively. The sequence alignment results depicted in Figure 3 demonstrate a substantial degree of sequence homology between PtPME and the PME found in woody plants. Furthermore, the secondary structure analysis reveals that PtPME predominantly consists of α helices, β sheets, β turns, and random coils. The phylogenetic analysis of protein sequences obtained by BLAST, as depicted in Figure 4, reveals a close relationship between PtPME and the PME protein of Salix brachista (KAB5561212.1), followed by the PME protein of Linum tenue and Punica granatum.

3.2. Physical and Chemical Properties

The hydrophilicity index of PtPME, as predicted by the ProtParam tool (Expasy—ProtParam), was determined to be −0.216, indicating a low hydrophilicity for this protein. Additionally, an instability index of 42.41 suggested potential instability. In Figure 5A, the hydrophobicity analysis revealed that Serine at position 194 had the lowest score (−2.456), while Cysteine at position 206 had the highest score (1.822). The prediction results from NetPhos 3.1 in Figure 5B indicated that there were, respectively, ten potential phosphorylation sites on serine residues, ten on threonine residues, and seven on tyrosine residues within PtPME. In Figure 5C, SignalP and TMHMM 2.0 analyses showed no signal peptide cleavage sites or transmembrane helices in PtPME.
The secondary structure prediction results of SOPM are illustrated in Figure 5D. PtPME primarily consisted of α-helix, β-sheet, β-turn, and random coiling. Among these components, random coiling accounted for 49.68% of the total amino acid residues; β-sheet comprised 30.06% of the residues; α-helix formation involved 16.14% of the residues, while only 4.11% formed β-turn structures. The signal peptide prediction results in Figure 5E indicate that the PtPME sequence does not contain a signal peptide.

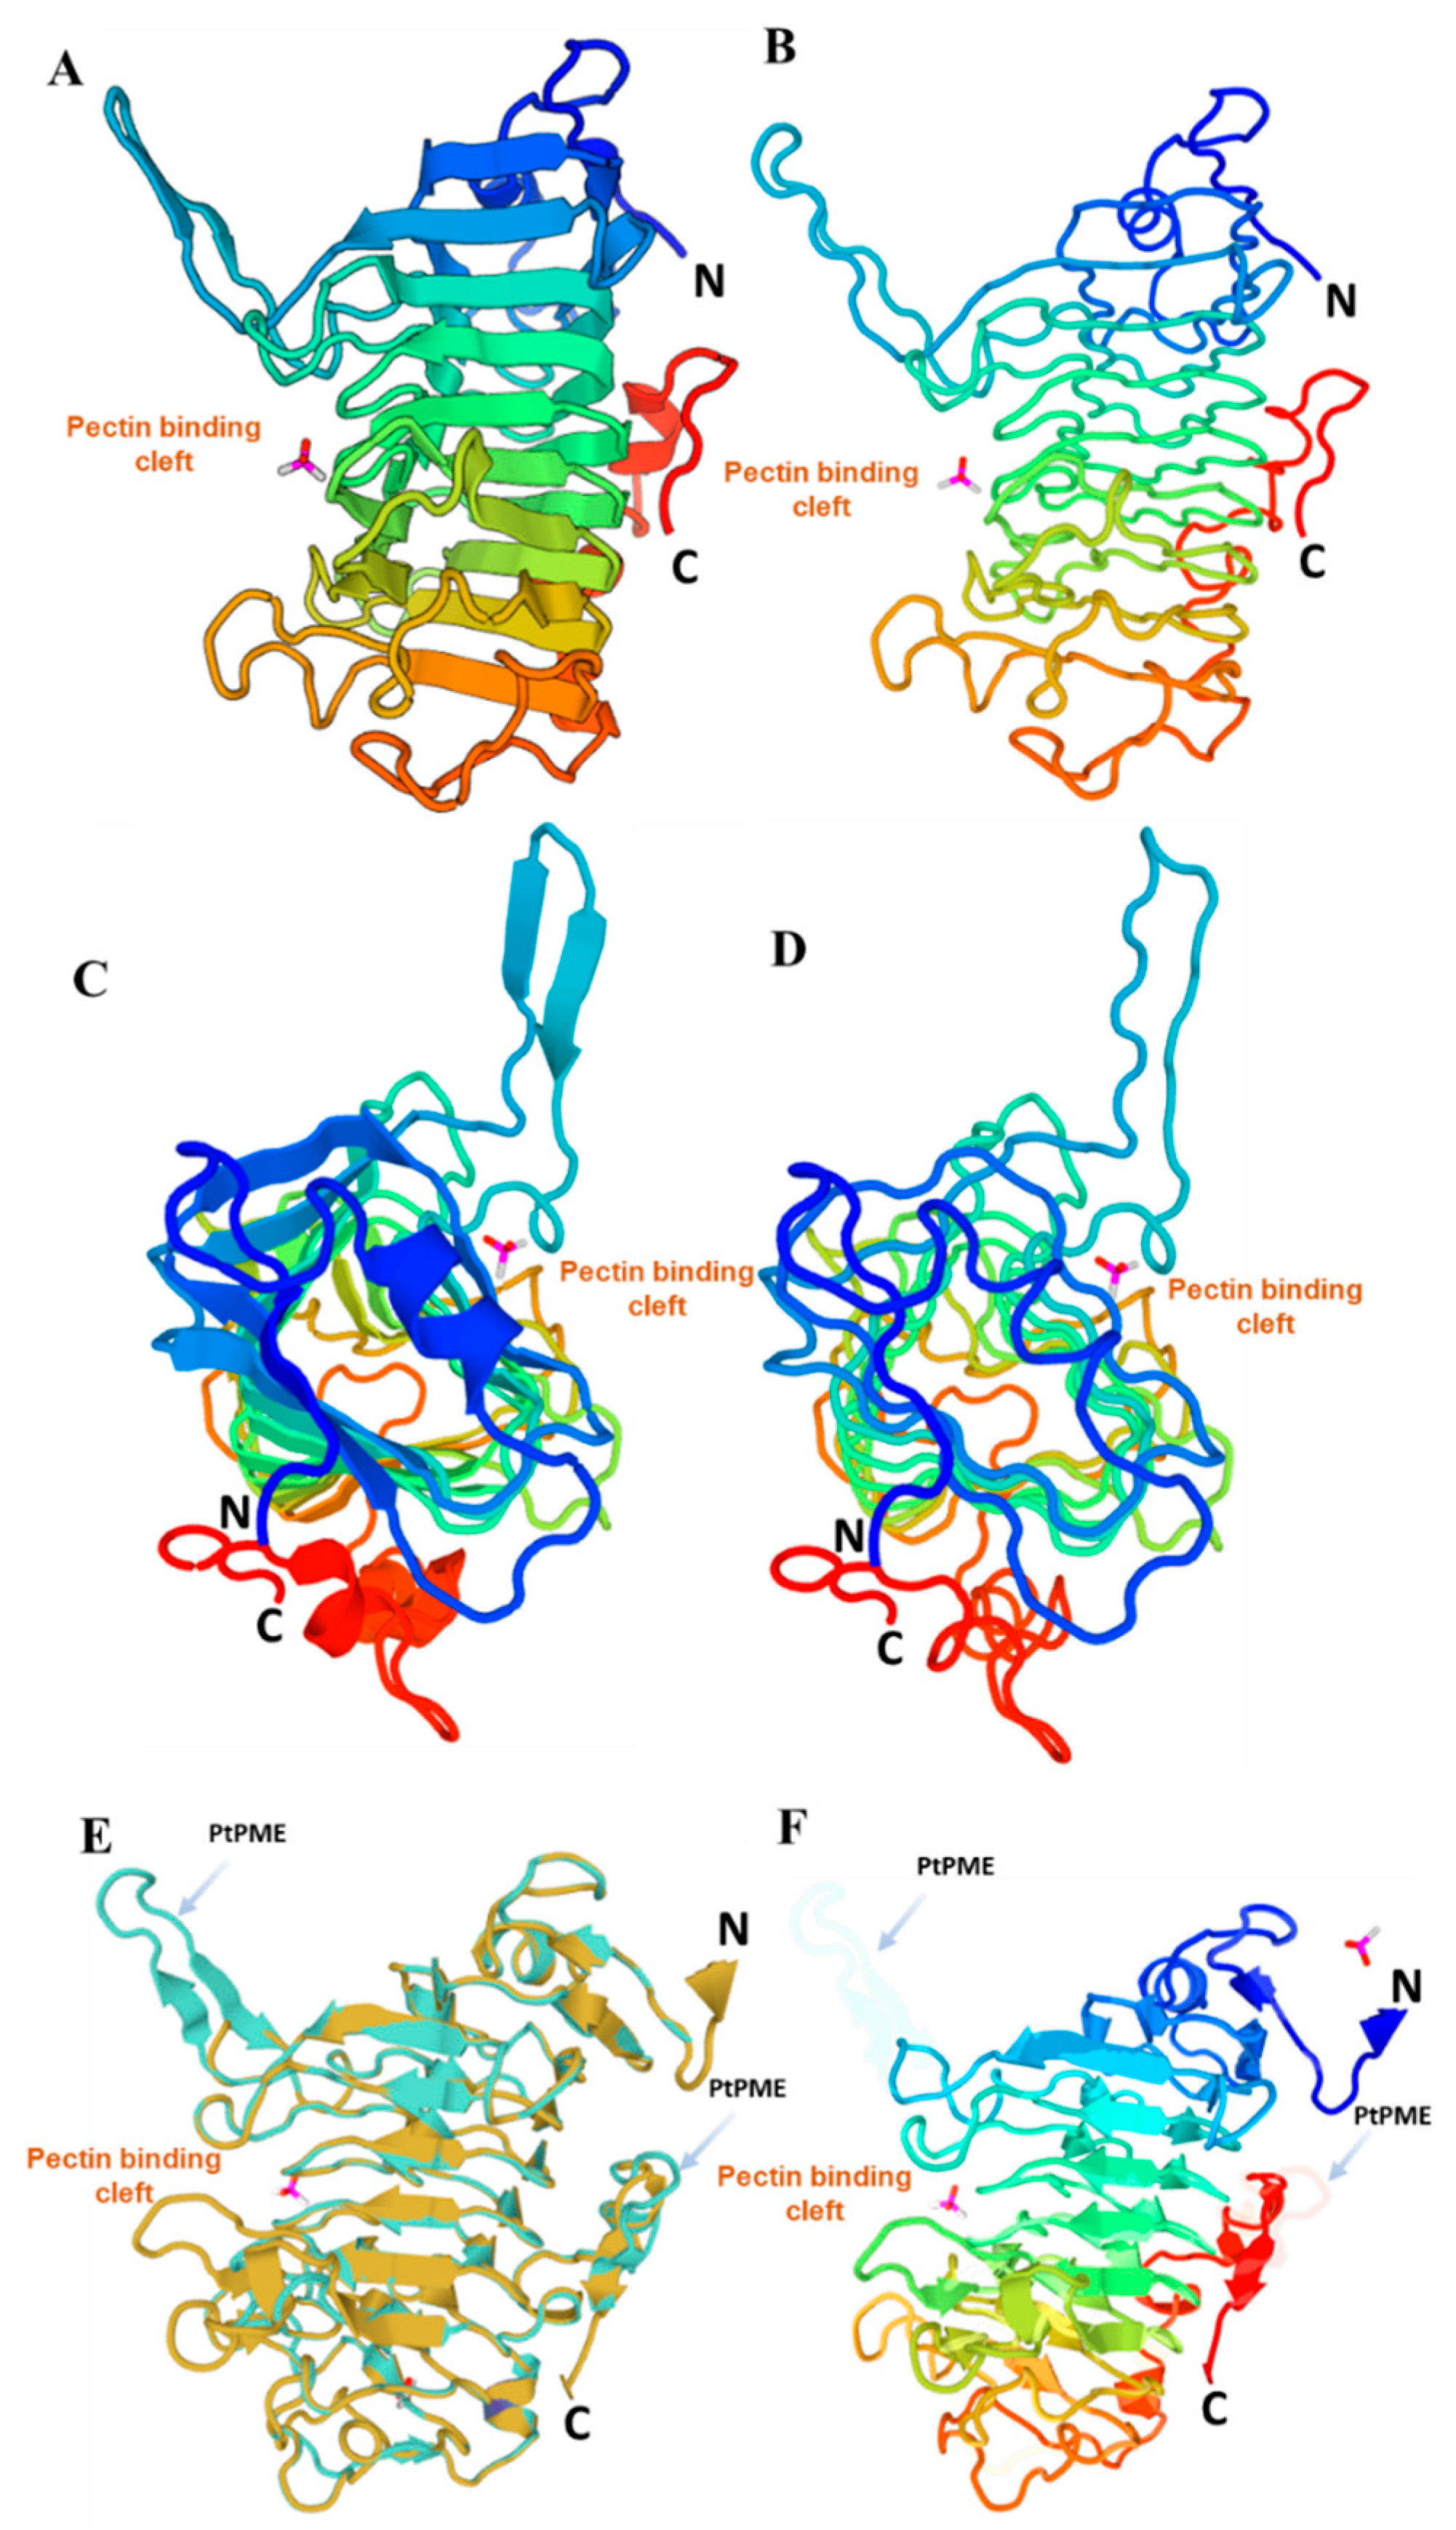
3.3. Molecular Modeling of PtPME

The pectin methylesterase from carrot (1GQ8.1.A) was utilized as a template for homology modelling of the protein structure using SWISS-MODEL. The sequence similarity between PtPME and carrot PME (PDB:1GQ8.1.A) was determined to be 38.72%. The simulated protein structure of PtPME is illustrated in Figure 6. Figure 6A (Cartoon Model) and B (Tube Model) demonstrate that the pectin-bound crack appendage of PtPME is formed by random coil sequences, with β-sheet to form a ring structure. Figure 6C (Cartoon Model) and D (Tube Model) demonstrate, from the top down, that PtPME is folded by β-sheet to form a ring structure. The protein structures of PtPME and carrot PME (PDB:1GQ8.1. A) exhibit significant similarity with slight variations observed in the shaded region of Figure 6E,F. Therefore, it can be inferred that the protein structure of PtPME shares resemblance with that of Carrot PME (PDB:1GQ8.1. A) which belongs to a right-handed parallel β-helix conformation where each circular β-sheet can be divided into PB1, PB2, and PB3 regions, respectively. The connecting corners between these three β-sheets are referred to as T1 (PB1-PB2), T2 (PB2-PB3), and T3 (PB3-PB1) [25,26].

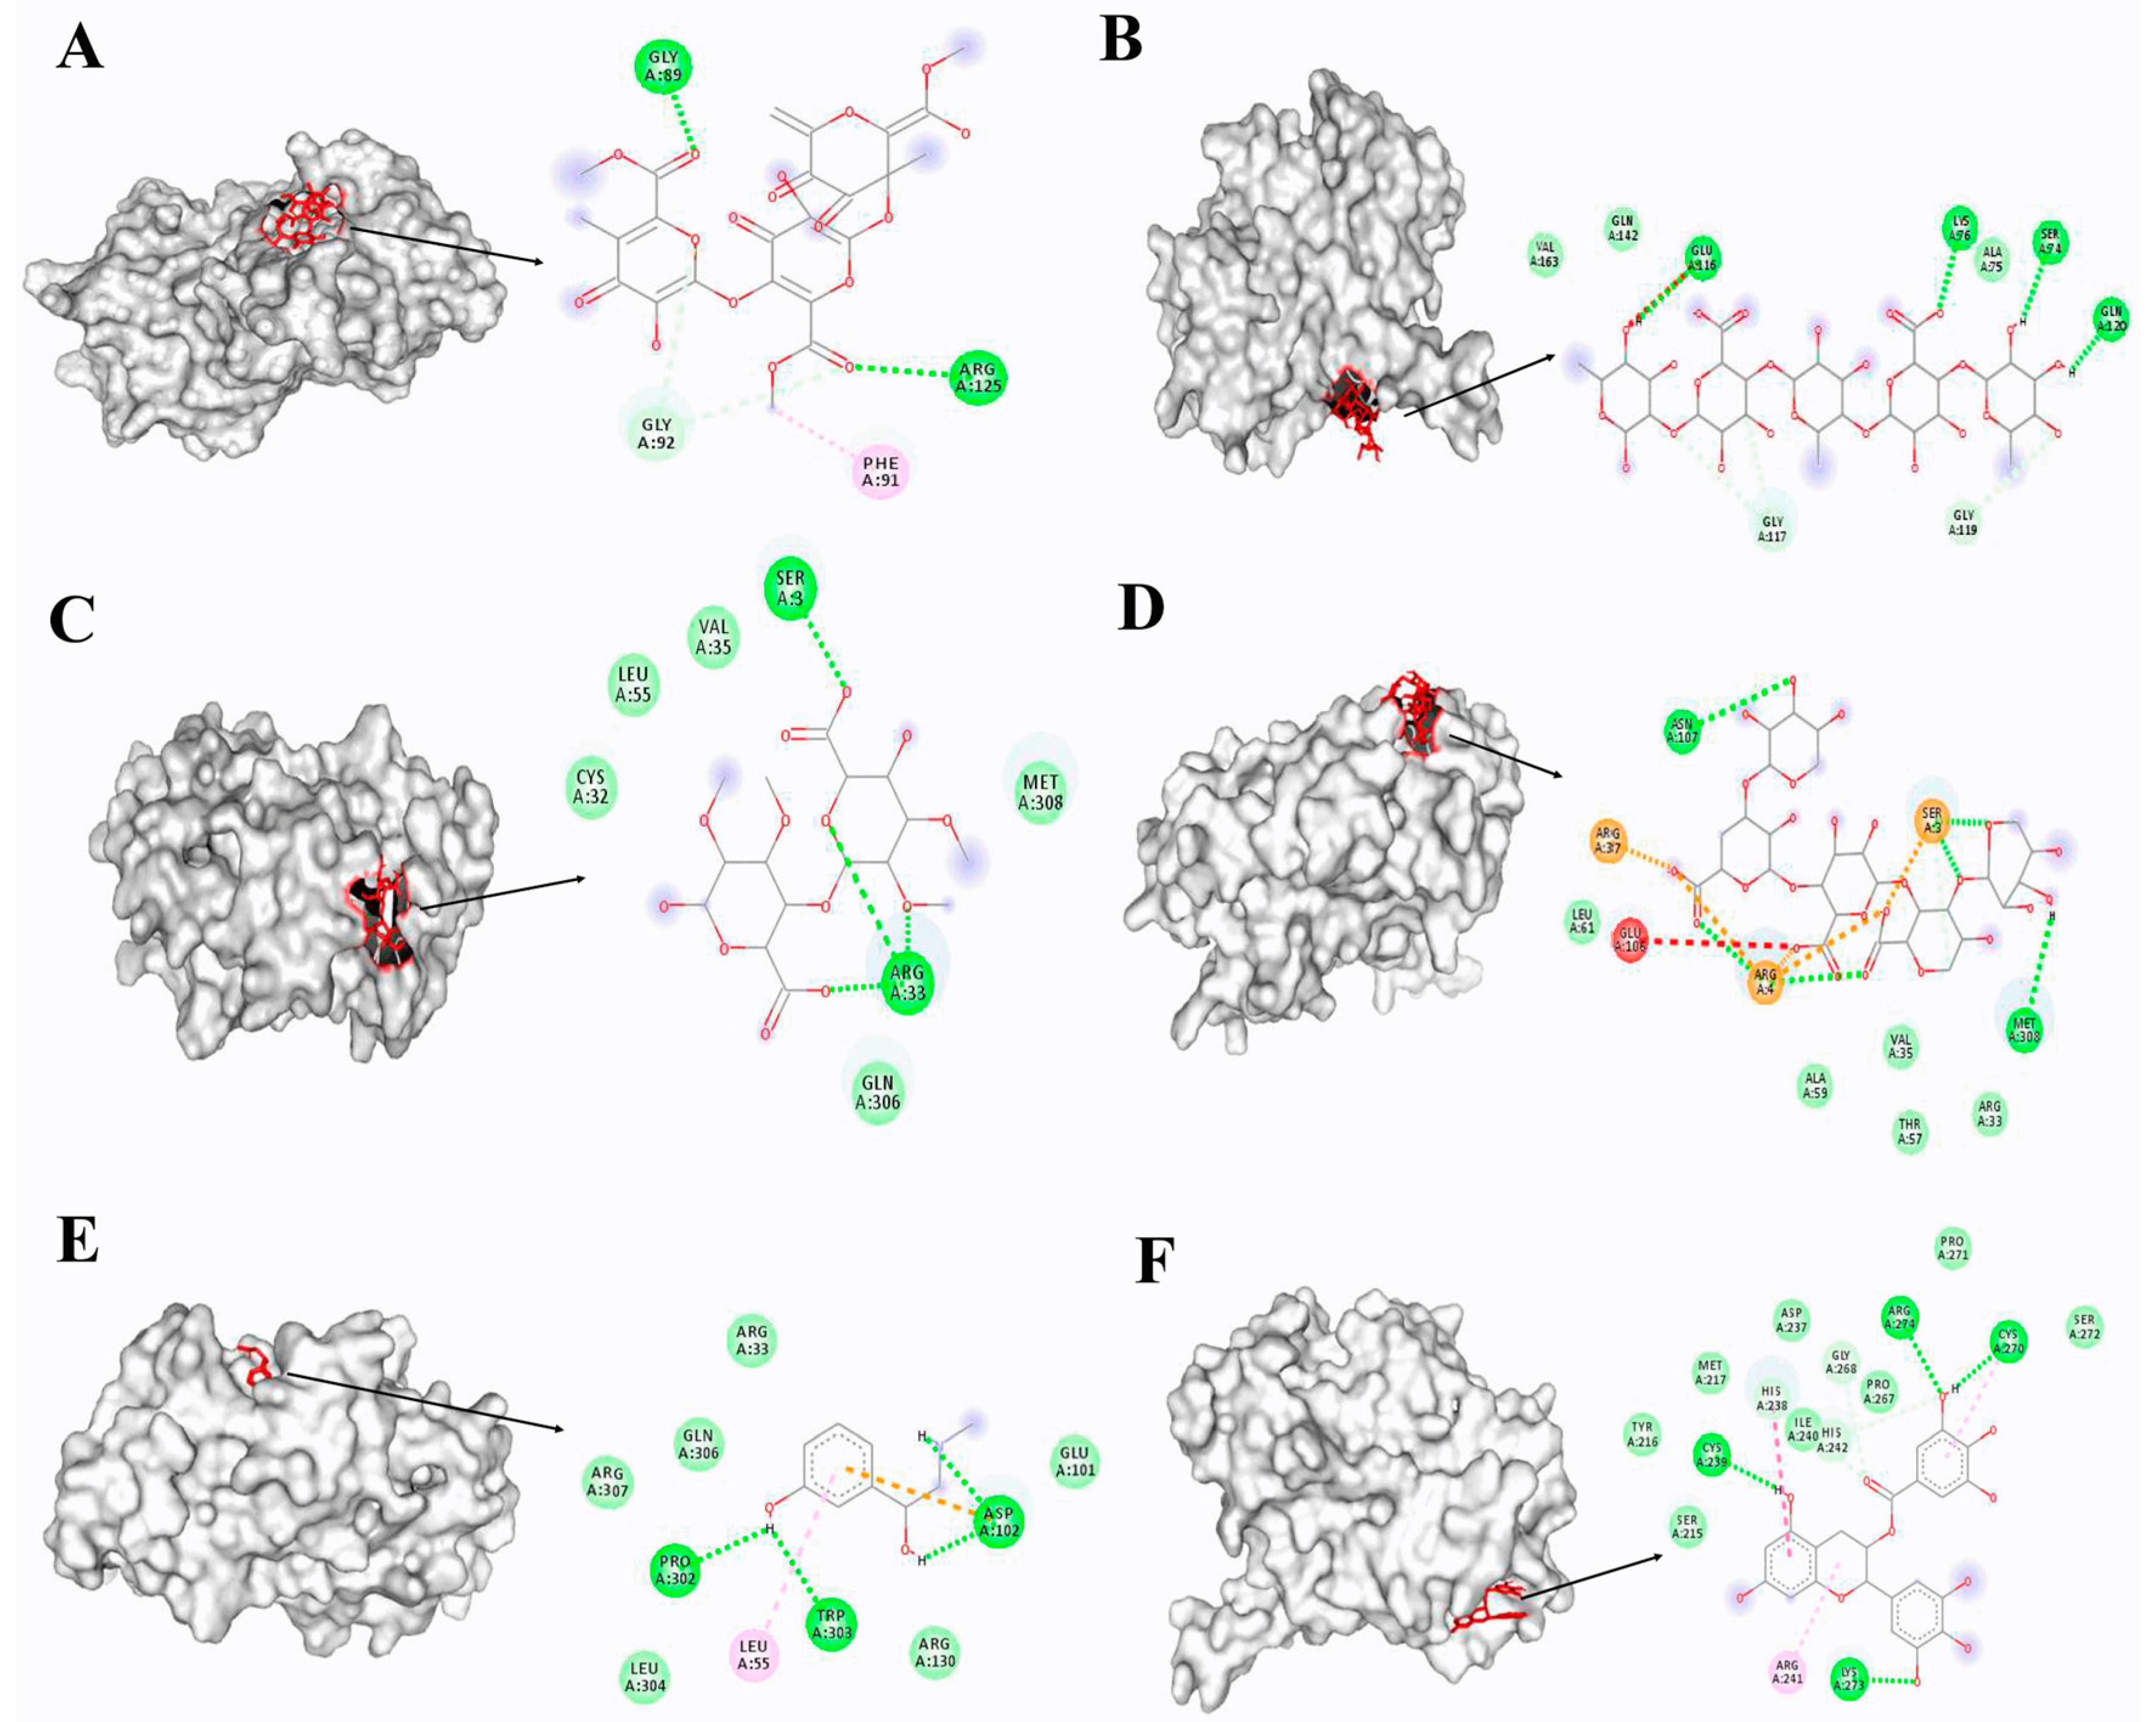
3.4. Docking Simulation of Different Substrates

The four pectin substrate polysaccharides HG, RG I, RG II, and XGA were selected from the PubChem database to dock with PtPME using their most minor structural units. Two inhibitors (EGCG and PE) were also chosen for docking with PtPME. The experimental results presented in Table 2 demonstrate that all six compounds exhibit a small root mean square deviation (RMSD), indicating the reasonable and reliable parameters employed for the docking simulation. This approach enables a more accurate simulation of the optimal conformation of these six compounds when interacting with the active centre of PtPME. Each pectin substrate polysaccharide’s minimum structural unit forms a complex with PtPME that exhibits the lowest binding energy. Specifically, the HGA-unit represents the minimum structural unit of methylated polygalacturonic acid, demonstrating a binding free energy of −3.29 kcal/mol.
The binding free energy of the RG II-unit, which represents the smallest structural unit of polyrhamnogalacturonic acid II, and its interaction with PtPME is calculated to be −2.83 kcal/mol, surpassing that of the HGA-unit. However, it should be noted that while both the minimum structural unit RG I-unit of polyrhamnogalacturonic acid I and the minimum structural unit XGA-unit of polyxylogalacturonic acid exhibit a high binding free energy upon docking with PtPME, their resulting complex shows limited conformational stability. In contrast to these findings, previous literature has reported phenylepinephrine and epigallocatechin gallate as small-molecular pectin methylesterase inhibitors; however, their binding free energies with PtPME are relatively low. Specifically, phenylepinephrine achieves a value as low as −4.85 kcal/mol.
The docking results were visualized and analyzed using Pymol v2.6 software (Schrödinger, Inc., San Diego, CA, USA), revealing that six small molecules could establish hydrogen bonds with relevant amino acid residues of PtPME (Figure 7). Specifically, the HGA-unit formed conventional hydrogen bonds with Gly89 and Arg125, while the surface model of the docking complex between the HGA-unit and PtPME exhibited a stable conformation characterized by hydrogen bond interactions with Gly92 (Figure 7A).
The RG I-unit engages in hydrogen bonding interactions with four amino acid residues, namely Ser74, Lys76, Gln120, and Glu116. Additionally, it forms van der Waals forces with Ala45, Gln142, and Val163 (Figure 7B). However, due to its shallow pocket at the junction site, the RG I-unit cannot establish stable binding interactions, as indicated by its highest binding energy. The RG II unit primarily consists of five amino acids, including Cys32 and Val35, which contribute to the formation of van der Waals forces (Figure 7C). Additionally, both the XGA-unit and RG II-unit form hydrogen bond interactions with Ser3 of PtPME (Figure 7D). PE can establish hydrogen bonds with Asp102, Pro302, and Trp303, engaging in van der Waals forces, electrostatic forces, and π—alkyl interactions with neighboring amino acid residues within the binding energy pocket (Figure 7E). EGCG exhibits four distinct types of interactions with amino acid residues at the docking site: hydrogen bonding with Cys270, Lys273, Arg274; involvement of eight different amino acids through van der Waals forces; and observed embedding into their respective docking sites for most small molecules when considering the surface model of EGCG and PtPME (Figure 7F).

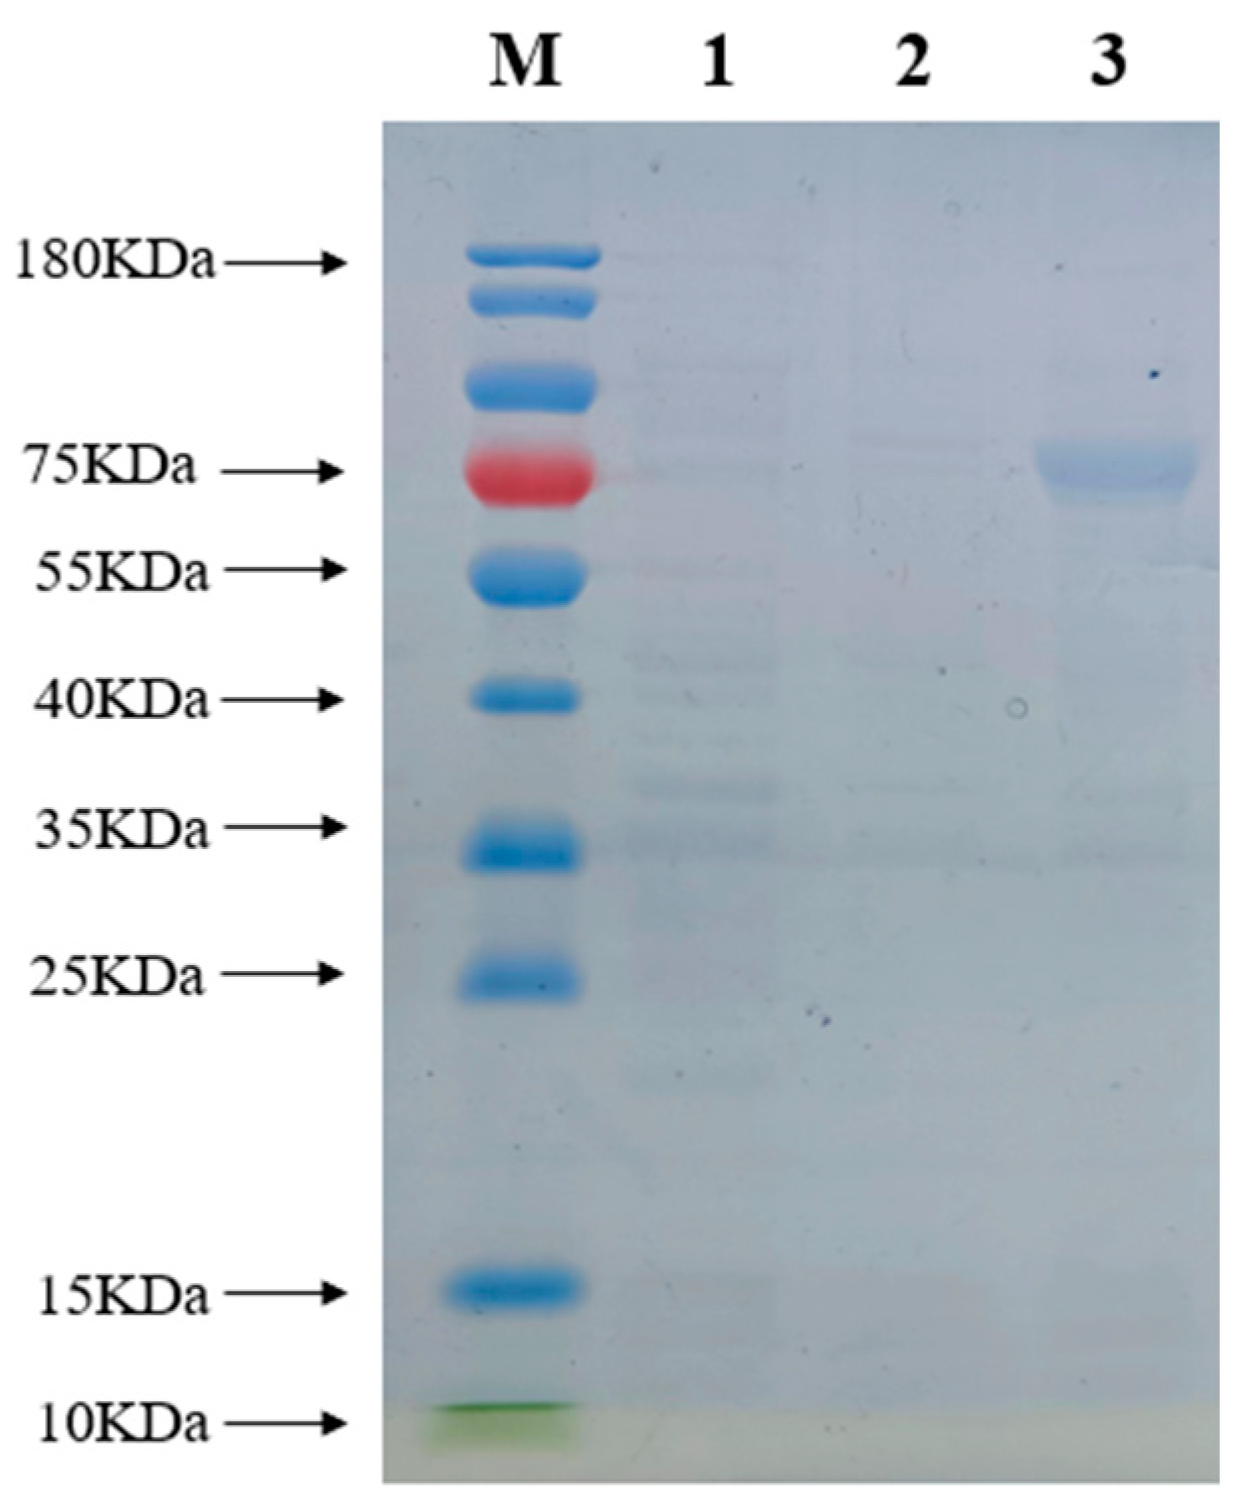
3.5. Prokaryotic Expression and Purification of PtPME Protein

The recombinant PtPME was expressed as a soluble MBP-tagged protein in E. coli BL21. After transferring the activated expression bacteria to shake flasks for fermentation, they were incubated at 37 °C for 3 h. Subsequently, IPTG (final concentration of 0.3 mmol/L) was added, and the bacteria were induced overnight at 16 °C. The bacteria were then centrifuged and resuspended for fragmentation, followed by the bacterial fluid and supernatant, which were collected and analyzed by SDS-PAGE (Figure 8). Notably, a distinct band corresponding to an approximate size of 80 KDa was observed, which matched the theoretical protein size (77.9 kDa).
The supernatants of bacterial fragmentation were subjected to a maltose affinity column to purify recombinant proteins. The concentrated enzyme fraction was obtained using Amicon Ultra Centrifugal Filter Units (50 K, Merck Millipore, Billerica, MA, USA). Finally, the concentrated proteins were subjected to SDS-PAGE for subsequent enzymatic characterization.

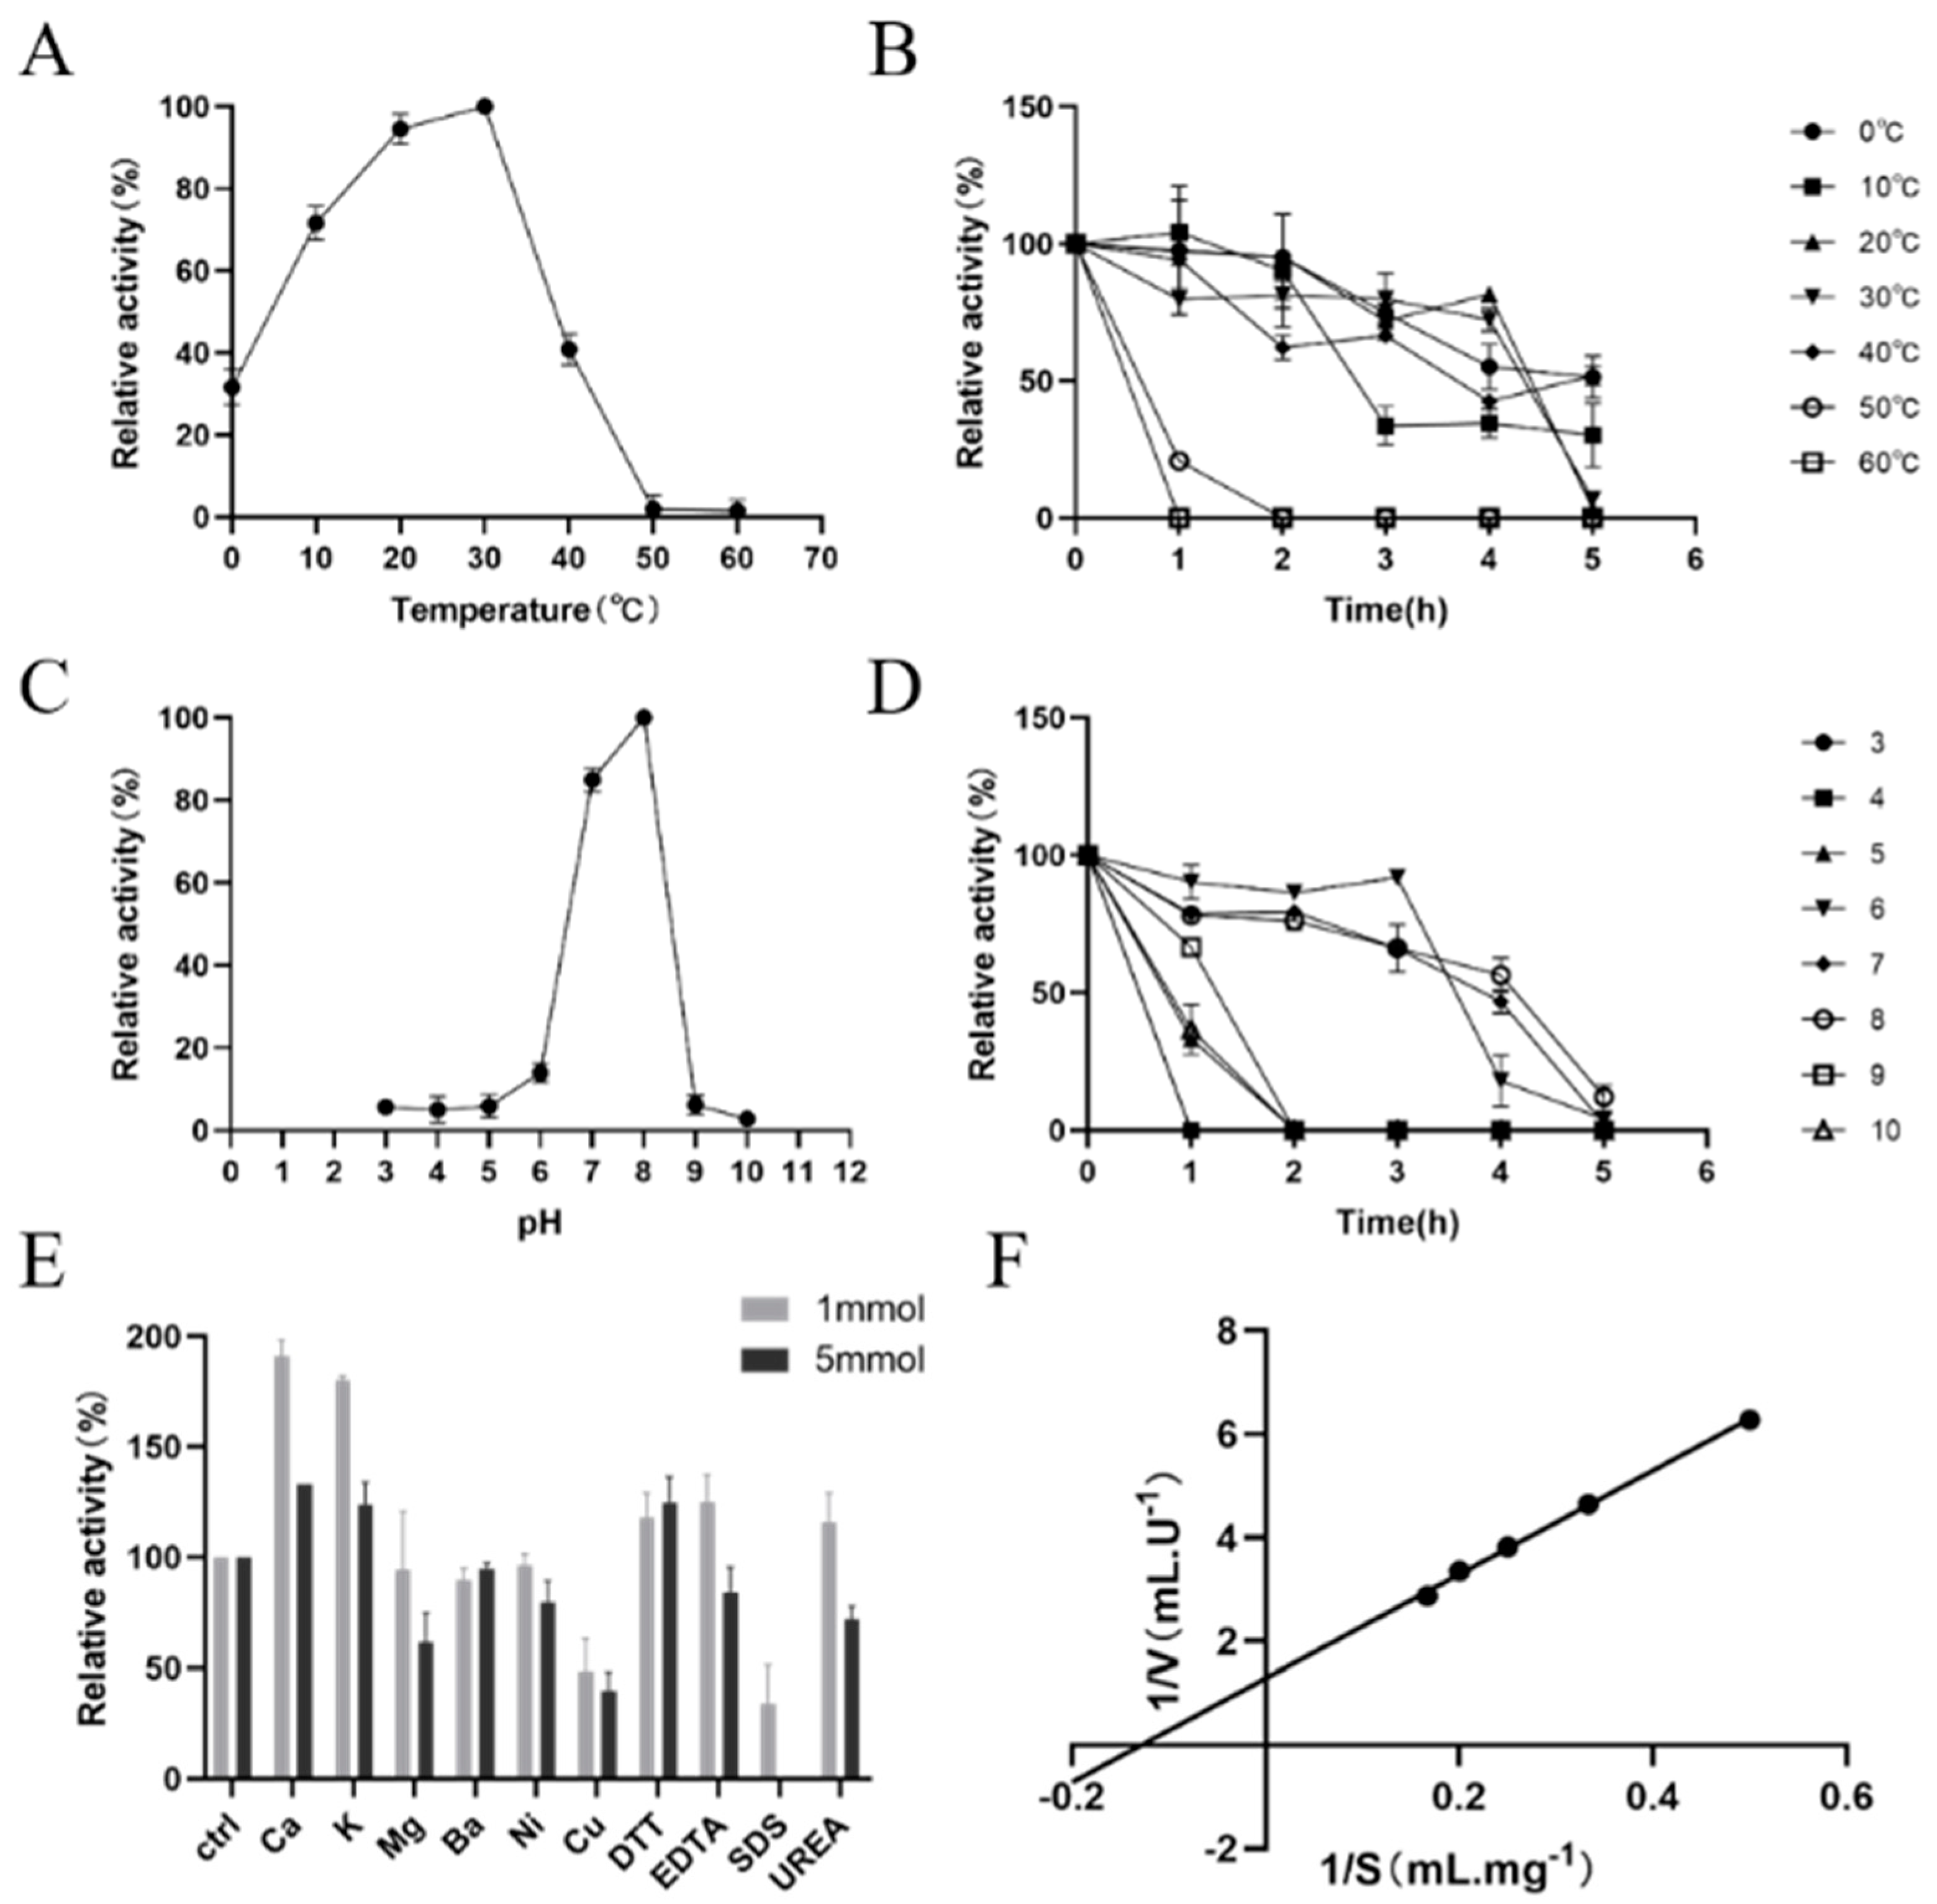
3.6. Analysis of the Enzymatic Properties of PtPME

Recombinant PtPME protein was subjected to reactions with high-ester pectin and low-ester pectin at a concentration of 8 mg/mL each. The resulting methanol production, catalyzed by ethanol oxidase, was quantified to evaluate the enzymatic activity. The enzyme required to increase absorbance by 0.01 per minute when utilizing methanolic high-ester pectin as the substrate was determined to be 100% at 405 nm. PtPME exhibited significantly higher affinity towards high-ester pectin than low-ester pectin, with a relative enzyme activity of only 44% for the latter.
The effects of temperature, pH, and metal ions on the activity of the PtPME enzyme were investigated individually. PtPME was subjected to various temperatures (0–60 °C) for reaction and its enzymatic activity was determined. The results are presented in Figure 9A,B. The optimal reaction temperature for this pectin esterase is approximately 30 °C; there is still over 30% relative enzyme activity at a low temperature of 0 °C, but the enzyme activity declines as the temperature exceeds 30 °C, with the relative enzyme activity at 40 °C being equivalent to that at 0 °C. Almost complete loss of enzyme activity is observed when it reaches 50 °C.
The temperature stability of PtPME enzyme activity was excellent within the 0–40 °C range, with a retention of 73% relative enzyme activity even after 4 h at 30 °C (Figure 9B). However, a decline in temperature stability and a decrease in relative enzyme activity were observed upon surpassing the optimal temperature. Notably, complete inactivation of the enzyme occurred within just one hour when exposed to temperatures as high as 60 °C. In contrast, PME derived from Talaromyces leycettanus JCM12802 exhibited an exceptionally high optimum temperature of 75 °C [27].
The results depicting the impact of pH on PtPME enzyme activity are illustrated in Figure 9C,D. PtPME exhibited pectin methylesterase activity within a narrow pH range (6.5–9.0), with an optimal reaction pH value of 8.0. Below pH8.0, enzyme activity progressively increased with rising pH, while it sharply declined beyond pH8.0. To assess the effect of different pH conditions (3.0~10.0) on PtPME, the residual enzyme activity was measured at regular intervals for five hours at 30 °C using various buffers. At both pH 7.0 and 8.0, approximately half of the relative enzyme activity was retained over four hours at 30 °C, indicating favorable stability under neutral conditions akin to most plant pectin methyl esterases.
A range of PMEs exhibiting optimal activity within the alkaline pH range (7.0–9.0) have been previously documented and are commonly employed for fiber degumming and debinding in the textile and paper industries. Examples of PMEs that operate closer to the pH activity range of PtPME include Bacillus sp. Y1 (pH 8.5) [28], Tomato (pH 8.5) [29], Carica papaya L. fruit (pH 7) [30], among others. The temperature tolerance and pH stability of PtPME demonstrate its promising potential for industrial applications. Furthermore, the substrate specificity study revealed that PtPME exhibited higher activity on high-ester pectin than low-ester pectin, which is consistent with previous findings [31]. Given its favourable performance at alkaline and neutral temperatures, PtPME is a promising candidate for industrial applications such as plant fiber degumming and bioprocessing cotton fibers.
The impact of metal ions and other reagents on the enzymatic activity of PtPME was assessed. As depicted in Figure 9E, Mg2+, Ni+, and Cu2+ exhibited inhibitory effects on the enzyme, with a Cu2+ concentration of 1 mmol/L resulting in a 50% reduction in enzyme activity. Conversely, slightly increasing Ca2+, K+, DTT, and EDTA at a concentration of 1 mmol/L can enhance enzyme activity. These findings suggest that most metal ions and reagents activate the enzyme’s activity, rendering it highly promising for industrial applications [32,33]. Notably, the reducing agent DTT demonstrated a particular promotional effect on PtPME’s enzymatic activity, potentially due to its influence on disulfide bond-related catalytic properties.
The results of enzyme kinetic parameter determination are presented in Figure 9F. PtPME’s enzymatic activity was assessed under optimal reaction conditions using sodium phosphate buffer prepared with high-ester pectin solutions at mass concentrations ranging from 2 to 6 mg/mL as substrates, employing the Lineweaver–Burk double inverse plotting method. The horizontal and vertical axes intercepts correspond to 1/Km and 1/Vmax, respectively; Km represents the enzyme’s affinity towards the substrate. As depicted in Figure 9F, a linear regression equation of Y = 10.04x + 1.2833 (R2 = 0.9983) was obtained, yielding a Michaelis constant Km value of 7.825 mg/mL and a maximum reaction rate Vmax of 0.779 U/mL.

3.7. Orthogonal Test of Enzyme Activity

Based on the results of our preliminary experiments, we employed orthogonal experiments to optimize the factors that influence PtPME enzyme activity. The L9 (33) orthogonal table was used for experimental arrangement, and three factors were selected: enzyme pH (A), temperature (B), and substrate pectin concentration (C). Each factor was tested at three levels (Table 3).
The effect of the three variables on enzyme activity was determined using Polar Difference (R) analysis. Analysis of the results indicates that all three factors significantly influence enzyme activity, with pH having the most significant impact according to the R-value, followed by substrate pectin concentration and reaction temperature. The order of importance for these factors on enzyme activity was as follows: pH (A) > substrate pectin concentration (C) > temperature (B). The optimal combination for maximum enzyme activity was A1B1C2, corresponding to a reaction involving a 7 mg/mL concentration of pectin and PtPME at 20 °C for 30 min in a buffer solution with a pH value of 7.0.

3.8. Degree of Esterification

The pectin esterification results were analyzed using NaOH titration before and after the action of PtPME, a pectin methyl esterase from Populus trichocarpa. The findings are presented in Table 4. Under optimal conditions, PtPME catalyzed the de-esterification of highly esterified pectin (>60%), resulting in low-esterified pectin, with an esterification level of approximately 20% and a de-esterification rate of 68.3%. Regarding the degree of esterification, both the green biocatalyst CLEAs-PME and PtPME demonstrated comparable efficiency in de-esterifying high-ester pectin extracted from mangoes and pomegranates to low-ester pectin. Furthermore, their de-esterification effect surpassed Wan et al.’s high hydrostatic pressure-assisted enzymatic production method [34]. Under optimal HHP conditions, pectin esterification decreased from 79.91% to 37.02% within 12 min. The enzymatic method, which involves enzymatic de-esterification for low-ester pectin preparation, offers advantages such as high specificity, ease of operation, and economic and environmental friendliness. PtPME’s effective de-esterification makes it a promising candidate for low-ester pectin industrial production.
Low-ester pectin finds extensive applications in the food, pharmaceutical, and healthcare industries. However, natural sources of low-ester pectin are limited to small-scale agricultural products like sunflower seeds [35] and sweet cyclam [36]. On the other hand, industrial production of low-ester pectin through de-esterification of high-ester pectin is well-established using alkali-based methods due to their simplicity and cost-effectiveness, leading to market dominance [37]. Nevertheless, it is crucial not to overlook the impact of reaction conditions on product structure. Enzyme-catalyzed de-esterification offers a green and environmentally friendly alternative that can be optimized by fine-tuning reaction parameters for maximum enzyme activity, improved yield, and enhanced operability. This approach holds significant research value.

4. Conclusions

The pectin methyl esterase PME gene from Populus trichocarpa was successfully heterologously expressed in E. coli BL21, and the PtPME protein was subsequently isolated and purified. Bioinformatic analysis revealed its physicochemical properties, while enzymatic characterization was performed to investigate its functionality further. The optimal reaction temperature of PtPME was determined to be 30 °C, and the enzyme retained over 70% relative enzyme activity after 4 h. Moreover, the optimum pH for PtPME activity was found to be 8.0. Similar to most plant pectin methyl esterases, this enzyme displayed high catalytic efficiency within the pH range of 7.0–8.0 and retained approximately 50% relative enzyme activity after 4 h, indicating its remarkable stability under neutral conditions. Treatment of high-ester pectin with this enzyme resulted in a remarkable 67% de-esterification, highlighting its strong applicability in the enzymatic preparation of low-ester pectin for industrial use.

Author Contributions

Conceptualization, G.H. and W.L.; methodology, Y.F., L.H., G.H., Y.Z. (Yue Zeng), Y.Z. (Yiyuan Zhang) and W.L.; formal analysis and investigation, G.H., Y.F., L.H. and W.L.; writing—original draft preparation, Y.F. and G.H.; writing—review and editing, G.H., Y.F. and W.L.; funding acquisition, G.H. and W.L.; resources, G.H.; supervision, G.H. and W.L. All authors have read and agreed to the published version of the manuscript.

Funding

This research was supported by the National Natural Science Foundation [Grant Numbers 31870655] and the State Key Laboratory of Forest Genetics and Breeding Open Foundation [Grant Number TGB2019001].

Data Availability Statement

Data are contained within the article.

Acknowledgments

The authors thank Yuan da Tang for the chemical structure analysis.

Conflicts of Interest

The authors declare no conflict of interest.

References

  1. Lara-Espinoza, C.; Carvajal-Millán, E.; Balandrán-Quintana, R.; López-Franco, Y.; Rascón-Chu, A. Pectin and pectin-based composite materials: Beyond food texture. Molecules 2018, 23, 942. [Google Scholar] [CrossRef]
  2. Chandel, V.; Biswas, D.; Roy, S.; Vaidya, D.; Verma, A.; Gupta, A.J.F. Current advancements in pectin: Extraction, properties and multifunctional applications. Foods 2022, 11, 2683. [Google Scholar] [CrossRef]
  3. Zdunek, A.; Pieczywek, P.M.; Cybulska, J.J.C.R.i.F.S.; Safety, F. The primary, secondary, and structures of higher levels of pectin polysaccharides. Compr. Rev. Food Sci. Food Saf. 2021, 20, 1101–1117. [Google Scholar] [CrossRef]
  4. Saffer, A.M. Expanding roles for pectins in plant development. J. Integr. Plant Biol. 2018, 60, 910–923. [Google Scholar] [CrossRef]
  5. Zhang, Z.; Dong, J.; Zhang, D.; Wang, J.; Qin, X.; Liu, B.; Xu, X.; Zhang, W.; Zhang, Y. Expression and characterization of a pectin methylesterase from aspergillus niger zj5 and its application in fruit processing. J. Biosci. Bioeng. 2018, 126, 690–696. [Google Scholar] [CrossRef]
  6. Coculo, D.; Lionetti, V. The plant invertase/pectin methylesterase inhibitor superfamily. Front. Plant Sci. 2022, 13, 863892. [Google Scholar] [CrossRef]
  7. Shrestha, S.; Rahman, M.S.; Qin, W. New insights in pectinase production development and industrial applications. Appl. Microbiol. Biotechnol. 2021, 105, 9069–9087. [Google Scholar] [CrossRef]
  8. Garg, G.; Singh, A.; Kaur, A.; Singh, R.; Kaur, J.; Mahajan, R. Microbial pectinases: An ecofriendly tool of nature for industries. 3 Biotech 2016, 6, 47. [Google Scholar] [CrossRef]
  9. Li, Y.; He, H.; He, L.-F. Genome-wide analysis of the pectin methylesterase gene family in potato. Potato Res. 2020, 64, 1–19. [Google Scholar] [CrossRef]
  10. Ishii, S.; Kiho, K.; Sugiyama, S.; Sugimoto, H. Low-methoxyl pectin prepared by pectinesterase from aspergillus japonicus. J. Food Sci. 1979, 44, 611–614. [Google Scholar] [CrossRef]
  11. Gupta, A.; Gangotia, D.; Mani, I. Bioinformatics tools and software. In Advances in Bioinformatics; Singh, V., Kumar, A., Eds.; Springer: Singapore, 2021; pp. 15–35. [Google Scholar]
  12. He, G.; Guan, C.-N.; Chen, Q.-X.; Gou, X.-J.; Liu, W.; Zeng, Q.-Y.; Lan, T. Genome-wide analysis of the glutathione s-transferase gene family in capsella rubella: Identification, expression, and biochemical functions. Front. Plant Sci. 2016, 7, 1325. [Google Scholar] [CrossRef] [PubMed]
  13. Tamura, K.; Stecher, G.; Kumar, S.; Battistuzzi, F.U. Mega11: Molecular evolutionary genetics analysis version 11. Mol. Biol. Evol. 2021, 38, 3022–3027. [Google Scholar] [CrossRef]
  14. Salas-Tovar, J.A.; Flores-Gallegos, A.C.; Contreras-Esquivel, J.C.; Escobedo-García, S.; Morlett-Chávez, J.A.; Rodríguez-Herrera, R. Analytical methods for pectin methylesterase activity determination: A review. Food Anal. Methods 2017, 10, 3634–3646. [Google Scholar] [CrossRef]
  15. Deytieux-Belleau, C.; Vallet, A.; Doneche, B.; Geny, L. Pectin methylesterase and polygalacturonase in the developing grape skin. Plant Physiol. Biochem. 2008, 46, 638–646. [Google Scholar] [CrossRef] [PubMed]
  16. Sahoo, P.; Chakraborty, S. Influence of pulsed light, ultrasound, and series treatments on quality attributes, pectin methyl esterase, and native flora inactivation in sweet orange juice (citrus sinensis l. Osbeck). Food Bioprocess Technol. 2023, 16, 2095–2112. [Google Scholar] [CrossRef]
  17. Chaiwarit, T.; Rachtanapun, P.; Kantrong, N.; Jantrawut, P. Preparation of clindamycin hydrochloride loaded de-esterified low-methoxyl mango peel pectin film used as a topical drug delivery system. Polymers 2020, 12, 1006. [Google Scholar] [CrossRef] [PubMed]
  18. Sabzevari, A.G.; Sabahi, H.; Nikbakht, M.; McInnes, S.J.P. Development and characteristics of layered egcg/montmorillonite hybrid: An oral controlled-release formulation of egcg. J. Drug Deliv. Sci. Technol. 2022, 76, 103750. [Google Scholar] [CrossRef]
  19. Cheong, M.S.; Lee, D.Y.; Seo, K.H.; Choi, G.H.; Song, Y.H.; Park, K.H.; Kim, J.H. Phenylephrine, a small molecule, inhibits pectin methylesterases. Biochem. Biophys. Res. Commun. 2019, 508, 320–325. [Google Scholar] [CrossRef] [PubMed]
  20. Roach, M.J.; Johnson, D.L.; Bohlmann, J.; van Vuuren, H.J.J.; Jones, S.J.M.; Pretorius, I.S.; Schmidt, S.A.; Borneman, A.R. Population sequencing reveals clonal diversity and ancestral inbreeding in the grapevine cultivar chardonnay. PLoS Genet. 2018, 14, e1007807. [Google Scholar] [CrossRef]
  21. Kim, S.; Park, J.; Yeom, S.I.; Kim, Y.M.; Seo, E.; Kim, K.T.; Kim, M.S.; Lee, J.M.; Cheong, K.; Shin, H.S.; et al. New reference genome sequences of hot pepper reveal the massive evolution of plant disease-resistance genes by retroduplication. Genome Biol. 2017, 18, 210. [Google Scholar] [CrossRef]
  22. Zhong, Y.; Chen, Y.; Zheng, D.; Pang, J.; Liu, Y.; Luo, S.; Meng, S.; Qian, L.; Wei, D.; Dai, S.; et al. Chromosomal-level genome assembly of the orchid tree bauhinia variegata (leguminosae; cercidoideae) supports the allotetraploid origin hypothesis of bauhinia. DNA Res. 2022, 29, dsac012. [Google Scholar] [CrossRef]
  23. Zapata, L.; Ding, J.; Willing, E.M.; Hartwig, B.; Bezdan, D.; Jiao, W.B.; Patel, V.; Velikkakam James, G.; Koornneef, M.; Ossowski, S.; et al. Chromosome-level assembly of arabidopsis thaliana ler reveals the extent of translocation and inversion polymorphisms. Proc. Natl. Acad. Sci. USA 2016, 113, E4052–E4060. [Google Scholar] [CrossRef]
  24. Li, J.; Bi, Z.; Ma, S.; Chen, B.; Cai, C.; He, J.; Schwarz, S.; Sun, C.; Zhou, Y.; Yin, J.; et al. Inter-host transmission of carbapenemase-producing escherichia coli among humans and backyard animals. Environ. Health Perspect. 2019, 127, 107009. [Google Scholar] [CrossRef]
  25. Teller, D.C.; Behnke, C.A.; Pappan, K.; Shen, Z.; Reese, J.C.; Reeck, G.R.; Stenkamp, R.E. The structure of rice weevil pectin methylesterase. Acta Crystallogr. Sect. F Struct. Biol. Commun. 2014, 70, 1480–1484. [Google Scholar] [CrossRef]
  26. Singh, P.; Yadav, S.; Shah, S.; Shanker, K.; Sundaresan, V.; Shukla, A.K. Characterization of a crpme indicates its possible role in determining vindoline accumulation in catharanthus roseus leaves. Physiol. Plant. 2024, 176, e14276. [Google Scholar] [CrossRef]
  27. Hua, T.; Li, Y.; Wang, K.; Tu, T.; Huang, H.; Luo, H.; Yao, B. High-level expression and characterization of pectin methylesterase pmet from talaromyces leycettanus jcm12802 in pichia pastoris. Acta Microbiol. Sin. 2018, 58, 122–130. [Google Scholar]
  28. Guo, F.; Li, X.; Zhao, J.; Li, G.; Gao, P.; Han, X. Optimizing culture conditions by statistical approach to enhance production of pectinase from bacillus sp. Y1. BioMed Res. Int. 2019, 2019, 8146948. [Google Scholar] [CrossRef]
  29. Jeong, H.Y.; Nguyen, H.P.; Eom, S.H.; Lee, C. Integrative analysis of pectin methylesterase (pme) and pme inhibitors in tomato (Solanum lycopersicum): Identification, tissue-specific expression, and biochemical characterization. Plant Physiol. Biochem. 2018, 132, 557–565. [Google Scholar] [CrossRef]
  30. Kotnala, B.; N, S.M.; Vasu, P. Purification and characterization of a salt-dependent pectin methylesterase from carica papaya fruit mesocarp-exocarp tissue. J. Food Sci. 2018, 83, 2062–2070. [Google Scholar] [CrossRef]
  31. L’Enfant, M.; Domon, J.M.; Rayon, C.; Desnos, T.; Ralet, M.C.; Bonnin, E.; Pelloux, J.; Pau-Roblot, C. Substrate specificity of plant and fungi pectin methylesterases: Identification of novel inhibitors of pmes. Int. J. Biol. Macromol. 2015, 81, 681–691. [Google Scholar] [CrossRef]
  32. Yan, R.; Han, C.; Fu, M.; Jiao, W.; Wang, W. Inhibitory effects of cacl2 and pectin methylesterase on fruit softening of raspberry during cold storage. Horticulturae 2022, 8, 1. [Google Scholar] [CrossRef]
  33. Li, J.; Yang, Z.-L.; Ding, T.; Song, Y.-J.; Li, H.-C.; Li, D.-Q.; Chen, S.; Xu, F. The role of surface functional groups of pectin and pectin-based materials on the adsorption of heavy metal ions and dyes. Carbohydr. Polym. 2022, 276, 118789. [Google Scholar] [CrossRef] [PubMed]
  34. Wan, L.; Wang, H.; Zhu, Y.; Pan, S.; Cai, R.; Liu, F.; Pan, S. Comparative study on gelling properties of low methoxyl pectin prepared by high hydrostatic pressure-assisted enzymatic, atmospheric enzymatic, and alkaline de-esterification. Carbohydr. Polym. 2019, 226, 115285. [Google Scholar] [CrossRef] [PubMed]
  35. Hua, X.; Wang, K.; Yang, R.; Kang, J.; Zhang, J. Rheological properties of natural low-methoxyl pectin extracted from sunflower head. Food Hydrocoll. 2015, 44, 122–128. [Google Scholar] [CrossRef]
  36. Yuliarti, O.; Mardyiah Binte Othman, R. Temperature dependence of acid and calcium-induced low-methoxyl pectin gel extracted from cyclea barbata miers. Food Hydrocoll. 2018, 81, 300–311. [Google Scholar] [CrossRef]
  37. Limberg, G.; Körner, R.; Buchholt, H.C.; Christensen, T.M.I.E.; Roepstorff, P.; Mikkelsen, J.D. Analysis of different de-esterification mechanisms for pectin by enzymatic fingerprinting using endopectin lyase and endopolygalacturonase II from A. Niger. Carbohydr. Res. 2000, 327, 293–307. [Google Scholar] [CrossRef]
Figure 1. Structural formulas of compounds for molecular docking. (A) Structural formula of HG-unit, (B) structural formula of RGI-unit, (C) structural formula of RGII-unit, (D) structural formula of XGA-unit, (E) structural formula of phenylephrine, and (F) structural formula of epigallocatechin gallate.
Processes 12 01511 g001
Figure 2. 1.2% agarose gel electrophoresis of PtPME PCR amplification product. Line M: DL 2000 DNA Marker. Line 1: PCR product of PtPME.
Processes 12 01511 g002
Figure 3. Sequence alignment of PMEs. RVW80869.1: PME31 of Vitis vinifera, XP_006482635.1: PME31 of Citrus sinensis, PHT35232.1: PME31 of Capsicum baccatum, KAI4346624.1: hypothetical protein L6164_007505 of Bauhinia variegate, AXH37591.1: PME of Aspergillus niger, KZV15962.1: PME31 of Dorcoceras hygrometricum, XP_012084742.1: PME31 of Jatropha curcas, NP_566842.1: PME31 of Arabidopsis thaliana, EEF32370.1: pectinesterase precursor of Ricinus communis, OMP03547.1: PME of Corchorus olitorius. The η symbol refers to a 310-helix. α-helices and 310-helix are displayed as squiggles. β-sheet are rendered as arrows, β-turns as TT letters.
Processes 12 01511 g003
Figure 4. Phylogenetic trees based on pectin methyl esterase (PME) sequences were constructed using the neighbor-joining method with a bootstrap value of 1000. Evolutionary analyses were performed in MEGA11, incorporating a total of 52 protein sequences.
Processes 12 01511 g004
Figure 5. Physical and chemical properties and structure predictions of PtPME. (A) Protein hydrophobicity analysis, (B) phosphorylation site prediction, (C) protein transmembrane helix analysis, (D) secondary structure prediction, and (E) signal peptide prediction for PtPME.
Processes 12 01511 g005
Figure 6. Results of sequence and structural comparison analysis of PME derived from PtPME and carrot (PDB:1GQ8.1. A). (A) Cartoon Model and (B) Tube Model demonstrate the PtPME frontal structure; (C) Cartoon Model and (D) Tube Model demonstrate the PtPME structure from the top down; (E) the structure alignment of PME from Populus trichocarpa (PtPME, light blue) and carrot (PDB:1GQ8.1. A, orange); (F) the shaded indicating the significance difference.
Processes 12 01511 g006
Figure 7. PtPME docking visualization model. (A) 2D diagram of the butt surface model and interaction between PtPME and HGA-unit, (B) 2D diagram of the butt surface model and interaction between PtPME and RGI-unit, (C) 2D diagram of the butt surface model and interaction between PtPME and RGII-unit, (D) 2D diagram of the butt surface model and interaction between PtPME and XGA-unit, (E) 2D diagram of the butt surface model and interaction between PtPME and PE, and (F) 2D diagram of the butt surface model and interaction between PtPME and EGCG.
Processes 12 01511 g007
Figure 8. SDS-PAGE analysis of PtPME. Lane M: protein molecular weight marker. Lane 1: Fermentation supernatant. Lane 2: Bacterial crushing supernatant. Lane 3: Purified protein.
Processes 12 01511 g008
Figure 9. Analysis of the enzymatic properties of PtPME. (A,B) Effects of temperature on the activity and stability of PtPME; (C,D) Effects of pH on the activity and stability of PtPME; (E) Effects of metal ions and chemical reagents on the activity of PtPME; (F) The Lineweaver–Burk plot for PtPME catalyzed reaction.
Processes 12 01511 g009
Table 1. Factors and levels of orthogonal tests.
LevelA (Ph)B (T/°C)C (S/mg·mL−1)
17206
28307
39408
Table 2. Molecular docking results of PtPME with different substrates.
SubstrateBing Energy (KJ/mol)Binding PocketRMSD
HGA-unit−3.29Gly89, Arg1252.059
RGI-unit1.62Ser74, Lys76, Gln120, Glu1164.438
RGII-unit−2.83Ser3, Arg331.340
XGA-unit−1.16Ser3, Arg42.903
PE−4.85Asp102, Pro302, Trp3031.687
EGCG−3.57Cys270, Lys273, Arg274, Cys2393.073
Table 3. The L9 (33) orthogonal experiment design and results.
Exp. NumberPh (A)T(B) (°C)Pectin Concentration (C) (mg/mL)AbsorbanceEnzymatic Activity
11110.3690.219
21230.3470.188
31320.4230.275
42130.2890.173
52220.3450.234
62310.2910.151
73120.2770.087
83210.2420.042
93330.2810.044
K10.6820.4790.412
K20.5580.4640.596
K30.1730.470.405
K10.2270.1590.137
K20.1860.1540.198
K30.0570.1560.135
R0.1690.0050.063
Best levelA1B1C2
Table 4. Results of esterification determination.
PectinDegree of Esterification (%)
High-ester pectin68.8 ± 1.06
De-esterified pectin21.83 ± 1.68
Disclaimer/Publisher’s Note: The statements, opinions and data contained in all publications are solely those of the individual author(s) and contributor(s) and not of MDPI and/or the editor(s). MDPI and/or the editor(s) disclaim responsibility for any injury to people or property resulting from any ideas, methods, instructions or products referred to in the content.

