Article

Mercury Discharge Inventory Based on Sewage Treatment Process in China

1
China Energy Engineering Group Guangxi Electric Power Design Institute Co., Ltd., Nanning 530000, China
2
School of Environment, Northeast Normal University, Changchun 130117, China
3
Technical Innovation Center of Mine Geological Environmental Restoration Engineering in Southern Karst Area, Ministry of Natural Resources, Nanning 530000, China
4
State Environmental Protection Key Laboratory of Wetland Ecology and Vegetation Restoration, School of Environment, Northeast Normal University, Changchun 130117, China
*
Author to whom correspondence should be addressed.
Processes 2024, 12(7), 1534; https://doi.org/10.3390/pr12071534 (registering DOI)
Submission received: 29 May 2024 / Revised: 12 July 2024 / Accepted: 19 July 2024 / Published: 21 July 2024
(This article belongs to the Section Environmental and Green Processes)

Abstract

:
Mercury pollution is a serious public health problem. China’s extensive use and reliance on mercury has led to water pollution, particularly the presence of methylmercury in water. Estimating total mercury emissions from wastewater in China is challenging due to the large amount and wide range of emissions. An estimation model for total mercury content in sewage in China was established by establishing a relationship between sewage treatment volume, mercury content in effluent after sewage treatment, and the data of sludge production and mercury content in the sewage treatment plant. It was determined that only 3% of mercury entered the air during sewage treatment, 27.5% of mercury entered the effluent, and about 69.5% of mercury entered the sludge, based on the treatment of existing wastewater treatment plants in China. From 2002 to 2021, the average annual sewage mercury emission in China was 32.07 Mg, and the emissions were higher in densely populated and economically developed provinces such as Beijing, Shandong, Hebei, and Guangdong. By 2025, China’s mercury emissions are projected to reach 55.41 Mg. By 2035, China’s mercury emissions are projected to reach 49.3 Mg.

1. Introduction

Mercury (Hg) is a global pollutant and its presence in the environment has been a concern of scholars both nationally and internationally [1]. Some inorganic mercury entering the aquatic environment is methylated to produce the more toxic methylmercury, which is then enriched through the food chain, creating a risk of methylmercury accumulation and poisoning due to fish consumption [2]. However, ongoing research on mercury pollution has found that rice is selectively enriched by methylmercury [3,4], and consumption of rice from mercury-contaminated areas also increases the risk of methylmercury exposure [5]. Meanwhile, foreign studies have shown that methylmercury is commonly found in the effluent of municipal domestic wastewater treatment plants [4,6,7]. Continuous chemical leaching using the heptameric grading method with improved BCR extraction can increase extraction of humic acid-bound states [7], indicating that mercury in sludge in China is mainly in residual state, followed by the humic acid-bound state [8]. In addition, analysis of the sludge drying at 100 °C showed that no zero-valent mercury was present in the sludge [9].
Municipal wastewater treatment plants play an important role in society, which is removing various pollutants from municipal wastewater before the sewage is discharged into the receiving water body [10], so that the sewage treatment plants become the convergence point and potential source of harmful pollutants. National and international studies [11] have shown mass concentration of total mercury in urban domestic wastewater at levels of 0.8 mg/m3–2.76 mg/m3 [12]. After the treatment process in the sewage treatment plant, most of the total mercury in the effluent is transferred to the municipal sludge [13,14]. The total environmental contribution of mercury in the external discharge of 28 sewage plants in Switzerland is about 1.5–3% of the riverine mercury load, with an average value of 2.4%. The per capita mercury load in raw wastewater is 16 mg/year and in treated wastewater is 0.6 mg/year. The total mercury concentration in sewage sludge ranges from 320 to 1400 ng/g [15]. In the corresponding domestic studies, the environmental contribution of total mercury and methylmercury in the effluent from sewage plants was 15.2% and 6.83%, respectively. The average total mercury concentration in untreated sewage in China is 3400 ± 2600 ng/L (population-weighted mean ± standard deviation), which is nearly 1000 times higher than the total mercury concentration in the general freshwater system in China. The average concentration of total mercury in treated sewage is 160 ± 130 ng/L, and about 95% of total mercury in influent sewage is transferred to sewage sludge [4]. As a result, the vast majority of the mercury in the effluent goes into the sludge and some into the tailwater for discharge, with only 3% of the untreated effluent being released into the air by means of aeration. However, according to the size and number of wastewater treatment plants in China, it is estimated that the direct emissions of mercury from aeration in China are 6.4 kg per year [16], which is very small compared to the mercury contained in the sludge in the tailwater.
It is proven by the mass balance of typical wastewater treatment processes in China [13,17], that the net transport direction of mercury in sewage is water to air and water to sediment [18]. Studies have shown that the concentration of mercury in the sediment phase is much greater than its concentration in the water column, indicating a tendency for mercury to be enriched by entering the sediment again.
With reference to the relevant literature on the mass balance of mercury in wastewater treatment in China, it has been shown that pretreatment devices (for example, grates and sedimentation tanks) do not have a significant impact on the mercury content in the residual state, and that the mercury removed by pretreatment only accounts for 0.3% of the total mercury in the influent, with most of the remaining mercury entering the primary sedimentation tanks with the water. Primary sedimentation tanks can remove the mercury bound to the particulate matter through physicochemical effects such as adsorption and co-precipitation of the particulate matter. Moreover, most suspended particulate mercury can be removed by sedimentation under the influence of a long hydraulic residence time, and the removal efficiency for total mercury in primary sedimentation tanks is 58–79% [19].
The removal of total mercury and methylmercury from the effluent is mainly achieved in the secondary biological treatment unit of the wastewater treatment plant [20]. Biological treatment units are available to reduce mercury levels in effluent to a certain extent through active absorption by bacteria [21], adsorption of bacterial cells, and retention of colloidal precipitates [22]. Disinfection of tailwater from wastewater treatment plants only affects the form of mercury in the water, but does not remove it. A report on chlorine treatment disinfection showed no significant difference in dissolved methylmercury content compared to the filter effluent, as well as to the dissolved mercury content, while the UV disinfection system contributed significantly to the conversion of inorganic mercury, methylmercury, and methylmercury forms [23]. After passing through the aerobic section and sedimentation tank of the A2/O process before entering the UV disinfection system, most methylmercury and ethyl mercury are converted into inorganic mercury.
During the sludge treatment process, the mercury content does not change essentially, as it is only continuously transported between units, with the conversion of unstable mercury to stable mercury accompanying the production of methylmercury [24]. Eventually, the mercury enters the dewatering room with the digested sludge and is dewatered and transferred to the dewatered sludge. Most of the total mercury in the sludge enters the activated sludge and is discharged with the remaining sludge. Data show that about 60–90% of mercury enters the sludge through adsorption on mineral particles and bacterial surfaces, proving once again that the vast majority of mercury in sewage enters the sludge. The United Nations Environment Programme (UNEP) is working on a plan to reduce mercury globally [25], requiring estimates of national emissions of mercury from major sources in each country. The main purpose of this study is to establish a mercury emission estimation model for municipal sewage treatment plants and a mercury emission inventory for domestic sewage discharge in China through statistical analysis of the total mercury emission from wastewater treatment plants in China in the past 20 years, so as to provide basic data and scientific basis for the calculation of the total mercury in wastewater and the treatment of mercury in wastewater in China.

2. Materials and Methods

According to the literature, the total amount of mercury discharged from domestic sewage and the difference in the distribution of mercury content in sewage sludge by different processes were calculated. Based on this, the mercury discharge list of domestic sewage in various provinces and cities can be obtained.

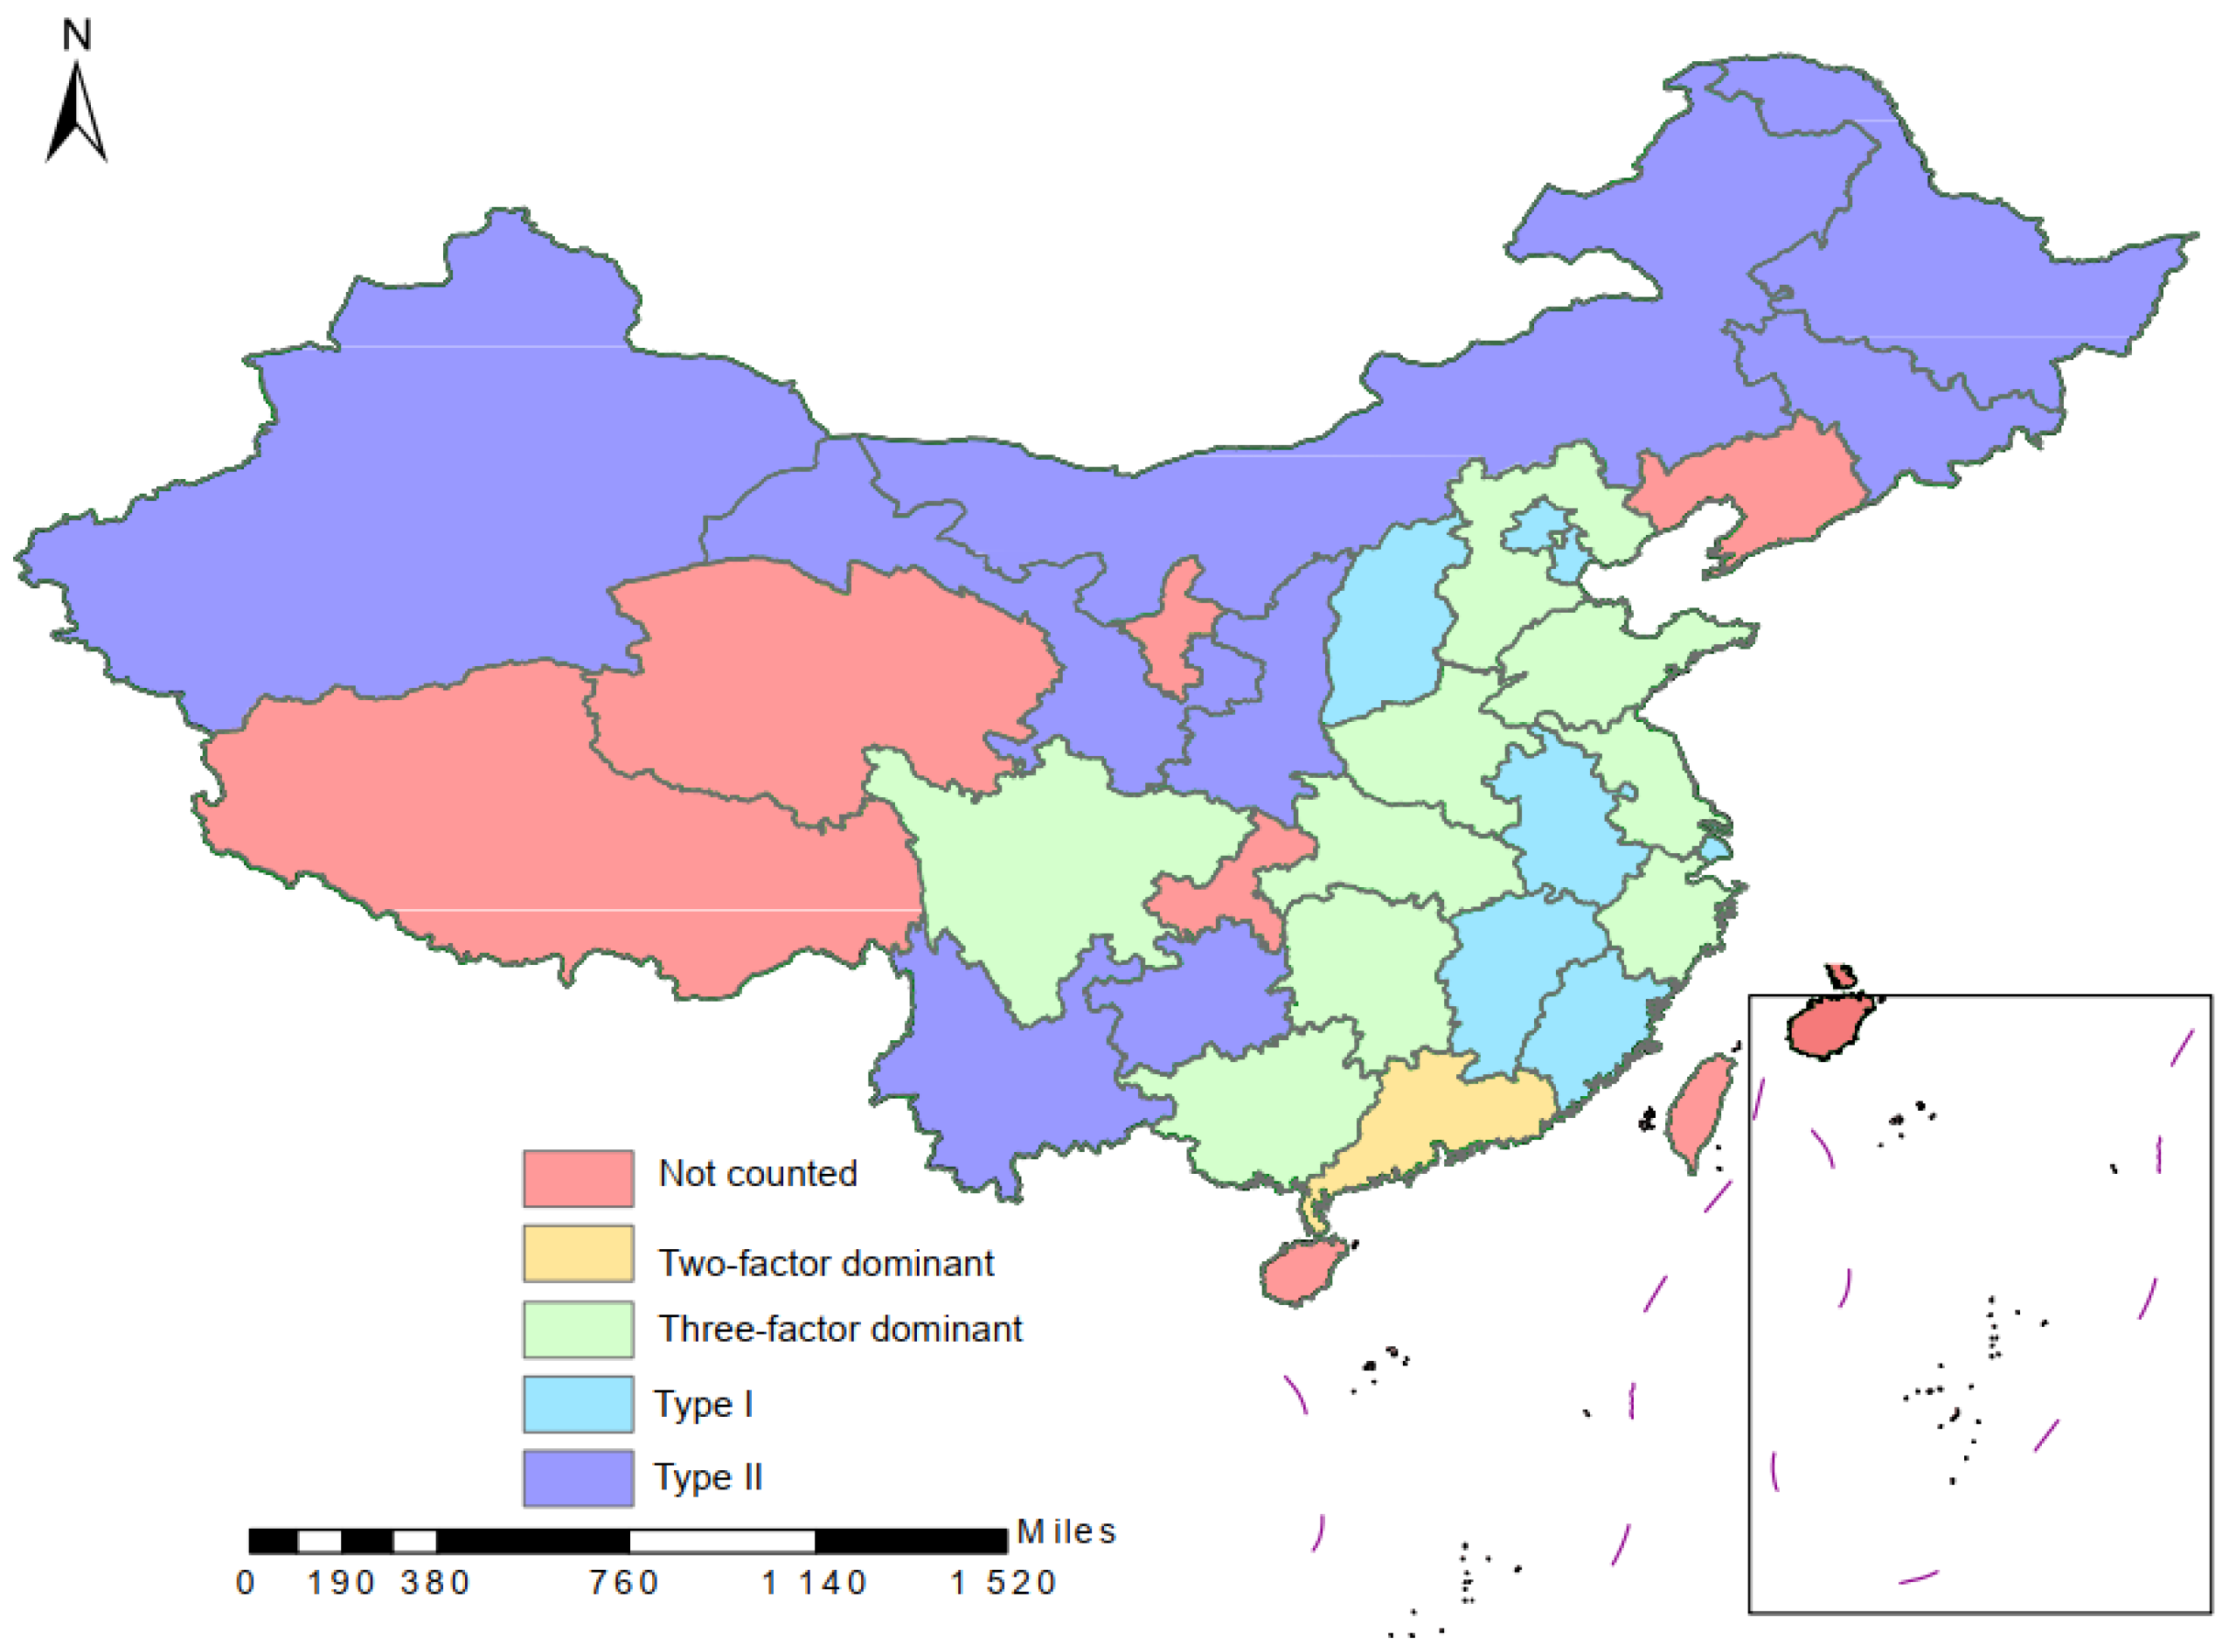
2.1. Overview of the Study Area Characteristics

The study area of this paper is domestic wastewater treatment plants in China. There are 2827 urban sewage treatment plants in China, with an annual treatment capacity of 6.02 × 10¹⁰ m3 and a dry sludge production of 1.42 × 10⁷ t, and 1765 county sewage treatment plants, with an annual treatment capacity of 1.04 × 10¹⁰ m3 and a dry sludge production of 2 × 10⁶ t up to 2021. The current treatment measures for sludge in China mainly include: sludge landfill [26], sludge land use [15], and sludge incineration treatment [27], but improper disposal of sludge creates a huge environmental hazard. The operating load of different wastewater treatment plants varies considerably, with the average operating load factor of wastewater treatment plants in China being around 83% and 52% of wastewater treatment plants operating at less than 80% of the load. Of the wastewater treatment plants that met the Class I-A discharge standard of the Emission Standards for Pollutants from Urban Wastewater Treatment Plants (GB 18918-2002) [28], approximately 28% were built after 2010. The sludge treatment and recovery rate are only 25%, about 15% of wastewater treatment plants are inefficient, and about 60% of wastewater treatment plants have a treatment capacity of 104 m3/d to 5 × 10⁴ m3/d [29].
For China’s residential drainage, the amount of domestic sewage discharged by urban residents is directly related to the number of people, the intensity of water demand, and the amount of pollutants discharged per capita, which in turn is inextricably linked to income levels, local water endowments, water consumption habits, and the degree of regulation [30,31]. The influencing factors are complex, so there are large spatial and temporal differences in the amount of sewage discharged between provinces in China.
According to the natural geographic location division proposed by The China Urban Construction Statistical Yearbook [32], the construction and operation of sewage treatment facilities in China is currently unbalanced between the east, central, and western regions, and the total amount of urban sewage discharge and the total amount of sewage treatment in the eastern region are much higher than that in the central and western regions. In the comparison between the central and western regions, although the difference between the total indicators is not significant, the difference in per capita level is caused by the difference in population density, the urban sewage treatment rate in the central region is lower than that in the western region, so this study also uses this classification method: China is divided into three parts according to the natural geographical location of the east, central, and west for analysis.

2.2. Data Sources and Processing Methods

2.2.1. Calculation of Mercury Emissions

According to Web of Science, CNKI (China National Knowledge Infrastructure), and other databases, more than 30 relevant studies were identified for key words such as “wastewater treatment plant”, “wastewater mercury”, and “mercury emission inventory”; ultimately, 10 valid studies were identified. Based on data publicly reported in the literature and the concentration of total mercury in the main domestic wastewater of each province in China, the amount of mercury discharged from domestic wastewater in each province was calculated according to Equation (1). The average value of 0.2 mg/m3 of the existing research results was used as the result of this study. By collecting data from measurements of mercury content in sludge in China for 2006, 2013, 2016, and 2018, the mercury content in sludge varies relatively little from a national perspective. Considering the effect of temperature on the mercury content in sludge, the different sampling points of the data, and the technical reasons for the analysis of the mercury content in sludge, the mercury content in sludge in each province was determined using the weighted average of the measurements for many years. The amount of mercury contained in the sludge in each province was calculated according to Equation (2), and based on the flow of mercury in the treated effluent, it was determined that most of the mercury in the effluent remains in the sludge and a small amount goes into the tailwater, while for the mercury discharged into the air, the amount is not considered in the estimation due to its small content; therefore, the total amount of mercury in the national domestic effluent is calculated according to Equation (3).
T H g i = c i × V i
T H g j = c j × V j
T H g ( C h i n a ) = Σ T H g i + Σ T H g j
In Equation (1), T H g i indicates the discharge of mercury in tailwater after treatment in each region, c i indicates the concentration of total mercury in tailwater after domestic wastewater treatment in each region, and V i indicates the discharge of domestic wastewater in each region.
In Equation (2), T H g i indicates the amount of mercury emissions from sludge in each region. c j indicates the concentration of total mercury in domestic wastewater in each region, and V j indicates the amount of sludge discharged after treatment in each region.
In Equation (3), T H g ( C h i n a ) represents the total mercury discharge from domestic wastewater in China.

2.2.2. Calculation of Dry Sludge Production Per Ton of Water in China

The tons of sludge produced by different wastewater treatment processes were calculated based on the weighted calculation of the tons of sludge produced by different wastewater treatment processes and combined with the use of treatment processes in Chinese municipal wastewater treatment plants [33,34,35].
x ¯ = x 1 ω 1 + x 2 ω 2 + x n ω n ω 1 + ω 2 + ω n
In Equation (4), the weight ω is the usage rate of each process and x is the amount of sludge produced in each ton of water. The production of tons of water sludge and the usage rate of various sewage treatment processes in China are shown in Table 1. At present, the highest utilization rate of sewage treatment technology is the oxidation ditch method, the utilization rate of which reaches 21%. The largest amount of aquatic sludge per ton is the A/O method, which reached 321 g, and the rest of the process has little difference in the amount of aquatic sludge per ton.

2.2.3. Estimation of Total Mercury in Sewage

Based on data on mercury in sludge from the literature from 2002 to 2021, the arithmetic mean for each city in a province was used to represent the amount of mercury in sludge in that province, weighted by the total amount of wastewater treated in each province.
A ¯ = A 1 r 1 + A 2 r 2 + A n r n r 1 + r 2 + r n
In Equation (5), r is the proportion of dry sludge generated in each province to each region and A is the amount of mercury per kg of dry sludge in each province.

2.2.4. Revised Calculation of Sludge Predicted Yield

The average sludge production in China from 2002 to 2021 was estimated according to Equation (6) based on the calculation of the dry sludge production of each ton of water in China.
y ^ = y k
In Equation (6), the slope k is obtained by plotting the actual sludge yield as x and the predicted sludge yield as y. These data are plotted in an x-y right-angle coordinate system and calculated using least squares, with y ^ being the corrected predicted sludge yield.

3. Results

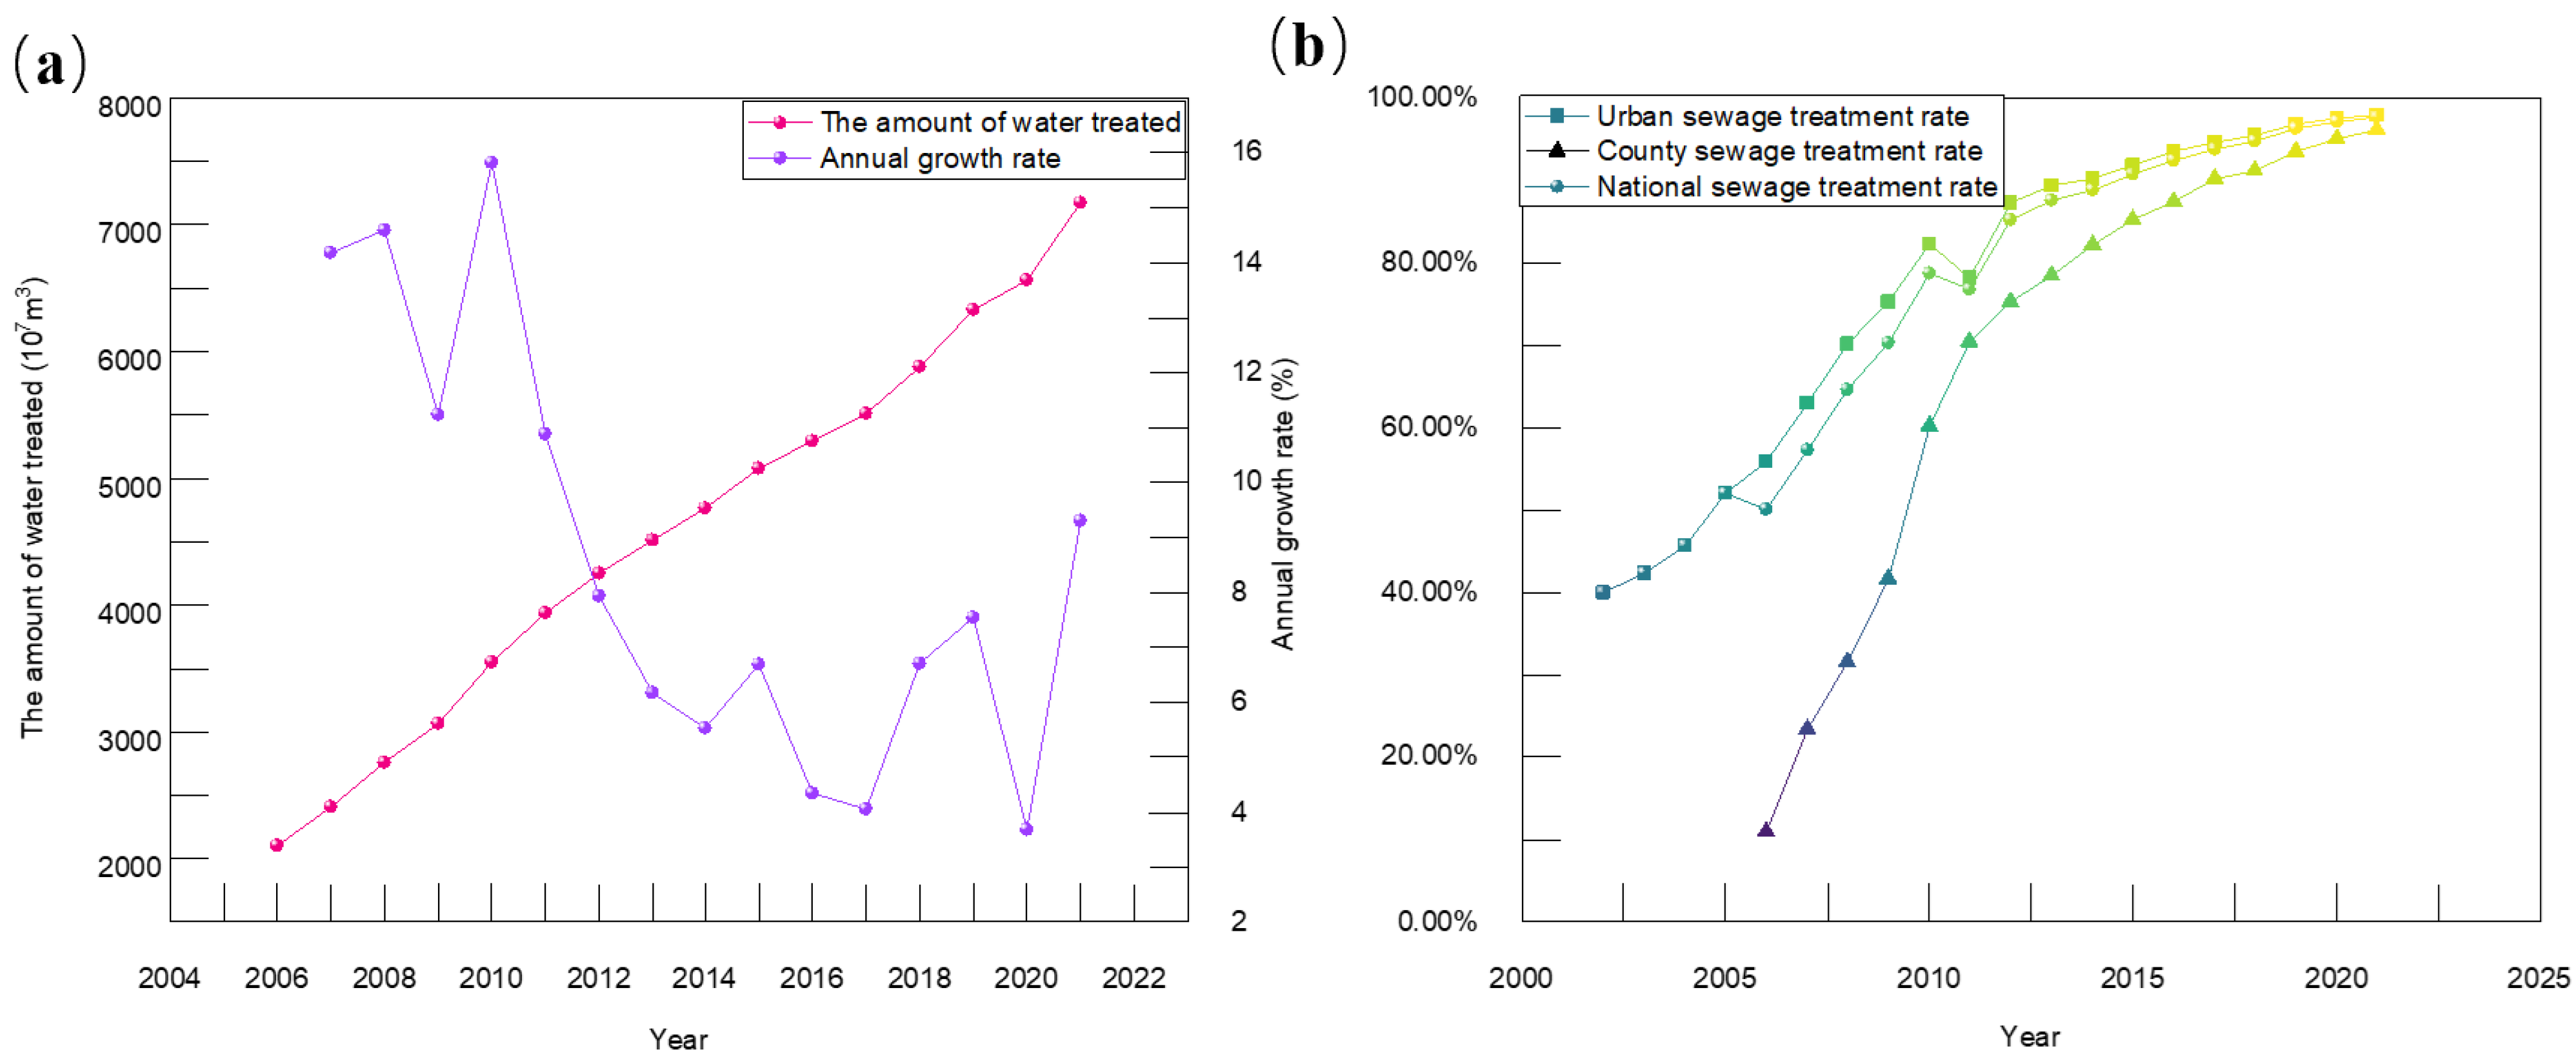
3.1. Relationship between Sewage Discharge and Total Mercury

As China is using a limit on the concentration of mercury in wastewater at this stage, there is a direct correlation between the amount of wastewater discharged and the total amount of mercury in the wastewater. By compiling data on the total amount of wastewater treated and the amount of dry sludge produced in China from 2002 to 2021, the results show that there is a strong relationship between dry sludge production and total wastewater treatment (R2 = 0.9238), and a strong statistical significance between the two with a high degree of confidence (p = 0.1099).

3.1.1. Analysis of the Causes Affecting the Change of Sewage Discharge

Since the 1980s, China’s urbanization process has developed rapidly, with the urbanization rate increasing from 18.9% in 1980 to 60.6% in 2019. The growth of urbanization rate leads to the rapid increase of urban sewage discharge. Domestic sewage, which accounts for over 70% of urban sewage discharges and includes human living, bathing, and toilet excretion, is the main source of urban sewage discharge. Industrial and agricultural wastewater discharges are relatively small, accounting for about 10% and 20%, respectively.
With the increasing awareness of environmental protection, the Chinese government has also strengthened its control over sewage discharge. By the end of 2018, the total investment in the construction of urban sewage treatment facilities in China had reached RMB 729.2 billion, an increase of 17.6% compared to the same period last year, and is expected to continue to grow at a rate of more than 15% during between 2020 and 2030. In 2015, China introduced The Action Plan for the Prevention and Control of Water Pollution [36], which plans to fully complete the construction of urban sewage treatment plants by 2020 and achieve an urban sewage treatment rate of more than 95%. By the end of 2020, China had built a total of 22,000 sewage treatment plants, with the urban sewage treatment rate reaching 93.4%.

3.1.2. Difference Analysis of Domestic Sewage Discharge between Regions

The variability of domestic wastewater discharges between regions in China is mainly influenced by factors such as the level of economic development, geographical and climatic conditions, urban–rural differences, and the abundance of water resources. Domestic wastewater discharges are composed of human waste and other household wastewater from daily life, and they consist of a variety of pollutants, including organic and inorganic substances.
According to the LMDI (logarithmic mean Divisia index) model developed by Chen et al. [37], in terms of the national total, the scale of economic development is the dominant driver of the increase in domestic wastewater emissions, with the scale of economic development bringing an average annual increment of over 3.6 × 10⁹ t; technological progress is the dominant factor inhibiting the increase in domestic wastewater emissions, bringing an average annual reduction of over 4.4 × 10⁹ t. This shows that technological progress is crucial in alleviating the pressures of domestic wastewater discharges on the environment and achieving sustainable development. Such progress involves better wastewater treatment technologies, the implementation of policies and regulations, and public education and awareness-raising activities.
Chen et al. [37] used the least variance method and combined the four-factor level to classify the types of dominant drivers of changes in domestic wastewater emissions in each province into two-factor dominant, three-factor dominant, and four factors acting together type (Type I and Type II). Among these, the two-factor dominant type is dominated by the level of technological progress and the scale of economic development, and only Guangdong belongs to this type. The three-factor dominant type is dominated by the level of resource utilization, the level of technological progress, and the scale of economic development. According to the level of economic development, the four factors acting together type can be divided into Type I and Type II, and Type I belongs to the highest level of rivalling. The economic scale and urbanization of this type have reached a higher level, while the water resource utilization efficiency and sewage treatment technology level are higher, and the contribution value of each driving factor to the variation of domestic wastewater discharge is relatively balanced. However, the contribution of each driving factor of Type II to domestic wastewater discharge was relatively low. Because sewage production is closely related to the total amount of mercury in sewage, the total amount of mercury discharged from sewage varies greatly between regions
From the distribution map of dominant driving factors in various provinces (Figure 1), it can be seen that the majority of northern provinces in China are competing with the four-factor Type II, while the eastern coastal areas are mostly dominated by the three-factor type, while there are few provinces with the four-factor type and the two-factor dominant type.
The total amount of mercury in the effluent can be estimated for each province by calculating the mercury content in the sludge and the mercury content in the tailwater separately for each province. Based on the statistical production of sludge in tons of water for different processes, China’s sludge production was analyzed through the different process percentages counted in the literature, and the calculated data was compared with the data on the production of dry sewage sludge from regional urban and county sewage treatment plants in mainland China from 2002 to 2021. For each province, the difference between the predicted value of sludge and the actual yield of sludge is not large (Figure 2a). From the perspective of the whole country, there is a strong relationship between the dry sludge yield and the predicted value of dry sludge (R2 = 0.9697, Figure 2b) with good fitting. Therefore, it is feasible to estimate sludge production by combining the total sewage volume with the use of existing wastewater treatment processes in China, and after correction, it was decided to use 202.191 g as China’s sludge production per ton of water in the estimation of China’s future sewage sludge generation.

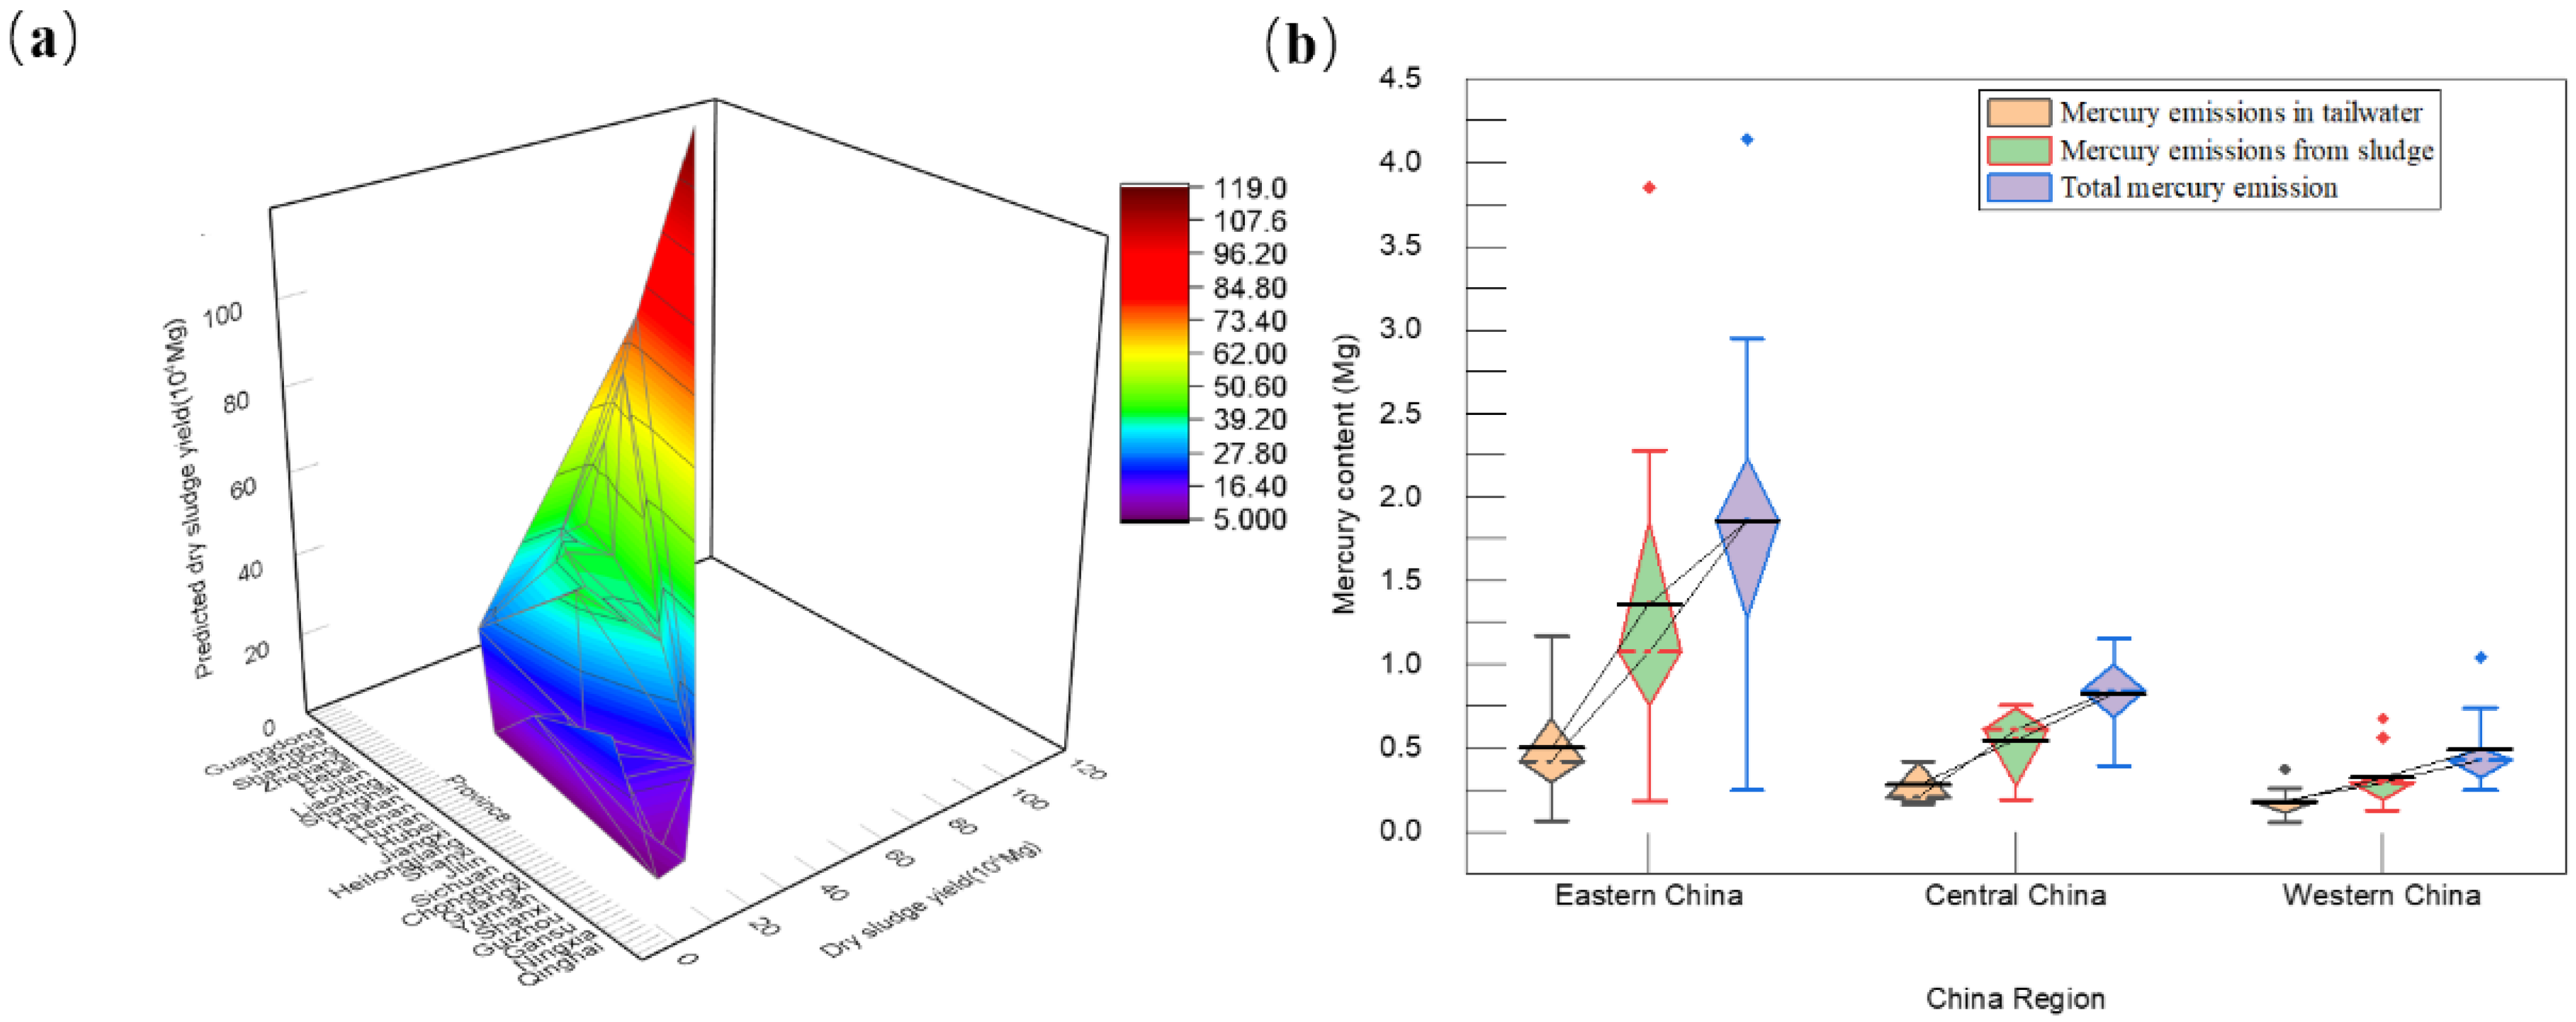
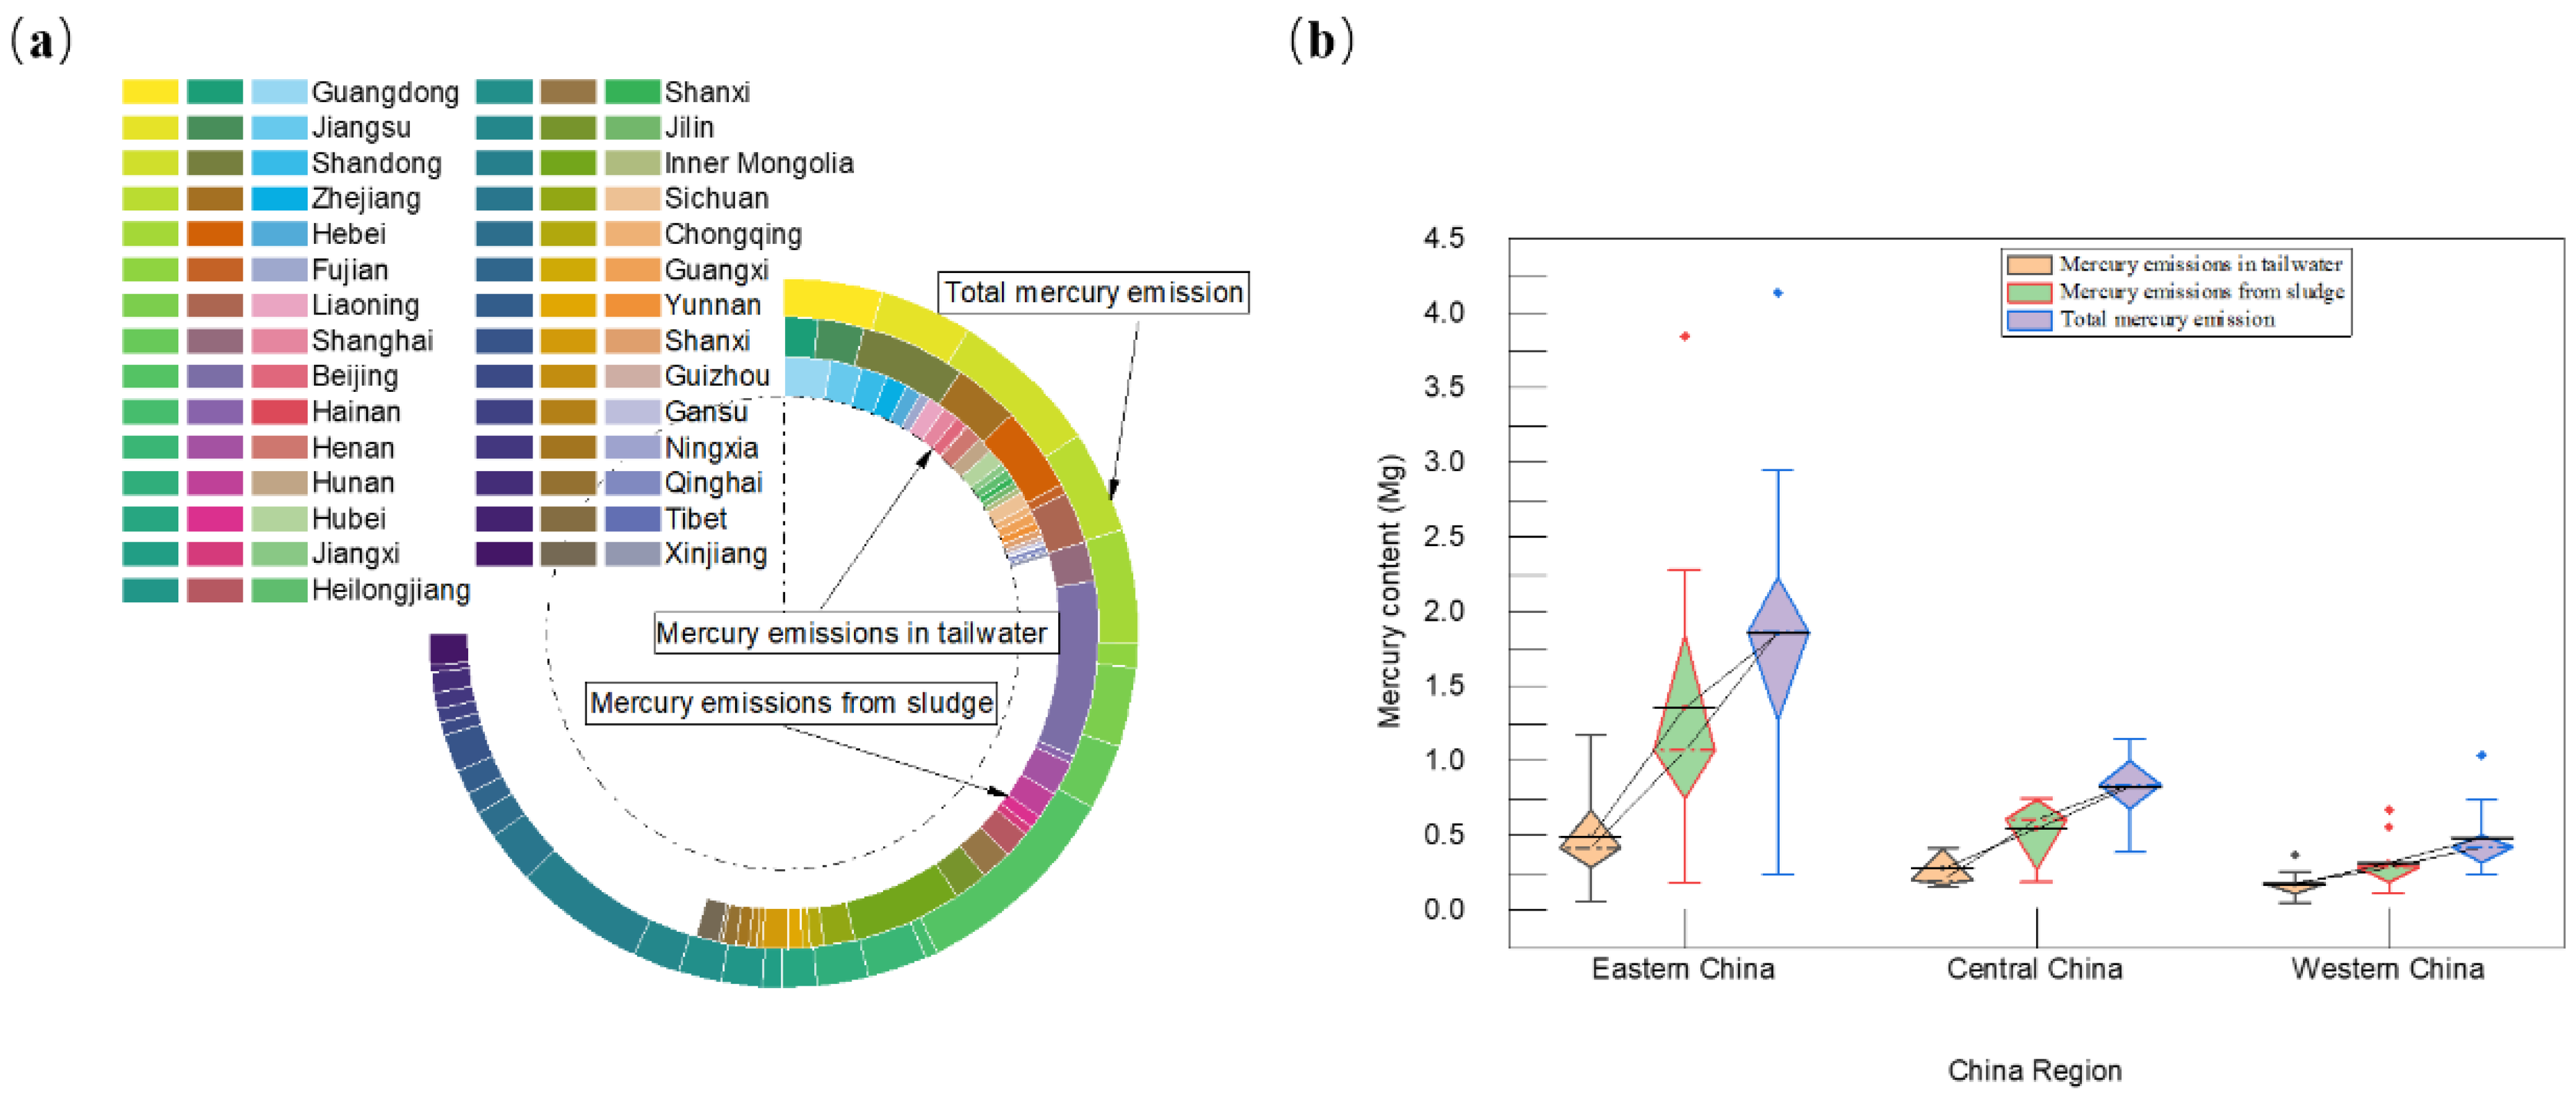
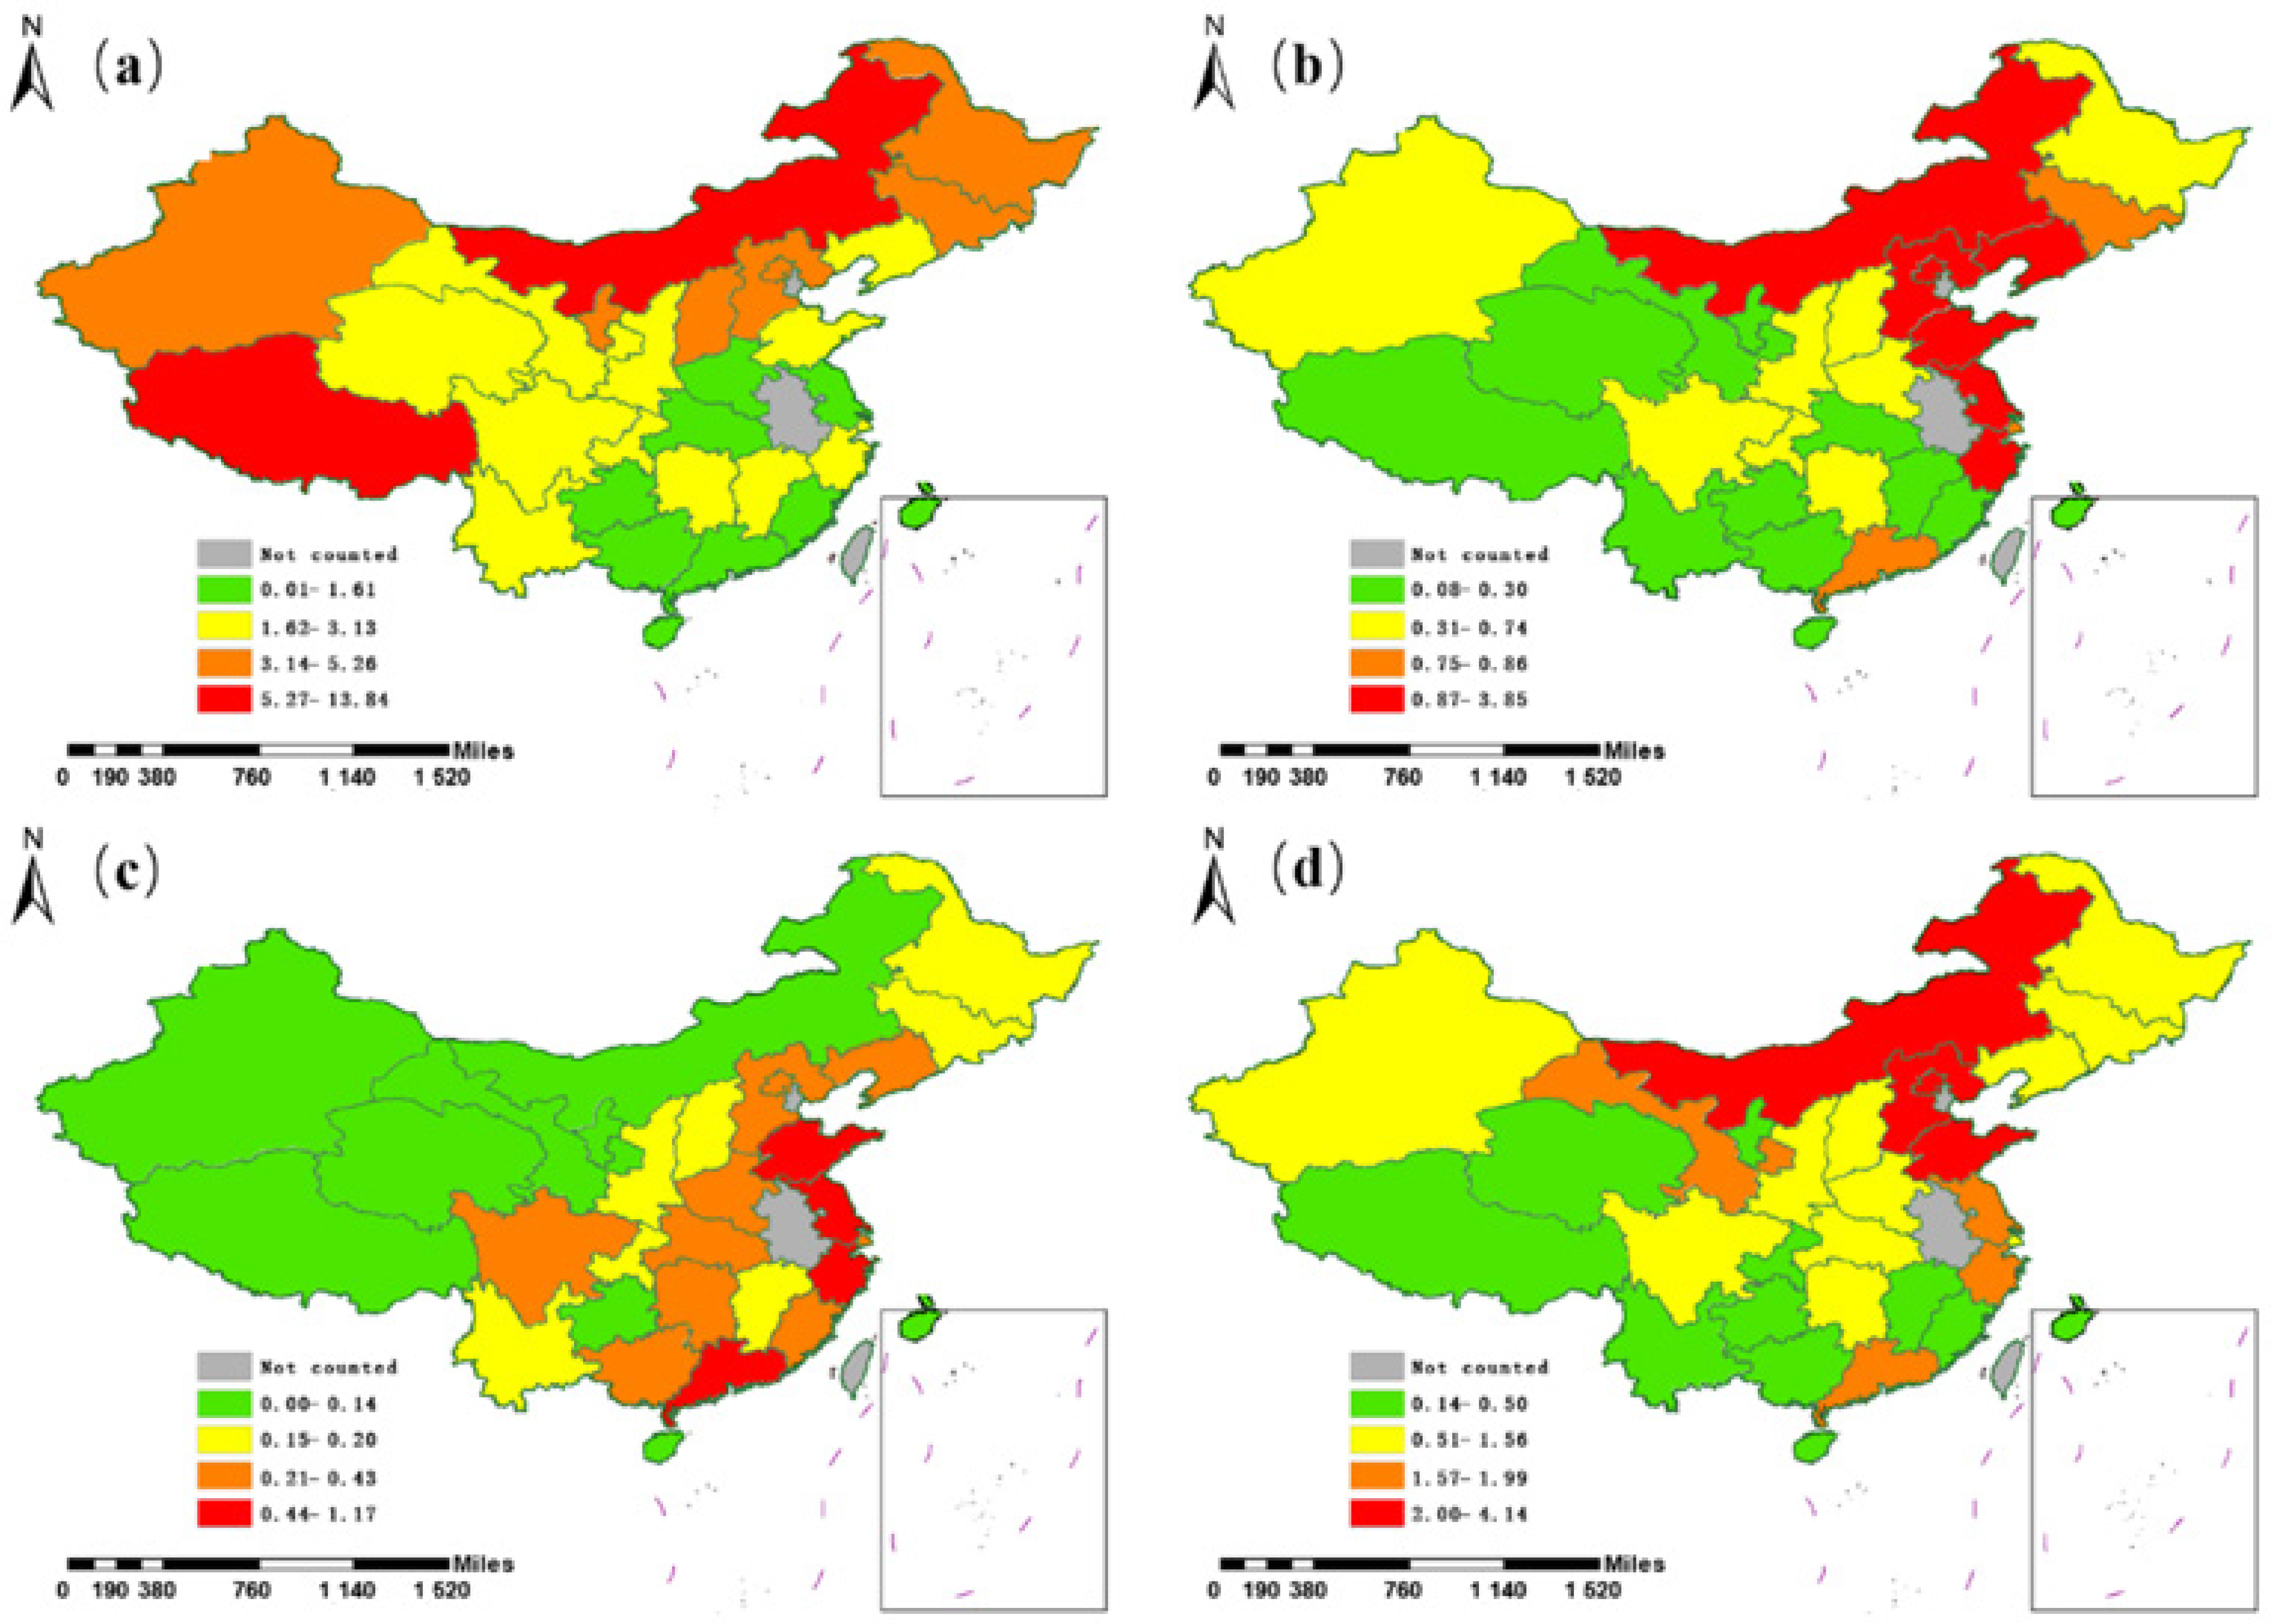
3.2. Mercury Discharge in Domestic Sewage

It can be clearly found that the total amount of mercury in sewage is relatively high in Beijing, Shandong, Hebei, Guangdong and other densely populated and economically developed provinces, among which the total amount of mercury in sewage of Beijing is high (4.14 Mg) (Figure 3). It can also be seen that the total amount of mercury in sewage of Beijing accounts for 14.4% of the total amount of mercury in sewage of China (Figure 4a). The boxplot shows that, at the regional scale, the total amount of mercury in sewage in eastern and central regions is significantly higher than that in western regions, and within the regions, there are great differences among provinces in the effluent mercury discharge, sludge mercury discharge, and total amount of mercury (Figure 4b). Integration of data from several articles on mercury content in effluent shows that the mercury content of tailwater from wastewater treatment plants in China was estimated to be 2.48 mg/kg, while the mercury content of tailwater from wastewater treatment plants was determined to be 0.2 mg/m3. As well as estimating the mercury content in sludge by province by reporting national sludge sample mercury content data for 2006, 2013, 2016 and 2019, the weighted calculation gives an average mercury concentration in Chinese sludge of 2.48 mg/kg. Compared to the average mercury content of Japanese sewage sludge of 1.0 mg/kg [38,39,40,41,42], the mercury content of Chinese sludge is twice as high as that of Japanese sludge.
Combining the data obtained from the calculations, the final determination of the mercury content in domestic wastewater in China was 0.701 mg/t, which is below the emission limit of 1 mg/m3 required by China. The average annual total domestic wastewater treatment in China from 2002 to 2021 was 4386.46 × 107 m3, and the total amount of mercury discharged from the effluent was 30.74 Mg. By comparison, the United States released only 3.16 Mg of mercury to water from 1987 to 1993, which is significantly less than the amount of mercury released to water in China. However, this difference may be due to the earlier statistical time and incomplete data statistics.
Mercury is a toxic substance that can cause harm to human health and the surrounding environment when discharged into the water. Therefore, it is necessary to strictly control the discharge of mercury into the environment through the implementation of emission limits and effective wastewater treatment technologies. The final determination of the mercury content in domestic wastewater in China being below the emission limit is a positive result, reflecting the efforts made by the Chinese government in pollution control and sustainable development. However, further research and monitoring are still needed to continuously reveal the current state of mercury emissions and its potential risks to the environment and human health.
Through the comparison of mercury content in sludge (Figure 5a), it can be found that the mercury content in sludge is highest in the central region at 2.95 mg/kg. The analysis determined that the mercury content in the sludge in Inner Mongolia was too high, which may be related to the increase of mercury emission caused by the rich mineral resources in Inner Mongolia. The mercury content in sludge in the eastern region is the lowest, 2.23 mg/kg, which is related to the relatively developed economy and high sewage treatment level in the eastern region. However, due to the dense population in the eastern region, under the influence of multiple factors, the sewage production is large (Figure 5b), the dry sludge production is the highest, and the total sludge mercury content is the highest (accounting for 58.62% of the country). It can be found that the average mercury emission after domestic sewage treatment in all provinces is 0.05–1.17 Mg, among which Guangdong Province is the highest, accounting for 13.37% of the mercury emission after domestic sewage treatment in China (Figure 5c). The mercury emission of sludge from different provinces was significantly different, and the maximum difference was 3.77 Mg, among which Beijing was the highest (3.85 Mg; 17%) and Tibet the lowest (0.08 Mg; 1.81%). By comparing the total amount of mercury discharged from domestic sewage in different provinces, it can be seen that the total amount of mercury discharged from domestic sewage in Beijing is the largest, which is 4.14 Mg, accounting for 10% of the total amount of mercury discharged from domestic sewage in China, followed by Shandong (2.95 Mg; 9%) and Inner Mongolia (2.55 Mg; 7.94%) (Figure 3 and Figure 5d).

4. Discussion

4.1. Analysis of Total Mercury in Sewage

4.1.1. Impact and Effectiveness of Environmental Policies

From the perspective of environmental protection policies, several international organizations and governments have formulated monitoring and restriction policies for mercury, such as the United Nations Environment Programme Convention on Mercury Control and Reduction and the EU Water Framework Directive, which aim to protect human health and environmental safety and reduce mercury pollution and emissions. At the national level, China has also strengthened its monitoring and control of mercury and has developed a series of environmental laws and standards, such as the Water Pollution Prevention and Control Law and the Technical Policy on Mercury Pollution Prevention and Control. The introduction of these laws and policies will help to manage and reduce mercury pollution and protect human health and environmental safety.
The development of mercury emission standards in China has gone through a process from simple to complex, from total control to gradual refinement and upgrading, and the development and improvement of standards are closely related to the development of mercury pollution management and control. From the early 1980s to the late 1990s, China’s emission standards for mercury were still relatively simple and imperfect, and were mainly based on total volume control. Between the beginning of the 21st century and 2010, China began to gradually improve its mercury emission standards and policies and to regulate mercury emission standards, incorporating them into the emission standards of various industries. From mid-2010 to the present, China has strengthened the management and control of mercury pollution by introducing a series of policies and standards for mercury pollution management; for example, the emission standards for mercury are strictly limited in the Emission Standards for Pollutants from Urban Wastewater Treatment Plants released in 2017.

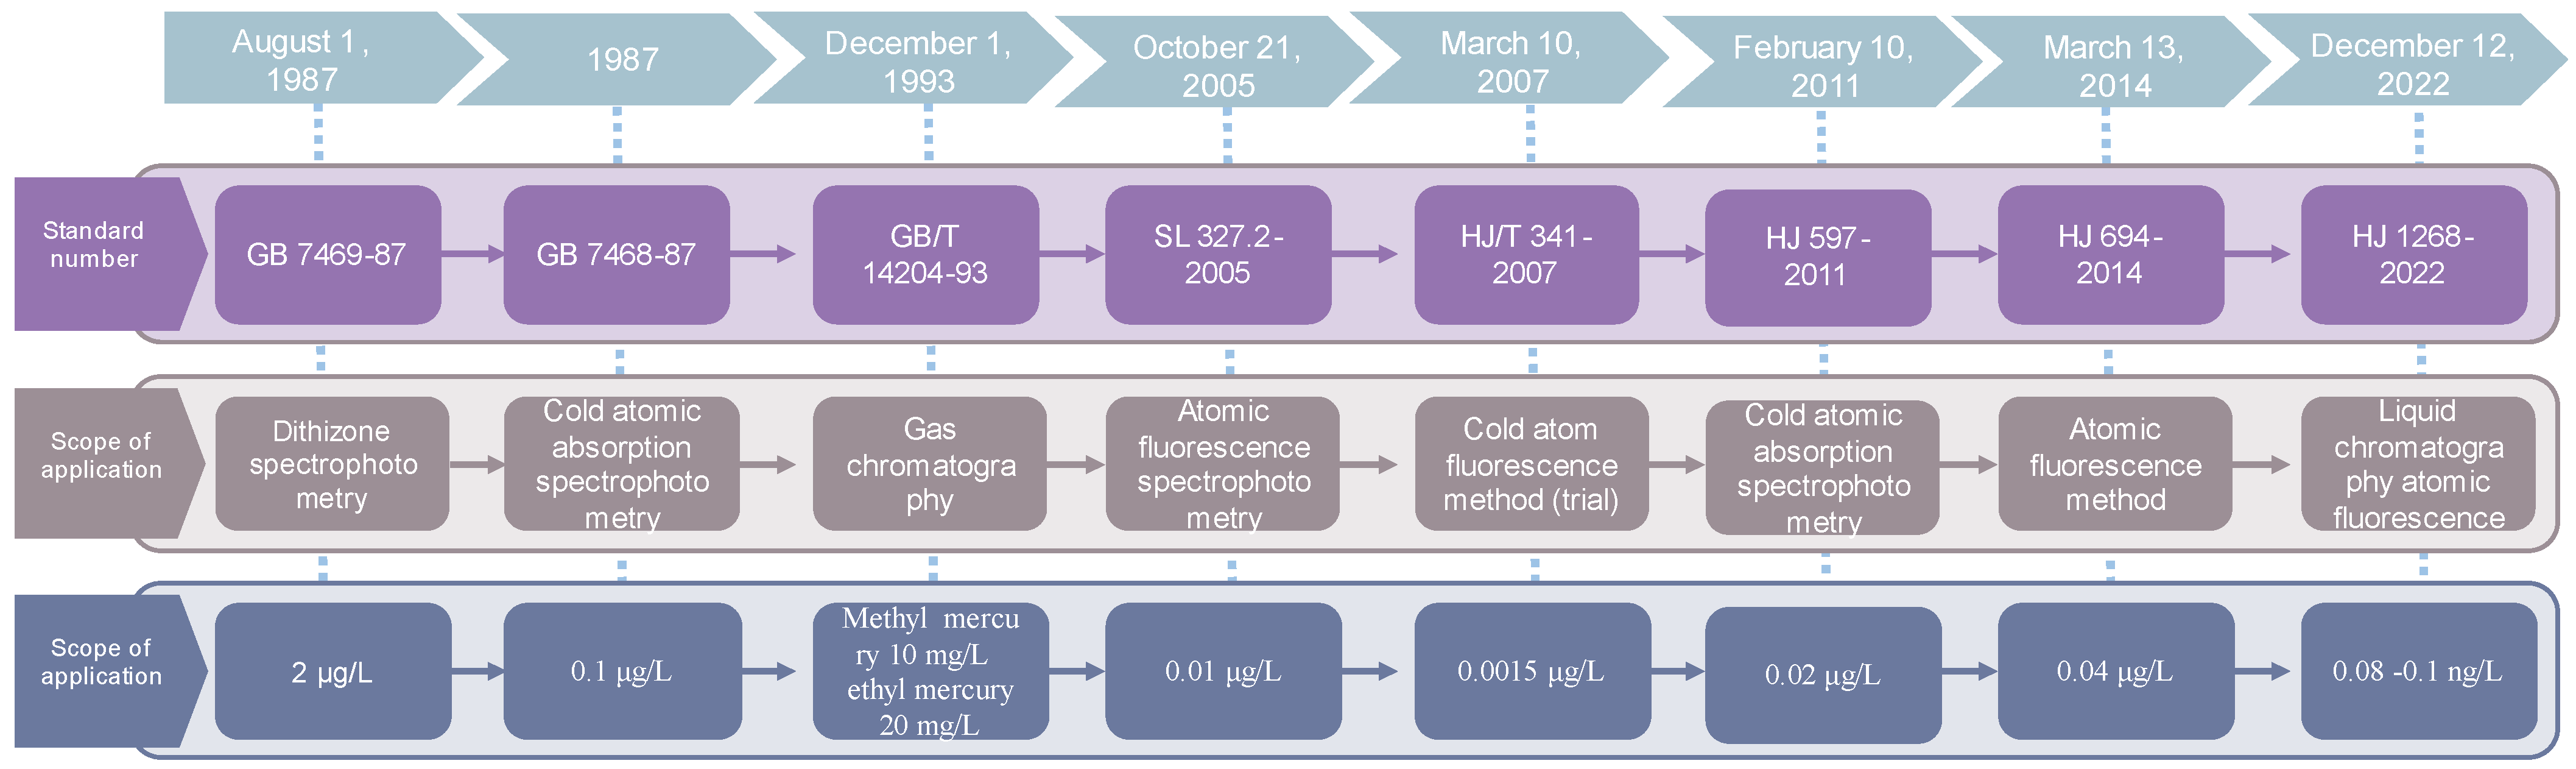
4.1.2. Measurement Methods and Their Development History

The development of methods for the determination of mercury in water in China in recent years (Figure 6) indicates the continuous improvement of measurement technology in China, with a great increase in precision and sensitivity. The cold atomic absorption method uses air as carrier gas to quantitatively determine the absorption of mercury atoms to characteristic spectral lines. This method is complex and has long analysis time and low sensitivity. Hot atomic fluorescence spectrometry has become one of the most widely used instruments for detecting heavy metals such as mercury due to its high sensitivity, low detection limit, and low interference. Cold atomic fluorescence is an important analytical method for the determination of mercury which has been developed rapidly in recent years. The instrument has the advantages of convenient operation, high sensitivity, and low cost.
With the development of technology and the strengthening of environmental requirements, methods for the determination of total mercury in wastewater are constantly being upgraded and improved. The new methods are not only more accurate and sensitive, but also minimize costs and allow for online monitoring and shorter analysis times. The improved method is also more environmentally friendly and safer, avoiding the dangers and pollution associated with waste disposal. The change in the measurement method allows us to more accurately understand the change in the total amount of mercury in sewage.

4.1.3. Influence of Residents’ Living Habits on Mercury Content in Sewage

The impact of the living habits of the Chinese people on the total amount of mercury in domestic wastewater comes mainly from catering, bathing, washing, and medical wastewater. These activities generate large amounts of wastewater, which contains mercury that can pollute the water environment. With the reform and opening up and the development of social economy, the influence of the living habits of the Chinese people on the total amount of mercury in domestic wastewater and the extent of their influence have changed considerably.
Complex sources of mercury in domestic wastewater include daily cosmetics, broken thermometers, amalgam dental fillings and pharmaceuticals, pigments, and wood preservatives. In a survey conducted in the United States, mercury discharges from dental practices were identified as the largest source of mercury entering wastewater treatment plants, followed by hospital and residential waste [43]. The amalgam used in dentistry is also widely used in China. In addition, Chinese hospital thermometers and blood pressure monitors, some traditional medicines [44,45,46,47], cinnabar, and gold amalgam use a significant amount of mercury. With the control of mercury used for domestic purposes in China in recent years [48,49,50], the use of mercury will be greatly reduced in the future. Residents’ pursuit of health has also greatly reduced the incidence of mercury in their lives.

4.1.4. Types of Industries Emitting Mercury

Major industrial types that cause mercury to be released as waste include coal burning emissions, non-ferrous metals, cement manufacturing, and the indigenous metallurgical industry. The manufacture of some medical materials may also emit waste containing mercury. These industries may use mercury in the production process or produce mercury-containing waste, and mercury may be collected in the form of waste along with production wastewater to the sewage treatment plant, resulting in an increase in the mercury load of the sewage treatment plant.
With the development of science and technology, the mercury content of sewage discharged by factories will decrease, but the increase in the number of factories and production capacity will lead to the increase of the amount of sewage entering the sewage treatment plant, and the change of the total mercury content of the sewage treatment plant load is uncertain.

4.2. Changing Trend of Mercury in Sewage

4.2.1. Changing Trend of Sewage Treatment Rate

It can be seen from the change of China’s sewage treatment rate and the change of sewage treatment volume from 2002 to 2021 (Figure 7) that China’s sewage treatment rate is increasing year by year, and the sewage treatment rate of counties is lower than that of cities.
As the statistics in this paper are derived from treatment plant treatment data alone, and it is challenging to estimate the amount of mercury that is discharged into the environment without treatment; changes in the treatment rate directly affect the total amount of wastewater treated, which in turn has a greater impact on the estimated total amount of mercury in wastewater treatment.

4.2.2. Changing Trend of Mercury Content in Sewage

As most of the mercury in the effluent goes into the sludge, the trend in the mercury content of the sludge gives a fair indication of the trend in the mercury content of the effluent.
From a large number of statistics from countries such as the UK and the US, it is a general trend that the heavy metal content in municipal sludge is gradually decreasing due to social and economic development and the improvement of technology. The latest statistics from the EU’s official website also support this view: there has been a general decline in the heavy metal content of municipal sludge in major European wastewater treatment plants over the past 20 years.
However, measurements of mercury content in sludge from Chinese provinces and municipalities in 2006, 2013, 2016, and 2019 were collected and showed no major changes in the mercury content in Chinese sludge [50] (Table 2). Moreover, the measurement method and temperature affect the mercury content in the sludge. Therefore, the weighted average of the mercury content in sludge measured in each province and municipality over a number of years is a good representation of the mercury content in sludge in each province and municipality.
The development trend predicts that the mercury content per kilogram of sludge will gradually decrease with the enhancement of wastewater treatment technology and the improvement of relevant environmental regulations.

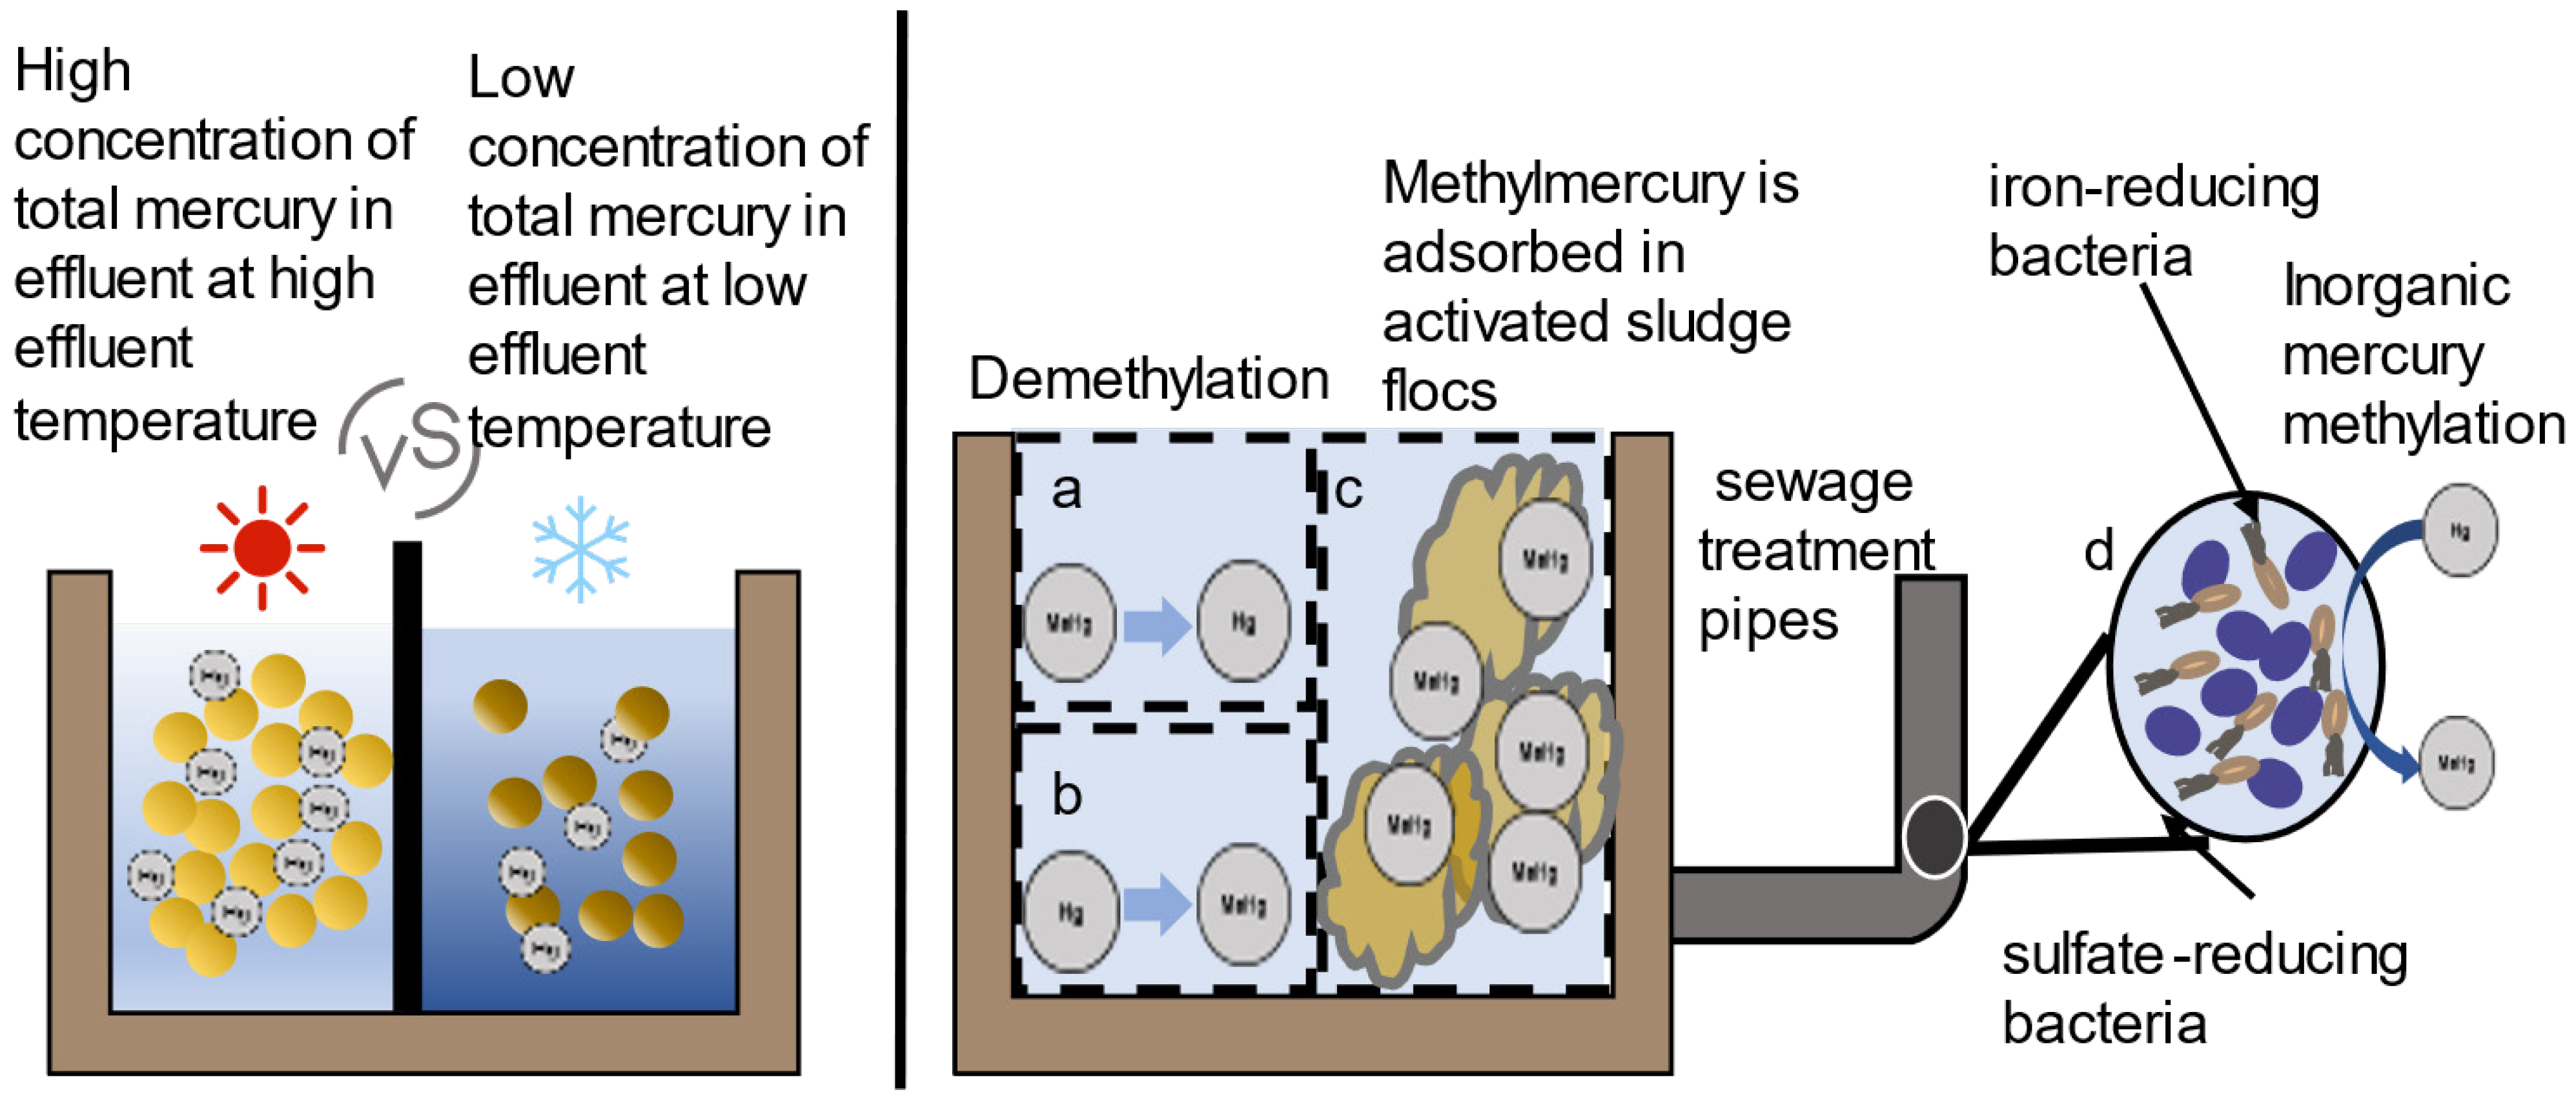
4.3. Removal and Transformation of Mercury in Sewage Treatment Process

4.3.1. Removal of Total Mercury

Due to the high affinity of mercury itself for particulate matter, effective removal of mercury from wastewater treatment plants is achieved at all stages of the treatment process due to adsorption of suspended particles (>90%).
The significantly higher proportion of total dissolved mercury in the effluent from the disinfection tank compared to the influent from the sedimentation tank is due to the fact that the effluent plant removes more particulate mercury than dissolved mercury, resulting in a higher proportion of total dissolved mercury in the effluent from the disinfection tank. As a whole (Figure 8), the total mercury content shows a trend of low in the high temperature season and high in the low temperature season. Comprehensive analysis of the settling performance of particulate matter during the wastewater treatment process suggests that this result may be due to the low wastewater temperature during the low temperature season, while the sludge load is high, the microbial metabolic rate is slow, and the sludge settling performance is poor, resulting in a high total mercury content in the effluent, with the opposite variation in each of the high temperature seasons. Dissolved mercury does not show a clear pattern of temporal variation, mainly because the distribution of mercury content in the particulate and dissolved phases are influenced by many factors. The sorption and resolution processes of inorganic and organic mercury on suspended particulate matter and substrate particles are important determinants of dissolved mercury concentrations in the water column, and the partitioning of mercury between dissolved and stationary phases can influence the mobility and activity of morphological mercury.

4.3.2. Removal of Methylmercury

As for methylmercury in sludge, in addition to direct human discharges, in situ methylation of inorganic mercury in sewage collection and transport systems is a possible source. For example, sulphate-reducing bacteria (SRB) and iron-reducing bacteria in sewer systems contribute to in situ methylation of inorganic mercury [51].
At the same time, the presence of anaerobic zone or sludge flocculent in the activated sludge system makes the in situ methylation of inorganic mercury possible. Therefore, the content of methylmercury in the sewage treatment plant is the result of the combined influence of inorganic mercury methylation, methylmercury demethylation, sulphate reducing bacteria, and iron reducing bacteria in the sewage treatment pipeline (Figure 8).

4.3.3. Mercury Removal in the Treatment Process of China’s Representative Sewage Treatment Plants

A comprehensive review of the mercury mass balance in several relevant wastewater treatment plants showed that only 6.4 kg of mercury is released into the air from untreated wastewater in China through the aeration process. The mercury removed by the pretreatment was only 0.3% of the total influent mercury content, and the primary sedimentation tanks had mercury removal efficiencies of 58% to 79%. The secondary biological treatment plant is better able to achieve the removal of total mercury and methylmercury from wastewater treatment plant effluent, which is similar to the treatment process for mercury in UK wastewater treatment plants [52]. It is worth noting that approximately 32.01% of the mercury in China’s widely used A2/O wastewater treatment process is returned to the wastewater treatment in the form of return flows, which, although not effectively removing the mercury, reduces the total amount of mercury discharged to the environment and therefore reduces the environmental impact. After secondary treatment, tertiary treatment has little effect on the mercury content of the effluent, but there are some tertiary treatment facilities that can significantly affect the form of mercury present.
In general, the removal of mercury from wastewater treatment processes is mainly based on microbial oxidation or physical methods, as well as chemical methods used for sterilization treatment, whose main effect is to have an impact on the form of mercury present in the wastewater.

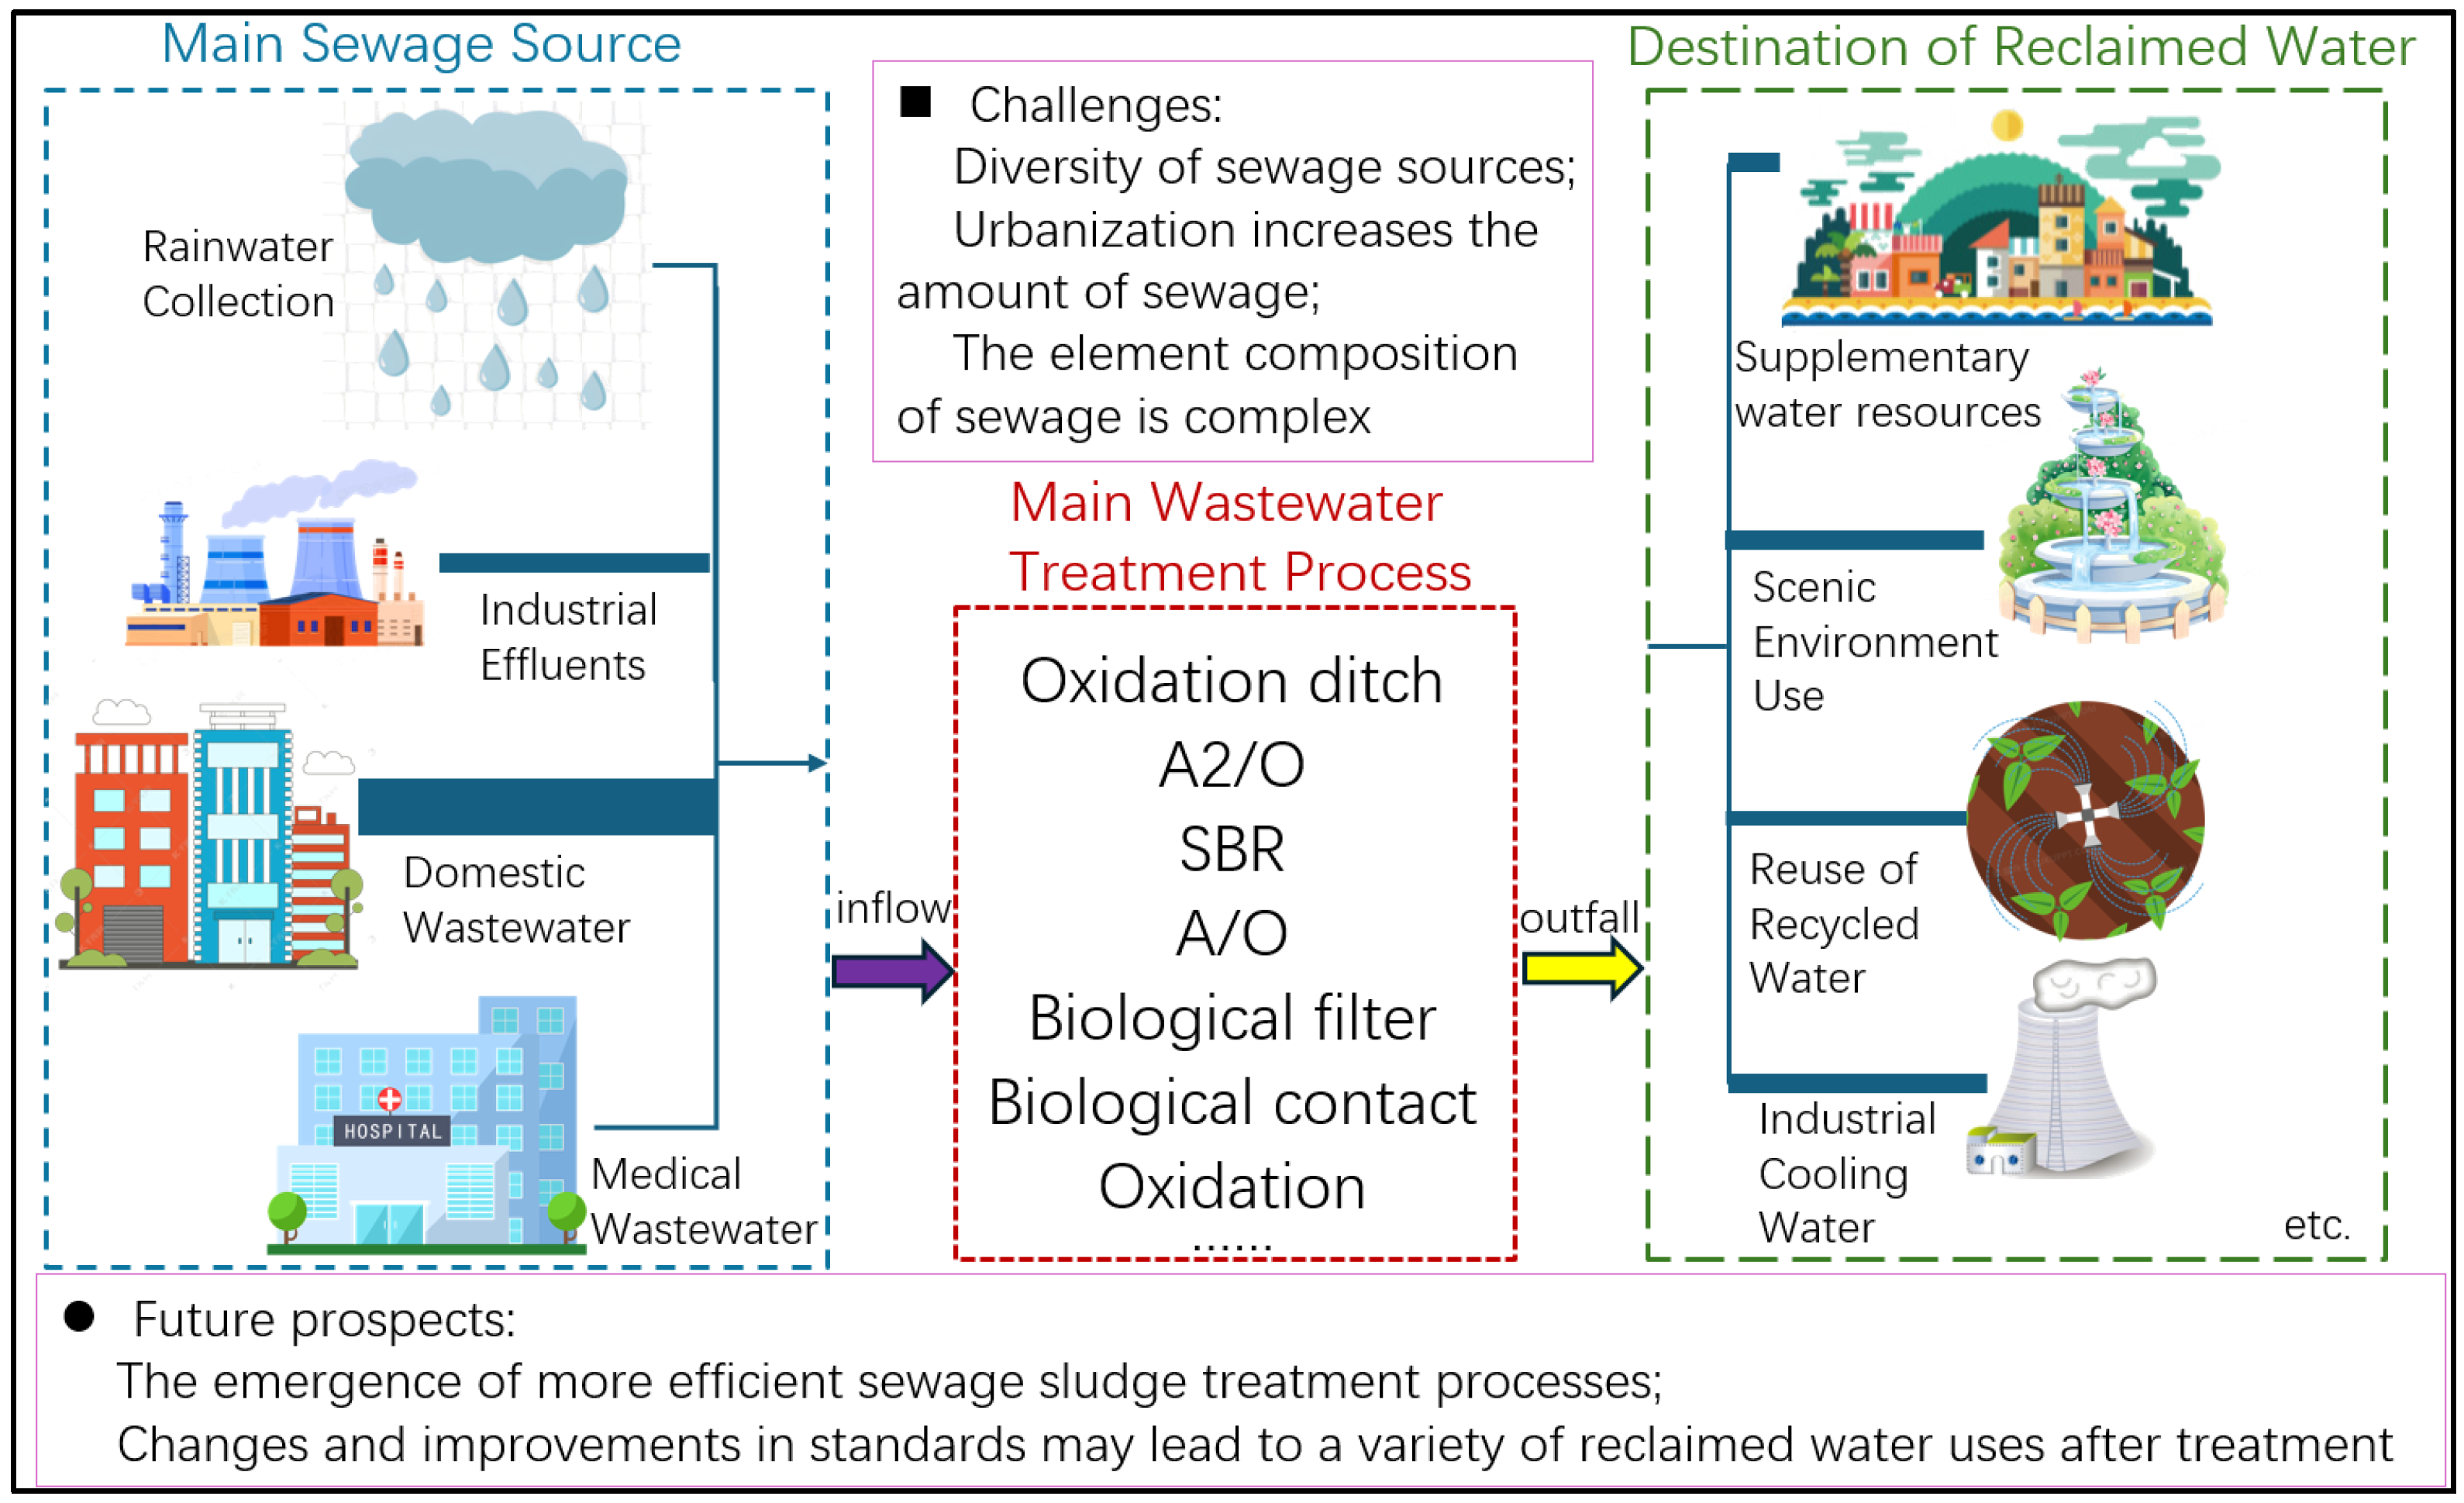
4.4. Changes and Regional Differences of Total Mercury Pollution in Sewage in the Future

4.4.1. Prediction and Evaluation of Total Mercury Pollution Based on Development Planning

The 14th Five-Year Plan states that 2 × 10⁷ m3/d of new wastewater treatment capacity is to be added by 2025, and the national urban domestic sewage collection rate strives to reach over 70%. Based on the treatment capacity of urban wastewater treatment plants of 6.02 × 10¹⁰ m3 in 2021 and the treatment capacity of county wastewater treatment plants of 1.05 × 10¹⁰ m3, the national average daily wastewater treatment capacity in 2021 is 1.96 × 10⁸ m3; with the national average annual operation time of wastewater treatment plants of 360.7 days, and based on the national average daily wastewater treatment capacity in 2025 of 2.16 × 10⁸ m3, then the sewage treatment capacity in 2025 is 7.90 × 10¹⁰ m3.
As a consequence, the sewage treatment rate is expected to increase considerably by 2025. Based on China’s sludge production of 202.191 g per ton of water, the estimated dry sludge production in 2025 is 1.597 × 10⁷ Mg; based on the mercury content of 0.701 mg per ton of water, it can be estimated that in 2025 the total amount of mercury in sludge in the country will be 39.61 Mg and the total mercury in wastewater will be 55.41 Mg.
In 2021, the total amount of mercury in sludge in China was 36.17 Mg and the total amount of mercury in sewage was 50.50 Mg, consistent with the estimate of the literature [6,50]. In 2025, the total amount of mercury in sludge in China is expected to increase by 9.52% and the total amount of mercury in sewage by 9.73%. The main reason for the increase of mercury discharge in sewage in China is the increase of sewage collection rate; some of the original sewage is not collected and transported to sewage treatment plants, but directly or mixed with storm water pipes to discharge into urban water body. The mercury discharge of this sewage is difficult to estimate; as China’s sewage collection rate increases, the sewage discharge system will be further improved, the mercury discharge into natural water body will also be further reduced, and the impact on nature will be further reduced.
The 14th Five-Year Plan for the Development of Urban Sewage Treatment and Resource Utilization states that by 2035, there will be basic full coverage of urban domestic sewage collection network, full coverage of urban sewage treatment capacity, full realization of the harmless disposal of sludge, the sewage sludge resource utilization level will be significantly improved, and urban sewage will receive safe and efficient treatment. It is expected that by 2035 China’s sewage collection will basically achieve full coverage, the change in the volume of sewage treatment will be relatively reduced, the mercury in sewage will be greatly enhanced by sewage treatment technology, and with the improvement in the level of sewage treatment as well as sewage discharge standards, the mercury content in the tailwater and sludge will be significantly reduced after sewage treatment, and the total amount of mercury discharged into the environment will be greatly reduced.
According to the development trend of wastewater discharge limits in China, a discharge limit of 0.001 mg/L for mercury in domestic wastewater is expected to be implemented nationwide by 2035. According to the changing pattern of sewage treatment volume and the impact of full sewage treatment coverage, it is expected that 9.86 × 10¹⁰ m3 will be discharged in 2035. Based on the relationship between the statistical status of sewage mercury discharge and the limit value, the total mercury discharge in China’s sewage is estimated at 49.3 Mg based on a mercury content of 0.0005 mg/L in sewage.

4.4.2. Influencing Factors of Mercury Content in Sewage in the Future

Up to 2025, the mercury content in sludge will change relatively little from a national perspective. Due to the development of wastewater treatment technology and the reduction of the total amount of mercury used in medical devices and residential life, the total amount of mercury in wastewater in the economically developed eastern regions will gradually decrease in the future, while for the central and western regions, due to the increase of the wastewater collection rate and the increase of the wastewater treatment rate, the mercury in the external drainage water that was not collected will enter the wastewater treatment plants, making the mercury content in these regions higher. The mercury content in China’s wastewater, as estimated from data on the volume of wastewater treated, is expected to tend to increase in the coming years. However, from an environmental perspective, the total amount of mercury in external effluent entering the environment in China will gradually decrease in the future due to the increase in the level of sewage treatment. By 2035, the impact of mercury treatment technologies in wastewater treatment will gradually increase as China achieves essentially full wastewater treatment coverage and changes in wastewater treatment volumes are reduced. With the increasing stringency of China’s environmental regulations, the total amount of mercury entering the environment from China’s effluent will be greatly reduced, and the impact of mercury pollution on the environment will gradually decrease. This reduction in mercury pollution will require the implementation of effective wastewater treatment technologies, the reduction of mercury use in various industries, and the strict enforcement of environmental regulations to help protect the environment and human health (Figure 9).

5. Conclusions

In this article, the occurrence, migration, and transformation of mercury in the treatment of sewage in Chinese municipal sewage treatment plants were analyzed, and the morphological changes of mercury in the treatment process were deduced. The conclusion was drawn that the treatment process of sewage treatment plants was poor in removing dissolved mercury, and residual mercury was still retained in the effluent form. Therefore, the mercury emission in domestic wastewater can be estimated indirectly by the method of mercury content estimation in sludge and tailwater. Based on the data of past years, the relationship between the amount of wastewater treated and the total amount of mercury in wastewater was established, the total amount of mercury in wastewater in China was established, and the mercury emission of urban sewage in China was estimated. Through this study, combined with the status quo and development planning of wastewater treatment plant technology in China, the total amount of mercury emission in wastewater in China can be predicted in the future, providing references for policy formulation and scientific and technological development.

Supplementary Materials

The following supporting information can be downloaded at: https://www.mdpi.com/article/10.3390/pr12071534/s1, Table S1: Mercury emission statistics by provinces; Table S2: Sewage Treatment Rate of Cities and Towns in China (2002–2021); Table S3: Variation of water volume; Table S4: Sludge yield, predicted value and revised value; Table S5: Change of mercury content in sludge.

Author Contributions

Conceptualization, J.G.; methodology, J.G., R.F. and G.Z.; software, J.G. and Y.H.; validation, T.Z.; formal analysis, J.G. and X.W.; investigation, G.Z.; resources, H.C. and S.H.; data curation, J.G.; writing—original draft preparation, C.W. and J.G.; writing—review and editing, J.G., X.W., H.C. and S.H.; visualization, G.Z.; supervision, R.F., T.Z. and G.Z.; project administration, G.Z.; funding acquisition, G.Z. All authors have read and agreed to the published version of the manuscript.

Funding

This research was funded by the Major science and technology project of China Power Engineering Consulting Group Co., LTD (No. DG3-P01-2022); the Science and Technology Development Plan Project of Jilin Province, China (20240101067JC); the Science and Technology Research Project of Jilin Provincial Education Department (No. JJKH20231316KJ); the Chinese National Natural Science Foundation of China (Grant No. 31230012, 31770520); the Fundamental Research Funds for the Central Universities (No. 134-135132028); and the Chinese Postdoctoral Science Foundation (2021M700496).

Data Availability Statement

The data presented in this study are available on request from the corresponding author.

Acknowledgments

We are grateful to the Key Laboratory of Vegetation ecology of the Ministry of Education for its help and support.

Conflicts of Interest

Authors Chenglong Wei, Rongyang Fan, Tingting Zhang, Hao Chen, and Song Hang are employed by the China Energy Engineering Group Guangxi Electric Power Design Institute Co., LTD.; the remaining authors declare that the research was conducted in the absence of any commercial or financial relationships that could be construed as potential conflicts of interest.

References

  1. Gonzalez-Raymat, H.; Liu, G.; Liriano, C.; Li, Y.; Yin, Y.; Shi, J.; Jiang, G.; Cai, Y. Elemental mercury: Its unique properties affect its behavior and fate in the environment. Environ. Pollut. 2017, 229, 69–86. [Google Scholar] [CrossRef] [PubMed]
  2. Feng, X.; Li, P.; Fu, X.; Wang, X.; Zhang, H.; Lin, C.-J. Mercury pollution in China: Implications on the implementation of the Minamata Convention. Environ. Sci. Process. Impacts 2022, 24, 634–648. [Google Scholar] [CrossRef] [PubMed]
  3. Qian, X.; Yang, C.; Xu, X.; Ao, M.; Xu, Z.; Wu, Y.; Qiu, G. Extremely Elevated Total Mercury and Methylmercury in Forage Plants in a Large-Scale Abandoned Hg Mining Site: A Potential Risk of Exposure to Grazing Animals. Arch. Environ. Contam. Toxicol. 2021, 80, 519–530. [Google Scholar] [CrossRef] [PubMed]
  4. Liu, M.; Du, P.; Yu, C.; He, Y.; Zhang, H.; Sun, X.; Lin, H.; Luo, Y.; Xie, H.; Guo, J.; et al. Increases of Total Mercury and Methylmercury Releases from Municipal Sewage into Environment in China and Implications. Environ. Sci. Technol. 2018, 52, 124–134. [Google Scholar] [CrossRef] [PubMed]
  5. Pacyna, J.M. Recent advances in mercury research. Sci. Total Environ. 2020, 73, 139955. [Google Scholar] [CrossRef] [PubMed]
  6. Liu, K.; Wu, Q.; Wang, S.; Ouyang, D.; Li, Z.; Ding, D.; Li, G.; Tang, Y.; Xiang, L.; Han, D.; et al. Highly Resolved Inventory of Mercury Release to Water from Anthropogenic Sources in China. Environ. Sci. Technol. 2021, 55, 13860–13868. [Google Scholar] [CrossRef] [PubMed]
  7. Cheng, L.; Wang, L.; Geng, Y.; Wang, N.; Mao, Y.; Cai, Y. Occurrence, speciation and fate of mercury in the sewage sludge of China. Ecotoxicol. Environ. Saf. 2019, 186, 109787. [Google Scholar] [CrossRef] [PubMed]
  8. Shoham-Frider, E.; Shelef, G.; Kress, N. Mercury speciation in sediments at a municipal sewage sludge marine disposal site. Mar. Environ. Res. 2007, 64, 601–615. [Google Scholar] [CrossRef]
  9. Pola, L.; Fernandez-Garcia, L.; Collado, S.; Oulego, P.; Diaz, M. Heavy metal solubilisation during the hydrothermal treatment of sludge. J. Environ. Manag. 2021, 286, 112120. [Google Scholar] [CrossRef]
  10. Wiest, L.; Gosset, A.; Fildier, A.; Libert, C.; Hervé, M.; Sibeud, E.; Giroud, B.; Vulliet, E.; Bastide, T.; Polomé, P.; et al. Occurrence and removal of emerging pollutants in urban sewage treatment plants using LC-QToF-MS suspect screening and quantification. Sci. Total Environ. 2021, 774, 145779. [Google Scholar] [CrossRef]
  11. Sturm, M.T.; Myers, E.; Schober, D.; Thege, C.; Korzin, A.; Schuhen, K. Adaptable Process Design as a Key for Sustainability Upgrades in Wastewater Treatment: Comparative Study on the Removal of Micropollutants by Advanced Oxidation and Granular Activated Carbon Processing at a German Municipal Wastewater Treatment Plant. Sustainability 2022, 14, 11605. [Google Scholar] [CrossRef]
  12. Feng, J.; Chen, X.; Jia, L.; Liu, Q.; Chen, X.; Han, D.; Cheng, J. Effluent concentration and removal efficiency of nine heavy metals in secondary treatment plants in Shanghai, China. Environ. Sci. Pollut. Res. 2018, 25, 17058–17065. [Google Scholar] [CrossRef] [PubMed]
  13. Gao, Z.; Cai, L.; Liu, M.; Zhang, Z.; Gao, B.; Zhao, W.; Cizdziel, J.V.; Chen, L. Total mercury and methylmercury migration and transformation in an A2/O wastewater treatment plant. Sci. Total Environ. 2020, 710, 136384. [Google Scholar] [CrossRef] [PubMed]
  14. Liu, H.; Cui, Y.; Li, H.; Mao, Y. A case study on the occurrence, transport, and fate of mercury species in a sewage treatment plant in Jiaozuo, China. Environ. Sci. Pollut. Res. Int. 2018, 25, 21616–21622. [Google Scholar] [CrossRef] [PubMed]
  15. Suess, E.; Berg, M.; Bouchet, S.; Cayo, L.; Hug, S.J.; Kaegi, R.; Voegelin, A.; Winkel, L.H.E.; Tessier, E.; Amouroux, D.; et al. Mercury loads and fluxes from wastewater: A nationwide survey in Switzerland. Water Res. 2020, 17, 115708. [Google Scholar] [CrossRef]
  16. Li, Y.; Wang, Y.; Liu, R.; Shao, L.-B.; Liu, X.; Han, K.; Song, P. Variation of mercury fractionation and speciation in municipal sewage treatment plant: Effects of mercury on the atmosphere. Environ. Sci. Pollut. Res. 2022, 29, 36475–36485. [Google Scholar] [CrossRef] [PubMed]
  17. Mao, Y.; Cheng, L.; Ma, B.; Cai, Y. The fate of mercury in municipal wastewater treatment plants in China: Significance and implications for environmental cycling. J. Hazard. Mater. 2016, 306, 1–7. [Google Scholar] [CrossRef] [PubMed]
  18. Sun, L.; Lin, S.; Feng, L.; Huang, S.; Yuan, D. The distribution and sea–air transfer of volatile mercury in waste post-desulfurization seawater discharged from a coal-fired power plant. Environ. Sci. Pollut. Res. 2013, 20, 6191–6200. [Google Scholar] [CrossRef] [PubMed]
  19. Hargreaves, A.J.; Vale, P.; Whelan, J.; Constantino, C.; Dotro, G.; Cartmell, E. Mercury and antimony in wastewater: Fate and treatment. Water Air Soil Pollut. 2016, 227, 89. [Google Scholar] [CrossRef]
  20. Figueiredo, N.L.; Canario, J.; Serralheiro, M.L.; Carvalho, C. Optimization of microbial detoxification for an aquatic mercury-contaminated environment. J. Toxicol. Env. Health Part A 2017, 80, 788–796. [Google Scholar] [CrossRef]
  21. De, J.; Dash, H.R.; Das, S. 6—Mercury Pollution and Bioremediation—A Case Study on Biosorption by a Mercury-Resistant Marine Bacterium. In Microbial Biodegradation and Bioremediation; Das, S., Ed.; Elsevier: Oxford, UK, 2014; pp. 137–166. [Google Scholar]
  22. Singh, A.D.; Khanna, K.; Kour, J.; Dhiman, S.; Bhardwaj, T.; Devi, K.; Sharma, N.; Kumar, P.; Kapoor, N.; Sharma, P.; et al. Critical review on biogeochemical dynamics of mercury (Hg) and its abatement strategies. Chemosphere 2023, 319, 137917. [Google Scholar] [CrossRef] [PubMed]
  23. Mohammed, H.; Khaleefa Ali, S.; Basheer, M. Heavy metal ions removal using advanced oxidation (UV/H2O2) technique. IOP Conf. Ser. Mater. Sci. Eng. 2020, 870, 012026. [Google Scholar] [CrossRef]
  24. Liu, J.; Bao, Z.; Wang, C.; Wei, J.; Wei, Y.; Chen, M. Understanding of mercury and methylmercury transformation in sludge composting by metagenomic analysis. Water Res. 2022, 226, 119204. [Google Scholar] [CrossRef] [PubMed]
  25. Futsaeter, G.; Wilson, S. The UNEP Global Mercury Assessment: Sources, Emissions and Transport. E3S Web Conf. 2013, 1, 36001. [Google Scholar] [CrossRef]
  26. Wei, L.; Zhu, F.; Li, Q.; Xue, C.; Xia, X.; Yu, H.; Zhao, Q.; Jiang, J.; Bai, S. Development, current state and future trends of sludge management in China: Based on exploratory data and CO2-equivaient emissions analysis. Environ. Int. 2020, 144, 106093. [Google Scholar] [CrossRef] [PubMed]
  27. Zhang, S.; Wang, F.; Mei, Z.; Lv, L.; Chi, Y. Status and Development of Sludge Incineration in China. Waste Biomass Valorization 2021, 12, 3541–3574. [Google Scholar] [CrossRef]
  28. GB 18918-2002; Pollutant Discharge Standards for Urban Sewage Treatment Plants. National Bureau of Quality Inspection: Beijing, China, 2002.
  29. Zhang, Q.H.; Yang, W.N.; Ngo, H.H.; Guo, W.S.; Jin, P.K.; Dzakpasu, M.; Yang, S.J.; Wang, Q.; Wang, X.C.; Ao, D. Current status of urban wastewater treatment plants in China. Env. Int 2016, 92–93, 11–22. [Google Scholar] [CrossRef]
  30. Li, X.; Li, H.; Yang, G.; Zhang, H.; Chen, B. Spatial Variation of Domestic Water Consumption and Fate of Domestic Sewage in Rural Areas of Taihu Region, Jiangsu. J. Ecol. Rural Environ. 2015, 31, 158–165. [Google Scholar]
  31. Yao, T.; Wei, Y.; Zhang, J.; Wang, Y.; Yu, Y.; Huang, W. What influences the urban sewage discharge in China? The effect of diversified factors on the urban sewage discharge in different regions of China. Environ. Dev. Sustain. 2022, 24, 6099–6135. [Google Scholar] [CrossRef]
  32. Ministry of Housing and Urban-Rural Development of the People’s Republic of China. The China Urban Construction Statistical Yearbook; China Statistics Press: Beijing, China, 2023.
  33. Gui, Z.; Wen, J.; Fu, L.; Wang, S.; Zheng, B. Analysis on Mode and Benefit of Resource Utilization of Rural Sewage in a Typical Chinese City. Water 2023, 15, 2062. [Google Scholar] [CrossRef]
  34. Ma, X.; Zhang, T.; Xie, Y.; Tan, Q. A simulation-assessment-optimization approach towards energy self-sufficiency and carbon reduction in regional-scale sewage systems. Resour. Conserv. Recycl. 2022, 187, 106595. [Google Scholar] [CrossRef]
  35. Zhong, L.; Ding, J.; Wu, T.; Zhao Yl Pang, J.W.; Jiang, J.P.; Jiang, J.Q.; Li, Y.; Ren, N.Q.; Yang, S.S. Bibliometric overview of research progress, challenges, and prospects of rural domestic sewage: Treatment techniques, resource recovery, and ecological risk. J. Water Process Eng. 2023, 51, 103389. [Google Scholar] [CrossRef]
  36. Action Plan for Prevention and Control of Water Pollution Printed and Distributed. Available online: https://english.mee.gov.cn/News_service/news_release/201504/t20150427_299595.shtml (accessed on 29 May 2024).
  37. Chen, K.; Liu, X.; Ding, L.; Huang, G.; Li, Z. Spatial Characteristics and Driving Factors of Provincial Wastewater Discharge in China. Int. J. Environ. Res. Public Health 2016, 13, 1221. [Google Scholar] [CrossRef]
  38. Cheng, X.; Wei, C.; Ke, X.; Pan, J.; Wei, G.; Chen, Y.; Wei, C.; Li, F.; Preis, S. Nationwide review of heavy metals in municipal sludge wastewater treatment plants in China: Sources, composition, accumulation and risk assessment. J. Hazard. Mater. 2022, 437, 129267. [Google Scholar] [CrossRef]
  39. Duan, B.; Feng, Q. Risk Assessment and Potential Analysis of the Agricultural Use of Sewage Sludge in Central Shanxi Province. Int. J. Environ. Res. Public Health 2022, 19, 4236. [Google Scholar] [CrossRef]
  40. Guo, Y.; Gong, H.; Shi, W.; Fang, N.; Tan, Y.; Zhou, W.; Huang, J.; Dai, L.; Dai, X.; Guo, Y. Insights into multisource sludge distributed in the Yangtze River basin, China: Characteristics, correlation, treatment and disposal. J. Environ. Sci. 2023, 126, 321–332. [Google Scholar] [CrossRef] [PubMed]
  41. Xiao, D.; Li, H.; Wang, Y.; Wen, G.; Wang, C. Distribution Characteristics of Typical Heavy Metals in Sludge from Wastewater Plants in Jiangsu Province (China) and Their Potential Risks. Water 2023, 15, 313. [Google Scholar] [CrossRef]
  42. Xuan, C.; Jianfeng, Z.; Changshun, S. Characteristics and risk assessment of sewage sludge from urban wastewater treatment plants in Shaanxi Province, China. Environ. Monit. Assess. 2023, 195, 799. [Google Scholar] [CrossRef] [PubMed]
  43. Rani, A.; Rockne, K.J.; Drummond, J.; Al-Hinai, M.; Ranjan, R. Geochemical influences and mercury methylation of a dental wastewater microbiome. Sci. Rep. 2015, 5, 12872. [Google Scholar] [CrossRef] [PubMed]
  44. Lu, Y.-t.; Qi, W.-z.; Wang, S.; Song, X.-n.; Yang, D.-y.; Song, M.; Hang, T.-j. Toxicity and risk assessment of mercury exposures from cinnabar and Baizi Yangxin Pills based on pharmacokinetic and tissue distribution studies. J. Ethnopharmacol. 2020, 250, 112489. [Google Scholar] [CrossRef]
  45. Xu, X.; Li, L.; Zhou, H.; Hu, Q.; Wang, L.; Cai, Q.; Zhu, Y.; Ji, S. Heavy Metals and Probabilistic Risk Assessment via Pheretima (a Traditional Chinese Medicine) Consumption in China. Front. Pharmacol. 2022, 12, 803592. [Google Scholar] [CrossRef]
  46. Yuan, X.; Li, K.; Zhang, Y.; Miao, Y.; Xiang, Y.; Sha, Y.; Zhang, M.; Huang, K. Point discharge microplasma for the determination of mercury in Traditional Chinese Medicines by chemical vapor generation atomic emission spectrometry. Microchem. J. 2020, 155, 104695. [Google Scholar] [CrossRef]
  47. Zuo, T.T.; Li, Y.L.; He, H.Z.; Jin, H.Y.; Zhang, L.; Sun, L.; Gao, F.; Wang, Q.; Shen, Y.J.; Ma, S.C.; et al. Refined assessment of heavy metal-associated health risk due to the consumption of traditional animal medicines in humans. Environ. Monit. Assess. 2019, 191, 171. [Google Scholar] [CrossRef] [PubMed]
  48. Li, Z.; Jia, P.; Zhao, F.; Kang, Y. Mercury Pollution, Treatment and Solutions in Spent Fluorescent Lamps in Mainland China. Int. J. Environ. Res. Public Health 2018, 15, 2766. [Google Scholar] [CrossRef]
  49. Zhao, C.; Luo, K. Household consumption of coal and related sulfur, arsenic, fluorine and mercury emissions in China. Energy Policy 2018, 112, 221–232. [Google Scholar] [CrossRef]
  50. Zheng, B.; Huang, G.; Liu, L.; Li, J.; Li, Y. A stepwise emission clustering analysis method for analyzing the effects of heavy metal emissions from multiple income groups. Sci. Total Environ. 2022, 812, 152472. [Google Scholar] [CrossRef] [PubMed]
  51. Bravo, A.G.; Bouchet, S.; Guedron, S.; Amouroux, D.; Dominik, J.; Zopfi, J. High methylmercury production under ferruginous conditions in sediments impacted by sewage treatment plant discharges. Water Res. 2015, 80, 245–255. [Google Scholar] [CrossRef]
  52. Rule, K.L.; Comber, S.D.W.; Ross, D.; Thornton, A.; Makropoulos, C.K.; Rautiu, R. Diffuse sources of heavy metals entering an urban wastewater catchment. Chemosphere 2006, 63, 64–72. [Google Scholar] [CrossRef]
Figure 1. Distribution of dominant driving factors for sewage discharge.
Processes 12 01534 g001
Figure 2. Dry sludge production and forecast after sewage treatment in provinces of China. (a) The difference between the predicted value of sludge and the actual output in each province. (b) Correlation between sludge yield and predicted value (Detailed data refer to the Supplementary Materials Tables S1 and S4).
Processes 12 01534 g002
Figure 3. Mercury release in domestic sewage in China.
Processes 12 01534 g003
Figure 4. The distribution of mercury in different media in different regions. (a) The proportion of mercury in sewage sludge by province and city. (b) Variations in mercury levels in different regions (Detailed data refer to the Supplementary Materials Tables S1 and S4).
Processes 12 01534 g004
Figure 5. Distribution and discharge characteristics of mercury in sewage. (a) Distribution of mercury content in sludge. (b) Distribution of mercury discharge in sludge. (c) Mercury discharge from tailwater. (d) Distribution of all mercury discharge.
Processes 12 01534 g005
Figure 6. Development of mercury determination methods in water.
Processes 12 01534 g006
Figure 7. Changes of domestic sewage treatment capacity and treatment rate in different regions of China from 2002 to 2021. (a) Changes in treated water and annual growth rates in China, 2006–2021. (b) Changes in China’s county, city and national sewage treatment rates from 2002 to 2022 (Detailed data refer to the Supplementary Materials Tables S2 and S3).
Processes 12 01534 g007
Figure 8. Seasonal differences of mercury adsorption in sewage, and transformation and removal of methylmercury. (a) demethylation process of mercury; (b) The methylation process of mercury; (c) The adsorption process of activated sludge; (d) Mercury methylation process of sulfate-reducing bacteria and iron-reducing bacteria.
Processes 12 01534 g008
Figure 9. Wastewater treatment process in China, challenges, and future prospects.
Processes 12 01534 g009
Table 1. Production of tons of water sludge by different processes.
Name of the ProcessTons of Water Sludge Production (g)Usage Rate
Oxidation ditch20121.00%
A2/O24115.30%
SBR2279.20%
A/O3213.60%
Biological filter1922.00%
Biological contact oxidation2181.60%
Table 2. Variation trend of mercury content in sludge in China (Detailed data refer to the Supplementary Materials Table S5).
YearArithmetic Mean of Mercury Content in SludgeGeometric Mean of Mercury Content in Sludge
20063.18198.00%
20132.8140.00%
20163.2244.00%
20191.91128.00%
Disclaimer/Publisher’s Note: The statements, opinions and data contained in all publications are solely those of the individual author(s) and contributor(s) and not of MDPI and/or the editor(s). MDPI and/or the editor(s) disclaim responsibility for any injury to people or property resulting from any ideas, methods, instructions or products referred to in the content.

