Article

Experimental Assessment of Paper Formation Conditions and Structural Two-Sidedness and Their Impacts on Curl Phenomena

1
CERES, Department of Chemical Engineering, University of Coimbra, 3030-790 Coimbra, Portugal
2
RAIZ—Forest and Paper Research Institute, Quinta de São Francisco, Rua José Estevão (EN 230-1), Eixo, 3800-783 Aveiro, Portugal
*
Author to whom correspondence should be addressed.
Processes 2024, 12(7), 1536; https://doi.org/10.3390/pr12071536
Submission received: 23 June 2024 / Revised: 15 July 2024 / Accepted: 16 July 2024 / Published: 22 July 2024
(This article belongs to the Section Materials Processes)

Abstract

:
Curl propensity is a critical-to-quality (CTQ) property of paper, as it causes severe problems during printing and other final conversion operations. The main papermaking factor causing the curl phenomenon is the existence of a fiber orientation (FO) gradient across the thickness direction (or ZD), also known as two-sidedness. Therefore, a methodology that characterizes the FO across the ZD is fundamental for papermakers. In this work, we propose and validate an efficient and cost-effective protocol based on sheet splitting and image analysis. Besides assessing the level of FO two-sidedness, the methodology also provides insights into the flow dynamics in the draining zone of the forming section of the paper machine and the drying stresses built into the paper. This information is relevant for monitoring, optimizing, and troubleshooting activities in the paper industry.

1. Introduction

Paper is a dimensionally active material that change its dimensions with the variation of temperature (T) and/or relative humidity (RH). The unevenness of structural properties across the thickness direction (usually referred to as the Z-direction, or simply, ZD) leads to the occurrence of dimensional changes in the different layers of fibers, which ultimately result in the development of an out-of-plane deformation, called curl [1,2]. When the origin of this three-dimensional curvature is structural, it is referred to as structural curl to distinguish from other possible causes. The curl phenomenon is a critical quality attribute (CQA) of paper, being known to cause serious problems to end users, such as disrupting jams and significant losses in efficiency during printing operations [3,4]. The variation of fiber orientation in the ZD, which is also known as fiber orientation (FO) two-sidedness, is usually the main driver of structural curl [2,4,5]. For this reason, we propose, test, and validate an efficient protocol to characterize the FO distribution along the thickness of paper (ZD), as well as the process conditions that originate it.
Paper is essentially a network of fibers connected by hydrogen bonds that contains a certain amount of fillers and chemicals to enhance some of its properties (e.g., optical, mechanical, and chemical properties related to the surface and printing quality, among others). Industrial-made paper is formed by fibers predominantly aligned with the machine direction (MD), which corresponds to the longitudinal direction of the machine used to produce the paper (paper machine), with lower amounts being found aligned with the perpendicular direction, known as the cross-machine direction (CD), which is also the transversal direction of the paper machine [6,7]. The in-plane FO distribution is usually characterized by an angular (or polar) FO distribution function. Two summary parameters are usually extracted from the angular FO distribution function: the orientation angle (θmax), which corresponds to the angle formed between the MD and the direction with the highest level of FO and the anisotropy (A), corresponding to the ratio of the maximum (a) and minimum (b) of the angular FO distribution function, A = a/b [8,9,10]. The FO in the ZD is defined as the superposition of multiple in-plane FO distributions corresponding to layers of fibers located in different positions of the paper thickness. With paper being a thin material (thickness of approximately 0.1 mm for copy paper of around 80 g m−2 [11]), the challenges of robustly characterizing the FO in the ZD are obvious.

1.1. Characterization of the Fiber Orientation in the ZD

Two types of methodologies can be found in the literature to characterize the FO in the ZD: nondestructive approaches, based on the use of confocal laser scanning microscope or X-ray microtomography [12,13], and destructive methods, based on sheet-splitting techniques [14,15,16,17,18,19]. Nondestructive approaches tend to be less used due to the expensive equipment and highly specific and trained personnel required, which are not usually available in paper companies [10]. In contrast, sheet-splitting methods are less expensive to implement, being, for this reason, more adopted by industry [18]. The Beloit sheet splitter is an example of a sheet-splitting technique that requires a relevant training level for the operator [18], with reasonable splitting quality being only assured till around eight layers [14,15,20,21,22]. The FO distribution of each layer can then be estimated by applying one of several different measurement principles, such as ultrasonic-based methods [15,22], zero-span tensile analysis [14,15,20], and tensile stiffness testing [21]. Simpler sheet-splitting techniques are also available and can typically split the paper into 6 to 14 layers. Among them, one can find the adhesive tape approach [6,7,16,23,24] and the use of a commercial hot laminator [17,18,19,25]. The hot laminator technique has been shown to be a flexible option [18], allowing the use of samples ranging from 35 × 80 mm2 (CD × MD) [17,18] to A4 or A3 sheets [19,25], with some works reporting that around 60 to 100 layers can be obtained in the splitting step [17,18]. Both sheet-splitting techniques, adhesive tape and hot laminator, are usually coupled to an image analysis approach to determine the FO distribution for each layer [6,7,16,17,18,19,23,24,25]. A bending stiffness test can also be used to analyze the layers obtained using the adhesive tape approach and provide an estimate of the FO anisotropy [21].
The image analysis stage involves two main steps: imaging acquisition, to obtain good quality images of the layers, followed by an algorithmic analysis of the collected images, to estimate the FO distribution in each layer. Dyes might also be added to the samples before sheet splitting to improve the visualization of the fibers [17,18,26]. The image acquisition step may require the use of an optical microscope [26], a digital camera [16], or a commercial flatbed scanner [6,7,27,28]. The latter is often preferable to ensure the acquisition of images of a larger sample size [18]. Images are then analyzed using an algorithm to determine the angular fiber orientation function. Algorithms currently in use are gradient-based approaches [6,7,16,19,23,27,28], the steerable filtering method [19], application of the Hough transform [26], or segmentation methods coupled to skeletonization techniques [17,18,24]. The gradient approach is usually preferred in practice, assuring an accurate and fast analysis of a low-resolution layer image (around 800 dpi, dots per inch). Additionally, this approach requires just around 12 layers to characterize the sample in the ZD [6,7,16,28].

1.2. Flow Dynamics and the Local Structure of Paper

The structural anisotropy in the ZD addressed in the preceding paragraphs is mostly originated in the forming section of the paper machine. The angle formed by the suspension jet and the wire and, especially, the difference between the jet (J) and the wire (W) speeds, J-W, of the paper machine, play a key role in the development of the FO distribution in paper. Other factors are also important, such as the type of former used and the furnish properties, the pressure balance in the manifold, or the existence of localized deflection jets in the edges [6,7,23,29,30,31]. FO two-sidedness is typically found in papers produced by paper machines with a Fourdrinier or, to a lesser extent, with hybrid formers due to the asymmetrical flow conditions in the ZD created by the uneven removal of water in the two sides: the bottom side, also known as the wire, and the top side, which interfaces with the stagnant air. On the other hand, gap formers promote a symmetrical removal of water between the two sides, typically presenting a reduced potential to develop structural curl-related problems [16,29]. As such, the knowledge of the flow dynamics at the forming section could be potentially useful to mitigate the FO two-sidedness of the produced paper. To this end, strategies have been devised to qualitatively estimate the cross-section (CD × ZD) structure of the suspension flow at the draining phase of the forming section by analyzing the FOs of local elements of paper layers as a means to optimize the operation of the paper machine [6,7,23]. This aspect will be also considered in this work.

1.3. Objectives and Organization of the Document

The goal of this work is to develop, test, and validate a robust and accurate methodology to determine the FO in the ZD of paper. The methodology should meet the requirements of being simple and cost effective to be widely adopted by papermakers. To this end, a methodology that combines a sheet-splitting technique with an image analysis approach was proposed and used to characterize the paper machine at several positions in the CD. This methodology finds applications in process optimization, product development, and curl troubleshooting activities. Though challenging and facing several open technical problems, the availability of such a solution provides a critical asset for papermakers in their continuous effort to produce papers that are able to meet increasingly demanding requirements in the global market [17]. Additionally, the hot bend method was used to measure curl and confirm the capability of the developed methodology to correctly diagnose FO-induced curl problems.
The paper is organized as follows: First, the methodology developed in this work to characterize the FO in the ZD is presented in detail, followed by a brief description of the hot bend method. Subsequently, the experimental plan designed to validate and to test/apply the methodology in an industrial environment is presented. As such, this plan includes experimental trials with paper produced by real paper machines, including the analysis of samples collected at different transversal positions (different positions in the CD). The main results obtained for the two phases, validation and industrial application, are then presented and fully discussed. Finally, the main conclusions and applications of this work are concisely referred.

2. Materials and Methods

In this section, the methodology developed to characterize the FO in the ZD is presented in detail. We will use the acronym SIA (i.e., sheet splitting and image analysis) to designate the methodology. Subsequently, the hot bend method, used to measure curl potential, is described. Finally, the experimental plan followed in this work is introduced and clarified.

2.1. Methodology to Characterize the Variation of the Fiber Orientation Distribution Function along the Thickness Direction of Paper

The proposed methodology, sheet splitting and image analysis (SIA), consists of three main stages (see Figure 1): (i) sheet splitting, where very thin layers of paper of around 5–15 g·m−2 are obtained; (ii) multilayer image collection, to acquire good quality images of all the split layers; and (iii) multilayer image analysis, where the FO distribution functions for all the layers are obtained and combined for analysis [6,7,16,19,28]. The first stage, sheet splitting, consists of implementing a hot laminator-based technique by using a Leitz PH9 Photo Laminator A4 device (Esselte Leitz GmbH & Co KG, Stuttgart, Germany). With this technique, the sample is initially kept between two laminating plastic layers before passing it through the hot laminator. The applied heat assures the attachment of the sample to the transparent plastic layers. Subsequently, the laminated sample is manually split in two halves [17,18,32,33]. The splitting should be performed along the MD of the sample to minimize the level of fiber realignment promoted by the physical separation and, therefore, to assure good repeatability [18]. Each half is then successively peeled by applying new splitting steps until only around 15 g·m−2 remains. The peeled layers are usually analyzed as obtained, having a grammage (or basis weight) around 5–15 g·m−2 [6,7,16]. Although unlikely, peeled layers weighing more than 15 g·m−2 may require an additional splitting step [28]. In this work, three sample sizes were tested: size s1, 120 × 140 mm2 (CD × MD); s2, 145 × 150 mm2; and s3, an A4 sheet. The first two sample sizes were only used during Phase 1 (development phase) of the experimental plan.
For the second stage, multilayer image collection, a greyscale image is acquired for each layer with a reflective imaging system, a flatbed scanner EPSON Perfection V600 Photo (Seiko Epson Corporation, Suwa, Japan) [6,7,27,28]. The images are acquired against a dark background [6,7,16,28] with a resolution of 800 dpi [28]. The digitalized area varies according to the size of the sample: size s1, 70 × 75 mm2 (CD × MD); s2, 120 × 130 mm2; and s3, 195 × 279 mm2.
The third and final stage, multilayer image analysis, consists of the application of an efficient, robust, and fast image analysis algorithm, GSM (gradient-segmentation method) to estimate the FO distribution of each layer. The algorithm focuses only on the pixels that are probably part of a fiber segment edge, thus reducing the computational effort required to analyze an image. The algorithm, which was implemented in Matlab R2018b ver. 9.5 (The Mathworks, Inc., Natick, MA, USA), includes the following steps (for additional details, see reference [10]) that are applied to each layer image: (i) computation of the gradient of intensities of the pixels through the Sobel operator; (ii) determination of the threshold of gradient magnitudes to find the edges of fiber segments by using the Otsu method, an automatic segmentation technique; (iii) obtainment of the sample angular frequency distribution of the fibers orientation, θ; and (iv) estimation of a pre-selected parametric model for the angular distribution function, f θ θ , which, in this work, is the cosine function with three terms, Equation (1), using the sample frequency distribution data.
f θ θ = K π 1 + η 1   c o s 2   θ θ m a x + η 2   c o s 4   θ θ m a x + η 3   c o s 6   θ θ m a x
The parameters of the angular FO model used, f θ θ , are as follows: K, the scale factor; θmax, the orientation angle (i.e., angle at the maximum of the angular distribution function); and η1, η2, and η3, the three terms of the truncated Fourier series expansion. As expected, the anisotropy, A, can be estimated by the ratio maximum/minimum of the fitted angular FO function [10]. For each layer image, two levels of analysis were considered: (i) a global level, to estimate the overall FO, and (ii) a local level, to determine the FO at smaller elements, at 3 × 3 mm2 [23]. The global analysis provides an estimate of the level of FO two-sidedness of the sample, therefore being useful for diagnostic tasks of structural curl-related problems. Three types of results are produced with the global analysis: (i) FO in the ZD, in which the overall FO distribution of all the sample layers are shown; (ii) FO of the aggregated halves, in which the data for the bottom and top layers (corresponding to approximately 50% of the sample weight for each half) are combined to obtain the overall angular FO distribution of the bottom half (BH) and of the top half (TH), respectively; and (iii) FO of the entire sample, in which the data of all the layers are combined to calculate the overall angular FO distribution of the paper sheet [23]. In this work, the last two types of results, FO of the two halves and FO of the sample, are obtained by considering equivalent contributions from each layer.
The local analysis provides an estimate of the cross-section (CD × ZD) structure of the suspension flow at the draining phase of the forming section of the paper machine, which could be used to support the definition of the strategy to act on the process to mitigate, for example, potential fiber-induced curl problems. In particular, the analysis provides qualitative information regarding two properties that are largely responsible for the orientation of the fibers in the sheet: (i) effective shear in the MD and (ii) turbulence. These properties are assessed by analyzing the standard anisotropy vector, Astd, at the local elements of the layer. The direction of the vector is aligned with the orientation angle, θmax, while the magnitude is determined from the anisotropy parameter, A, according to Equation (2). The magnitude ranges from 0, which corresponds to all the fibers being aligned along the CD, to the maximum value of 1 for the cases where the fibers are all aligned along the MD [23].
A s t d = 1 1 A
For each position in the CD of the layer, the average of the MD component of the standard anisotropy, Astd (MD), of the corresponding local elements is calculated to qualitatively evaluate the effective shear in MD. Similarly, the standard deviation of the CD component, Astd (CD), is determined for each position in the CD to assess the level of turbulence of the suspension flow [23].

2.2. Hot Bend Method

Curl phenomena can be assessed immediately at the end of the production (end-of-line assessment) as part of the local monitoring activities or after cutting the paper to the commercial sizes, followed by conducting a standard electrophotographic printing process (where the “curl Xerox” methodology is typically applied) [4,34]. In this work, the potential of paper to develop curl was evaluated at the end-of-line assessment. The existing end-of-line methods can be organized according to the type of external stimuli applied to the paper to promote the development of curl: variation of the relative humidity [15,22,35,36,37], application of temperature changes [15,21,22,36,38,39,40], and wetting/soaking [15,22]. The temperature change methods, or heat methods, are particularly interesting for papermakers [21,22,38], being considerably faster than the techniques based on the variation of the relative humidity [21]. A type of heat method we have found particularly interesting is the “hot bend” method; it was, therefore, adopted in this work.
The hot bend method for determining the curl potential consists of three steps (Figure 2): (i) the preparation of sample strips of around 20 × 210 mm2, followed by a conditioning phase at 23 °C and 50% RH for at least 4 h; (ii) placement of each strip in contact with a heated, curved metal plate (at around 150 °C) for 1–3 s by holding each end with the fingertips; and (iii) holding the sample vertically over a template kept on a flat surface to determine the magnitude of the developed curvature through a comparison with arcs of known curvatures. The concave face of the curvature is typically developed towards the side kept in contact with the heated plate, with positive values being attributed to the magnitude for these cases. Otherwise, negative values are associated with the magnitude readings. The hot bend method is performed for the two geometrical paper directions, the MD and CD, and, in each case, for the bottom side (BS) and the top side (TS) facing the plate. As such, four tests are executed and analyzed for each sample: MD-TS, MD-BS, CD-TS, and CD-BS. At least two strips/repetitions were analyzed for each test, with the average value being determined and used. The predominant curl tendency for each direction (MD and CD) is then calculated by subtracting the average of curvatures obtained on the TS tests to those obtained on the BS tests [22,38,40].
Additionally, the hot bend method was also applied to analyze strips prepared for the two in-plane diagonal directions (see Figure 2), namely the left diagonal (LD) and the right diagonal (RD), to assess the level of diagonal curl in the samples. These diagonal tests were performed similarly to the ones executed for the MD and CD. As such, 4 additional tests (at least 2 strips/repetitions per test) were conducted to study the bottom and top sides facing the heated plate for each diagonal: LD-TS, LD-BS, RD-TS, and RD-BS. The overall curl tendency was also determined for the two diagonal directions by subtracting the curvatures obtained from the TS tests to those from the BS tests [40] for each direction.

2.3. Experimental Plan

With the support of a paper company that granted access to commercial sheets of copy paper (A4 size) and cross-sectional samples from a jumbo roll (a full-width copy paper roll produced in the paper machine), the following two-phase experimental plan was laid down: (i) Phase 1: development and validation of the SIA methodology and repeatability analysis of the hot bend method using commercial paper samples produced in a paper machine, designated PM-A; (ii) Phase 2: industrial application of the hot bend method, TSO technique, and SIA methodology in a diagnostic activity that encompassed the characterization of the curl tendency, in-plane tensile stiffness, fiber orientation anisotropy, and flow conditions across the entire cross-section of the paper machine, i.e., at several positions in the CD of a jumbo roll produced in the paper machine, designated PM-B. The copy paper used in the two phases was produced from a furnish mainly based on an industrial bleached pulp from Eucaliptus globulus, presenting a basis weight of 80 g·cm−3. The complete composition of the furnish is a trade secret of the company. It should also be noted that the type of former (i.e., Fourdrinier, hybrid, or gap former) of the paper machines PM-A and PM-B may not be the same (due to confidentiality reasons, the formers cannot be revealed).

2.3.1. Phase 1: Development and Validation

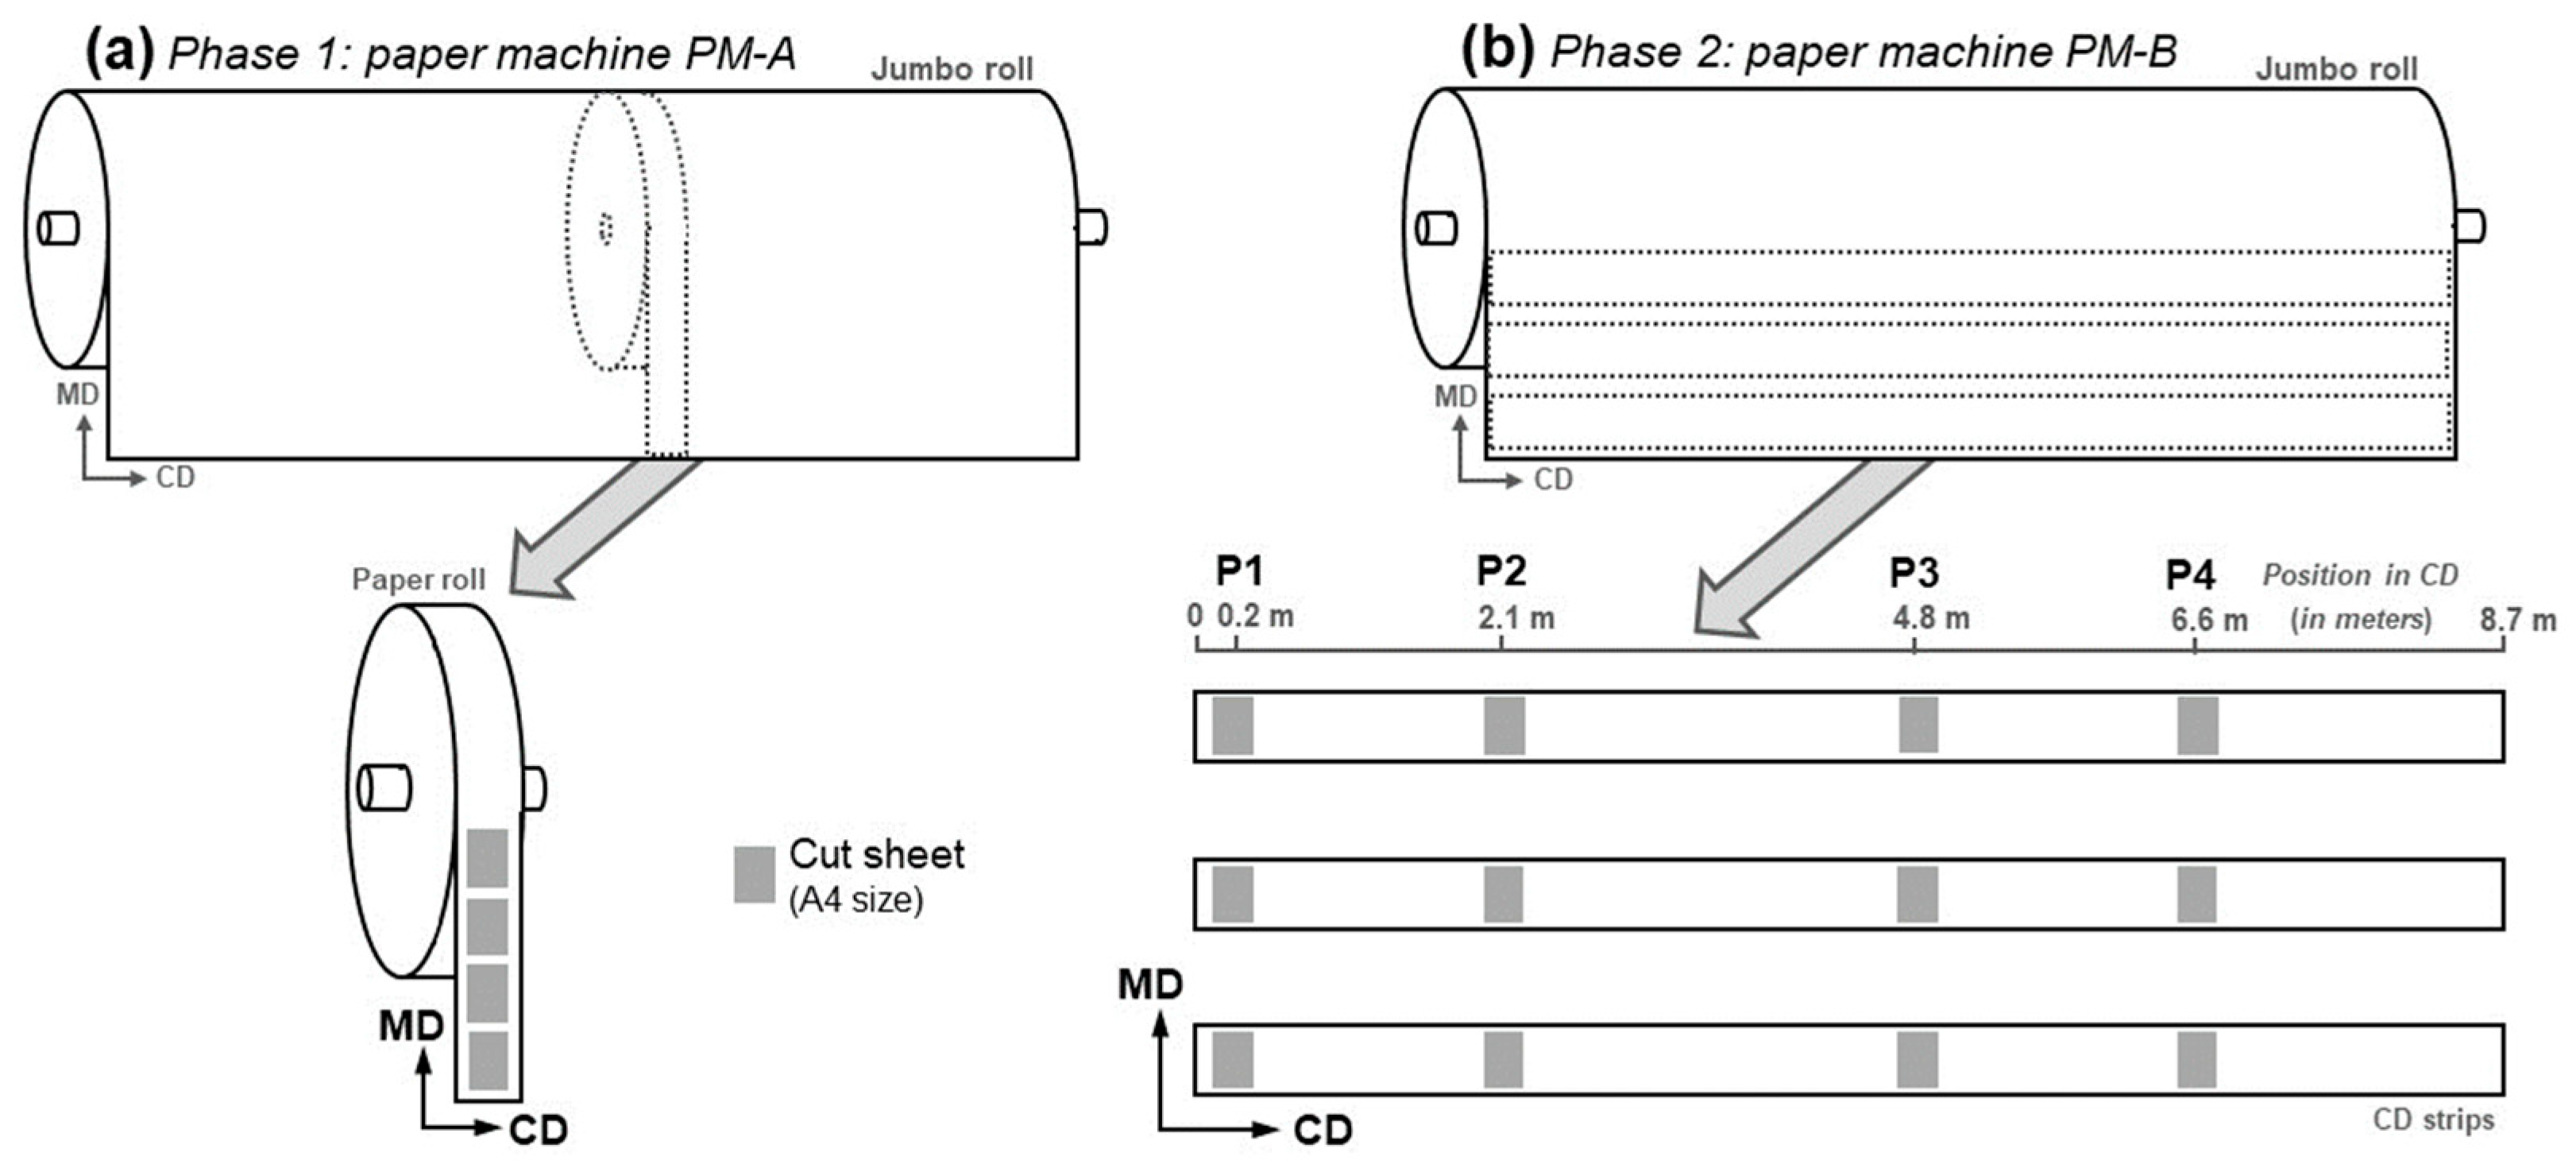
The sheets analyzed in Phase 1 were produced in the paper machine PM-A and were specifically selected to belong to exactly the same position in the CD (the specific position cannot be revealed, only that it was kept fixed during this phase). The samples regard consecutive positions along the MD. This sampling strategy consisted of cutting A4 sheets from a paper roll that resulted from the slitting of a jumbo roll, as shown in Figure 3a. The analysis of these samples conducted for Phase 1 comprised the activities described next.
Several studies were conducted to develop, fine tune, and validate the SIA methodology, which was used to characterize the FO along the ZD before establishing the final protocol, namely (i) the development of the sheet-splitting technique; (ii) internal validation of the GSM algorithm; (iii) repeatability analysis of the SIA methodology; (iv) external validation of the SIA methodology; and (v) analysis of the local paper and flow structure. The main aspects addressed in this sequence of studies are briefly referred to below.
In the development of the sheet-splitting technique, sheets of different sizes (s1, s2, and s3) were used to test and optimize the splitting protocol. The internal validation study consists of imposing in-plane rotations to a sheet layer at known offset angles (θoff) with the MD and acquiring the corresponding images. The images were then processed and analyzed using the GSM algorithm to predict the rotation angle. The prediction accuracy was finally assessed by comparing the predicted rotation angle with the imposed offset angle using the coefficient of determination (R2) for the linear regression model relating them. Additionally, similar values should also be observed for the anisotropy. To this end, the average relative deviation ( R D ¯ ) of the anisotropy values at the ith offset angle, Ai, from the standard measurement, A(0°) (i.e., without imposed rotations, θoff = 0°), is determined through Equation (3) [10]:
R D ¯ = i = 1 n | R D | i n
where | R D | i is the absolute value of the relative deviation (in percentage) of the anisotropy at the ith imposed rotation, in Equation (4), and n is the total number of offset angles analyzed [10].
| R D | i = | A i A ( 0 ° ) | A ( 0 ° ) × 100 %
The standard error corresponding to R D ¯ , σ x ¯ , is also computed from the sample standard deviation, s , of the n values of | R D | i , through the following well-known formula, Equation (5) [10]:
σ x ¯ = s n
In the repeatability study of the SIA methodology, three samples were analyzed to assess the measurement precision of the anisotropy and orientation angle for the overall sample as well as for the bottom and top halves.
In the external validation stage of the SIA methodology, an independent testing principle is used to assess its measurements. For such, the FO results of the individual layers were combined to obtain an overall FO, and this compounded result was compared to the tensile stiffness distribution determined with a TSO tester, Code 150 (Lorentzen Wettre, Kista, Sweden), an ultrasonic-based equipment that provides the (overall) tensile stiffness orientation (TSO), which was used as a reference. Note that although correlated to the FO of paper [41,42,43,44], the tensile stiffness distribution, or TSO distribution, is also influenced by the applied drying conditions [41,45,46], a fact that was taken into account in this work.
Finally, a detailed analysis was conducted of the local cross-sectional (CD) structure that provides insights about the suspension flow at the draining phase of the forming section [23].
A repeatability study was performed for the hot bend method by analyzing both types of experiments: MD and CD and diagonal (LD and RD) (4 tests each). A total of 12 sheets were therefore used to secure 6 strips/repetitions for each test, with the corresponding means ( x ¯ ) and sample standard deviations ( s ) being determined. The overall curl tendencies for all directions were obtained by calculating the difference between the curvatures obtained on two sides, TS − BS.

2.3.2. Phase 2: Industrial Application

The sheets used in Phase 2 were produced in the paper machine PM-B. Contrary to what happened in Phase 1 of the experimental study, where all the samples were collected from the same CD position and successive MD positions (longitudinal profile), here, the samples were collected for the same MD position and different CD positions (cross-sectional profile). This sampling strategy consists of cutting A4 sheets from CD strips of a jumbo roll (Figure 3b). A total of 4 sampling positions in the CD were considered for the second phase (CD strip length of 8.7 m), corresponding to the sampling position P1 → CD position of 0.2 m; P2 → 2.1 m; P3 → 4.8 m; and P4 → 6.6 m. The characterization methods established during Phase 1, SIA, hot bend, and TSO were used to characterize the samples collected in these CD positions. First, the nondestructive TSO technique was applied to a single A4 sheet for each position to determine the corresponding TSO distribution. Subsequently, SIA was implemented over the same sheet used previously for the TSO measurements to determine the FO (global and local) of each layer. Finally, the hot bend method was applied to both types of analyses, MD/CD and diagonal. A total of four sheets were used for each position, to allow 2 strips/repetitions per test.

3. Results and Discussion for Phase 1: Methods Development and Validation

In this section, the results obtained during Phase 1 of the experimental plan are presented and discussed. We start by reporting the outcomes of the SIA methodology. Subsequently, the repeatability study of the hot bend method is analyzed. As previously mentioned, all samples analyzed in Phase 1 were produced by the same paper machine, PM-A, and regard the same position in the CD (the exact position in the CD was not known) and at consecutive positions in the MD. Therefore, they are expected to be structurally similar, as most variations take place along the cross-direction of the paper machine and not along the longitudinal direction or MD.

3.1. Development, Test, and Validation of SIA

The main results obtained in the several studies performed during the development, testing, and validation of the SIA methodology are presented below.

3.1.1. Development of the Sheet-Splitting Technique

Three samples were used, one for each size considered: sample DT1, with size s1; DT2, s2; and DT3, s3 (recall that size s1 corresponds to samples with 120 × 140 mm2 (CD × MD); size s2, to 145 × 150 mm2; and size s3, to an A4 sheet). As expected, the increase of the sample size (i.e., the in-plane sample area, CD × MD) improved the precision of the measurement of the basis weight of the layers. As such, future studies should target A4 sheets (size s3) or larger. A study to determine an appropriate range for the number of layers to obtain using sheet splitting was then conducted for the sample DT3 of size s3 (Figure 4).
The results obtained for the overall FO of sample DT3, which was calculated by combining the results of all the layers obtained after each splitting stage, stabilized after reaching 10 layers. Additionally, the probability of damaging the layers during sheet splitting increases for lower basis weight values (inferior to 7–10 g·m−2). As such, the applied sheet-splitting technique should be used to obtain around 12 layers/sample.

3.1.2. Internal Validation

A total of 12 layers were initially obtained for sample DT1 (size s1), which was the first sample subjected to sheet splitting. The top layer was then used to assess the internal consistency of the methodology. First, several images of the layer were acquired for different introduced in-plane rotations with known offset angles (θoff) with the MD. Subsequently, the GSM algorithm was applied to the images to estimate the fiber orientation. The results obtained for the internal validation study are shown in Figure 5.
The GSM algorithm detected the introduced offset angles accurately, with a near linear 1:1 relationship being obtained between the predicted and imposed rotation angles (R2 of 0.9973). Additionally, the offset angle did not significantly impact the anisotropy, leading to a value for R D ¯ ± σ x ¯ of just 3.3% ± 1.2%. Therefore, these results confirm a high internal consistency of the SIA methodology.

3.1.3. Repeatability Analysis

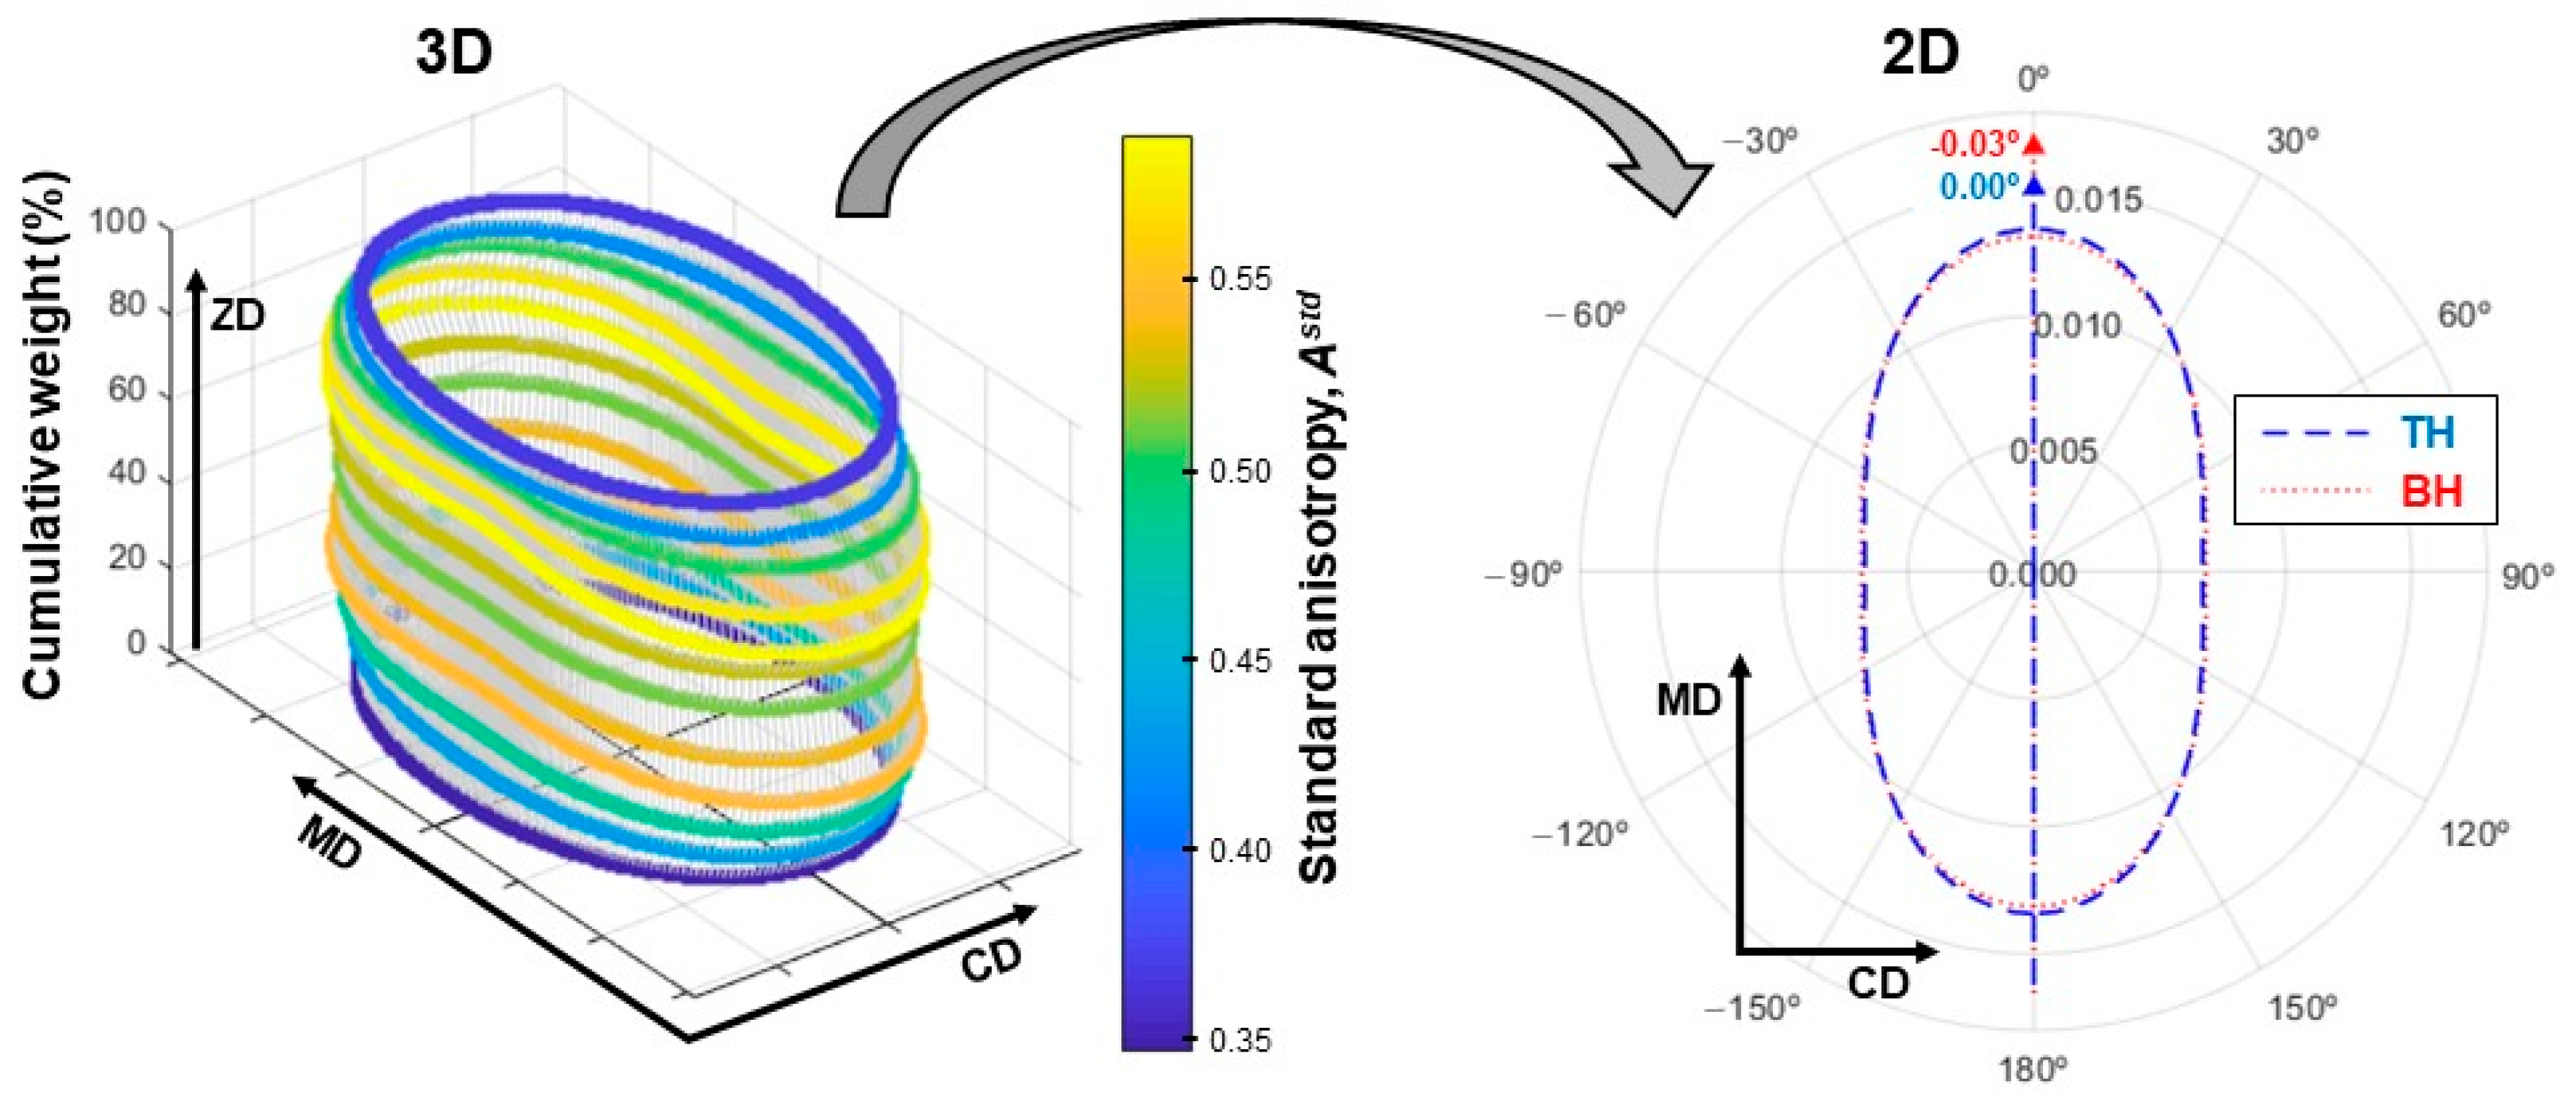
For each sample, the GSM results from all layers were combined to obtain the overall FO of the paper sheet. Similarly, the overall FO of the bottom (BH) and of the top (TH) halves were calculated for each sample by combining the data from the corresponding layers (around 50% in weight for each half). Figure 6 presents the FO in the ZD results obtained for sample DT3 (i.e., considering the individual outcomes from all the layers) through a 3D visualization; also shown is the overall FO of the two halves, in which a 2D representation is used. Polar coordinates were considered for both the 3D and 2D representations.
The FO results obtained for the three samples were then analyzed by comparing the values of the orientation angle and the anisotropy (Table 1). A reduced variation was observed for the overall FO of the paper sheet and of the two halves (bottom and top), with low values being obtained for the sample standard deviation ( s ) of the measured properties. As such, the precision of the methodology was confirmed.
Note that the results shown in Table 1 can be quite useful during a diagnostic activity. In this case, similar FO distributions were obtained for the two halves of paper, indicating a reduced potential for the development of FO induced structural curl problems.

3.1.4. External Validation

The overall fiber orientation distribution of sample DT3 obtained using the SIA methodology was compared with the measurements provided using a TSO technique, which was used as a reference. The TSO technique determines the overall TSO distribution, a property correlated to the fiber orientation distribution [41,42,43,44]. The results are shown in Figure 7.
At the paper machine, the web sheet is stretched in the MD (usually around 1 to 3%) by the application of draws between the pressing and the drying sections, leading to the introduction of drying stresses (i.e., internal stresses introduced after drying) in the MD. On the other hand, the sheet is allowed, to a certain degree, free drying in the CD, especially near the borders, and less so in the center of the web. Thus, a lower level of drying restrictions is applied along the CD when compared to the MD [47]. As previously mentioned, the drying stresses introduced in both the MD and CD impact the TSO results, leading to different TSO and FO distributions [41,45,46]. In particular, the orientation angle of the TSO distribution is only similar to the one of the FO distributions for sheets with preferential fiber alignment around the MD (i.e., θmax < 5°). Otherwise, the two angles will differ, with the difference increasing for higher orientation angles of the FO distribution [45]. Additionally, a smaller FO anisotropy is attained when compared to the corresponding TSO anisotropy [41]. The results obtained in this work are consistent with these effects (Figure 7). In particular, the values obtained for the fiber orientation angle and for the TSO angle were similar and around 0°. On the other hand, a value of 1.96 was obtained for the FO anisotropy, whereas a higher value of 2.41 was determined for the TSO anisotropy. Therefore, the SIA methodology developed in this work is successfully validated.

3.1.5. Analysis of the Local Structure

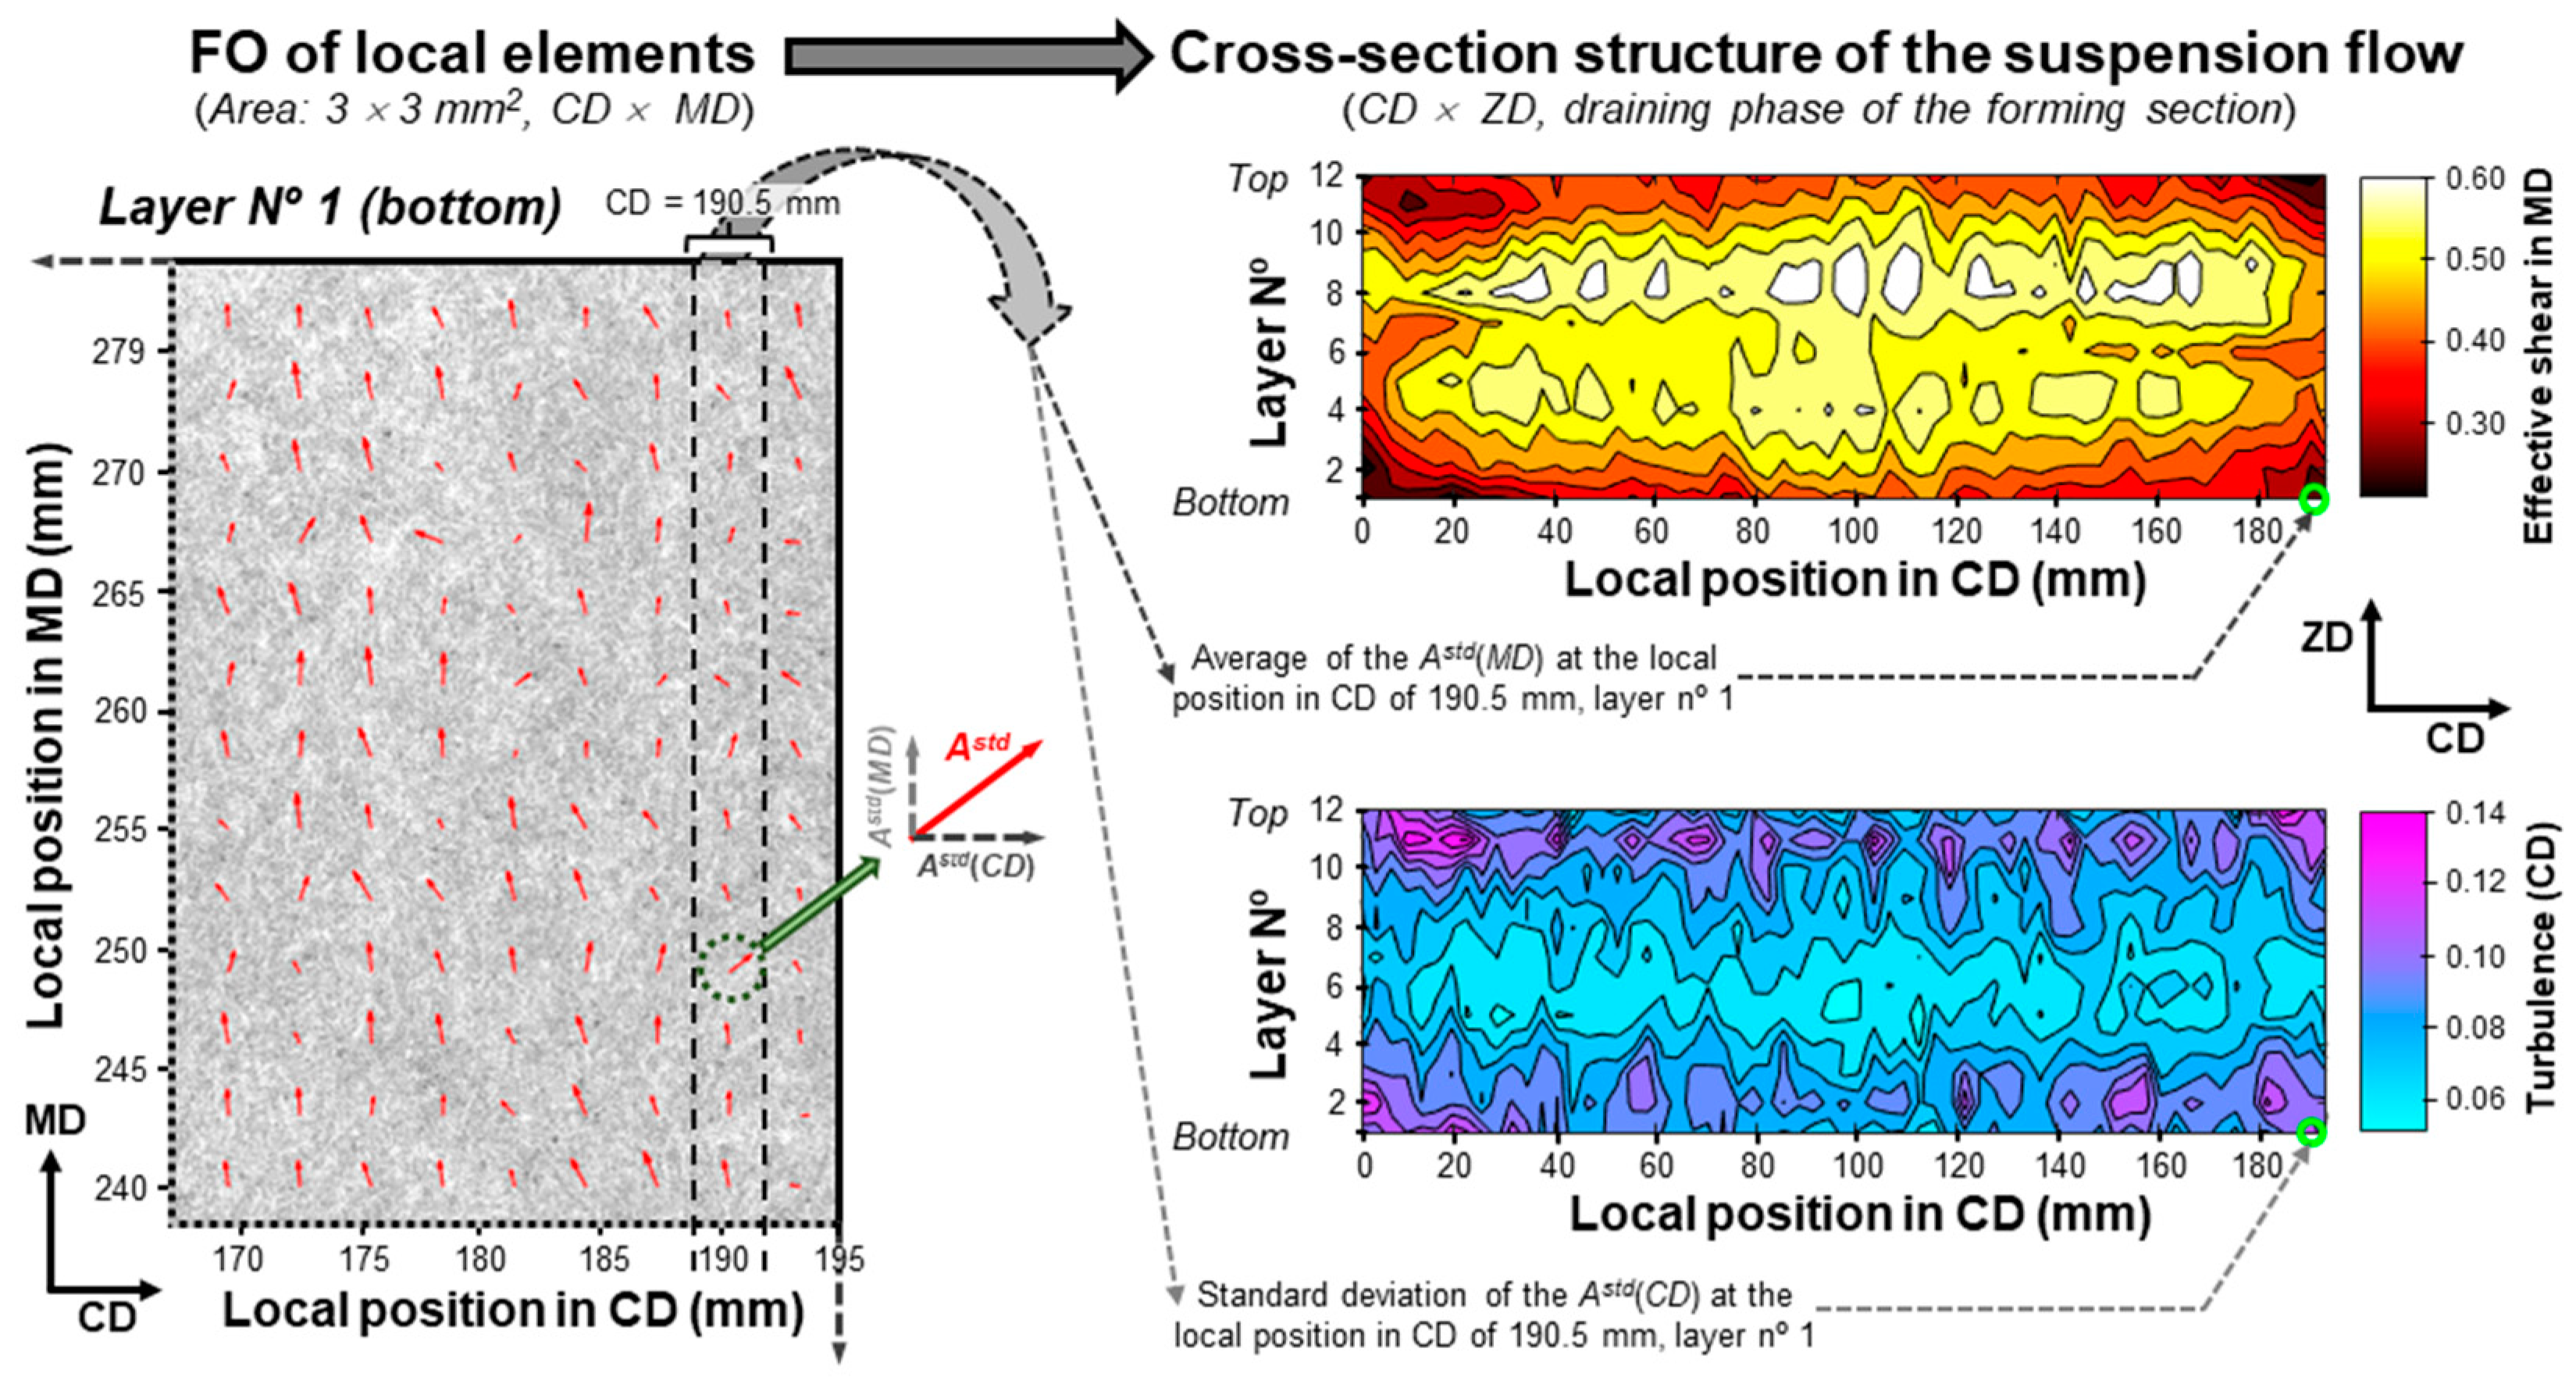
The analysis of the FO at the local level was also implemented on sample DT3. The analysis included two main aspects (see Figure 8): (i) an assessment of the FO of local elements and (ii) evaluation of the cross-section structure of the suspension flow.
For the first aspect, the vector of the standard anisotropy, Astd, was calculated for all the elements of the layers of the sample. This vector is represented in the image by an arrow located at the corresponding position of the local element. The direction of the arrow points towards the direction of the orientation angle, while its size is proportional to the magnitude of the standard anisotropy. As an example, a representation combining the image of part of layer n° 1 (corresponds to the bottom layer) of sample DT3 with the corresponding local FO is shown on the left side of Figure 8.
The second aspect regards the analysis of the cross-section (CD × ZD) structure of the suspension flow at the draining phase of the forming section of the paper machine. To this purpose, the standard anisotropy of the elements of a given layer located at the same position in the CD (i.e., corresponds to an MD strip in the layer) was analyzed. In particular, the average of the MD component of the standard anisotropy, Astd (MD), of the local elements in the MD strip of the layer was used to estimate the effective shear in the MD, while the standard deviation of the CD component, Astd (CD), was used to estimate the turbulence [23]. The calculation of these two properties for a single point is exemplified in the right side of Figure 8, being signaled by a circle (green color) in the two representations of the cross-section (CD × ZD) of the suspension flow.
The analysis of both properties, effective shear in the MD and turbulence, indicates the existence of similar flow dynamics in the two sides of the sheet at the draining phase of the forming section (see Figure 8). These conditions secure the formation of paper with a rather symmetrical FO distribution in the two halves, bottom and top, as previously seen in Figure 6 and Table 1. Therefore, the produced paper is not expected to present structural curl-related problems due to FO two-sidedness.
As previously mentioned, the method provides a qualitative analysis of the flow dynamics of the suspension flow. Nevertheless, a high level of fiber orientation in the MD was observed for the sheets, indicating that a high level of shear in the MD is also being applied to the suspension flow in the forming section. The web sheet in a gap former is constrained between two fabrics, allowing for the application of such high shear levels [23]. As such, this result gives a strong hint that paper machine PM-A could be a gap former.

3.2. Repeatability of the Hot Bend Method

Considering that the assessment of the out-of-plane dimensional stability of paper is always challenging, the repeatability of the hot bend method was analyzed to better interpret its results. Paper samples produced at around the same time using paper machine PM-A and from the same position in the CD were analyzed. The study included two types of tests: MD/CD and diagonal (LD/RD) tests. The mean ( x ¯ ) and the sample standard deviation ( s ) were determined for each test, i.e., for each combination of direction and side (e.g., test MD-TS means that the direction is the MD and the side TS). The dominant curl tendency for each direction was also calculated by subtracting the values of the tests performed on two sides, TS − BS [40]. The results obtained for this study are presented in Table 2.
The diagonal tests were very difficult to measure, leading to quite unreliable results. In particular, the strips tended to develop S-shaped and/or twisted curvatures, rendering the results untrustworthy. On the other hand, a good precision was obtained for the MD/CD tests, as can be appreciated from the low values obtained for the sample standard deviation. The repeatability of the hot bend method was thus confirmed for the MD/CD tests (which are the ones used more frequently).
The results of the MD/CD tests also confirm the reduced potential for the paper produced in the paper machine PM-A to develop structural curl. In particular, the tests showed similar dimensional reactivity for the two sides (i.e., BS and TS) for each direction (MD and CD) of the paper. The results are aligned with the ones obtained using the SIA methodology, which indicate similar FO distributions in the two halves of the sheet. Additionally, this high level of symmetry observed in the sheets using these two methods, hot bend and SIA, combined with the high level of shear in the MD that was previously detected for the suspension flow collectively point in the direction that the paper machine PM-A has a gap former in the forming section [23,29].

4. Results and Discussion for Phase 2: Industrial Application

The methodologies developed/tested/validated in the previous section (Phase 1) were subsequently applied to more thoroughly analyze the production process. Therefore, the methodologies were used to study the CD profile of the paper machine PM-B by analyzing the samples acquired in four CD positions (see Figure 3b).

4.1. Analysis of Fiber Orientation across the ZD

The SIA methodology was applied to characterize the FO in the ZD for each sample acquired in the selected CD positions of the paper machine, PM-B. The main results obtained for the samples are shown in Figure 9. Different types of graphical representations are used to better visualize the results: 3D polar graphs (Figure 9a, left column), to show the FO distribution in ZD; MD vs. ZD polar graphs (Figure 9b, center column), to easily observe the existing differences in the FO between the bottom and top halves; and CD vs. MD polar graphs (Figure 9c, right column), to analyze the FO distributions from the top of the sample. The color map indicates the corresponding standard anisotropy, Astd, for each layer.
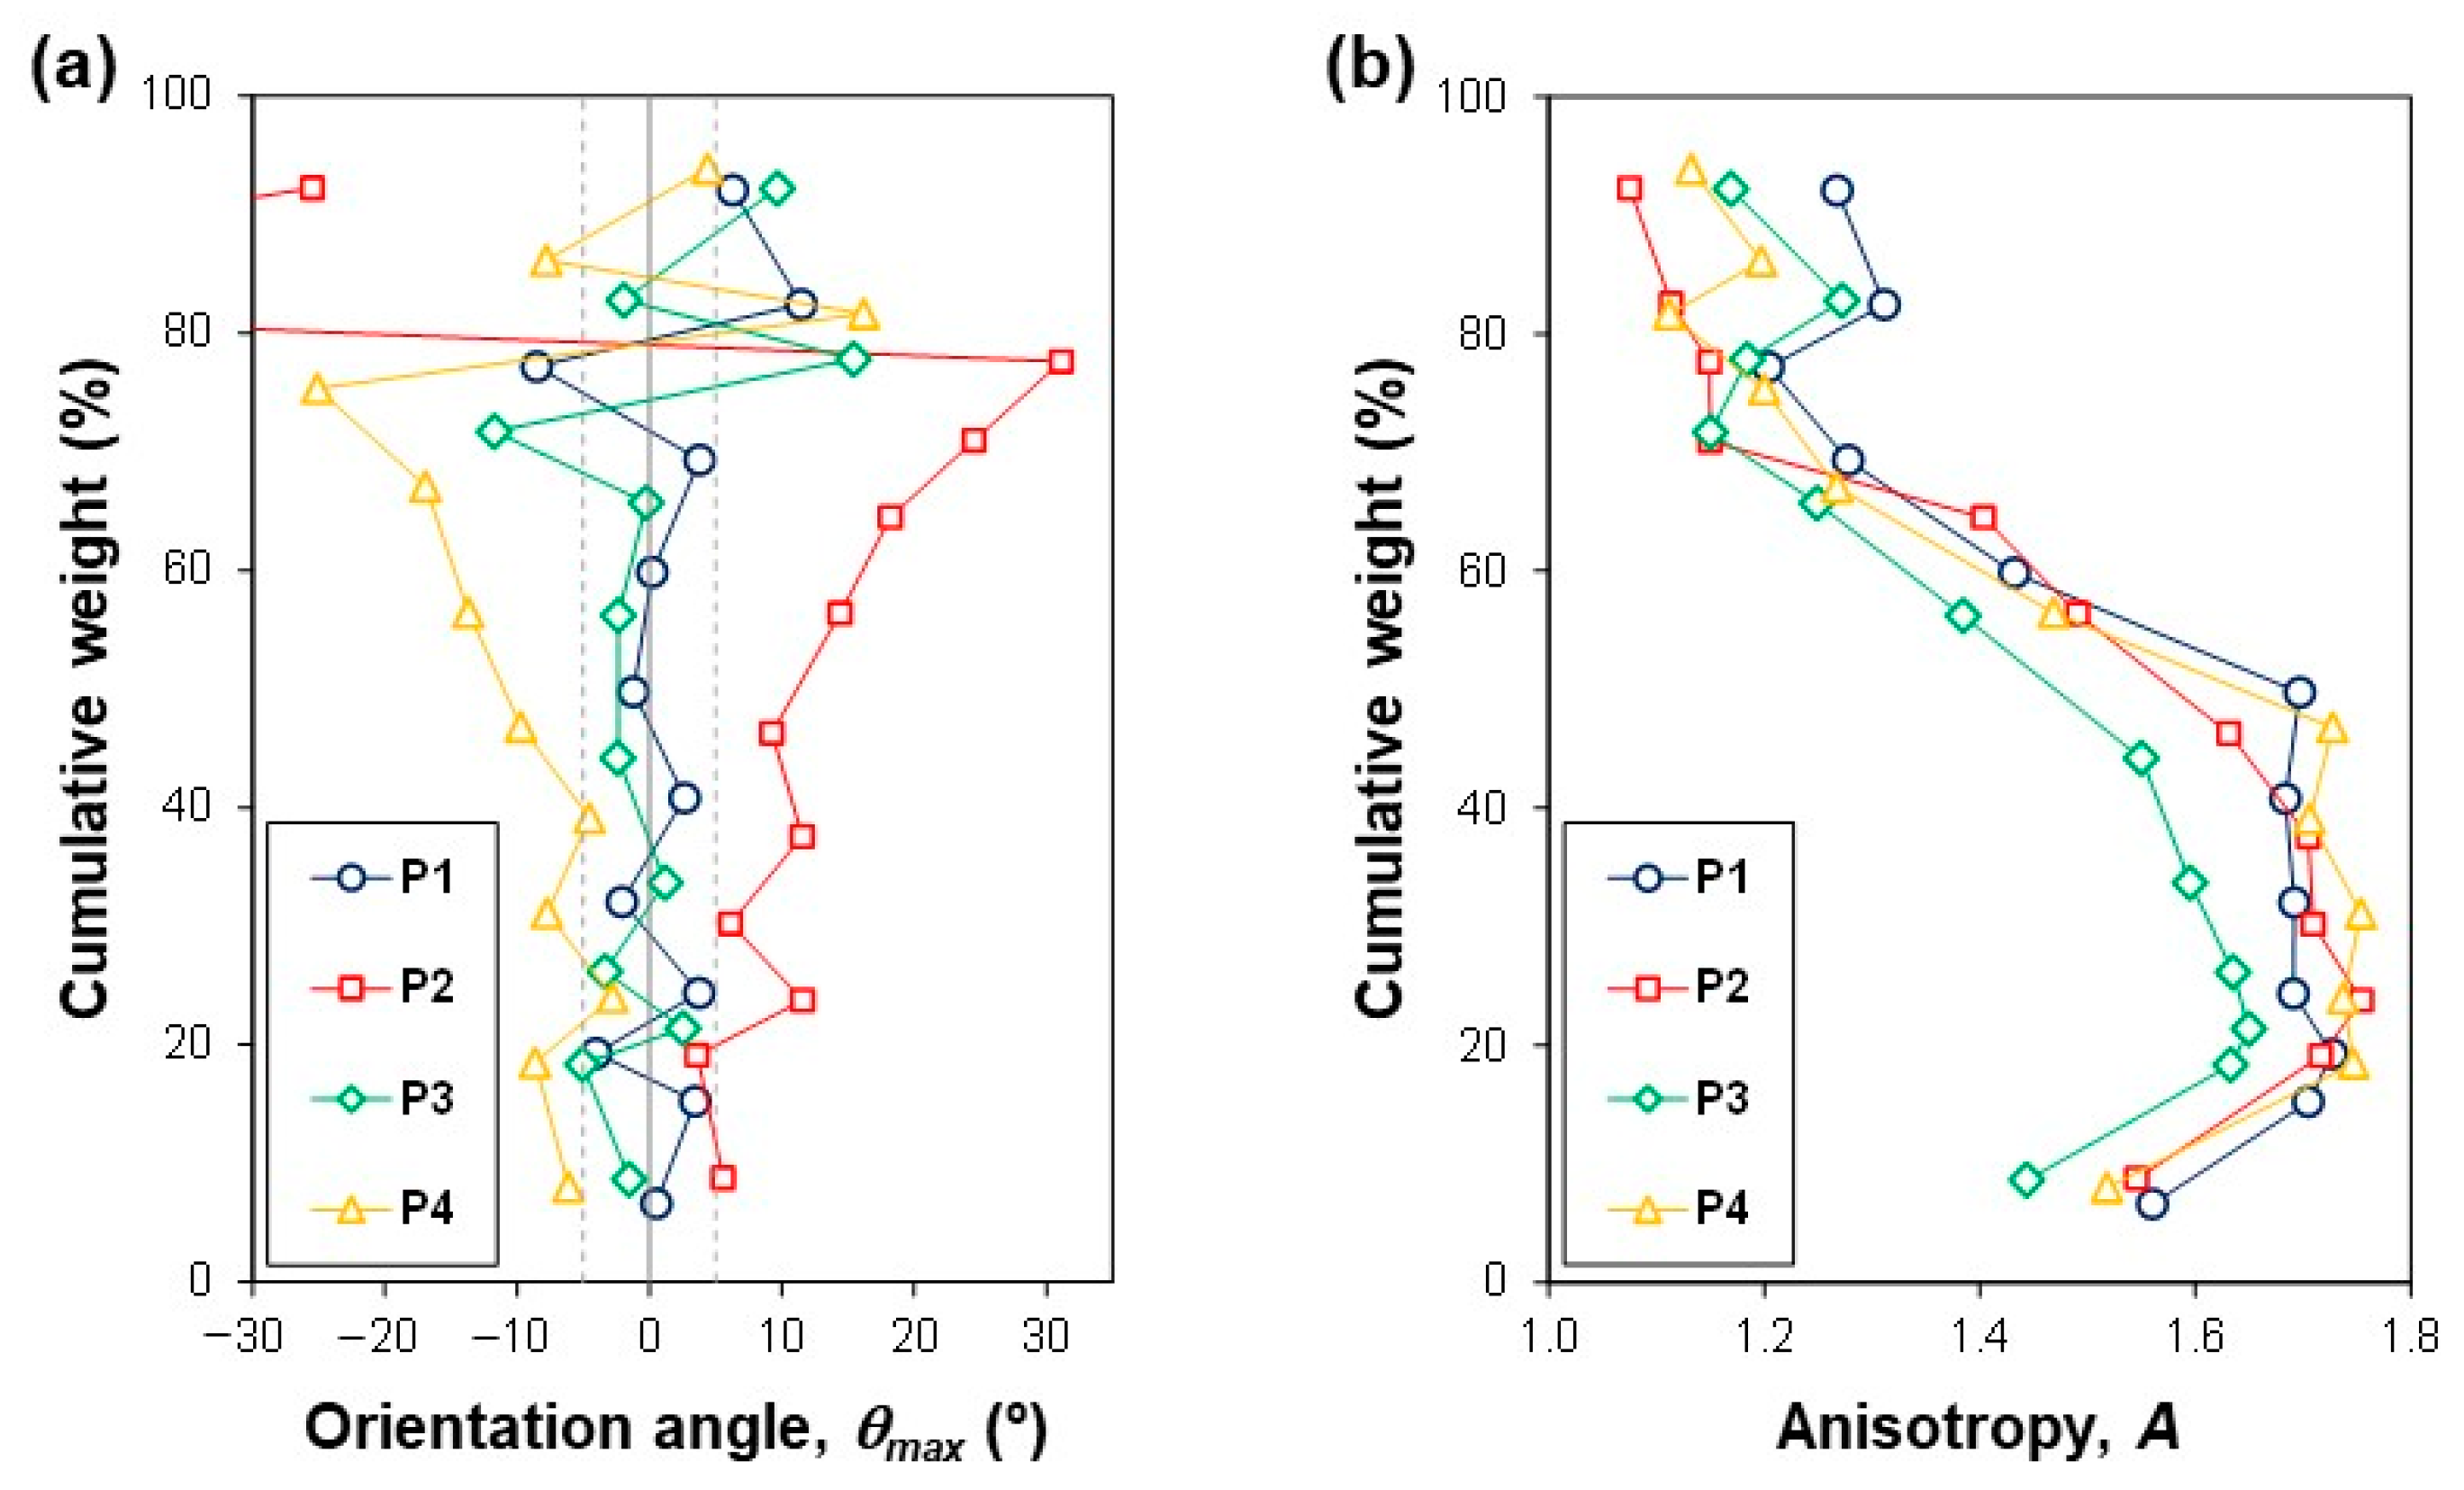
The analysis of Figure 9 allows for drawing relevant findings. Overall, a relatively low level of fiber orientation in the MD was observed in the sheets, probably due to the application of a low level of shear in the MD to the suspension flow in the forming section. Therefore, the paper machine PM-B certainly has a former of the Fourdrinier or hybrid type [23]. Additionally, distinct anisotropy levels were observed in the bottom and the top layers of all samples. To complement the analysis of the results obtained using the SIA methodology, the variation in the ZD of the orientation angle (θmax) and of the anisotropy (A) was also assessed (Figure 10). The cumulative weight is used to represent the ZD of paper, with 0% corresponding to the bottom of the sheet and 100% to the top.
Several interesting observations can be made from the analysis of Figure 10. The variation of the orientation angle in the ZD was highly dependent on the position in the CD. Samples P1 and P3, located, respectively, near the edge and at the middle of the jumbo roll, have orientation angles close to 0° till a cumulative weight of around 70%. At the top layers, higher values are observed for the orientation angles, varying rapidly between negative and positive angles, possibly due to reduced anisotropy. In fact, the anisotropy at the top layers is significantly lower and close to 1 (i.e., the corresponding angular FO distribution is almost a circle), justifying the instability in the orientation angles. On the other hand, samples P2 and P4 are located at symmetrical positions in the CD of the jumbo roll, namely at around 2.1 m from the left and from the right edges, respectively. These samples presented a significant orientation misalignment with the MD, with positive orientation angles being observed for sample P2 and negative for sample P4. Thus, the direction of the suspension flow during the forming phase pointed slightly to the center of the paper machine, close to the positions P2 and P4. In addition, the absolute values of the orientation angle did not change significantly in the bottom layers, until around a cumulative weight of 40%, probably promoted by water drainage and by fiber packing taking place near the wire. This effect is less pronounced in the top layers, leading to a fiber misalignment that increases almost linearly from a cumulative weight of 40%, near the middle of the sheet, to around 80%, near the top. Similar to samples P1 and P3, the reduced anisotropy levels obtained for the top layers led to unstable and meaningless orientation angles.
The data of the different layers were then combined to obtain the FO distribution of the two halves, BH and TH, and of the entire sample (i.e., the overall result, BH + TH). The values of the orientation angle and of the anisotropy calculated from these FO distributions are shown in Table 3. Additionally, the modulus of the difference between the two halves for the two properties is also presented, |TH − BH|, to assess the level of FO two-sidedness of the samples.
The four samples present significant levels of anisotropy two-sidedness (see Table 3), which could potentially promote the development of curl. This aspect could be even more severe in the case of samples P2 and P4, where higher anisotropy differences are observed in the two halves. The axis of the potential curvature, which is also known as the curl mode, can be aligned with the MD or with the CD, being known as MD curl and CD curl, respectively [23]. The curl mode that is developed in practice depends, among other factors, on the level of anisotropy two-sidedness, the operational conditions applied at the drying section of the paper machine, and the shape and size of the paper sample [23,48].
The samples P2 and P4 also have a slight misalignment between the orientation angles of the two halves (differences superior to 4°, see Table 3). As such, the samples might also present potential for the development of the diagonal curl mode (i.e., the axis of the developed curvature is not aligned with any of the main directions, MD and CD) [17,49].
The results obtained for the CD profile of the fiber misalignment tendency (i.e., for the entire sample) shown in Table 3 are also aligned with previous works found in the literature [23]. Namely, it was observed that the fiber misalignment increases from the edge of the paper machine (position P1) until reaching a maximum (around position P2, positive value), followed by a decrease in the misalignment angle to a value of around 0° at the center of the web (position P3). A new maximum is then reached (around position P4), with a similar absolute value but with a different signal (i.e., negative value) than the previous one (around position P2). Consequently, the CD profile of the orientation angle typically resembles a sinusoidal function.

4.2. In-Plane Tensile Stiffness

The TSO distribution determined using the ultrasonic-based TSO technique is a function of both the FO and the drying stresses of paper. Therefore, papermakers can indirectly study the applied drying conditions by combining the information obtained from the FO measurements with the TSO results [6,7,17]. In particular, the drying conditions can be assessed by analyzing the FO and the TSO distributions together. To this end, the values of the properties that represent the two distributions, the anisotropy (A) and the orientation angle (θmax), are compared and analyzed. Table 3 shows the values of the anisotropy and the orientation angle that were obtained for the four samples using the SIA methodology (global FO result, determined by combining the data of all the layers) and using the TSO technique.
Similar values of the orientation angle were obtained for samples P1 and P3 using the two methods (see Table 3). This was expected, since the FO is mainly oriented along the MD (i.e., the orientation angle is close to 0°). On the other hand, FO misalignment with the MD was observed for samples P2 and P4. In this case, lower absolute values were then attained for the orientation angle using the TSO technique when compared to the FO measurement. This difference can be explained as a manifestation of the internal stresses that build up during drying (drying stresses) [45].
The four samples presented higher anisotropy values for the TSO distribution when compared to the ones calculated for the FO, in line with results found in the literature [41]. As such, the difference between the anisotropy values of the two distributions, A (TSO) − A (FO), can be attributed to the applied drying restrictions in the paper machine [6,7]. Similar differences were observed for the samples that are located away from the border of the web sheet, namely the samples P2, P3, and P4. Thus, these samples were subjected to comparable drying conditions. On the other hand, a higher difference between the anisotropy values of the TSO of the FO distributions was observed for sample P1, located near the border of the web. Lower levels of drying restrictions in the CD are applied in the areas close to the borders, thus explaining the comparatively higher difference obtained for this sample [47,50].

4.3. Potential to Develop Curl

The hot bend method was applied to sheets produced using the paper machine PM-B at the selected positions in the CD to assess their potential to develop curl. Two types of tests were used to analyze the sheets, MD/CD and diagonal. For each position in the CD, two strips/repetitions were measured per test, from which a mean value of the curl magnitude was calculated. The results obtained using the method are presented in Table 4.
The diagonal tests were very difficult to perform due to the strips’ tendency to develop S-shaped and/or twisted curvatures, as previously observed during the validation study in Phase 1. This fact renders the results obtained for the diagonal experiments not trustworthy. Therefore, we do not recommend the systematic use of the hot bend method to evaluate diagonal curl. Nevertheless, these tests could be used to analyze situations where this mode could be present (e.g., due to possible differences between the orientation angles of the two halves superior to 10–15°).
Unlike the diagonal tests, the MD/CD experiments did not raise any practical issue. The results indicated a high potential of the samples to develop curl phenomena. Additionally, similar curl tendencies were obtained for the four positions, with the curvatures developed for the two directions facing opposite sides: top side (TS) for the MD strips and bottom side (BS) for the CD strips. This result is typical of sheets with strong anisotropy two-sidedness [2,22,38,40], in line with the analysis that was previously made for the FO measurements. It should also be mentioned that slightly higher curl magnitudes were observed for positions P2 and P4 due to the increased level of anisotropy two-sidedness found in those sheets.

4.4. Cross-Section Structure of the Suspension Flow

The sheets produced using the paper machine PM-B were found to present a high potential for the development of curl. This dimensional phenomenon was promoted by the high level of FO two-sidedness in the sheets. As mentioned previously, knowledge of the flow dynamics at the forming section is very useful to understand the FO distribution in the ZD found in the web sheet. Therefore, the cross-section (CD × ZD) structure of the suspension flow at the draining phase of the forming section was qualitatively estimated for the considered positions in the CD of the paper machine PM-B. In particular, the two properties of the jet that are responsible to a great extent for the FO observed at the local elements of the sheet are estimated, namely the effective shear in the MD (Figure 11a) and the turbulence (Figure 11b) [6,7,23]. The analysis of the results can then be used by the company to determine if there is a need to act on the process, namely by changing the operational variables linked to the jet, to improve the FO distribution in the ZD of the sheets (e.g., use a different setting for J-W by adjusting the jet speed J).
Similar cross-section structures of the suspension flow were obtained for all the positions. Clear differences were observed between the bottom and the top parts of the cross-section structures. A higher shear was applied in the bottom of the suspension flow, being responsible for the increased FO level in the MD that was observed in the bottom half of the sheets. On the other hand, higher turbulence was found at the top of the flow, leading to the reduced anisotropy level observed in the top half of the sheets. This turbulence was more pronounced at the positions P2 and P4, which could explain the fiber misalignment with the MD that was observed in the top half of those samples.
As a final remark, the results indicate that the papermaker could indeed consider acting on the process to improve the FO symmetry between the two halves of the sheet in order to reduce possible curl-related problems due to the strong anisotropy two-sidedness found in the sheets. Nevertheless, priority should always be given to the operational settings that first minimize the potential for the development of diagonal curl due to fiber misalignment between the two sides of paper, as this is known to promote more severe problems to the final user (e.g., printer jams) [4]. The anisotropy two-sidedness can also be partially (and temporarily) mitigated by the application of differential drying to the two sides of the sheet [47].

5. Conclusions

The SIA methodology to characterize the FO in the ZD of paper sheets was successfully developed and applied in an industrial context. The methodology is simple and easy to implement, combining a sheet-splitting technique with an image analysis approach. The methodology has the potential to be applied in curl troubleshooting activities, process optimization, and product development. Moreover, the methodology provides qualitative information regarding the flow dynamics of the suspension flow at the draining phase of the forming section, which could be useful for diagnosing problems and tuning the operation. The FO results can also be combined with TSO measurements to analyze the presence and effect of drying stresses in the paper produced.
The hot bend method was successfully used to assess the potential of paper to develop curl. This method is easy to implement, providing fast and consistent results. In particular, the precision of the method was confirmed for the tests used to analyze the two main directions, the MD and CD. Nevertheless, the method provided results for the diagonal tests that are not reliable, thus not assuring an adequate analysis of the potential of paper to develop diagonal curl.
In summary, we demonstrated that SIA, TSO, and hot bend methods, when properly executed and combined, reliably provide valuable insights to paper producers and support to their continuous efforts to characterize a complex material such as paper and optimize its properties, as well as the operating conditions under which it is produced.

Author Contributions

Conceptualization, P.A.N.D. and M.S.R.; methodology, P.A.N.D. and M.S.R.; software, P.A.N.D.; validation, P.A.N.D. and M.S.R.; formal analysis, P.A.N.D.; investigation, P.A.N.D.; resources, M.S.R. and R.R.; data curation, P.A.N.D.; writing—original draft preparation, P.A.N.D.; writing—review and editing, P.A.N.D. and M.S.R.; visualization, P.A.N.D.; supervision, M.S.R. and R.R.; project administration, M.S.R. and R.R.; funding acquisition, M.S.R. and R.R. All authors have read and agreed to the published version of the manuscript.

Funding

This work was carried out under the Project inpactus—innovative products and technologies from eucalyptus, Project N.° 21874, funded by Portugal 2020 through the European Regional Development Fund (ERDF) in the frame of COMPETE 2020 n°246/AXIS II/2017. Marco S. Reis acknowledges support from the Fundação para a Ciência e Tecnologia, I.P., through the projects with DOI:10.54499/UIDB/00102/2020 and DOI:10.54499/UIDP/00102/2020.

Data Availability Statement

The data that were used are confidential.

Conflicts of Interest

The authors declare that they have no known competing financial interests or personal relationships that could have appeared to influence the work reported in this paper.

Abbreviations

The nomenclature is given as the abbreviations, variables, and their corresponding units and subscripts in this section.
Abbreviations
Bottom half of the paper sheetBH
Bottom side of the paper sheetBS
Cross-machine direction, i.e., the direction perpendicular to the MDCD
Critical quality attributeCQA
Diagonal (also known as angular) direction, i.e., an in-plane direction not aligned with the MD and/or CDDD
Dots per inchdpi
Fiber orientationFO
Gradient-segmentation methodGSM
In-plane left diagonal direction of the paper sheetLD
Machine direction, i.e., the direction parallel to the paper machine where the paper is producedMD
In-plane right diagonal direction of the paper sheetRD
Sheet splitting and image analysis methodologySIA
Top half of the paper sheetTH
Top side of the paper sheetTS
Tensile stiffness orientationTSO
Thickness direction of a paper sheetZD
Variables
Maximum of the angular distribution functiona
Anisotropy, obtained using the ratio of the maximum, a, and minimum, b, values of the angular distribution functionA
Anisotropy MD/CD, corresponding to the ratio of the values of the angular distribution function for the MD and CDAMD/CD
Standard anisotropy, being linked to the anisotropy, A, by 1 − 1/AAstd
Minimum of the angular distribution functionb
Cosine function with three terms, a Fourier series expansion truncated in the third term, used to represent the angular distributionfθ(θ)
Speed of the suspension jet at the forming section of the paper machine (m·min−1)J
Difference between the speed of the suspension jet and the wire at the forming section of the paper machine (m·min−1)J-W
Scale factor of the cosine function with three termsK
Number of rotations tested, i.e., number of θoff introduced at an imaging step for the internal consistency assessmentn
Coefficient of determinationR2
Average of the modulus (absolute value) of relative deviation, R D i , for all the n considered offset angle points i, introduced at an imaging step for the internal consistency assessment R D ¯
Absolute value of the relative deviation of the anisotropy at a given offset angle with index i, Ai, from the standard measurement (θoff = 0°), A(0°) R D i
Relative humidity (%)RH
Sample standard deviation s
Temperature (°C)T
Wire speed at the forming section of the paper machine (m·min−1)W
Sample mean x ¯
Variation of the temperature (°C)ΔT
First term of the cosine function with three termsη1
Second term of the cosine function with three termsη2
Third term of the cosine function with three termsη3
Orientation angle of a fiber segment, corresponding to the angle between the MD and the longitudinal direction of the fiber segment (°)θ
Orientation angle, corresponding to the angle between the MD and the direction with the highest orientation level of fibers (°)θmax
Offset angle, corresponding to a rotation relative to the MD introduced at an imaging step (°)θoff
Density (g·cm−3)ρ
Standard deviation of the mean, estimated from the sample standard deviation of the n data points, s , using σ x ¯ = s n σ x ¯
Subscripts
Offset angle (θoff) pointi

References

  1. Rutland, D.F. Dimensional Stability and Curl. In Pulp and Paper Manufacture; Kouris, M., Kocurek, M.J., Eds.; Joint Textbook Committee of the Paper Industry: Atlanta, GA, USA, 1989; Volume 9, pp. 132–151. [Google Scholar]
  2. Uesaka, T. Dimensional Stability and Environmental Effects on Paper Properties. In Handbook of Physical Testing of Paper—Vol. 1, 2nd ed.; Mark, R.E., Habeger, C., Jr., Borch, J., Lyne, M.B., Eds.; Marcel Dekker, Inc.: New York, NY, USA, 2002; Volume 1, pp. 115–171. [Google Scholar]
  3. Green, C.; Atkins, J. The Problem of Paper Curl. Tappi J. 2011, 7, 1–6. [Google Scholar]
  4. Reis, M.S.; Abreu, C.T.; Heitor, M.J.; Ataíde, J.; Saraiva, P.M. A New Procedure for the Routine Assessment of Paper Diagonal Curl. Tappi J. 2009, 8, 20–26. [Google Scholar] [CrossRef]
  5. Glynn, P.; Jones, H.W.H.; Gallay, W. The Fundamentals of Curl in Paper. Pulp Pap. Mag. Can. 1959, 60, T316–T323. [Google Scholar]
  6. Lloyd, M.D.; Chalmers, I.R. Use of an Image Orientation Analysis Technique to Investigate Sheet Structural Problems During Forming. In Proceedings of the 54th Appita Annual Conference, Melbourne, VIC, Australia, 3–6 April 2000; pp. 495–502. [Google Scholar]
  7. Lloyd, M.D.; Chalmers, I.R. Use of Fibre Orientation Analysis to Investigate Sheet Structural Problems During Forming. Appita J. 2001, 54, 15–21. [Google Scholar]
  8. Enomae, T.; Han, Y.; Isogai, A. Nondestructive determination of fiber orientation distribution of paper surface by image analysis. Nord. Pulp Pap. Res. J. 2006, 21, 253–259. [Google Scholar] [CrossRef]
  9. Mendes, A.d.O.; Fiadeiro, P.T.; Costa, A.P.; Amaral, M.E.; Belgacem, M.N. Laser Scanning for Assessment of the Fiber Anisotropy and Orientation in the Surfaces and Bulk of the Paper. Nord. Pulp Pap. Res. J. 2015, 30, 308–318. [Google Scholar] [CrossRef]
  10. Dias, P.A.N.; Rodrigues, R.J.; Reis, M.S. Fast characterization of in-plane fiber orientation at the surface of paper sheets through image analysis. Chemom. Intell. Lab. Syst. 2023, 234, 104761. [Google Scholar] [CrossRef]
  11. Gustafsson, P.-J.; Niskanen, K. 2 Paper as an engineering material. In Mechanics of Paper Products; Sören, Ö., Kaarlo, N., Eds.; De Gruyter: Berlin, Germany; Boston, MA, USA, 2021; pp. 5–28. [Google Scholar]
  12. Enomae, T.; Han, Y.-H.; Isogai, A. Z-Directional Distribution of Fiber Orientation of Japanese and Western Papers Determined by Confocal Laser Scanning Microscopy. J. Wood Sci. 2008, 54, 300–307. [Google Scholar] [CrossRef]
  13. Kondo, Y.; Aidun, C.K. Development of Method for Analyzing Internal Properties of Coated Paper: Image Analysis Using X-ray Microtomography. Jpn. Tappi J. 2007, 61, 83–91. [Google Scholar] [CrossRef]
  14. Kallmes, O.J. Technique for Determining The Fiber Orientation Distribution Throughout the Thickness of a Sheet. Tappi 1969, 52, 482–485. [Google Scholar]
  15. Green, C.J. Curl, Expansivity, and Dimensional Stability. In Handbook of Physical and Mechanical Testing of Paper and Paperboard; Mark, R.E., Ed.; Marcel Dekker, Inc.: New York, NY, USA, 1984; Volume 2, pp. 415–443. [Google Scholar]
  16. Erkkilä, A.-L.; Pakarinen, P.; Odell, M. Sheet Forming Studies Using Layered Orientation Analysis. Pulp Pap. Can. 1998, 99, 81–85. [Google Scholar]
  17. Hirn, U.; Bauer, W. Investigating Paper Curl by Sheet Splitting. In Proceedings of the EUCEPA Conference ‘Challenges 06’, Bratislava, Slovakia, 8–9 November 2006. [Google Scholar]
  18. Hirn, U.; Bauer, W. Evaluating an Improved Method to Determine Layered Fibre Orientation by Sheet Splitting. In Proceedings of the 61st Appita Annual Conference and Exhibition, Gold Coast, QLD, Australia, 6–9 May 2007; pp. 71–79. [Google Scholar]
  19. Rosén, F.; Söderberg, D.; Lucisano, M.F.; Östlund, C. Estimation of Fibre Segment Orientation Using Steerable Filtering. In Proceedings of the PaperCon’08—Paper Conference and Trade Show, Dallas, TX, USA, 4–7 May 2008; pp. 1097–1144. [Google Scholar]
  20. Green, C. Curl Properties of Paper Structures. Ind. Eng. Chem. Prod. Res. Dev. 1981, 20, 147–150. [Google Scholar] [CrossRef]
  21. Morris, V.A.P.; Sampson, W.W. An Investigation of Heat Curl in Newsprint. Tappi J. 1998, 81, 191–194. [Google Scholar]
  22. Green, C. PTN318 on Analyzing Curl Problems. 2006. Available online: http://www.papercurl.com (accessed on 22 June 2024).
  23. Odell, M.H.; Pakarinen, P. The Compleat Fibre Orientation Control and Effects on Diverse Paper Properties. In Proceedings of the 2001 Papermakers Conference, Atlanta, GA, USA, 11–14 March 2001. [Google Scholar]
  24. Ono, K.; Park, C.; Aidun, C. A New Technique for Fibre Orientation Measurement Using Image Analysis. In Proceedings of the 2002 TAPPI Fall Technical Conference and Trade Fair, San Diego, CA, USA, 8–22 September 2002; pp. 1–7. [Google Scholar]
  25. Lucisano, M.F.; Pikulik, L. Sheet Splitting with a Heat Seal Lamination Technique; Innventia AB: Stockholm, Sweden, 2010. [Google Scholar]
  26. Thorpe, J.L. Exploring Fibre Orientation Within Copy Paper. In Proceedings of the 1999 International Paper Physics Conference, San Diego, CA, USA, 26–30 September 1999; pp. 447–458. [Google Scholar]
  27. Erkkilä, A.-L.; Leppänen, T.; Tuovinen, T. The Curl and Fluting of Paper: The Effect of Elasto-Plasticity. In Proceedings of the ECCOMAS Congress 2016: VII European Congress on Computational Methods in Applied Sciences and Engineering, Crete, Greece, 5–10 June 2016; pp. 4752–4769. [Google Scholar]
  28. Lipponen, P.; Erkkilä, A.-L.; Leppänen, T.; Hämäläinen, J. On the importance of in-plane shrinkage and through-thickness moisture gradient during drying on cockling and curling phenomena. In Proceedings of the 14th Pulp and Paper Fundamental Research Symposium, Oxford, UK, 13–18 September 2009; pp. 389–436. [Google Scholar]
  29. Holik, H.; Moser, J.; Ruehl, T. Wire Section. In Handbook of Paper and Board, 2nd ed.; Holik, H., Ed.; Wiley-VCH Verlag GmbH & Co. KGaA: Weinheim, Germany, 2013; Volume 2, pp. 659–678. [Google Scholar]
  30. Holik, H.; Moser, J.; Ruehl, T. Headbox. In Handbook of Paper and Board, 2nd ed.; Holik, H., Ed.; Wiley-VCH Verlag GmbH & Co. KGaA: Weinheim, Germany, 2013; Volume 2, pp. 635–657. [Google Scholar]
  31. Holik, H.; Moser, J. Uniformity of Paper Web Properties. In Handbook of Paper and Board; Holik, H., Ed.; Wiley-VCH Verlag GmbH & Co. KGaA: Weinheim, Germany, 2013; Volume 2, pp. 879–909. [Google Scholar]
  32. Costa, T.G.; Gamelas, J.A.; Moutinho, I.M.; Figueiredo, M.M.; Ferreira, P.J. The Influence of Paper Surface Sizing on Inkjet Pigment Penetration. Appita J. 2010, 63, 392–398. [Google Scholar]
  33. Ferreira, P.J.; Gamelas, J.A.; Moutinho, I.M.; Ferreira, A.G.; Gómez, N.; Molleda, C.; Figueiredo, M.M. Application of FT-IR-ATR Spectroscopy to Evaluate the Penetration of surface Sizing Agents into the Paper Structure. Ind. Eng. Chem. Res. 2009, 48, 3867–3872. [Google Scholar] [CrossRef]
  34. Conn, A.; Reich, M.; Faltas, R.; Branson, T. A New, Simple, Low Cost, Paper Curl Measurement Apparatus. Appita: Technol. Innov. Manuf. Environ. 2012, 65, 352–359. [Google Scholar]
  35. Eriksson, L.-E.; Cavlin, S.; Fellers, C.; Carlsson, L. Curl and Twist of Paperboard-Theory and Measurement. Nord. Pulp Pap. Res. J. 1987, 2, 66–70. [Google Scholar] [CrossRef]
  36. Lucisano, M.F.C.; Nilsson, M.; Cochard, J. A New Instrument for Measurement of the Out-of-plane Dimensional Stability of Paperboard. In Proceedings of the 2007 International Paper Physics Conference, Gold Coast, QLD, Australia, 6–9 May 2007; pp. 349–355. [Google Scholar]
  37. Niskanen, K. Curl Variations in Paper and Board. Pap. Ja Puu 1996, 78, 292–297. [Google Scholar]
  38. Green, C.; Atkins, J. Solving Curl Problems: The Basics. Solution 2001, 84, 40–43. [Google Scholar]
  39. Reich, M.; Conn, A.; Faltas, R.; Liu, F.; Branson, T. Measurement of Curl Using Image Analysis. In Proceedings of the 61st Appita Annual Conference and Exhibition, Gold Coast, QLD, Australia, 6–9 May 2007; pp. 207–211. [Google Scholar]
  40. Green, C. PTN44 Hot Bend (or Mandrell) Curl Test-v3-4. June 2003. Available online: http://www.papercurl.com (accessed on 22 June 2024).
  41. Brodeur, P.; Gerhardstein, J.P. Overview of applications of ultrasonics in the pulp and paper industry. In Proceedings of the 1998 IEEE Ultrasonics Symposium, Sendai, Japan, 5–8 October 1998; pp. 809–815. [Google Scholar]
  42. Niskanen, K.J.; Sadowski, J.W. Evaluation of some fibre orientation measurements. J. Pulp Pap. Sci. 1989, 15, J220–J224. [Google Scholar]
  43. Schaffrath, H.J.; Tillmann, O. Testing of Fibers, Suspensions, and Paper and Board Grades. In Handbook of Paper and Board, 2nd ed.; Holik, H., Ed.; Wiley-VCH Verlag GmbH & Co. KGaA: Weinheim, Germany, 2013; Volume 2, pp. 1059–1086. [Google Scholar]
  44. Tan, Z. Paper: Nondestructive Evaluation. In Encyclopedia of Materials: Science and Technology; Buschow, K.H.J., Cahn, R.W., Flemings, M.C., Ilschner, B., Kramer, E.J., Mahajan, S., Veyssière, P., Eds.; Elsevier: Oxford, UK, 2001; pp. 1–5. [Google Scholar]
  45. Hess, T.R.; Brodeur, P.H. Effects of Wet Straining and Drying on Fibre Orientation and Elastic Stiffness Orientation. J. Pulp Pap. Sci. 1996, 22, J160–J164. [Google Scholar]
  46. Vahey, D.W.; Considine, J.M.; Kahra, A.; Scotch, M. Comparison of fiber orientation and tensile-stiffness orientation measurements in paper. In Proceedings of the Progress in Paper Physics Seminar 2008, Espoo, Finland, 2–5 June 2008; pp. 271–273. [Google Scholar]
  47. Holik, H.; Mayer, R. Dryer Section. In Handbook of Paper and Board, 2nd ed.; Holik, H., Ed.; Wiley-VCH Verlag GmbH & Co. KGaA: Weinheim, Germany, 2013; Volume 2, pp. 713–744. [Google Scholar]
  48. Nordström, A.; Gudmundson, P.; Carlsson, L.A. Influence of Sheet Dimensions on Curl of Paper. J. Pulp Pap. Sci. JPPS 1998, 24, 18–25. [Google Scholar]
  49. Niskanen, K.J. Anisotropy of Laser Paper. Pap. Ja Puu 1993, 75, 326–328. [Google Scholar]
  50. Mendes, A.H.T.; Kim, H.Y.; Ferreira, P.J.T.; Park, S.W. The Importance of the Measurement of Paper Differential CD Shrinkage. O Pap. 2012, 73, 45–49. [Google Scholar]
Figure 1. Simplified flowsheet of the SIA (sheet splitting and image analysis) methodology developed in this work to characterize the FO in the ZD of paper.
Processes 12 01536 g001
Figure 2. Implementation of the hot bend method.
Processes 12 01536 g002
Figure 3. Sampling strategies used in (a) Phase 1 and (b) Phase 2.
Processes 12 01536 g003
Figure 4. Effect of the number of sheet-splitting steps on the overall fiber orientation of sample DT3 (i.e., obtained by combining the data of the layers obtained till that point), produced using the paper machine PM-A: (a) orientation angle, θmax; (b) anisotropy, A.
Processes 12 01536 g004
Figure 5. Impact of the introducing offset angles, θoff, during the imaging step on the measurement of the FO of the top layer of sample DT1, produced using the paper machine PM-A: (a) orientation angle, θmax; (b) anisotropy, A.
Processes 12 01536 g005
Figure 6. FO distribution results (polar coordinates) obtained with the SIA methodology for sample DT3, produced using the paper machine PM-A: left side—FO in the ZD (3D representation); right side—overall FO in the bottom half (BH) and in the top half (TH) (2D graph).
Processes 12 01536 g006
Figure 7. Comparison of the overall angular fiber orientation distribution obtained using the SIA methodology with the angular TSO distribution, used as a reference, for sample DT3, produced using the paper machine PM-A.
Processes 12 01536 g007
Figure 8. Analysis of the FO at the local level for all the layers of sample DT3, produced using the paper machine PM-A: left side—assessment of the FO of local elements, exemplified for part of the image of layer n° 1 (corresponds to the bottom layer); right side—evaluation of the cross-section structure of the suspension flow.
Processes 12 01536 g008
Figure 9. Results obtained of the FO distribution in the ZD (polar coordinates used) using the SIA methodology for samples produced using the paper machine PM-B at different positions in the CD: (a) 3D visualization (left column); (b) MD vs. ZD (center column); (c) CD vs. MD (right column). The color map indicates the corresponding standard anisotropy, Astd.
Processes 12 01536 g009
Figure 10. Results obtained using the SIA methodology for samples produced using the paper machine PM-B at different positions in the CD for the variation in the ZD of (a) the orientation angle, θmax, and (b) anisotropy, A.
Processes 12 01536 g010
Figure 11. Analysis of the cross-section (CD × ZD) structure of the suspension flow at the draining phase of the forming section of the paper machine PM-B for the considered positions in the CD: (a) effective shear in the MD; (b) turbulence (CD).
Processes 12 01536 g011
Table 1. Results obtained for the orientation angle (θmax) and for anisotropy (A) using the SIA methodology for the overall paper sheet and for the two halves, bottom (BH) and top (TH), for the 3 samples produced using the paper machine PM-A. The values calculated for the properties of the mean ( x ¯ ) and of the sample standard deviation ( s ) are also shown.
ReferenceOrientation Angle, θmax (°)Anisotropy, A
BHTHOverallBHTHOverall
DT1−0.76−1.28−1.022.042.082.06
DT20.16−0.24−0.031.961.881.92
DT3−0.030.00−0.021.922.011.96
x ¯ −0.21−0.51−0.361.971.991.98
s 0.480.680.580.060.100.07
Table 2. Results obtained for the study to analyze the repeatability of the hot bend method. The values of the mean ( x ¯ ) and of the sample standard deviation ( s ) for the measurements of the curl magnitude are shown for each test.
Type of TestsDirectionCurl Magnitude (10−1 m−1)
TSBSTS − BS
x ¯ s x ¯ s x ¯ s
MD/CDMD13.81.413.32.60.42.9
CD34.25.620.42.913.86.3
Diagonal 1LD5.413.28.811.9−3.314.6
RD12.57.77.511.25.013.9
1 The results for the diagonal tests are not reliable.
Table 3. Values of the orientation angle (θmax) and of the anisotropy (A), obtained using the SIA methodology for the two halves and for the entire (global) sheet and using the TSO technique for the complete (global) sheet. The analyzed samples were produced using the paper machine PM-B at different CD positions.
PropertyPosition in CDSIATSO
BHTH|TH − BH|Global
θmax (°)P10.433.142.711.13−0.62
P28.0114.396.389.523.59
P3−1.410.822.23−0.72−0.54
P4−6.62−10.634.01−7.67−3.20
AP11.671.290.391.502.77
P21.671.170.501.392.31
P31.581.220.361.392.29
P41.691.200.491.422.35
Table 4. Results obtained for the curl magnitude with the hot bend method to analyze samples produced using the paper machine PM-B at different positions in the CD.
Type of TestsDirectionSideCurl Magnitude (10−1 m−1)
P1P2P3P4
MD/CDMDTS13.818.813.816.3
BS−13.8−12.5−12.5−13.8
TS − BS27.531.326.330.0
CDTS−25.0−57.5−27.5−45.0
BS50.028.837.547.5
TS − BS−75.0−86.3−65.0−92.5
Diagonal 1LDTS12.5−10.05.05.0
BS18.811.35.011.3
TS − BS−6.3−21.30.0−6.3
RDTS−3.811.31.3−1.3
BS22.512.521.321.3
TS − BS−26.3−1.3−20.0−22.5
1 The results for the diagonal tests are not reliable.
Disclaimer/Publisher’s Note: The statements, opinions and data contained in all publications are solely those of the individual author(s) and contributor(s) and not of MDPI and/or the editor(s). MDPI and/or the editor(s) disclaim responsibility for any injury to people or property resulting from any ideas, methods, instructions or products referred to in the content.