Article

Fracture Propagation of Multi-Stage Radial Wellbore Fracturing in Tight Sandstone Reservoir

1
National Key Laboratory of Petroleum Resources and Engineering, China University of Petroleum (Beijing), Beijing 102249, China
2
Beijing Petroleum Machinery Company Limited, Beijing 102206, China
3
Key Laboratory of Shale Gas Exploration, Ministry of Natural Resources, Chongqing 401120, China
4
National and Local Joint Engineering Research Center of Shale Gas Exploration and Development, Chongqing 401120, China
*
Author to whom correspondence should be addressed.
Processes 2024, 12(7), 1539; https://doi.org/10.3390/pr12071539
Submission received: 27 June 2024 / Revised: 17 July 2024 / Accepted: 20 July 2024 / Published: 22 July 2024
(This article belongs to the Section Energy Systems)

Abstract

:
Radial wellbore fracturing is a promising technology for stimulating tight sandstone reservoirs. However, simultaneous fracturing of multiple radial wellbores often leads to unsuccessful treatments. This paper proposes a novel technology called multi-stage radial wellbore fracturing (MRWF) to address this challenge. A numerical model based on the finite element/meshfree method is established to investigate the effects of various parameters on the fracture propagation of MRWF, including the azimuth of the radial wellbore, the horizontal stress difference, and the rock matrix permeability. The results show that previously created fractures have an attraction for subsequently created fractures, significantly influencing fracture propagation. A conceptual model is proposed to explain the variations in the fracture propagation of MRWF, highlighting three critical effect factors: the attraction effect, the orientation effect of the radial wellbore, and the deflection effect of the maximum horizontal principal stress. Fracture geometry is quantitatively assessed through the deviation distance, which indicates the radial wellbore’s ability to guide fracture propagation along its axis. As the azimuth increases, the deviation distances can either increase or decrease, depending on the specific radial wellbore layouts. Decreasing the horizontal stress difference and increasing the rock matrix permeability both increase the deviation distance.

1. Introduction

Tight sandstone reservoirs have emerged as a primary source of energy globally. The widely employed technique for extracting these resources is hydraulic fracturing with long horizontal wells. Despite the advantages associated with this method, concerns have been raised regarding the substantial costs of expansive hydraulic fracturing operations and the potential for insufficient stimulation leading to diminished output. Radial wellbore fracturing (RWF) (which has emerged as an advanced technique) combines radial wellbores and hydraulic fracturing, which entails initially drilling several lateral wellbores along the vertical well and subsequently fracturing these wellbores to establish a complex fracture network in the reservoir [1,2,3]. RWF can enhance communication between the wellbore and the reservoir and augment the production of low-permeability oil or gas reservoirs. Several countries have successfully applied RWF to the oil and gas fields, demonstrating its excellent stimulation effects [4,5,6,7]. Consequently, RWF is anticipated to become a crucial technique for extracting tight sandstone reservoirs.
Fracture propagation of RWF has been widely investigated through laboratory experiments. Abass et al. [8] proposed a directional fracturing method that utilizes waterjet radial drilling in a horizontal well. This method has proven effective in generating transverse fractures that remain unaffected by the orientation effect of the well. Fu et al. [9] carried out laboratory experiments of RWF on coal, revealing that a complex fracture network can be generated when radial wellbores intersect bedding. Furthermore, when the fracture initiates from the bedding, a primary horizontal fracture that connects multiple vertical fractures is formed. Lu et al. [10] also implemented experiments of RWF on coal, demonstrating that radial wellbores can induce fractures to initiate and propagate along their axes, and increasing radial wellbore branches elevates the complexity of the fracture network, a finding corroborated by the work of Liu et al. [11]. In addition, Yan et al. [12] noted that, with an increase in azimuth, the complexity of fractures also escalates. Guo et al. [13,14] performed experiments on artificial rock samples, conducting a comprehensive analysis of factors such as horizontal stress differences, radial wellbore parameters, fracturing fluid properties, rock properties, and reservoir permeabilities. Guo et al. [15,16] investigated fracture propagation of multi-layer and multi-branch RWF, identifying an extrusion effect that exists between adjacent radial wellbores.
Numerical simulation has been widely utilized to validate experimental findings [17]. Numerous researchers have investigated the influence of multiple factors on the fracture propagation of RWF, mostly by the extended finite element method [14,18,19,20]. The finite element/meshfree method is also employed for the simulation of fracture propagation of RWF [21]. The numerical results obtained align with conclusions drawn from radial wellbore fracturing experiments, providing valuable insights for planning fracturing parameters.
Previous research on RWF has primarily focused on synchronous fracturing, where fracturing fluid is injected into all radial wellbores simultaneously to create fractures alongside each wellbore. This approach suffers from the stress shadow effect, where closely spaced fractures impede the initiation of some fractures, leading to unsuccessful fracturing in some wellbores [22]. Consequently, a new method called multi-stage radial wellbore fracturing (MRWF) is proposed, like the sequential fracturing of horizontal wells. MRWF addresses the limitations of synchronous fracturing by injecting fracturing fluid in stages, starting with one row of radial wellbores before moving on to the next, as shown in Figure 1. This stepwise approach minimizes fracture interference and allows for the creation of multi-stage hydraulic fractures that connect various target areas in the reservoir, ultimately enhancing stimulation. While studies have investigated fracture interaction in horizontal well fracturing, research on multi-stage fracture interactions in MRWF is currently lacking.
In this paper, a three-dimensional (3D) numerical model is established to investigate fracture propagation of, and interaction in, MRWF. This model is based on the finite element/meshfree method (FEMM) and incorporates streaming coupling. Through this model, a series of sensitivity studies have been conducted to investigate the influences of key parameters on fracture propagation, including the azimuth of the radial wellbore, the horizontal stress difference, and the rock matrix permeability. This research provides a valuable foundation for optimizing hydraulic fracturing design in MRWF, ultimately improving the effectiveness of tight sandstone reservoir stimulation.

2. Model Establishment of Multi-Stage Radial Wellbore Fracturing

This section details the development of the 3D fracture propagation model for MRWF using FEMM. The model incorporates fluid–solid coupling interactions and is solved through the TOUGH3-AIFRAC simulator. In addition, we make certain assumptions as follows:
(1)
The reservoir rock is considered an isotropic material.
(2)
Fracture propagation is treated as a quasi-static process.
(3)
The radial wellbores are substituted with weakened material.
(4)
Fracturing fluid is injected at a constant pressure, permitting its permeation from the boreholes into the rock matrix.

2.1. Governing Equations

2.1.1. Solid Phase

The strong form of governing equations for a 3D solid body Ω under quasi-static loading, subjected to an applied traction on the external boundary Γ h , can be expressed as [23]:
× σ + ρ b = 0 σ × V = h i n   Ω o n   Γ h
The surface energy of the fracture can be expressed as:
G s = Γ s p × w d Γ
The weak form of governing equation according to the principle of virtual work can be expressed as [23]:
Ω δ ε × σ d Ω = Ω δ u × b d Ω + Γ h δ u × t d Γ + Γ s p × w d Γ

2.1.2. Fluid Phase

The general form of the equation of mass balance for fluid flow is:
d d t V n M κ d V n = Γ n F κ · n d Γ n + V n q κ d V n
Volume mass per unit is:
M κ = ϕ β S β ρ β X β κ + 1 ϕ ρ R ρ l X l κ K d
The mass flow of κ is composed of the convective flow and the diffusion flow. The convective flow is:
F κ | a d v = β X β κ F β
The flow rate of the liquid phase refers to the multi-phase formula of Darcy’s law, which is:
F β = ρ β u β = k k r β ρ β μ β P β ρ β g
The diffusion flow is:
f β κ = ϕ τ 0 τ β ρ β d β κ X β κ

2.1.3. Criterion of Fracture Propagation

Fracture propagation occurs in two steps. Initially, the direction of fracture propagation is determined, utilizing the criterion of maximum circumferential stress with the calculation formula [23]:
K Ι sin θ 0 + K Ι Ι 3 cos θ 0 1 = 0
The calculation formulas of stress intensity factors are:
K Ι = 2 π r m μ κ + 1 Δ v
K Ι Ι = 2 π r m μ κ + 1 Δ u
where μ = E / 2 1 + ν .
Equation (9) can be transferred to the simplified form as:
tan θ 0 2 = 1 4 K Ι K Ι Ι sgn K Ι Ι K Ι K Ι Ι 2 + 8 , π θ 0 π
Once the direction of fracture propagation is determined, the maximum stress criterion is employed to judge whether the series of points in this direction meet the fracture propagation conditions, as follows:
σ max σ t

2.2. Model Parameters

2.2.1. Layout of Radial Wellbores

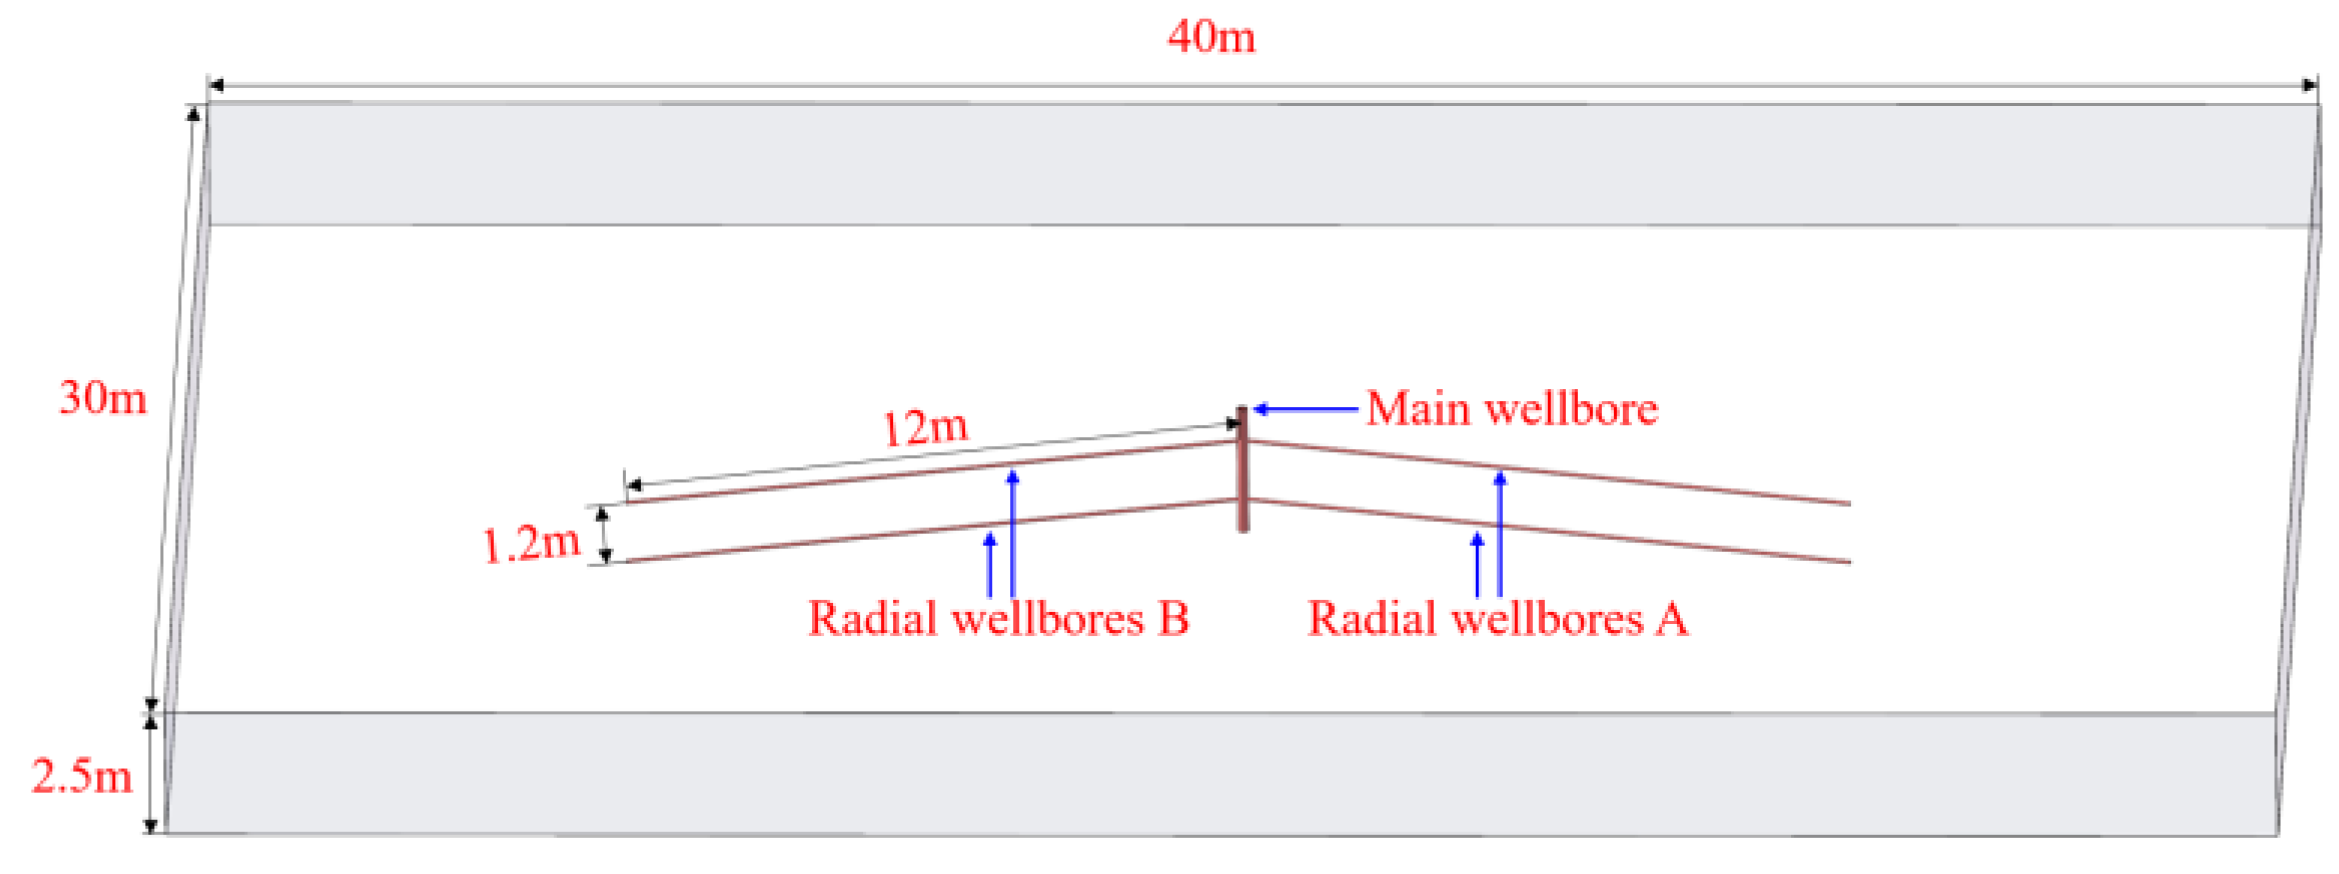
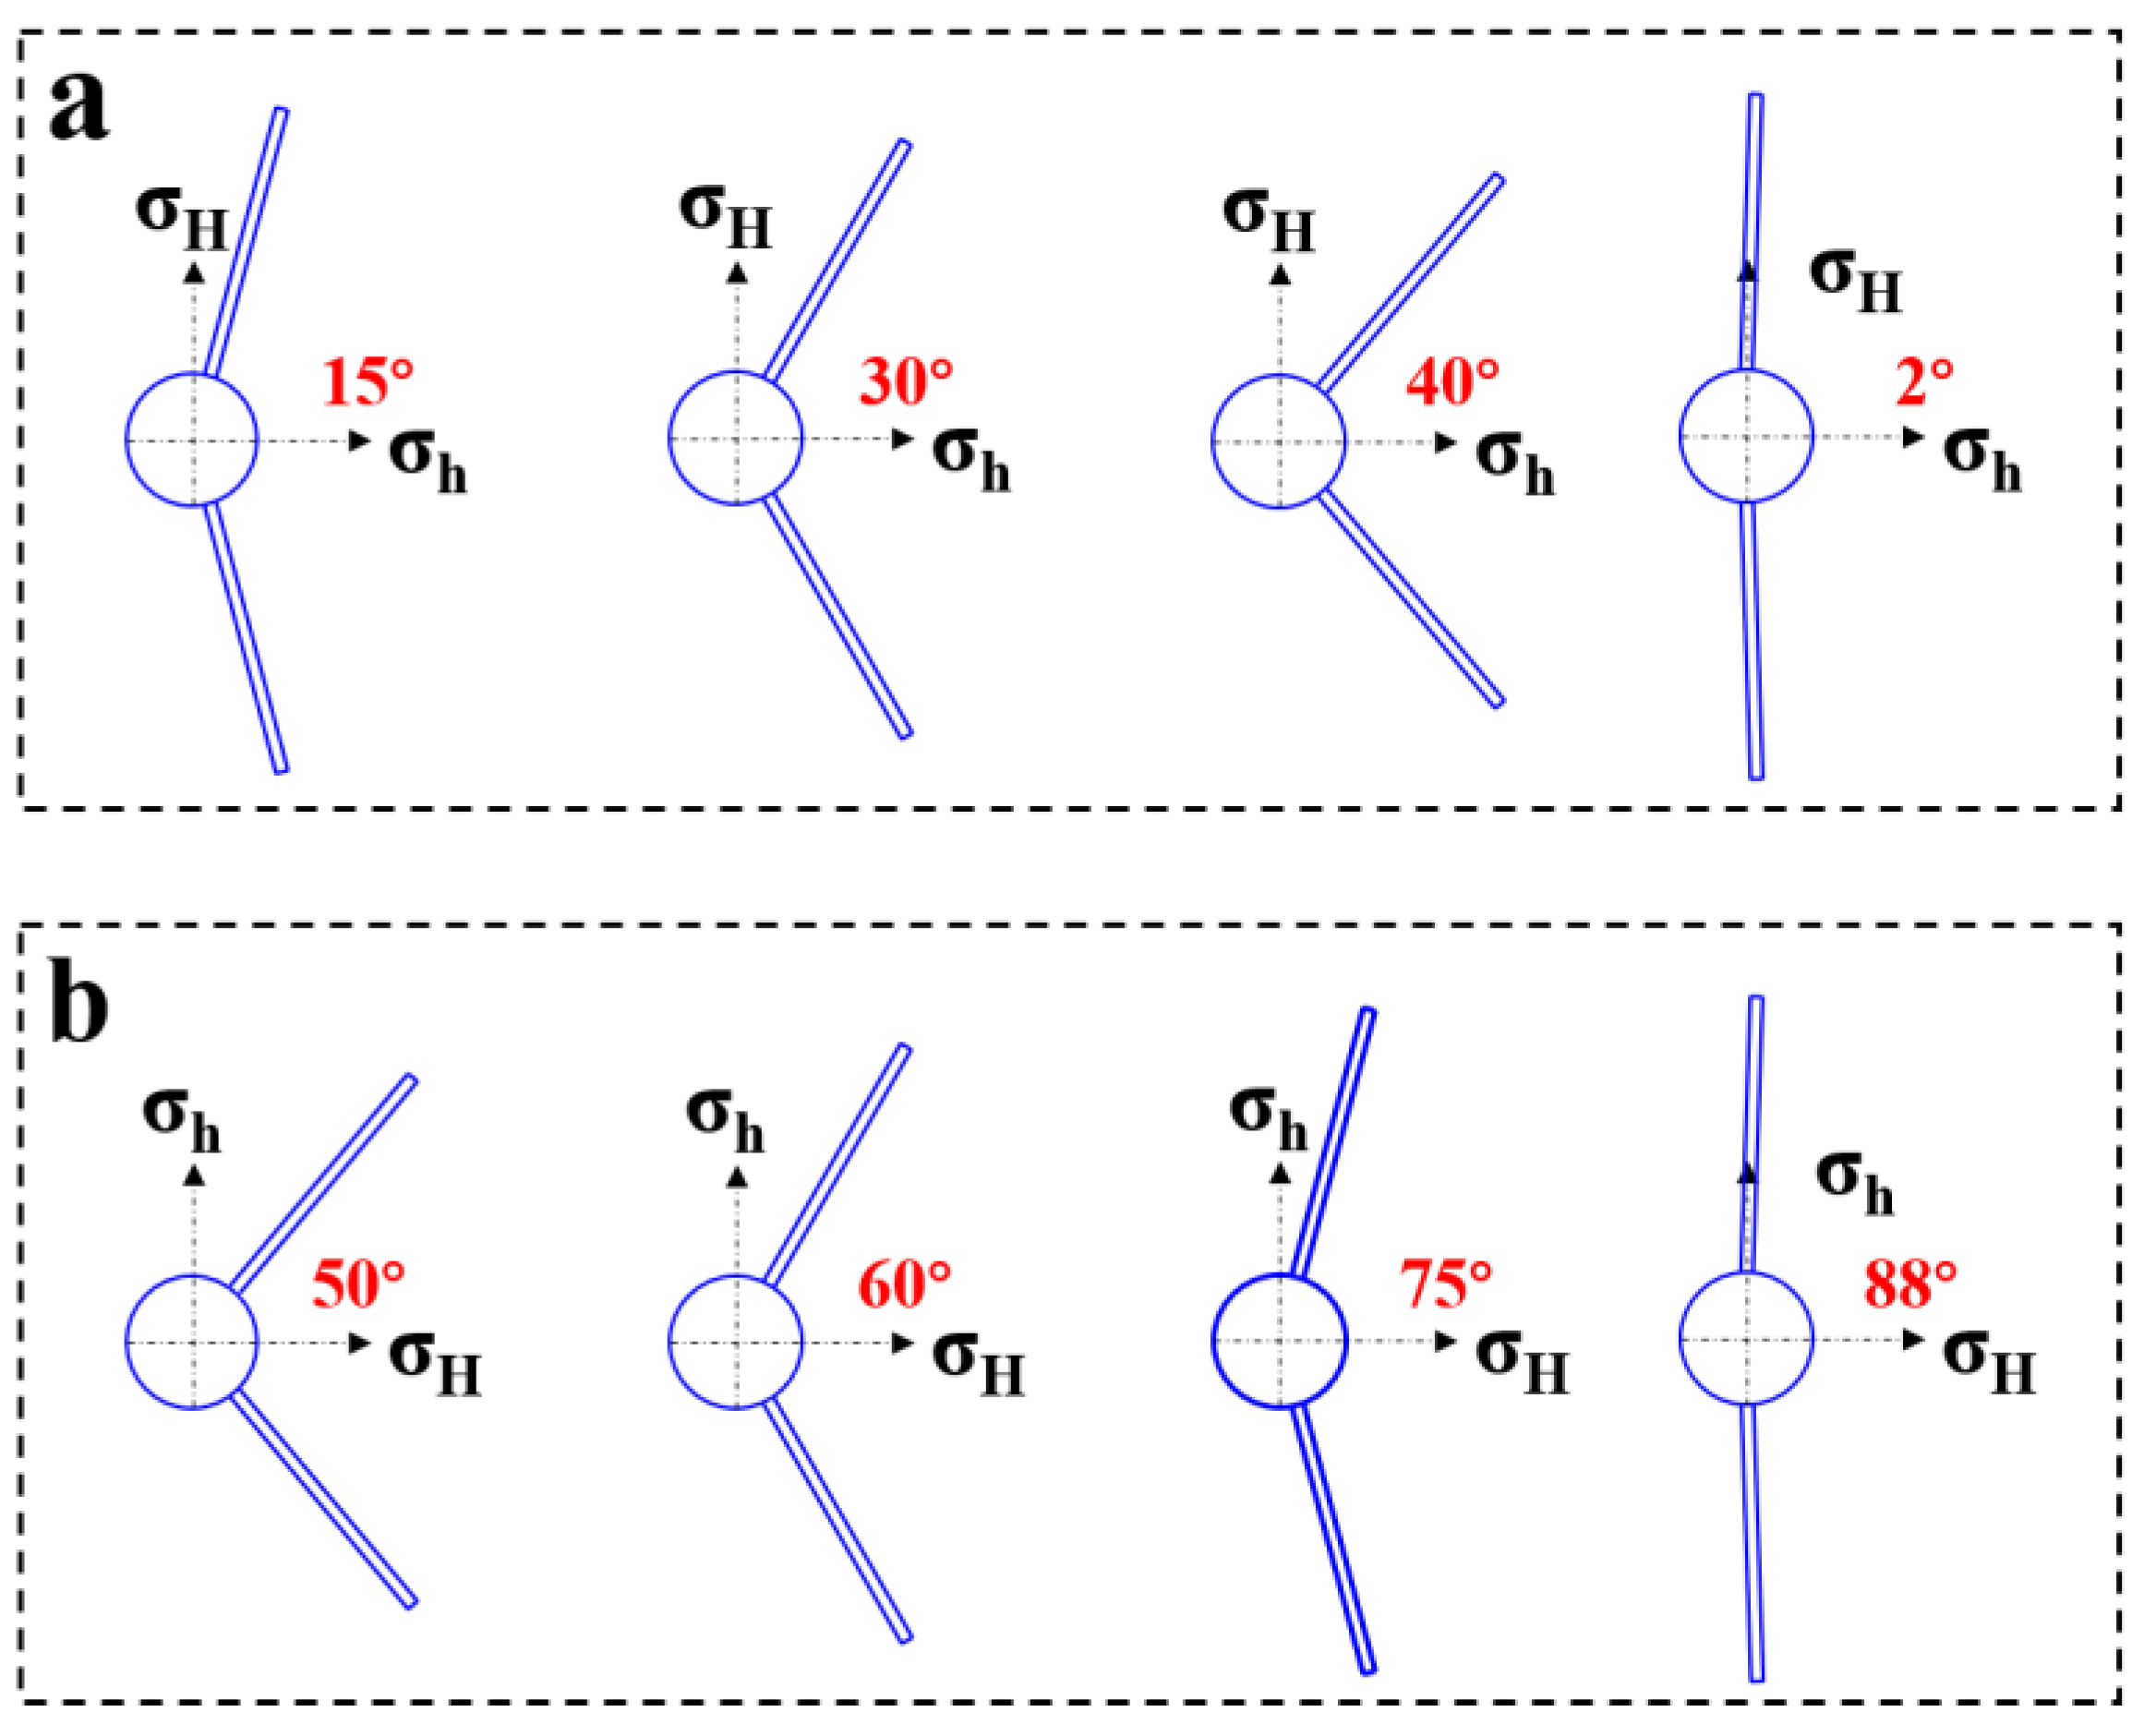
The crucial effect of MRWF on fracture propagation is the interaction between subsequently created fractures and those formed in preceding stages. To delve deeper into this phenomenon and streamline our research, two stages of RWF are simulated. Figure 2 shows the schematic of the MRWF simulation model. The reservoir is represented as a square with the dimension of 40 m × 30 m × 2.5 m. Radial wellbores branch out radially from the main wellbore. The diameter of the main wellbore is 0.19 m. Radial wellbores, each 0.05 m in diameter and 12 m long, are symmetrical arranged in two layers with a vertical spacing of 1.2 m. The radial wellbores fractured in stage-1 and stage-2 are denoted as radial wellbores A and B, respectively. Two distinct radial wellbore layouts are considered, where radial wellbores are symmetrically distributed along the direction of minimum horizontal stress (Dmin) and the direction of maximum horizontal stress (Dmax). Each layout is further investigated through four azimuth combinations, as depicted in Figure 3. It is important to note that, due to the challenges of mesh generation, the azimuths are set to 2° and 88° instead of 0° and 90°. This minor deviation does not affect the validity of our analysis.

2.2.2. Geometric Parameters

Simulations were conducted using formation parameters derived from studies on tight sandstone reservoirs in the Ordos Basin [24,25,26,27], as detailed in Table 1. To overcome mesh quality issues associated with open holes in radial wellbores, these boreholes were replaced with weakened materials [21]. The parameters of the weakened materials are also listed in Table 1.

2.3. Modeling Procedures

The two stages of MRWF generate fractures corresponding to stage-1 and stage-2 fractures. Furthermore, simulating fracture propagation with AIFRAC necessitates the presetting of an initial fracture in the model. In a normal fault stress state, RWF typically generates vertical fractures initiated from the heel of the radial wellbore [20]. Consequently, initial fractures that are perpendicular across the heel of radial wellbores are preset. The procedures for simulating MRWF are as follows:
(1)
Nodes of the preset fracture in radial wellbores B are fixed to prevent further expansion. Stage-1 fracture, initiated from radial wellbores A, propagates driven by fracturing fluid.
(2)
Once stage-1 fracture ceases propagating, the coordinates of mesh nodes, pore pressure data, and coordinates of the fracture geometry are extracted.
(3)
Nodes of stage-1 fracture are then fixed to prevent further expansion, and nodes of the preset fracture in radial wellbores B are released.
(4)
Mesh node coordinates and pore pressure data extracted in step 2 are utilized as the model node coordinates and initial pore pressure for the second stage of MRWF.
(5)
Stage-2 fracture propagates driven by fracturing fluid.

2.4. Mesh Sensitivity

To ensure accurate and efficient simulations, a mesh sensitivity test is conducted with three mesh densities: 0.2 m, 0.3 m, and 0.4 m. The impact of mesh density on the simulation results of MRWF is assessed by comparing two-dimensional (2D) fracture geometries plotted according to the data extracted from the results of three-dimensional fractures. Figure 4 illustrates the results for both stage-1 (above the lines of Dmin and Dmax) and stage-2 (below) fractures at two different azimuths (30° and 60°). When the azimuth is 30°, the stage-1 fracture geometries for all three mesh densities are highly similar, with the 0.3 m and 0.4 m cases nearly overlapping. (Figure 4a). Stage-2 fracture geometries also exhibit excellent consistency between the mesh densities of 0.3 m and 0.4 m. When the azimuth is 60°, similar results are observed for stage-1 fractures, with mesh densities of 0.2 m and 0.3 m (Figure 4b). Therefore, the fundamental mesh density of 0.3 m is considered optimal for the numerical simulation of fracture propagation of MRWF.
To further optimize computational efficiency while maintaining accuracy, a hybrid meshing approach is employed. The mesh densification region, a zone parallel and perpendicular to the radial wellbore axis, is defined, with a base density of 0.3 m. Outside this region, the horizontal mesh density varies between 0.3 m and 1.0 m, while the vertical mesh density is 0.05 m where the radial wellbores reside and 0.3 m elsewhere.

2.5. Model Validation

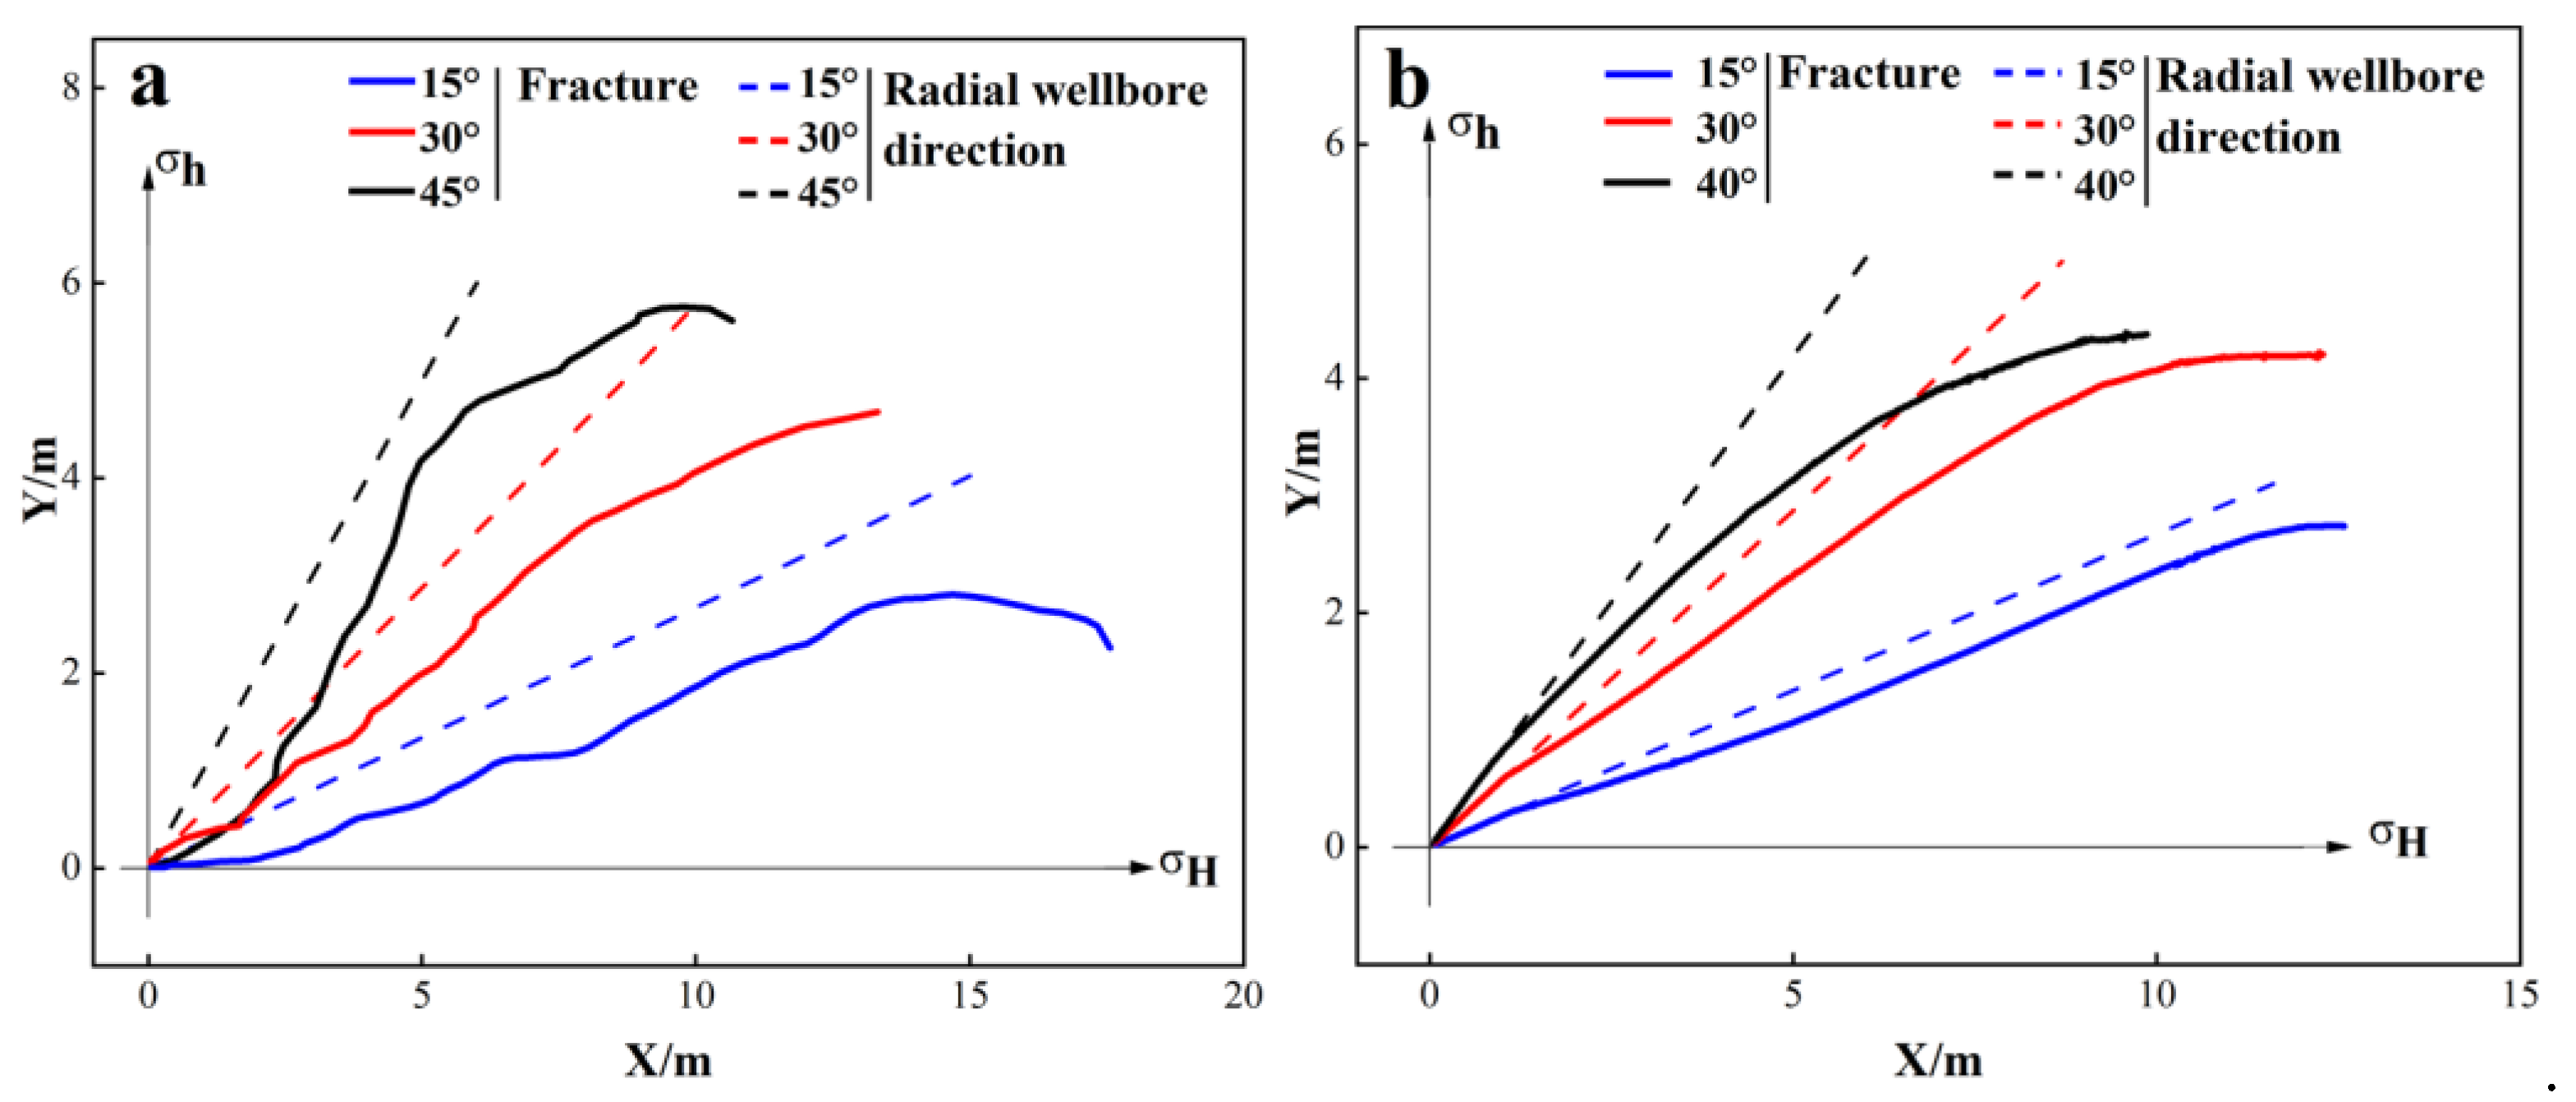
The FEMM method employed in this study has a strong foundation in simulating fracture propagation, as evidenced by thorough theoretical verification [23]. Building on this method, we have established a fracture propagation model for RWF and explored synchronous fracturing scenarios [21]. The model presented here further refines our previous work to address the specific needs of this research and has undergone rigorous validation to ensure its accuracy. To further validate the accuracy of the model, we simulated RWF in a single row (radial wellbores A). Figure 5 displays the resulting fracture geometries of RWF with varying azimuths. These observations align perfectly with findings from previous numerical and laboratory studies [13,19], providing strong validation for the model’s accuracy.

3. Results and Discussion

To analyze the fracture propagation of MRWF, we conducted a series of sensitivity analyses to examine various effects, including the azimuth of the radial wellbore (2, 15, 30, 40, 50, 60, 75, 88°), the horizontal stress difference (0, 2, 5, 10 MPa), and the rock matrix permeability (0.005, 0.05, 0.5 mD).

3.1. Deviation Distance

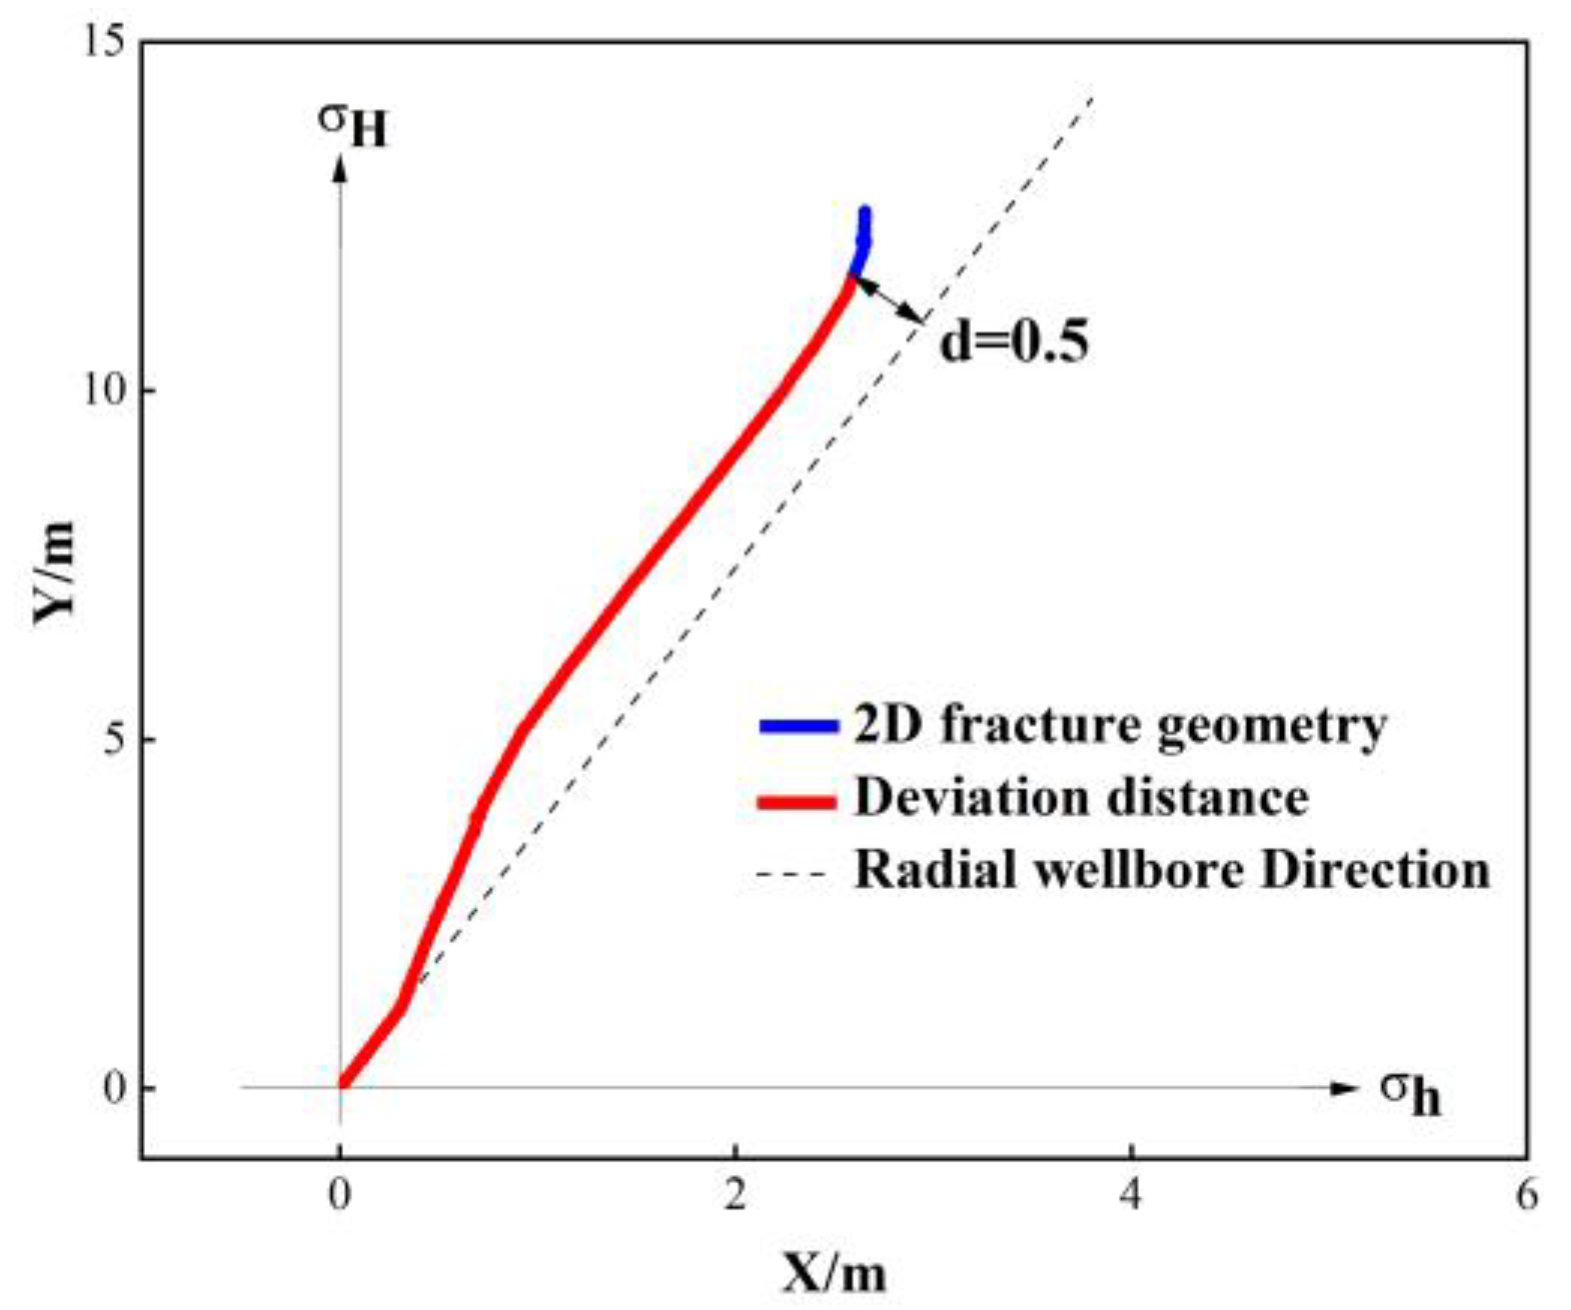
Upon solving the model, the stress, strain, and pore pressure of each model point and the 3D fracture geometry are obtained, as shown in Figure 6. For better analysis, 2D fracture geometries, drawn by the 2D fracture data extracted from the 3D fracture, are described, as shown in Figure 7.
Given that fractures of RWF initially propagate parallel to the radial wellbore axis and then curve in the direction of the maximum horizontal stress, the parallel section of the fracture is indicative of the guiding ability of the radial wellbore. The deviation distance, which represents the fracture length from the main well to the point where the fracture first deviates from the radial wellbore axis by more than 0.5 m, is defined to quantitatively assess the guiding ability [21], as shown in Figure 7. The deviation distances are calculated by importing the 2D fracture data into a MATLAB program.

3.2. Attraction Effect and Conceptual Model

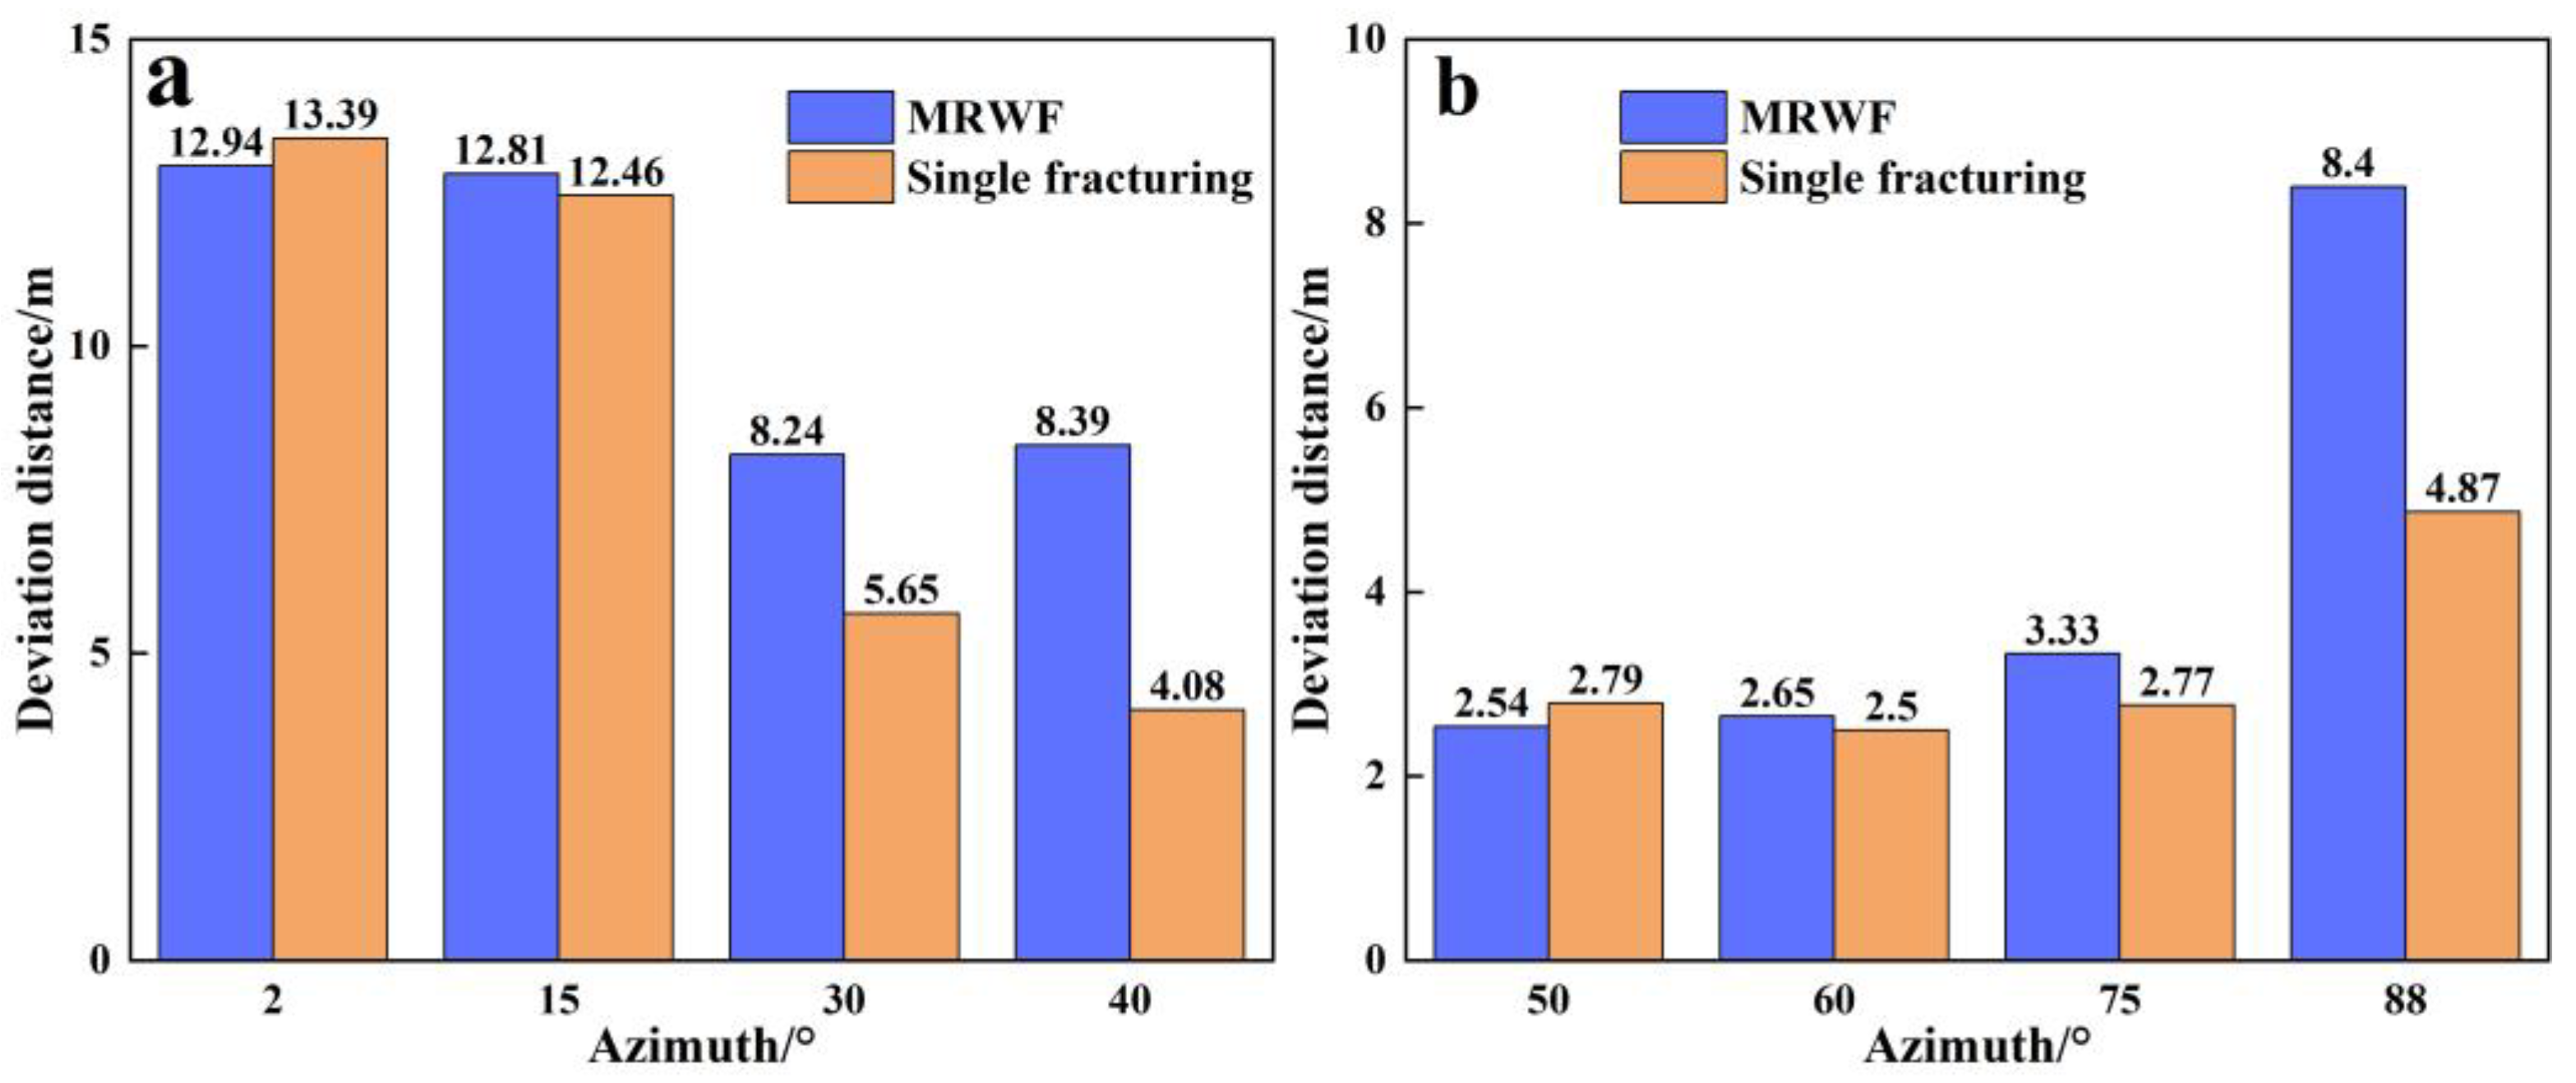
Figure 8 and Figure 9 present comparisons of fracture geometries and deviation distances between MRWF and single radial wellbore fracturing (briefly single fracturing), respectively. In Figure 8, stage-1 fractures are depicted above the lines of Dmin and Dmax, while stage-2 fractures are below these lines. Single fracturing refers to the scenario where only a single row of radial wellbores is fractured, generating a single vertical fracture, as shown in Figure 10. To facilitate a comparison with the fracture geometries of two-stage RWF, numerical simulations of single fracturing are performed on two sets of radial wellbores.
Figure 8a represents the results with radial wellbores symmetrically distributed along Dmin. When the azimuth is 2°, fracture geometries of MRWF mostly coincide with those of single fracturing. As the azimuth increases to 15°, 30°, and 40°, geometries of stage-1 fractures are similar to fracture geometries of single fracturing, while stage-2 fractures propagate closer to the line of Dmin. As shown in Figure 9a, for azimuths of 15°, 30°, and 40°, the deviation distances of MRWF are higher than those of single fracturing, with the difference being more prominent for larger azimuths. Figure 8b shows the results with radial wellbores symmetrically distributed along Dmax. For four azimuths, stage-1 fractures tend to be closer to the line of Dmax. When the azimuths are 50° and 60°, stage-2 fractures exhibit a more rapid deviation from their initial direction. Moreover, the fracture crosses the line of Dmax with the azimuth of 50°. When the azimuths are 75° and 88°, the fractures of single fracturing deviate from the initial direction more quickly. With three different azimuths, except for 50°, the deviation distances of MRWF are larger than those of single fracturing, as shown in Figure 9b.
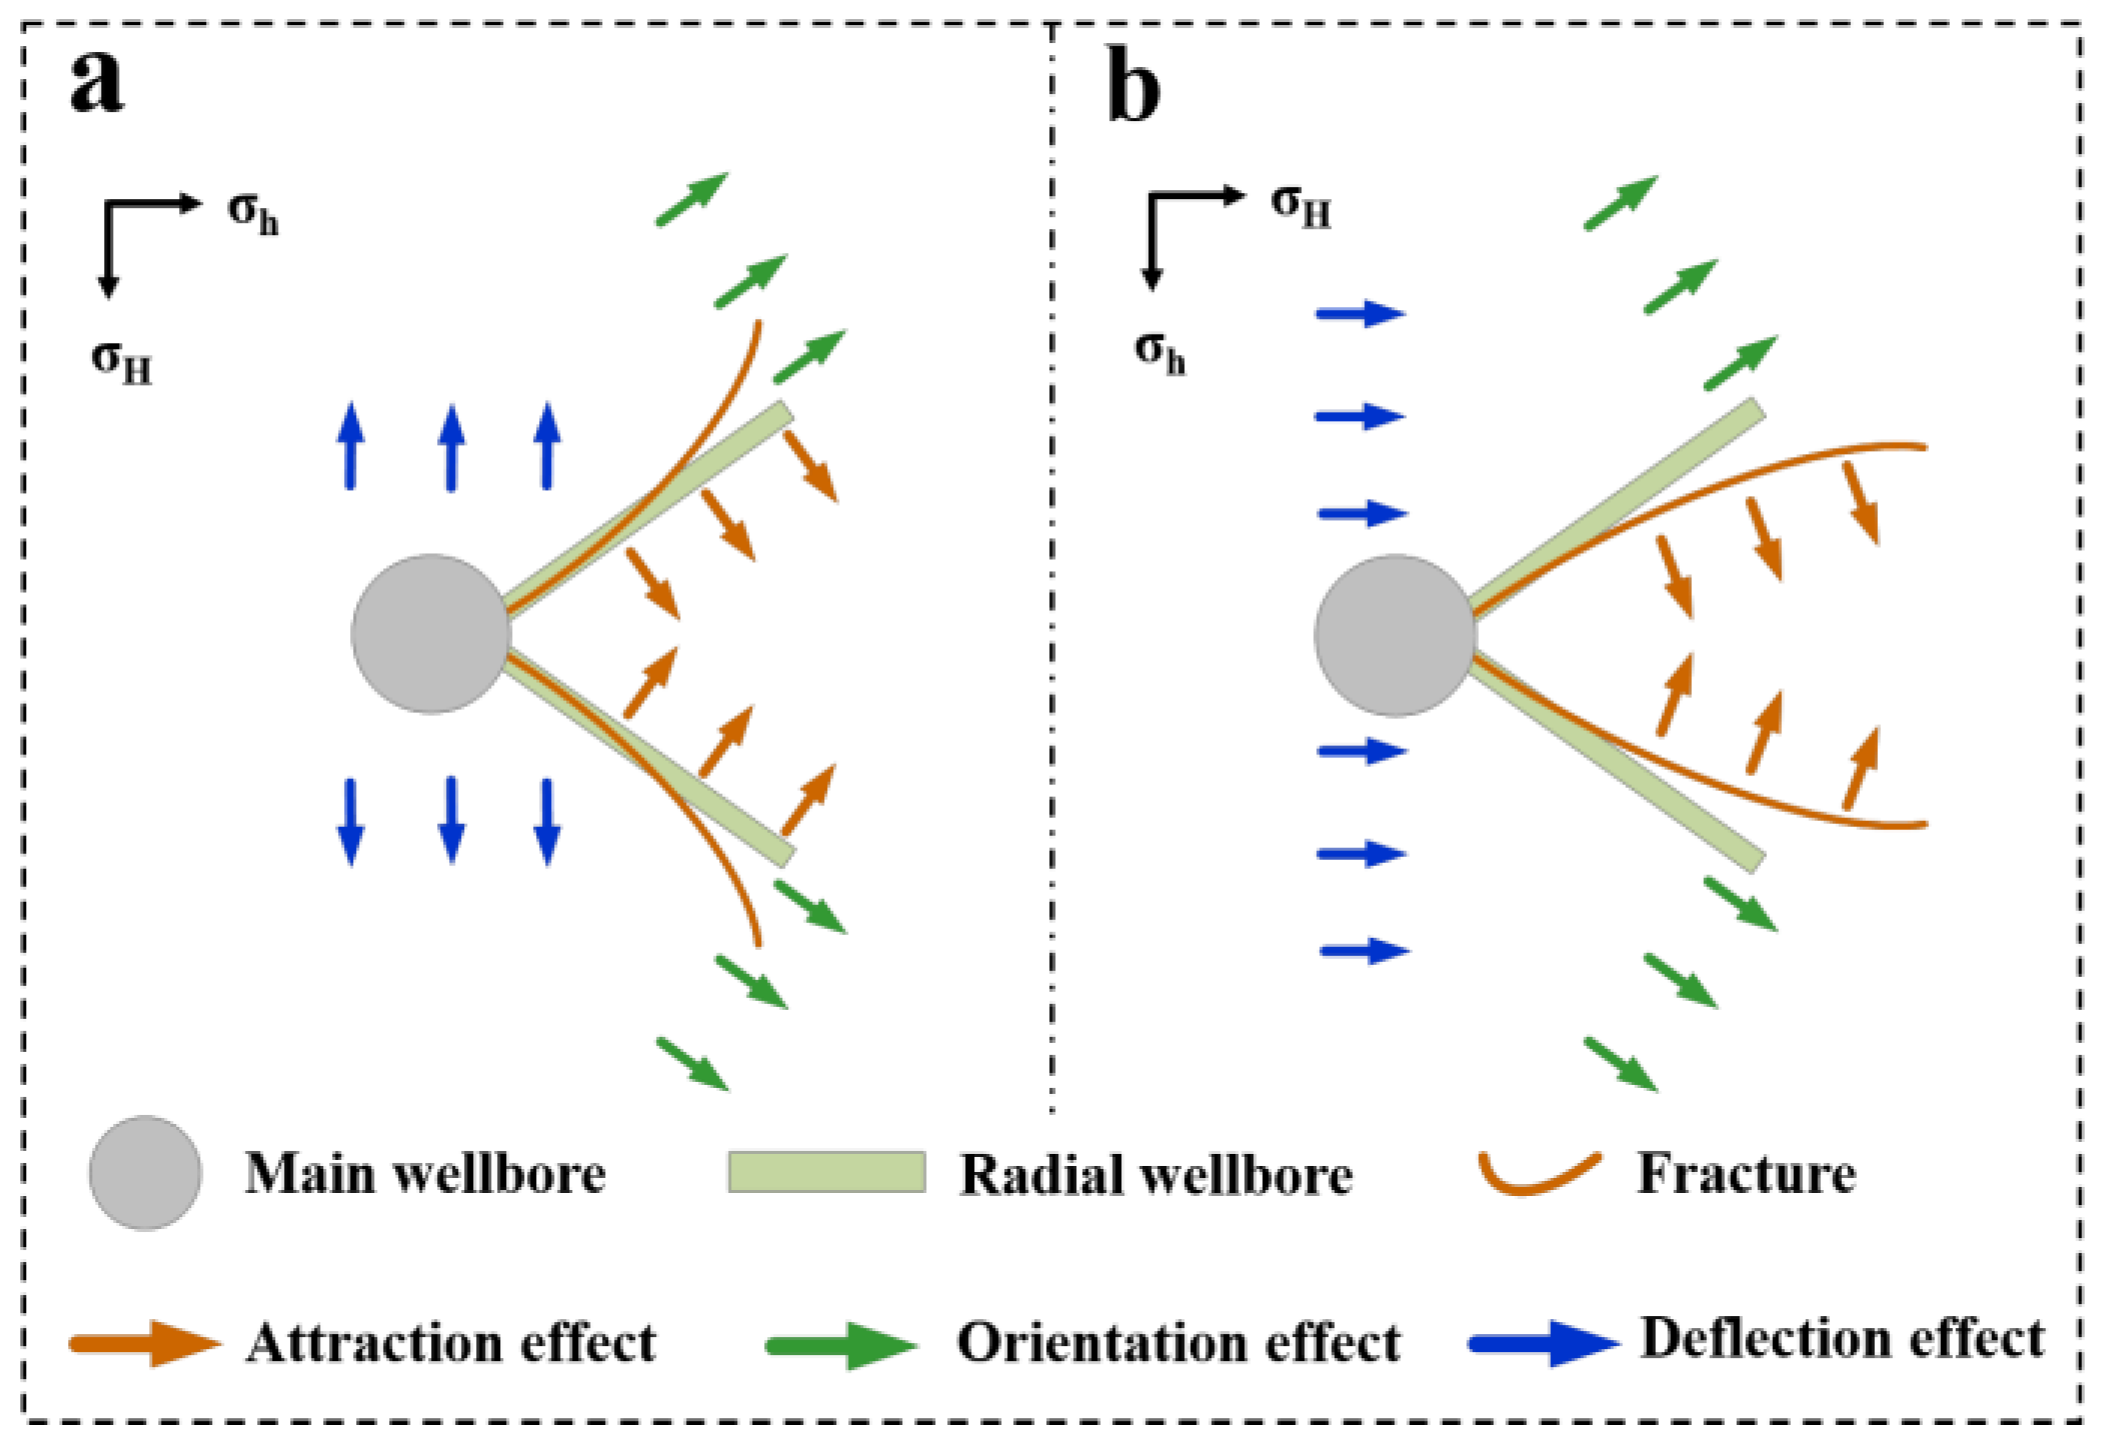
Compared with the fractures generated by single fracturing, when the azimuths vary from 15° to 88°, stage-1 fractures are closer to the symmetry axis of radial wellbores in the same layer (briefly, symmetry axis). When the azimuths vary from 15° to 60°, stage-2 fractures are closer to the symmetry axis. The reason for this phenomenon is that when multi-stage fracturing of two rows of radial wellbores occurs, the expanding fractures are attracted by other radial wellbores or previously created fractures, which causes the expanding fractures to close to the symmetry axis. When the azimuths are 75° and 88°, stage-2 fractures slowly turn to Dmax; because, for 75° and 88° azimuths, stage-1 fractures are relatively farther from radial wellbores B, resulting in less influence on stage-2 fractures. Moreover, as shown in Figure 11, the pore pressure around radial wellbores B increases after the first-stage fracturing, further enhancing the guiding ability of the radial wellbores. The inference of attraction effect in MRBF is reasonable, because the same fracture interaction occurs in the fracture propagation of multi-stage horizontal well fracturing. The attraction between multi-fractures has been discovered by experiments [28], and it has been explained by numerical simulation that this phenomenon is caused by stress variation between multi-fractures [29].
Based on the analysis above, when radial wellbores are symmetrically distributed along Dmin, the two fractures generated in MRWF tend to attract each other, which is conducive to increasing the deviation distances. Similarly, when radial wellbores are symmetrically distributed along Dmax, the two fractures generated also tend to attract each other. For relatively small azimuths, stage-2 fractures are easily attracted by stage-1 fractures and propagate closer to them. For relatively large azimuths, the influence of stage-2 fractures decreases, which helps to increase the deviation distance of stage-2 fracture.
A conceptual model is then proposed to explain the variations in fracture propagation of MRWF. This model identifies that fracture propagation of MRWF is controlled by three key factors, corresponding to the attraction effect, the orientation effect, and the deflection effect, as shown in Figure 12. The attraction effect arises from the presence of other radial wellbores or existing fractures, as discussed earlier. The orientation effect represents the guiding ability of radial wellbores [30], where fractures propagate along the radial wellbore axes. The deflection effect represents the impact of in situ stress on fracture propagation [31], where fractures propagate approximately parallel to the axis of Dmax.

3.3. Effect of the Azimuth

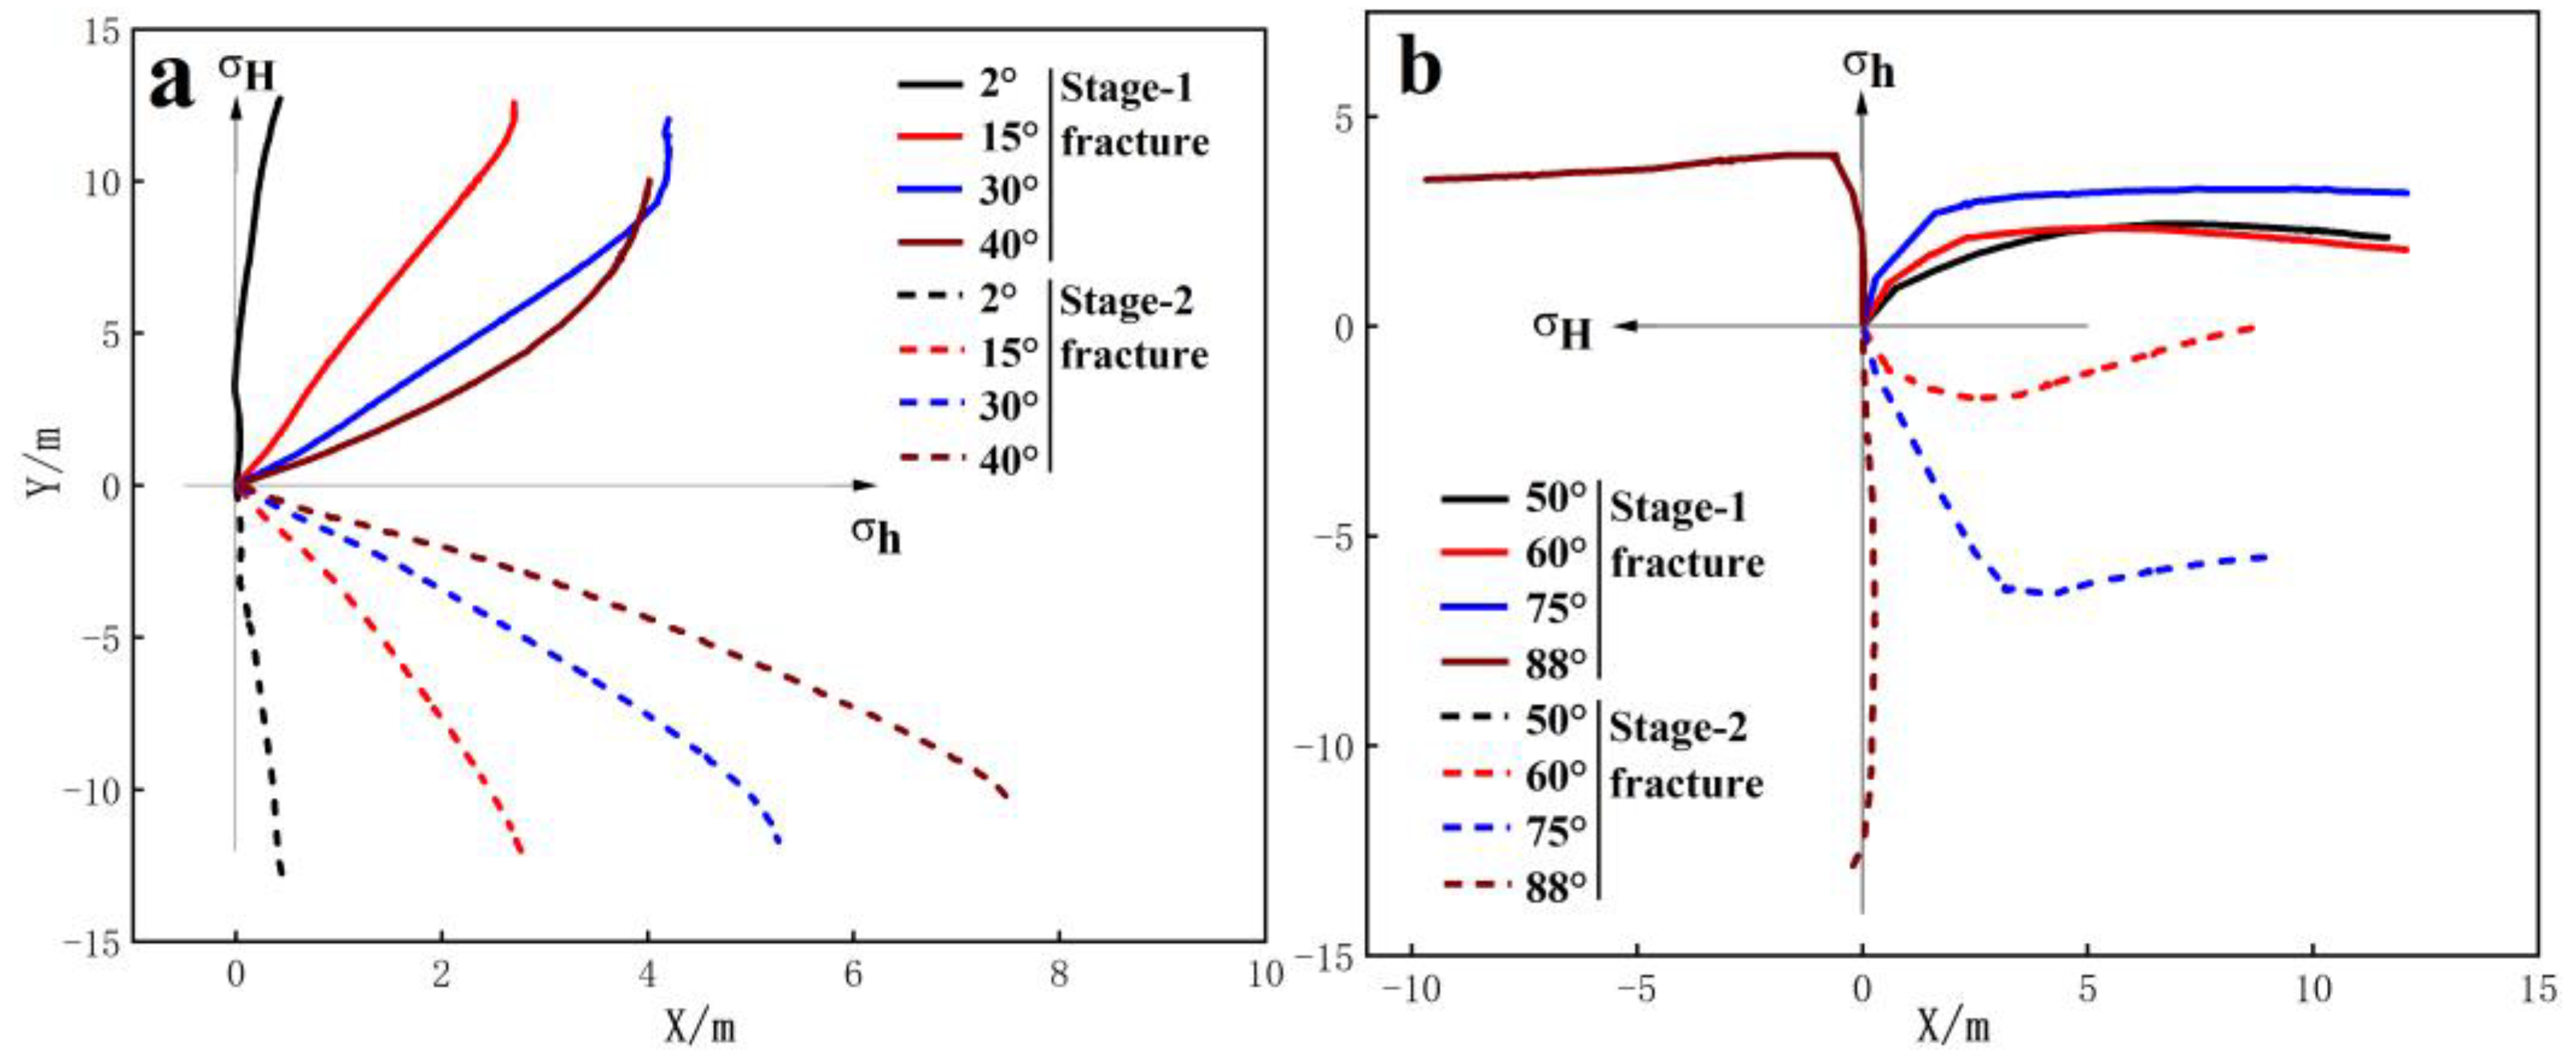
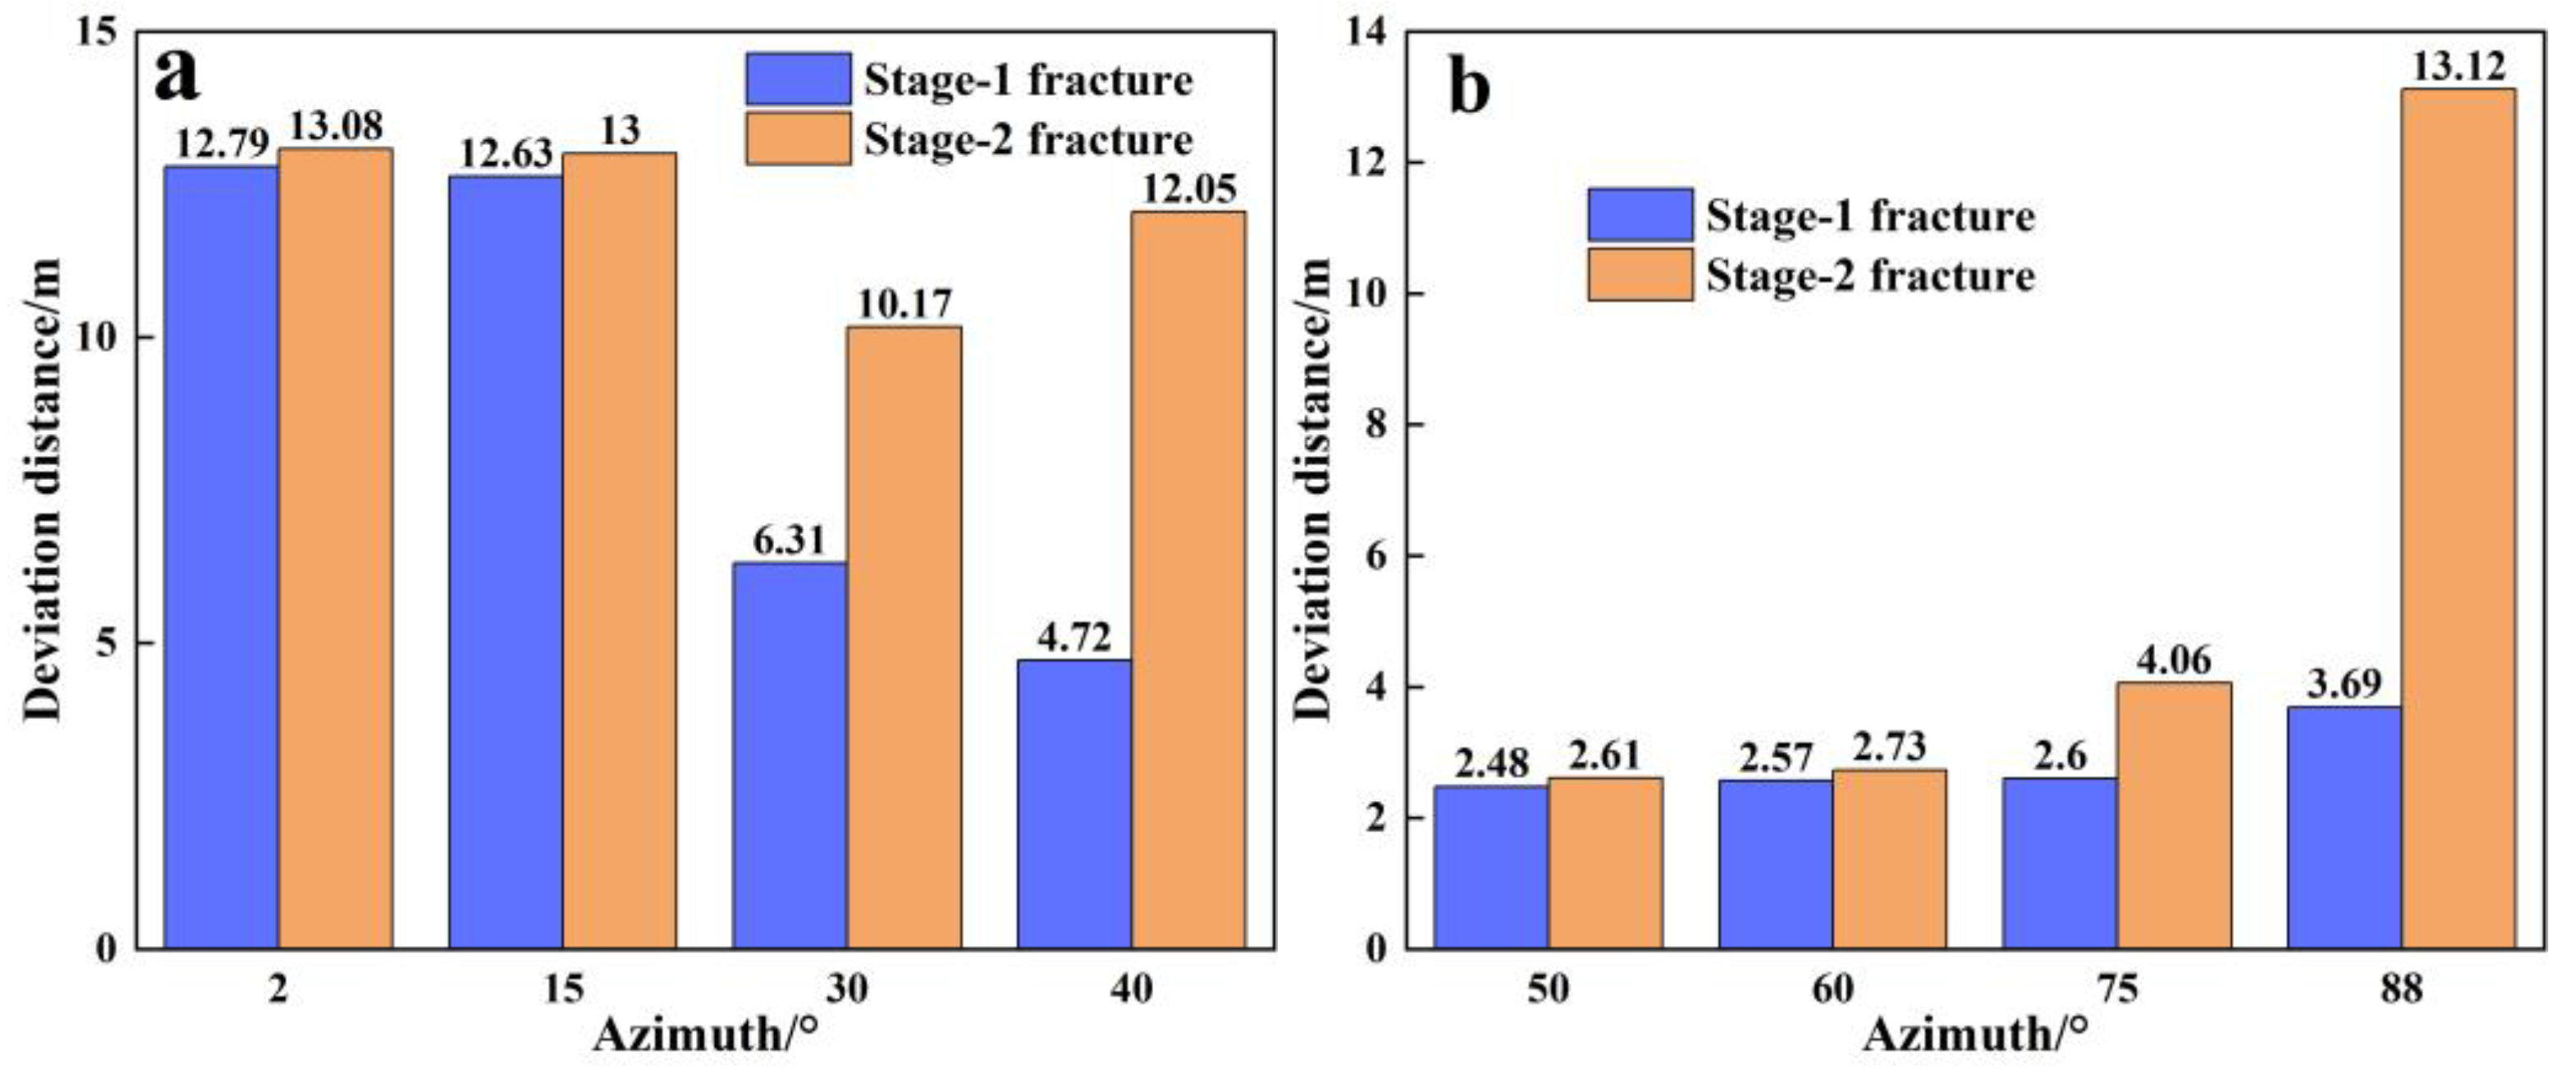
Figure 13 shows the fracture geometries of MRWF with the variation of azimuths. When radial wellbores are symmetrically distributed along Dmin, the deviation distances are shown in Figure 14a. As the azimuths increase, the deviation distances of stage-1 fractures decrease, whereas the deviation distances of stage-2 fractures initially decrease and then increase. As illustrated in Figure 8a, geometries of stage-1 fractures are similar to fracture geometries of single fracturing, indicating that the attraction effect of radial wellbores B to stage-1 fractures is relatively weak, in other words, a small attraction. An increase in the azimuth leads to a decrease in the orientation effect (i.e., the deviation distances of single fracturing decreases), an increase in the deflection effect, and a slight change in the attraction effect. The dynamic variation of three effects ultimately results in a decrease in the deviation distances of stage-1 fractures. The geometries of stage-2 fractures exhibit differences to the fracture geometries of single fracturing, particularly when increasing the azimuths. This phenomenon suggests that, with the azimuths lifting, stage-2 fractures are more significantly affected by radial wellbores A and stage-1 fractures, in other words, a stronger attraction, which is favorable for increasing the deviation distance. Meanwhile, increasing the azimuths reduces the orientation effect while elevating the deflection effect. Because of the dynamic change of three effects, the deviation distances of stage-2 fractures first decrease and then increase. This suggests that, under the azimuth of 40°, the strengthening of the attraction effect increases the deviation distances, whose effect is higher than the reduction of the deviation distances due to the weakening of the orientation effect and the strengthening of the deflection effect.
When radial wellbores are symmetrically distributed along Dmax, the deviation distances are shown in Figure 14b. As the azimuths increase from 50° to 88°, the deviation distances of stage-1 fractures increase from 2.48 m to 3.69 m (48.8%). The reason is that, as the azimuths increase, two groups of radial wellbores are farther apart and the influence of radial wellbores B on stage-1 fractures is weaker, that is, the small attraction is beneficial for increasing the deviation distance. Additionally, increasing the azimuths reduces the orientation effect and improves the deflection effect. Affected by the dynamic changes of three effects, the deviation distances of stage-1 fractures increase. This indicates that, when the azimuths increase, the weakening of the attraction effect increases the deviation distances, whose effect is higher than the reduction of the deviation distances due to the weakening of the orientation effect and the strengthening of the deflection effect.
The above analysis reveals that the attraction effect can significantly impact deviation distances, depending on the radial wellbore layouts. Specifically, when radial wellbores are symmetrically distributed along Dmin and Dmax, the enhancement of the attraction effect is beneficial and negative for increasing the deviation distances, respectively. The reason for the opposite phenomena is that, in the former case, the attraction effect slows down the fracture turning to Dmax, while, in the latter case, the attraction effect facilitates its turn.
As shown in Figure 14b, when radial wellbores are symmetrically distributed along Dmax, the deviation distances of stage-2 fractures increase by 4.0 times (from 2.61 m to 13.12 m), with the azimuths increasing from 50° to 88°. One of the reasons is that, as illustrated in Figure 13b, when the azimuths increase, stage-1 fractures are relatively farther away from radial wellbores B, resulting in a weaker attraction on stage-2 fractures and subsequently increasing their deviation distances. Additionally, when the azimuths are 60°, 75°, and 88°, the deviation distances of stage-2 fractures are larger than those of single fracturing, as shown in Figure 15. Since there is no attraction induced by other radial wellbores and the fractures, the deviation distances of single fracturing should be higher than those of stage-2 fractures. This is because the completion of the first-stage of MRWF results in an increase in the pore pressure of the matrix around radial wellbores B, as illustrated in Figure 11. The rise of the pore pressure makes the rock around radial wellbores B more likely to reach the conditions for fracture propagation, improving the guiding ability of radial wellbores B. Thus, another reason for the gradual increase in the deviation distances of stage-2 fractures is that the first-stage of MRWF lifts the pore pressure around radial wellbore B, improving its guiding ability. When the azimuth is 50°, excessive attraction from radial wellbores A and stage-1 fractures leads to a rapid deviation of stage-2 fractures from their initial direction.

3.4. Effect of the Horizontal Stress Difference

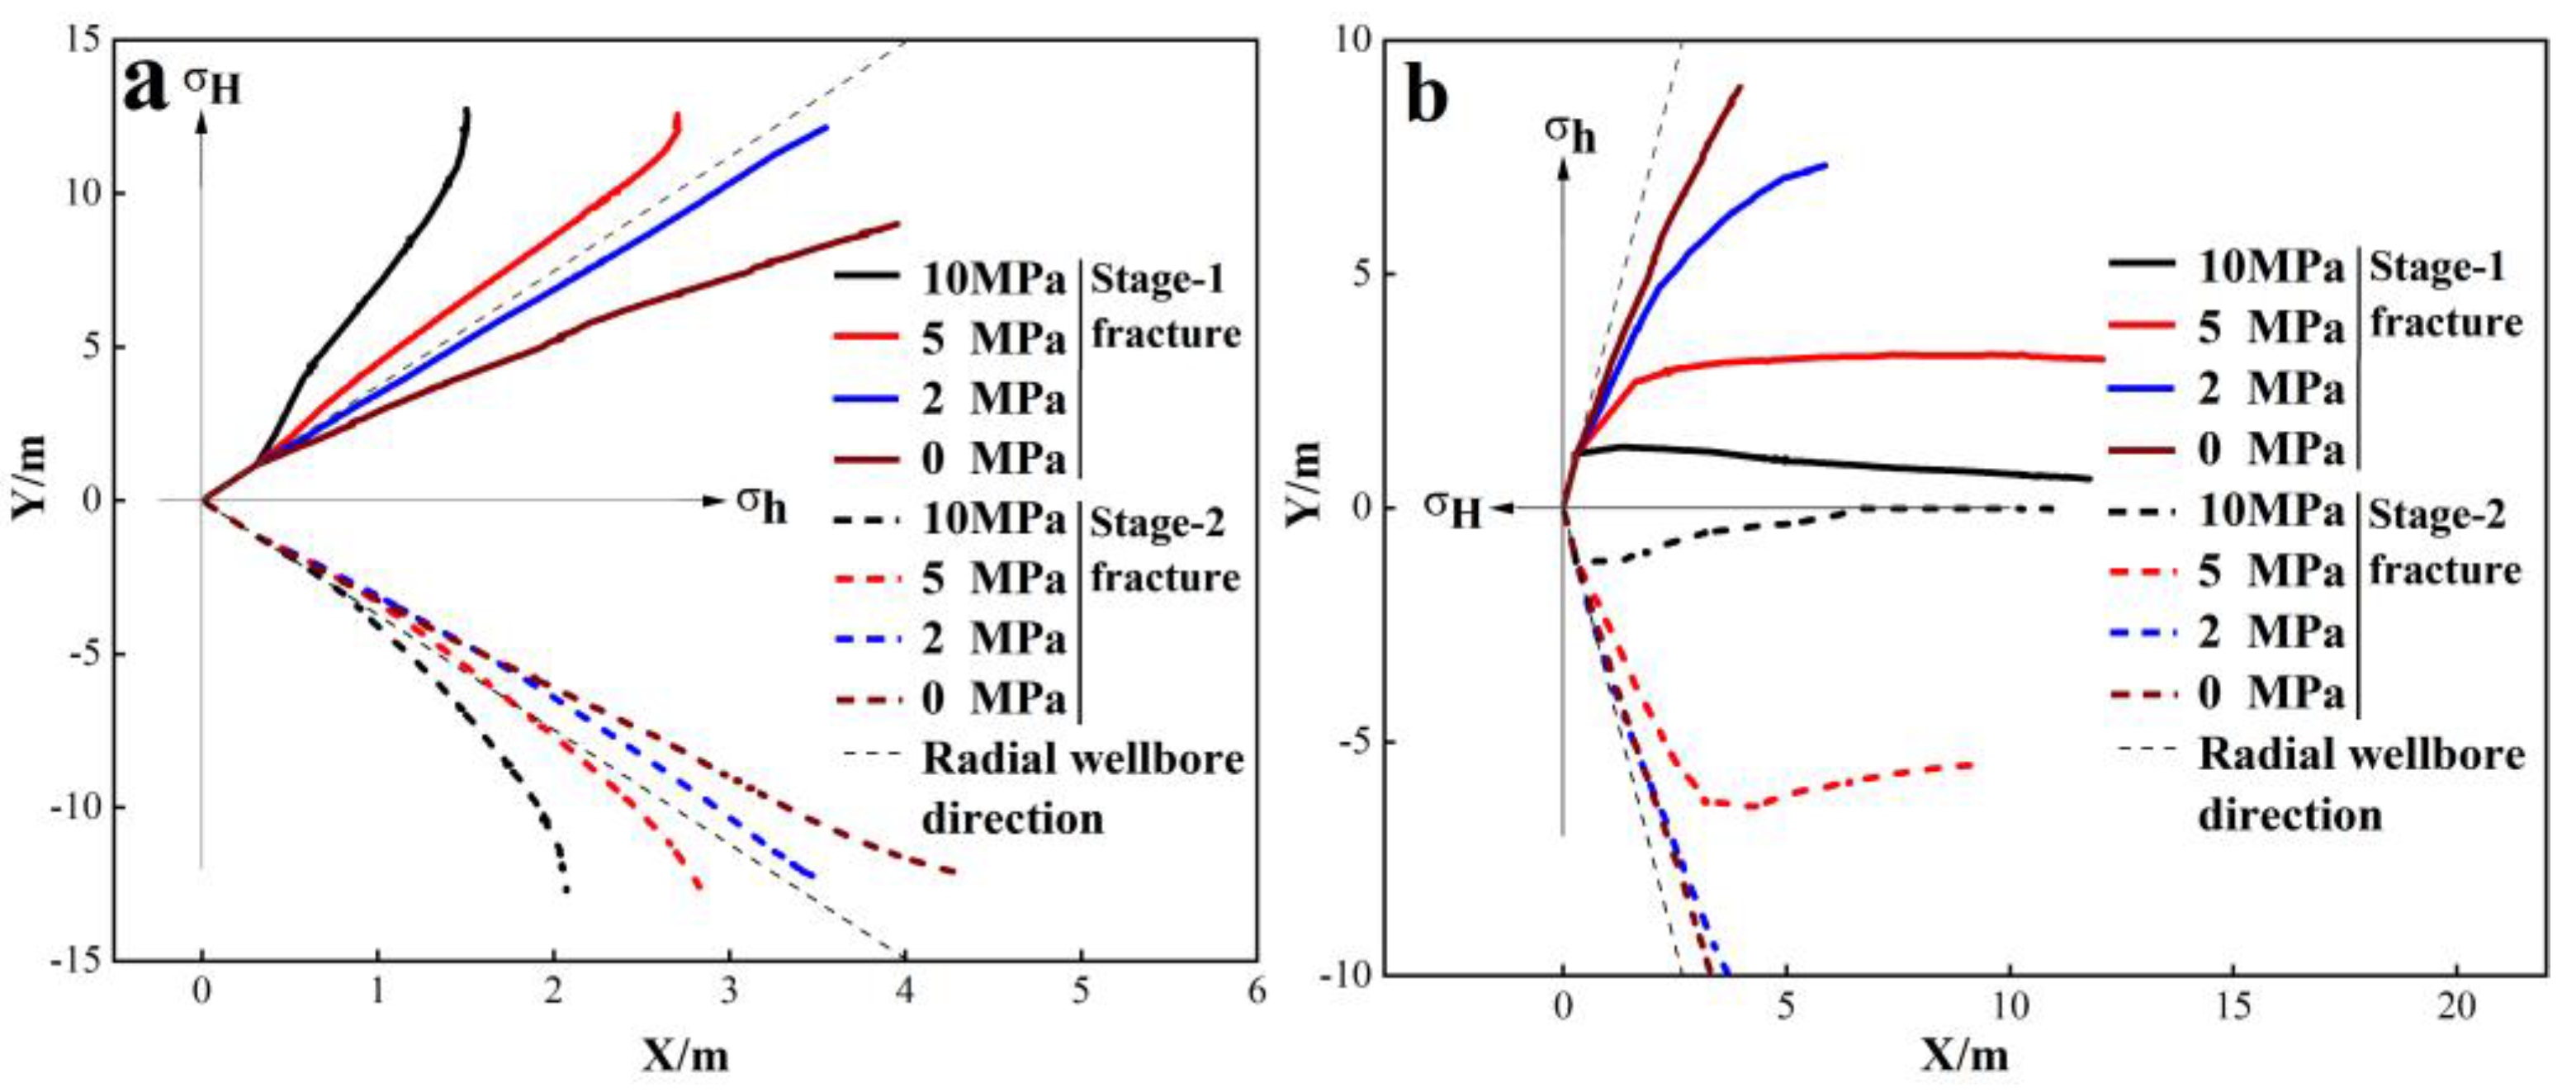
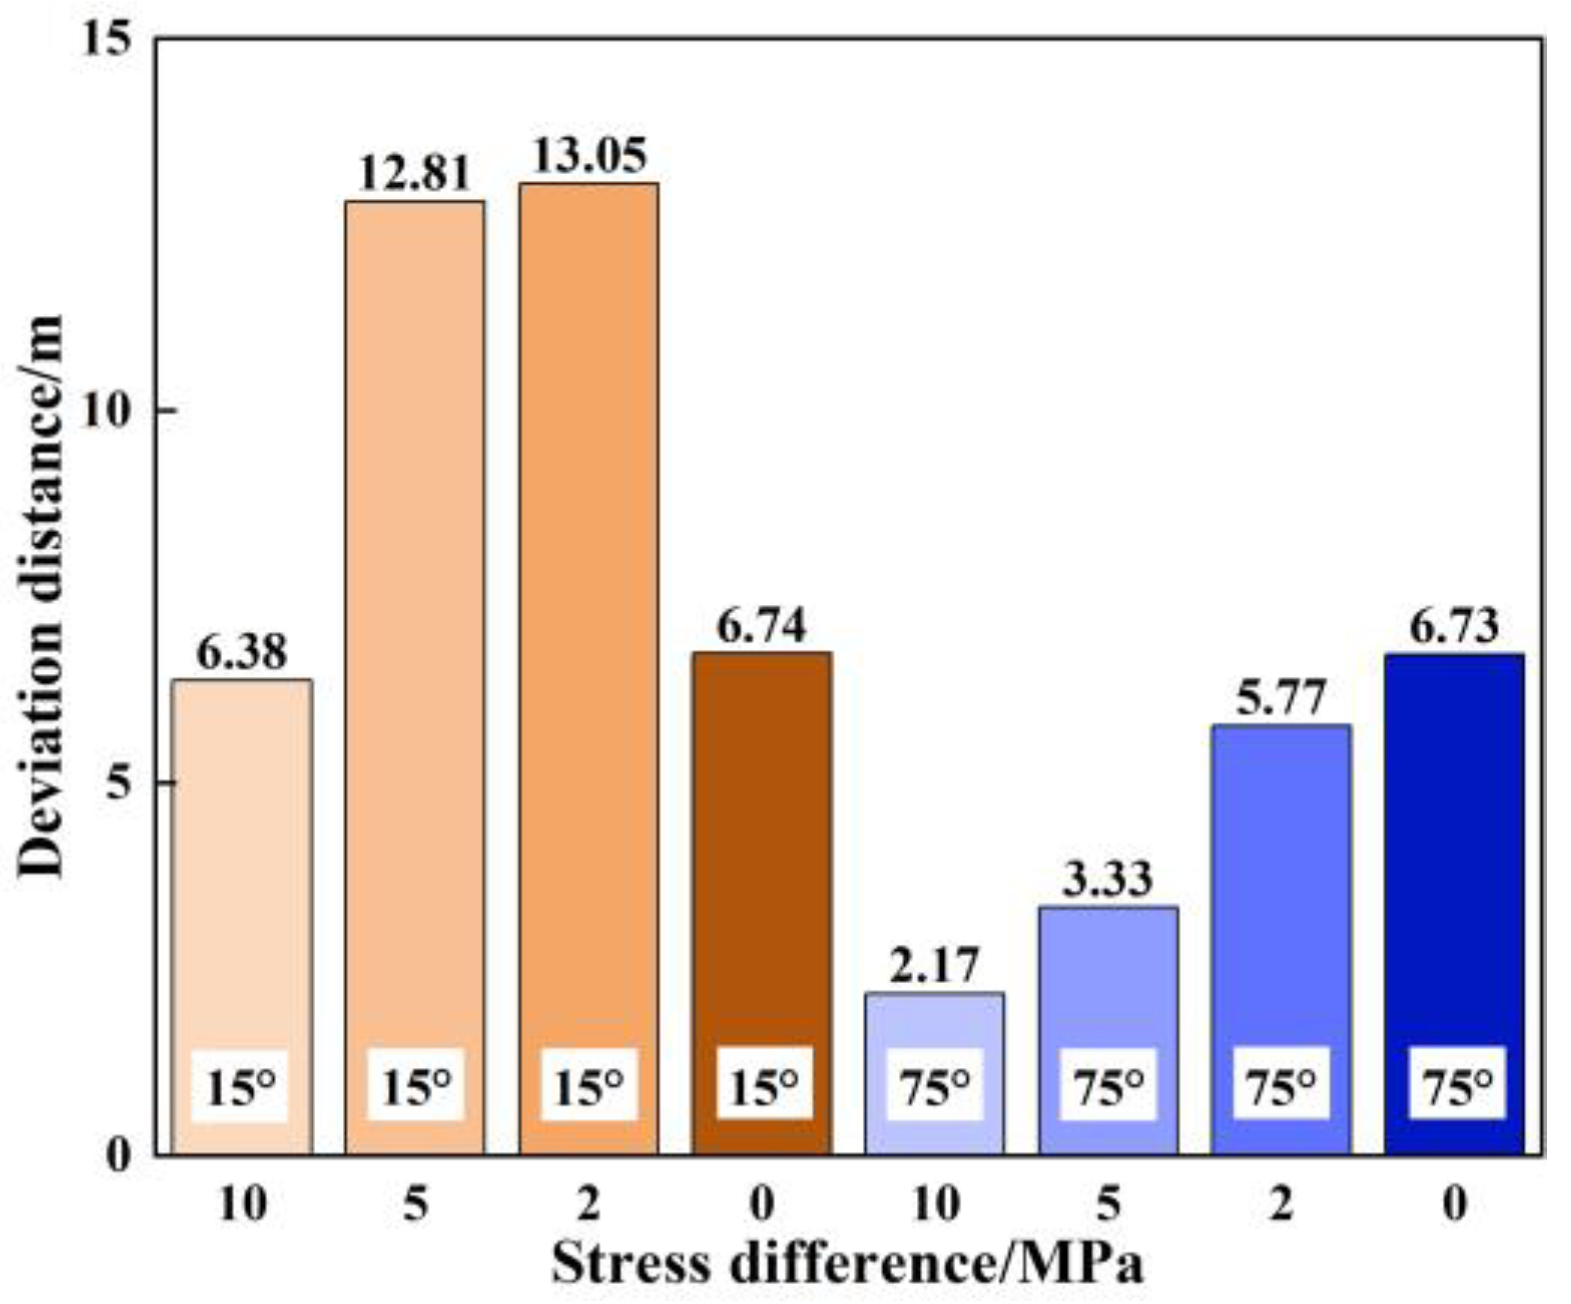
Figure 16 and Figure 17 show fracture geometries and deviation distances of MRWF with different horizontal stress differences. When radial wellbores are symmetrically distributed along Dmin with the azimuth of 15°, the deviation distances first increase and then decrease as the stress difference decreases. As the stress differences decrease from 10 MPa to 2 MPa, the deflection effect on stage-1 fractures reduces. The orientation effect stays stable and is superimposed positively on the attraction effect, leading to a gradual increase in the deviation distances. On this basis, stage-2 fractures are more significantly affected by radial wellbores A and stage-1 fractures (as illustrated in Figure 16a, the thick dashed lines are closer to the radial wellbore direction line than the solid lines). The attraction effect on stage-2 fractures increases, and the guiding ability of radial wellbores B is further improved. When the stress difference reaches 0 MPa, the deflection effect direction of the fracture changes, promoting the fracture turn to the direction of 45° azimuth.
When radial wellbores are symmetrically distributed along Dmax with the azimuth of 75°, decreasing the stress difference from 10 MPa to 0 MPa increases the deviation distances from 2.17 m to 6.73 m (2.1 times). This is because, when the stress differences decrease, the deflection effect on stage-1 fractures increases. The orientation effect stays stable and the attraction effect weakens (as illustrated in Figure 16b, stage-1 fractures are relatively farther from radial wellbores B as the stress difference decreases), resulting in a gradual increase in deviation distances. On this basis, stage-2 fractures are more significantly affected by radial wellbores A and stage-1 fractures. The larger the stress difference, the stronger the attraction effect and the smaller the deviation distance. With the stress difference of 10 MPa, the stage-2 fracture even crosses the line of Dmax, as shown by the black dotted line in Figure 16b.
Compared with the deviation distances when radial wellbores are symmetrically distributed along Dmin and Dmax, it is observed that the variation of the deviation distances is opposite when the stress difference reduces from 2 MPa to 0 MPa. Because, if fractures curve to Dmax and 45° azimuth, the fractures generated in radial wellbores of 15° azimuth will need to deflect 15° and 30°, respectively, while the fractures generated in radial wellbores of 75° azimuth will need to deflect 75° and 30°, respectively. When radial wellbores are symmetrically distributed along Dmin with the azimuth of 15°, the deflection effect of 2 MPa stress difference (turning towards Dmax, deflection 15°) is likely lower than that of 0 MPa stress difference (turning towards the direction of 45° azimuth, deflection 30°). When radial wellbores are symmetrically distributed along Dmax with the azimuth of 75°, the deflection effect of 2 MPa stress difference (turning towards Dmax, deflection 75°) is likely higher than that of 0 MPa stress difference (turning towards 45° direction, deflection 30°).
Radial wells can induce the expansion of fractures. The induction mechanism is that the wellbore pressure of radial wells changes the stress field around the well, making it easier for nearby rocks to reach fracture expansion conditions, thereby inducing fractures to expand along the radial well direction. Horizontal stress differences are not conducive to the expansion of fractures induced by radial wells. Therefore, when the stress difference is larger than 0 MPa, decreasing the stress difference is beneficial for increasing the deviation distance. When the stress difference is 0 MPa, radial wellbores with 45° azimuths are optimal for guiding fractures to propagate along their direction.

3.5. Effect of the Rock Matrix Permeability

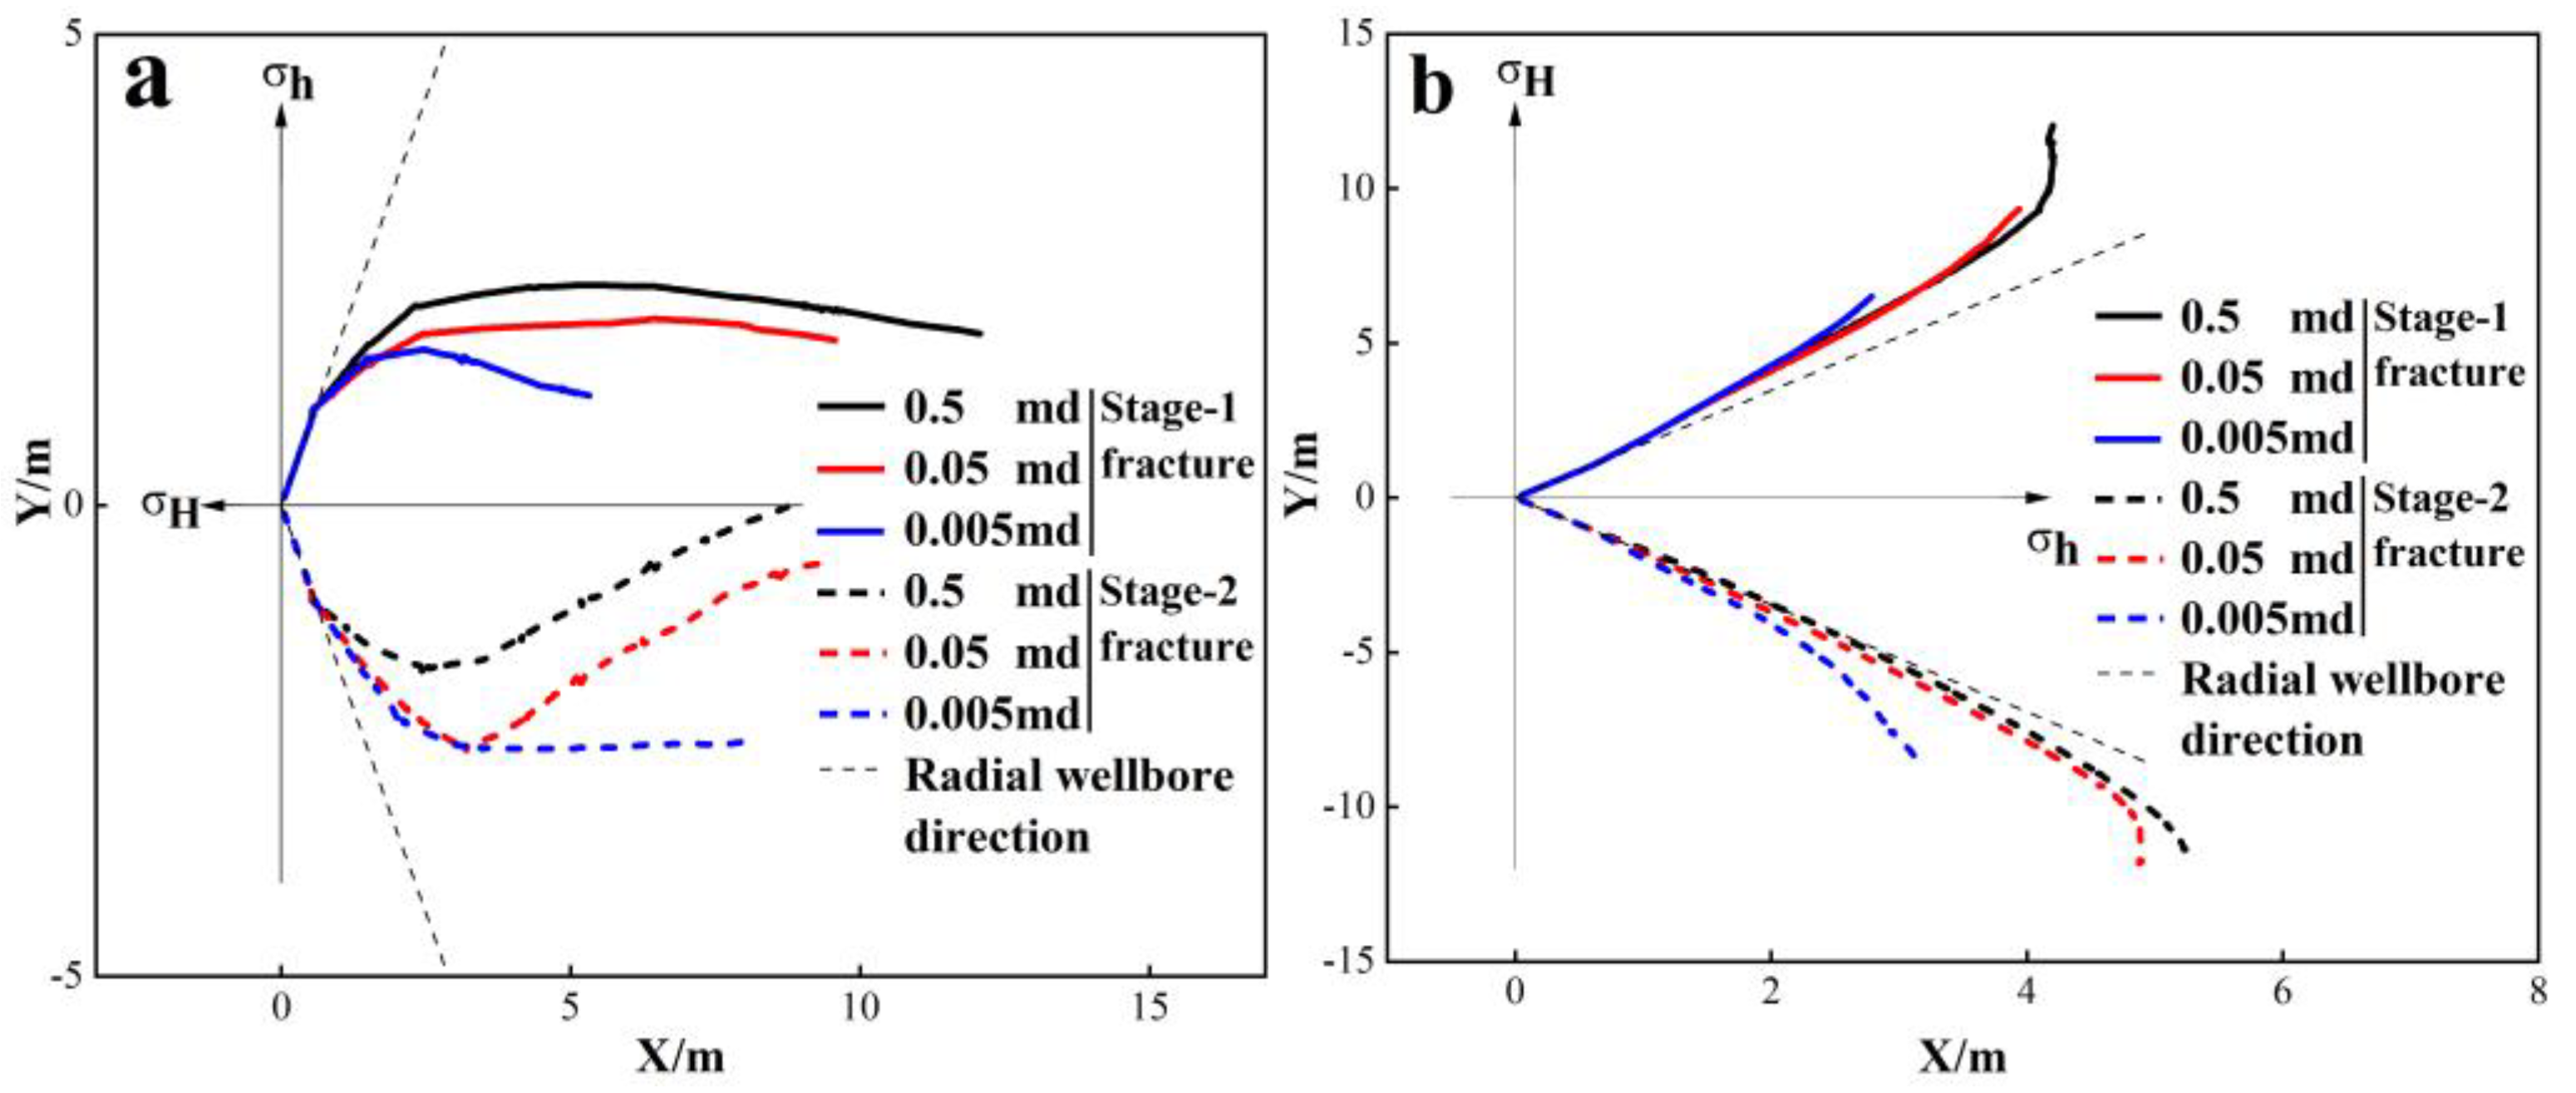
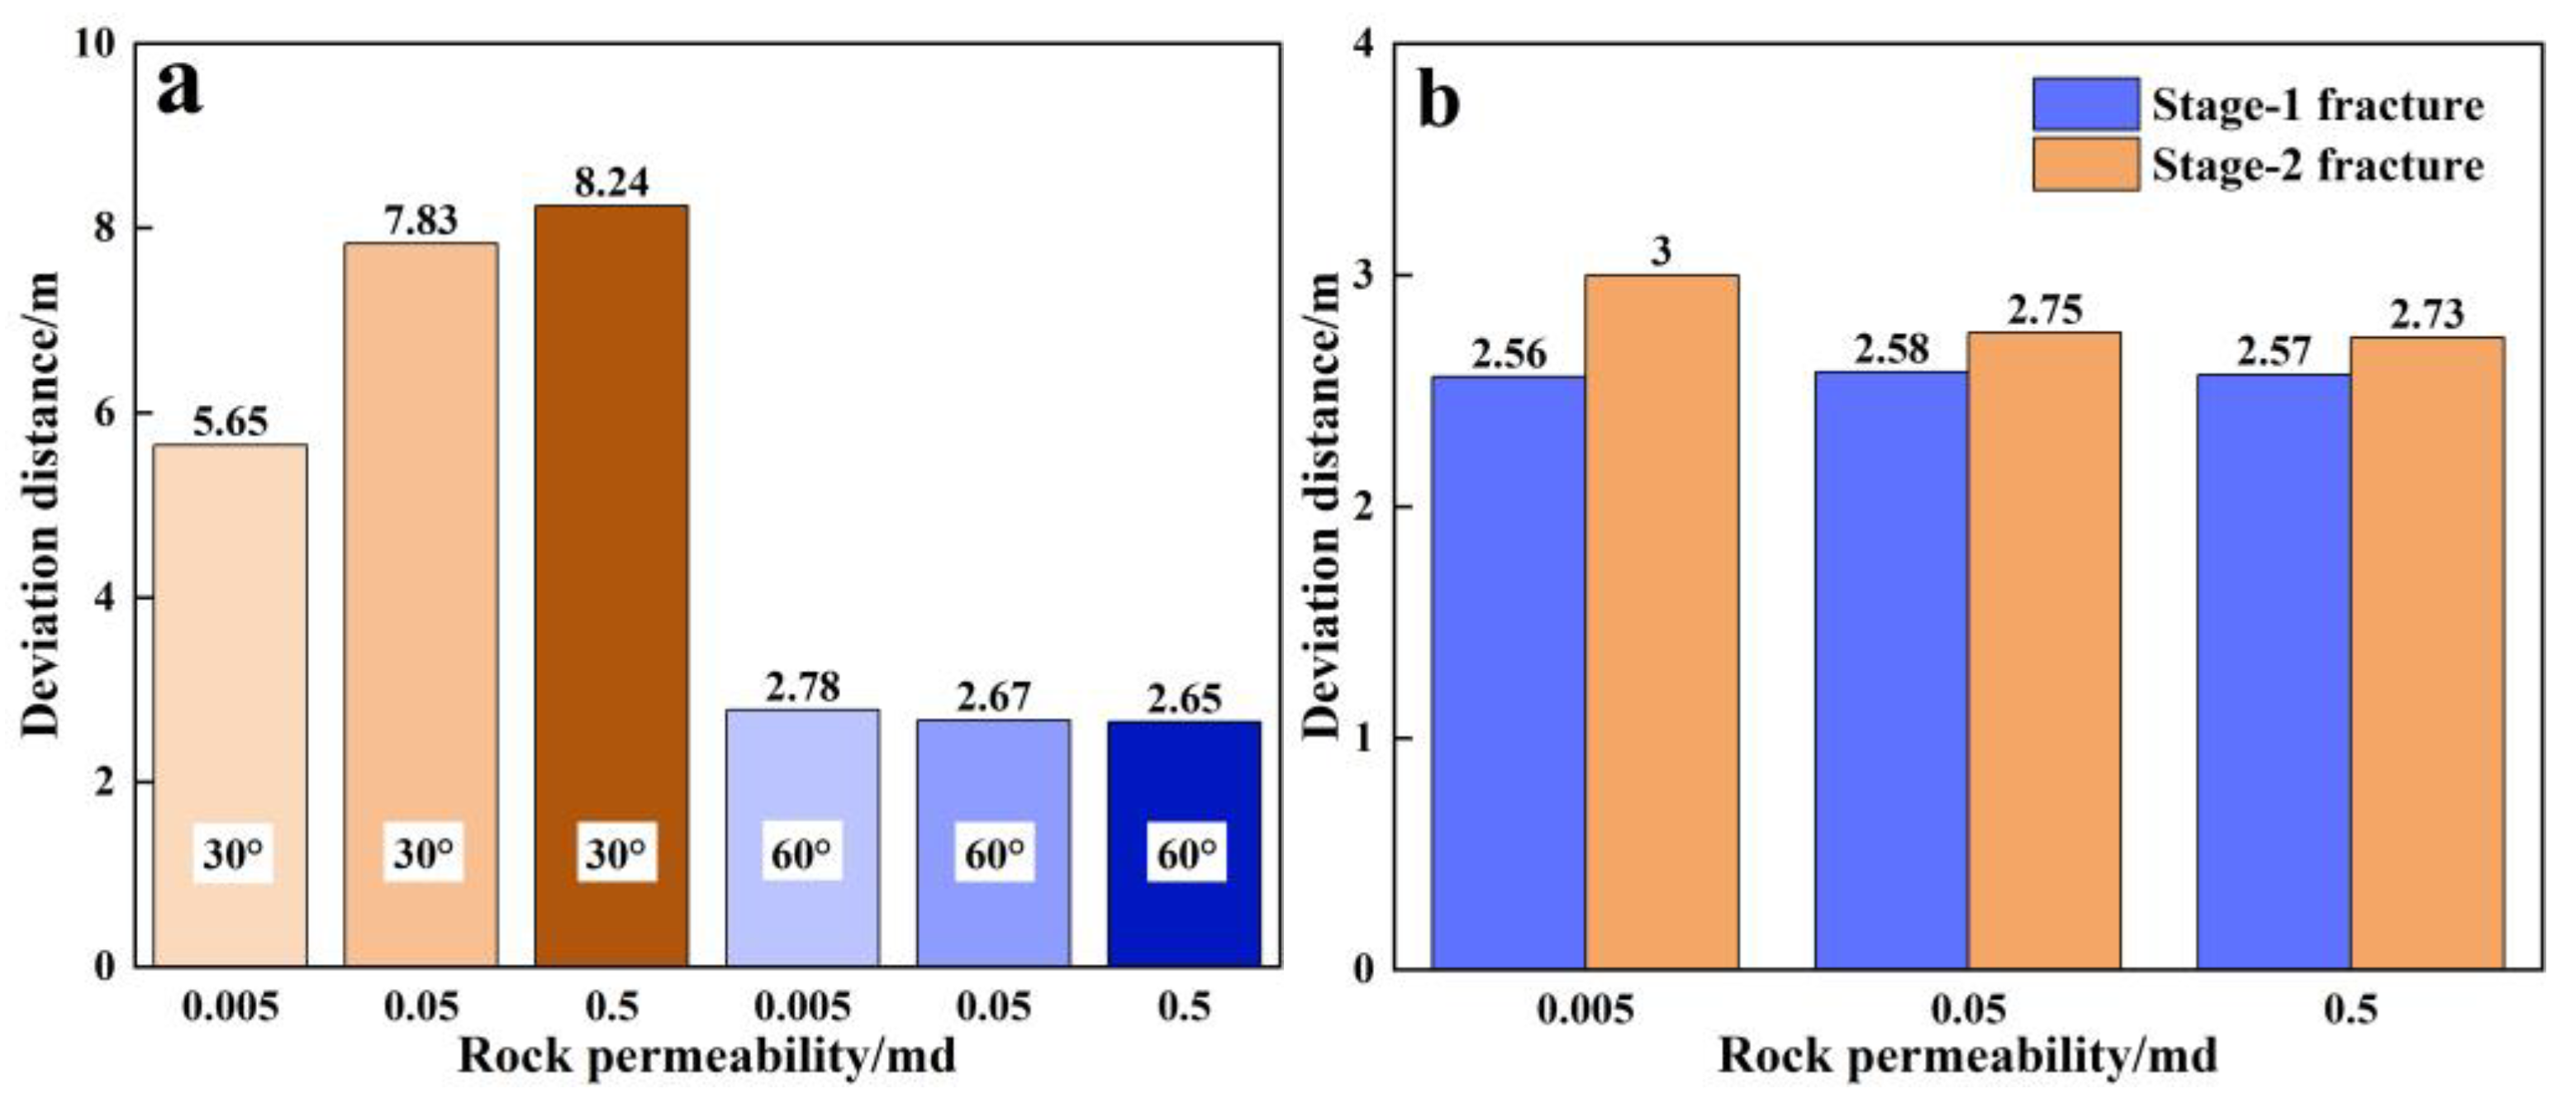
Figure 18 and Figure 19 illustrate fracture geometries and deviation distances of MRWF with varying rock matrix permeabilities. Increasing the rock matrix permeability raises the deviation distance of radial wellbores with the azimuth of 30° symmetrically distributed along Dmin (Figure 18a). When the rock matrix permeability increases from 0.005 mD to 0.5 mD, the deviation distance increases from 5.65 m to 8.24 m (45.8%). Because high permeability leads to high pore pressure of the rock matrix around the radial wellbores, the fracture will be attracted by the matrix within the high pore pressure [32]. When radial wellbores are symmetrically distributed along Dmax with the azimuth of 30° (Figure 18b), increasing the rock matrix permeability causes stage-1 fractures to be closer to the radial wellbore direction line. This is also due to the higher pore pressure of the rock around the radial wellbores. Stage-2 fractures are easily attracted by radial wellbores A and stage-1 fractures. When the rock matrix permeability is 0.5 md, stage-2 fractures even cross the line of Dmax to intersect with stage-1 fractures.
Increasing the pore pressure of the matrix around radial wellbores B improves the guiding ability of radial wellbores. The region of increased pore pressure around stage-1 fractures also attracts stage-2 fractures. These two opposite effects play with each other. If a stage-1 fracture is close to radial wellbore B, a stage-2 fracture will be attracted by the stage-1 fracture and gradually move closer to it, as shown in Figure 13b (the geometries of stage-2 fractures when the azimuths are 50° and 60°). If the stage-1 fracture is far away from radial wellbores B, the stage-2 fracture will be easily attracted by radial wellbores B and closer to their axes, as shown in Figure 13b (the geometries of stage-2 fractures when the azimuths are 75° and 88°).
Figure 20 shows the pore pressure contours of the model after the first-stage of MRWF with 60° radial wellbores when changing the rock matrix permeability. Increasing the rock matrix permeability raises the pore pressure in a larger area around stage-1 fractures. When the rock matrix permeabilities are 0.5 md and 0.05 md, the pore pressure around the preset fracture of the second-stage fracturing increases by 15.6 MPa. Stage-2 fractures are easily attracted by stage-1 fractures and propagate close to them. When the rock matrix permeability is 0.005 md, after the first-stage fracturing, the pore pressure around stage-1 fracture slightly lifts. The region near the preset fracture of the second-stage fracturing is not affected, making it difficult for the stage-2 fracture to propagate close to the stage-1 fracture.
When radial wellbores are symmetrically distributed along Dmax with the azimuth of 60°, the fracture geometries at three rock matrix permeabilities are quite different, but the differences in the deviation distances are small, as shown in Figure 19a. The reason is that, under three rock matrix permeabilities, stage-1 and stage-2 fractures rapidly deviate from the initial direction after expanding along the radial wellbores, and the permeability change has little influence on the deviation distances, as illustrated in Figure 19b.
The above simulations and analyses illustrate the fracture propagation of MRBF. However, the numerical model still has limitations. The model is pseudo-three-dimensional and does not fully consider the vertical propagation of fractures. And the simulated homogeneous reservoir does not consider the influence of natural fractures.

4. Conclusions

This study proposed multi-stage radial wellbore fracturing (MRWF), a novel approach for radial wellbore fracturing, and established a numerical model using the finite element/meshfree method to investigate fracture propagation. Fracture geometries are quantitatively assessed through the deviation distance, an indicator of the guiding ability of radial wellbores. A sensitivity analysis explores the effects of various factors, including the azimuth of the radial wellbore, the horizontal stress difference, and the rock matrix permeability. The major conclusions are as follows:
(1)
Previously created fractures attract subsequently created fractures, influencing the fracture propagation of MRWF. A conceptual model is proposed to elucidate the variations of fracture propagation, highlighting three critical factors: the attraction effect, the orientation effect of the single radial wellbore, and the deflection effect of the maximum horizontal principal stress.
(2)
With radial wellbores symmetrically distributed along the minimum horizontal stress direction, increasing the azimuth decreases the deviation distance of stage-1 fractures, and initially decreases then increases the deviation distance of stage-2 fractures. For radial wellbores symmetrically distributed along the maximum horizontal stress direction, increasing the azimuth (50° to 88°) lifts the deviation distance of both stage-1 and stage-2 fractures (48.8% and 402.7%, respectively).
(3)
When the horizontal stress difference exceeds 0 MPa, reducing the difference increases the deviation distance of both stage-1 and stage-2 fractures. When the horizontal stress difference is 0 MPa, radial wellbores with 45° azimuth exhibit better guiding ability.
(4)
Higher rock matrix permeability leads to longer fracture propagation and a greater influence of stage-1 fractures on stage-2 fractures. When radial wellbores are distributed along the minimum horizontal stress direction, increased rock matrix permeability (0.005 to 0.5 mD) lifts the deviation distances of stage-2 fractures (45.8%).

Author Contributions

Conceptualization, Y.Y. and Z.G.; methodology, Y.Y. and Z.G.; software, Z.G. and X.Z.; validation, Y.Y.; formal analysis, Y.Y.; investigation, Y.Y. and Z.G.; resources, Y.Z.; writing—original draft preparation, Y.Y.; writing—review and editing, S.T. and T.W.; funding acquisition, S.T. and T.W. All authors have read and agreed to the published version of the manuscript.

Funding

This research was funded by the Strategic Cooperation Technology Projects of CNPC and CUPB (ZLZX2020-01), the Open Topics of Chongqing Institute of Geology and Mineral Resources (KLSGE-202202), and Science Foundation of China University of Petroleum, Beijing (No. 2462023BJRC025).

Data Availability Statement

All data that support the findings of this study are available from the corresponding author upon reasonable request.

Conflicts of Interest

All authors declare that the research was conducted in the absence of any commercial or financial relationships that could be construed as a potential conflict of interest.

Nomenclature

b body force
d β κ diffusion flux of component κ within liquid phase β
E Young’s modulus
F κ mass flux of component κ
F κ | a d v convective flux of component κ
F β mass flux of phase β
f β κ diffusion flux of component k within liquid phase β
G s energy of fracture surface
g acceleration of gravity
h normal load on the external boundary
k absolute permeability
k r β relative permeability of β
K Ι stress intensity factor Ι
K Ι Ι stress intensity factor Ι Ι
K d distribution coefficient of the liquid phase
r m radius relative to the tip of the fracture
M κ volume mass per unit of component κ
P hydraulic pressure loading on fracture surface
P β fluid pressure of phase β
q point source and point sink in V n
S β saturation of phase β
t time
u displacement field in solid
V unit normal to the external boundary
V n any sub-region of the fluid system
w difference in displacement from the + to the − side of the fracture surface
X l κ mass fraction of κ within liquid phase
X β κ mass fraction of κ within phase β
Ω three-dimensional solid body
Γ h external boundary
d Γ tiny face in Ω
σ stress
σ max maximum principal stress
σ t tensile strength of rock
ε linear strain
ϕ porosity of the flow system
β single liquid phase
ρ β density of phase β
ρ l density of liquid phase
ρ R density of rock skeleton
u β Darcy velocity of β
μ β kinetic viscosity
τ 0 dependent factor
τ β coefficient
θ 0 fracture propagation angle
κ Kolosov constant
ν Poisson’s ratio
Δ v displacement differences at a distance
Δ u displacement differences at r m

References

  1. Landers, C.W. Method of and Apparatus for Horizontal Well. Drilling. Patents U.S. 5,853,056, 29 December 1998. [Google Scholar]
  2. Huang, Z.; Huang, Z.; Wu, L.; Su, Y.; Hong, C. Trajectory measurement of radial jet drilling wells: Improved tool and data processing. J. Energy Resour. Technol. 2020, 142, 032902. [Google Scholar] [CrossRef]
  3. Huang, Z.; Huang, Z.; Su, Y.; Bi, G.; Li, W.; Liu, X.; Jiang, T. A feasible method for the trajectory measurement of radial jet drilling laterals. SPE Drill. Complet. 2020, 35, 125–135. [Google Scholar] [CrossRef]
  4. Ragab, A.M.; Kamel, A.M. Radial drilling technique for improving well productivity in Petrobel-Egypt. In Proceedings of the North Africa Technical Conference and Exhibition: OnePetro, Cairo, Egypt, 15–17 April 2013. [Google Scholar]
  5. Maut, P.P.; Jain, D.; Mohan, R.; Talukdar, D.; Baruah, T.; Sharma, P.; Verma, S. Production enhancement in mature fields of Assam Arakan basin by radial jet drilling-a case study. In Proceedings of the SPE Symposium: Production Enhancement and Cost Optimisation: OnePetro, Kuala Lumpur, Malaysia, 7 November 2017. [Google Scholar]
  6. Li, Y.; Wang, C.; Shi, L.; Guo, W. Application and development of drilling and completion of the ultrashort-radius radial well by high pressure jet flow techniques. In Proceedings of the International Oil and Gas Conference and Exhibition in China: OnePetro, Beijing, China, 8–10 June 2010. [Google Scholar]
  7. Cinelli, S.D.; Kamel, A.H. Novel technique to drill horizontal laterals revitalizes aging field. In Proceedings of the SPE/IADC Drilling Conference: OnePetro, Amsterdam, The Netherlands, 5 March 2013. [Google Scholar]
  8. Abass, H.H.; Soliman, M.Y.; Al-Tahini, A.M.; Surjaatmadja, J.B.; Meadows, D.L.; Sierra, L. Oriented fracturing: A new technique to hydraulically fracture an openhole horizontal well. In Proceedings of the SPE Annual Technical Conference and Exhibition: OnePetro, New Orleans, Louisiana, 4–7 October 2009. [Google Scholar]
  9. Fu, X.; Li, G.; Huang, Z.; Liang, Y.; Xu, Z.; Jin, X. Experimental and numerical study of radial lateral fracturing for coalbed methane. J. Geophys. Eng. 2015, 12, 875–886. [Google Scholar] [CrossRef]
  10. Lu, Y.Y.; Zuo, S.J.; Ge, Z.L.; Xiao, S.; Cheng, Y. Experimental Study of Crack Initiation and Extension Induced by Hydraulic Fracturing in a Tree-Type Borehole Array. Energies 2016, 9, 514. [Google Scholar] [CrossRef]
  11. Liu, Q.; Tian, S.; Li, G.; Yu, W.; Sheng, M.; Fan, X.; Zhang, Z.; Sepehrnoori, K.; Guo, Z.; Geng, L. Fracture initiation and propagation characteristics for radial drilling-fracturing: An experimental study. In Proceedings of the Unconventional Resources Technology Conference, Houston, TX, USA, 23–25 July 2018; Society of Exploration Geophysicists, American Association of Petroleum: Tulsa, OK, USA, 2018; pp. 1059–1067. [Google Scholar]
  12. Yan, C.; Cheng, Y.; Deng, F.; Qimin, L.; Fei, T.; Qingchao, L. Experimental Study on the Hydraulic Fracturing of Radial Horizontal Wells. In Proceedings of the 4th ISRM Young Scholars Symposium on Rock Mechanics, Jeju, Korea, 10 May 2017. [Google Scholar]
  13. Guo, T.; Rui, Z.; Qu, Z.; Qi, N. Experimental study of directional propagation of hydraulic fracture guided by multi-radial slim holes. J. Petrol. Sci. Eng. 2018, 166, 592–601. [Google Scholar] [CrossRef]
  14. Guo, T.; Gong, F.; Shen, L.; Qu, Z.; Qi, N.; Wang, T. Multi-fractured stimulation technique of hydraulic fracturing assisted by radial slim holes. J. Petrol. Sci. Eng. 2019, 174, 572–583. [Google Scholar] [CrossRef]
  15. Guo, Z.Q.; Tian, S.C.; Yong, Y.N.; Ma, L.; Liu, Q.; Zhang, Y.; Yang, R. Fracture Geometries Influenced by Distances Between Adjacent Layers of Radial Boreholes for Hydraulic Fracturing. In Proceedings of the 55th US Rock Mechanics/Geomechanics Symposium: OnePetro, Online, 18–25 June 2021. [Google Scholar]
  16. Guo, Z.; Tian, S.; Liu, Q.; Ma, L.; Yong, Y.; Yang, R. Experimental investigation on the breakdown pressure and fracture propagation of radial borehole fracturing. J. Petrol. Sci. Eng. 2022, 208, 109169. [Google Scholar] [CrossRef]
  17. Seyedrahimi-Niaraq, M.; Bina, S.M.; Itoi, R. Numerical and thermodynamic modeling for estimating production capacity of NW Sabalan geothermal field, Iran. Geothermics 2021, 90, 101981. [Google Scholar] [CrossRef]
  18. Li, X.L.; Xiao, W.; Qu, Z.Q.; Guo, T.; Li, J.; Zhang, W.; Tian, Y. Rules of fracture propagation of hydraulic fracturing in radial well based on XFEM. J. Pet. Explor. Prod. Technol. 2018, 8, 1547–1557. [Google Scholar] [CrossRef]
  19. Guo, T.; Qu, Z.; Gong, F.; Wang, X. Numerical simulation of hydraulic fracture propagation guided by single radial boreholes. Energies 2017, 10, 1680. [Google Scholar] [CrossRef]
  20. Guo, T.; Qu, Z.; Gong, D.; Lei, X.; Liu, M. Numerical simulation of directional propagation of hydraulic fracture guided by vertical multi-radial boreholes. J. Nat. Gas. Sci. Eng. 2016, 35, 175–188. [Google Scholar] [CrossRef]
  21. Wang, T.; Guo, Z.; Li, G.; Zhengchao, M.; Yuning, Y.; CHANG, X.; Shouceng, T. Numerical simulation of three-dimensional fracturing fracture propagation in radial wells. Pet. Explor. Dev. 2023, 50, 699–711. [Google Scholar] [CrossRef]
  22. El Rabaa, W. Experimental study of hydraulic fracture geometry initiated from horizontal wells. In Proceedings of the SPE Annual Technical Conference and Exhibition: OnePetro, San Antonio, TX, USA, 8–11 October 1989. [Google Scholar]
  23. Tang, X.; Rutqvist, J.; Hu, M.; Rayudu, N.M. Modeling three-dimensional fluid-driven propagation of multiple fractures using TOUGH-FEMM. Rock. Mech. Rock. Eng. 2019, 52, 611–627. [Google Scholar] [CrossRef]
  24. Zhang, K.; Tang, M.; Wang, C.; Wang, G.; Dou, L.; Sun, H. Study on prediction method of tensile strength for tight sandstone formation. Progress. Geophys. 2021, 36, 318–324. [Google Scholar]
  25. Yang, B.; Wang, H.; Wang, B.; Shen, Z.; Zheng, Y.; Jia, Z.; Yan, W. Digital quantification of fracture in full-scale rock using micro-CT images: A fracturing experiment with N2 and CO2. J. Petrol. Sci. Eng. 2021, 196, 107682. [Google Scholar] [CrossRef]
  26. Liu, J.; Hui, C.; Fan, J.; Lyu, W.; Wang, J.; Yin, C.; Wang, H. Distribution characteristics of the present-day in-situ stress in the Chang 6 tight sandstone reservoirs of the Yanchang Formation in the Heshui Area, Ordos Basin, China and suggestions for development. Int. J. Geomech. 2021, 27, 31–39. [Google Scholar]
  27. Bian, H.; Wang, F.; Zhang, Y.; Yue, C. Experimental study of dynamic and static elastic parameters of tight sandstones under reservoir conditions. Chin. J. Rock. Mech. Eng. 2015, 34, 3045–3054. [Google Scholar]
  28. Zhang, Z.; Zhang, S.; Zou, Y.; Ma, X.; Li, N.; Liu, L. Experimental investigation into simultaneous and sequential propagation of multiple closely spaced fractures in a horizontal well. J. Petrol. Sci. Eng. 2021, 202, 108531. [Google Scholar] [CrossRef]
  29. Zheng, H.; Pu, C.; Xu, E.; Sun, C. Numerical investigation on the effect of well interference on hydraulic fracture propagation in shale formation. Eng. Fract. Mech. 2020, 228, 106932. [Google Scholar] [CrossRef]
  30. Gong, D.; Qu, Z.; Guo, T.; Tian, Y.; Tian, K. Variation rules of fracture initiation pressure and fracture starting point of hydraulic fracture in radial well. J. Petrol. Sci. Eng. 2016, 140, 41–56. [Google Scholar] [CrossRef]
  31. Hubbert, M.K.; Willis, D.G. Mechanics of hydraulic fracturing. Trans. AIME 1957, 210, 153–168. [Google Scholar] [CrossRef]
  32. Bruno, M.; Nakagawa, F. Pore pressure influence on tensile fracture propagation in sedimentary rock. Int. J. Rock. Mech. Min. Sci. 1991, 28, 261–273. [Google Scholar] [CrossRef]
Figure 1. Schematic of the technique of MRWF.
Processes 12 01539 g001
Figure 2. Schematic of the simulation model.
Processes 12 01539 g002
Figure 3. Schematic of the layouts of radial wellbores in a single layer. (a) Symmetrically distributed along Dmin; (b) symmetrically distributed along Dmax.
Processes 12 01539 g003
Figure 4. Two-dimensional fracture geometries when changing the mesh densities. (a) Azimuth of 30°; (b) azimuth of 60°.
Processes 12 01539 g004
Figure 5. Chart of fracture geometries of RWF with various azimuths. (a) Numerical results by Guo et al. [19]; (b) results of this model.
Processes 12 01539 g005
Figure 6. Pore pressure contour and fracture geometry of MRWF with the azimuth of 60°. (a) Pore pressure contour; (b) fracture geometry.
Processes 12 01539 g006
Figure 7. Schematic of the definition of deviation distance.
Processes 12 01539 g007
Figure 8. Comparison of fracture geometries between MRWF and single fracturing. (a,b) Radial wellbores symmetrically distributed along Dmin and Dmax, respectively.
Processes 12 01539 g008
Figure 9. Comparison of deviation distances between MRWF and single fracturing. (a,b) Radial wellbores symmetrically distributed along Dmin and Dmax, respectively.
Processes 12 01539 g009
Figure 10. Schematic of two kinds of RWF.
Processes 12 01539 g010
Figure 11. Pore pressure contours when fractures stop propagating after first-stage fracturing.
Processes 12 01539 g011
Figure 12. Schematic of the conceptual model for fracture propagation controlled by three effects.
Processes 12 01539 g012
Figure 13. Chart of fracture geometries when changing the azimuths. (a,b) Radial wellbores symmetrically distributed along Dmin and Dmax, respectively.
Processes 12 01539 g013
Figure 14. Comparison of deviation distances between stage-1 and stage-2 fractures. (a,b) Radial wellbores symmetrically distributed along Dmin and Dmax, respectively.
Processes 12 01539 g014
Figure 15. Comparison of deviation distances of stage-2 fractures produced by the second stage of MRWF and fractures of single fracturing.
Processes 12 01539 g015
Figure 16. Chart of fracture geometries when changing the horizontal stress differences. (a,b) Radial wellbores symmetrically distributed along Dmin and Dmax, respectively.
Processes 12 01539 g016
Figure 17. Chart of deviation distances when changing the horizontal stress differences.
Processes 12 01539 g017
Figure 18. Chart of fracture geometries when changing the rock matrix permeability. (a,b) Radial wellbores symmetrically distributed along Dmin and Dmax, respectively.
Processes 12 01539 g018
Figure 19. Chart of deviation distances when changing the rock matrix permeability. (a) Average deviation distances of stage-1 and stage-2 fractures; (b) deviation distances of stage-1 and stage-2 fractures with the azimuths of 60°.
Processes 12 01539 g019
Figure 20. Pore pressure contours of the model after the first stage fracturing when changing the rock matrix permeability.
Processes 12 01539 g020
Table 1. Parameters of formation and weakened material.
ParametersValueUnit
Formation
 Density2467kg/m3
 Young’s modulus32 × 109Pa
 Uniaxial tensile strength4.8 × 106Pa
 Poisson’s ratio0.18
 Porosity0.08
 Permeability5 × 10−16m2
 Pore pressure15.6 × 106Pa
 Maximum horizontal stress30 × 106Pa
 Minimum horizontal stress25 × 106Pa
Weakened material
 Density500kg/m3
 Young’s modulus32 × 105Pa
Poisson’s ratio0.25
Porosity0.4
Permeability1 × 10−12m2
Disclaimer/Publisher’s Note: The statements, opinions and data contained in all publications are solely those of the individual author(s) and contributor(s) and not of MDPI and/or the editor(s). MDPI and/or the editor(s) disclaim responsibility for any injury to people or property resulting from any ideas, methods, instructions or products referred to in the content.