
Investigation of the Use of Mycelial Filler with Different Cultivation Times for the Filtration of Particulate Airflow
 , and
, and
Abstract
:1. Introduction
2. Materials and Methods
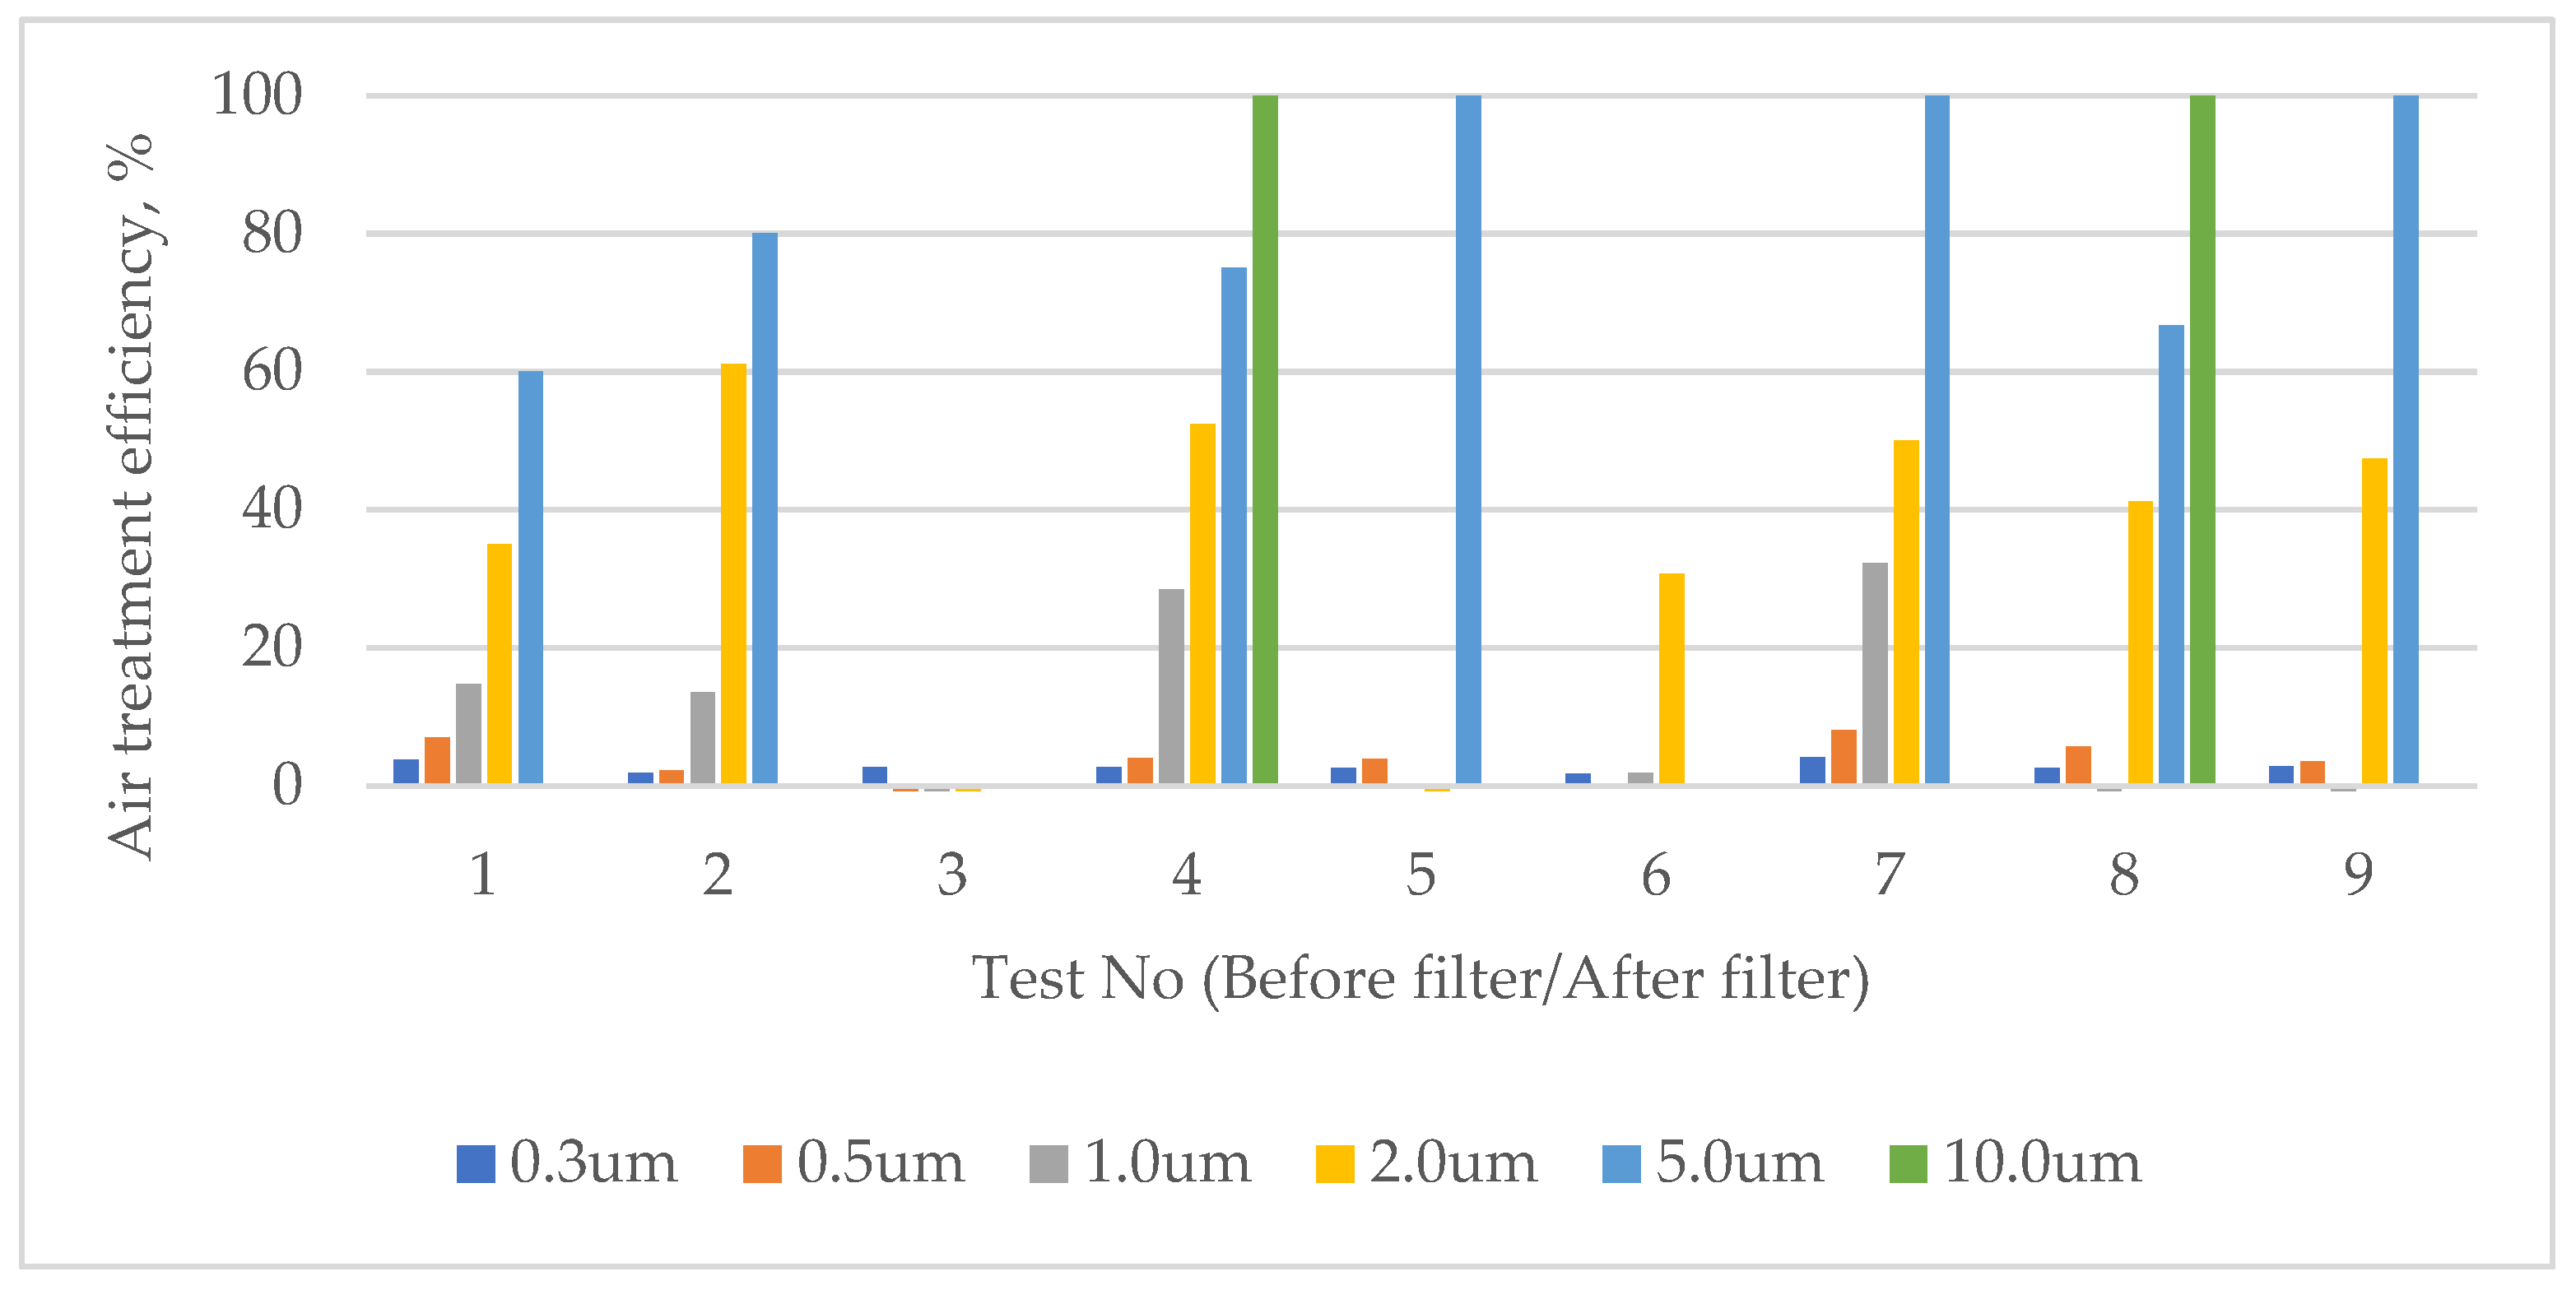
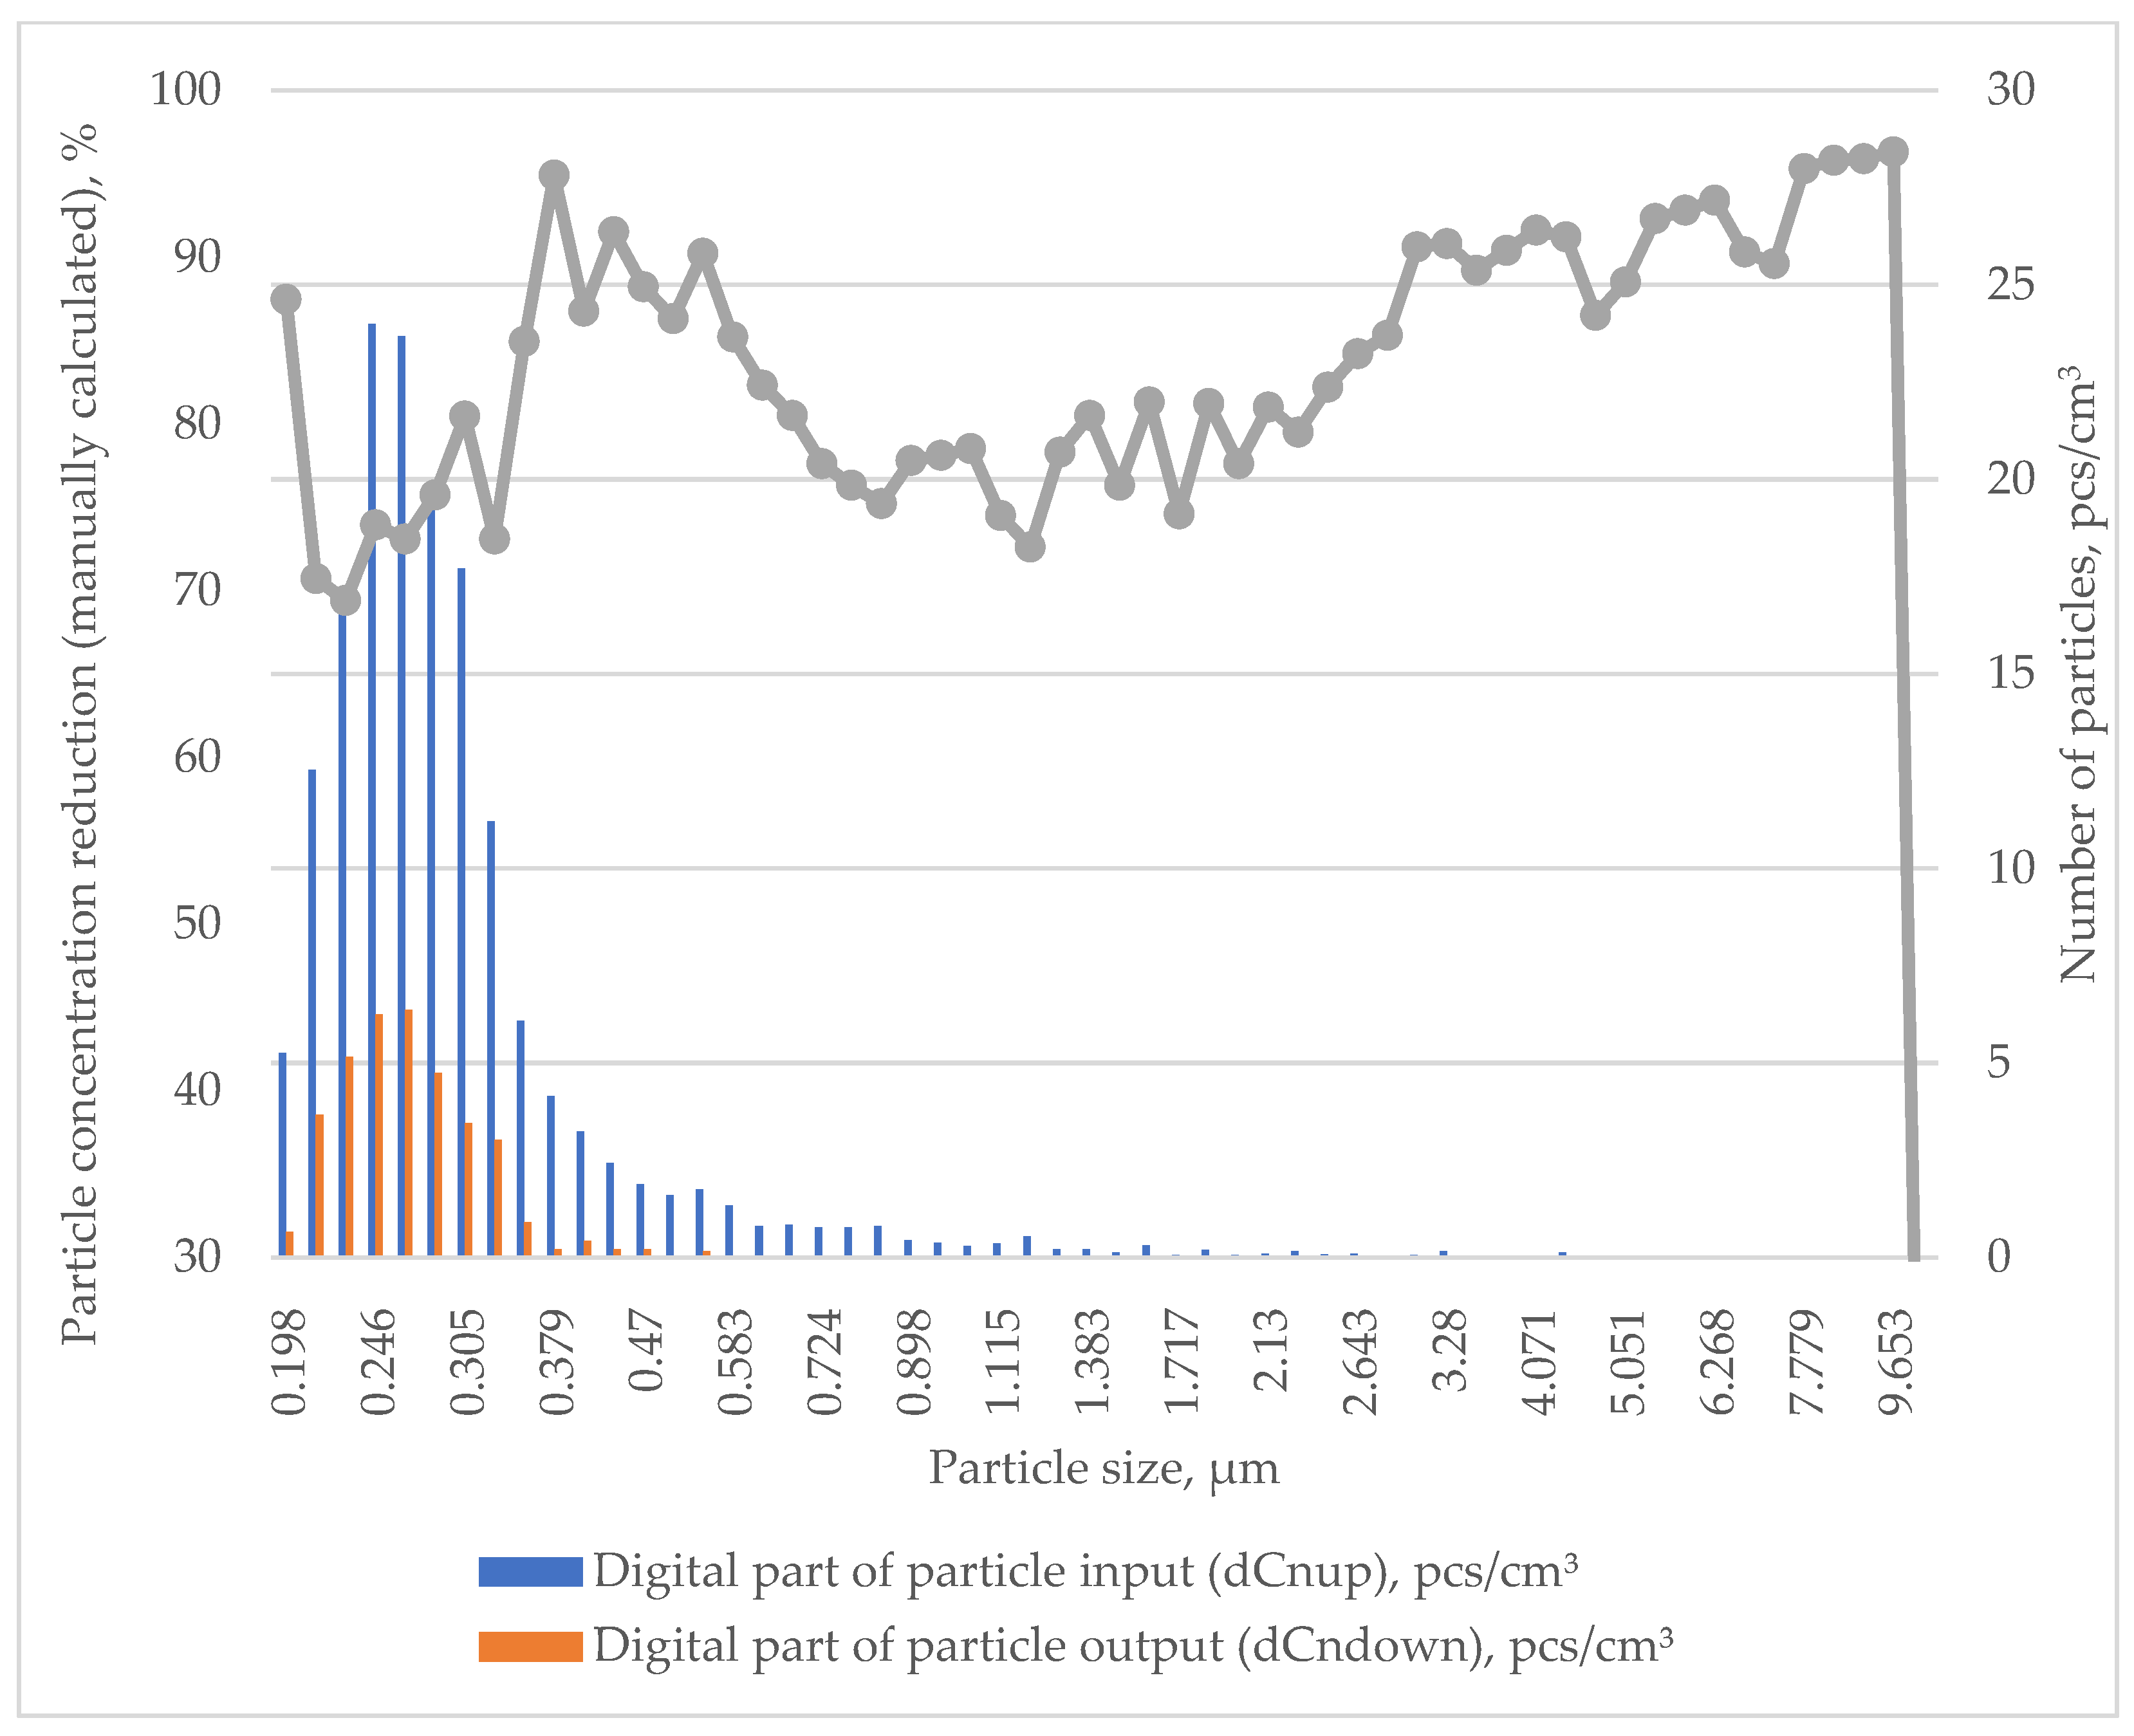
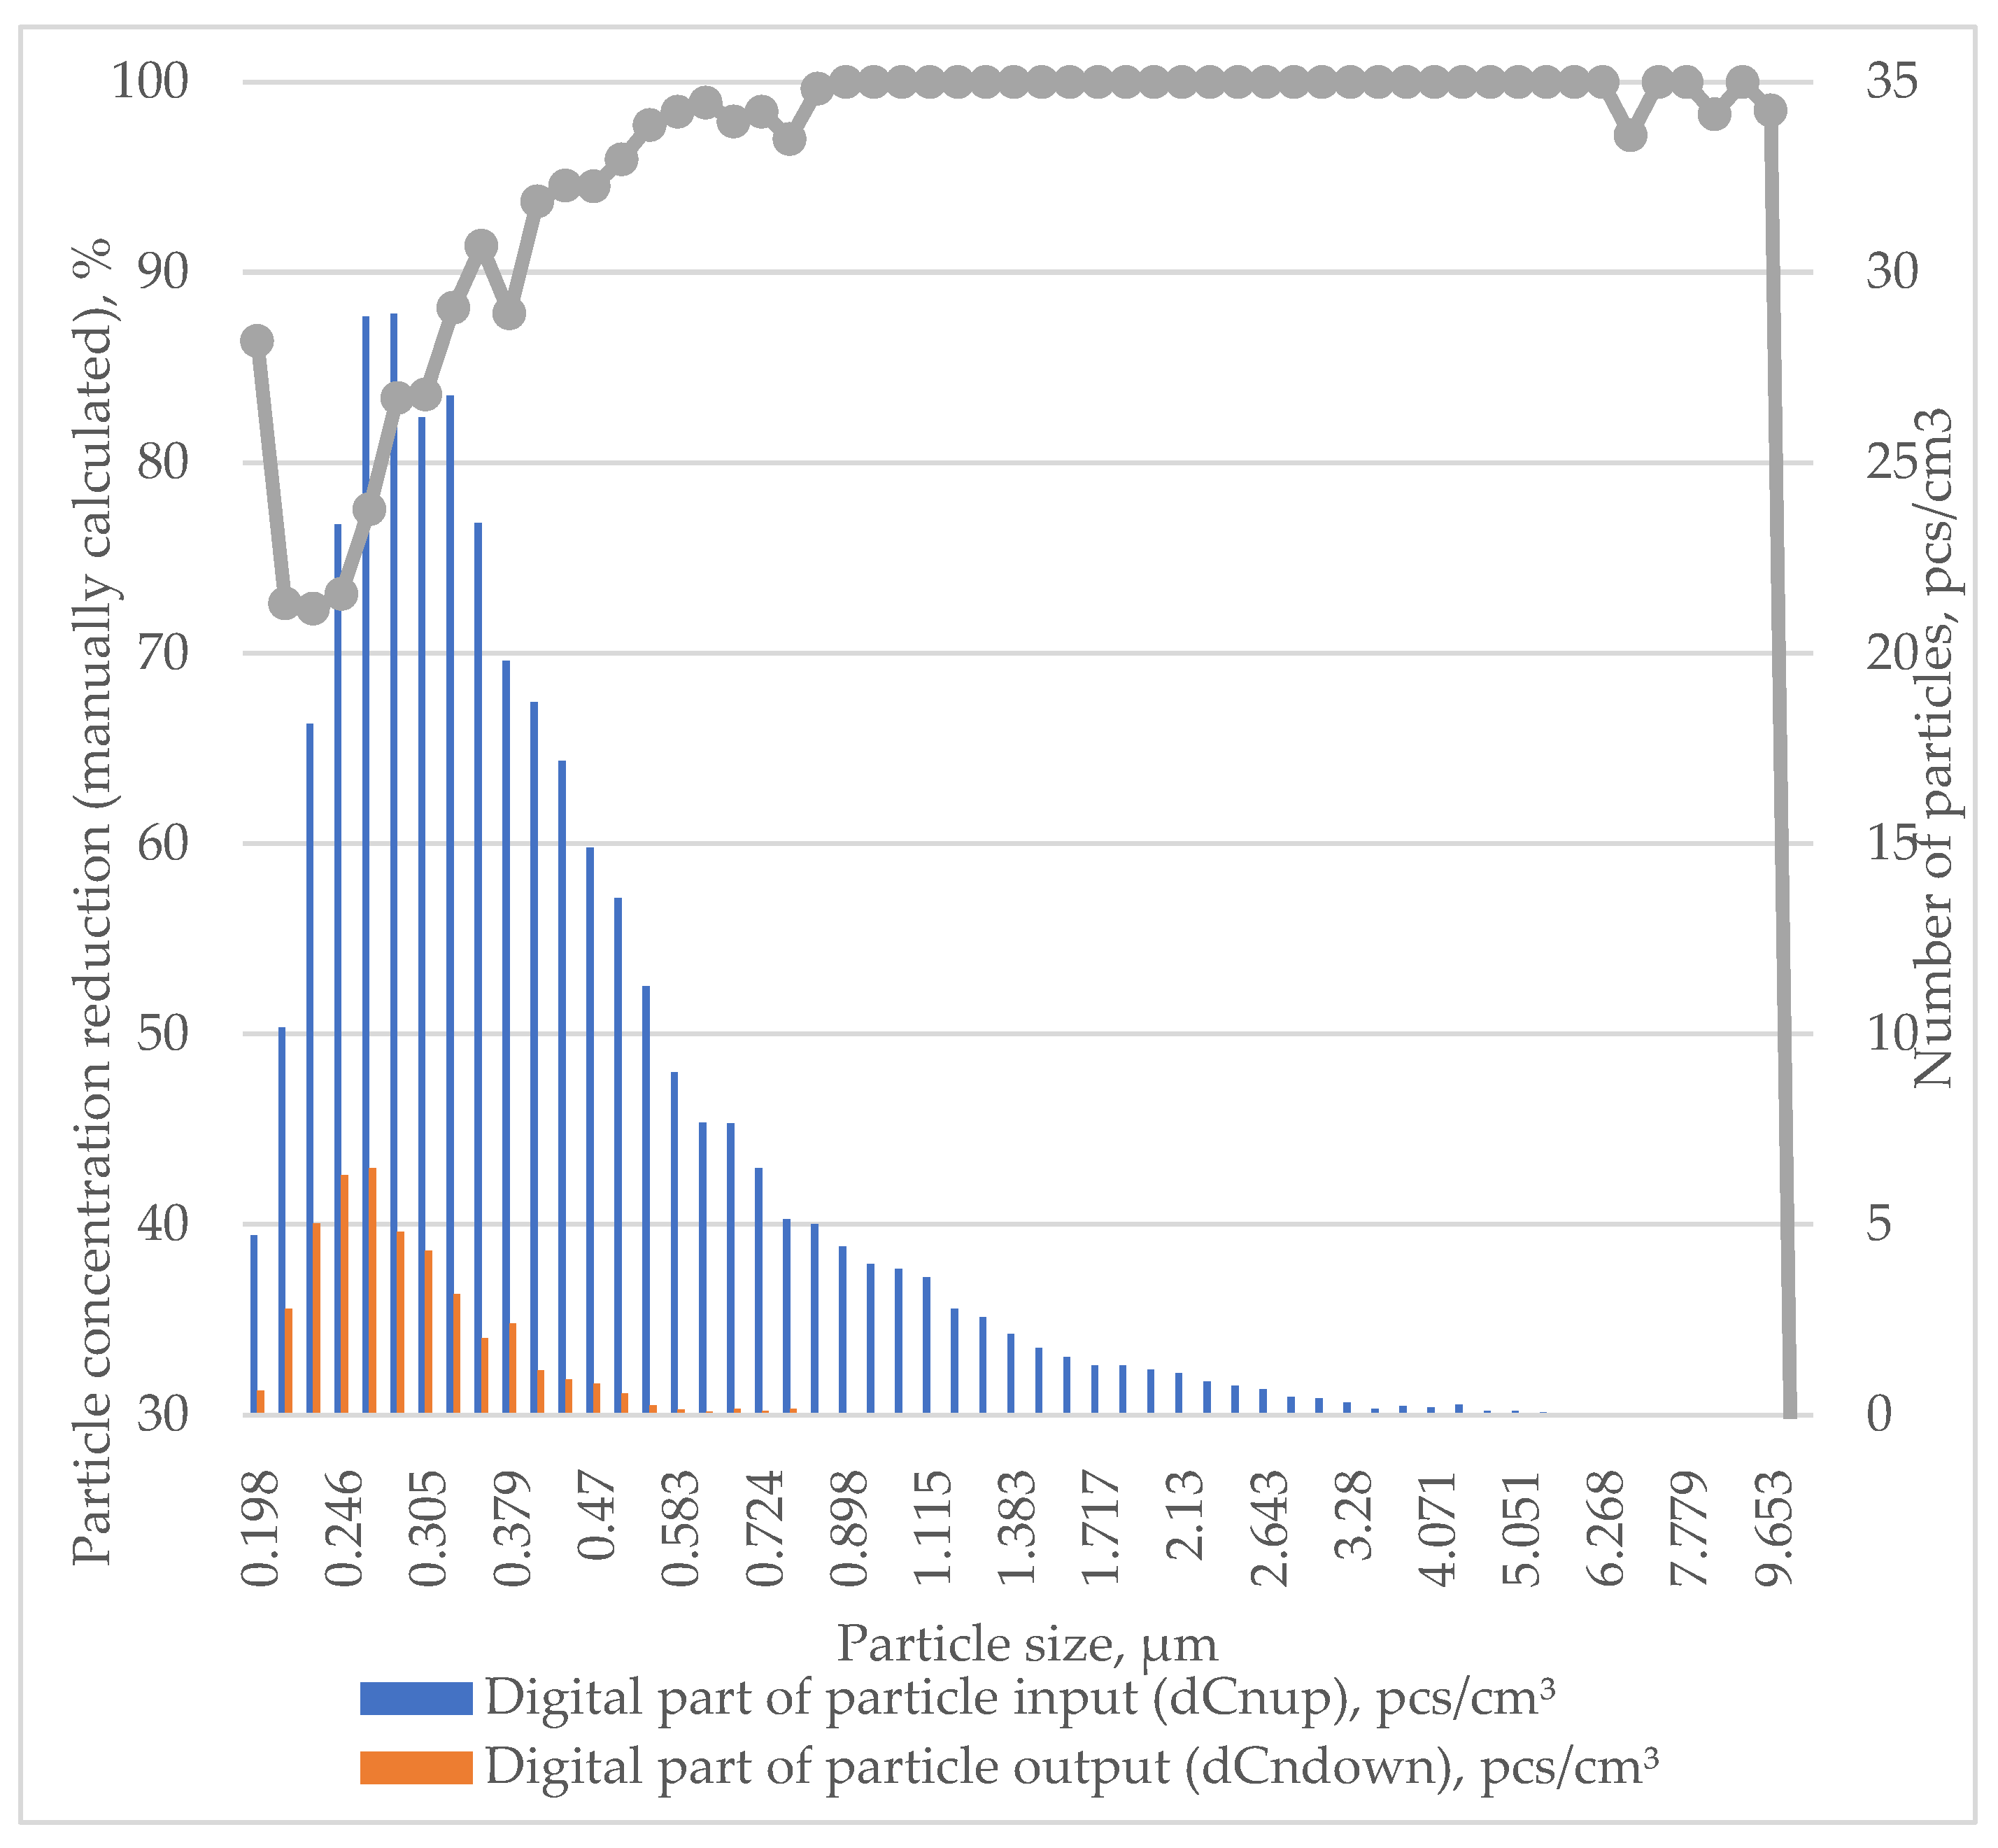
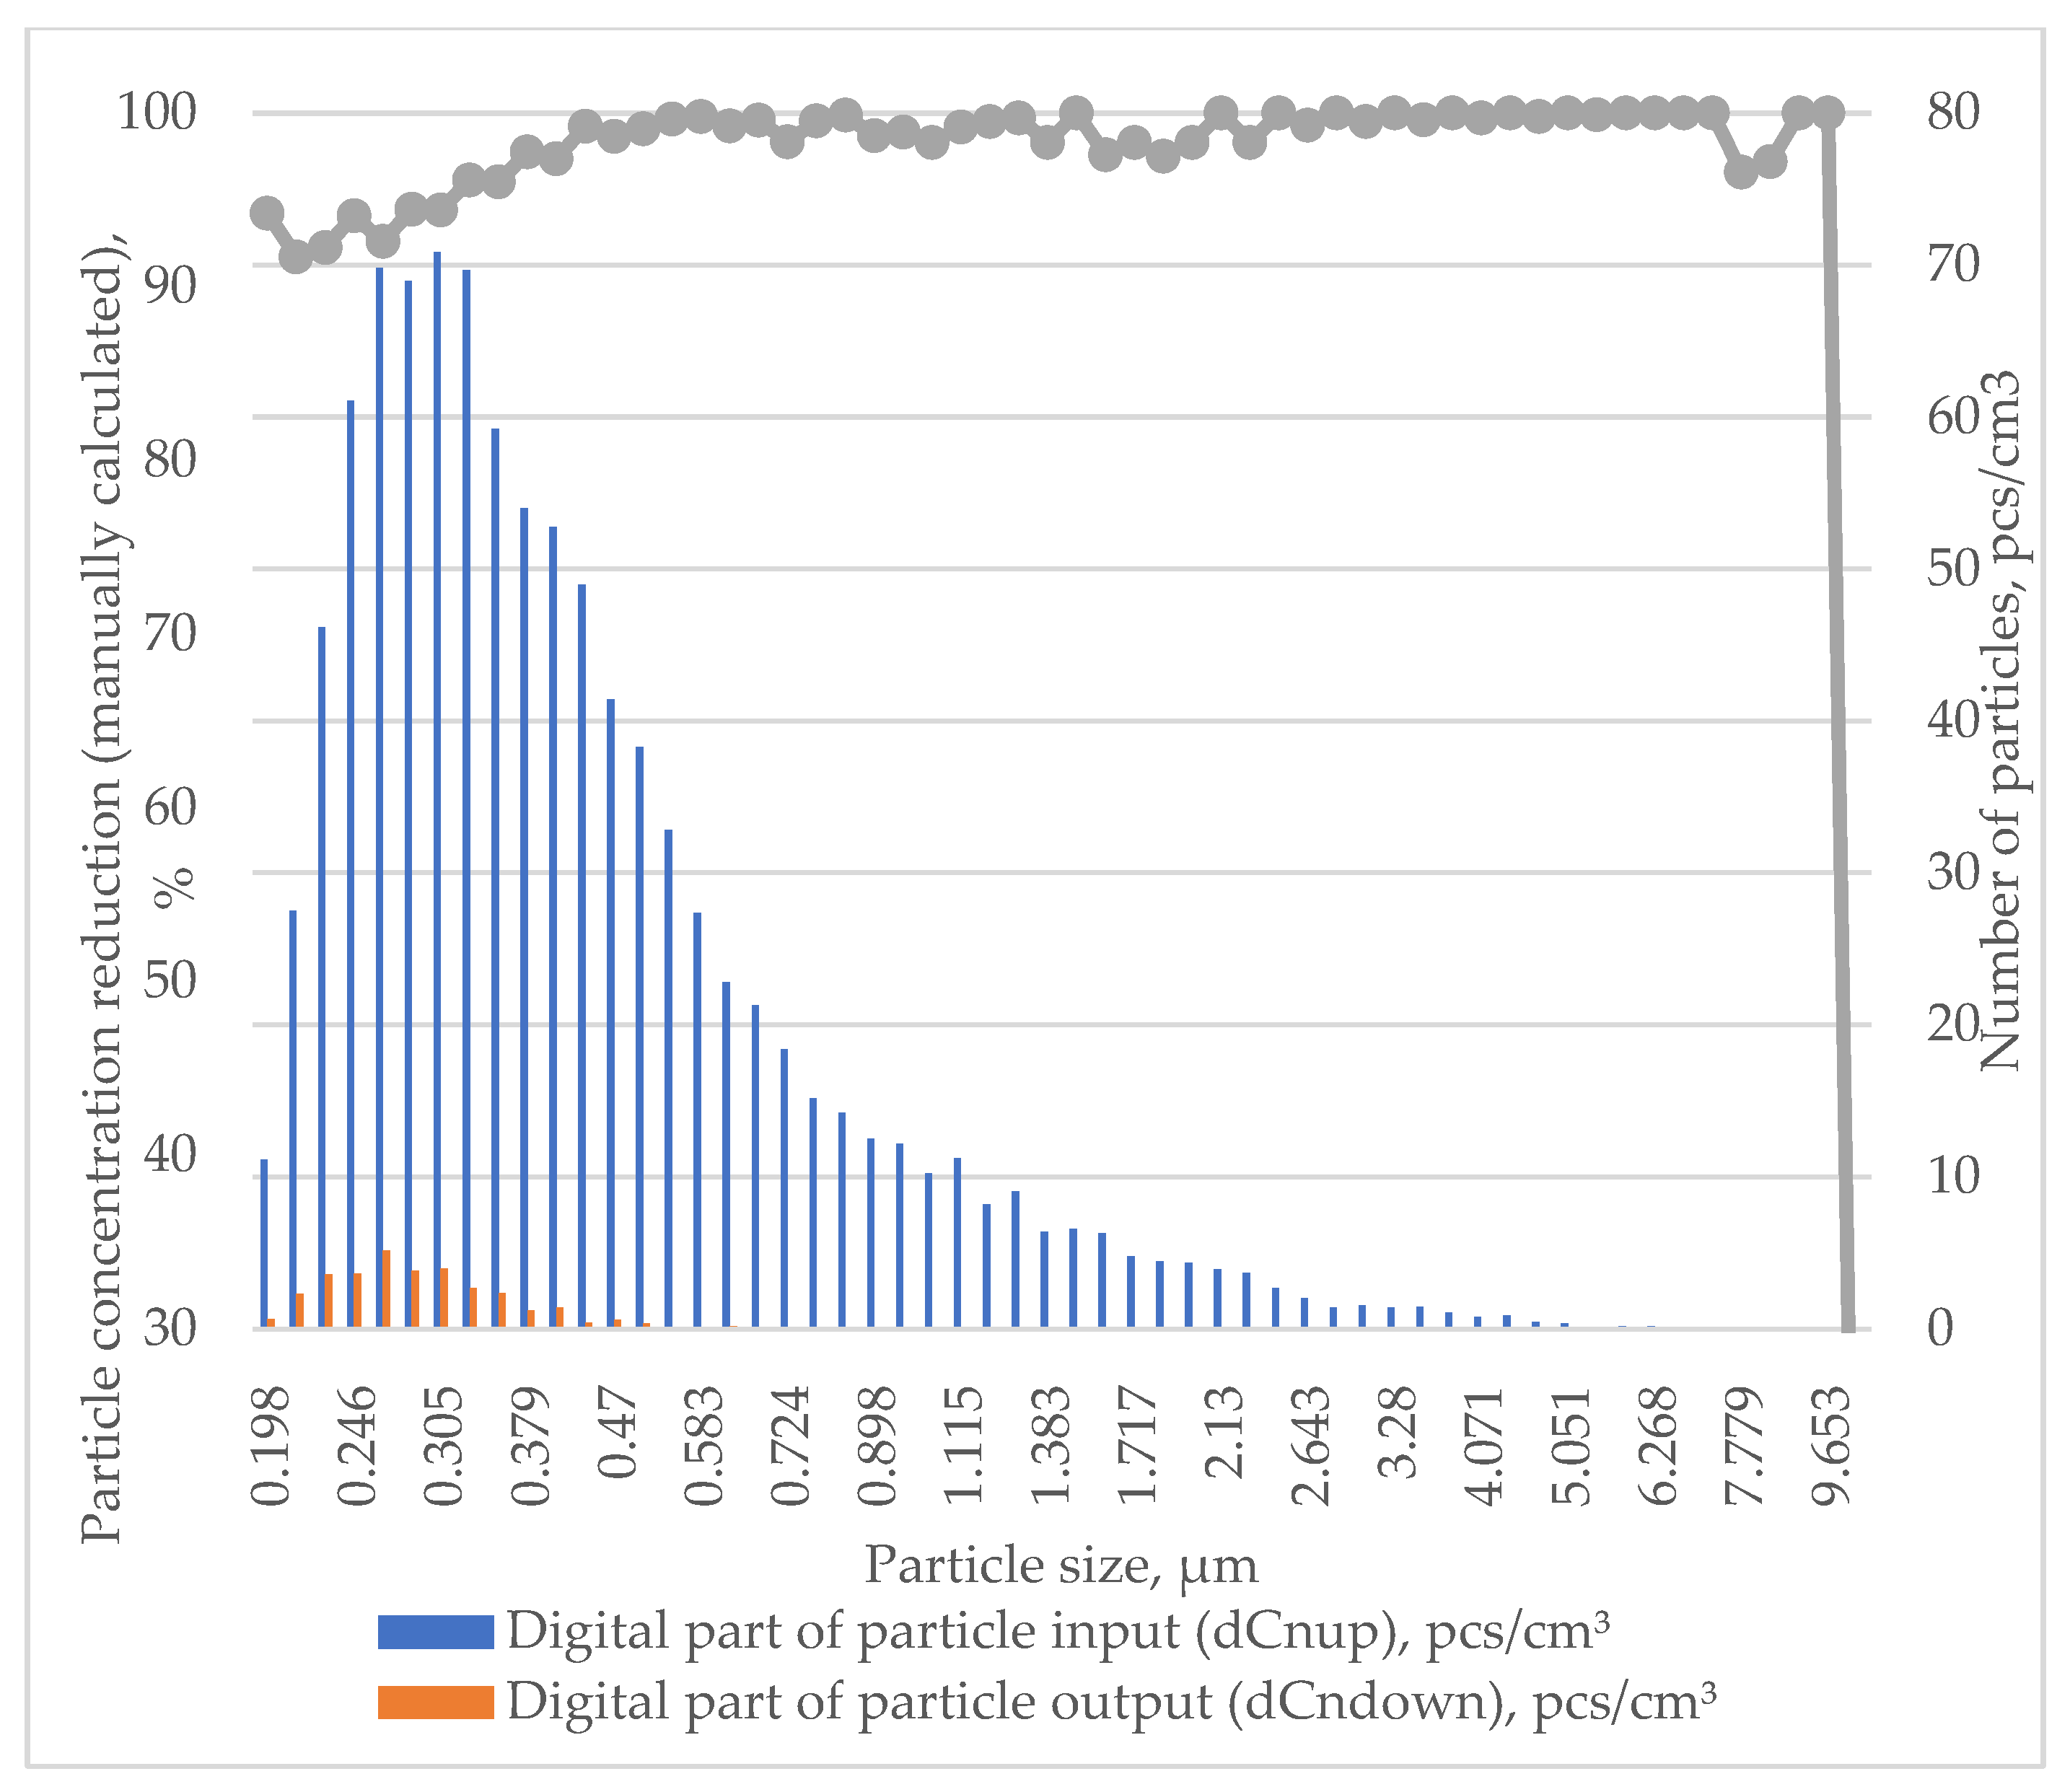
3. Results
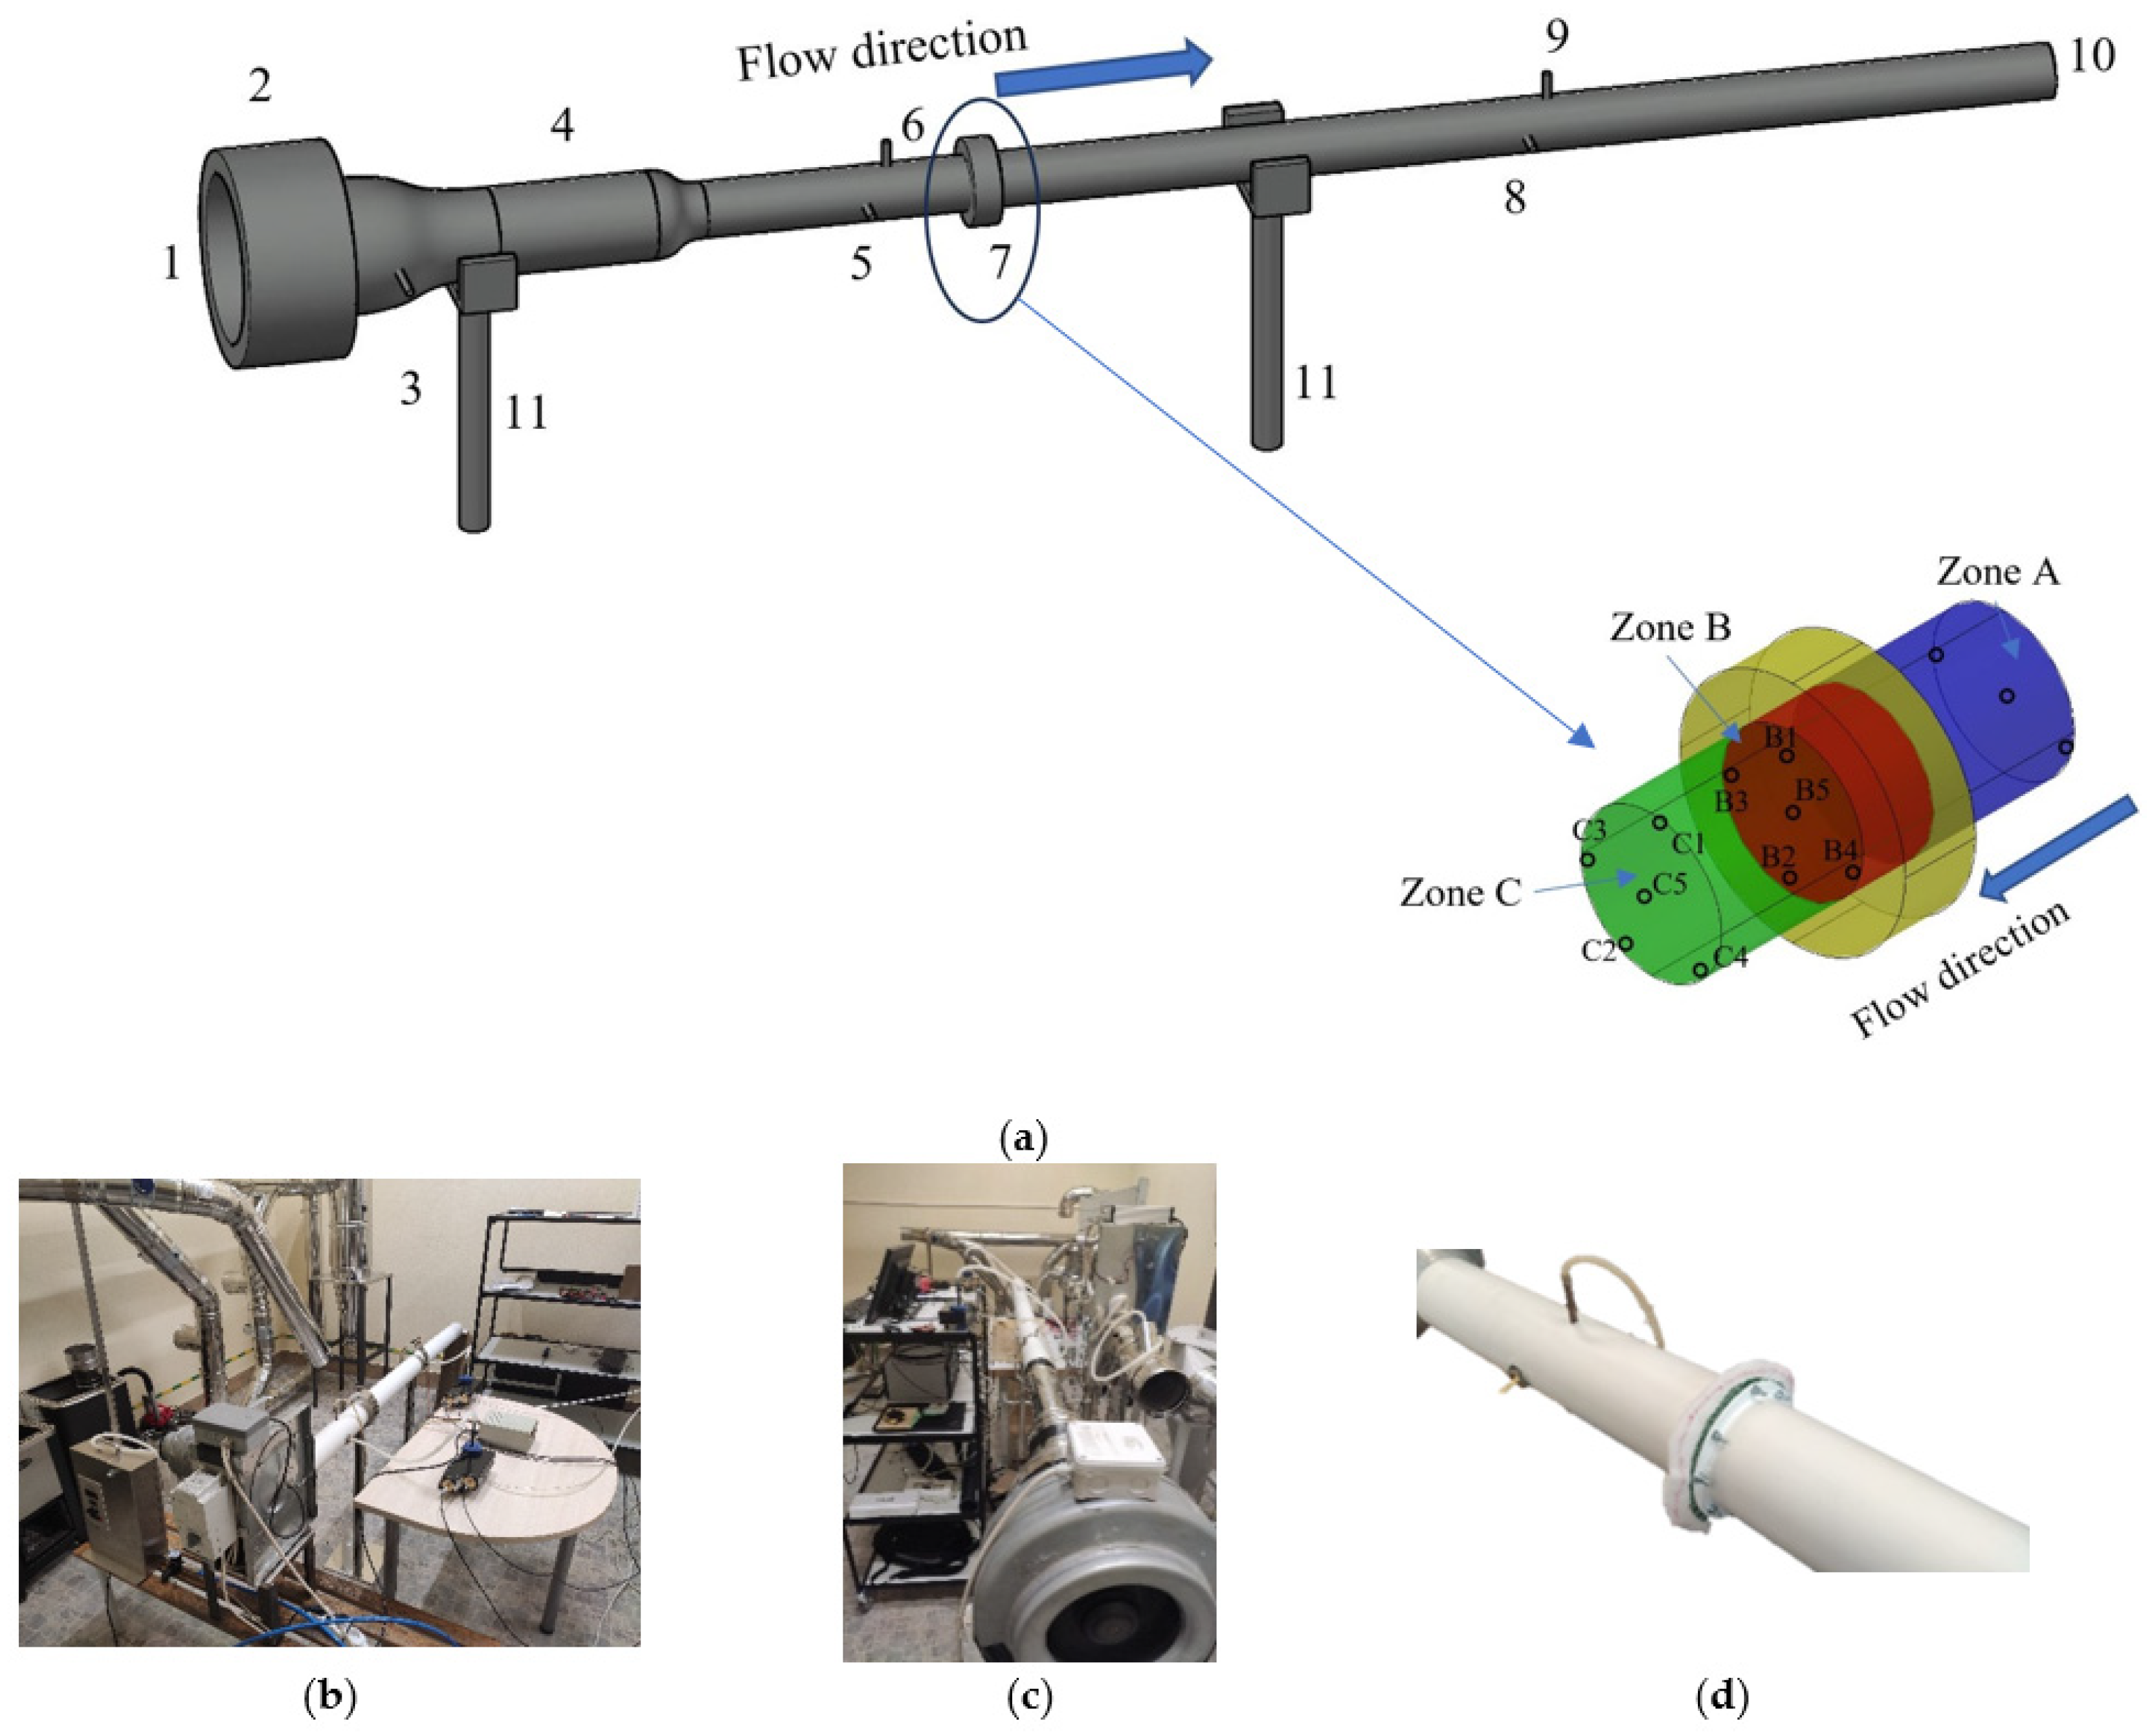
- (a)
- To see the penetration of the particle into the mycelium;
- (b)
- To see how quickly the particle adheres to the surface of the mycelium;
- (c)
- To understand the forces and magnitude of the interaction between the particle and the mycelium;
- (d)
- How fast the particle is moving and the velocities of the particle during the interaction;
- (e)
- Providing an example of a theoretical model to analyze the motion of a particle during its interaction with a mycelium material. In addition, being able to analyze the adhesion process.
3.1. Results of Numerical Experiment
3.2. Results of Physical Experiment
4. Discussion
5. Conclusions
Author Contributions
Funding
Data Availability Statement
Acknowledgments
Conflicts of Interest
References
- Girometta, C.; Picco, A.M.; Baiguera, R.M.; Dondi, D.; Babbini, S.; Cartabia, M.; Pellegrini, M.; Savino, E. Physico-Mechanical and Thermodynamic Properties of Mycelium-Based Biocomposites: A Review. Sustainability 2019, 11, 281. [Google Scholar] [CrossRef]
- Yang, L.; Park, D.; Qin, Z. Material Function of Mycelium-Based Bio-Composite: A Review. Front. Mater. 2021, 8, 737377. [Google Scholar] [CrossRef]
- Jones, M.P.; Huynh, T.; Dekiwadia, C.; Daver, F.; John, S. Mycelium Composites: A Review of Engineering Characteristics and Growth Kinetics. J. Bionanosci. 2017, 11, 241–257. [Google Scholar] [CrossRef]
- Sydor, M.; Bonenberg, A.; Doczekalska, B.; Cofta, G. Mycelium-Based Composites in Art, Architecture, and Interior Design: A Review. Polymers 2021, 14, 145. [Google Scholar] [CrossRef] [PubMed]
- Islam, M.R.; Tudryn, G.; Bucinell, R.; Schadler, L.; Picu, R.C. Morphology and Mechanics of Fungal Mycelium. Sci. Rep. 2017, 7, 13070. [Google Scholar] [CrossRef] [PubMed]
- Islam, M.R.; Tudryn, G.; Bucinell, R.; Schadler, L.; Picu, R.C. Mechanical Behavior of Mycelium-Based Particulate Composites. J. Mater. Sci. 2018, 53, 16371–16382. [Google Scholar] [CrossRef]
- Gou, L.; Li, S.; Yin, J.; Li, T.; Liu, X. Morphological and Physico-Mechanical Properties of Mycelium Biocomposites with Natural Reinforcement Particles. Constr. Build. Mater. 2021, 304, 124656. [Google Scholar] [CrossRef]
- Olivero, E.; Gawronska, E.; Manimuda, P.; Jivani, D.; Chaggan, F.Z.; Corey, Z.; de Almeida, T.S.; Kaplan-Bie, J.; McIntyre, G.; Wodo, O.; et al. Gradient Porous Structures of Mycelium: A Quantitative Structure–Mechanical Property Analysis. Sci. Rep. 2023, 13, 19285. [Google Scholar] [CrossRef] [PubMed]
- Lelivelt, R.J.J. The Mechanical Possibilities of Mycelium Materials. Master’s Thesis, Technische Universiteit Eindhoven, Eindhoven, The Netherlands, 2015. [Google Scholar]
- Elsacker, E.; De Laet, L.; Peeters, E. Functional Grading of Mycelium Materials with Inorganic Particles: The Effect of Nanoclay on the Biological, Chemical and Mechanical Properties. Biomimetics 2022, 7, 57. [Google Scholar] [CrossRef]
- Elsacker, E.; Vandelook, S.; Brancart, J.; Peeters, E.; Laet, L.D. Mechanical, Physical and Chemical Characterisation of Mycelium-Based Composites with Different Types of Lignocellulosic Substrates. PLoS ONE 2019, 14, e0213954. [Google Scholar] [CrossRef]
- Shakir, M.A.; Azahari, B.; Yusup, Y.; Yhaya, M.F.; Salehabadi, A.; Ahmad, M.I. Preparation and Characterization of Mycelium as a Bio-Matrix in Fabrication of Bio-Composite. J. Adv. Res. Fluid Mech. Therm. Sci. 2020, 65, 253–263. [Google Scholar]
- Houette, T.; Maurer, C.; Niewiarowski, R.; Gruber, P. Growth and Mechanical Characterization of Mycelium-Based Composites towards Future Bioremediation and Food Production in the Material Manufacturing Cycle. Biomimetics 2022, 7, 103. [Google Scholar] [CrossRef] [PubMed]
- He, J.; Cheng, C.; Su, D.; Zhong, M. Study on the Mechanical Properties of the Latex-Mycelium Composite. Appl. Mech. Mater. 2014, 507, 415–420. [Google Scholar] [CrossRef]
- Appels, F.V.W.; van den Brandhof, J.G.; Dijksterhuis, J.; de Kort, G.W.; Wösten, H.A.B. Fungal Mycelium Classified in Different Material Families Based on Glycerol Treatment. Commun. Biol. 2020, 3, 334. [Google Scholar] [CrossRef] [PubMed]
- Soh, E.; Saeidi, N.; Javadian, A.; Hebel, D.E.; Le Ferrand, H. Effect of Common Foods as Supplements for the Mycelium Growth of Ganoderma Lucidum and Pleurotus Ostreatus on Solid Substrates. PLoS ONE 2021, 16, e0260170. [Google Scholar] [CrossRef] [PubMed]
- Konda, A.; Prakash, A.; Moss, G.A.; Schmoldt, M.J.; Grant, G.D.; Guha, S. Aerosol Filtration Efficiency of Common Fabrics Used in Respiratory Cloth Masks. ACS Nano 2020, 14, 6339–6347. [Google Scholar] [CrossRef] [PubMed]
- Vandelook, S.; Elsacker, E.; Van Wylick, A.; De Laet, L.; Peeters, E. Current State and Future Prospects of Pure Mycelium Materials. Fungal Biol. Biotechnol. 2021, 8, 20. [Google Scholar] [CrossRef]
- Karana, E.; Blauwhoff, D.; Hultink, E.-J.; Camere, S. When the Material Grows: A Case Study on Designing (with) Mycelium-Based Materials. Int. J. Des. 2018, 2, 119–136. [Google Scholar]
- Haneef, M.; Ceseracciu, L.; Canale, C.; Bayer, I.S.; Heredia-Guerrero, J.A.; Athanassiou, A. Advanced Materials From Fungal Mycelium: Fabrication and Tuning of Physical Properties. Sci. Rep. 2017, 7, 41292. [Google Scholar] [CrossRef] [PubMed]
- Dziubak, T.; Szwedkowicz, S. Operating Properties of Non-Woven Fabric Panel Filters for Internal Combustion Engine Inlet Air in Single and Two-Stage Filtration Systems. Eksploat. Niezawodn. 2015, 17, 519–527. [Google Scholar] [CrossRef]
- Gricius, A.; Matelis, A. Mycota Lithuaniae VI. Aphyllophorales 2.—Hymenochaetaceae, Fistulinaceae, Ganodermataceae, Polyporaceae; Mokslo ir Enciklopediju Leidykla: Vilnius, Lithuania, 1996. [Google Scholar]
- Pohl, C.; Schmidt, B.; Nunez Guitar, T.; Klemm, S.; Gusovius, H.-J.; Platzk, S.; Kruggel-Emden, H.; Klunker, A.; Völlmecke, C.; Fleck, C.; et al. Establishment of the Basidiomycete Fomes Fomentarius for the Production of Composite Materials. Fungal Biol. Biotechnol. 2022, 9, 4. [Google Scholar] [CrossRef] [PubMed]
- Vaišis, V.; Chlebnikovas, A.; Jasevičius, R. Numerical Study of the Flow of Pollutants during Air Purification, Taking into Account the Use of Eco-Friendly Material for the Filter—Mycelium. Appl. Sci. 2023, 13, 1703. [Google Scholar] [CrossRef]
- Chlebnikovas, A.; Jasevičius, R. Investigation of the Interaction of Particulate Matter and Its Separation from the Gas Flow in a Multi-Channel Cyclone with Recirculation. Granul. Matter 2022, 24, 98. [Google Scholar] [CrossRef]
- Chlebnikovas, A.; Jasevičius, R. Air Pollution with Fine Particles in Closed Parking and Theoretical Studies of the Interaction of Inhaled Particles in Respiratory Tract. Buildings 2022, 12, 1696. [Google Scholar] [CrossRef]
- Appels, F.V.W.; Dijksterhuis, J.; Lukasiewicz, C.E.; Jansen, K.M.B.; Wösten, H.A.B.; Krijgsheld, P. Hydrophobin Gene Deletion and Environmental Growth Conditions Impact Mechanical Properties of Mycelium by Affecting the Density of the Material. Sci. Rep. 2018, 8, 4703. [Google Scholar] [CrossRef]


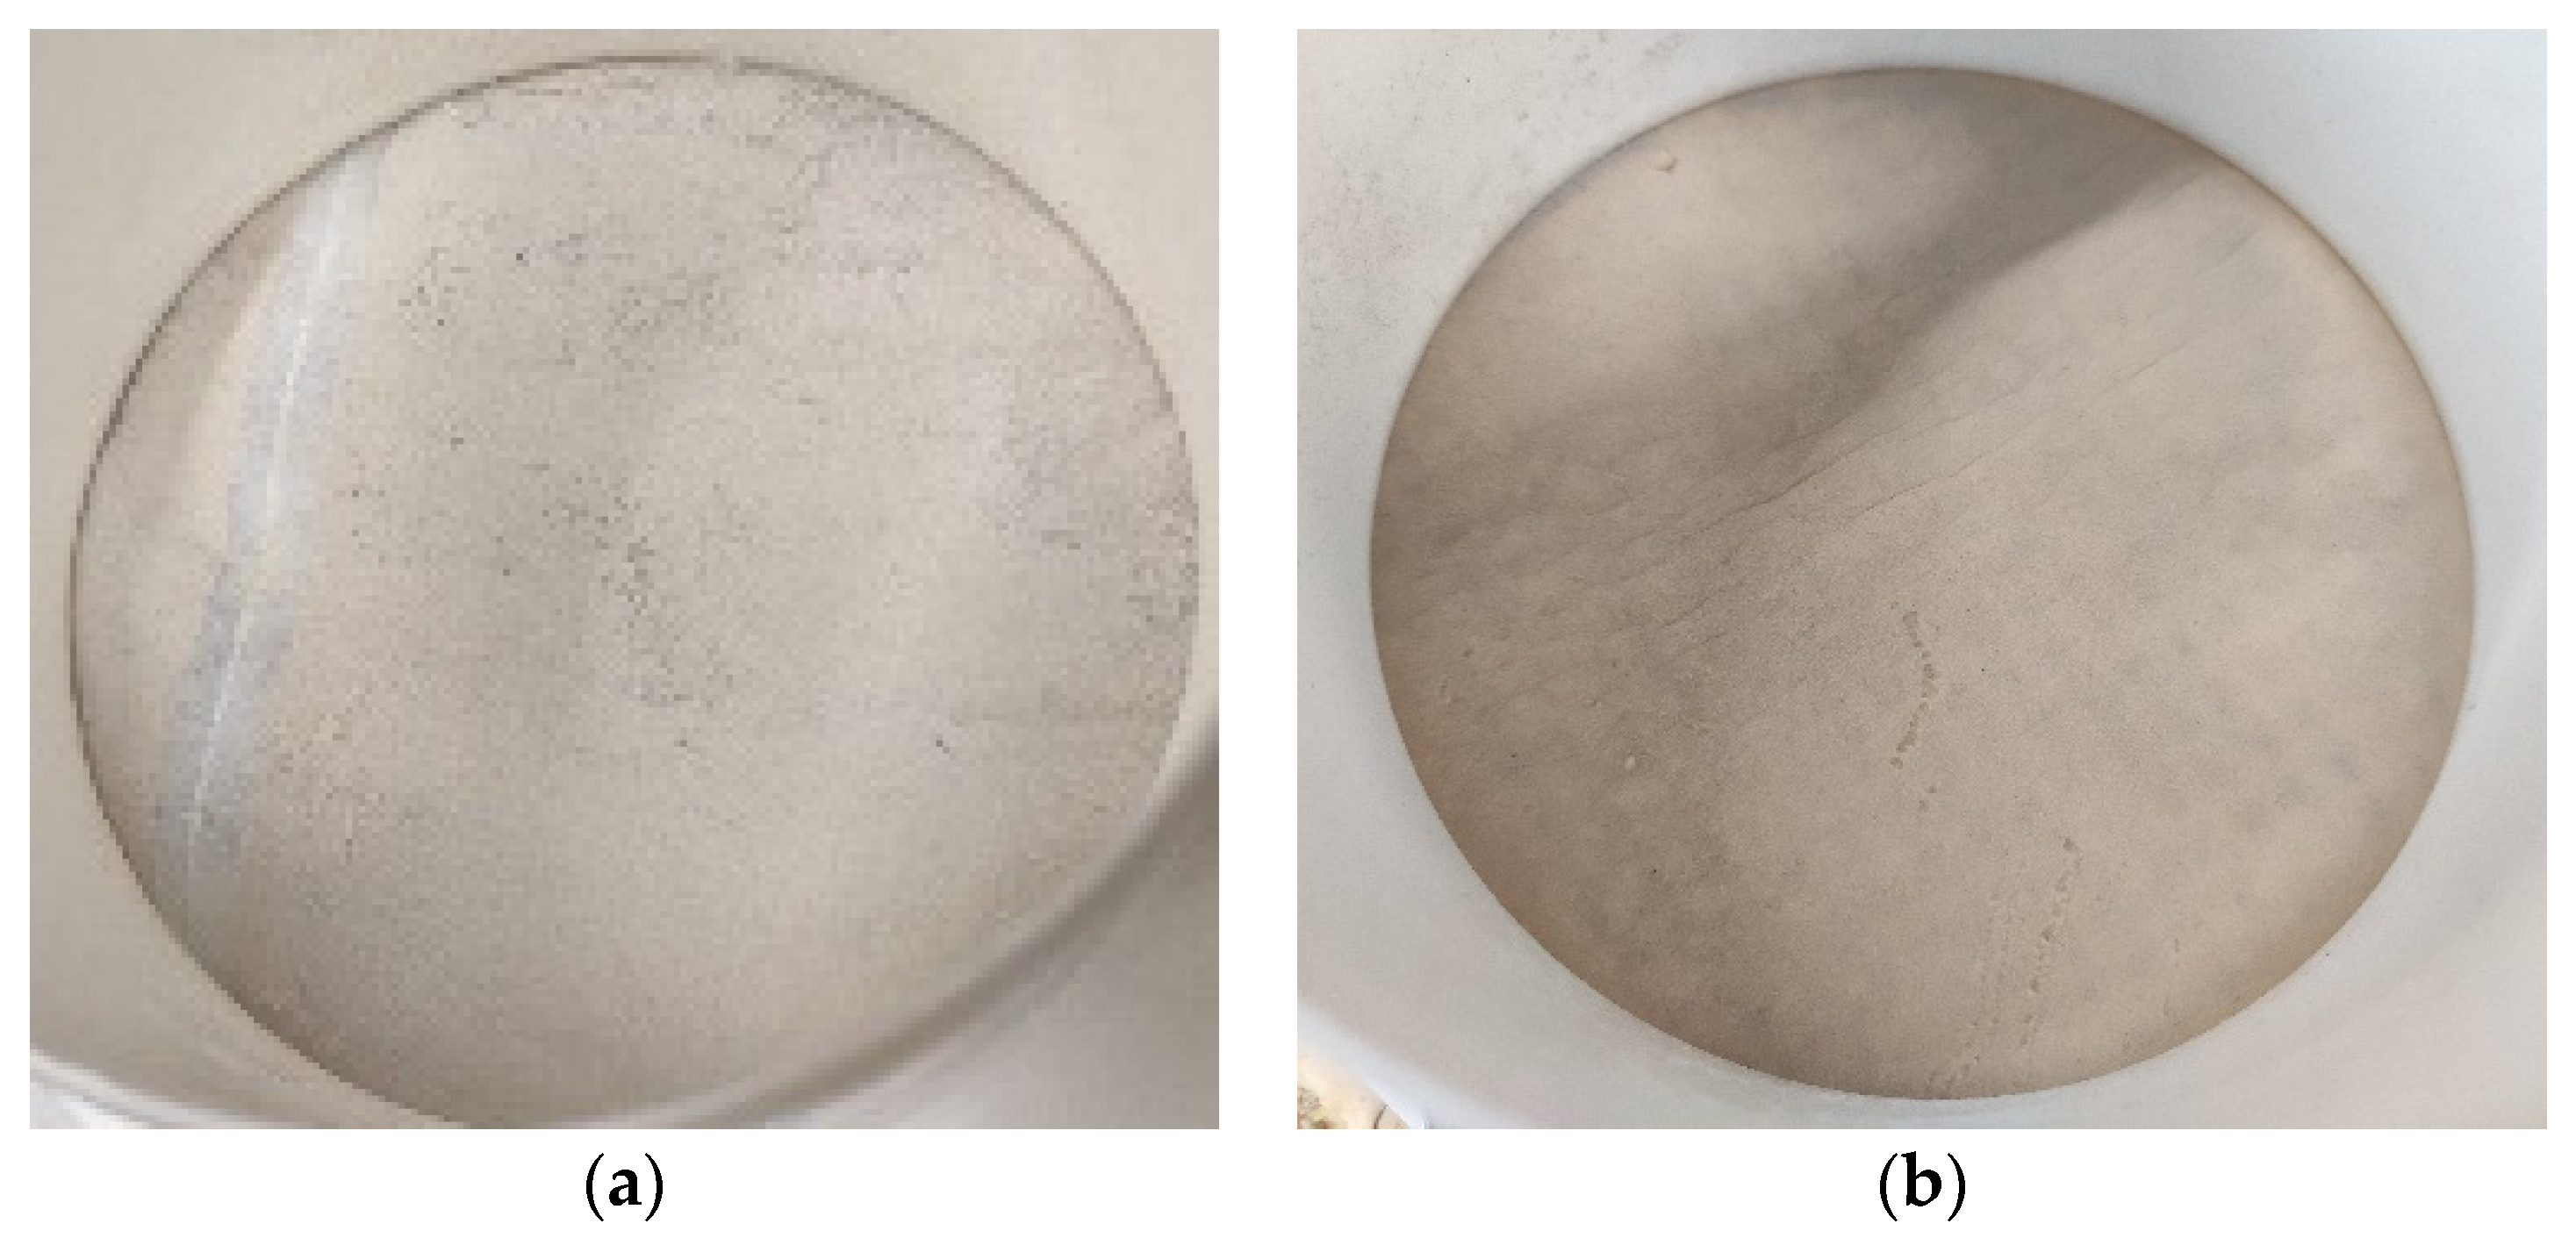
| Filter Base | Material | Density Porous/Nonporous, kg/m3 | Open Porosity | Additional Features |
|---|---|---|---|---|
| Mycelium, 3 weeks | mycelium + fiberglass base | 98.4/196.9 | 0.48 | Visual transparency 40% |
| Mycelium, 4 weeks | 49.4/98.7 | 0.49 | Visual transparency 25% | |
| Mycelium, 5 weeks | 56.9/81.2 | 0.31 | Visual transparency 10% | |
| Synthetic material—comparative filter | polyester, 100% | 25 | 0.88 | Pressure drop limit 450 Pa; for PM10, not less than 50% efficiency |
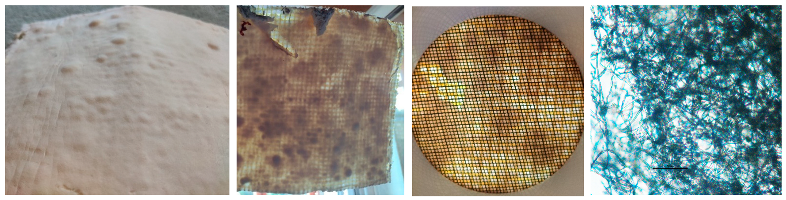
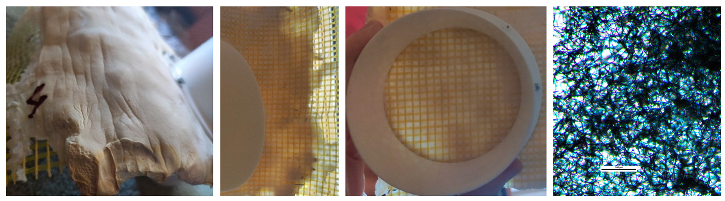
| Filtration Filler |
|---|
| Surface view, Visibility test, Mounted filler in the filter flange connection, Macro view with division length of 50 µm |
| Mycelium, 3-week-old cultivation |
 |
| Mycelium, 4-week-old cultivation |
 |
| Mycelium, 5-week-old cultivation |
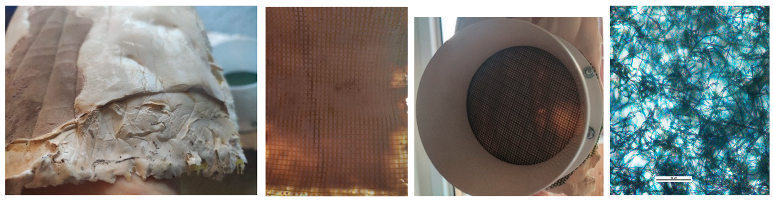 |
| Synthetic polyester filter material |
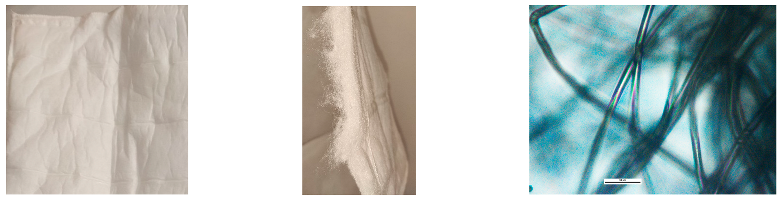 |
| Parameter | Glass PM |
|---|---|
| Skeletal density of the sample, kg/m3 | 680–700 |
| Density of the saturated sample, kg/m3 | 2300–2350 |
| Total porosity | 0.0016–0.0018 |
| Overall density, kg/m3 | 2450–2500 |
| Bulk density, kg/m3 | 1500–1550 |
| 10th percentile of particle diameter, μm | 2.6–2.7 |
| 50th percentile of particle diameter, μm | 9.1–9.3 |
| 90th percentile of particle diameter, μm | 18.5–18.7 |
| Mean diameter, μm | 9.8–10.1 |
| Microscopic view, magnification ×20, division length is 10 µm | 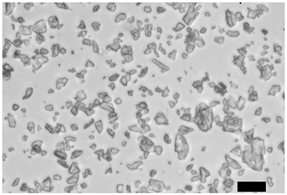 |
| Objects | Initial Parameters | Values | References, Source |
|---|---|---|---|
| Glass particle (pollution) | Diameter, | - | |
| Radius, | - | ||
| Initial interaction distance, | Chlebnikovas and Jasevičius [25] | ||
| Initial normal velocity, | 0.7 m/s | - | |
| mass, | ≈ (picograms) | - | |
| Density, | ≈ | Chlebnikovas and Jasevičius [25,26] | |
| Young’s modulus, | Chlebnikovas and Jasevičius [25,26] | ||
| Poisson’s ratio, | 0.27 | Chlebnikovas and Jasevičius [25,26] | |
| Mycelium | Density, | 680 | Vaišis et al. and Appels et al. [24,27] |
| Young’s modulus, | Vaišis et al. and Appels et al. [24,27] | ||
| Poisson ratio, | Vaišis et al. and Appels et al. [24,27] | ||
| Simulation | Time step | (picoseconds) | - |
| Fan Lever, Hz (% of Nominal Flow Rate) | I (15%) | II (25%) | III (50%) | IV (75%) | V (85%) | VI (100%) |
|---|---|---|---|---|---|---|
| Air velocity after all ducts, point 9 (Figure 1a), m/s | 0.50–0.51–0.56 | 0.54–0.56–0.57 | 0.57–0.59–0.61 | 0.58–0.63–0.64 | 0.60–0.64–0.66 | 0.61–0.64–0.66 |
| Resistance/Static pressure upstream of filter, Pa | 231–233 | 240–242 | 260–262 | 275–277 | 288–290 | 295–297 |
| Air Source Frequency, Hz (Nominal 50 Hz) | Air Flow Rate into the Duct Zone, m/s | Aerodynamic Resistance/Static Pressure before the Filter, Pa | ||
|---|---|---|---|---|
| Just after the Fan, in an Open Duct, Point 6 (Figure 1a) Min-Avg1-Avg2-Max | Just after the Filter, Zone B, Point 7, Open Duct (Figure 1a) | after All Ducts, Zone C, Open Duct (Figure 1a, Point 9), Min-Vid.1-Vid.2-Max | ||
| 50 | 11.7–12.5–12.7–12.8 | 0.73 | 0.60–0.63–0.65–0.66 | 288–290 |
| 45 | 9.2–9.7–10.2–10.07 | 0.42 | 0.38–0.39–0.41–0.42 | 175–177 |
| 40 | 8.63–9.27–9.88–10.07 | 0.42 | 0.38–0.39–0.41–0.42 | 175–177 |
| Measuring Zone | Point B1 | Point B2 | Point B3 | Point B4 | Point B5 |
|---|---|---|---|---|---|
| Just after the filter, near the filter surface, Zone B | 0.17 | 0.28 | 0.18 | 0.26 | 0.19 |
| Just after the filter, open opening, Zone C | 0.17–0.20 | 0.18–0.26 | 0.22–0.24 | 0.17–0.21 | 0.15–0.19 |
| Air Source Frequency/Flow Amount/Load (%) | 10.02/270/17 19.98/540/33 25.00/670/42 | 30.06/800/50 | 35.04/930/58 | 40.02/1070/67 | 45.0/1200/75 | 50.0/1330/83 | 55.0/1470/92 | 60/1600/100 | |
|---|---|---|---|---|---|---|---|---|---|
| Just after the filter, open opening, Zone C | ≤0.03 * | 0.06 | 0.09 | 0.16 | 0.24 | 0.27 | 0.33 | 0.45 | |
| Just after the filter, near the filter surface, Zone B | B1 | ≤0.03 * | 0.18–0.19 | 0.22 | 0.31 | 0.41 | 0.47 | 0.52 | 0.68–0.69 |
| B2 | 0.11 | 0.17 | 0.23 | 0.31 | 0.43 | 0.42 | 0.45 | ||
| B3 | 0.13 | 0.16 | 0.23 | 0.32 | 0.42 | 0.44 | 0.48 | ||
| B4 | 0.14 | 0.19 | 0.23 | 0.32 | 0.42 | 0.43 | 0.48 | ||
| B5 | 0.07 | 0.12 | 0.18–0.19 | 0.21 | 0.28 | 0.31 | 0.47 | ||
| After all ducts, Zone C, open duct (Figure 1a, Point 9) | ≤0.03 */≤0.03 *–0.04/0.05–0.08 | 0.14 | 0.20 | 0.24 | 0.30–0.31 | 0.32–0.35 | 0.40–0.41 | 0.44–0.46 | |
| Aerodynamic resistance, Pa | -/96/147 | 204 | 274 | 353 | 438 | 533 | 635 | 743 | |
| Air Source Frequency/Flow Amount/Load (%) | 10.02/270/17 19.98/540/33 25.00/670/42 | 30.06/800/50 | 35.04/930/58 | 40.02/1070/67 | 45.0/1200/75 | 50.0/1330/83 | 55.0/1470/92 | 60/1600/100 | |
|---|---|---|---|---|---|---|---|---|---|
| Just after the filter, open opening, Zone C | ≤0.03 * | 0.05–0.08 | 0.11 | 0.16–0.18 | 0.20–0.21 | 0.25–0.26 | 0.30 | 0.35 | |
| Just after the filter, near the filter surface, Zone B | B1 | ≤0.03 * | 0.24 | 0.32 | 0.38 | 0.39 | 0.47 | 0.64 | 0.24 |
| B2 | 0.17 | 0.20 | 0.23 | 0.28 | 0.32 | 0.39–0.44 | 0.17 | ||
| B3 | 0.17 | 0.19 | 0.23 | 0.31 | 0.31 | 0.34–0.35 | 0.17 | ||
| B4 | 0.16 | 0.18 | 0.23 | 0.31 | 0.31 | 0.46 | 0.16 | ||
| B5 | 0.16 | 0.18 | 0.23 | 0.28 | 0.37 | 0.36 | 0.16 | ||
| After all ducts, Zone C, open duct (Figure 1a, Point 9) | ≤0.03 * | 0.17 | 0.21 | 0.24 | 0.27 | 0.32 | 0.35 | ||
| Aerodynamic resistance, Pa | - | 170 | 260 | 338 | 425 | 523 | 625 | 735 | |
Disclaimer/Publisher’s Note: The statements, opinions and data contained in all publications are solely those of the individual author(s) and contributor(s) and not of MDPI and/or the editor(s). MDPI and/or the editor(s) disclaim responsibility for any injury to people or property resulting from any ideas, methods, instructions or products referred to in the content. |
© 2024 by the authors. Licensee MDPI, Basel, Switzerland. This article is an open access article distributed under the terms and conditions of the Creative Commons Attribution (CC BY) license (https://creativecommons.org/licenses/by/4.0/).
Share and Cite
Chlebnikovas, A.; Gavenauskas, M.; Motiejūnaitė, J.; Jasevičius, R.; Vaišis, V. Investigation of the Use of Mycelial Filler with Different Cultivation Times for the Filtration of Particulate Airflow. Processes 2024, 12, 1545. https://doi.org/10.3390/pr12081545
Chlebnikovas A, Gavenauskas M, Motiejūnaitė J, Jasevičius R, Vaišis V. Investigation of the Use of Mycelial Filler with Different Cultivation Times for the Filtration of Particulate Airflow. Processes. 2024; 12(8):1545. https://doi.org/10.3390/pr12081545
Chicago/Turabian StyleChlebnikovas, Aleksandras, Matas Gavenauskas, Jurga Motiejūnaitė, Raimondas Jasevičius, and Vaidotas Vaišis. 2024. "Investigation of the Use of Mycelial Filler with Different Cultivation Times for the Filtration of Particulate Airflow" Processes 12, no. 8: 1545. https://doi.org/10.3390/pr12081545