Article

Mathematical Modelling of Drying of Hydrogels via Finite Element Method and Texture Analysis

by
Marco Antônio Vasiliev da Silva, Júnior
,
Gabriela Feltre
and
Gustavo Cesar Dacanal
*
Department of Food Engineering, Faculdade de Zootecnia e Engenharia de Alimentos, Universidade de São Paulo, Pirassununga 13635-900, SP, Brazil
*
Author to whom correspondence should be addressed.
Processes 2024, 12(8), 1564; https://doi.org/10.3390/pr12081564
Submission received: 5 July 2024 / Revised: 21 July 2024 / Accepted: 22 July 2024 / Published: 26 July 2024
(This article belongs to the Special Issue Advanced Drying Technologies in Food Processing)

Abstract

:
Hydrogels are polymeric materials with specific mechanical handling and encapsulation properties. Despite their widespread application, the modelling of the drying behaviour of hydrogels, particularly the evolution of texture stiffness with moisture loss, requires further development. This work aimed to develop numerical models to predict the moisture and deformation of cornstarch–alginate hydrogels under convective drying at 60 °C and 0.5 m/s. Cylindrical solids were used, and a transient three-dimensional FEM model predicted drying profiles via diffusion–convection mass transport. Texture analysis evaluating the hyperelastic coefficients of the hydrogels was performed for moisture contents ranging from 0.91 to 0.55 kg∙kg−1 w.b., yielding Young’s modulus values from 24 to 147 kPa. A dimensionless relationship between the moisture ratio and elastic modulus produced a stiffness coefficient, used to adjust the moving boundary velocity and predict volumetric deformation. The model fitting returned an R2 higher than 0.95 and an RMSE lower than 0.04. The FEM model simulated hydrogel shrinkage by assessing the molar flux of water and mesh deformation at the boundaries, with mass diffusivity ranging from 2.38 to 5.46 × 10⁻¹⁰ m2∙s−1. Shrinkage reduced the surface area of solids during drying, revealing a pseudo-constant rate period in the drying profiles. The developed models effectively describe the drying of food materials with high shrinkage ratios.

1. Introduction

Hydrogels are polymeric materials with a three-dimensional network structure. When dispersed in an aqueous medium, they can swell without dissolving [1]. The main uses of hydrogels are in the controlled delivery and release of compounds due to their biocompatibility and their ability to easily disperse within the matrices in which they are incorporated [2]. The properties of hydrogels depend on the physicochemical characteristics of the polymers in their composition and external conditions [3]. The main polymers used in the formulation of hydrogels are sodium alginate, pectin, chitosan, and gelan gum. Combinations of two or more polymers have also been increasingly used in the production of hydrogels, with the aim of improving their properties, depending on the desired purpose.
Sodium alginate is an anionic polymer extracted from brown algae, composed of monomers α-L-guluronic acid (G) and (1–4)-linked β-mannuronic acid (M) [4]. The formation of the three-dimensional structure known as the “egg box” model occurs when the G blocks of alginate connect with cations such as Ca2+ and Mg2+ [5]. Sodium alginate is widely used as a wall material in the microencapsulation of compounds [6,7] and as a dietary supplement [8,9] due to its gelling properties, high biocompatibility, and biodegradability.
Alginate hydrogels and combinations of alginate and starch have been used for the microencapsulation of several compounds, with the aim of protecting them against external factors such as high temperature or oxidation [10,11,12,13]. The use of starch combined with alginate can alter the hydrogel structure, causing the encapsulated compound to be released more slowly [14]. In addition, protection against lipid oxidation increases for wheat germ oil when a certain amount of corn starch is used in alginate hydrogels [15].
The drying of hydrogels is undertaken in the food, pharmaceutical, and cosmetics industries to reduce water content and obtain solid products with proper mechanical handling and encapsulation properties [16,17]. The study of hydrogel drying is important because it allows the determination of several properties of the material [18]. During the process of removing water from the product, there is shrinkage, which is the decrease in the volume of the product. This phenomenon usually implies the formation of mechanical stresses and may generate a low-quality product [19,20]. The study of shrinkage in products should involve mechanical laws and consider the stresses and deformations of the material during drying [21].
The drying of hydrogels requires the study of shrinkage effects and mechanical properties in relation to moisture reduction. The mass transport phenomena can change with the solid matrix packing, and the drying rate reduces with increasing solid density. Texture properties are useful in better explaining the Hookean or hyperplastic behaviour of polymers and how their properties are affected by moisture and temperature [22].
The mathematical modelling of drying is suitable for explaining transport phenomena in relation to the main operation parameters of hydrogels and optimising the process steps with a reduction in the number of experiments. This work aimed to develop numerical models using the finite element method applied to the convective drying of hyperelastic materials. The FEM was combined with correlations of texture profiles, and allowed the description of the convective drying of sodium alginate and corn starch hydrogels, resulting in the proper prediction of solid shrinkage.

2. Materials and Methods

2.1. Material

The gels were produced from formulations containing native cornstarch and sodium alginate. Cornstarch (Ingredion Brazil, Mogi Guaçu, Brazil) with an initial moisture of 12.8 ± 2 g/100 g was used as a filling material for the gels. Sodium alginate (Protanal VK14, FMC Biopolymer, Campinas, Brazil) was dissolved in water at a concentration of 5% w/w. An aqueous solution of CaCl2 (Sigma-Aldrich, São Paulo, Brazil) 1% w/w was used for the ionic gelling of starch–alginate suspensions. Absolute ethanol (Dinâmica, Indaiatuba, Brazil) was used as a surfactant to disperse sodium alginate powder in distilled water.

2.2. Preparation of Starch–Alginate Suspensions and Ionic Gelling Material

The preparation of hydrogel samples was adapted from a previous study [23], where suspensions containing corn starch were obtained in fractions of 50% (RC50 and GC50) and 90% (RC90 and GC90), as shown in Table 1. The powdered alginate fractions were dispersed in surfactant ethanol, and water and corn starch were subsequently added.
The starch–alginate suspensions were packed in cylindrical PVC tubes 27.8 mm in diameter and submerged in a calcium chloride solution at 1% for 24 h. GC50 and GC90 samples were heated to 80 °C for 60 min, producing samples with gelatinized starch. The gels were cut into short cylinders about 25 mm high, as shown in Figure 1.

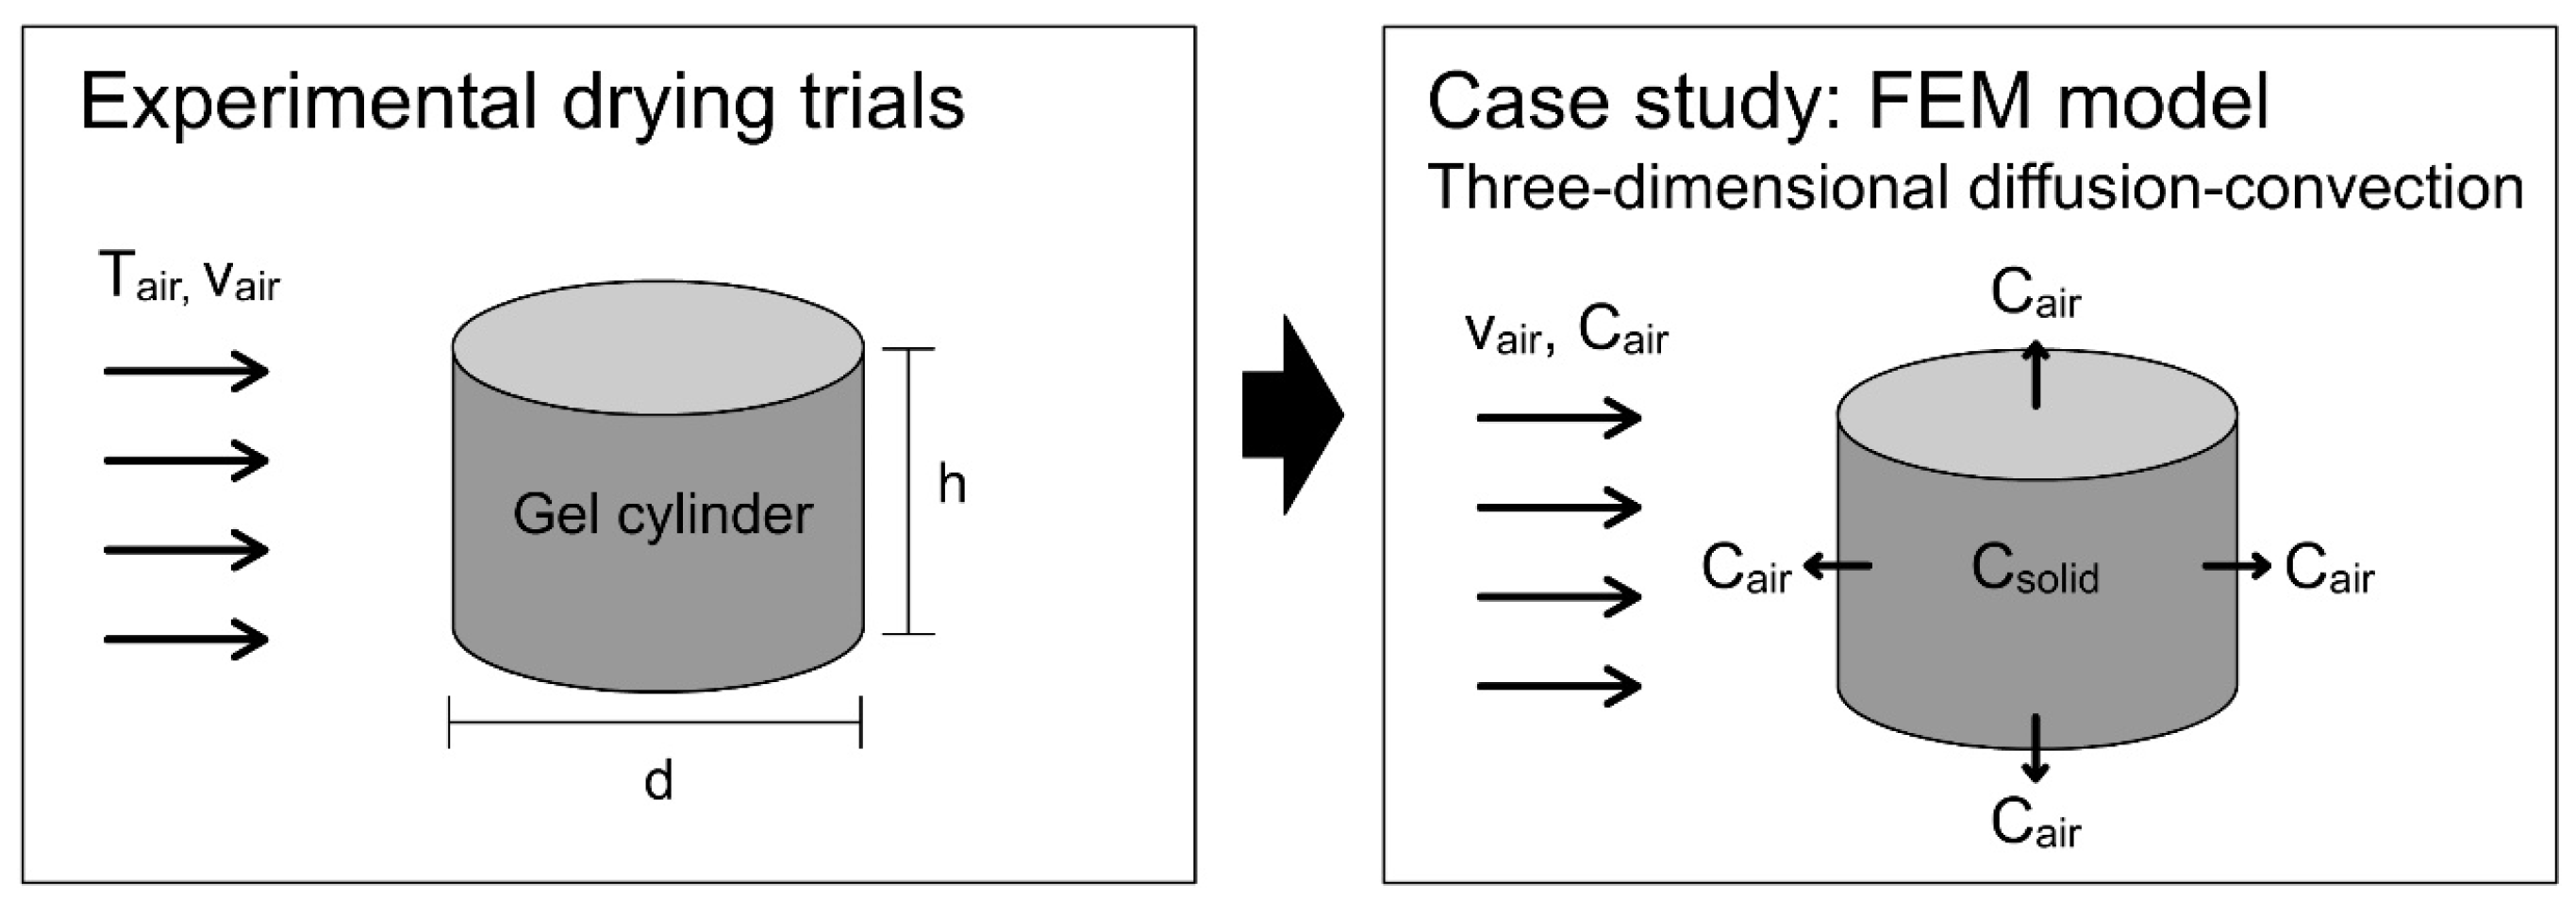
2.3. Convective Drying of Hydrogels

Drying was carried out in a convective drying oven with air renewal and circulation (220 V, Model MA 037, Marconi, Piracicaba, Brazil). The drying air temperature was maintained at 60 °C, with an average inlet airflow fixed at 0.5 m∙s−1, and a relative humidity of 7.9%. The trays placed in the oven created a drying tunnel with a height of 0.10 m and a length of 0.60 m. All of the different gel formulations (RC50, GC50, RC90, and GC90) were placed in the centre of the device tray to allow air to circulate freely around the test bodies.
By adopting an air density ( ρ 1 ) of 1.060 kg∙m−3 and a dynamic viscosity ( μ 1 ) of 2.1 × 10⁻⁵ Pa⋅s, the produced Reynolds numbers were set at the upper limit of laminar flow and implemented in the FEM model.
These drying parameters were chosen to ensure that the data collected in the current kinetic drying trials could be compared with previous authors’ works [23,24], providing a consistent background for the multiphysics modelling. This work specifically coupled texture analysis with the FEM model to predict the solid stiffness over moisture loss.
The wet gels were subjected to convective drying at 60 °C and 0.5 m/s, and collected at intervals of 0, 0.5, 1.5, and 2 h to monitor the kinetic drying process and produce samples with reduced moisture content.
Uniaxial compression tests were applied to wet and partially dried samples to determine the coefficients of the Ogden hyperelastic model.
After convective drying, the samples were further dried in an oven at 105 ± 5 °C for 24 h to determine their dry mass and total moisture content [25].
After this step, the equilibrium moisture ( W ) was calculated on a wet basis using Equation (1). From this value, the moisture content of the samples on a dry basis ( X ) was determined using Equation (2), where m w (kg) is the mass of water and m s (kg) is the total mass of the sample [26].
W = m w m s
X = W 1 W
The experimental drying data were obtained in triplicate for the formulations RC50, RC90, GC50, and GC90 at a temperature of 60 °C.

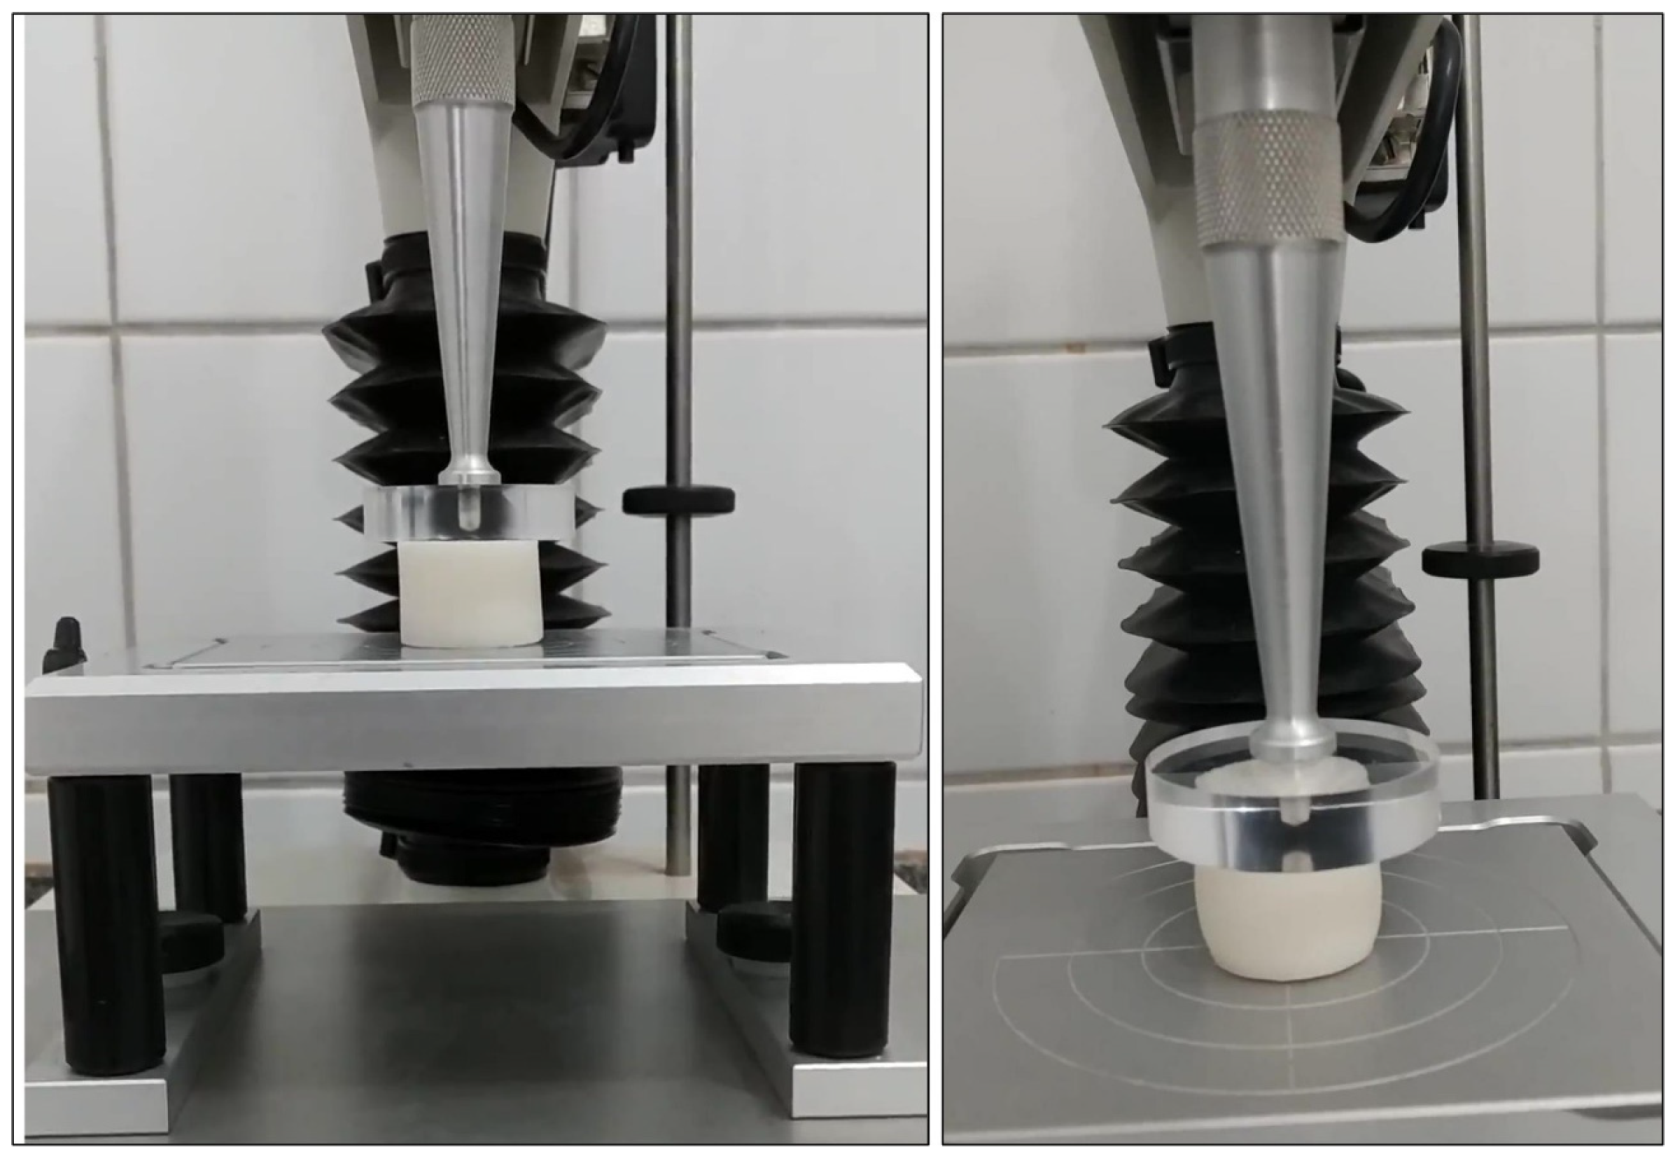
2.4. Texture Analysis

The uniaxial compression of the gels was undertaken with a texturometer (model TAXT Plus, Stable Micro System, Godalming, UK) equipped with a 20 kg load cell and Exponent software (Stable Micro Systems, v6.1.4, Godalming, UK). The tests used a compression speed of 1 mm/s and a displacement of 5 mm.
Cylindrical alginate starch gels with dimensions close to d = 25   mm and H 0 = 25   mm were used as samples in the uniaxial compression tests, in which strength and height values were obtained. The hydrogels presented variable initial compositions, represented by the nomenclatures of RC50, RC90, GC50, and GC90, as described in Table 1 [23]. The wet gels were subjected to convective drying at 60 °C and 0.5 m/s and collected at intervals of 0, 0.5, 1.5, and 2 h, producing samples with different moisture contents. Stress profiles concerning the deformation of the wet and partially dry gels were collected in triplicate.

2.5. Evaluation of Mechanical Coefficients

From the data on the initial height of the sample ( H 0 , m), as well as on the height ( h , m) and force ( F , N) acquired during compression on the sample area ( A , m2), it was possible to obtain the stress profiles ( σ , Pa) by deformation ( ε , m∙m−1), as described by Equation (3) and Equation (4) [27].
σ = F A
ε = l n h H o
The value of the stretch ratio ( λ ), applied to the Ogden model, was obtained from Equation (5) [28].
λ = e x p ( ε )
The hyperplastic model of Ogden (Equation (6)) was adjusted by nonlinear regression to the experimental data of stress and strain, and the coefficients of initial shear modulus ( μ , Pa) and the constant of Ogden ( α ) were obtained [28].
σ = 2 μ α ( λ α λ 1 2 α )
The modulus of elasticity, or Young’s modulus ( E , Pa), was calculated according to
𝜕 σ 𝜕 ε = E = 3 · μ
The integral area over the stress–strain profile was used to estimate the amount of compression energy used ( U , J).

2.6. Mathematical Modelling of Convective Drying via FEM

Two studies were conducted in this work related to the simulation of drying kinetics. These studies coupled partial differential equations for mass transfer, fluid flow, and geometric shrinkage (using the ALE method), and included a term for mechanical behaviour. The equations were numerically solved using the finite element method (FEM) with COMSOL Multiphysics® (COMSOL, Inc., v. 5.2., Burlington, MA, USA). The FEM model was constructed using Cartesian coordinates and used for the simulation of convective drying with the shrinkage of three-dimensional polyhedra. The present mathematical model was developed based on previous authors’ studies using 2D and 3D FEM models [23,24].
Figure 2 illustrates the cornstarch–alginate cylinder samples, the parameters monitored during the experimental convective drying tests, and the boundary conditions used in the mathematical model. In the FEM model, index 1 was assigned to the air fluid domain and index 2 to the starch–alginate solid domain.
The molar concentration of water in the drying air domain ( c 1 , mol · m 3 ) was assessed through convective moisture transfer, as depicted by Equation (8).
𝜕 c 1 𝜕 t D a i r 𝛻 2 c 1 + v · 𝛻 c 1 = 0
where v corresponds to the speed of the airflow, ρ 1 is the density of air and D a i r represents the effective mass diffusivity of water vapor in the drying air, which was estimated using Chapman–Enskog theory and Lennard-Jones potential parameters [29] (0.309 × 10⁻⁴ m2∙s−1). The mass conservation of the inlet and outlet airflow domain is expressed in Equation (9):
ρ 1 𝛻 · v = 0
The viscous effects of air drying around the starch–alginate cylinders were considered using a transient three-dimensional model and incompressible flow, calculated from the Navier–Stokes equation, as shown in Equation (10).
ρ 1 𝜕 v 𝜕 t + ρ 1 v · 𝛻 v = 𝛻 · P + μ 𝛻 v + 𝛻 v + F
where P is the term of pressure and F is its gravitational force.
The molar concentration of water in the starch–alginate cylinder domain ( c 2 ,   mol · m 3 ) was determined through diffusive mass transfer, as illustrated in Equation (11):
𝜕 c 2 𝜕 t D e f f 𝛻 2 c 2 = 0
where D e f f is the effective diffusivity of water in the starch–alginate cylinders.
In this study, the solid matrix was considered isotropic, and the initial and detailed boundary conditions were evaluated [23].
According to the ideal gas law, the molar concentration of water c 1 0 mol · m 3 in the drying air at the dryer inlet was obtained by dividing the partial pressure of the water P w ( Pa ) by the product of the ideal gas constant ( R = 8.314   J / mol · K ) and the drying air temperature T K .
c 1 0 = P w R   T
For the solid domain, or the gels, the initial molar concentration of water ( c 2 0 , mol · m 3 ) in the wet starch–alginate cylinder was determined by the ratio of the density of the wet solid ( ρ 2 , kg · m 3 ) , the molar mass of water ( M w = 18.01528   g · mol −1), and the initial moisture content on a dry basis ( X 0 , kg∙kg−1 d.b.).
c 2 0 = ρ 2 M w X 0 1 + X 0
The partition coefficient ( K p , dimensionless) determined the water concentration at the air–solid interface and was obtained by the ratio of the concentration of water vapor in the air ( c 1 s a t ,   mol · m 3 ) to the equilibrium concentration on the sample surface ( c 2 e q ,   mol · m 3 ) .
K p = c 1 s a t c 2 e q

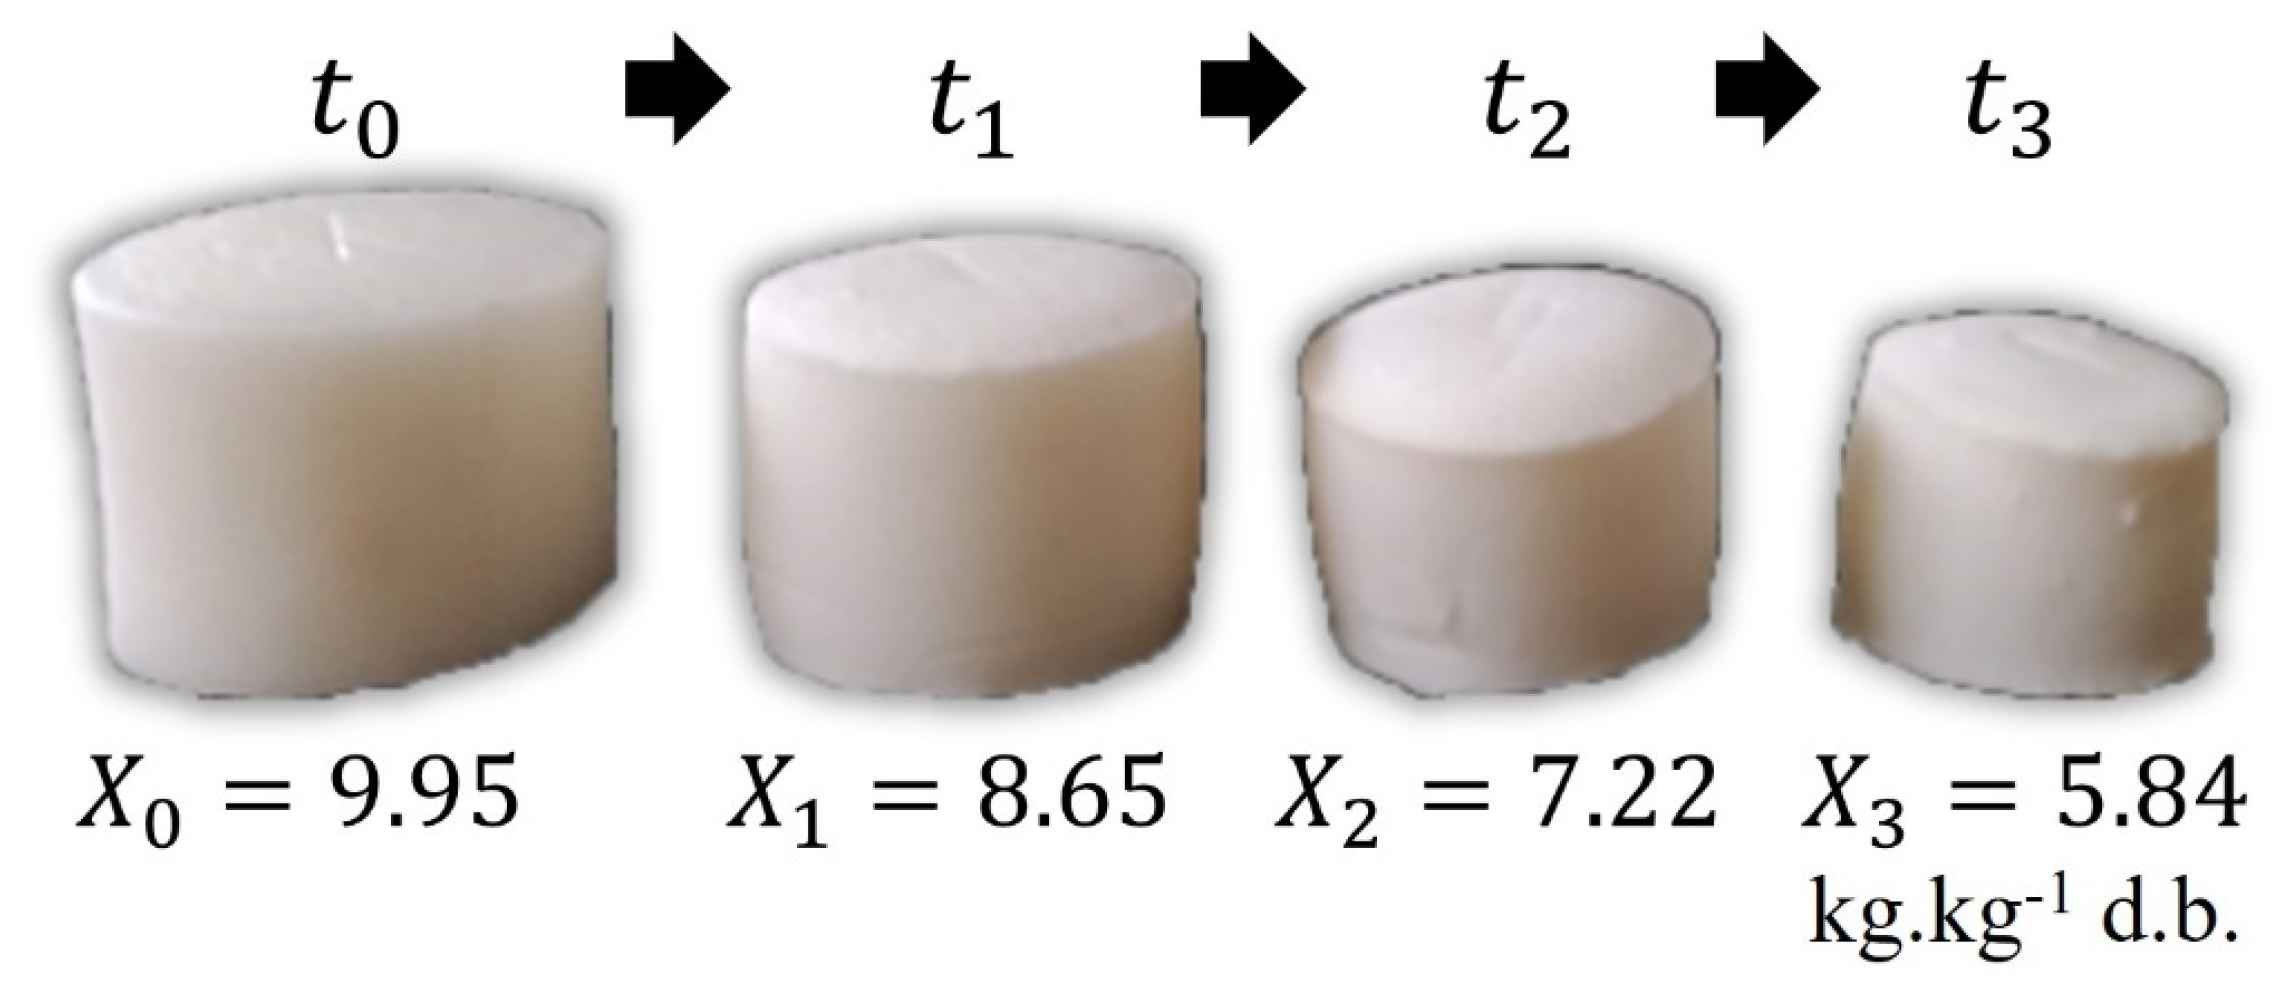
2.7. Evaluation of Shrinkage of Hydrogels during Drying

The FEM model considered the three-dimensional shrinkage of the gels during convective drying. The deformation of the computational mesh was estimated by the Lagrangian–Eulerian arbitrary method (ALE). The deformation of the solid domain was obtained by two case studies, which are described below.
In the first study, referred to as the FEM model, shrinkage was proportional to the volume of water removed during drying. Solid deformation was estimated based on the moisture loss from the surfaces of the starch–alginate cylinders [23,30,31]. The deforming boundary velocity ( v n ,   m · s 1 ) was evaluated using the relationship between normal molar diffusion flow ( J n ,   mol · m 2 · s 1 ), water density ( ρ w ,   kg · m 3 ), and water molecular weight ( M w ,   kg · mol 1 ) , as described by
v n = 𝜕 L 𝜕 t = J n M w ρ w
Additionally, the second case study, named the Texture-FEM model, estimated shrinkage through velocity ( v n ) using Equation (15), and was corrected by the solid stiffening coefficient ( β ).
With the loss of moisture during drying, the modulus of elasticity of the starch–alginate gels undergoes modifications. The literature shows that a lower moisture content ( X , kg∙kg−1 d.b.) results in higher Young’s modulus values ( E , Pa) [32]. Considering that the gels have hyperplastic behaviour, the modulus of elasticity can be estimated from Equation (7), as previously described.
Using experimental tests of moisture content and uniaxial compression, the profile of dimensionless moisture loss ( 1 X R ) was traced by the dimensionless modulus of elasticity ( E R ), as given by Equations (17) and (16).
E R = ( E E m i n ) ( E m a x E m i n )
where E m i n corresponds to the lowest value for the modulus of elasticity during moisture removal, E 0 is the initial modulus of elasticity of the wet gel, and E m a x is the value of the modulus of elasticity for the dry hydrogel, estimated as E m a x = 1.5   E 0 .
( 1 X R ) = 1 ( X X e q ) ( X 0 X e q )
where X 0 is the initial moisture content of the wet gel and X e q is the equilibrium moisture content of the dry gel.
The β coefficient is the angular coefficient, obtained from the linear adjustment between E R and ( 1 X R ) , as represented by Equation (18).
E R = β ( 1 X R )
By multiplying the moving boundary velocity ( v n ,   m · s 1 ) by the dimensionless coefficient of stiffening ( β 1 ), the simulated shrinkage profile can be corrected and thus reduce the deviations from the experimental shrinkage values. Therefore, the second case study used Equation (19) as an alternative to predict shrinkage using the ALE method.
v n = 𝜕 L 𝜕 t = J n M w ρ w 1 β

2.8. Statistical Measurements

The quality of the model coefficients was assessed by fitting the experimental data to the FEM model and to the texture Ogden model. Specifically, the effective mass diffusivity Deff (m2·s−1) was determined through the nonlinear fitting of the diffusion models to the experimental drying kinetics, returning the minimum deviation between the experimental and simulated data. The fitting and profile plots were established with Mathematica Wolfram software (Wolfram Research, Inc., v.13.3, Champaign, IL, USA), employing the least-squares regression method via the Levenberg–Marquardt algorithm. Goodness of fit was evaluated using the coefficient of determination (R2) and root-mean-square error (RMSE), defined as follows:
R 2 = 1 i N O i P i 2 i N O i P i ¯ 2
R M S E = i N O i P i 2 N 1 2
where Oi and Pi are the observed experimental and simulated values, respectively, and N is the number of observations. The best fit was achieved by minimizing the RMSE and maximizing R2.

3. Results and Discussion

3.1. Drying Experiments on Cornstarch–Alginate Hydrogels

The drying experiments on the cornstarch–alginate hydrogels were consistent with the previous study of [23]. During drying, moisture content, hydrogel diameter, and height measurements were obtained to determine solid volume and shrinkage. Table 2 shows the initial dimensions of the gels for the formulations containing starch fractions of 50% (RC50 and GC50) and 90% (RC90 and GC90).
The cylindrical gels presented average diameter and height dimensions of 2.56 cm and 2.25 cm, respectively. The heat treatment at 80 °C, for samples GC50 and GC90, resulted in variations in the final diameter. The GC50 samples had about a 6% reduction in diameter compared to the raw starch (RC50), while the GC90 samples had about a 3.5% increase in diameter compared to the RC90 samples. It can be assumed that heat treatment at 80 °C expanded the hydrogel matrix by swelling the starch granules in samples with a higher starch concentration (GC90). On the other hand, samples (GC50) that had lower starch concentrations and underwent heat treatment may have had an exudation of water and a small diameter retraction.
Figure 3 shows the shrinkage of the cylindrical gels for the RC50 samples, collected at convective drying intervals of 0, 0.5, 1.5, and 2 h. t is the drying time in a convective oven and X is the moisture of the sample in kg∙kg−1 d.b.

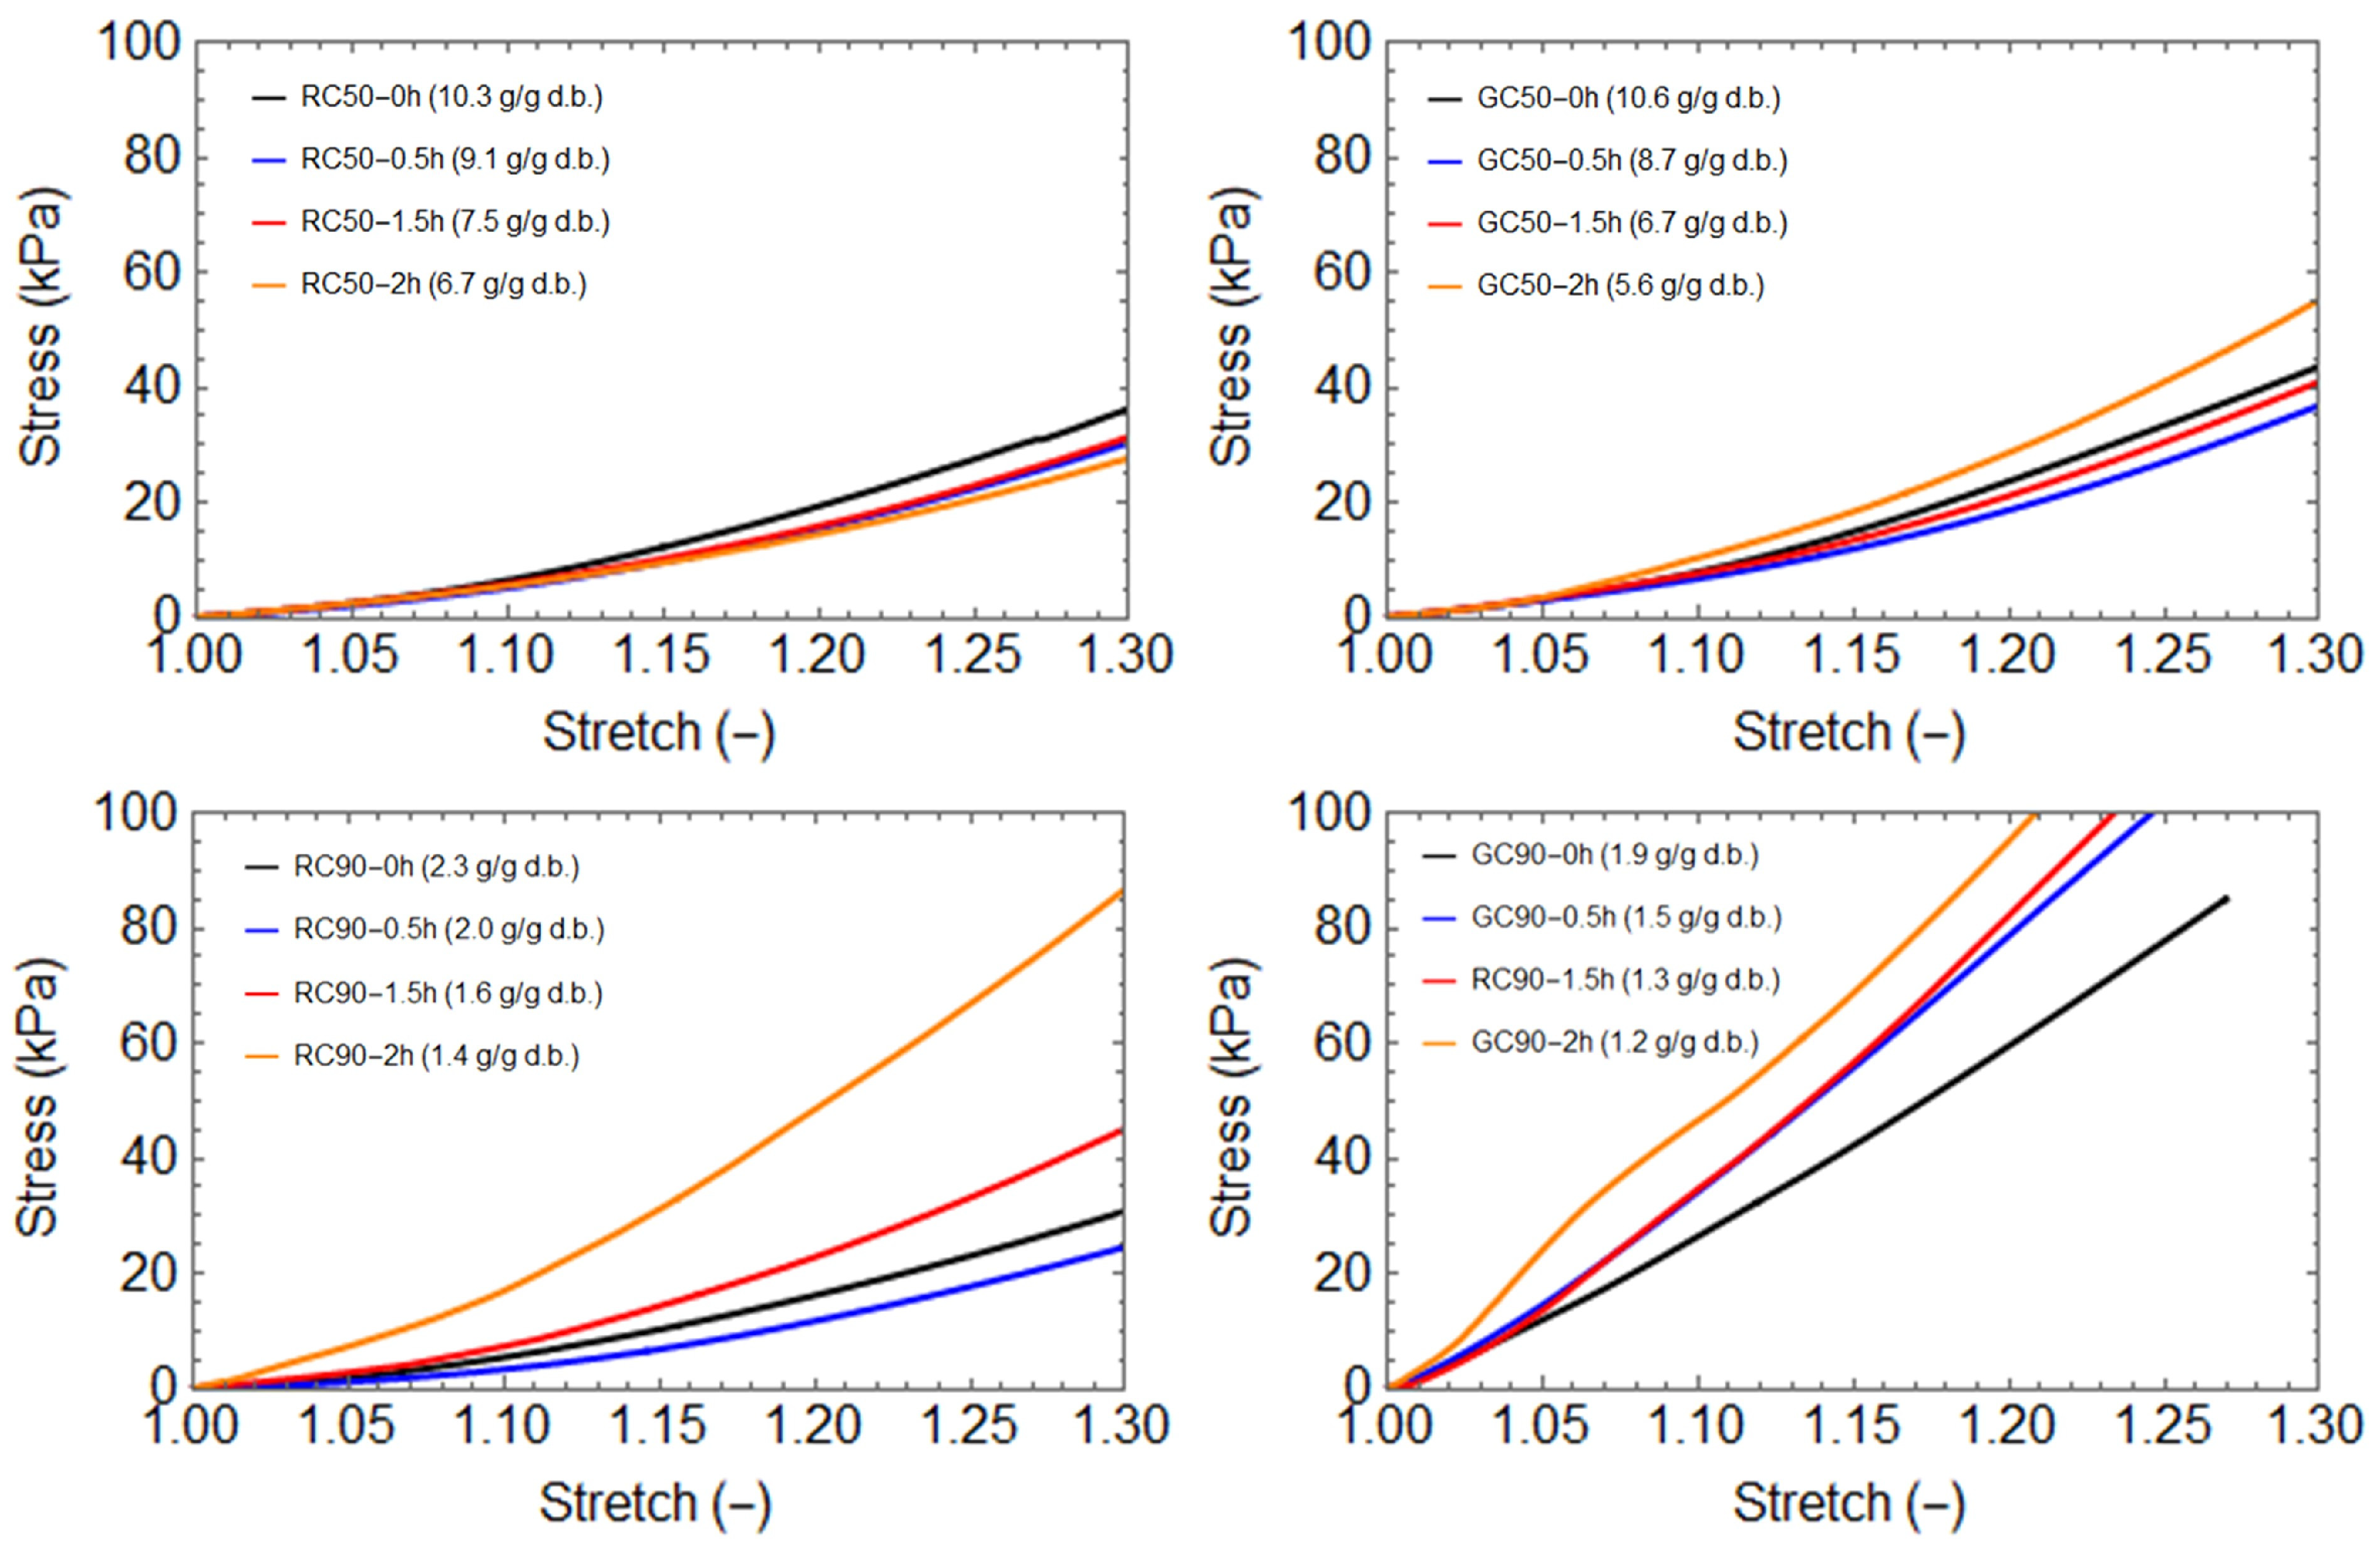
3.2. Texture Analysis

Starch–alginate suspensions were prepared, and the cylindrical gels followed the formulations of RC50, RC90, GC50, and GC90. The gels were subjected to uniaxial compression analysis in a texturometer, as shown in Figure 4.
To investigate the mechanical properties of the gels, the uniaxial compression technique was used, which is a conventional test for this purpose [33]. From the uniaxial compression tests, it was possible to obtain the stiffness parameters of the gels and correlate them with the moisture content of the solids.
Hydrogels are known for their mechanical behaviour as a hyperelastic solid; they exhibit a large deformation and a nonlinear stress–strain ratio. Alginate gels exhibit the mechanical behaviour of a nonlinear material, and although there are several models for hyperelastic solids, the Ogden model was chosen because it presents good adjustments to the experimental data [33,34]. Therefore, drying the gels led to a reduction in moisture content and modified the texture parameters of the Ogden model (hyperelastic solid), as well as the modulus of elasticity and the energy used for compression.
Mathematica software (Wolfram Research, Inc., v.13.3, Champaign, IL, USA) performed a non-linear regression to determine the Ogden parameters, and also calculated the compression work by the integral of the stress vs. strain profile.
Figure 5 shows the profiles of stress (kPa) against stretch (-) obtained through the uniaxial compression trials. It is possible to observe that the formulations with a lower amount of starch (RC50 and GC50) had a lower stiffness during drying, showing a maximum stress value after 2 h of drying of 35 kPa for the RC50 samples and 55 kPa for the GC50 samples. Samples with a higher amount of starch (RC90 and GC90) had a higher stiffness during drying, reaching a maximum stress value of 85 kPa for the RC90 samples and above 100 kPa for the GC90 samples. During drying, a tendency for the samples to decrease in stiffness in the first moments of drying was observed, which may have been due to the softening of the samples and the rearrangement of the structure. With the continuation of drying, the stiffness of the material increased, as expected. This trend was not observed in the RC90 formulation samples, and this is due to this formulation containing a higher concentration of native starch and going through the gelatinization process, which causes the inner layer of the hydrogel to form a stronger structural network that does not change during the growing–drying period.
Table 3 shows the moisture content and texture parameters obtained by the fitting of the Ogden model and the uniaxial compression data.
W is moisture on a wet basis; X is moisture on a dry basis; µ, e, and α are the stiffening parameters of the Ogden model; E is the elasticity modulus, or Young’s modulus; and U is the compression energy of a corresponding area when subjected to a deformation of 5 mm.
The RC50 and GC50 samples, which in the formulation contained a lower starch concentration, showed a higher water fraction, at around 90% of the initial moisture. Because the RC90 and GC90 samples contained in their formulation a higher starch concentration, they presented a lower fraction of water (around 65% of moisture on a wet basis).
The moisture data are in agreement with a previous study that also used starch–alginate formulations with flat geometries [23].
The compression tests for the samples collected during drying showed that the Ogden constant (α) presents a trend of global decrease with moisture loss. For example, at the initial time (0 h), the GC90 sample had an X value of 8.41 kg∙kg−1 and α value of 3.92, while for the equilibrium time (2 h), the values of X and α were equal to 1.23 kg∙kg−1 and 3.13, respectively. Similar behaviours were observed for the other raw and gelatinized samples.
The initial shear modulus (μ), which is the parameter representing the stiffness of the material, showed a trend of global increase with moisture loss during drying. However, it was shown that the initial shear modulus (μ) initially decays, which may be due to the softening of the samples and rearrangement of the structure. With continued drying, the stiffness of the material increases, as expected. As an example, the GC50 sample presented a μ value of 24,798.6 Pa for the initial time, at 0.5 h presented a μ value of 21,104.9 Pa, and at the final time of 2 h presented a μ value of 31,032.2 Pa. A similar behaviour was observed in the GC50, RC50, and RC90 formulations.
The RC90 samples showed a linear increase in the initial shear modulus (μ) with a decrease in moisture. Probably because of the higher fraction of native cornstarch, these samples generated a stronger solid matrix that was rearranged at the beginning of drying. Thus, the mechanical relaxation period was not observed at the beginning of drying.
The Ogden constant (α) and the initial shear modulus μ are parameters associated with the models obtained for each material, and are determined by adjusting the experimental compression data.

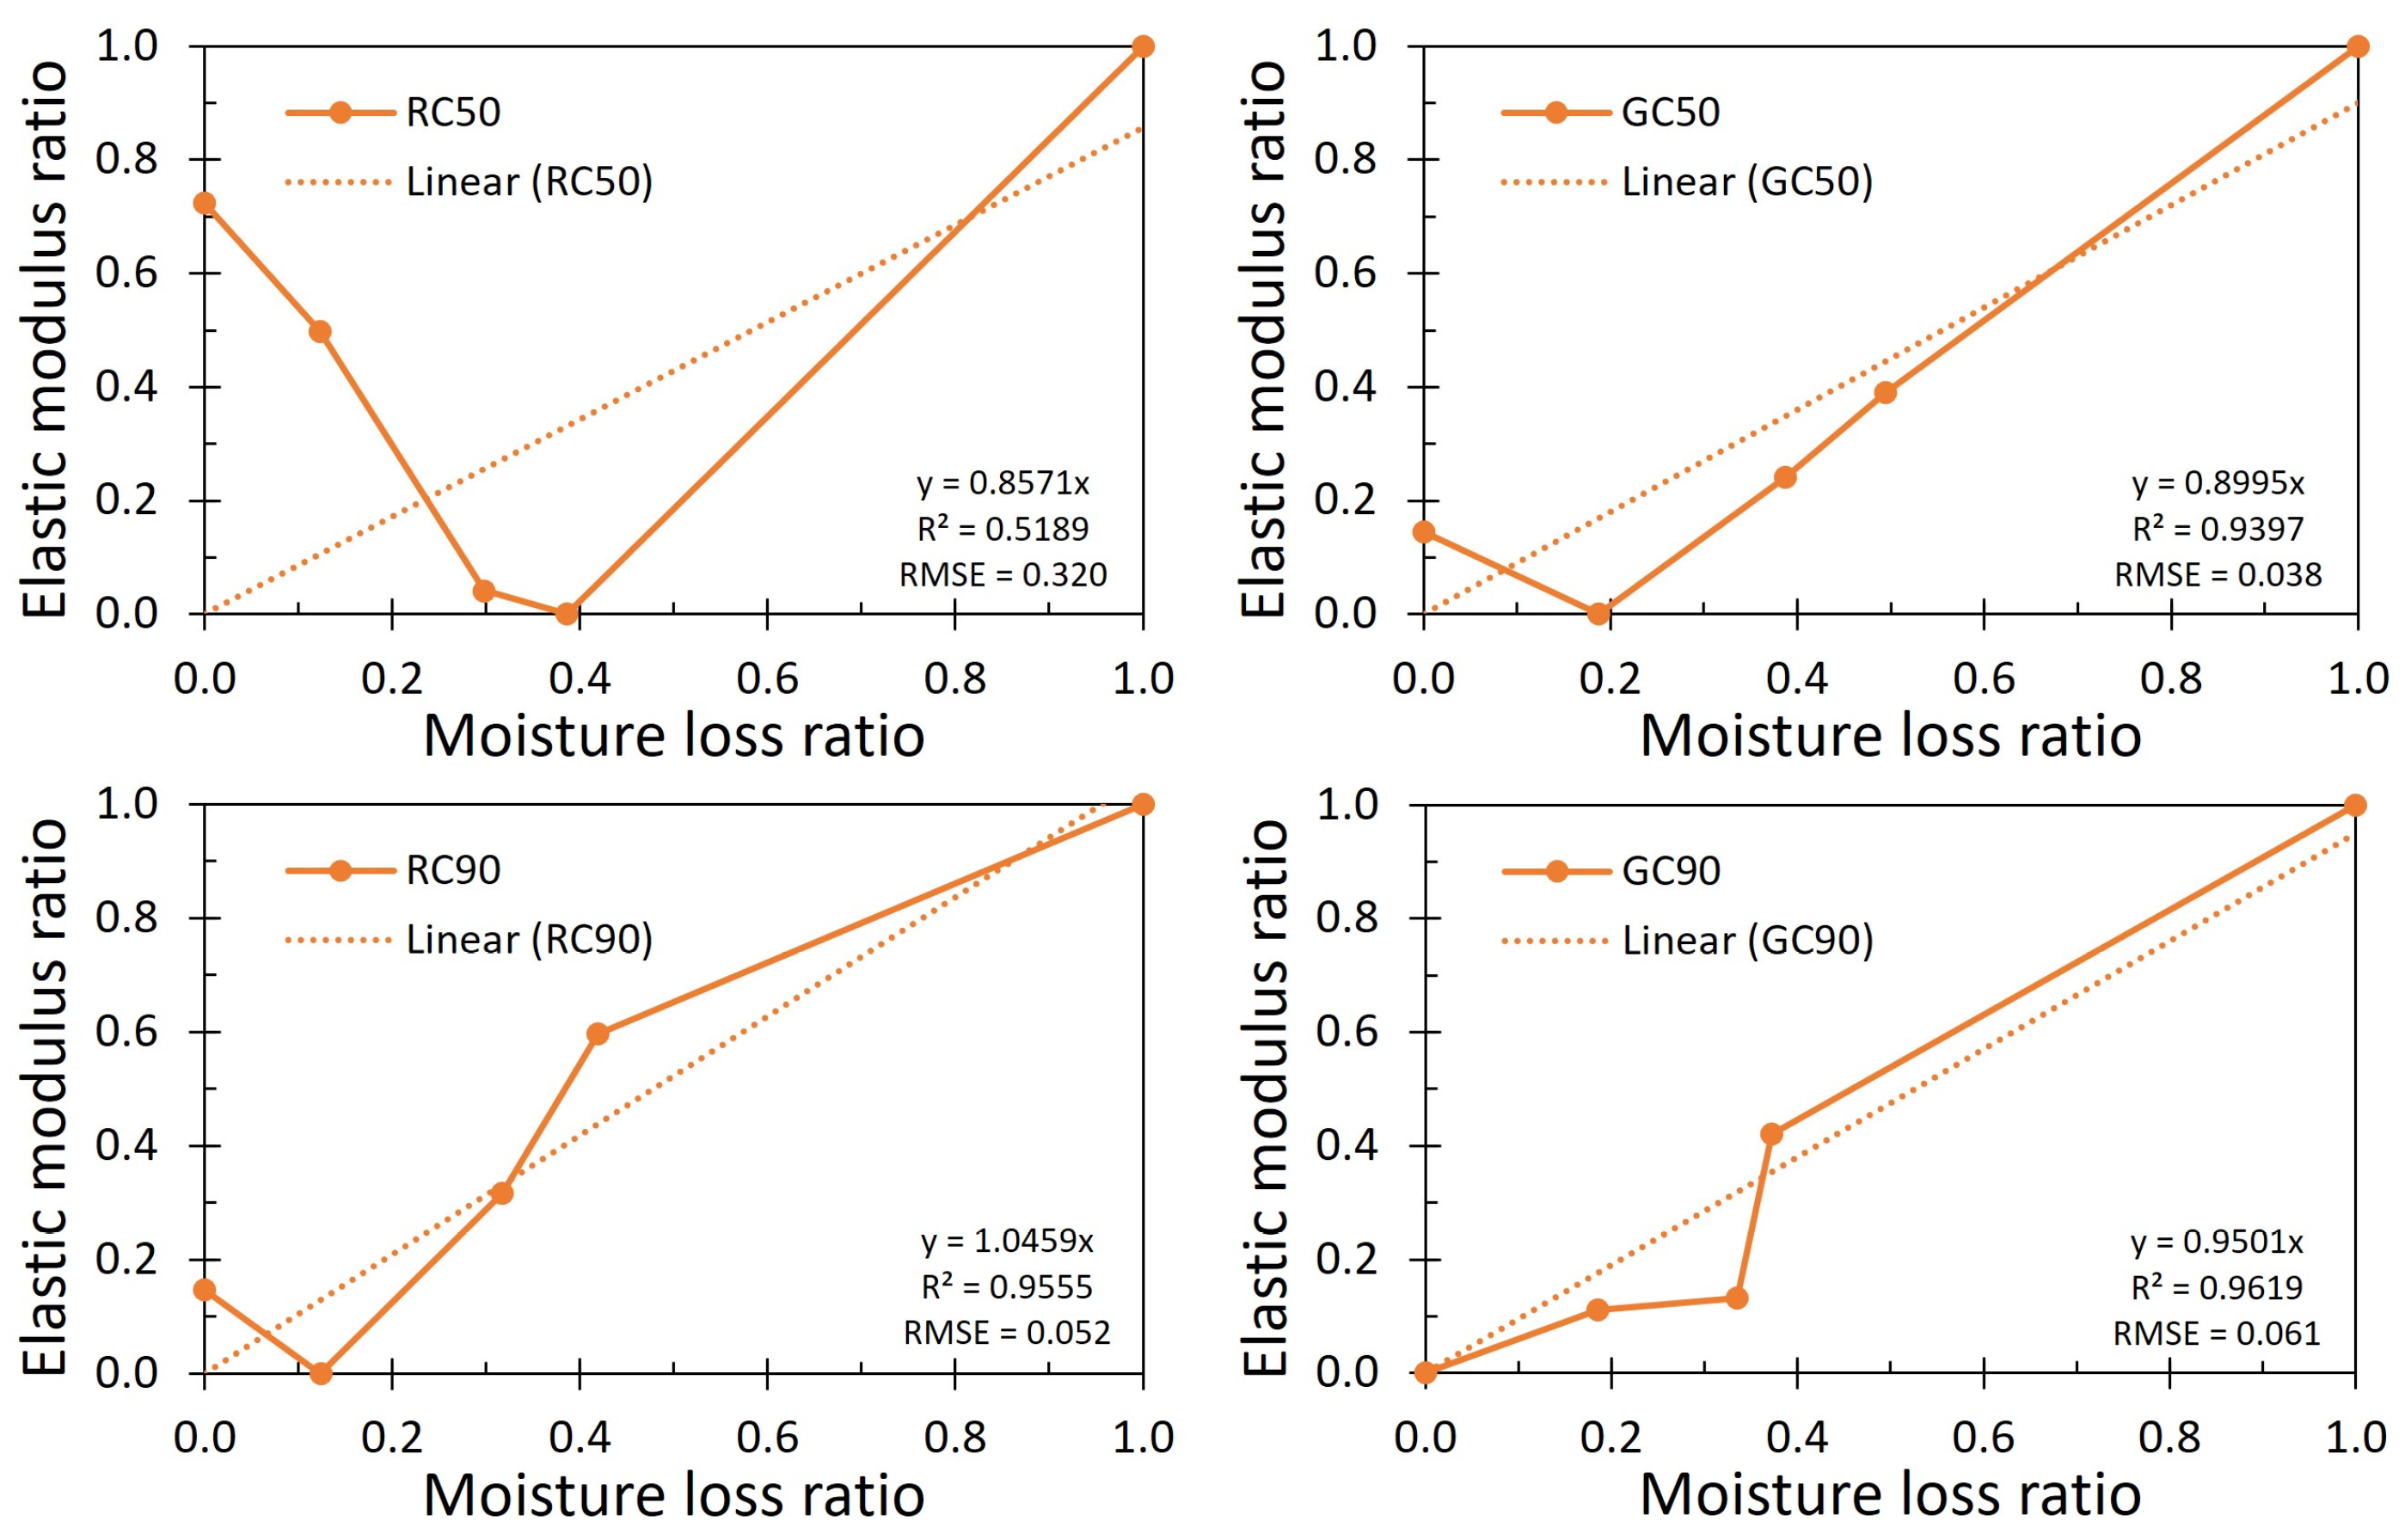
3.3. Evaluation of the Stiffening Coefficient (β−1)

Figure 6 shows the linear regression, described by Equation (18), and the determination of the β coefficient. Most formulations showed a linear tendency between the elastic modulus ratio ( E R ) and the moisture loss ratio ( 1 X R ) , explained by R2 coefficients greater than 0.94. A general behaviour in drying was observed, in which there was an increase in the modulus of elasticity with a loss of moisture. As an exception, the RC50 sample showed softening of the material in the initial drying moments, possibly due to the phenomenon of the gelatinization of raw starch.
The RC50 formulation had a large amount of water and corn starch at the drying temperature of 60 °C. Then, gelatinization began, the crystalline structure was lost, and there was a reduction in the stiffening coefficient ( β ).
The values of β were close to 1.0, but smaller values (<0.90) substantially affected the volumetric deformation, resulting in greater solid shrinkage. In particular, at a drying temperature of 60 °C, the β values were 0.8571, 0.8995, 1.0459, and 0.9501. Concerning the β values, the stiffening coefficients ( β 1 ) were estimated as equal to 1.1667, 1.1117, 0.9561, and 1.0525, for the RC50, GC50, RC90, and GC90 samples, respectively.

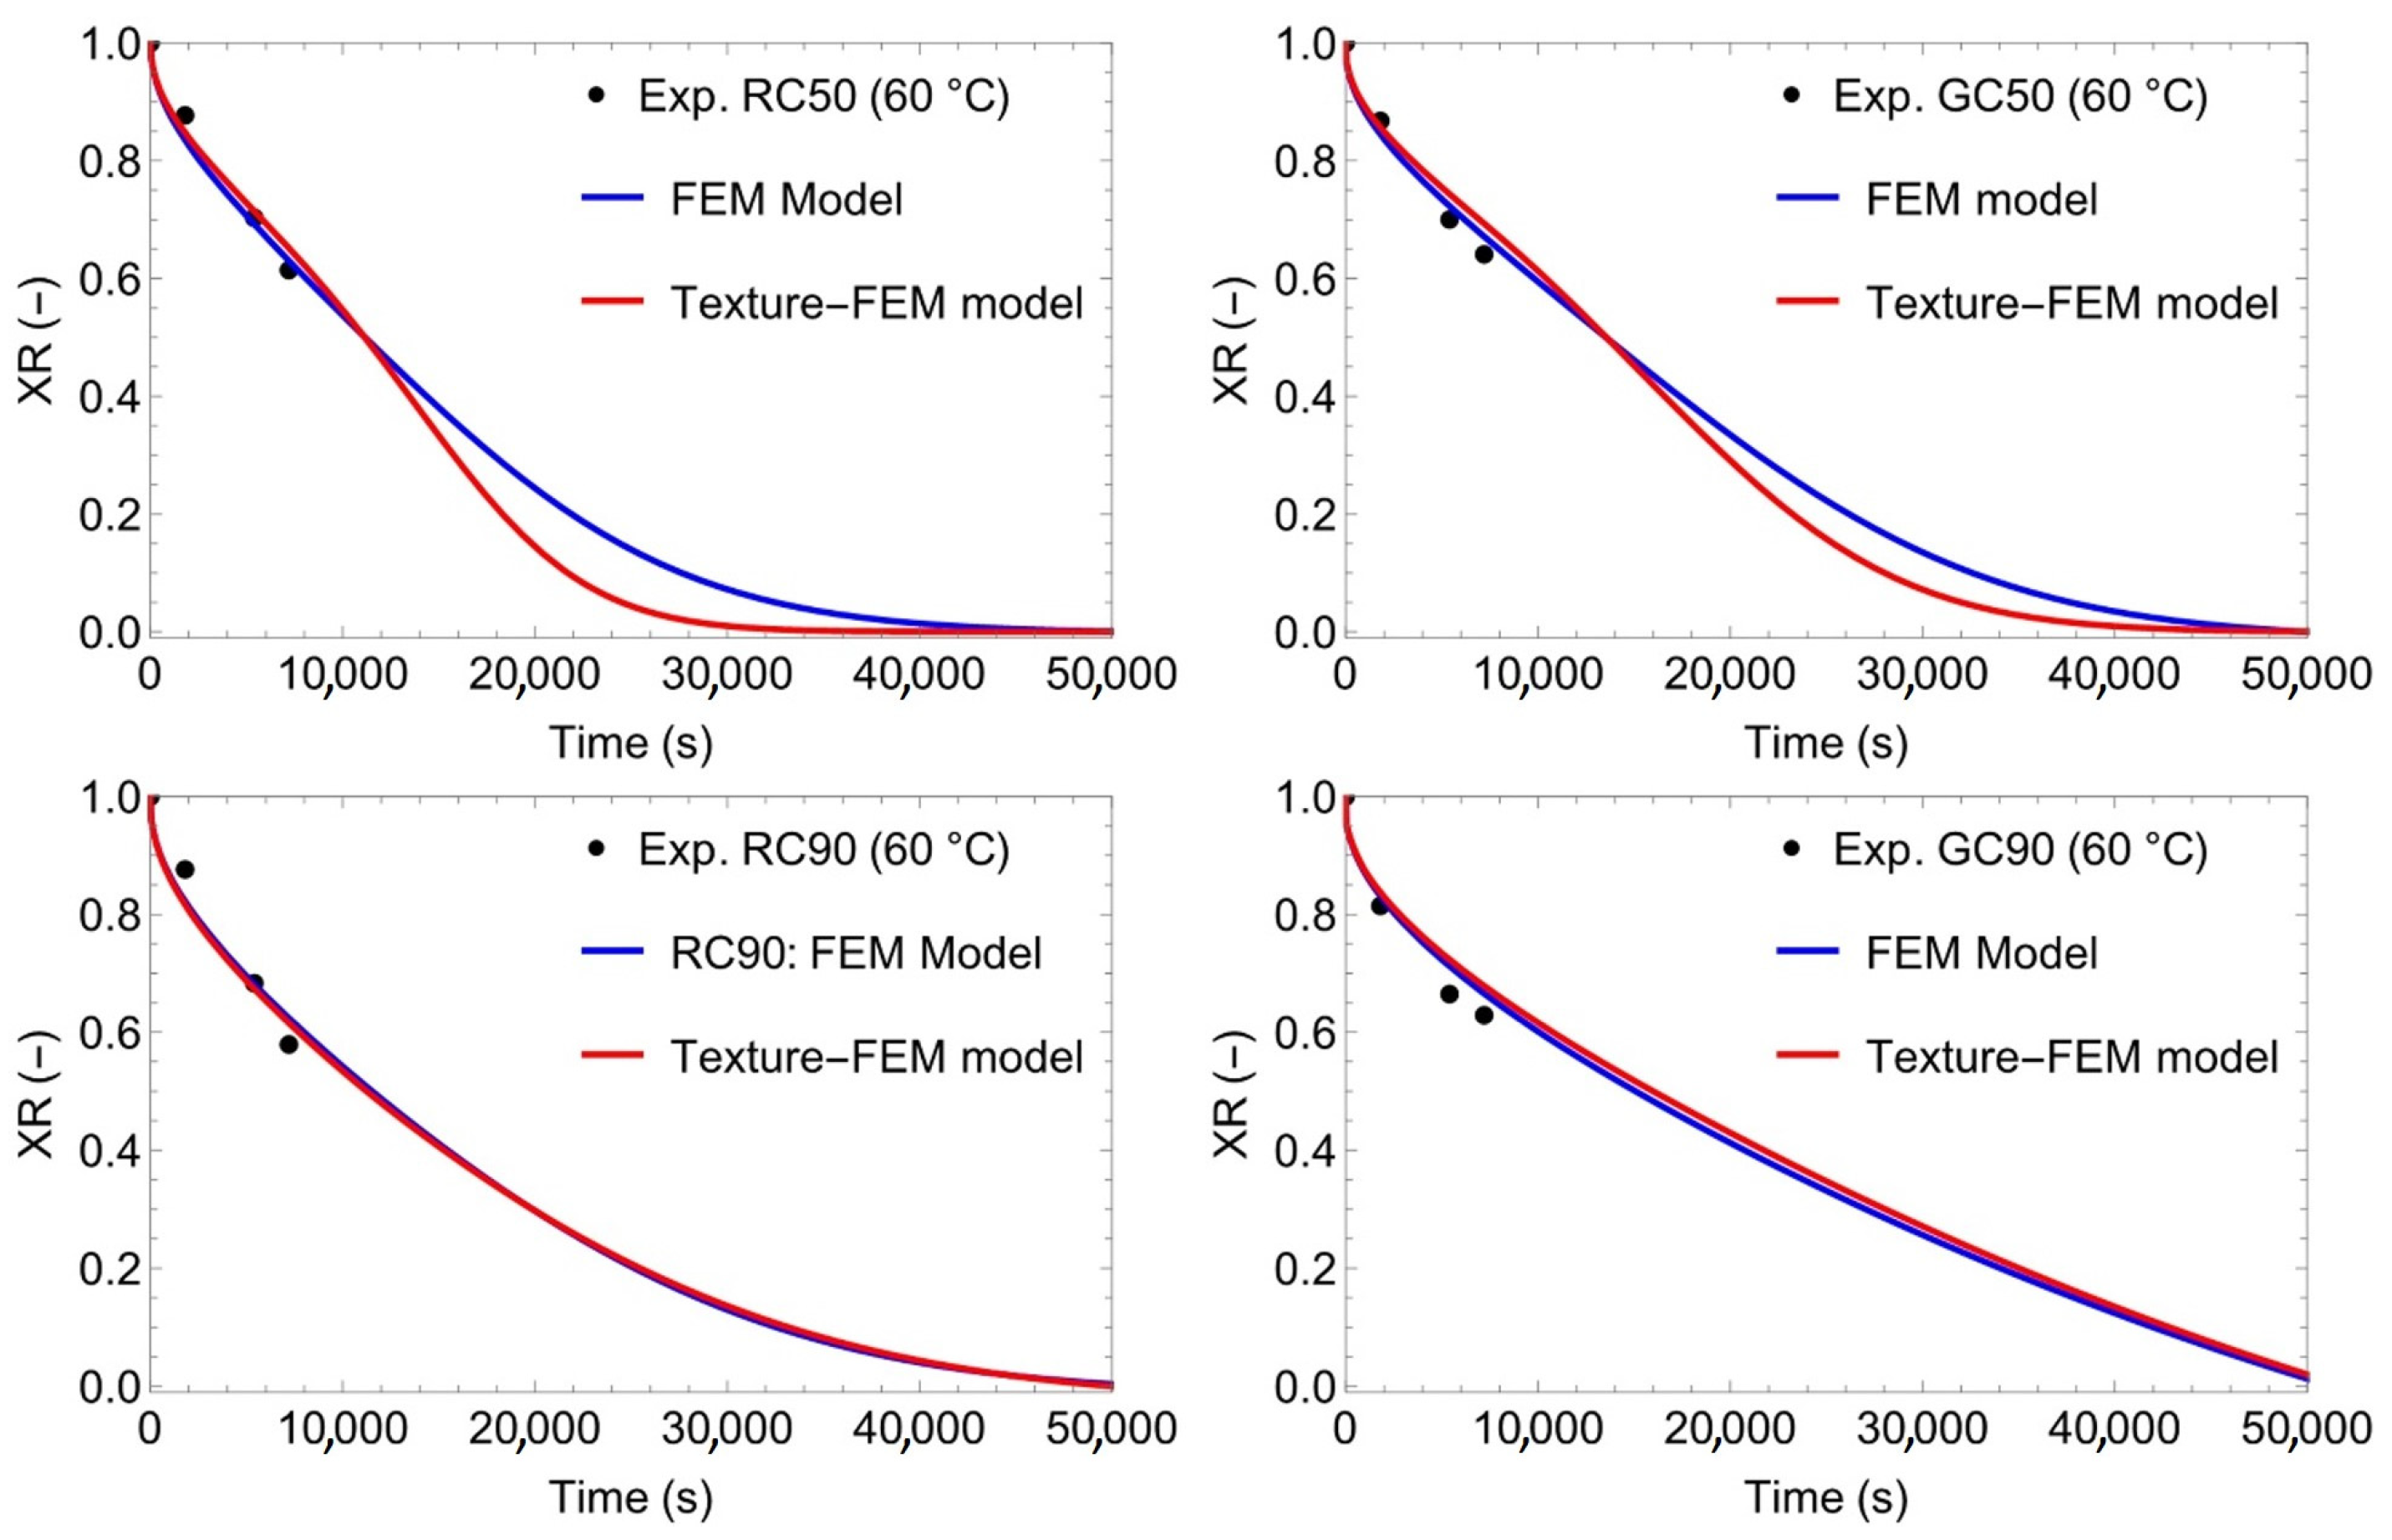
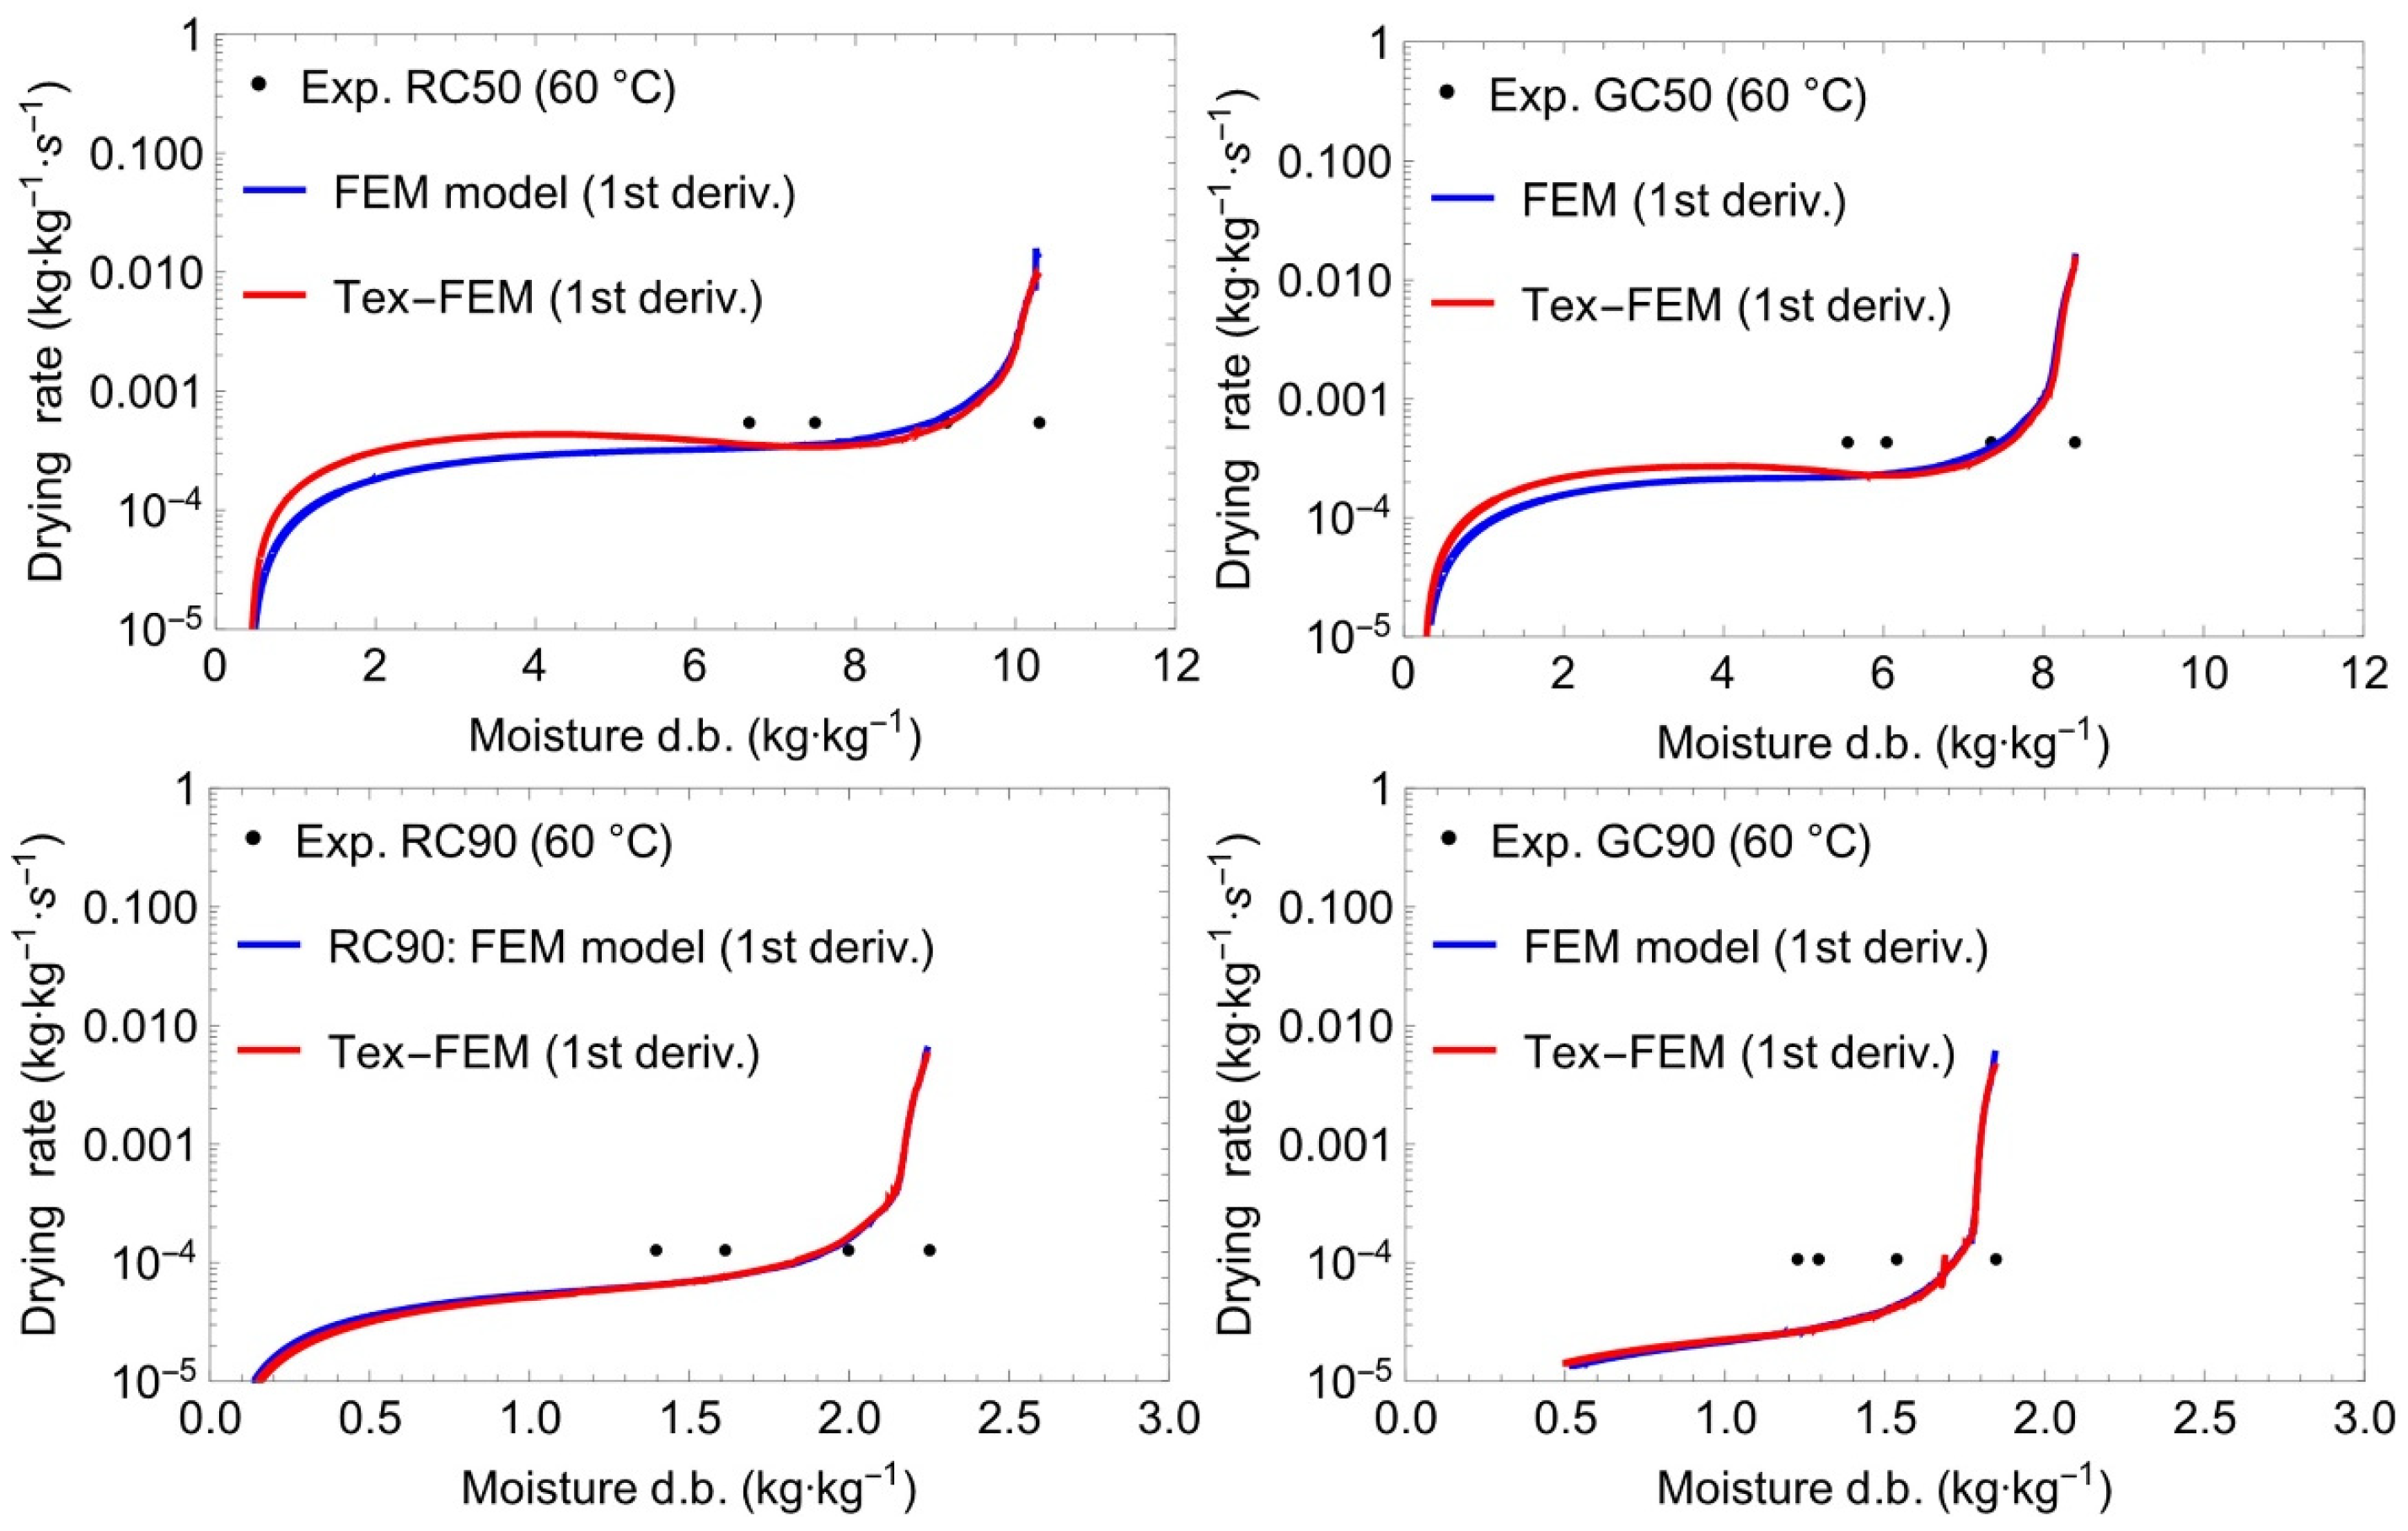
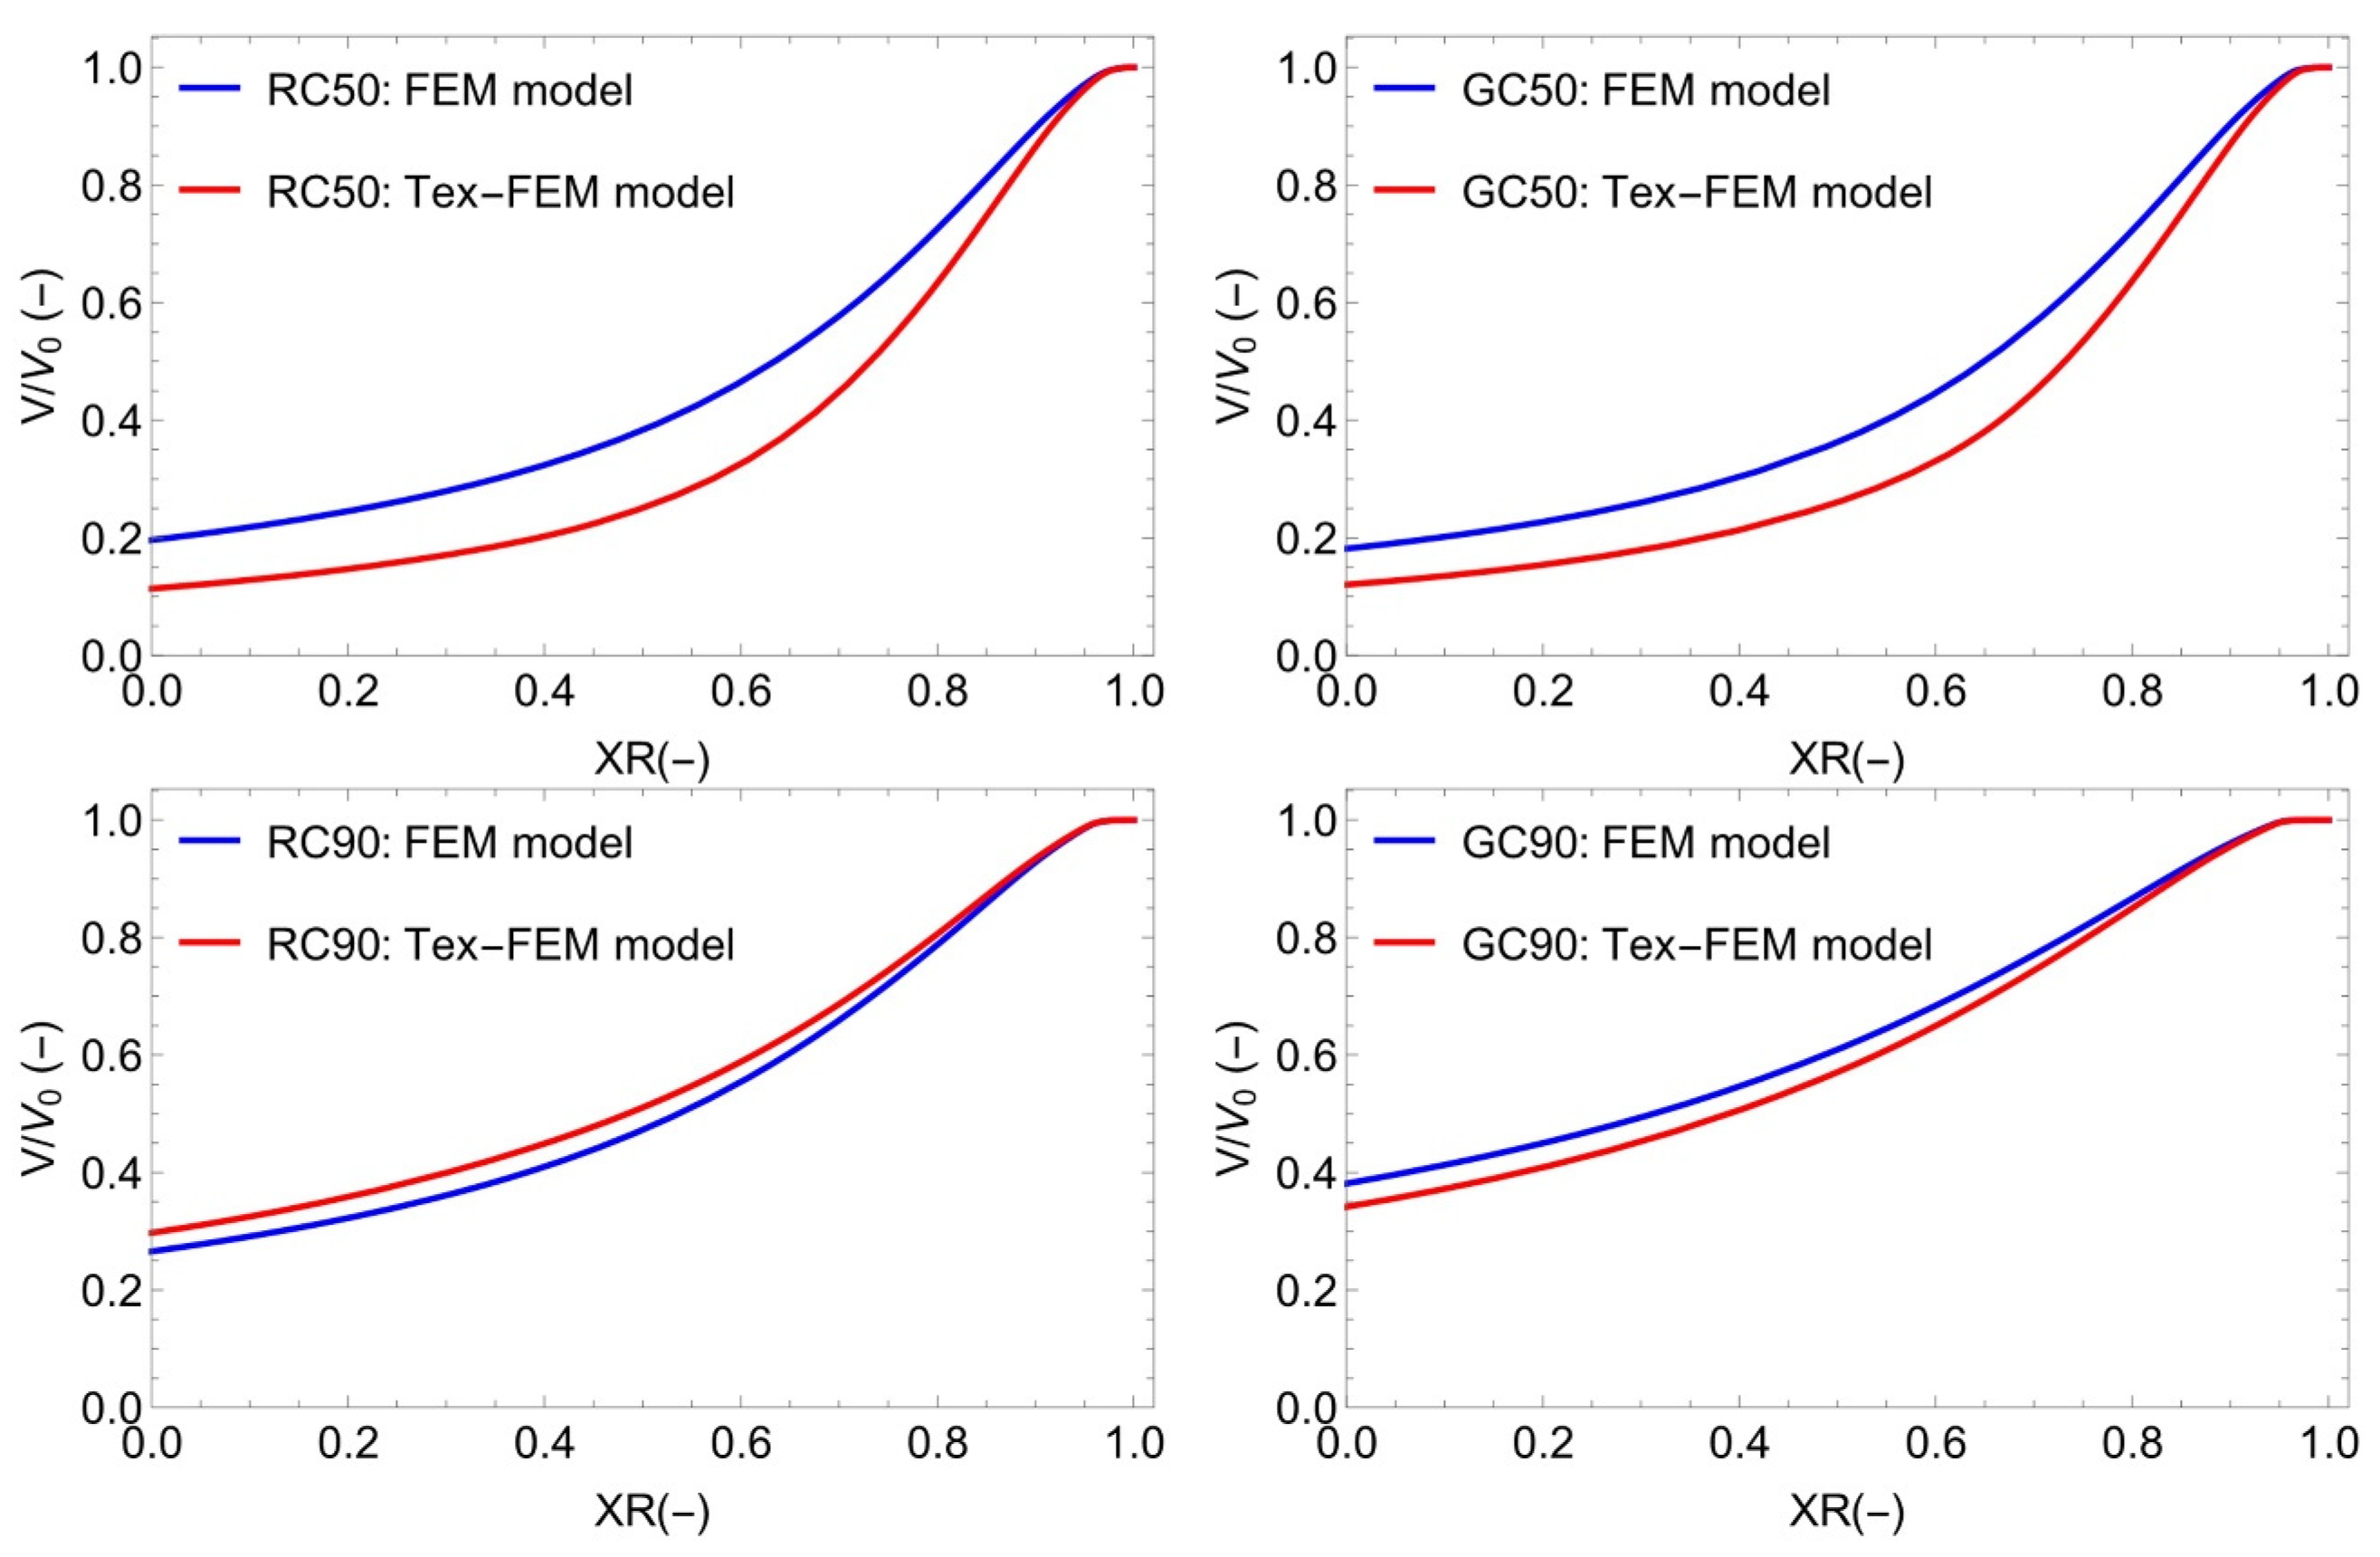
3.4. Modelling and Simulation of Convective Drying of Cornstarch–Alginate Hydrogels

The mathematical modelling and simulation of hydrogel drying involved two case studies: the FEM model and the Texture-FEM model. For both models, the statistical parameters R2 and RMSE indicated a good fit to the experimental data collected at the beginning of the drying process. The drying air temperature was maintained at 60 °C. Both the FEM model and the Texture-FEM model used the same mass diffusivity, ranging from 2.38 to 5.46 ×   10 10 m2⋅s−1, as shown in Table 2.
Figure 7 shows the fitting of the proposed numerical models for the RC50, GC50, RC90, and GC90 samples. For the FEM model, the corresponding R2 values were 0.977, 0.976, 0.954, and 0.956, with RMSE values of 0.023, 0.022, 0.035, and 0.031, respectively. Similarly, for the Texture-FEM model, the R2 values were 0.973, 0.942, 0.953, and 0.929, with RMSE values of 0.024, 0.034, 0.035, and 0.040, respectively. The quality of regression and the evaluated diffusion coefficients were consistent with the literature, producing similar D e f f values to those found in the drying of cornstarch–alginate hydrogels moulded as slabs [23].
The FEM model computed the mesh deformation from the moving boundary velocity equation ( v n ,   m · s 1 ), the results of which are plotted below as blue lines.
In the case of the Texture-FEM model, represented by red lines in the above figure, the stiffening coefficients ( β 1 ) corrected the v n equation, and probably better explained the volumetric deformation of the hydrogels during drying. This model assumes the presence of a relationship between the solid hardening, moisture content, and drying surface area of the hydrogels.
Changes in mechanical properties affect volume shrinkage during drying. Samples (RC50 and GC50) with a higher water content ( W > 0.89 kg∙kg−1 w.b.) also showed higher β 1 values (1.1117 and 1.1667), and the Texture-FEM model estimated a higher loss of moisture compared to the first FEM model, especially over advanced drying periods.
Figure 8 shows simulations of the drying rate period in relation to moisture ratio. The Texture-FEM model suggests an increase in water molar flux removal, explained by the development of a greater specific surface area of the hydrogels according to solid shrinkage.
In contrast, the samples (RC90 and GC90) with a higher corn starch content and lower moisture content ( W < 0.69 kg∙kg−1 w.b.) showed minimal deviations between the simulated drying profiles, as shown in Figure 7 and Figure 8. Inserting the stiffening coefficient ( β 1 ) into the Texture-FEM model did not affect the prediction of volumetric deformation for materials with reduced water content.
From the analysis of the hydrogels, we find that the initial values of the modulus of elasticity ( E , Pa) were around 74 kPa for the RC50 and GC50 samples, 52 kPa for RC90, and 282 kPa for GC90. The relationship between mechanical properties and shrinkage behavior evidenced that hydrogels with a higher initial Young’s modulus ( E > 80 kPa) showed a volumetric deformation proportional to moisture removal. Additionally, hyperelastic solids with a higher moisture content and lower initial Young’s modulus ( E < 80 kPa) showed greater matrix packing with moisture loss, giving a higher volumetric shrinkage compared to exclusive mass transfer transport.
This phenomenon could be explained by the development of a higher specific surface area, which is attributable to the extra packing of the hyperplastic matrix during drying. Figure 9 shows the simulated volumetric deformations with the FEM model and the Texture-FEM model. As stated before, the Texture-FEM model simulated a larger shrinkage for hydrogels containing higher amounts of water with a lower Young’s modulus (i.e., the RC50 and GC50 samples). Our results are in agreement with a previous study that used a 2D FEM model to describe the drying of cornstarch–alginate slabs, resulting in experimental shrinkage values lower than the simulated ones [23].
This study advances the understanding of hydrogel drying behaviour by integrating texture stiffness analysis with finite element method (FEM) modelling using a multiphysics approach. This innovative method not only accurately predicts moisture content and deformation, but also reveals the relationship between moisture loss and increased stiffness, consistent with hyperelastic material properties. The derived stiffness coefficient, used to adjust the moving boundary velocity, enhances the prediction of volumetric deformation, an aspect not thoroughly explored in previous studies. Compared to traditional models focusing solely on mass transfer [23,24], this multiphysics approach provides a more comprehensive understanding of drying processes, aligning with and expanding upon the existing literature.
The developed FEM model predicted final shrinkages ( V / V 0 ) of 0.196, 0.182, 0.266, and 0.381, while the Texture-FEM model predicted values 0.114, 0.120, 0.297, and 0.341, for the RC50, GC50, RC90, and GC90 samples, respectively. Except for the RC90 sample, the Texture-FEM model showed final shrinkages 10–40% lower than those predicted by the FEM model. However, due to the swelling effects of raw cornstarch as a result of water absorption, the final shrinkage of the RC90 samples given by the Texture-FEM model was 11% higher than those obtained by the FEM model.
Figure 10 shows the Texture-FEM simulations evaluated at drying times of 0, 10,000, 20,000, and 30,000 s for the RC50 samples. The hydrogels, initially moulded as cylinders, shrunk, producing angular edges. This phenomenon occurred due to the removal of the primary moisture at the corners of the polyhedron, while the centre of the solid remained wet, as shown by the moisture profile evaluated at t = 10,000 s. At the end of drying (t > 30,000 s), the moisture removal ceased and the solid volume became fixed. The Texture-FEM model also simulated the drying air domain with the coupling of mesh deformation. The inlet air velocity was 0.5 m/s, and changed according to the non-slip condition adopted for the walls’ boundary layer. The ALE method performed the mesh deformation of the air domain with the coupling of solid boundaries, and predicted the shrinkage during the drying.
Both developed numerical models accurately described the three-dimensional mass transfer by diffusion–convection, with an acceptable prediction of volumetric deformation and shrinkage. The coupling of the stiffening coefficient obtained from the texture analysis allowed the adjustment of the moving boundary velocity in the FEM model, and effectively simulated mesh deformation by assuming an increasing Young’s modulus during moisture loss.

4. Conclusions

The FEM model described the drying of cylindrical hydrogels at 60 °C through combined diffusion–convection mass transfer, and evaluated hydrogel shrinkage by the ALE method. In addition, a Texture-FEM model was also developed, which incorporated a dimensionless relationship (stiffness coefficient) between the texture coefficients and moisture levels in relation to the first FEM model. The composition of the hydrogels and thermal pre-treatment (80 °C) resulted in materials with distinct properties. The effective mass diffusivity ranged from 2.38 to 5.46 × 10⁻¹⁰ m2∙s−1. The moisture content ranged from 0.91 to 0.55 kg∙kg−1 w.b., and the Young’s modulus ranged from 24 to 147 kPa. In particular, the samples containing 50% d.b. of cornstarch (RC50) showed higher diffusivity, higher moisture, and a lower Young’s modulus. The stiffness coefficients adjust the moving boundary velocity and better predict the volumetric deformation of hydrogels, showing a solid shrinkage ( V / V 0 ) ranging from 0.114 to 0.341. The Texture-FEM model showed final shrinkages 10–40% lower than those predicted by the FEM model. Samples with swelling effects (RC90) showed a modified stiffness coefficient ( β 1 > 1) and a lower volumetric deformation, which could be explained by the higher water absorption by raw cornstarch in the initial drying period. This study used the Ogden hyperelastic model to describe the behavior of hydrogels during drying. However, it was observed that with prolonged drying time, the solid becomes rigid, forming a Hookean solid, at which point deformation stops. At this stage, the hyperelastic model is no longer valid. In general, the developed drying models proved useful in describing the drying profiles of hydrogels and food materials, evaluating material properties, and predicting solid shrinkage.

Author Contributions

All authors contributed to the study conception and design. Material preparation, data collection, and analysis were performed by M.A.V.d.S.J. Mathematical modelling and simulation were performed by G.C.D. and M.A.V.d.S.J. The first draft of the manuscript was written by G.C.D., M.A.V.d.S.J. and G.F. All authors commented on previous versions of the manuscript. All authors have read and agreed to the published version of the manuscript.

Funding

This study was financed in part by the Coordenação de Aperfeiçoamento de Pessoal de Nível Superior—Brasil (CAPES)—Finance Code 001.

Data Availability Statement

Dataset available on request from the authors.

Conflicts of Interest

On behalf of all authors, the corresponding author states that there are no conflicts of interest.

Nomenclature

SymbolDescription
A Area (m2)
c Water concentration (mol∙m−3)
d Sample diameter (m)
D a i r Diffusivity of water in air domain (m2∙s−1)
D e f f Effective diffusivity of water in solid domain (m2∙s−1)
E Elasticity modulus or Young’s modulus (Pa)
F Applied force during uniaxial compression (N)
h Sample height during uniaxial compression (m)
H 0 Initial sample height (m)
J n Total normal molar flux (mol∙m−2∙s−1)
K p Partition coefficient (dimensionless)
M w Water molar mass (kg∙mol−1)
m Mass (kg)
P Pressure (Pa)
R Universal gas constant (J∙mol−1∙K−1)
T Air temperature (°C or K)
t Time (s)
U Energy required to compress the gels (J)
V Volume (m3)
V V 0 Shrinkage (dimensionless)
v Air velocity (m∙s−1)
v n Normal velocity of moving boundary (m∙s−1)
W Moisture content in wet basis (kg∙kg−1)
X Moisture content in dry basis (kg∙kg−1)
X R Moisture ratio (dimensionless)
α Ogden constant (dimensionless)
β 1 Stiffening coefficient (dimensionless)
ε Strain (m∙m−1)
λ Stretch ratio (dimensionless)
μ Initial shear modulus (Pa)
ρ Density (kg∙m−3)
σ Stress (Pa)
GC50Dried samples containing 50% of gelatinized cornstarch
GC90Dried samples containing 90% of gelatinized cornstarch
RC50Dried samples containing 50% of native cornstarch
RC90Dried samples containing 90% of native cornstarch

References

  1. Ratner, B.D. The Biocompatibility of Implant Materials. In Biocompatibility of Clinical Implant Materials; Williams, D.F., Ed.; CRC Press: Boca Raton, FL, USA, 1981; p. 272. ISBN 0849366259. [Google Scholar]
  2. Risbud, M.V.; Hardikar, A.A.; Bhat, S.V.; Bhonde, R.R. PH-Sensitive Freeze-Dried Chitosan-Polyvinyl Pyrrolidone Hydrogels as Controlled Release System for Antibiotic Delivery. J. Control Release 2000, 68, 23–30. [Google Scholar] [CrossRef] [PubMed]
  3. Picone, C.S.F.; Cunha, R.L. Influence of PH on Formation and Properties of Gellan Gels. Carbohydr. Polym. 2011, 84, 662–668. [Google Scholar] [CrossRef]
  4. Thu, B.; Bruheim, P.; Espevik, T.; Smidsrød, O.; Soon-Shiong, P.; Skjåk-Bræk, G. Alginate Polycation Microcapsules: I. Interaction between Alginate and Polycation. Biomaterials 1996, 17, 1031–1040. [Google Scholar] [CrossRef] [PubMed]
  5. Grant, G.T.; Morris, E.R.; Rees, D.A.; Smith, P.J.C.; Thom, D. Biological Interactions between Polysaccharides and Divalent Cations: The Egg-Box Model. FEBS Lett. 1973, 32, 195–198. [Google Scholar] [CrossRef]
  6. Bhagya Raj, G.V.S.; Dash, K.K. Microencapsulation of Betacyanin from Dragon Fruit Peel by Complex Coacervation: Physicochemical Characteristics, Thermal Stability, and Release Profile of Microcapsules. Food Biosci. 2022, 49, 1011882. [Google Scholar] [CrossRef]
  7. Toprakçı, İ.; Şahin, S. Encapsulation of Olive Leaf Antioxidants in Microbeads: Application of Alginate and Chitosan as Wall Materials. Sustain. Chem. Pharm. 2022, 27, 100707. [Google Scholar] [CrossRef]
  8. Brownlee, I.A.; Allen, A.; Pearson, J.P.; Dettmar, P.W.; Havler, M.E.; Atherton, M.R.; Onsøyen, E. Alginate as a Source of Dietary Fiber. Crit. Rev. Food Sci. Nutr. 2005, 45, 497–510. [Google Scholar] [CrossRef]
  9. Paxman, J.R.; Richardson, J.C.; Dettmar, P.W.; Corfe, B.M. Daily Ingestion of Alginate Reduces Energy Intake in Free-Living Subjects. Appetite 2008, 51, 713–719. [Google Scholar] [CrossRef] [PubMed]
  10. de Cássia Sousa Mendes, D.; Asquieri, E.R.; Batista, R.D.; de Morais, C.C.; Ramirez Ascheri, D.P.; de Macêdo, I.Y.L.; de Souza Gil, E. Microencapsulation of Jabuticaba Extracts (Myrciaria Cauliflora): Evaluation of Their Bioactive and Thermal Properties in Cassava Starch Biscuits. LWT 2021, 137, 110460. [Google Scholar] [CrossRef]
  11. Oberoi, K.; Tolun, A.; Altintas, Z.; Sharma, S. Effect of Alginate-Microencapsulated Hydrogels on the Survival of Lactobacillus Rhamnosus under Simulated Gastrointestinal Conditions. Foods 2021, 10, 1999. [Google Scholar] [CrossRef]
  12. Olayemi, O.J.; Apeji, Y.E.; Isimi, C.Y. Formulation and Evaluation of Cyperus Esculentus (Tiger Nut) Starch-Alginate Microbeads in the Oral Delivery of Ibuprofen. J. Pharm. Innov. 2022, 17, 366–375. [Google Scholar] [CrossRef]
  13. Ta, L.P.; Bujna, E.; Antal, O.; Ladányi, M.; Juhász, R.; Szécsi, A.; Kun, S.; Sudheer, S.; Gupta, V.K.; Nguyen, Q.D. Effects of Various Polysaccharides (Alginate, Carrageenan, Gums, Chitosan) and Their Combination with Prebiotic Saccharides (Resistant Starch, Lactosucrose, Lactulose) on the Encapsulation of Probiotic Bacteria Lactobacillus Casei 01 Strain. Int. J. Biol. Macromol. 2021, 183, 1136–1144. [Google Scholar] [CrossRef]
  14. Okunlola, A.; Adewusi, S.A. Development of Theophylline Microbeads Using Pregelatinized Breadfruit Starch (Artocarpus Altilis) as a Novel Co-Polymer for Controlled Release. Adv. Pharm. Bull. 2019, 9, 93–101. [Google Scholar] [CrossRef] [PubMed]
  15. Feltre, G.; Sartori, T.; Silva, K.F.C.; Dacanal, G.C.; Menegalli, F.C.; Hubinger, M.D. Encapsulation of Wheat Germ Oil in Alginate-gelatinized Corn Starch Beads: Physicochemical Properties and Tocopherols’ Stability. J. Food Sci. 2020, 85, 2124–2133. [Google Scholar] [CrossRef]
  16. Nicolin, D.J.; Defendi, R.O.; Rossoni, D.F.; de Matos Jorge, L.M. Mathematical Modeling of Soybean Drying by a Fractional-Order Kinetic Model. J. Food Process. Eng. 2018, 41, e12655. [Google Scholar] [CrossRef]
  17. Malekjani, N.; Jafari, S.M. Simulation of Food Drying Processes by Computational Fluid Dynamics (CFD); Recent Advances and Approaches. Trends Food Sci. Technol. 2018, 78, 206–223. [Google Scholar] [CrossRef]
  18. Bastiani, F.H.; Sufredini, S.; Romio, A.P.; Nicolin, D.J. Modeling the Drying Kinetics of Alginate Particles Considering Shrinkage. J. Food Process. Eng. 2021, 44, e13760. [Google Scholar] [CrossRef]
  19. Achchaq, F.; Jomaa, W.; Godin, A.; Bontemps, S.; Puiggali, J.R. Temperature and Moisture Effects on the Failure Mode of Highly Shrinkable Raw Catalyst Supports. Procedia Struct. Integr. 2016, 2, 2283–2290. [Google Scholar] [CrossRef]
  20. Mayor, L.; Sereno, A.M. Modelling Shrinkage during Convective Drying of Food Materials: A Review. J. Food Eng. 2004, 61, 373–386. [Google Scholar] [CrossRef]
  21. Nguyen, T.K.; Khalloufi, S.; Mondor, M.; Ratti, C. Shrinkage and Porosity Evolution during Air-Drying of Non-Cellular Food Systems: Experimental Data versus Mathematical Modelling. Food Res. Int. 2017, 103, 215–225. [Google Scholar] [CrossRef]
  22. Ratti, C. Shrinkage during Drying of Foodstuffs. J. Food Eng. 1994, 23, 91–105. [Google Scholar] [CrossRef]
  23. Silva Júnior, M.A.V.; Rabi, J.A.; Ribeiro, R.; Dacanal, G.C. Modeling of Convective Drying of Cornstarch-Alginate Gel Slabs. J. Food Eng. 2019, 250, 9–17. [Google Scholar] [CrossRef]
  24. Silva Júnior, M.A.V.; Leite, M.A.; Dacanal, G.C. Modelling of Convective Drying of Potatoes Polyhedrons. Int. J. Food Eng. 2023, 19, 605–617. [Google Scholar] [CrossRef]
  25. Association of Official Analytical Chemists. Official Methods of Analysis of AOAC International, 18th ed.; Association of Official Analytical Chemists: Arlington, VA, USA, 2005. [Google Scholar]
  26. Nielsen, S.S. Moisture Content Determination BT—Food Analysis Laboratory Manual; Nielsen, S.S., Ed.; Springer International Publishing: Cham, Switzerland, 2017; pp. 105–115. ISBN 978-3-319-44127-6. [Google Scholar]
  27. Yu, J.; Santos, P.H.S.; Campanella, O.H. A Study to Characterize the Mechanical Behavior of Semisolid Viscoelastic Systems under Compression Chewing—Case Study of Agar Gel. J. Texture Stud. 2012, 43, 459–467. [Google Scholar] [CrossRef]
  28. Gamonpilas, C.; Charalambides, M.N.; Williams, J.G. Determination of Large Deformation and Fracture Behaviour of Starch Gels from Conventional and Wire Cutting Experiments. J. Mater. Sci. 2009, 44, 4976–4986. [Google Scholar] [CrossRef]
  29. Cussler, E.L. Diffusion Mass Transfer in Fluid Systems, 3rd ed.; Cambridge University Press: Cambrigde, UK, 2009; ISBN 9780521871211. [Google Scholar]
  30. Ajani, C.; Kumar, A.; Curcio, S.; Tekasakul, P. Parametric Study and Shrinkage Modelling of Natural Rubber Sheet Drying Using COMSOL Multiphysics. IOP Conf. Ser. Mater. Sci. Eng. 2017, 243, 012012. [Google Scholar] [CrossRef]
  31. Sun, M.L.; Wu, D.; Wang, M.Q.; Jin, S.F.; Wang, K.Z. Simulation Analysis of Fluid-Structure Interactions with Moving Mesh. Adv. Mater. Res. 2011, 305, 235–238. [Google Scholar] [CrossRef]
  32. Thussu, S.; Datta, A.K. Texture Prediction during Deep Frying: A Mechanistic Approach. J. Food Eng. 2012, 108, 111–121. [Google Scholar] [CrossRef]
  33. Nafo, W.; Al-Mayah, A. Characterization of PVA Hydrogels’ Hyperelastic Properties by Uniaxial Tension and Cavity Expansion Tests. Int. J. Non-Linear Mech. 2020, 124, 103515. [Google Scholar] [CrossRef]
  34. Di Giuseppe, M.; Law, N.; Webb, B.; Macrae, R.A.; Liew, L.J.; Sercombe, T.B.; Dilley, R.J.; Doyle, B.J. Mechanical Behaviour of Alginate-Gelatin Hydrogels for 3D Bioprinting. J. Mech. Behav. Biomed. Mater. 2018, 79, 150–157. [Google Scholar] [CrossRef]
Figure 1. Experimental steps used to produce hydrogel samples.
Processes 12 01564 g001
Figure 2. Scheme of the geometry used in the simulation of drying in a three-dimensional FEM model.
Processes 12 01564 g002
Figure 3. Shrinkage of RC50 sample during convective drying.
Processes 12 01564 g003
Figure 4. Hydrogels under uniaxial compression during texture analysis.
Processes 12 01564 g004
Figure 5. Uniaxial compression tests for collected starch–alginate samples.
Processes 12 01564 g005
Figure 6. Evaluation of the stiffening coefficient by the dimensionless relationship between elastic modulus and moisture loss ratio.
Processes 12 01564 g006
Figure 7. COMSOL simulation with experimental data extracted from texture tests.
Processes 12 01564 g007
Figure 8. Drying rate profiles obtained from the first-order derivative.
Processes 12 01564 g008
Figure 9. Shrinkage profiles simulated by FEM model and Texture-FEM model.
Processes 12 01564 g009
Figure 10. Evaluation of shrinkage, moisture content, and drying air flow profiles from Texture-FEM model for RC50 samples.
Processes 12 01564 g010
Table 1. Concentrations of corn starch and alginate suspensions and starch fractions after the ionic gelation.
SampleRC50RC90GC50GC90
Corn starch (g/100 g d.b.)50905090
Corn starch (g/100 g w.b.)5.233.25.233.2
Water (g/100 g w.b.)86.661.186.661.1
Sodium alginate (g/100 g w.b.)4.63.24.63.2
Ethanol (g/100 g w.b.)3.62.53.62.5
1 Heating temperature (°C)n.a.n.a.8080
1 60 min of heat treatment.
Table 2. Sample size and parameters applied to convective drying of starch–alginate hydrogels at a temperature of 60 °C.
SampleRC50GC50RC90GC90
d , Diameter (cm)2.60 ± 0.022.45 ± 0.042.56 ± 0.022.65 ± 0.03
h , Height (cm)2.26 ± 0.082.17 ± 0.062.08 ± 0.132.49 ± 0.19
X 0 , Initial moisture (-)10.29 ± 0.068.41 ± 0.062.25 ± 0.031.85 ± 0.03
X f , Final moisture (-)0.93 ± 0.050.48 ± 0.080.22 ± 0.040.18 ± 0.01
ρ 2 , Solid density of wet hydrogel (g⋅cm−3)1055.3 ± 3.61061.2 ± 9.31186.7 ± 46.41160.7 ± 23.9
ρ 2 s , Solid density of dry hydrogel (g⋅cm−3)1849.4 ± 94.91928.6 ± 91.71657.5 ± 24.71826.9 ± 81.1
D e f f ,   Mass   diffusivity   of   water   in   solid   ( 10 10 m2⋅s−1)5.463.784.422.38
Table 3. Uniaxial compression tests of gels with different moisture contents, produced during convective drying at 60 °C.
SampleDrying Time (h) W
(kg∙kg−1 w.b.)
X
(kg∙kg−1 d.b.)
µ
(Pa)
α
(-)
E
(Pa)
U
(103 J)
GC5000.8937 ± 0.00078.41 ± 0.0624,798.6 ± 66.17.61 ± 0.4274,395.836.6
GC500.50.8803 ± 0.00247.36 ± 0.1621,104.9 ± 286.07.62 ± 0.0563,314.728.7
GC501.50.8576 ± 0.00506.03 ± 0.2527,227.4 ± 1006.06.73 ± 0.8981,682.134.5
GC502.00.8472 ± 0.00955.56 ± 0.4031,032.2 ± 2384.06.17 ± 0.3393,096.639.3
RC5000.9114 ± 0.000510.29 ± 0.0624,605.1 ± 4.37.84 ± 0.1873,815.241.6
RC500.50.9014 ± 0.00059.14 ± 0.0522,572.3 ± 2377.06.55 ± 0.3467,716.833.5
RC501.50.8813 ± 0.01427.51 ± 1.0318,443.0 ± 335.96.97 ± 0.1055,329.133.2
RC502.00.8696 ± 0.00386.68 ± 0.2218,069.4 ± 1463.06.24 ± 0.9254,028.232.6
GC9000.6497 ± 0.00391.85 ± 0.0393,982.3 ± 2721.03.82 ± 0.07281,946.8111.4
GC900.50.6070 ± 0.00381.54 ± 0.02108,094 ± 4876.04.41 ± 0.05324,282.0125.8
GC901.50.5640 ± 0.00531.29 ± 0.03110,686 ± 4391.04.69 ± 0.90332,059.5134.5
GC902.00.5514 ± 0.01281.23 ± 0.06147,374 ± 4249.03.13 ± 0.80442,124.0167.0
RC9000.6921 ± 0.00332.25 ± 0.0317,327.8 ± 4945.08.38 ± 0.6851,983.430.9
RC900.50.6664 ± 0.00172.00 ± 0.0210,182.7 ± 1362.08.78 ± 0.1530,548.121.8
RC901.50.6162 ± 0.00621.61 ± 0.0425,589.3 ± 548.37.15 ± 0.6176,767.950.1
RC902.00.5830 ± 0.00961.40 ± 0.0539,295 ± 20,990.07.11 ± 1.92117,885.867.5
Disclaimer/Publisher’s Note: The statements, opinions and data contained in all publications are solely those of the individual author(s) and contributor(s) and not of MDPI and/or the editor(s). MDPI and/or the editor(s) disclaim responsibility for any injury to people or property resulting from any ideas, methods, instructions or products referred to in the content.

