Article

Research for Flow Behavior of Heavy Oil by CO2 Foam Viscosity Reducer-Assisted Steam (CFVAS) Flooding: Microscopic Displacement Experiment Study

1
School of Petroleum and Natural Gas Engineering, Changzhou University, Changzhou 213164, China
2
Shaanxi Key Laboratory of Advanced Stimulation Technology for Oil & Gas Reservoirs, Xi’an Shiyou University, Xi’an 710065, China
*
Authors to whom correspondence should be addressed.
Processes 2024, 12(8), 1582; https://doi.org/10.3390/pr12081582
Submission received: 28 June 2024 / Revised: 24 July 2024 / Accepted: 26 July 2024 / Published: 28 July 2024
(This article belongs to the Section Energy Systems)

Abstract

:
Steam displacement is prone to cross-flow, small swept area, large oil–water ratio, large oil–water interfacial tension, and low oil displacement efficiency. Compared with steam flooding, foam flooding can effectively reduce the residual oil in the small throat of the main flow channel and the small hole in the near flow channel and increase the overall recovery factor. Therefore, researchers carried out CO2 and chemical agent-assisted steam displacement. However, at present, there is a lack of research on the occurrence mechanism and model of residual oil. Steam flooding often encounters challenges such as cross-flow, limited sweep area, and high oil–water ratio. Foam flooding offers a promising alternative by effectively reducing residual oil in narrow throats and the near flow channel, thereby enhancing overall recovery rates compared to steam flooding alone. Therefore, chemical agent-assisted steam flooding was applied to enhance heavy oil recovery. However, the occurrence mechanism and model of residual oil after chemical agent-assisted steam is not clear. To fill this gap, the CO2 foam viscosity reducer assisted steam (CFVAS) flooding technology has been adopted and carried out in several studies. First, the foam viscosity reducer was prepared and its foam properties (viscosity reduction effect, foam volume, and half-life) were tested. Subsequently, the CFVAS displacement experiments after steam flooding were carried out, and the flow behavior of the remaining oil in multiple regions (main flow channel, near flow channel, and far flow channel) was analyzed. Finally, the shape and number of remaining oil under different displacement stages were compared, and the occurrence mode of remaining oil under CFVAS displacement was determined. The results indicate the following: (1) During steam flooding, the amount of near flow channel residual oil decreased with injected pore volumes (PV), transforming into columnar structures in small perforations and film-like formations in far flow channels. (2) CFVAS flooding, including the foam stability mechanism, flow channel adjustment mechanism, and emulsification and dispersion mechanism, can improve overall recovery rates by 55.2% by driving the remaining oil in near flow channels. (3) During CFVAS flooding stage, crude oil mobility notably improved and flooding front expanded more evenly. Residual oil primarily existed as oil-in-water (O/W) emulsions with discontinuous columns. (4) In the CFVAS flooding stage, residual oil mainly formed O/W emulsions through emulsification and dispersion, with foam-filled large and medium pores, concentrating residual oil in thick and middle throats. This work can provide important references for injecting CO2 gas into reservoirs to enhance heavy oil recovery and promote carbon sequestration.

1. Introduction

In the middle of the 20th century, research scholars disclosed that adding foam agents during the oil production process could effectively enhance oil recovery [1]. Through continuous and profound exploration, it was noticed that injecting CO2, N2, or other gases into reservoirs could considerably enhance the oil production of heterogeneous and low-permeability reservoirs [2]. At the 1997 International Symposium on Oilfield Chemistry, scholars deliberated on the performance of CO2 foam flooding and affirmed its capability to effectively improve the efficiency of crude oil recovery [3]. Studies have been conducted on the mechanism of reducing viscosity by foam chemical agents in ultra-heavy oil [4], and it is found that too little injection volume of chemical agents or gas does not affect the flow of ultra-heavy oil. To further enhance crude oil recovery using CO2 foam flooding, its viscosity reduction effect and recovery mechanism have gradually drawn attention. Through conducting experiments on the mixed-phase displacement of CO2 with heavy oil [5,6], it was found that CO2 injection could effectively reduce the viscosity of heavy oil and enhance its mobility.
Under reservoir conditions, the use of aqueous surfactants containing 0.70 gas fraction to stabilize CO2 foam can provide a significant mobility reduction factor of 340 compared to pure CO2 injection [7]. Compared with conventional gas foam chemical agents, researchers have gradually explored the advantages of combining CO2 with chemical agents [8]. On the one hand, CO2 can effectively dissolve in crude oil to decrease viscosity [9,10]. CO2 foam can expand the application range of viscosity reducers, and then push chemical agents deeper into reservoirs. On the other hand, CO2 injection efficiently mitigates greenhouse gases [11]. Therefore, CO2 foam has better economic and social benefits compared to N2 foam [12,13,14]. Similarly, surfactant solutions can be added to CO2 foam [15,16,17] to improve foam performance. For example, non-ionic surfactants [18,19] enhance foam stability in high-temperature and highly mineralized heavy oil reservoirs [20,21,22]. In addition to surfactants, polymers can also act together with CO2 foam. Li’s experiments, using micromodels simulating heterogeneous rocks, provided a fundamental understanding of phase behavior involving polymer-enhanced air foam [23]. During CO2 foam flooding, the recovery factor of heavy oil without fractured cores was lower than that with complex fractured cores, the results indicated the minimal impact of fracture complexity on the ultimate recovery factor [24].
Currently, the primary methods for developing heavy oil include steam drive and huff-and-puff techniques, but these methods will induce relatively low recovery efficiency. With the continuous exploitation of heavy oil resources, researchers have recognized the potential of adding CO2 foam additives during steam flooding to further develop remaining oil reserves in late-stage oilfields. Experimental studies using CO2-assisted steam huff-and-puff techniques have shown [25] that it is more effective than pure steam or pure CO2 huff-and-puff, increasing the recovery factor by about 20%. Moreover, CO2 foam flooding can reduce CO2 consumption by 15.23% while increasing gas storage capacity by 3.53% [26]. In a comparative analysis of the development effects of N2 and CO2 to assist steam huff-and-puff, it is concluded that adding CO2 during steam huff-and-puff significantly enhances heavy oil production rates [27,28]. Stone et al. employed a one-dimensional physical model to simulate Athabasca bitumen sand and discovered that injecting CO2 into steam could strengthen the driving energy and improve crude oil recovery [29]. Based on these facts, asphalt mining was successfully achieved by mixing high-temperature steam with CO2 and surfactant [30,31]. Of course, more efficient identification and exploitation of oil and gas resources and analysis of asphalt structure cannot be achieved without the application of advanced analytical chemistry technology and geochemistry [32]. Additionally, Mohammed et al. compiled production history data from Forest Oilfield and analyzed the effects of increasing the heavy oil recovery through CO2-assisted steam huff-and-puff [33].
At present, it is generally recognized that CO2 foam-assisted steam flooding can enhance the recovery of heavy oil, but its mechanism is still not clear enough. To fill this gap, we started our research by observing the flow behavior and existence mode of the remaining oil. This work focuses on observing the residual oil distribution and patterns in heavy oil reservoirs assisted by CO2 foam during steam flooding, aiming to understand the mechanism of steam flooding combined with thermal enhanced oil recovery, revealing residual oil distribution characteristics, clarifying the state and patterns of heavy oil residual oil, and providing the theoretical basis and technical support for enhancing heavy oil recovery through combined thermal recovery.

2. Materials and Methods

2.1. Formation Water

Experimental water, CaCl2, and MgCl2 were prepared by simulated strata, with a total mineralization of 40,000 mg/L, a Ca2+ concentration of 1400 mg/L, and 500 mg/L in Mg2+ concentration.

2.2. Crude Oil

Experimental crude oil came from Xinjiang oilfield. The density was 0.966 g/cm3, saturated hydrocarbon 52.6%, aromatics 15.2%, and gum 32.2%.

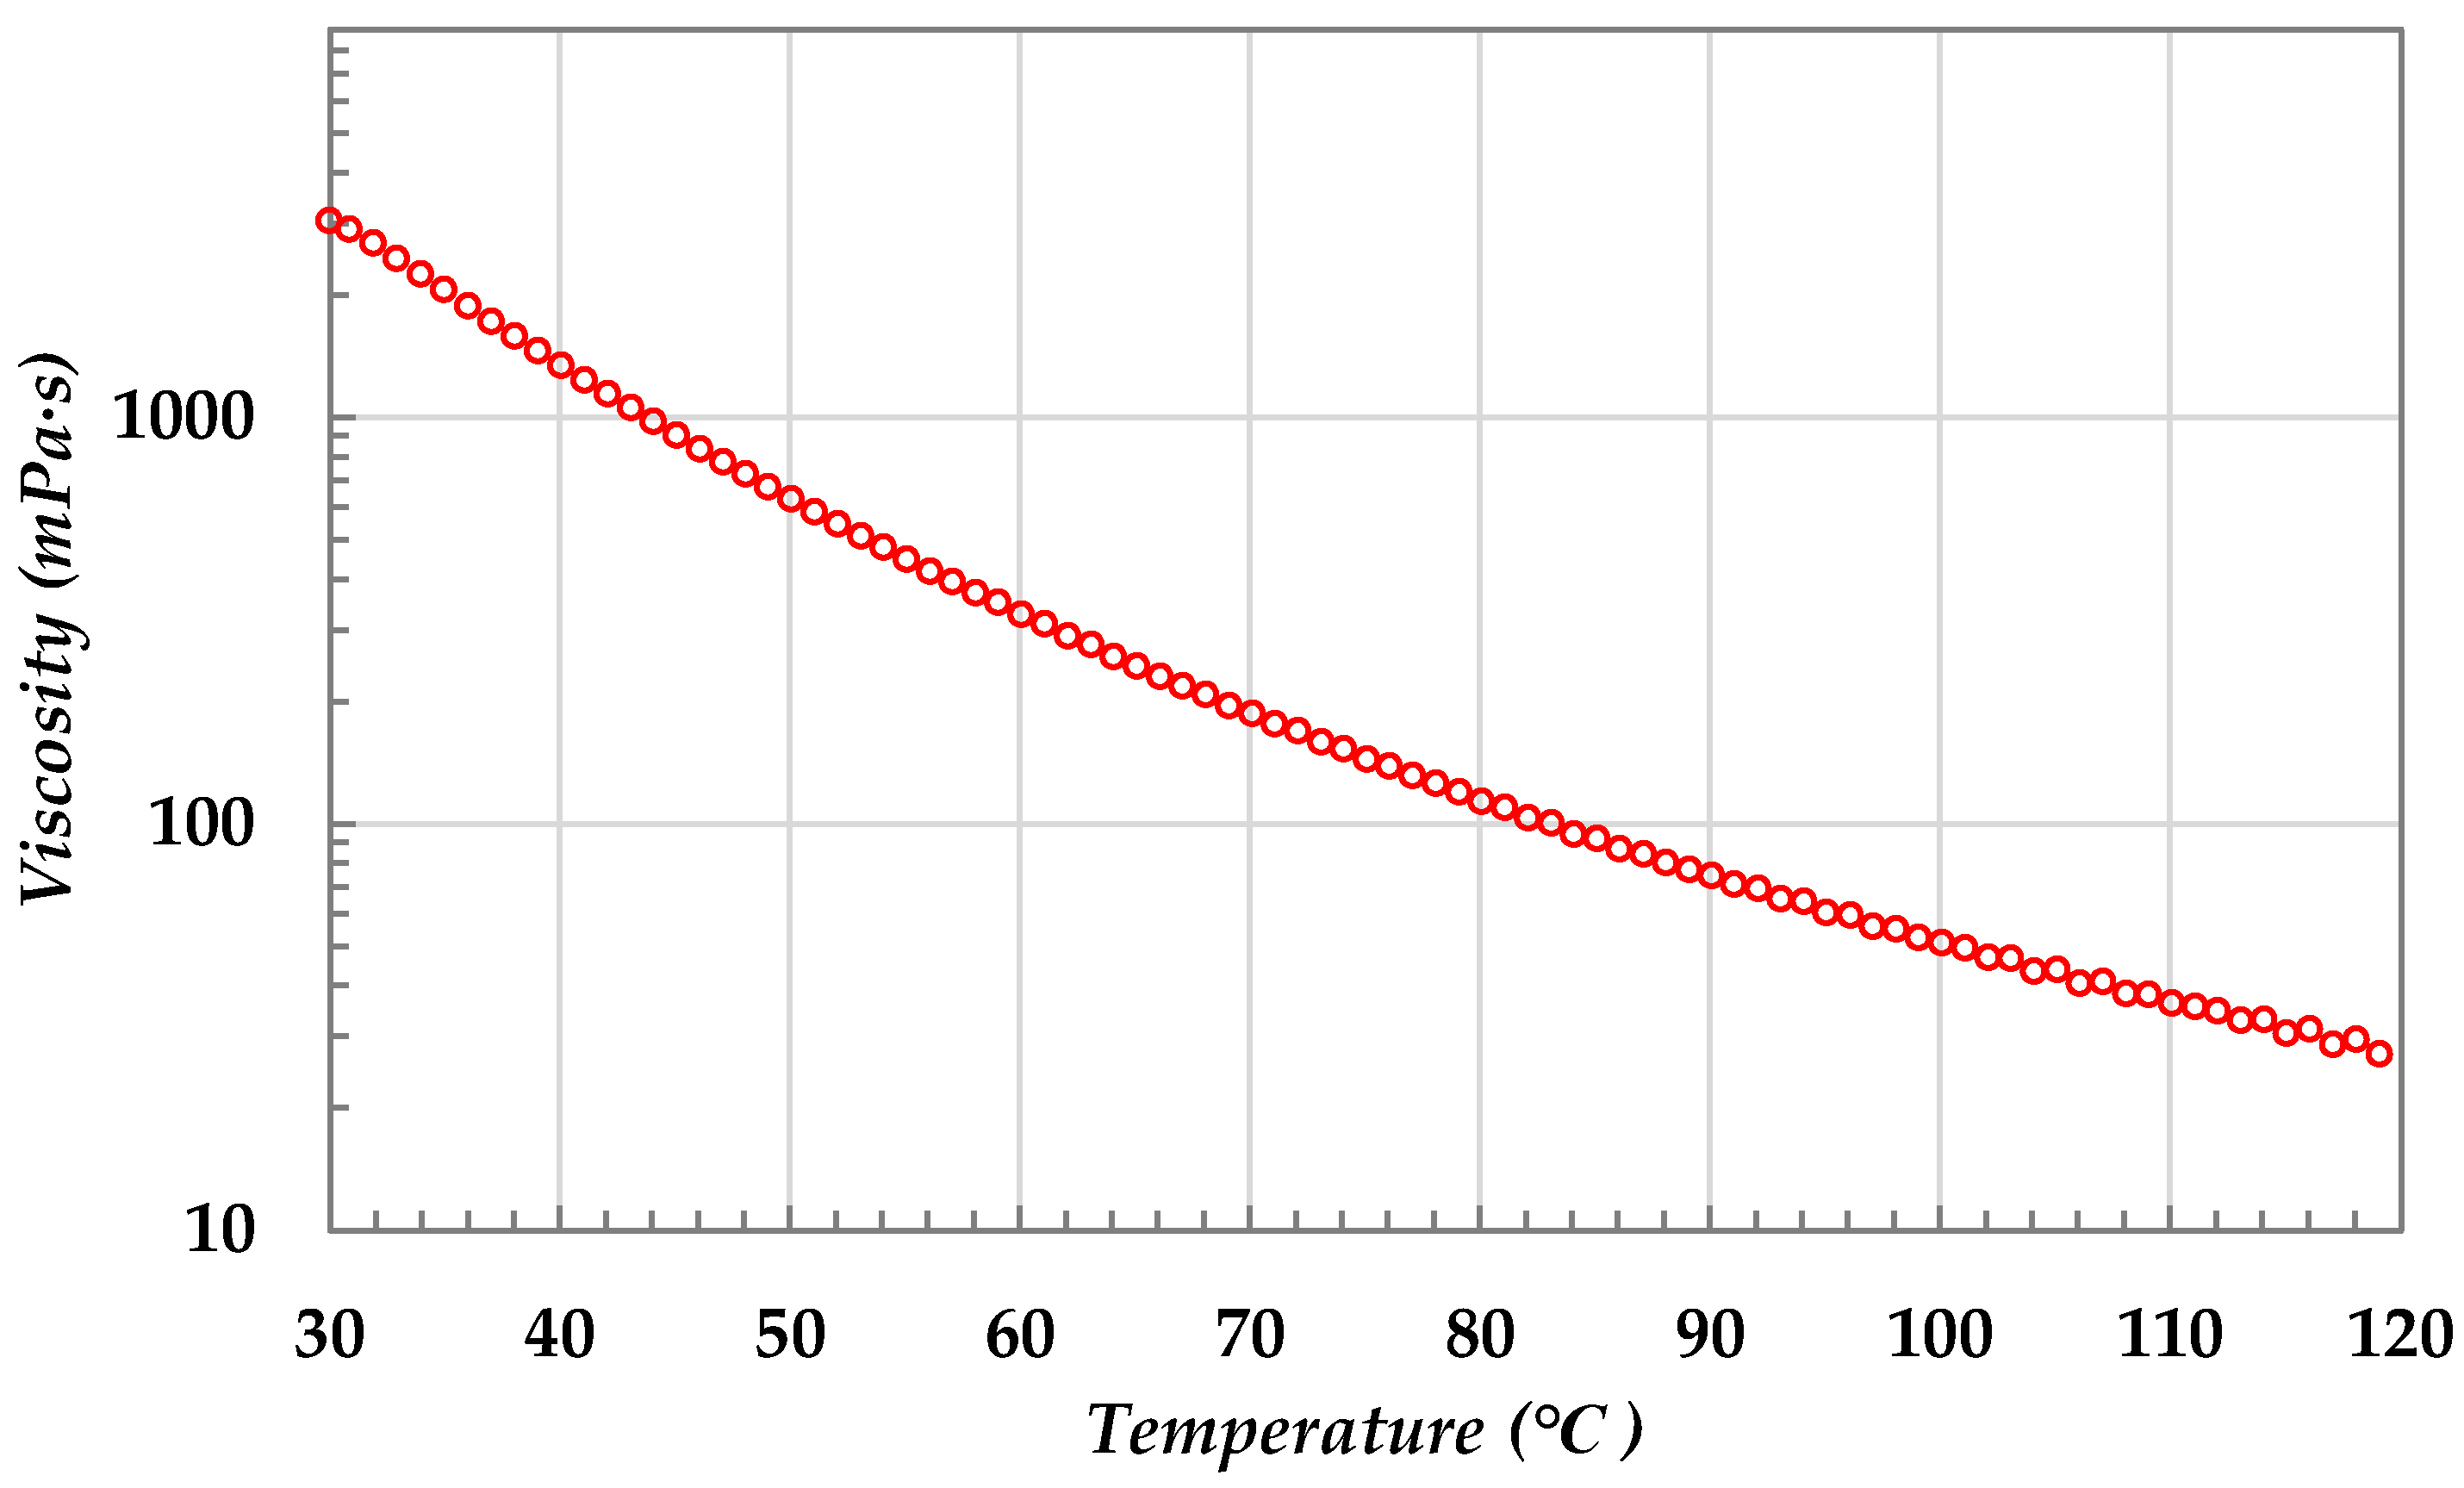
2.2.1. Crude Oil Viscosity

The crude oil in the experiment is a crude oil after dehydration. Measurement of the viscosity of crude oil was carried out by Anton Pal MCR 302 (Anton Pache Group Co., Ltd., Austria Graz, Austria), Germany. The flow instrument parameters were set as follows: the gap was 1.00 mm, the shear rate was 7 S−1, the normal force as 0.11 N, and the temperature gradually increased from 30 °C to 120 °C within 30 min. The 100 data points (Figure 1) show the relationship between viscosity and temperature.

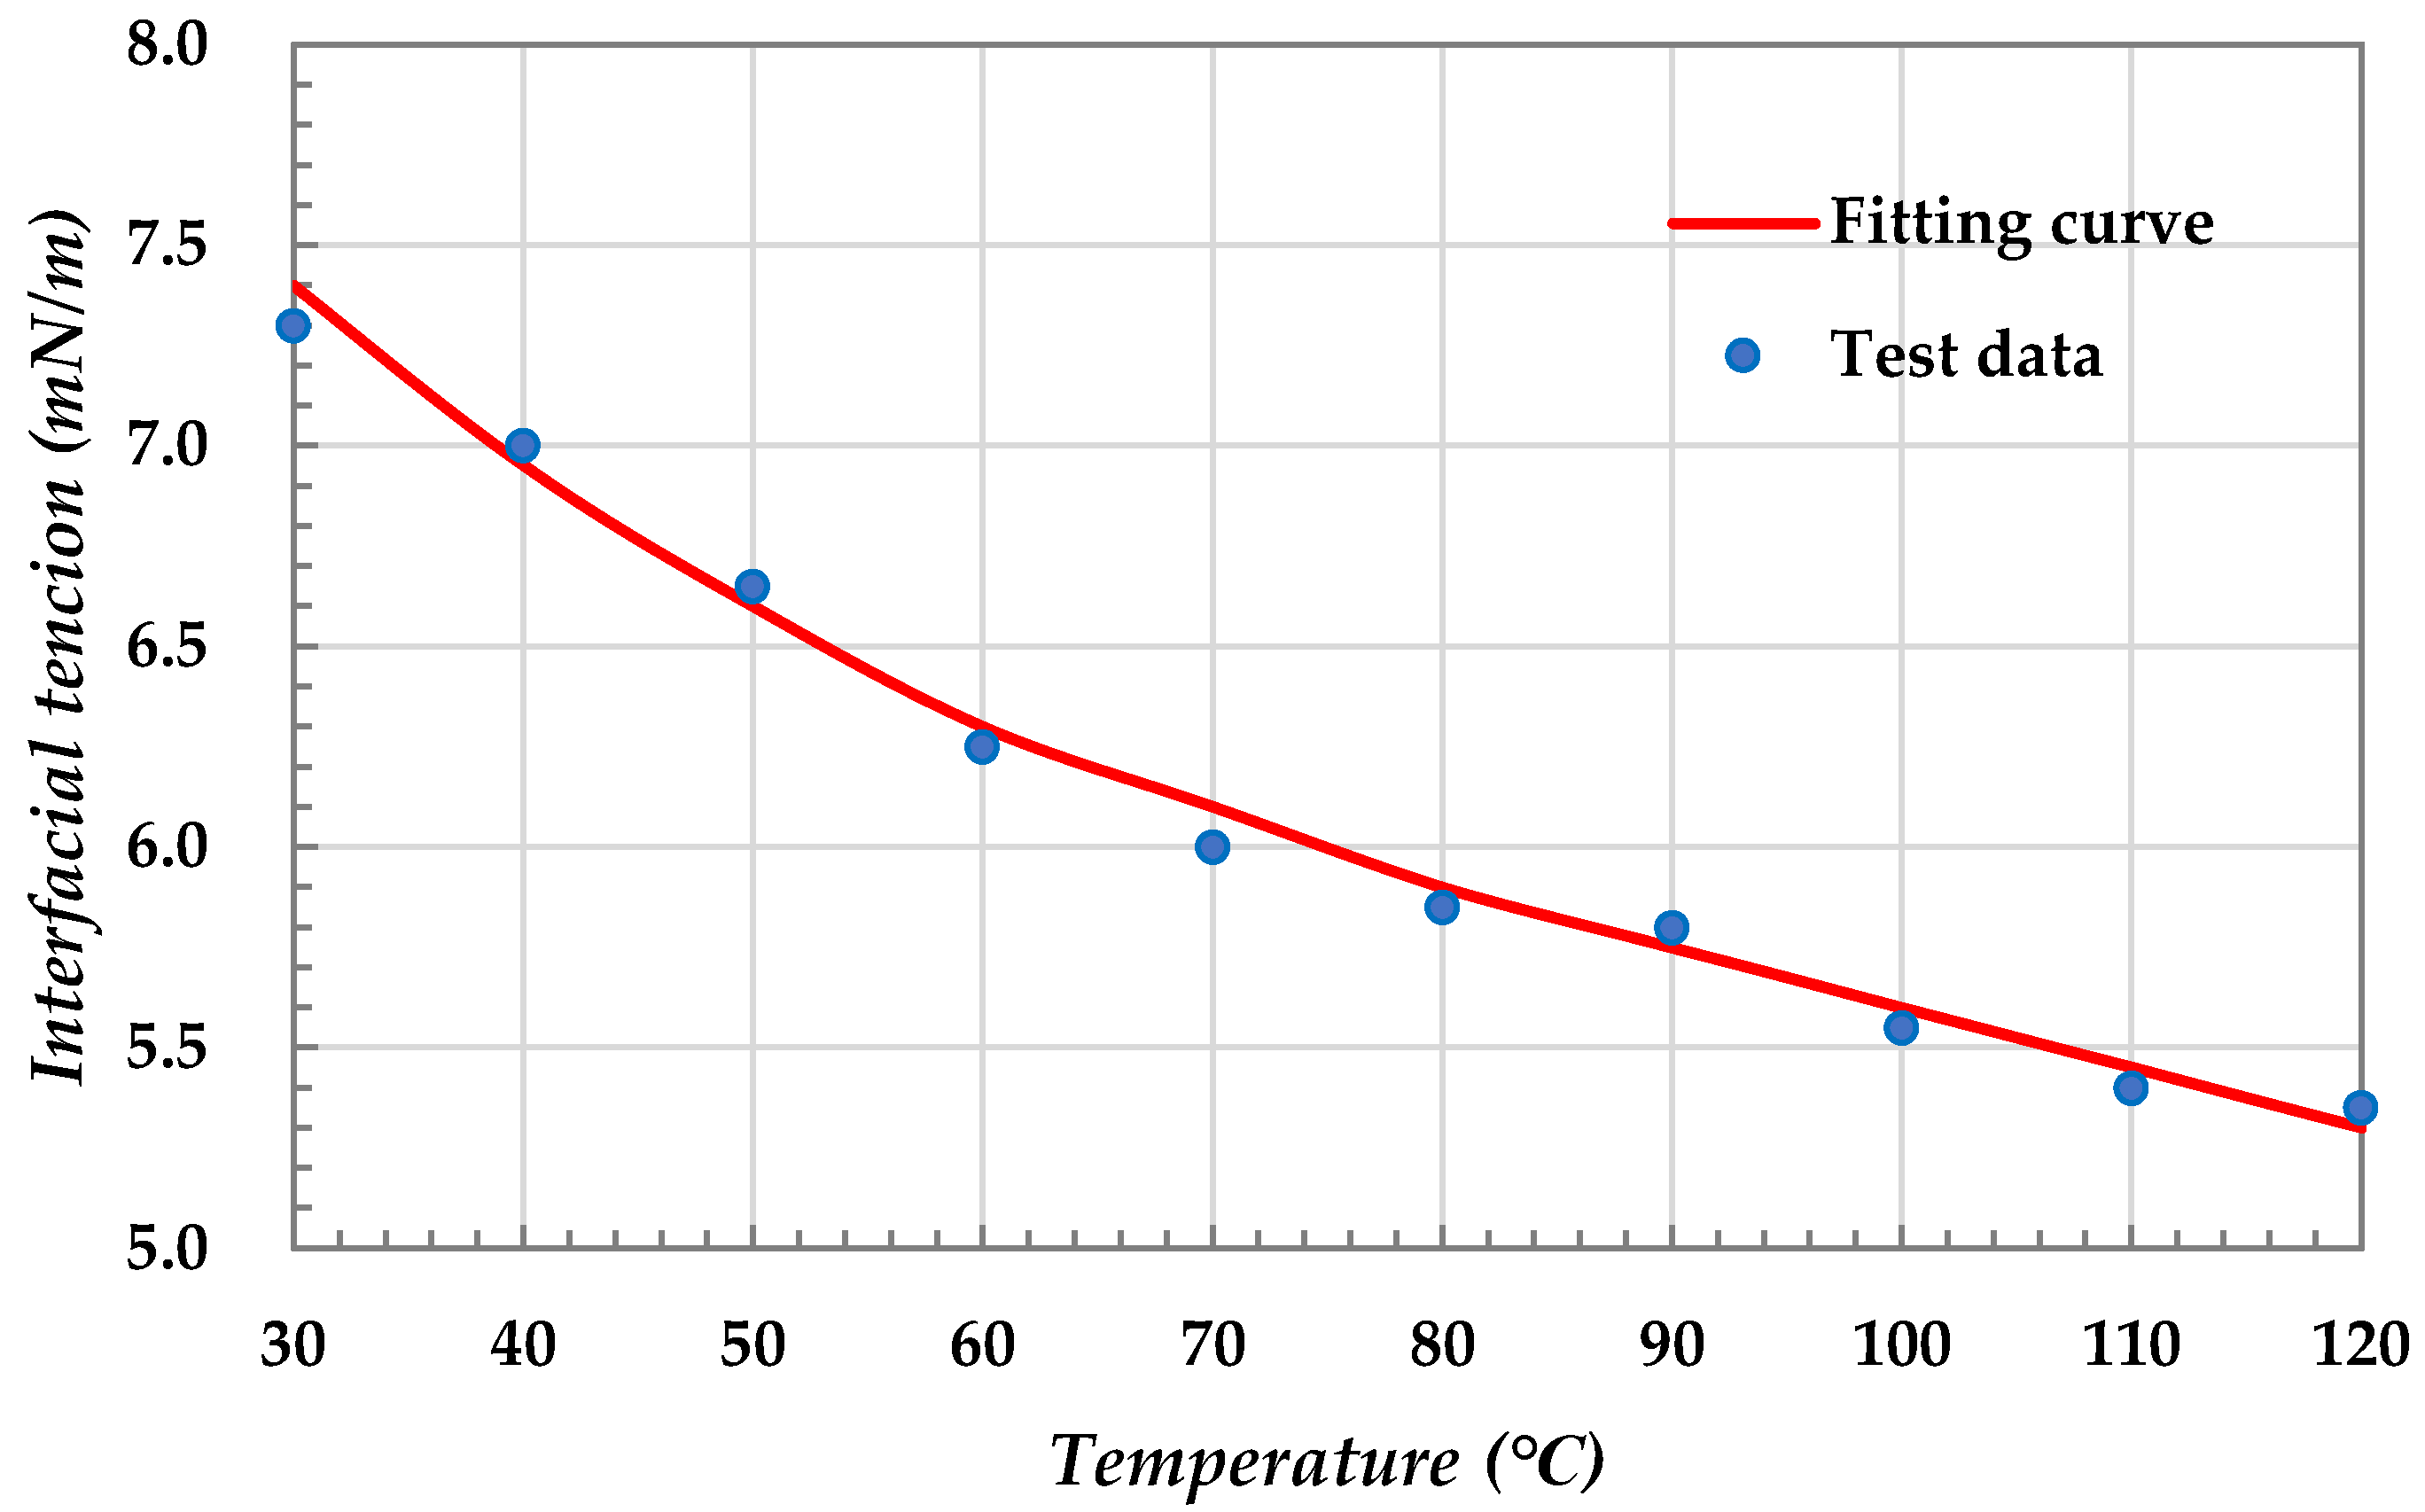
2.2.2. Oil–Water Interfacial Tension

The mixture of stratigraphic water and crude oil was introduced into the TX-500C rotating IFT device (Shanghai Solon Information Technology Co., LTD., from Shanghai, China). During testing, temperatures were varied from 30 °C to 120 °C in 10 °C intervals, with a rotational speed set at 5000 rpm. The test data revealed a mathematical correlation between oil–water interfacial tension and temperature (Figure 2), expressed as σ = 16.447 T−0.234, where σ represents the interfacial tension in mN/m, and T denotes the temperature in degrees Celsius in °C.

2.3. Foam Viscosity Reducer

2.3.1. Preparation of Foam Viscosity Reducer

The composition of the foam viscosity reducer is shown in Table 1. The recommended value of mass fraction was obtained through more than 30 laboratory tests at 55 °C. Although a small difference in mass percentage will not have a significant impact on its foam performance, the recommended mass percentage error should not exceed 0.5%. The optimal concentration of foam viscosity-reducing agent needs to be further discussed through evaluation tests including viscosity-reducing effect and foam properties.

2.3.2. Foam Properties

1.
Viscosity-reducing effect
The foam viscosity reducer solution with a concentration of 0.2 wt%~1.4 wt% was prepared from crude oil. In the course of this test, the test temperature was 55 °C, and the viscosity was used by Anton Paar MCR302 viscometer. To evaluate the viscosity reduction effect of foam viscosity reducer solution at different concentrations, DRμ = (μa − μb)/μa was used to define the viscosity reduction rate, where DRμ is the viscosity reduction rate %; μa is the viscosity before viscosity reduction, mPa·s; and μb is the viscosity after viscosity reduction, mPa·s. As shown in Figure 3, the optimal concentration of the foam viscosity reducer solution is greater than 0.8 wt%.
2.
Performance of foaming
The foaming volume and half-life of different concentrations of foaming viscosities were measured at 55 °C. As shown in Figure 4, the higher the concentration, the larger the foam volume and the longer the half-life of the foam. When the concentration reached 0.8 wt%, the foam volume and foam half-life did not increase significantly. Considering the economic benefits, the optimal dosage of the blowing agent is 0.8 wt%.

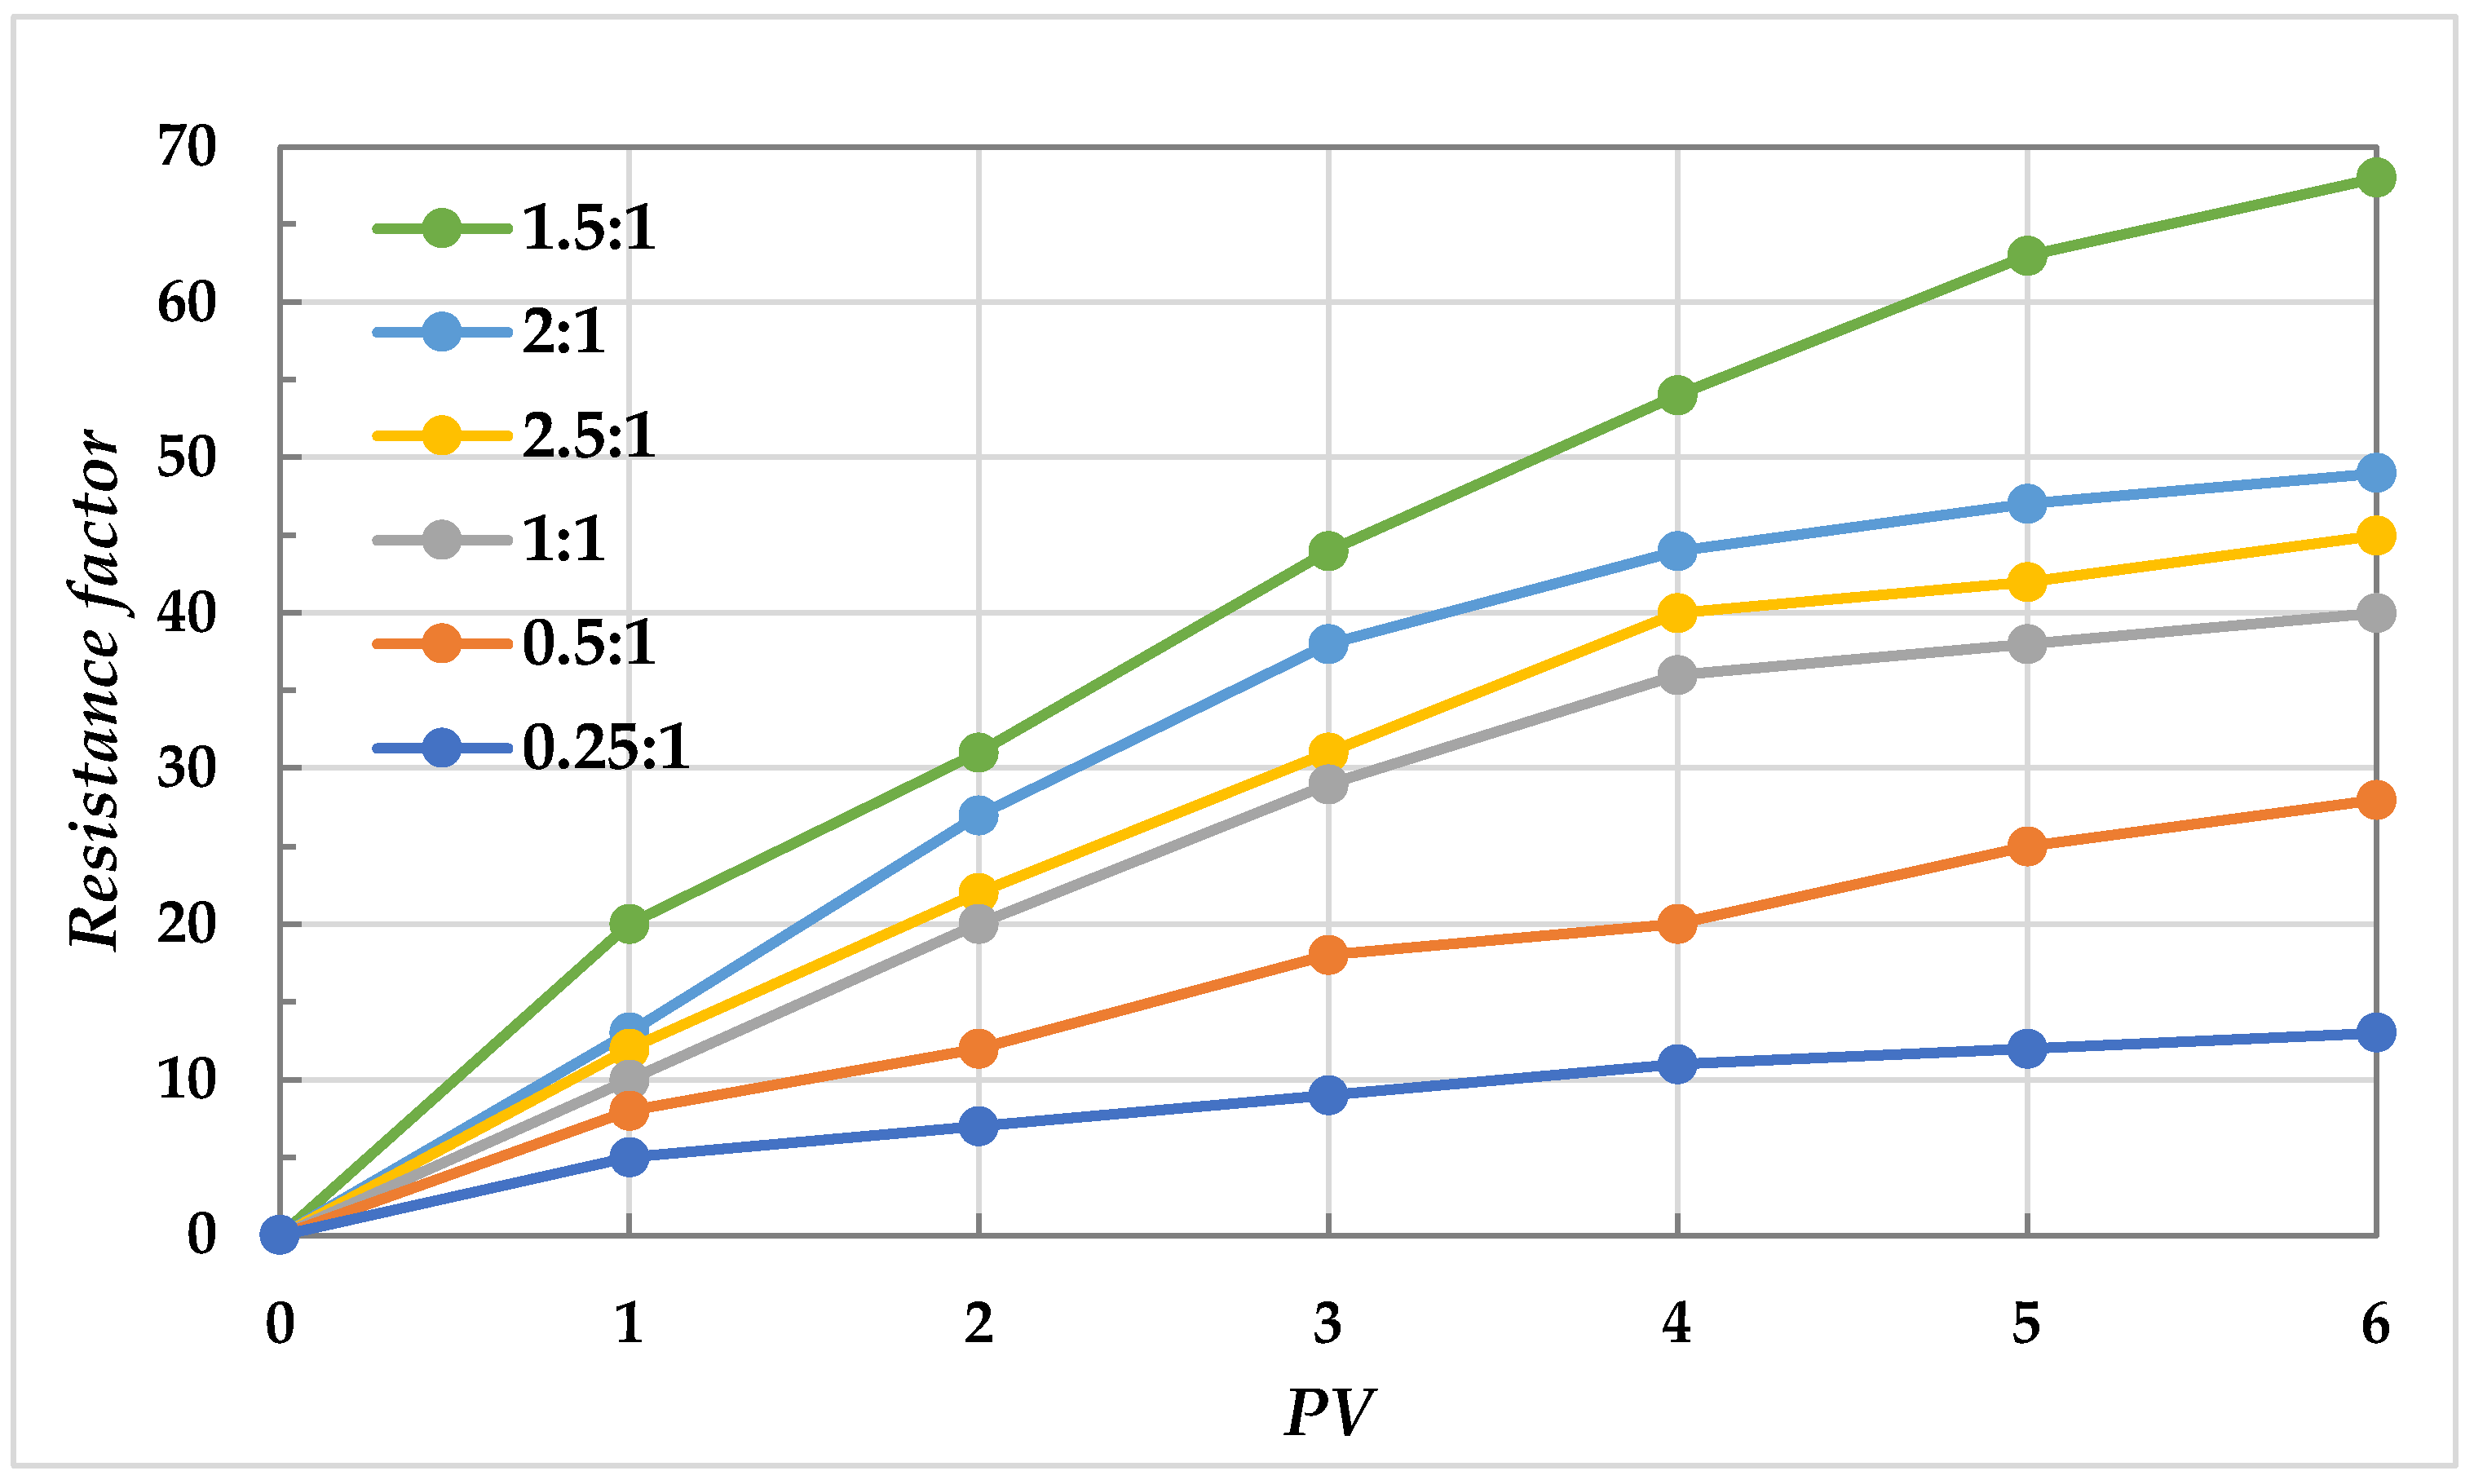
2.3.3. Optimization of CO2 and Foam Viscosity Reducer

In the actual field operation, many factors affect the oil displacement effect of CO2 foam. In this section, the concentration and gas–liquid ratio are tested to optimize the regulation parameters of CO2 and foam viscosity reducer.
According to the viscosity-reducing effect and foam properties of foam reducer, the test results show that the optimal concentration is 0.8 wt%. The recommended gas–liquid ratio of CO2 foam viscosity reducer solution was determined by the indoor evaluation experiment with the resistance factor as the evaluation index. The resistance factors of different gas–liquid ratio schemes (such as gas–liquid ratios of 1:1, 1.5:1, 2:1, 0.5:1, and 0.25:1) of CO2 foam viscosity reducer show that the scheme with the highest resistance factor is the gas–liquid ratio 1.5:1 (Figure 5).

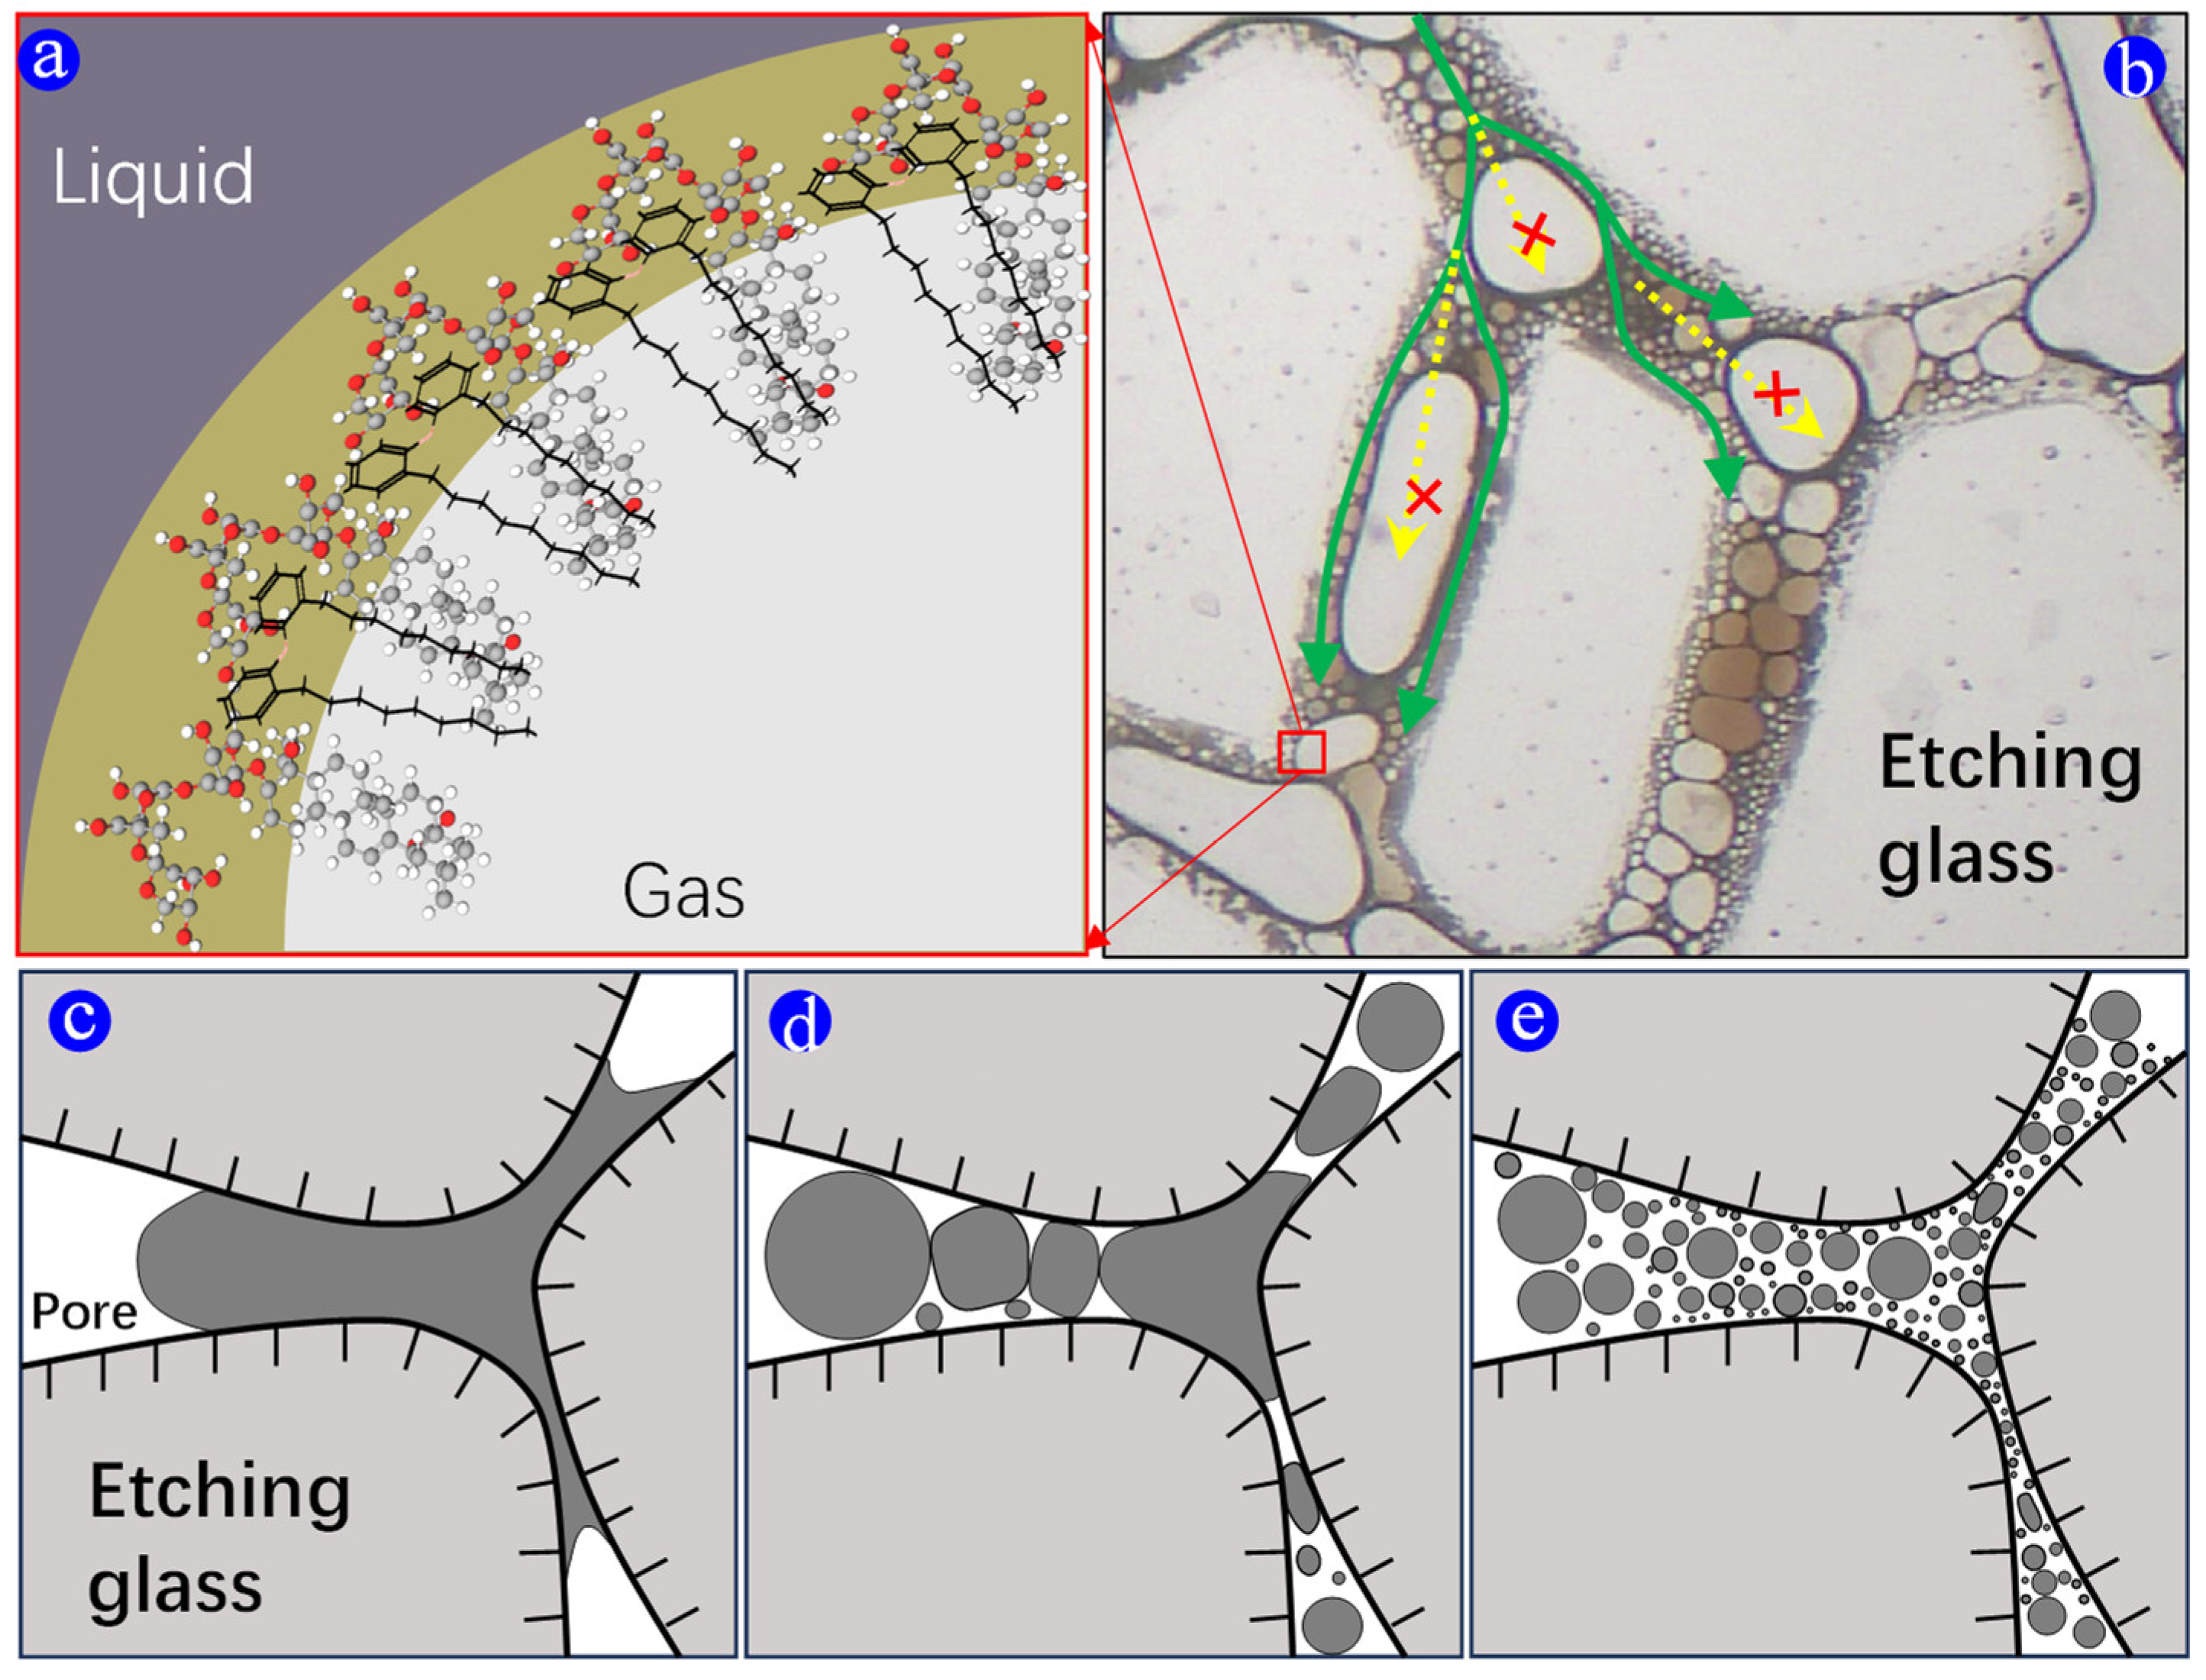
2.3.4. Mechanism of CO2 Foam Displacement

Saponins feature a hydrophilic head (-O-, -OH, and -COO-) and a hydrophobic tail, exhibiting robust surface activity that allows for them to swiftly adsorb onto gas–liquid interfaces, generating numerous bubbles. The ether bond (-O-) in C30H46O+ and the hydrogen bond coordination with saponins form a resilient network structure, bolstering bubble stability at the interface (Figure 6a). This synergy not only enhances foam durability but also extends its transmission range, effectively blocking orifice and flow channel locations. By adjusting the liquid phase flow direction, particularly using surfactants and viscosity reducers, the potent foam coerces liquid to flow along pore walls, thereby cleansing and eliminating oil films (Figure 6b). Through emulsification and flow regulation, the aqueous solution interacts more effectively with oil films and large droplets on pore walls, dispersing residual oil in pores channels and pore throats, ultimately yielding a more fluid emulsion or microsphere state (Figure 6c–e).

3. Experimental Procedures

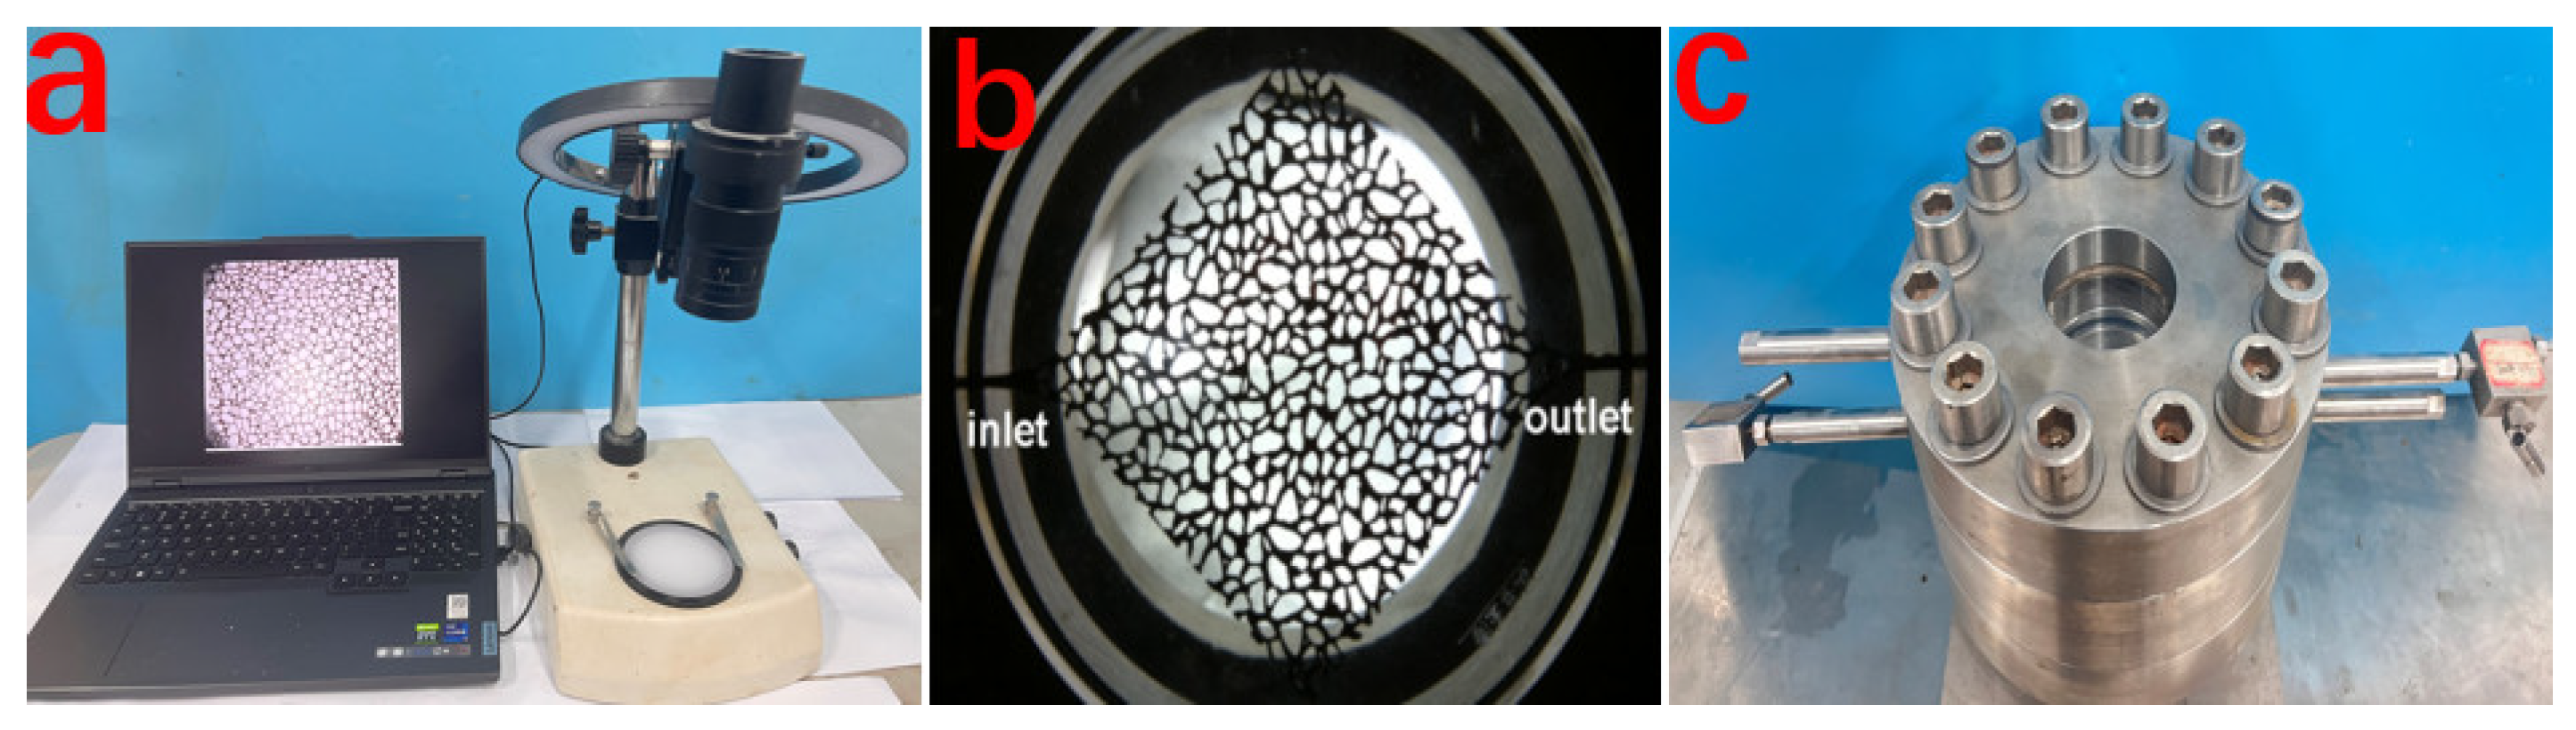
3.1. Experimental Equipment

The microscopic model temperature controller can control the temperature of 500 °C. The steam generator is used to produce steam; its temperature range is 100~300 °C. The experiment adopts the high-temperature and high-pressure displacement microscopic visualization experiment platform including the camera, observation window, and etched glass. The high-definition high-frequency camera system consisted of a computer and a digital microscope camera. The images were observed by Imageview software (Version 2.0) and analyzed by ImageJ software (Version 2.0), as shown in Figure 7a. The micro-etched glass model was placed in the high-temperature and high-pressure observation window. The appearance size of the glass model was 75 mm × 75 mm, the zone size with pore was 45 mm × 45 mm, the thickness of the model was 3.5 mm, the injection hole center distance was 92 mm, the diameter of the injection hole was 2.5 mm, and the glass model showed hydrophilicity (the contact Angle was 45°). (Figure 7b). The high-temperature and high-pressure observation window could withstand the pressure of 32 MPa and the temperature of 300 °C (Figure 7c); it was controlled by the temperature controller.

3.2. Experimental Procedures

As shown in Figure 8, the experimental steps are as follows:
  • Connect the experimental devices and pipelines. In particular, it is necessary to prepare several pipelines at the entrance of the high-temperature and high-pressure visualization experimental device to avoid pollution and blockage of the pipeline when oil and other chemical agents are injected.
  • Set the confining pressure to 2 MPa. Connect the pressure gauge to the confining pressure pipeline of the high-temperature and high-pressure visualization experimental device, inject water into the device with a hand pump, slowly increase the confining pressure to 2 MPa, and close the valve. The confining pressure is not lower than the input–outlet pressure system.
  • An ISCO pump is used to saturate the micro-etched glass with water first (remove possible impurities inside the pore, and then use the temperature controller to dry the glass model at high temperature). After the model is dried, an ISCO pump is used to saturate the crude oil sample. The injection rate is set at 0.025 mL/min, and the pressure difference between the inlet and the outlet should not be too large.
  • Simulate steam displacement. The microscopic model temperature controller is used to heat the visualization experimental device, and hot steam is injected into the microscopic glass saturated with oil samples. The injection speed of the ISCO plunger pump is set to 0.01 mL/min, and the flow and state changes of oil samples in the microscopic etched glass are observed.
  • Simulate heavy oil combined with thermal recovery and displacement. The one-way valve, dryer, and gas flow meter are, respectively, connected to the gas tank containing CO2. The CO2 injection rate is set to 0.025 mL/min with the gas flow meter and 0.013 mL/min with the foam viscosity reducer solution (0.8 wt%) with the ISCO plunger pump. At the same time, the CO2 and foam agent solution are injected into the foam generator. Foaming is carried out, and then the viscosity-reducing agent and foam are mixed and connected to the entrance of the high-temperature and high-pressure visualization experimental device, and the foam and viscosity-reducing agent are injected at the same time to observe the flow and state changes of oil samples in the micro-etched glass (for temperature fluctuations, the temperature controller is used to heat up the high temperature and high pressure visualization experimental device to 100 °C, and the ISCO pump is used to inject the crude oil at 0.025 mL/min).
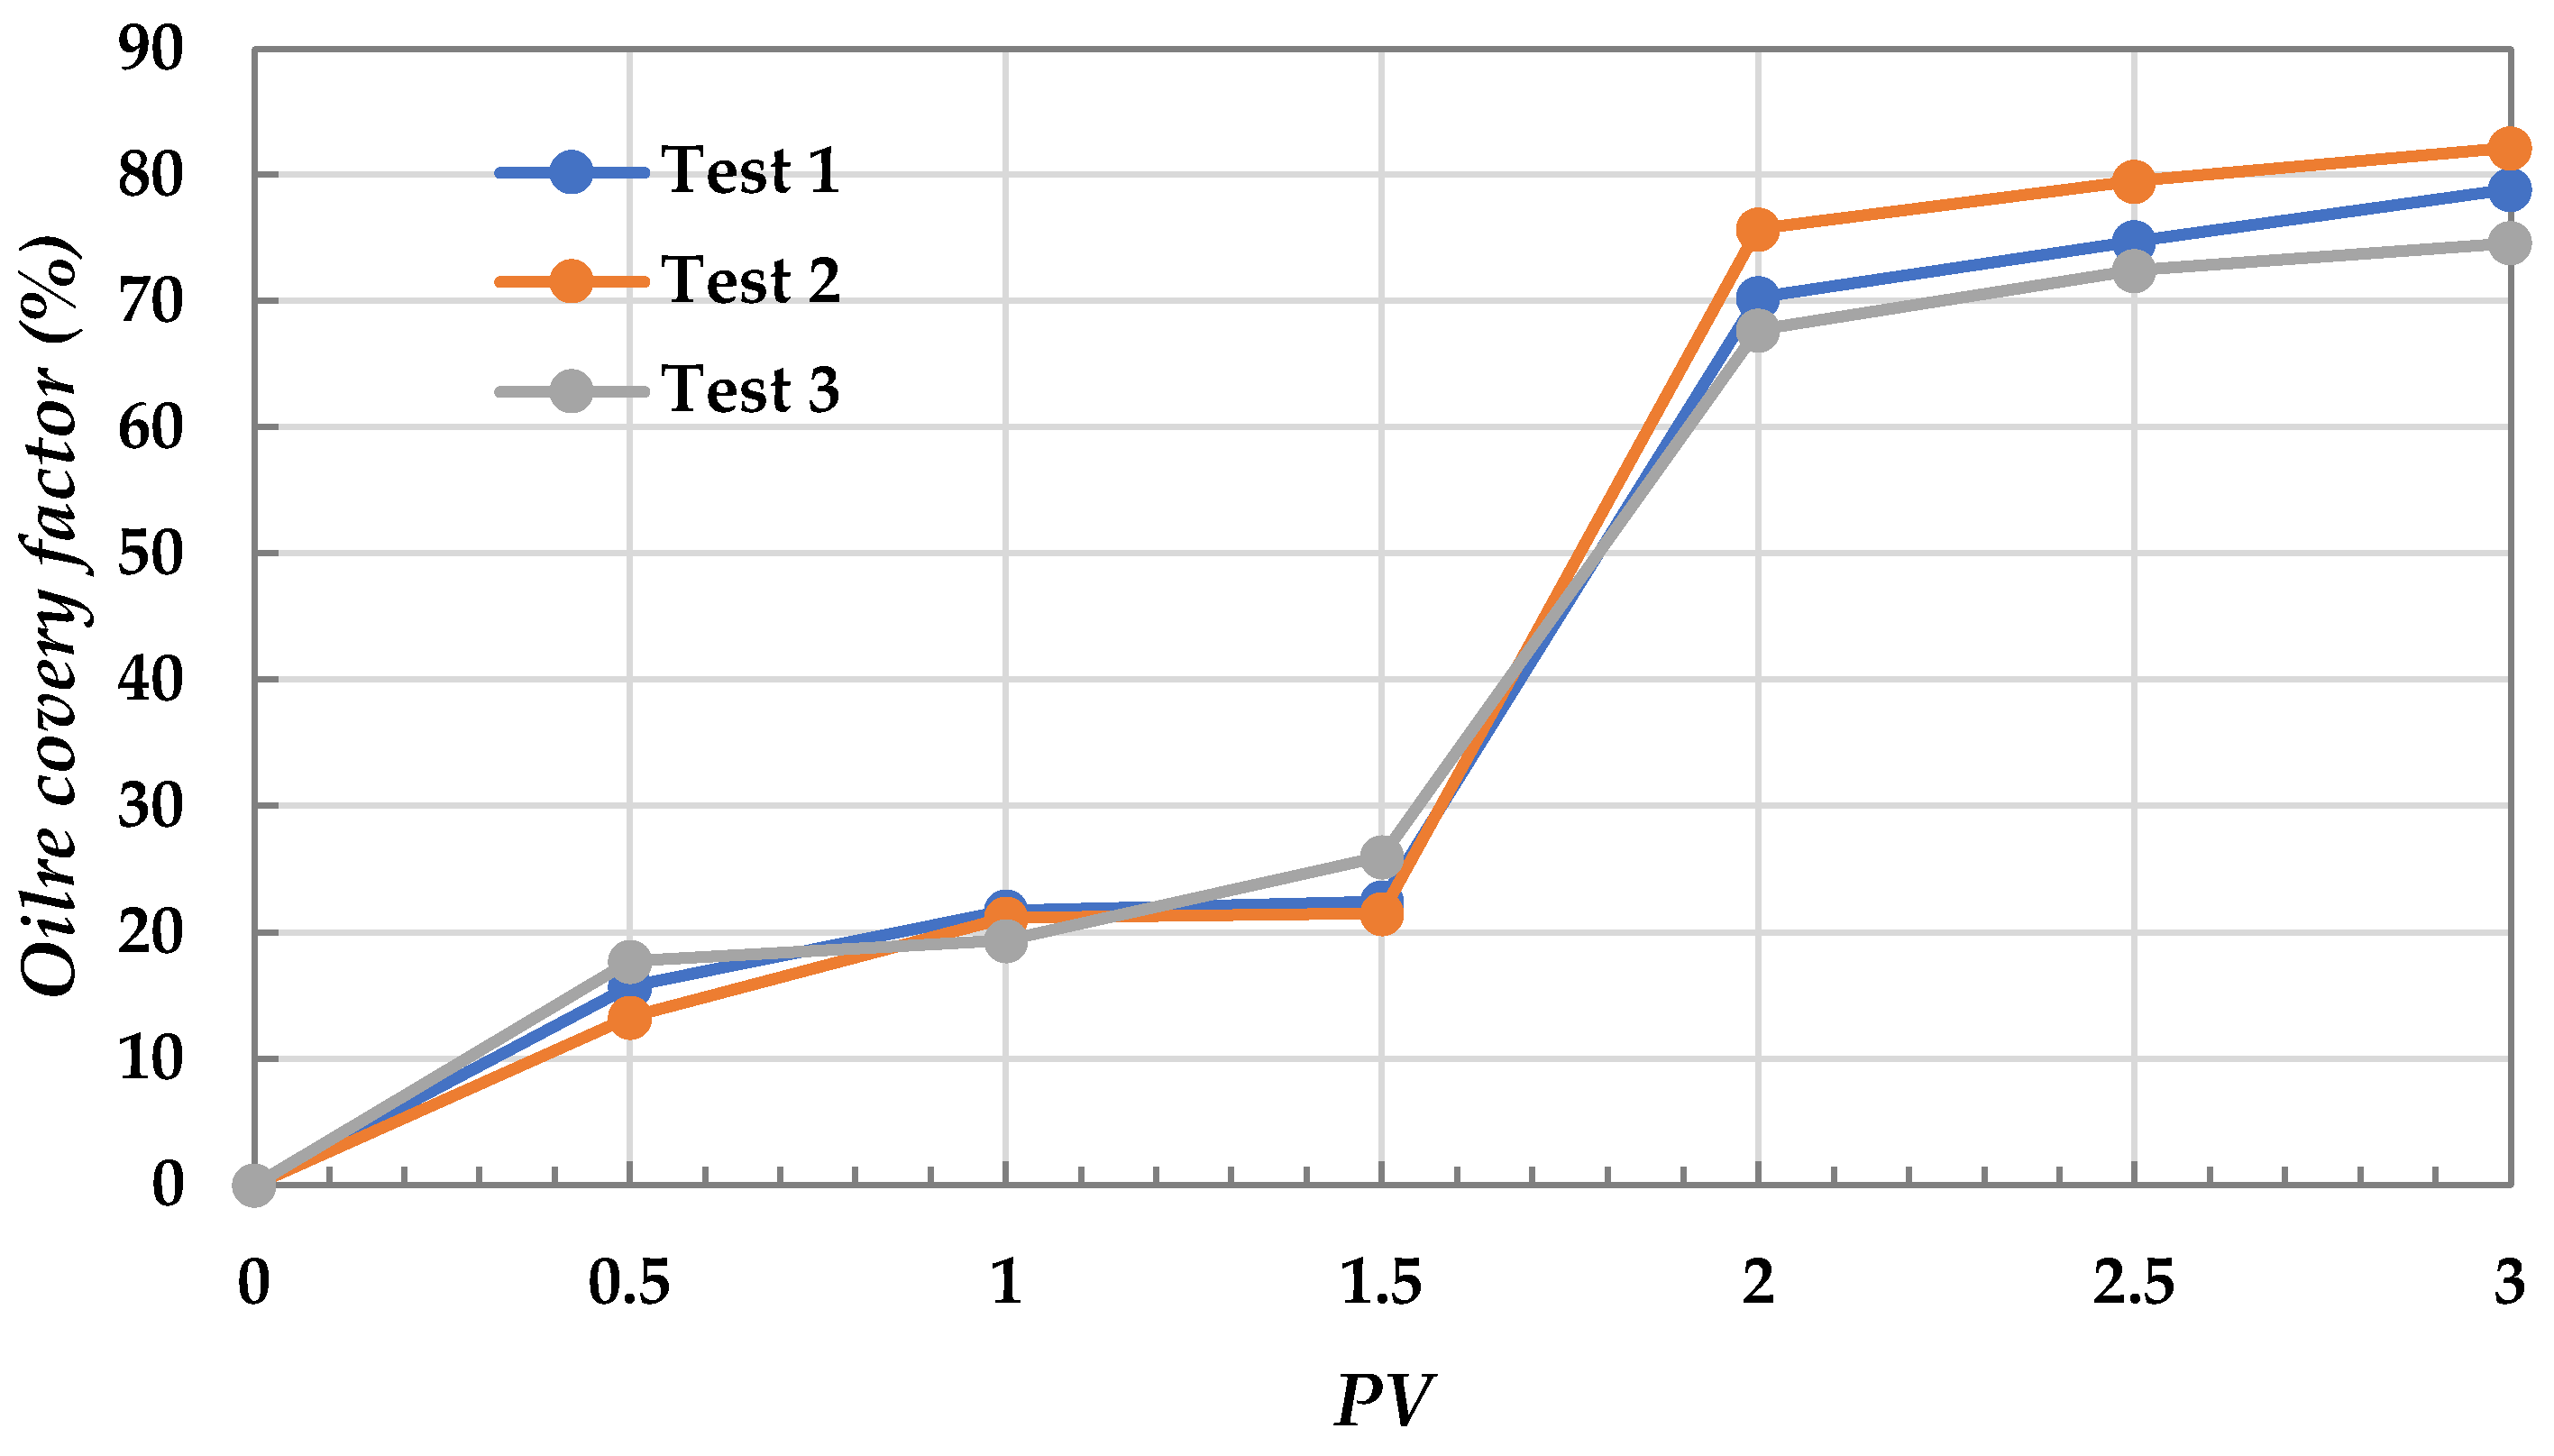
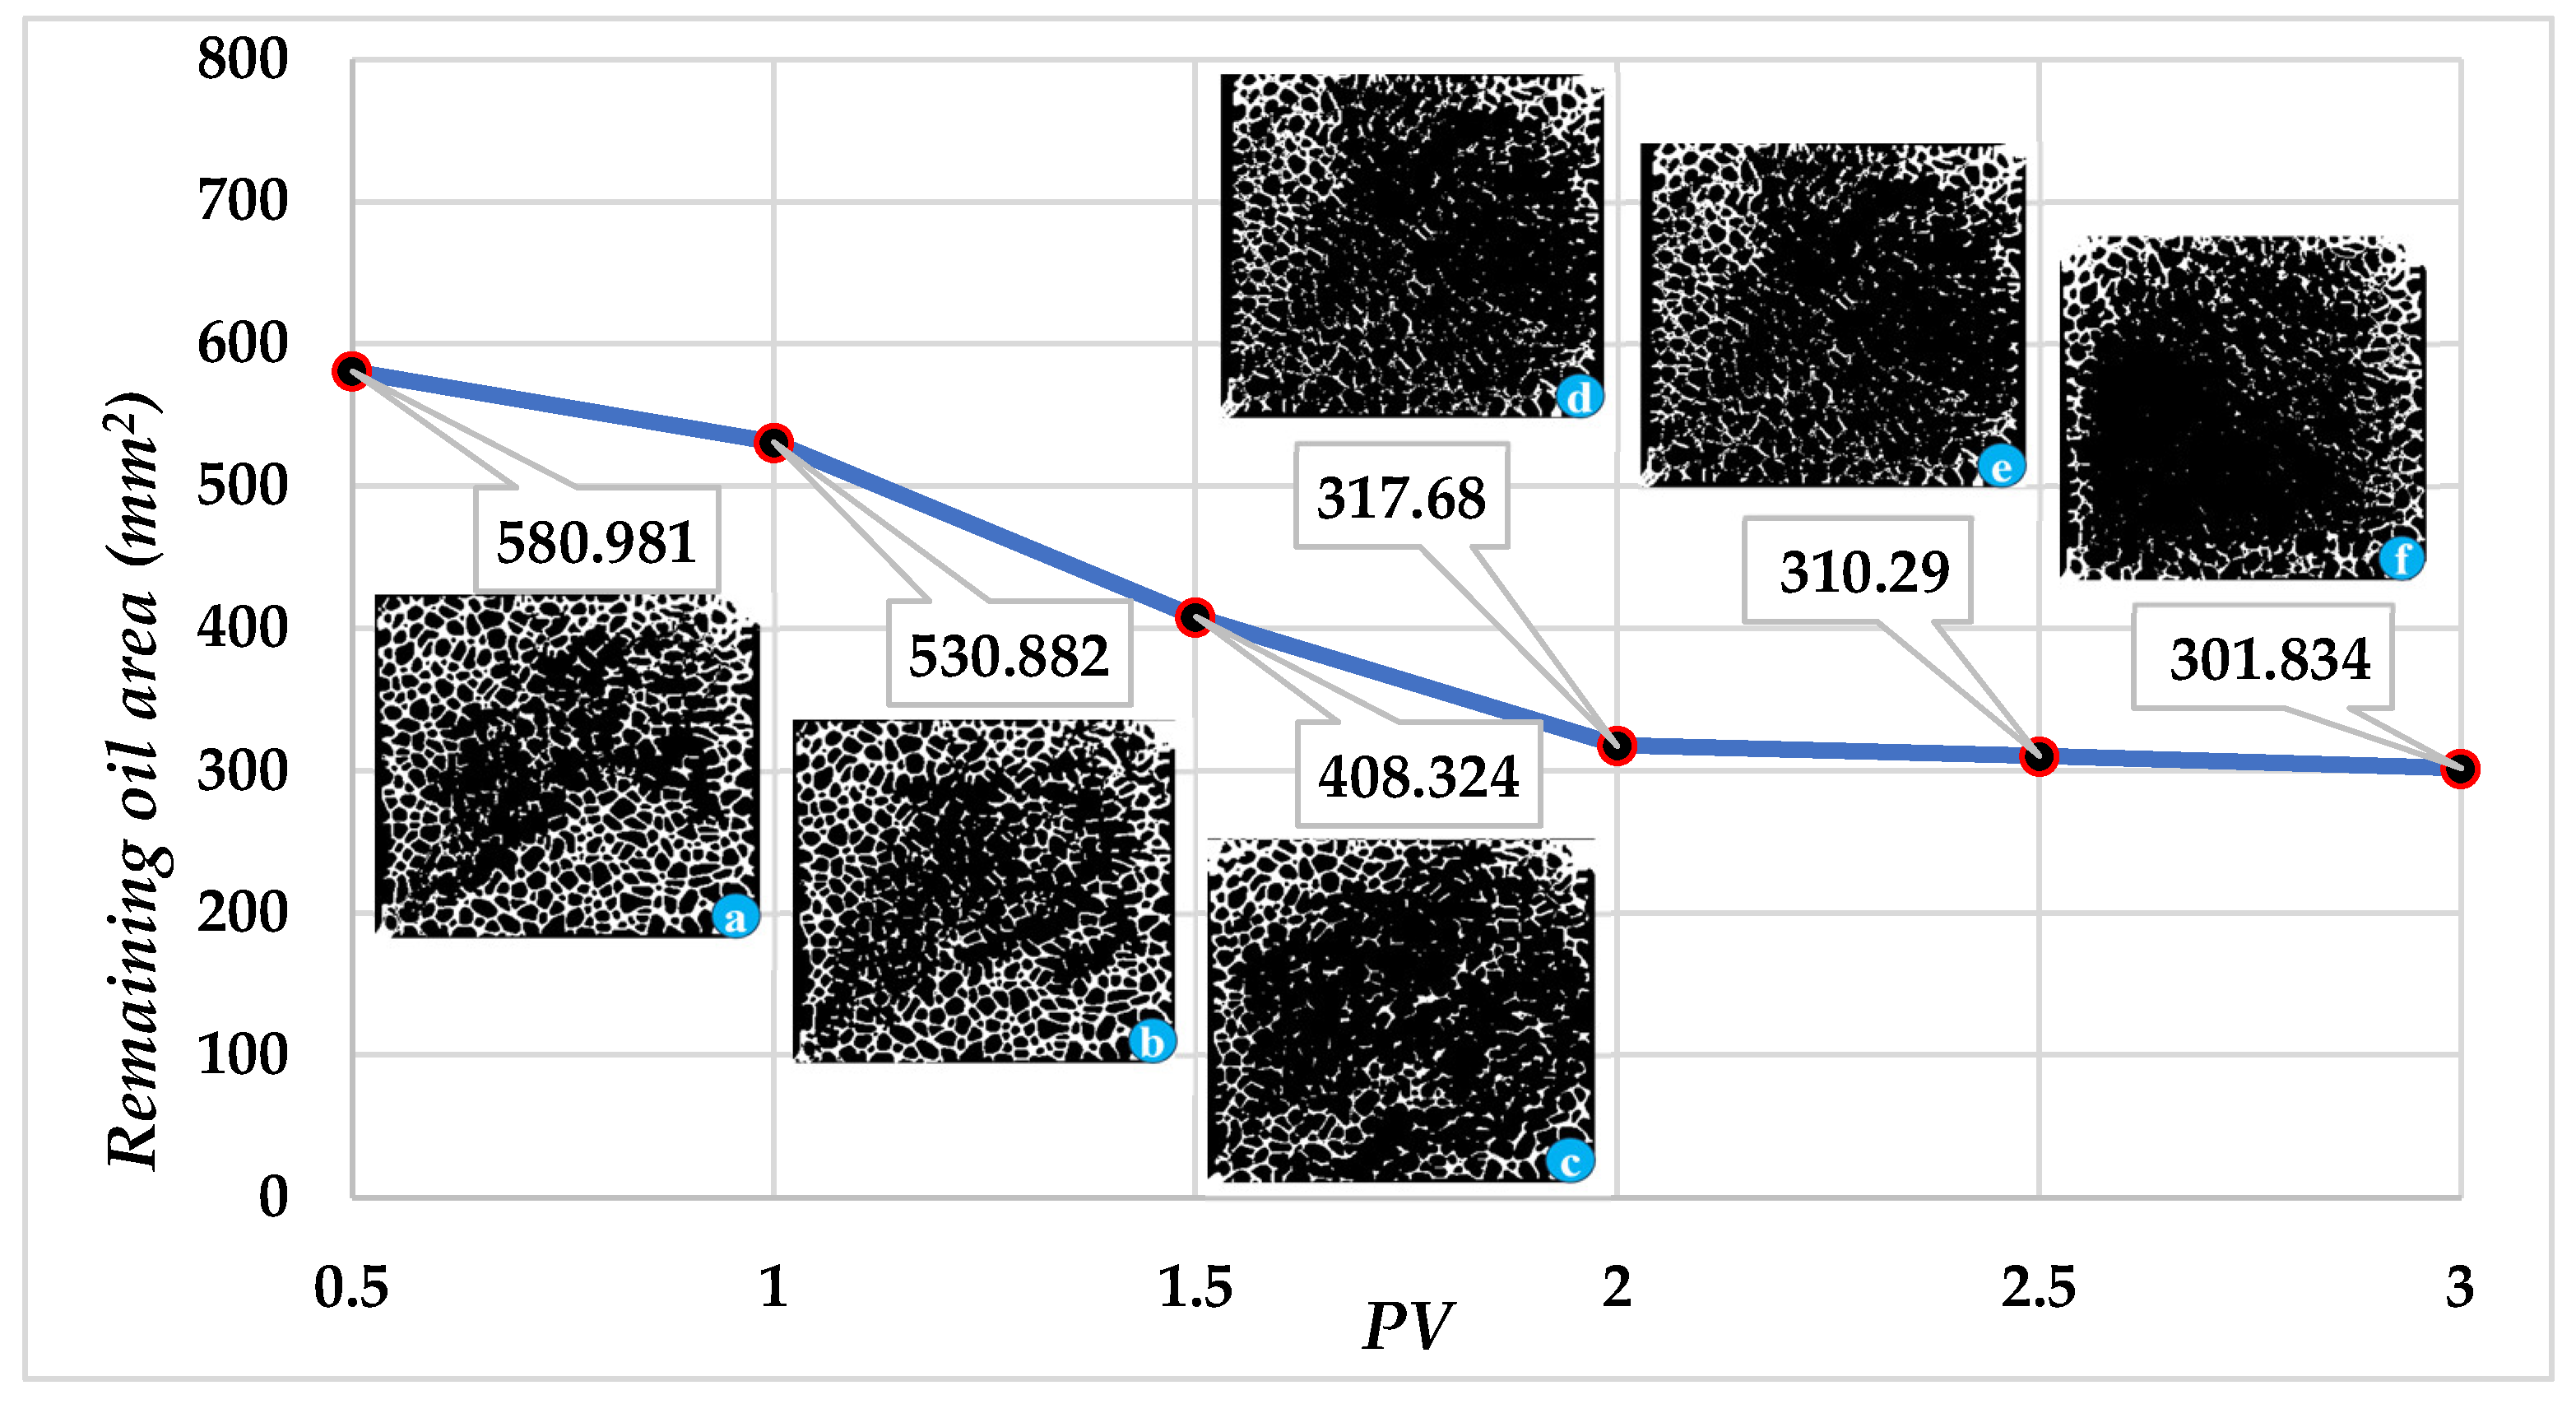
  • Video and record the heavy oil flow and state in the steam displacing to composite thermal recovery displacing stage, and analyze the flow form, remaining oil state, and occurrence mode of heavy oil in the model, using Imagej image analysis software (Version 2.0) of automatic area measurement function; calculate the etching glass model under different injection PV numbers within the area of remaining oil.

3.3. Experimental Parameters

According to the experimental scheme and experimental flow, two experimental schemes were used to connect the experimental equipment. Firstly, steam displacement was conducted to observe the state and mode of remaining oil according to the change in injected PV number. When the injection number was greater than 1.5, it was found that the state of the remaining oil did not change significantly, and the spread range of steam displacement no longer expanded. Therefore, a CO2 foam viscosity reducer-assisted steam displacement experiment was conducted.
  • During steam displacement, the temperature of the microscopic model temperature controller was set at 100~150 °C, the injection speed was 0.02 mL/min, and the injection PV number was from 0.5 to 1.5.
  • For CO2, the temperature range was the same as that of the scheme (i). The injection rate of 0.017 mL/min for 0.08 wt% foam viscosity reducer and 0.034 mL/min for CO2 were used, both of which were injected simultaneously. The injection volume of this group of experiments was continued until 3.0 PV according to the cut-off injection PV number of the first group of experiments.

3.4. Analytical Method

3.4.1. Flow Zone Division

Based on the flow channel observed in the micro-etched glass model, it is viewed as a diamond shape (Figure 9). Connect the diamond diagonals and tripartite with the red dotted line at the top left (as well as the red dotted line at the bottom right), connecting the other two vertices of the square according to the green dot of the tripartite, the innermost main channel, followed by the near channel, and finally the far channel.

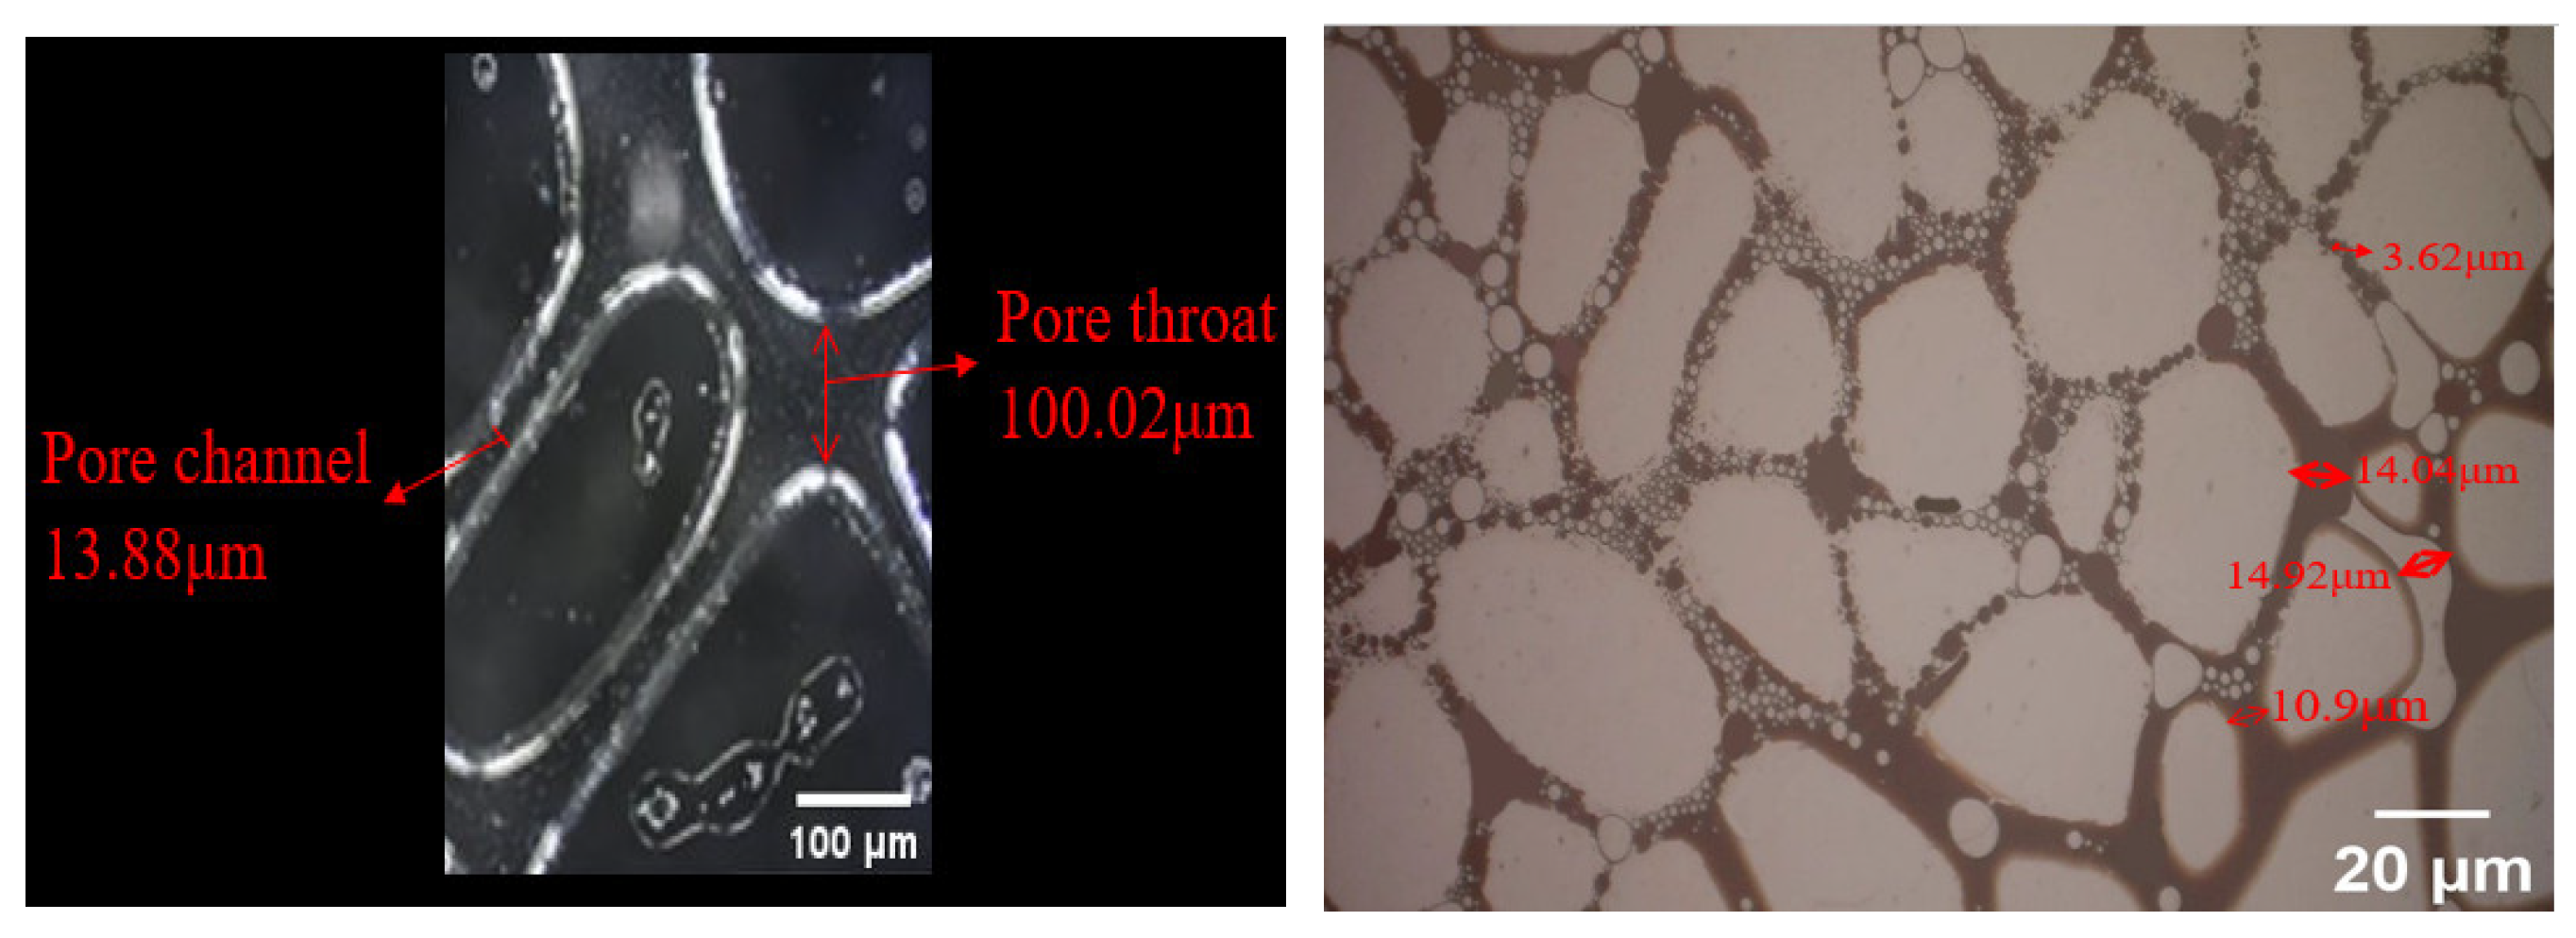
3.4.2. Pore Structure Division

The pore channel width of the etched glass model is 10~50 μm, and the pore throat width is 90~450 μm. The pore channel and pore throat size are characterized by the pore/throat radius. According to the radius of the pore channel, it can be divided into three categories: large (≥35 μm), medium (15~35 μm), and small channel (<15 μm). According to the mean size of the pore throat, it can be divided into four categories: coarse (≥7 μm), middle (1~7 μm), fine (0.1~1 μm), and micro-fine throat (<0.1 μm) (Figure 10).

3.4.3. Remaining Oil State Division

According to the proportion of microscopic remaining oil in pore space, the remaining oil state is mainly divided into two categories: one is continuous remaining oil, and the other is dispersed remaining oil (Table 2).

4. Results and Analysis

4.1. Steam Flooding Phase

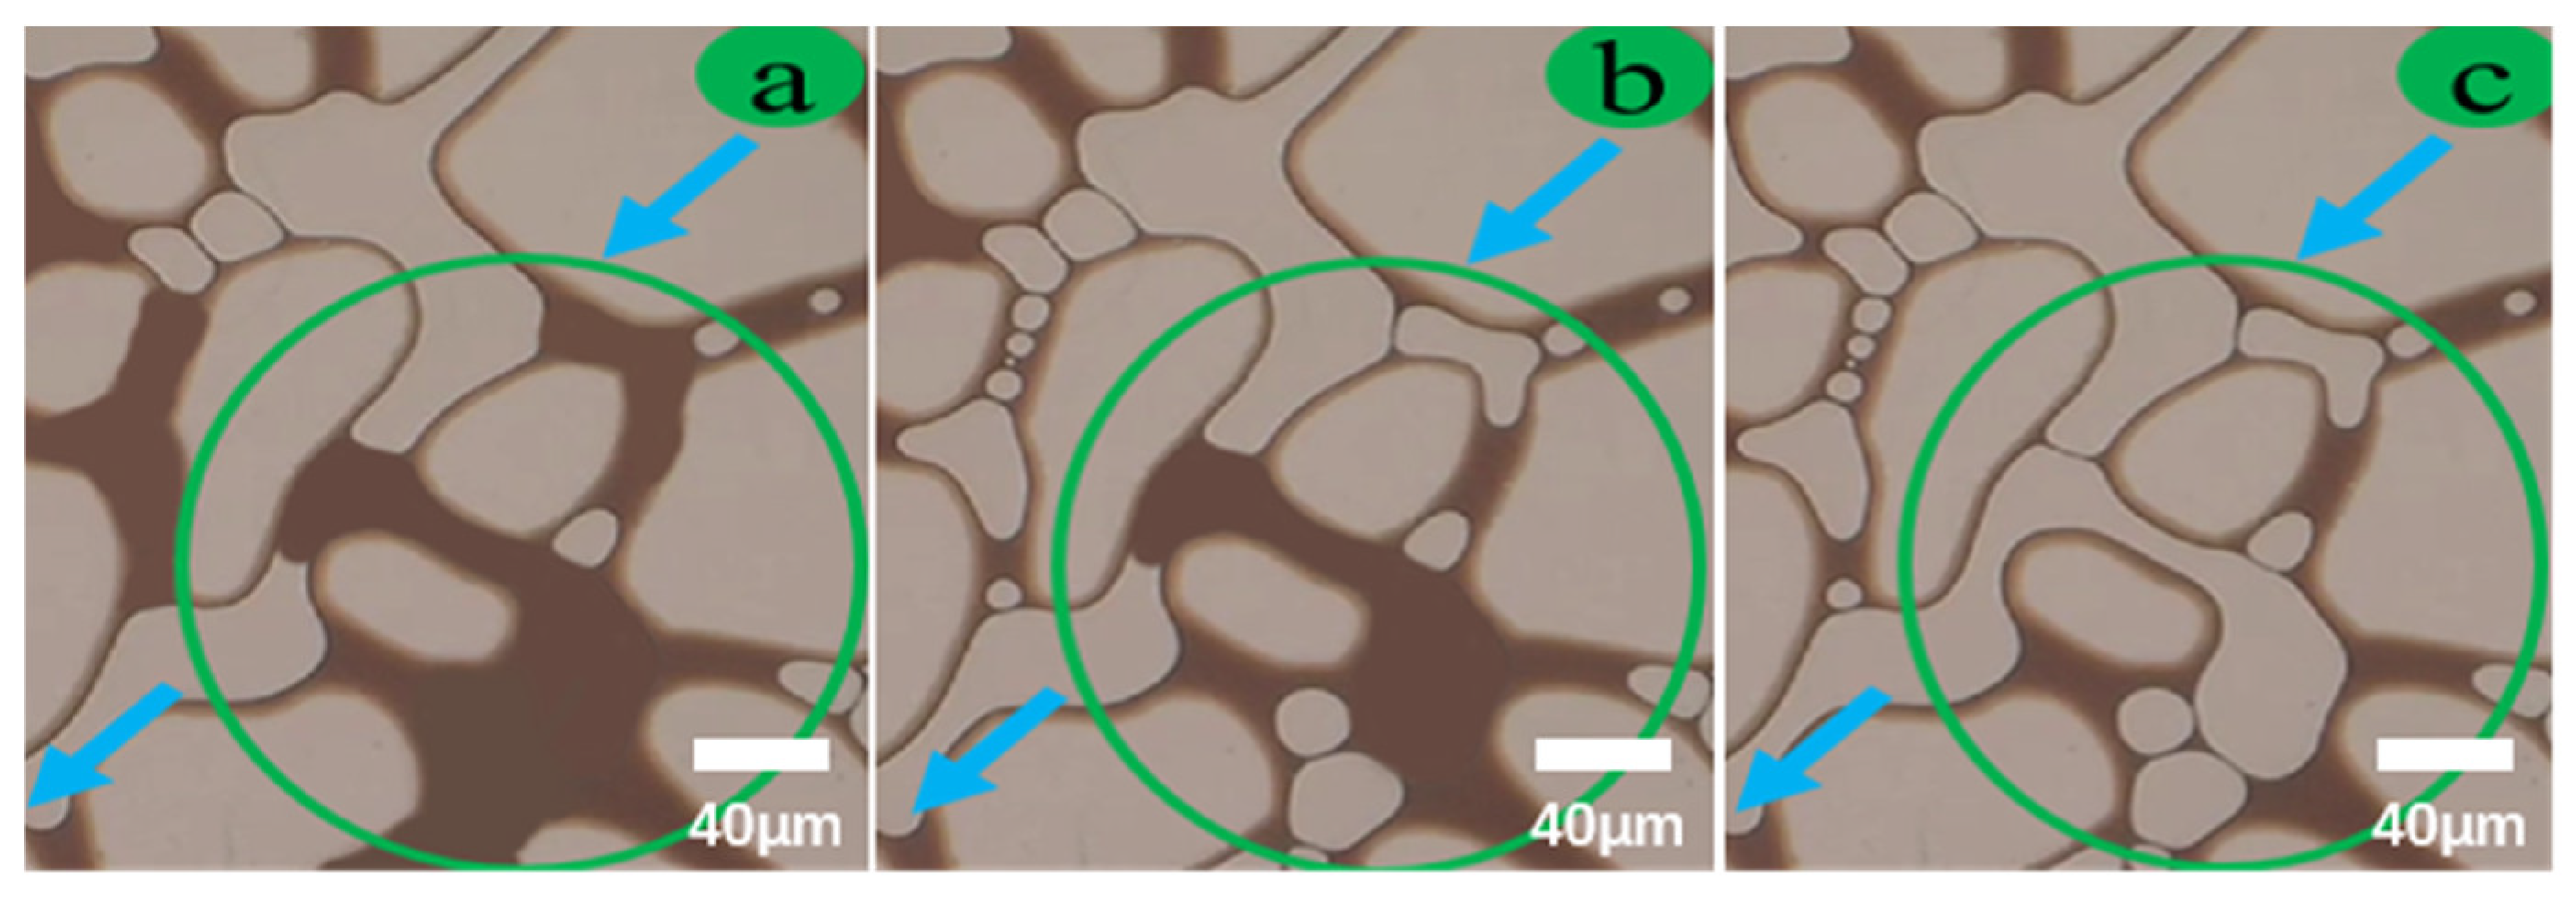
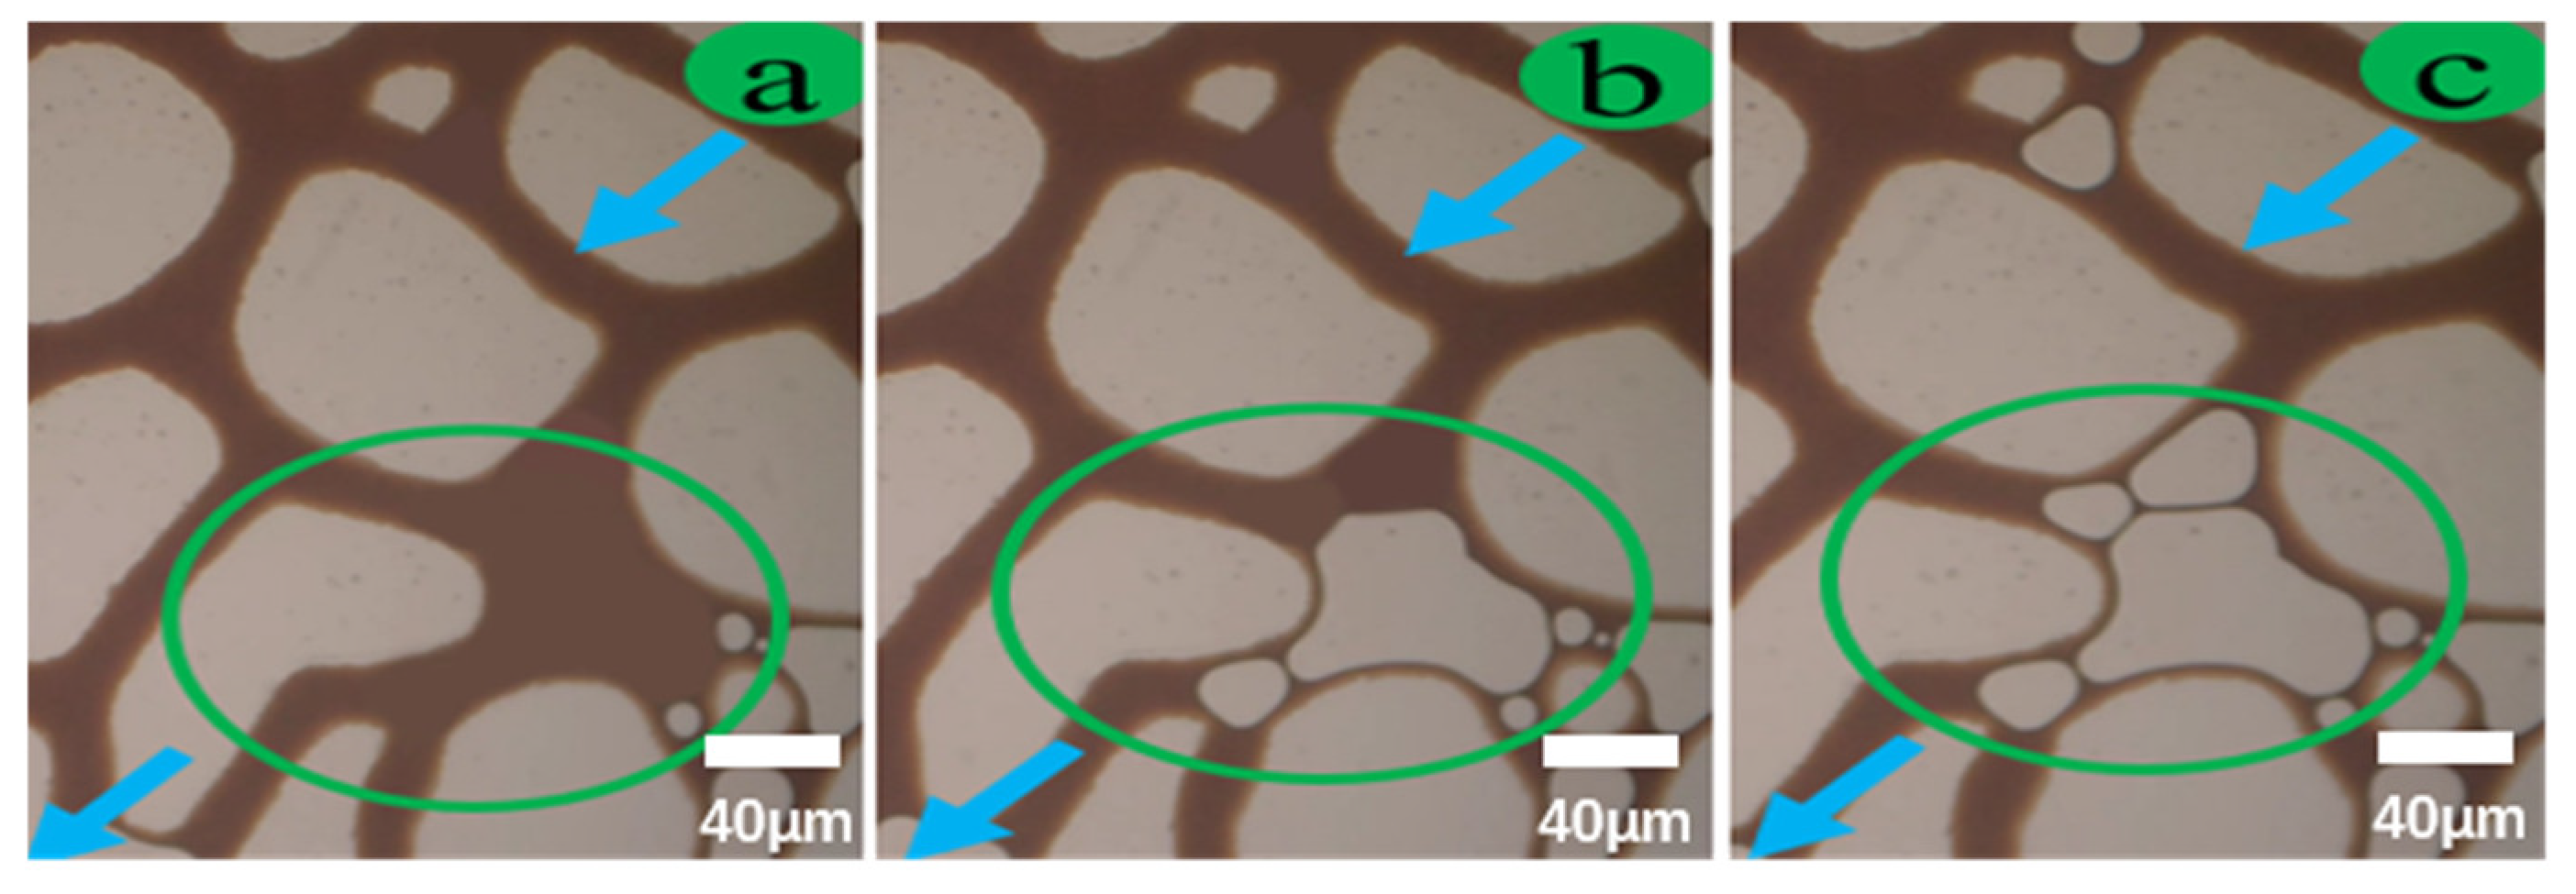
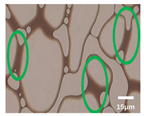
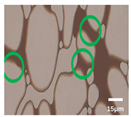
4.1.1. Main Channel Zone

(1)
Residual oil occurrence state
In the main channel, the water phase pushes forward to displace crude oil along the injection–production main channel, and the displacement front expands unevenly to both sides. The water phase occupies most of the volume of the channel, and most of the crude oil is displaced. In the main stream area, the remaining oil is mainly clustered in the continuous phase and columnar or film in the discontinuous phase (see the green circle in Figure 11).
(2)
Residual oil occurrence pattern
At the main channel zone, we select pore structures with pore coordination numbers (PCNs) of 3, 4, and 5, and the remaining oil is mainly short columnar. The pores are full of well-connected bubbles. As the number of PV injections increases, the viscosity of crude oil decreases, and bubbles in the fine noise gradually connect and gather in the pores. The bubbles in a PCN of 5 are almost unaffected. In PCNs of 3~4, part of the remaining oil is driven out. The amount of remaining oil in the film gradually decreases (Figure 12).

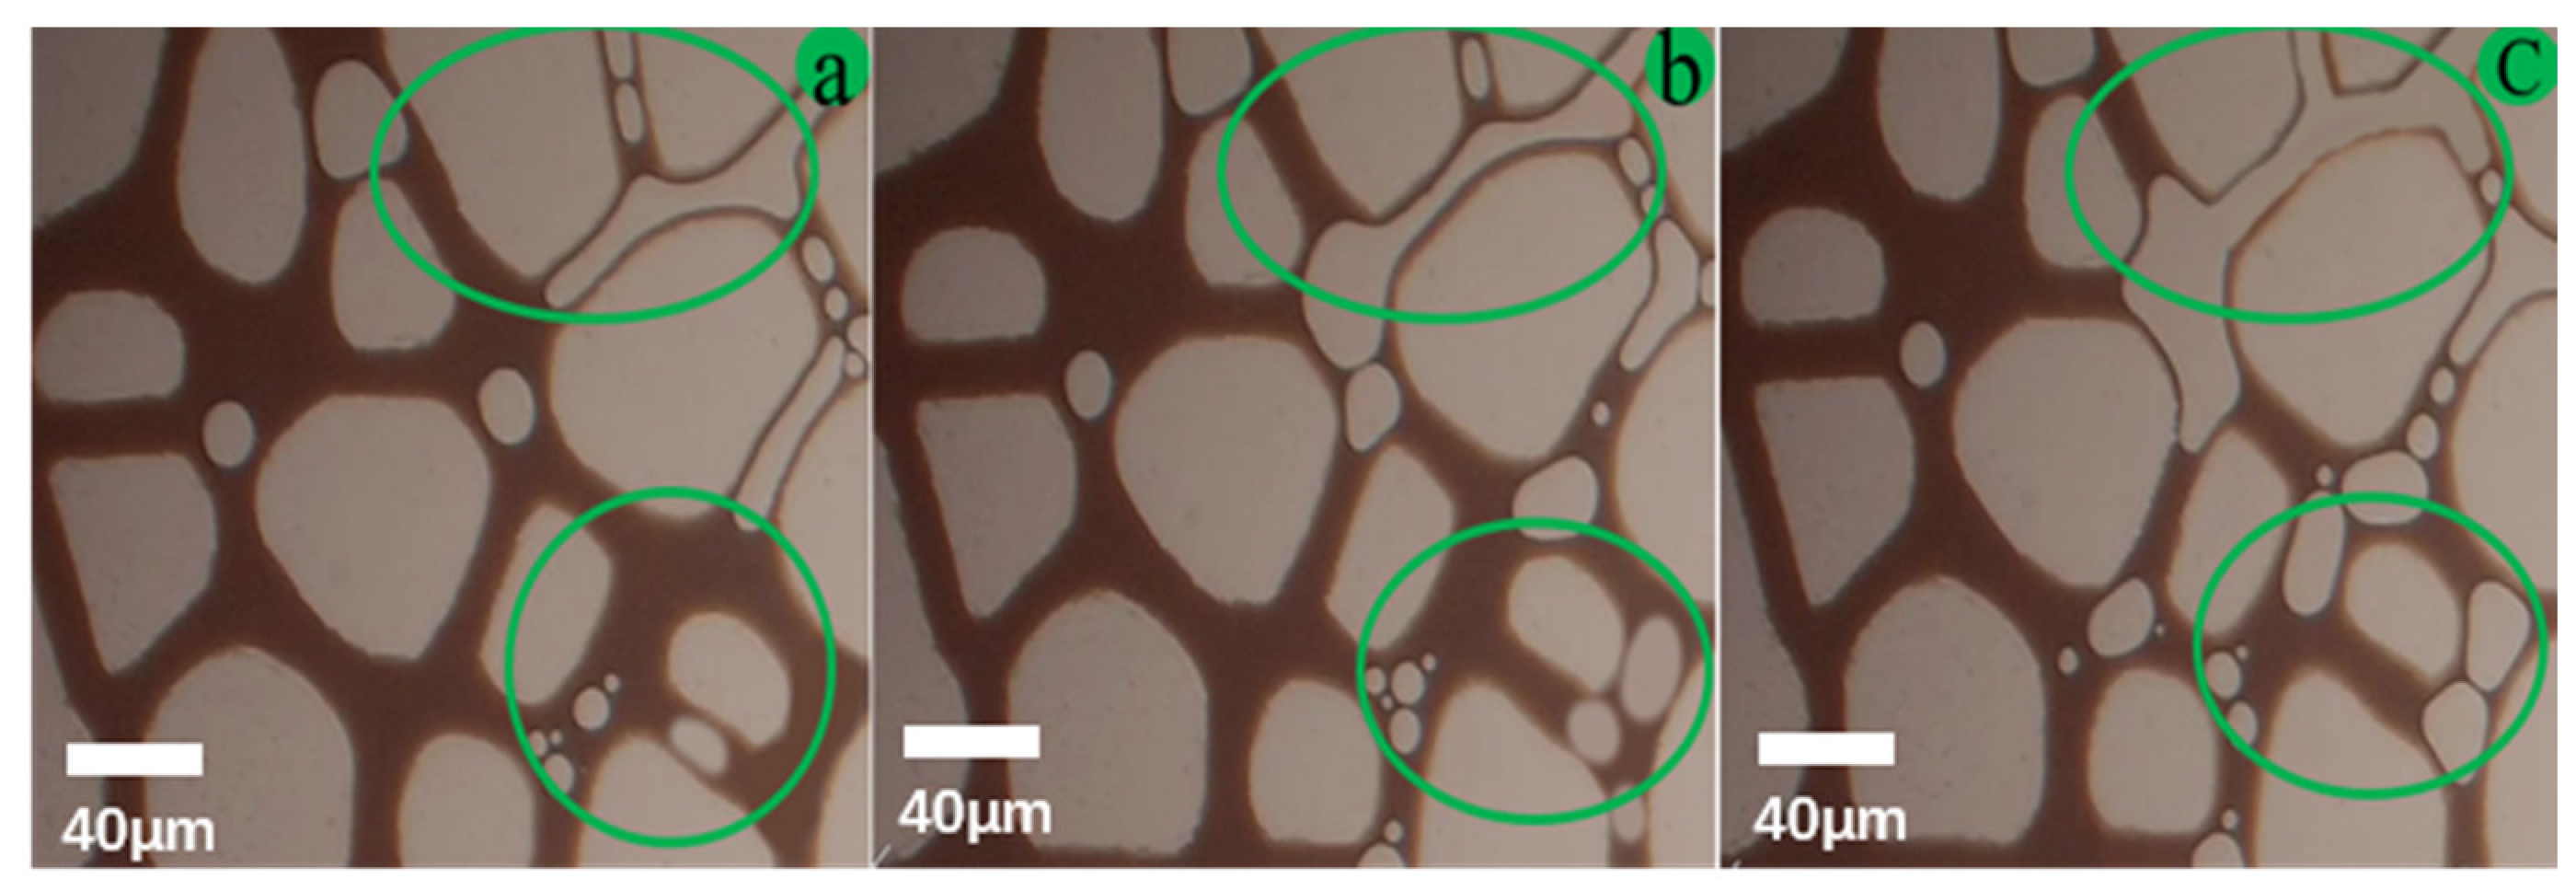
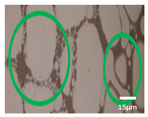
4.1.2. Near Channel Zone

(1)
Residual oil occurrence state
The location of the near channel is affected less. The effect of continuous steam injection on oil displacement is not obvious. In the area near the flow channel, the remaining oil occupies most of the pore area, and the remaining oil is columnar, membrane-like, and a few continuous phases cluster (see the green circle in Figure 13).
(2)
Residual Oil Occurrence Pattern
We select pore structures with PCNs of 3~4, in which there is a large area of residual oil, and the pore structure is mainly columnar, cluster, and a small part of the cluster. The bubbles are mainly distributed in large pores. With the increase of injected PV number, the small bubbles in the throat of large pores with larger radius gradually gather, the bubbles in adjacent throats gradually converge to exist in the pore, and the change of injected PV number has little effect on the remaining oil in the small radius of the bellows (Figure 14).

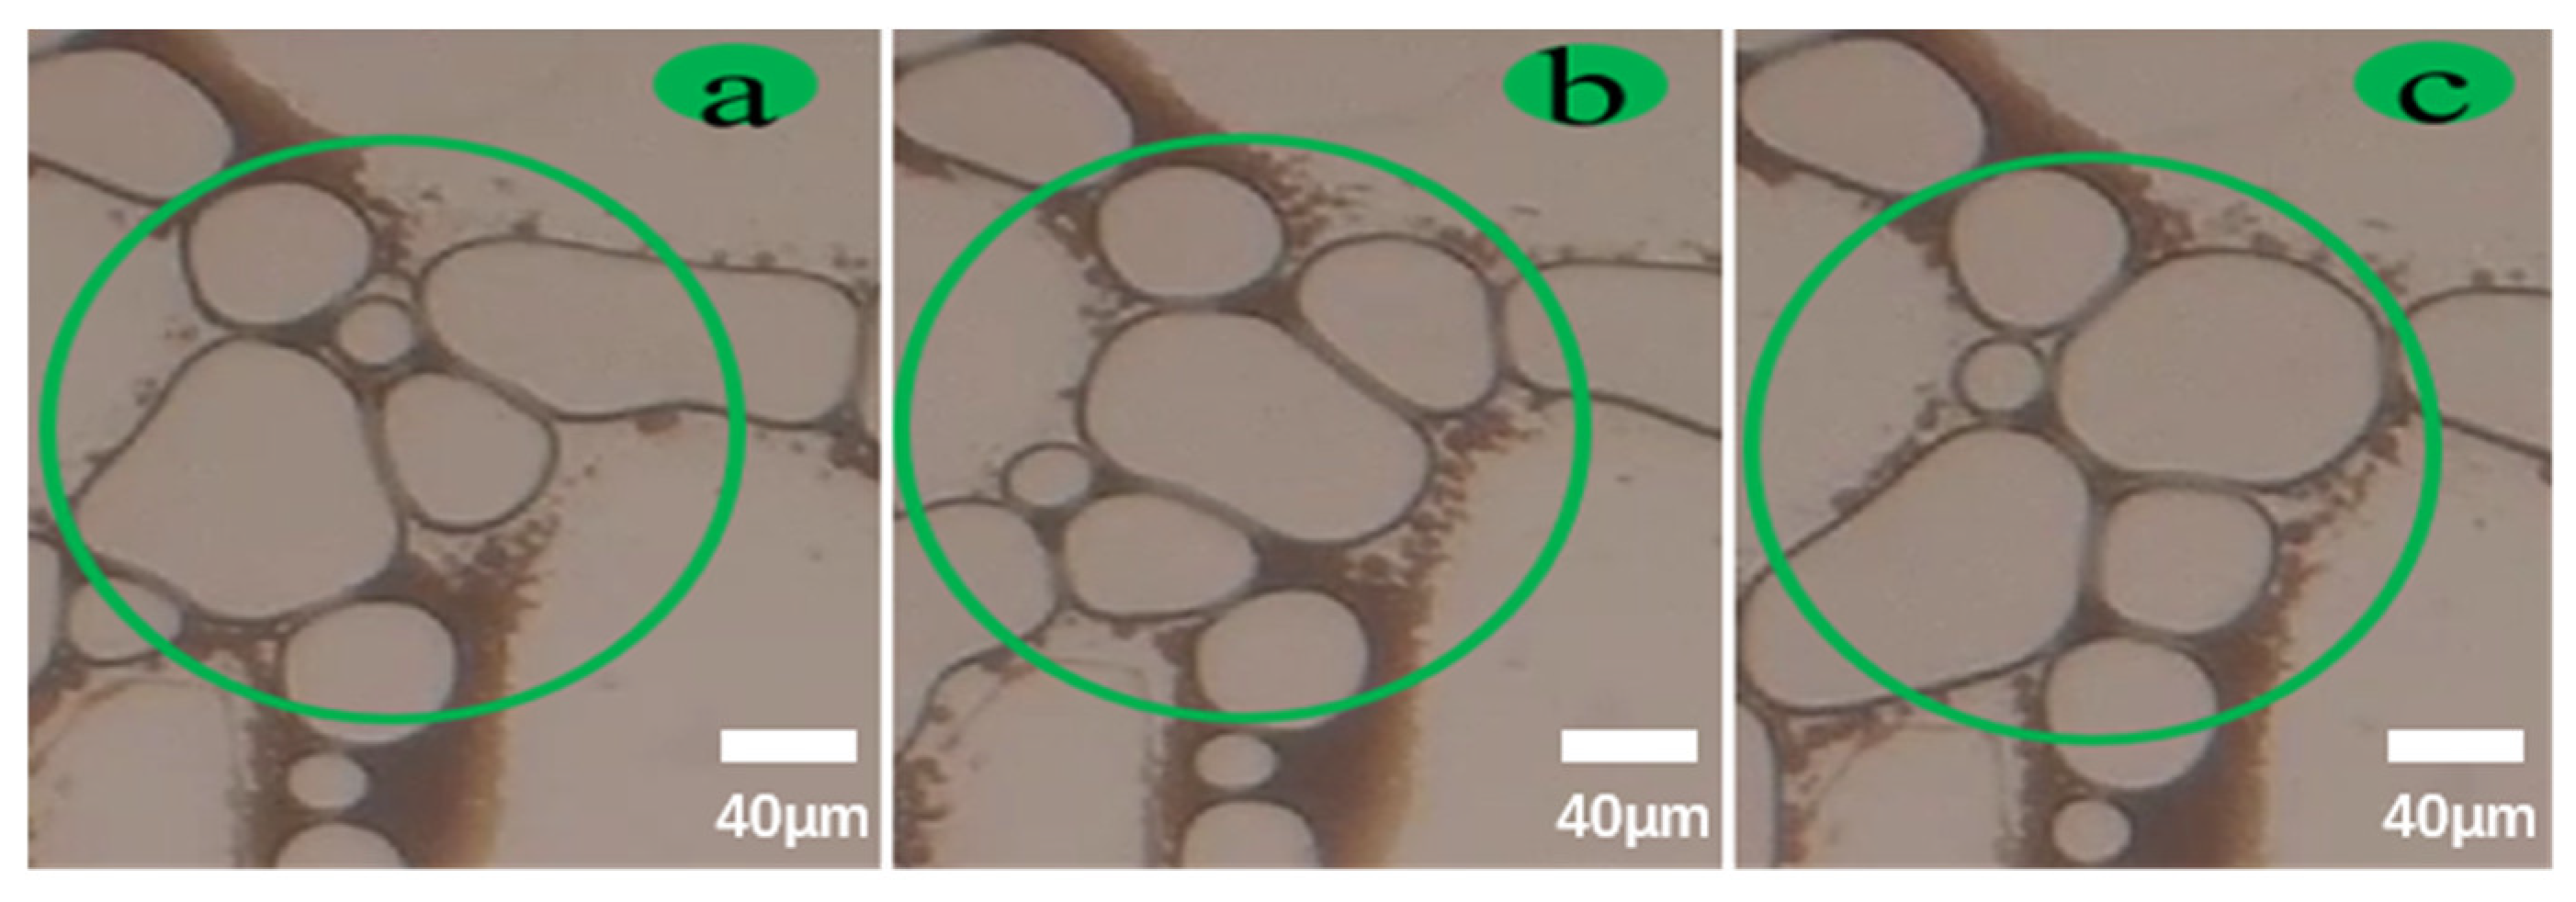
4.1.3. Far Channel Zone

(1)
Residual oil occurrence state
With the increase in injected PV, part of the crude oil in the flow channel is gradually displaced. The crude oil occupies most of the pore area in the far flow channel, the remaining oil is mainly in continuous sheet and cluster shapes, and a few are columnar and film shapes. The water phase slowly gathers in the form of dispersed droplets, and the steam can hardly spread to the far channel area (see the green circle in Figure 15).
(2)
Residual oil occurrence pattern
Crude oil occupies most of the pore area of the far flow channel. In the pore structure with PCNs of 3~5, the remaining oil is mainly continuous flake and cluster, and a small amount of columnar and film. Since the steam cannot reach the edge, the remaining oil in the pore with a coordination number of 5 is almost unchanged. In pore structures with PCNs of 3~4, with the increase in PV injection, the volume of bubbles gradually increases, and gradually dispersed bubbles are connected. As a result, the amount of the remaining oil in the longer column is reduced by steam flooding, the oil saturation in the middle throat decreases, and bubbles gradually gather in the fine throat (Figure 16).

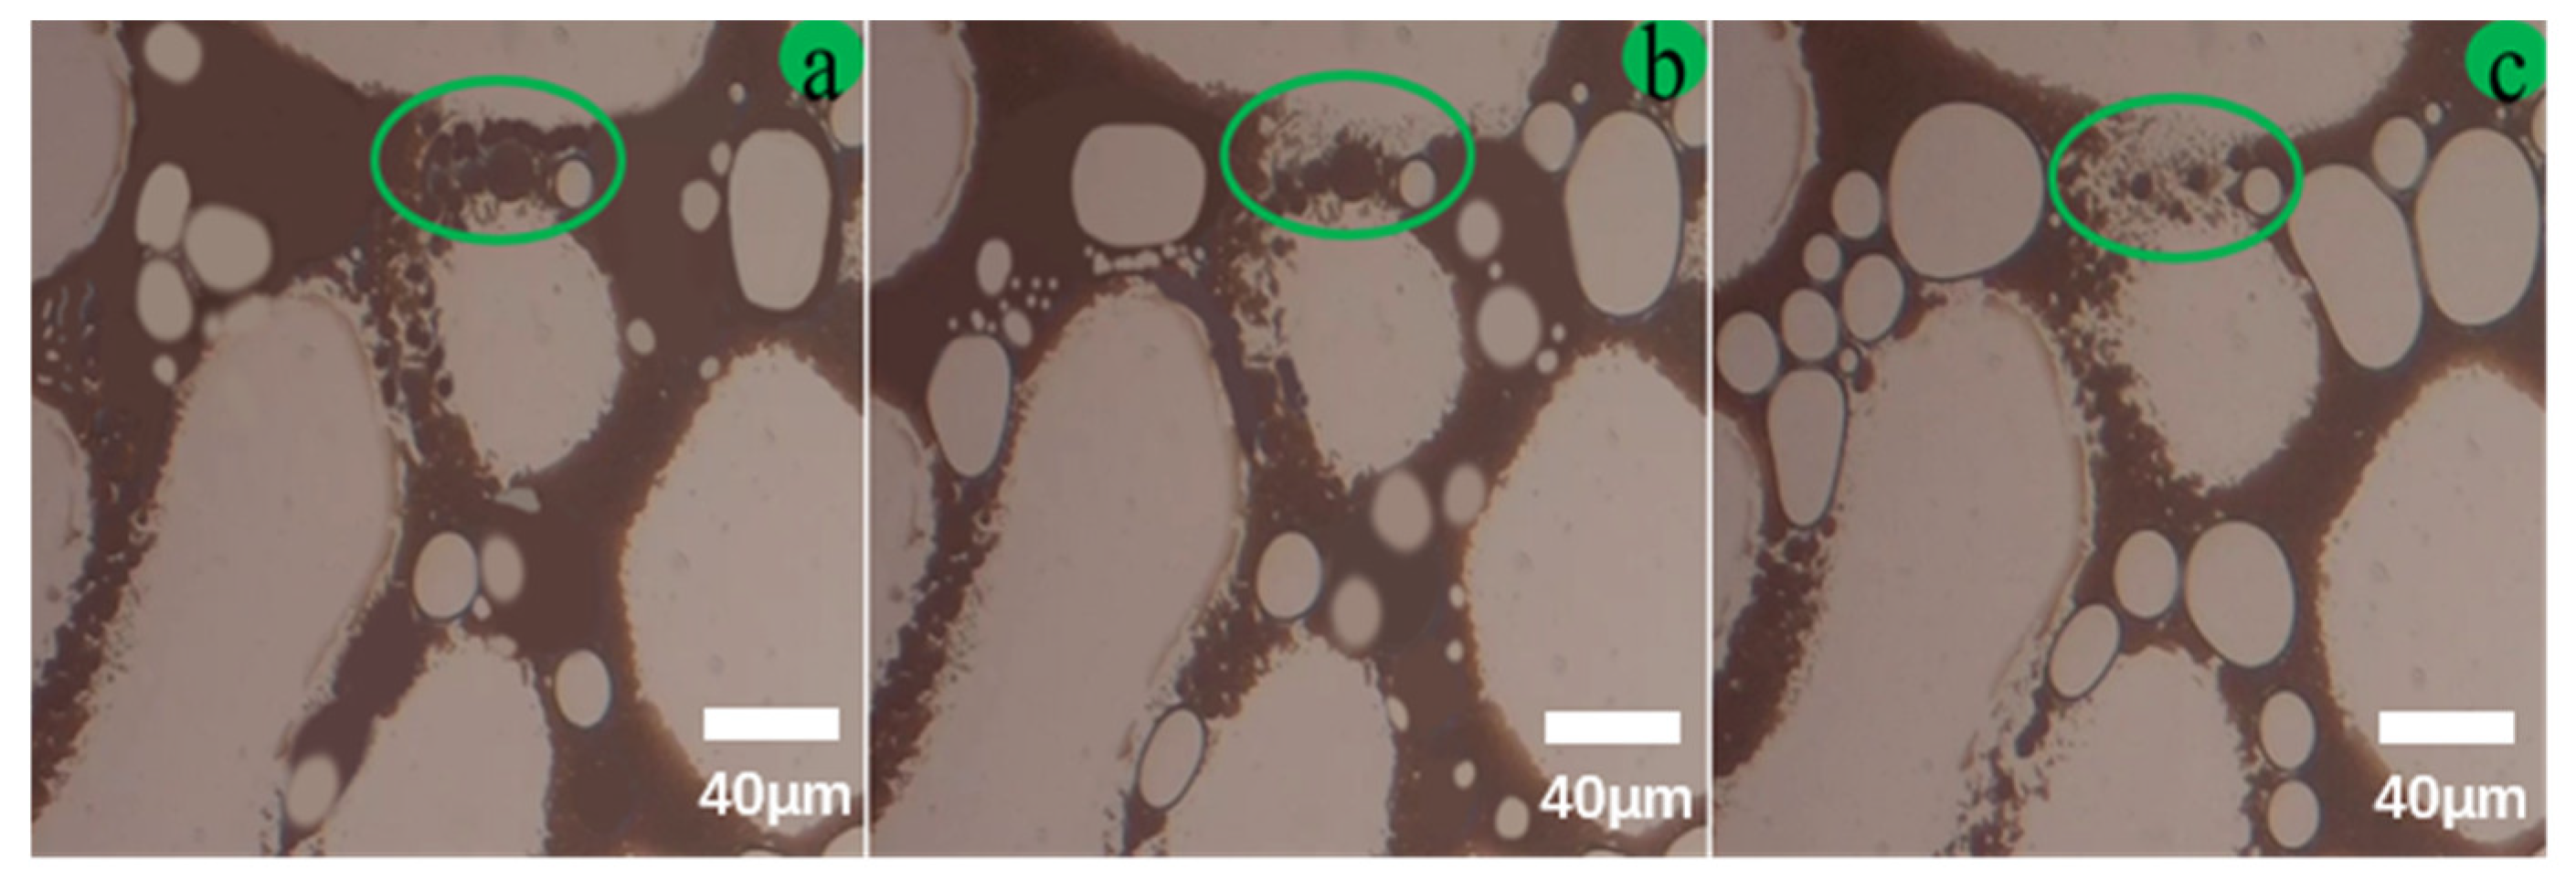
4.2. CFVAS Flooding Process

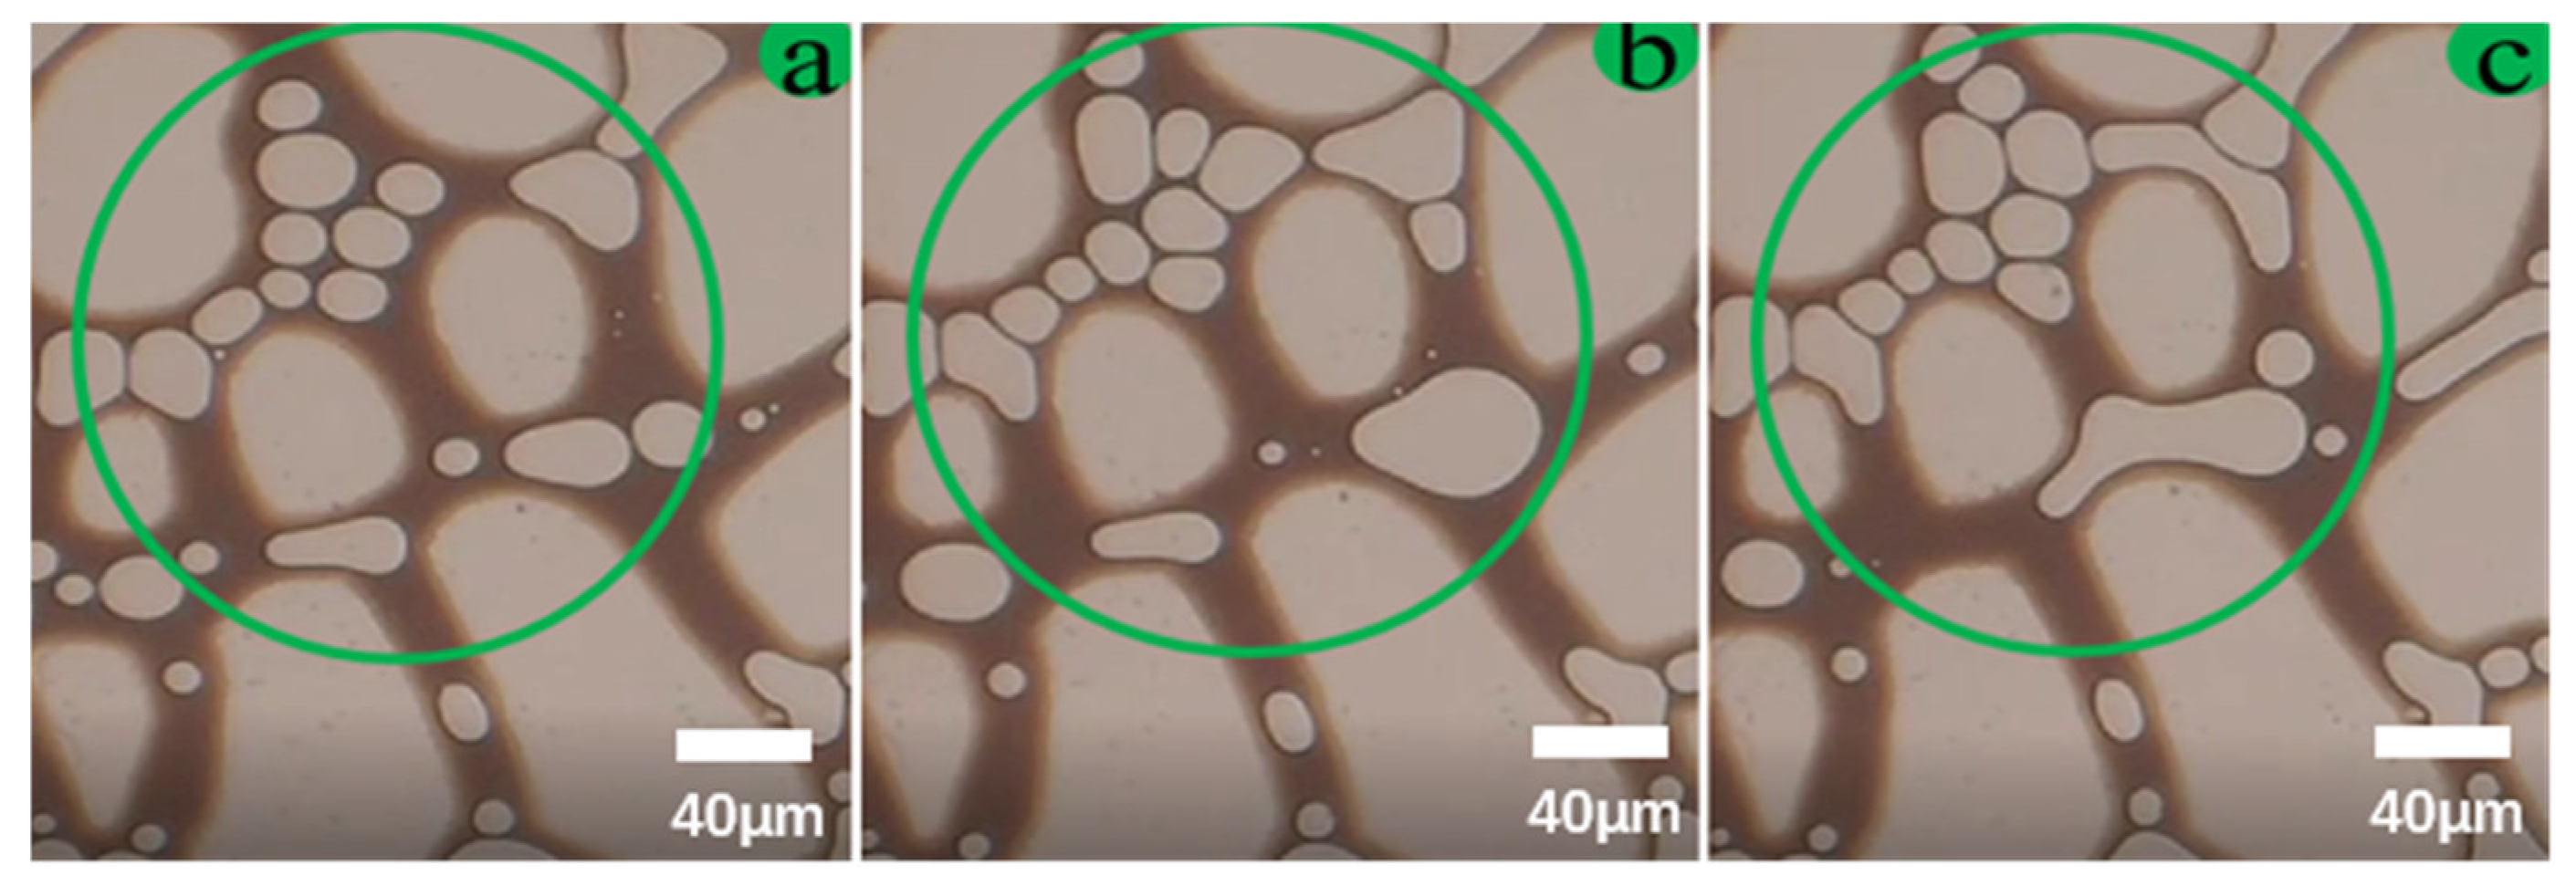
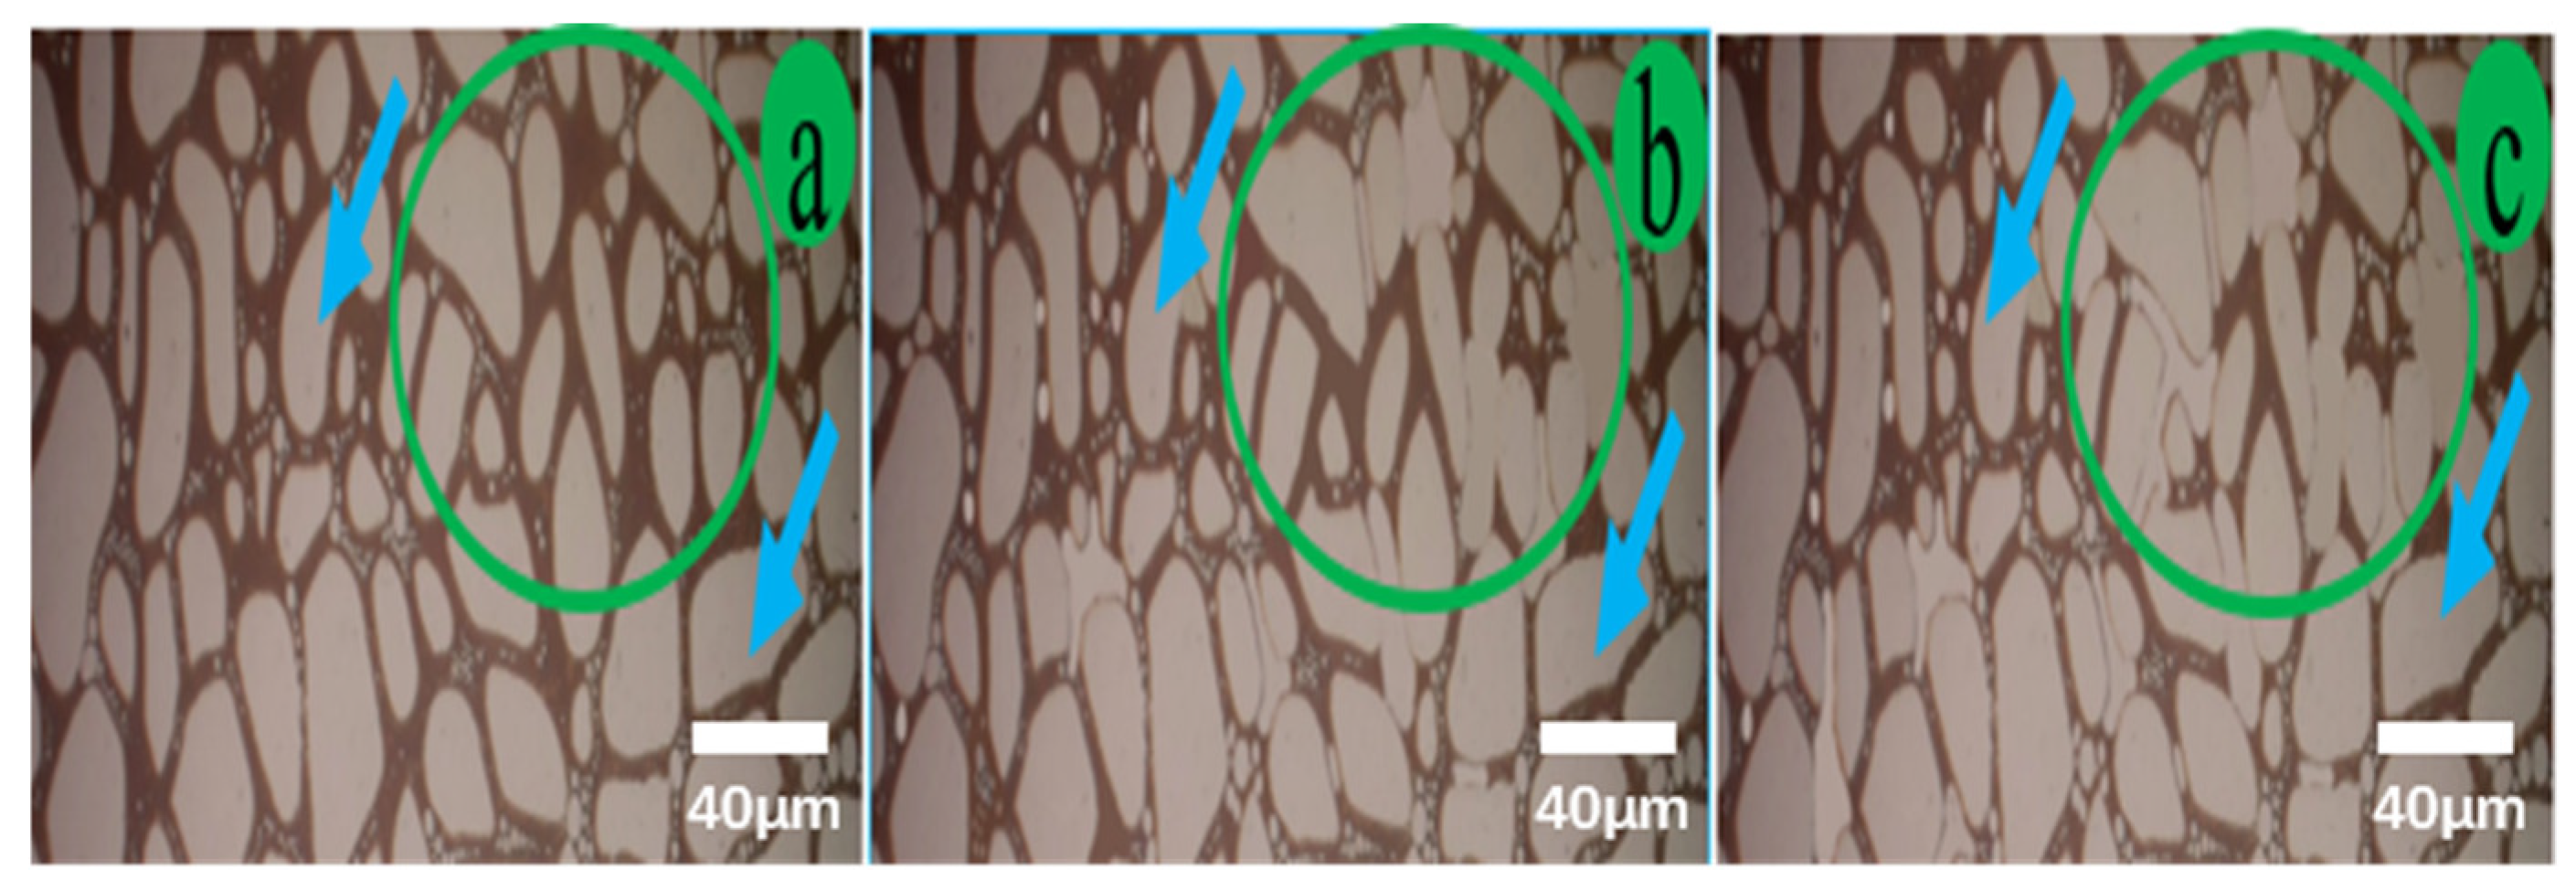
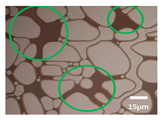
4.2.1. Main Channel Zone

(1)
Residual oil occurrence state
In the main channel, O/W and foam block the channel, forcing the displacement fluid to expand to both sides, and the spread range is significantly expanded. With the increase in PV, a large part of crude oil is displaced out of the pore, and the remaining oil is very small. In the main channel area, oil–water emulsion and foam occupy most of the channel positions, and the remaining oil mainly exists in the O/W state (see the green circle in Figure 17).
(2)
Residual oil occurrence pattern
The pore structure with a PCN of 3 was selected, and the remaining oil was mainly characterized as O/W emulsion after emulsification and dispersion. The pores are filled with foam, and the remaining oil tends to gather in the larger radius of the roar. With the increase of PV number, the viscosity of crude oil will decrease, the driving force of foam in large pores will increase, the seepage resistance will decrease, and the foam in large pores can only be driven and dispersed in a small range in the pores. The O/W emulsion flows along the liquid film on the surface of the foam, which also demonstrates the efficacy of the CO2 foam in improving the flow capacity of the remaining oil (Figure 18).

4.2.2. Near Channel Zone

(1)
Residual oil occurrence state
In the near flow channel, the displacement range expands greatly to both sides, and the remaining oil in the near passage is also used effectively. With the increase in PV number, most of the unused crude oil is displaced out of the channel. Emulsion and foam occupy most of the spread area, most of the remaining oil exists in an O/W state, and a small part is discontinuous columnar (see the green circle in Figure 19).
(2)
Residual oil occurrence pattern
For pore structures with PCNs of 3~4, the remaining oil was mainly characterized as O/W emulsion after emulsification and dispersion and a fully mixed state of oil, gas, and water, mostly distributed in the coarse and middle throats. The CO2 foam gathered in large pores with a PCN of 4, and a few small bubbles intermingled in the throat. As PV increases, CO2 foam collects between large pores. In the coarse and middle throats, O/W emulsions flow along the throat wall. Influenced by gas diffusion, the number of O/W emulsions decreases, and the emulsions displaced to adjacent throats gradually form the seepage of CO2 and foam and the mixed state of oil, gas, and water through the transport of foam (Figure 20).

4.2.3. Far Channel Zone

(1)
Residual oil occurrence state
The remaining oil in the far flow channel is effectively used, and the oil displacement channel is formed in the edge area. Most of the remaining oil mainly exists in the gap between the water phase and the foam, and the remaining oil is in a discontinuous column shape and the oil–oil–water is fully mixed (see the green circle in Figure 21).
(2)
Residual oil occurrence pattern
For pore structures with PCNs of 3~4, oil primarily exists in O/W emulsion after emulsification and dispersion, along with a mixed state of oil, gas, and water, mainly in coarse and middle throats. Large foams gather in a PCN of 4, stripping and emulsifying oil into filament-like emulsion via foam action, reducing interfacial tension. With PV increase, it increases the effect of surfactant, the big hole in the foam increases, the residual oil amount decreases significantly, and the size of foam in the larger pores gels at a relatively stable state, leading to a lower amount of O/W emulsion (Figure 22).

4.3. Comparison

We carried out three tests of steam flooding to CFVAS flooding, and the oil recovery factor in each test was slightly different under different injection PV numbers (Figure 23). The oil recovery efficiency obtained in the three tests of experiments was better analyzed using averaging, and the results obtained can be seen in in Figure 24.
In the steam flooding process, the remaining oil occurrence state in the micro-etching model has the following characteristics (Table 3): The front is not uniformly advanced, and it is easy to form a channeling way. The degree of oil flow differences, largely affected areas concentrated in the mainstream, basic not wave, and near port and port range is small. The oil–water interfacial tension is large, and the oil displacement efficiency is low. The overall occurrence state of the remaining oil in the microscopic model is shown in Figure 24 (PV = 0.5~1.5). CFVAS flooding (PV = 2.0~3.0) and CO2 foam viscous-reducing agent-assisted steam flooding can obviously improve the flow of crude oil, block the channeling channel, expand the spread area, and solve the problem of low oil displacement efficiency of steam flooding. The foam viscosity reducer can quickly adsorb to the gas–liquid interface and form many bubbles, make the bubbles more stable, and adjust the flow direction of the liquid phase. Foam agents can effectively block the channel, obviously increase the spread range, and expand the spread area. The CO2 foam viscosity reducer can effectively reduce the interfacial tension of oil and water, the contact area between the solvent and the oil film and large oil droplets on the pore wall is larger, and it emulsifies them into smaller emulsions, which significantly improves the oil displacement efficiency and greatly increases the recovery rate.
In the etched-glass model (Figure 25), the white area is the calculated area of the remaining oil. The area of remaining oil decreases with the increase of injection PV number, and the area of remaining oil is still large at the end of steam flooding. During CFVAS flooding, the area of remaining oil decreases, and the displacement range and efficiency increase.

5. Conclusions and Discussion

5.1. Conclusions

Regarding the unclear understanding of CO2 foam-assisted steam flooding, the flow process of heavy oil under steam flooding and CFVAS flooding in porous channels was simulated. Through the study on the occurrence state and mode of residual oil from steam drive to composite thermal recovery in a heavy oil reservoir, the distribution characteristics of residual oil were revealed, and the occurrence state and mode of residual oil were clarified, which provides the theoretical basis and technical support for the improvement of heavy oil recovery by composite thermal recovery. According to the state and mode of the remaining oil in each stage of the etched glass model, the following points were mainly observed:
  • From the two aspects of viscosity reduction effect and foam performance, the optimal concentration of foam viscosity reduction agent is 0.8 wt%, and the ratio of CO2 and foam viscosity reduction agent to gas and liquid is 1.5:1.
  • The sweep range of steam flooding is small, and the oil displacement efficiency is low. The CFVAS flooding has a larger sweep area, can block the flow channel and reduce the interfacial tension, significantly improve the mobility of crude oil, and uniformly expand the displacement front. The recovery factor of CFVAS flooding is 40~55% higher than that of steam flooding.
  • During CFVAS flooding, the remaining oil mainly exists in the form of an O/W emulsion or fully mixed state of oil, gas, and water, and a small part is in the form of discontinuous columns. The remaining oil form is related to the regional location, and the increase in injected PV number has a greater impact on CFVAS flooding but has little effect on the far and near flow channels
  • After CFVAS flooding, crude oil in the fine pore throat is mostly emulsified and dispersed, while the residual oil in the coarse and middle pore throat is columnar with foam. In the main channel, the pores with PCNs of 3~4 were filled with foam and some O/W emulsions. In the near flow channel, O/W emulsions were mixed with a few small foams and gathered in pores with a PCN of 4. The remaining oil was characterized as O/W emulsions and columns. In the far flow channel, residual oil that is fully mixed with foam, oil, gas, and water is gathered in the pore with PCNs of 4~5.

5.2. Discussions

For environmental protection, the novel foam viscosity-reducing agent prepared, extracted from tea trees, has the characteristics of a long half-life, large foam volume, and a more obvious blocking effect. The saponins contained in it are mainly extracted from oil tea cake and waste.
  • Saponin is mainly extracted from tea cakes and tea waste. Tea cakes contain irritating elements that deteriorate the quality of the land. People mainly deal with it by incineration. Through our extraction and utilization, we can effectively protect the quality of the land and reduce carbon emissions. Although the effect of saponin is quite good, the extraction rate of saponin for tea seeds is only 15%.
  • In terms of CO2, it can reduce CO2 emissions and promote carbon sequestration. On-site, we also recommend the use of captured CO2 injection to reduce the CO2 originally present in the atmosphere. The disadvantage is that the economic cost of captured CO2 is not low.

Author Contributions

Conceptualization, W.S.; methodology, W.S.; software, Y.G.; data curation, Y.M.; writing—original draft preparation, J.B. and Z.X.; supervision, L.T.; project administration, Q.Z.; funding acquisition, W.S. All authors have read and agreed to the published version of the manuscript.

Funding

This research was supported by the Open Fund of Shaanxi Key Laboratory of Advanced Stimulation Technology for Oil & Gas Reservoirs (NO. KFJJ-TZ-2023-5).

Data Availability Statement

Data is contained within the article.

Acknowledgments

The authors would like to thank Shengli Oilfield Huabin Chemical Co., Ltd. for providing chemicals and its products. The authors also thank the support of the Natural Science Research Project of Jiangsu Higher Education Institutions (grant number 23KJB440001) for providing the software and test equipment.

Conflicts of Interest

The authors declare that they have no known competing financial interests or personal relationships that could have appeared to influence the work reported in this paper.

References

  1. Bernard, G.G.; Jacobs, W.L. Effect of Foam on Trapped Gas Saturation and on Permeability of Porous Media to Water. SPE J. 1965, 5, 295–300. [Google Scholar] [CrossRef]
  2. Wei, P.; Pu, W.; Sun, L.; Pu, Y.; Wang, S.; Fang, Z. Oil recovery enhancement in low permeable and severe heterogeneous oil reservoirs via gas and foam flooding. J. Pet. Sci. Eng. 2018, 163, 340–348. [Google Scholar] [CrossRef]
  3. JPT staff. CO2-Foam Floods: Foam Properties and Mobility- Reduction Effectiveness. J. Pet. Technol. 1998, 50, 69–70. [Google Scholar] [CrossRef]
  4. Kaleli, M.K.; Farouq, A.S.M. Controlling mobility ahead of a viscous oil bank. In Proceedings of the Annual Technical Meeting, San Antonio, TX, USA, 6–9 June 1987. Paper Number: PETSOC-87-38-64. [Google Scholar] [CrossRef]
  5. Rojas, G.A.; Ali, S. Dynamics of Subcritical CO2/Brine Floods for Heavy-Oil Recovery. SPE Reserv. Eng. 1988, 3, 35–44. [Google Scholar] [CrossRef]
  6. Ma, J.; Wang, X.; Gao, R.; Zeng, F.; Huang, C.; Tontiwachwuthikul, P.; Liang, Z. Enhanced light oil recovery from tight formations through CO2 huff and puff processes. Fuel 2021, 154, 35–44. [Google Scholar] [CrossRef]
  7. Alcorn, Z.P.; Fredriksen, S.B.; Sharma, M.; Rognmo, A.U.; Føyen, T.L.; Fernø, M.A.; Graue, A. An Integrated Carbon-Dioxide-Foam Enhanced-Oil-Recovery Pilot Program with Combined Carbon Capture, Utilization, and Storage in an Onshore Texas Heterogeneous Carbonate Field. SPE Reserv. Eval. Eng. 2019, 22, 1449–1466. [Google Scholar] [CrossRef]
  8. Koottungal, L. Special Report 2010 worldwide EOR survey. Oil Gas J. 2010, 108, 41–53. [Google Scholar]
  9. Jian, G.; Zhang, L.; Da, C.; Puerto, M. Evaluating the Transport Behavior of CO2 Foam in the Presence of Crude Oil under High-Temperature and High-Salinity Conditions for Carbonate Reservoirs. Energy Fuels 2022, 33, 6038–6047. [Google Scholar] [CrossRef]
  10. Bernard, G.G.; Holm, L.W.; Harvey, C.P. Use of Surfactant to Reduce CO2 Mobility in Oil Displacement. SPE J. 1980, 20, 281–292. [Google Scholar] [CrossRef]
  11. Li, S.; Wang, P.; Wang, Z.; Cheng, H.; Zhang, K. Strategy to enhance geological CO2 storage capacity in saline aquifer. Geophys. Res. Lett. 2023, 50, 101431. [Google Scholar] [CrossRef]
  12. Wang, Z.; Li, S.; Jin, Z. Oil and gas pathway to net-zero: Review and outlook. Energy Strategy Rev. 2023, 45, 101048. [Google Scholar] [CrossRef]
  13. Qin, J.; Song, J.; Tang, Y. Well applicability assessment based on fuzzy theory for CO2 sequestration in depleted gas reservoirs. Renew. Energy 2023, 206, 239–250. [Google Scholar] [CrossRef]
  14. Qin, J.; Zhong, Q.; Tang, Y.; Rui, Z. CO2 storage potential assessment of offshore saline aquifers in China. Fuel 2023, 341, 127681. [Google Scholar] [CrossRef]
  15. He, Y.; Qiao, Y.; Qin, J. A novel method to enhance oil recovery by inter-fracture injection and production through the same multi-fractured horizontal well. J. Energy Resour. Technol. 2022, 144, 043005. [Google Scholar] [CrossRef]
  16. Rishi, L.; Mandal, M.M. Enhanced oil recovery using polyaniline-sodium dodecyl sulfate-sodium hydroxide flooding. Chem. Eng. Technol. 2022, 45, 497–507. [Google Scholar] [CrossRef]
  17. Yu, Y.; García, B.F.; Saraji, S. Surfactant viscoelasticity as a key parameter to improve supercritical CO2 foam stability/foamability and performance in porous media. J. Non-Newton. Fluid Mech. 2022, 282, 104311. [Google Scholar] [CrossRef]
  18. Lib, W.T.; Wei, F.L.; Xiong, C.M. Effect of Salinities on Supercritical CO2 Foam Stabilized by a Betaine Surfactant for Improving Oil Recovery. Energy Fuels 2021, 33, 8312–8322. [Google Scholar]
  19. Yang, K.; Li, S.; Zhang, K. Synergy of hydrophilic nanoparticle and nonionic surfactant on stabilization of carbon dioxide-in-brine foams at elevated temperatures and extreme salinities. Fuel 2021, 288, 119624. [Google Scholar] [CrossRef]
  20. Wang, P.; You, Q.; Han, L. Experimental Study on the Stabilization Mechanisms of CO2 Foams by Hydrophilic Silica Nanoparticles. Energy Fuels 2021, 32, 3709–3715. [Google Scholar] [CrossRef]
  21. Lai, N.J.; He, X.; Wang, J.Q.; Tang, L. Study on the Stabilization Mechanism of Wormlike Micelle-CO2 Foams in High-Temperature and High-Salt Oil Reservoirs. Energy Fuels 2023, 37, 10939–10950. [Google Scholar] [CrossRef]
  22. Mathew, E.S.; Shaik, A.R.; Sumaiti, A.A.; AlAmeri, W. Effect of Oil Presence on CO2 Foam Based Mobility Control in High Temperature High Salinity Carbonate Reservoirs. Energy Fuels 2018, 32, 2983–2992. [Google Scholar] [CrossRef]
  23. Li, W.; Zeng, H. Effect of temperature on the stability of supercritical CO2 foam stabilized with a betaine surfactant at high pressure. Colloids Surf. A Physicochem. Eng. Asp. 2022, 649, 129362. [Google Scholar] [CrossRef]
  24. Zhu, D.; Li, B.; Chen, L.; Zhang, C.; Zheng, L.; Chen, W.; Li, Z. Experimental investigation of CO2 foam flooding-enhanced oil recovery in fractured low-permeability reservoirs: Core-scale to pore-scale. Fuel 2024, 362, 130792. [Google Scholar] [CrossRef]
  25. Gümrah, F.; Baĝcı, S. Steam-CO2 drive experiments using horizontal and vertical wells. J. Pet. Sci. Eng. 1997, 18, 113–129. [Google Scholar] [CrossRef]
  26. Chen, X.; Zhang, Q.; Trivedi, J.; Li, Y.; Liu, J.; Liu, Z.; Liu, S. Investigation on enhanced oil recovery and CO2 storage efficiency of temperature-resistant CO2 foam flooding. Fuel 2024, 364, 130870. [Google Scholar] [CrossRef]
  27. Wei, B.; Pang, S.; Pu, W.; Lu, L.; Wang, C.; Kong, L. Mechanisms of N2 and CO2 Assisted Steam Huff-n-Puff Process in Enhancing Heavy Oil Recovery: A Case Study Using Experimental and Numerical Simulation. In Proceedings of the SPE Middle East Oil & Gas Show and Conference, Manama, Bahrain, 18–21 March 2017. Paper Number: SPE-183871-MS. [Google Scholar] [CrossRef]
  28. Majeed, T.; Kamal, M.S.; Zhou, X.M.; Solling, T.A. Review on Foam Stabilizers for Enhanced Oil Recovery. Energy Fuels 2021, 35, 5594–5612. [Google Scholar] [CrossRef]
  29. Stone, T.; Malcolm, J.D. Simulation of a large steam-CO2 co-injection experiment. J. Can. Pet. Technol. 1985, 24, 51–59. [Google Scholar] [CrossRef]
  30. Whelan, W.J. New Technology for Cold Lake. J. Can. Pet. Technol. 1984, 23. [Google Scholar] [CrossRef]
  31. Ding, M.C.; Li, Q.; Yuan, Y.J. Permeability and heterogeneity adaptability of surfactant-alternating-gas foam for recovering oil from low-permeability reservoirs. Pet. Sci. 2022, 19, 1185–1197. [Google Scholar] [CrossRef]
  32. Jia, B.; Xian, C.; Tsau, J.S.; Zuo, X.; Jia, W. Status and Outlook of Oil Field Chemistry-Assisted Analysis during the Energy Transition Period. Energy Fuels 2022, 36, 12917–12945. [Google Scholar] [CrossRef]
  33. Mohammed-Singh, L.J.; Singhal, A.K.; Sim, S.K. Screening Criteria for CO2 Huff-n-Puff Operations. In Proceedings of the SPE/DOE Symposium on Improved Oil Recovery, Tulsa, OK, USA, 22–26 April 2006. Paper Number: SPE-100044-MS. [Google Scholar] [CrossRef]
Figure 1. Relationship between the viscosity with temperature.
Processes 12 01582 g001
Figure 2. Oil–water interfacial tension with different temperatures.
Processes 12 01582 g002
Figure 3. Viscosity reduction effect of foam viscosity reducer.
Processes 12 01582 g003
Figure 4. Foaming performance of foam viscosity reducer.
Processes 12 01582 g004
Figure 5. CO2 foam viscosity reducer gas–liquid ratio optimization.
Processes 12 01582 g005
Figure 6. Controller and measurement equipment. (a) is mechanism of stabilizing foam, (b) is mechanism of adjusting flow, (c) is before emulsification, (d) is partial emulsification, and (e) is after emulsification.
Processes 12 01582 g006
Figure 7. Microscopic visualization experiment platform. (a) is the camera system, (b) is the etched glass model, and (c) is the observation window.
Processes 12 01582 g007
Figure 8. Experimental system and workflow.
Processes 12 01582 g008
Figure 9. Flow channel division diagram.
Processes 12 01582 g009
Figure 10. Pore channel width and pore throat width division.
Processes 12 01582 g010
Figure 11. Steam flooding at the main channel. (a) is pre-stage (0.5 PV), (b) is mid-stage (1.0 PV), and (c) is post-stage (1.5 PV).
Processes 12 01582 g011
Figure 12. Location of steam flooding at main channel zone. (a) is 0.5 PV, (b) is 1.0 PV, and (c) is 1.5 PV.
Processes 12 01582 g012
Figure 13. Steam flooding at near channel zone. (a) is 0.5 PV, (b) is 1.0 PV, and (c) is 1.5 PV.
Processes 12 01582 g013
Figure 14. Location of steam flooding near channel zone. (a) is 0.5 PV, (b) is 1.0 PV, and (c) is 1.5 PV.
Processes 12 01582 g014
Figure 15. Steam flooding at the far channel zone. (a) is 0.5 PV, (b) is 1.0 PV, (c) is 1.5 PV.
Processes 12 01582 g015
Figure 16. Location of steam flooding at far channel zone. (a) is 0.5 PV, (b) is 1.0 PV, (c) is 1.5 PV.
Processes 12 01582 g016
Figure 17. CFVAS flooding, at the main channel zone. (a) 2.0 PV, (b) 2.5 PV, (c) 3.0 PV.
Processes 12 01582 g017
Figure 18. Main channel location of CFVAS flooding. (a) 2.0 PV, (b) 2.5 PV, (c) 3.0 PV.
Processes 12 01582 g018
Figure 19. CFVAS flooding at the near channel zone. (a) is 2.0 PV, (b) is 2.5 PV, and (c) is 3.0 PV.
Processes 12 01582 g019
Figure 20. Near channel location of CFVAS flooding. (a) 2.0 PV, (b) 2.5 PV, and (c) 3.0 PV.
Processes 12 01582 g020
Figure 21. CFVAS flooding at the far channel zone. (a) 2.0 PV, (b) 2.5 PV, and (c) 3.0 PV.
Processes 12 01582 g021
Figure 22. Far channel location of CFVAS flooding. (a) is 2.0 PV, (b) is 2.5 PV, and (c) is 3.0 PV.
Processes 12 01582 g022
Figure 23. Oil recovery rate in three experiments.
Processes 12 01582 g023
Figure 24. Overall remaining oil occurrence state in the microscopic model.
Processes 12 01582 g024
Figure 25. The area of remaining oil in the etched glass model varies with injected PV.
Processes 12 01582 g025
Table 1. Components of foam viscosity reducer.
NameChemical FormulaMass Percentage
Sodium tripolyphosphateNa5P3O103%
Sodium nonylphenol polyoxyethylene ether sulfateC30H46O·OSO3Na+12%
Sapindus saponinsC46H74O168%
Coconut oil diethanolamineC4H11NO25%
Distilled waterH2O72%
Table 2. Residual oil shape classification.
Continuous Residual OilDispersed Residual Oil
Clusters formColumniform Film shapeIsolated island shape
Processes 12 01582 i001Processes 12 01582 i002Processes 12 01582 i003Processes 12 01582 i004
Table 3. Comparison of remaining oil patterns of two displacement methods.
Displacement StageFlow ChannelResidual Oil StatusResidual Oil PatternEffect of Injection PV Number
Steam floodingMain channelClusters form, columniform, film shapeMostly in the fine throatThe amount of film remaining oil increases
Near channelColumniform, film shapeMostly in the fine throat and small holeColumnar remaining oil increases in the small hole
Far channelClusters form, a few are columnar and film-shapeMostly distributed in coarse, middle-throatThe clusters are transformed into film shapes and columns
CFVAS floodingMain channelO/W emulsionDistributed in the thick and middle throatThe O/W emulsion in the pores gradually flows into the throat
Near channelO/W emulsions and columnsThe number of O/W emulsions increases
Far channelColumnar and fully mixed state of oil, gas, and water
Disclaimer/Publisher’s Note: The statements, opinions and data contained in all publications are solely those of the individual author(s) and contributor(s) and not of MDPI and/or the editor(s). MDPI and/or the editor(s) disclaim responsibility for any injury to people or property resulting from any ideas, methods, instructions or products referred to in the content.

