Article

Research on Structural Design and Optimisation Analysis of a Downhole Multi-Parameter Real-Time Monitoring System for Intelligent Well Completion

1
College of Petroleum Engineering, Xi’an Shiyou University, Xi’an 710065, China
2
Shaanxi Key Laboratory of Well Stability and Fluid & Rock Mechanics in Oil and Gas Reservoirs, Xi’an Shiyou University, Xi’an 710065, China
3
Integrated Solution & New Energy, China Oilfield Services Limited, Tianjin 300459, China
4
Natural Gas Research Institute of Shaanxi Yanchang Petroleum (Group) Co., Ltd., Xi’an 710075, China
5
PetroChina Tarim Oilfield Company, Korla 841000, China
6
Department of Drilling and Production Engineering, Liaohe Oilfield, Panjin 124010, China
*
Author to whom correspondence should be addressed.
Processes 2024, 12(8), 1597; https://doi.org/10.3390/pr12081597 (registering DOI)
Submission received: 24 June 2024 / Revised: 19 July 2024 / Accepted: 26 July 2024 / Published: 30 July 2024
(This article belongs to the Special Issue Modeling, Control, and Optimization of Drilling Techniques)

Abstract

:
In this paper, based on electro-hydraulic composite intelligent well-completion technology, a new type of downhole multi-parameter real-time monitoring system design scheme is established. Firstly, a multi-parameter real-time monitoring system with a special structure is designed; secondly, its reliability is analysed by applying the method of numerical simulation; finally, in order to verify the reliability of the simulation results, a principle prototype is developed, and indoor experimental tests of fluid flow are carried out. The experimental results show that the flow rate is directly proportional to the differential pressure, and when the flow rate is certain, the higher the water content, the higher the differential pressure. The indoor experimental flow rate of 400~1000 m3/d is measured with high accuracy, and the error range is within 5%. Numerical simulation and experimental results with a high degree of fit, a flow rate of 400–1000 m3/d, the two error range within 10%, the integrated flow coefficient of the experimental value is stable between 0.75–0.815, the simulation value is stable between 0.80–0.86. The mutual verification of the two shows that the flow monitoring design meets the requirements and provides a reference basis for the structural design of the intelligent, well-completion multi-parameter real-time monitoring system.

1. Introduction

Global technology is developing in the direction of digitalisation, informationisation, and intelligence, and the oil and gas industry also regards artificial intelligence as a transformative technology that is accelerating the process of digital transformation and intelligent development [1,2]. Intelligent well-completion technology is the organic integration of oil and gas drilling and completion engineering with artificial intelligence and other advanced technologies, which is expected to significantly improve drilling and completion efficiency, reservoir encounter rate and oil and gas recovery rate and is regarded as an important trend and hot spot in the development of the oil and gas industry [3]. Intelligent well-completion technology is the key link to building an intelligent production system for offshore oil and gas fields. At present, the more advanced and better-applied intelligent well-completion technology is electro-hydraulic-composite intelligent well-completion technology [4]. This technology can achieve electro-hydraulic composite control and multi-parameter real-time monitoring, and its key technology is the Venturi integration of other parameters for monitoring [5]. However, due to the small space of the Venturi monitoring compartment, it is difficult to install too many sensors for things such as temperature, water content, pressure, etc. A new type of multi-parameter monitoring structure is urgently needed to perfect the technology, improve monitoring accuracy, and increase the monitoring data types, which will greatly improve the understanding of the downhole fluid flow and condition monitoring and provide important advanced technological support for the sustained and efficient development of deep-sea oil and gas fields [6,7,8].
Traditional wellbore monitoring is mainly based on the temperature and pressure at a single point of the wellbore, while with the development of monitoring technology, in addition to temperature and pressure, several types of parameters such as flow rate, water content, resistivity and other parameters have been added to the types of wellbore monitoring data, which combine full-range measurements with multi-parameter detection, high sensitivity and reliability, and provide a detailed description of the components and flow state of the wellbore fluids in different dimensions [9,10]. Meng Z et al. proposed a two-phase flow measurement method using a Venturi combined with an electrical resistance tomography (ERT) sensor, which introduces flow pattern information in the measurement process to minimise the influence of the flow pattern on the conventional differential pressure method, but the method only considers the influence of a single factor on the measurement accuracy [11]. To optimise the design, through CFD modelling of a high-pressure wet gas flow, Kumar Perumal et al. investigated the influence of diameter, diameter ratio, and convergence angle on the performance of wet gas metering Venturi meter and obtained a more optimised Venturi flow measurement structure, and the reliability of the structure was difficult to determine because the results were not physically verified [12]. Xue et al. used a combination of numerical calculations and experimental validation to systematically study. Although the structure was experimentally verified, the measurement types were relatively single, and no multi-parameter integration study was carried out [13]. Zhan, MK et al. integrated microwave sensors into a Venturi multiphase flowmeter, which could measure salinity and water content, and determined the optimal measurement position by comparing different sensor installation positions, but they did not consider the temperature, pressure, and other key parameters simultaneously [14]. Abubaker Saeed et al. studied a new, permanent downhole monitoring system, which focuses on real-time monitoring of water content, pressure, and temperature, but it simply combines the Venturi with other sensors without considering the formation of an integrated structure [15].
In summary, in the traditional completion process, there is often a lack of monitoring of key parameters in the wellbore, which may lead to inefficient completion operations, inaccurate monitoring values of temperature and pressure downhole, leading to safety hazards in the production process of oil and gas wells [16]. Therefore, intelligent well-completion tools with multi-parameter real-time monitoring systems are needed to solve the above problems. However, there are fewer studies on monitoring other parameters of Venturi integration with lower accuracy, and there is a lack of related physical verification of the model’s reliability. The focus of this paper is to carry out the optimisation design of the reverse-Venturi structure on the basis of the Venturi monitoring technology and develop a monitoring structure integrating the Venturi, measurement sensor and pressure measurement system. The structure is equipped with temperature sensors and pressure sensors in the monitoring chamber, and it is capable of integrating real-time monitoring of key parameters such as flow, pressure, and temperature in the wellbore. Based on the design scheme of the reverse-Venturi structure, combined with the finite element numerical simulation method, the mechanical properties of the reverse-Venturi and fluid flow simulation research is carried out. At the same time, an indoor experimental test plan for flow monitoring under normal temperature and pressure conditions is formulated, and an indoor experiment for flow monitoring of the reverse-Venturi is carried out to calibrate the accuracy of the numerical simulation and to verify the reasonableness of the reverse-Venturi structure. Through the design of the integrated reverse-Venturi structure, parameters such as pressure and temperature in the wellbore can be obtained in time. Potential problems can be solved, providing systematic and comprehensive basic data for the adjustment of the production system in the later stage of offshore oil and gas wells, and improving the accuracy, efficiency, and safety of the well-completion operation.

2. Materials and Properties

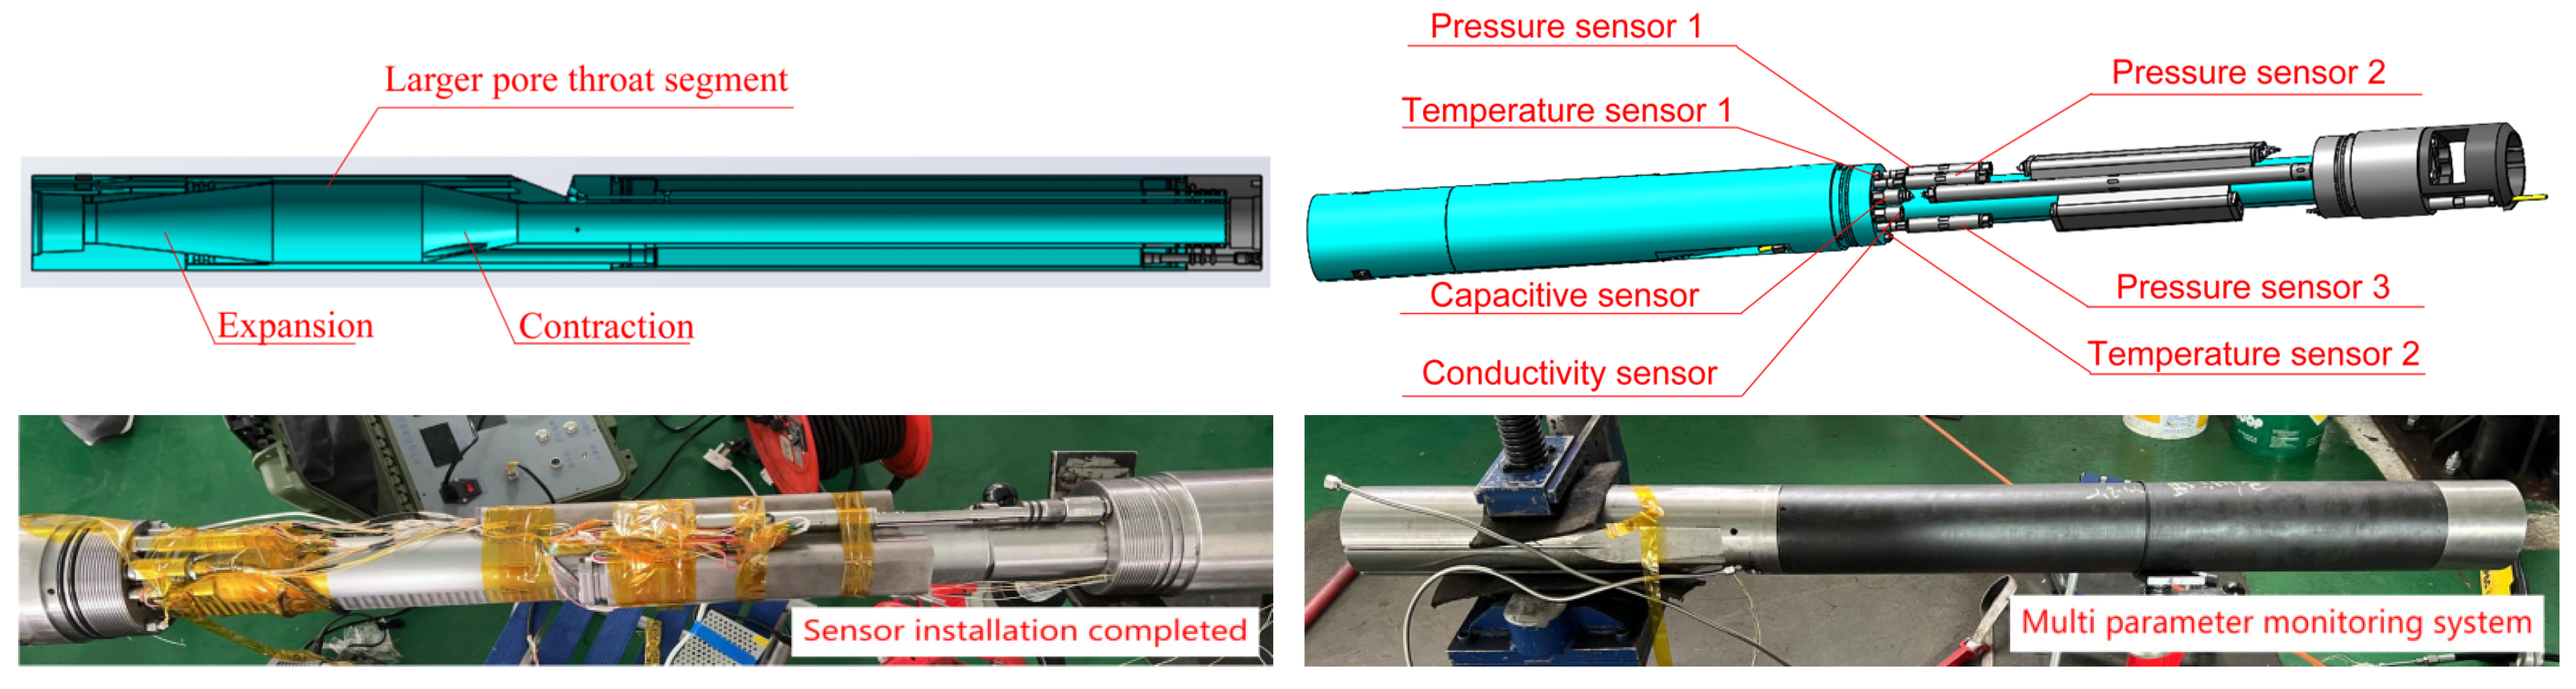
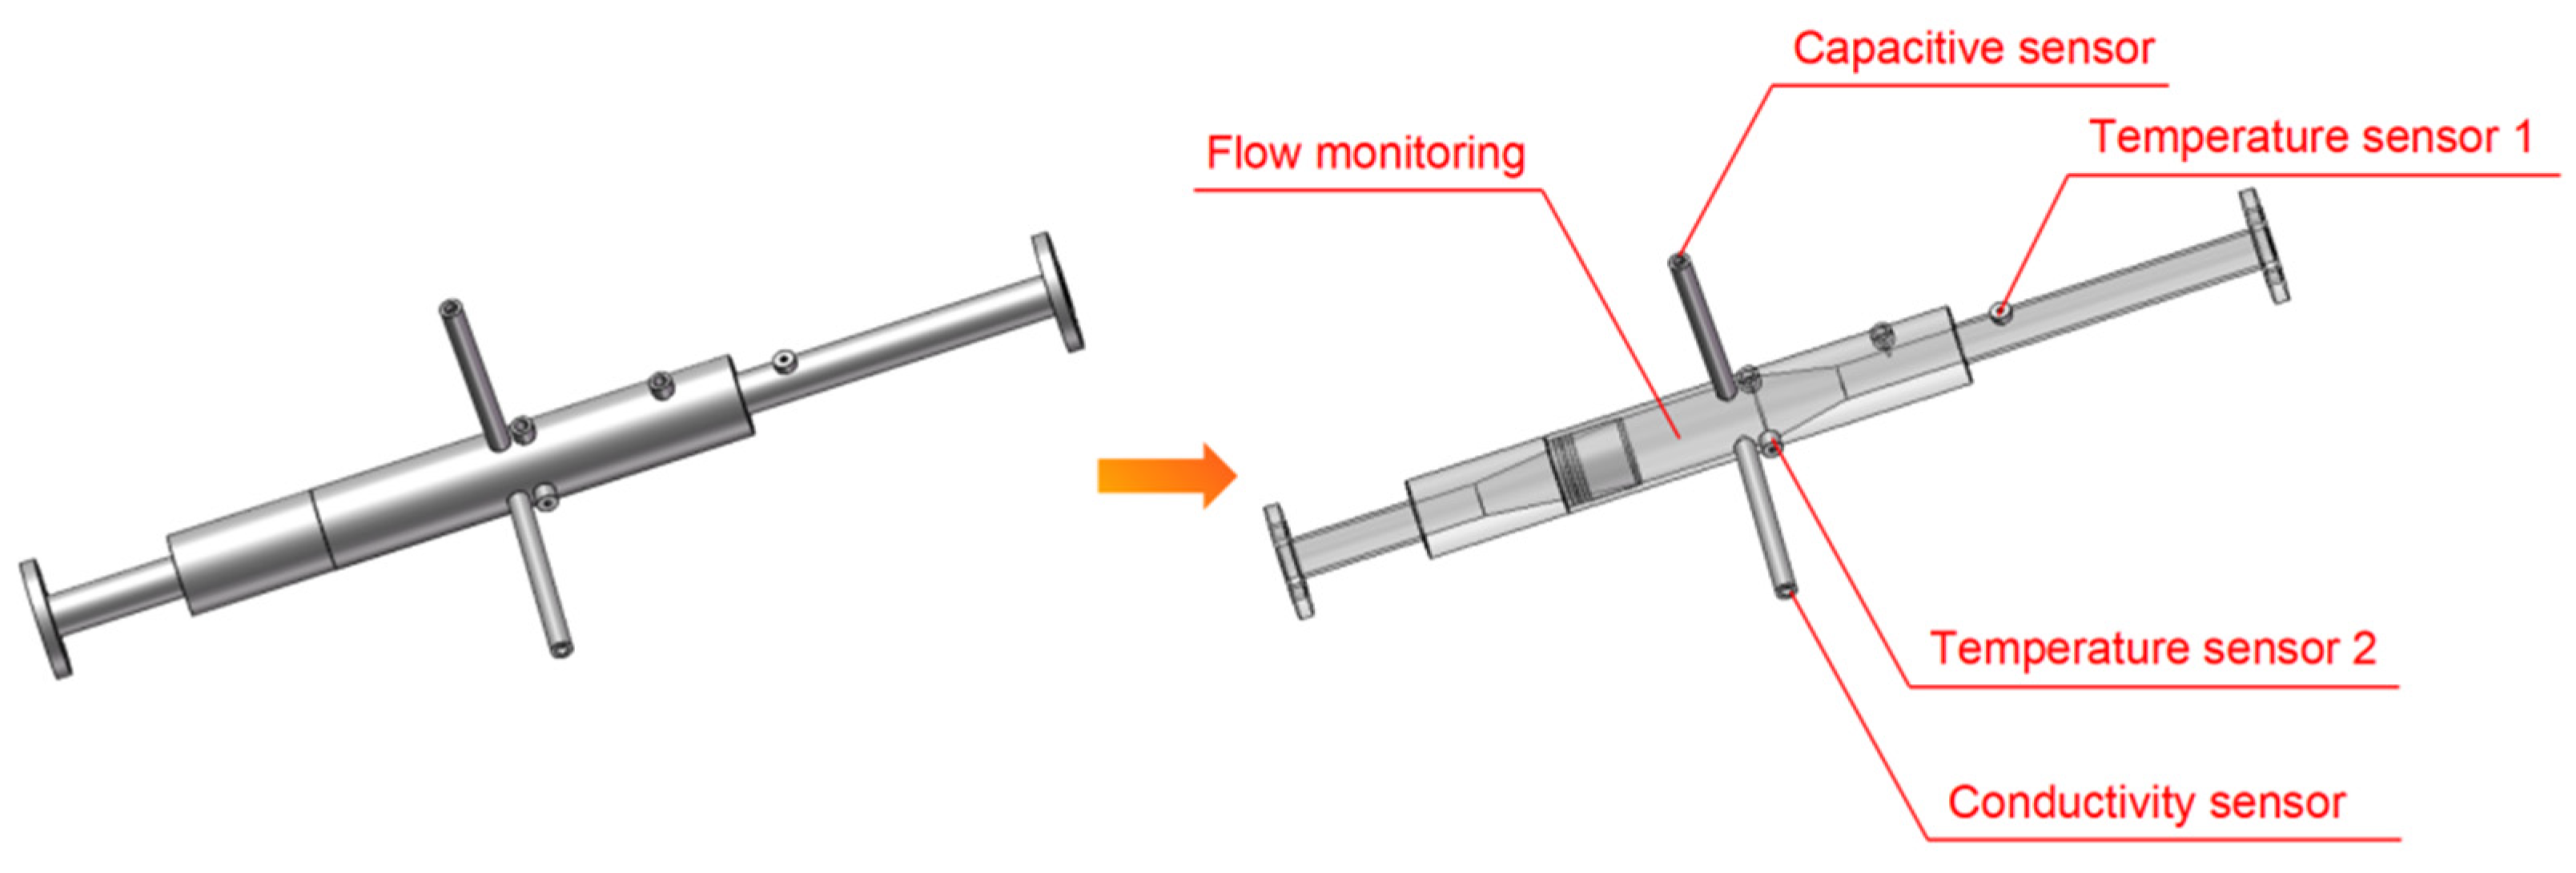
2.1. Multi-Parameter Real-Time Monitoring System Design Scheme

The downhole multi-parameter monitoring system, which realises high-precision online monitoring of temperature, pressure, water content, flow rate, and other parameters, is shown in Figure 1, which shows its structural features [17,18]. For flow monitoring, most of the new flow monitoring technologies are still only applicable to downstream production due to the harsh conditions found in the downhole tool environment, which, together with space constraints, make differential pressure-type instruments the preferred devices for full flow measurement, such as differential pressure flow meters represented by orifice plates, nozzles, and Venturi tubes [19,20,21]. Downhole Venturi flowmeter is a simple structure, applicable to a wide range of conditions, and easy to monitor in real-time. Still, the orifice throat section is relatively small, resulting in the inability to lower the well workover tool [22,23]. The reverse-Venturi flowmeter, which is not bound by the typical restrictive problems, has a simple structure, a wide range of applicable conditions, easy real-time monitoring and other advantages through the preferred [24]. Venturi tube flowmeters for downhole applications are shown in Table 1.
Venturi flowmeter, as a standard throttling flowmeter, is through the measurement of the throttling device before and after the pressure difference to carry out flow measurement, to the continuity equation and Bernoulli’s equation as the basic measurement principle. The contraction tube converts the pressure head to a velocity head, the expansion tube converts the velocity head to a pressure head, and the actual flow rate through the pipe can be calculated by measuring the pressure difference between the two sections. The relationship between flow rate and pressure difference is [25]:
Q = A 2 1 1 β 4 2 Δ P ρ
W = ρ Q = A 2 2 P ρ 1 β 4
where Q is the volume flow rate in m3/s. W is the mass flow rate in kg/s. A2 is the cross-sectional area of the Venturi throat in m2. β is the ratio of the diameter of the Venturi throat D2 to the diameter of the inlet straight section D1. ρ is the density of the fluid in kg/m3. ΔP is the difference between the pressure Pl at the inlet of the Venturi tube and that between the throats P2 in Pa.
The actual flow process in the section between the friction loss will be generated, resulting in the actual flow rate being lower than the theoretical value, so the introduction of correction coefficient C (i.e., flow coefficient), the actual flow rate is:
W = C A 2 ε 2 P ρ 1 β 4
The flow coefficient is defined as C = Qactual/Qtheoretical. The flow coefficient C is relevant to pipe size, fluid properties, flow velocity, and pipe wall roughness, ranging from 0.90 to 0.98. ε represents the compression coefficient, and ε = 1 for incompressible fluid.
This paper analyses the working principle of the flow monitoring system as well as dissects the key mechanical structure designs, researches the special Venturi structure, and finally determines the new type of intelligent, well-completion downhole flow monitor, i.e., reverse-Venturi, whose design parameters are shown in Table 2. The reverse-Venturi structure is easily lowered into the well workover tool using the channel as a roar channel and machining a flared structure in the side position [26,27]. The production multi-parameter real-time monitoring system selects high-precision pressure and temperature-sensitive components to design the pressure and temperature monitoring system, optimises the design of the Venturi flow detector structure so that it can be installed with different sensors, and combines with the theory of hydrodynamics to realise the monitoring of fluid flow and other parameters in the wellbore [28,29]. The structure of reverse-Venturi combined with sensors is shown in Figure 2.
The unique mechanical structure specifically includes components such as an upper joint, a monitoring compartment, a protective housing, and a protective cover, with the tool internally designed to use a reverse-Venturi structure. Therein, the monitoring compartment receives and processes data collected by the sensor assembly, is provided with three temperature sensors and three pressure sensors, respectively, a pressure-temperature sensor in the monitoring tube, an annulus pressure temperature sensor and a contraction section pressure temperature sensor. The protective casing houses the sensor assembly and the monitoring bin to protect them from interference and damage from the external environment. The real-time monitoring data such as pressure and temperature of the fluid in the annulus and tubing of each layer section and the Venturi flowmeter are used to interpret the key parameters of wellbore production such as yield, water content, and production index of each layer section [30].

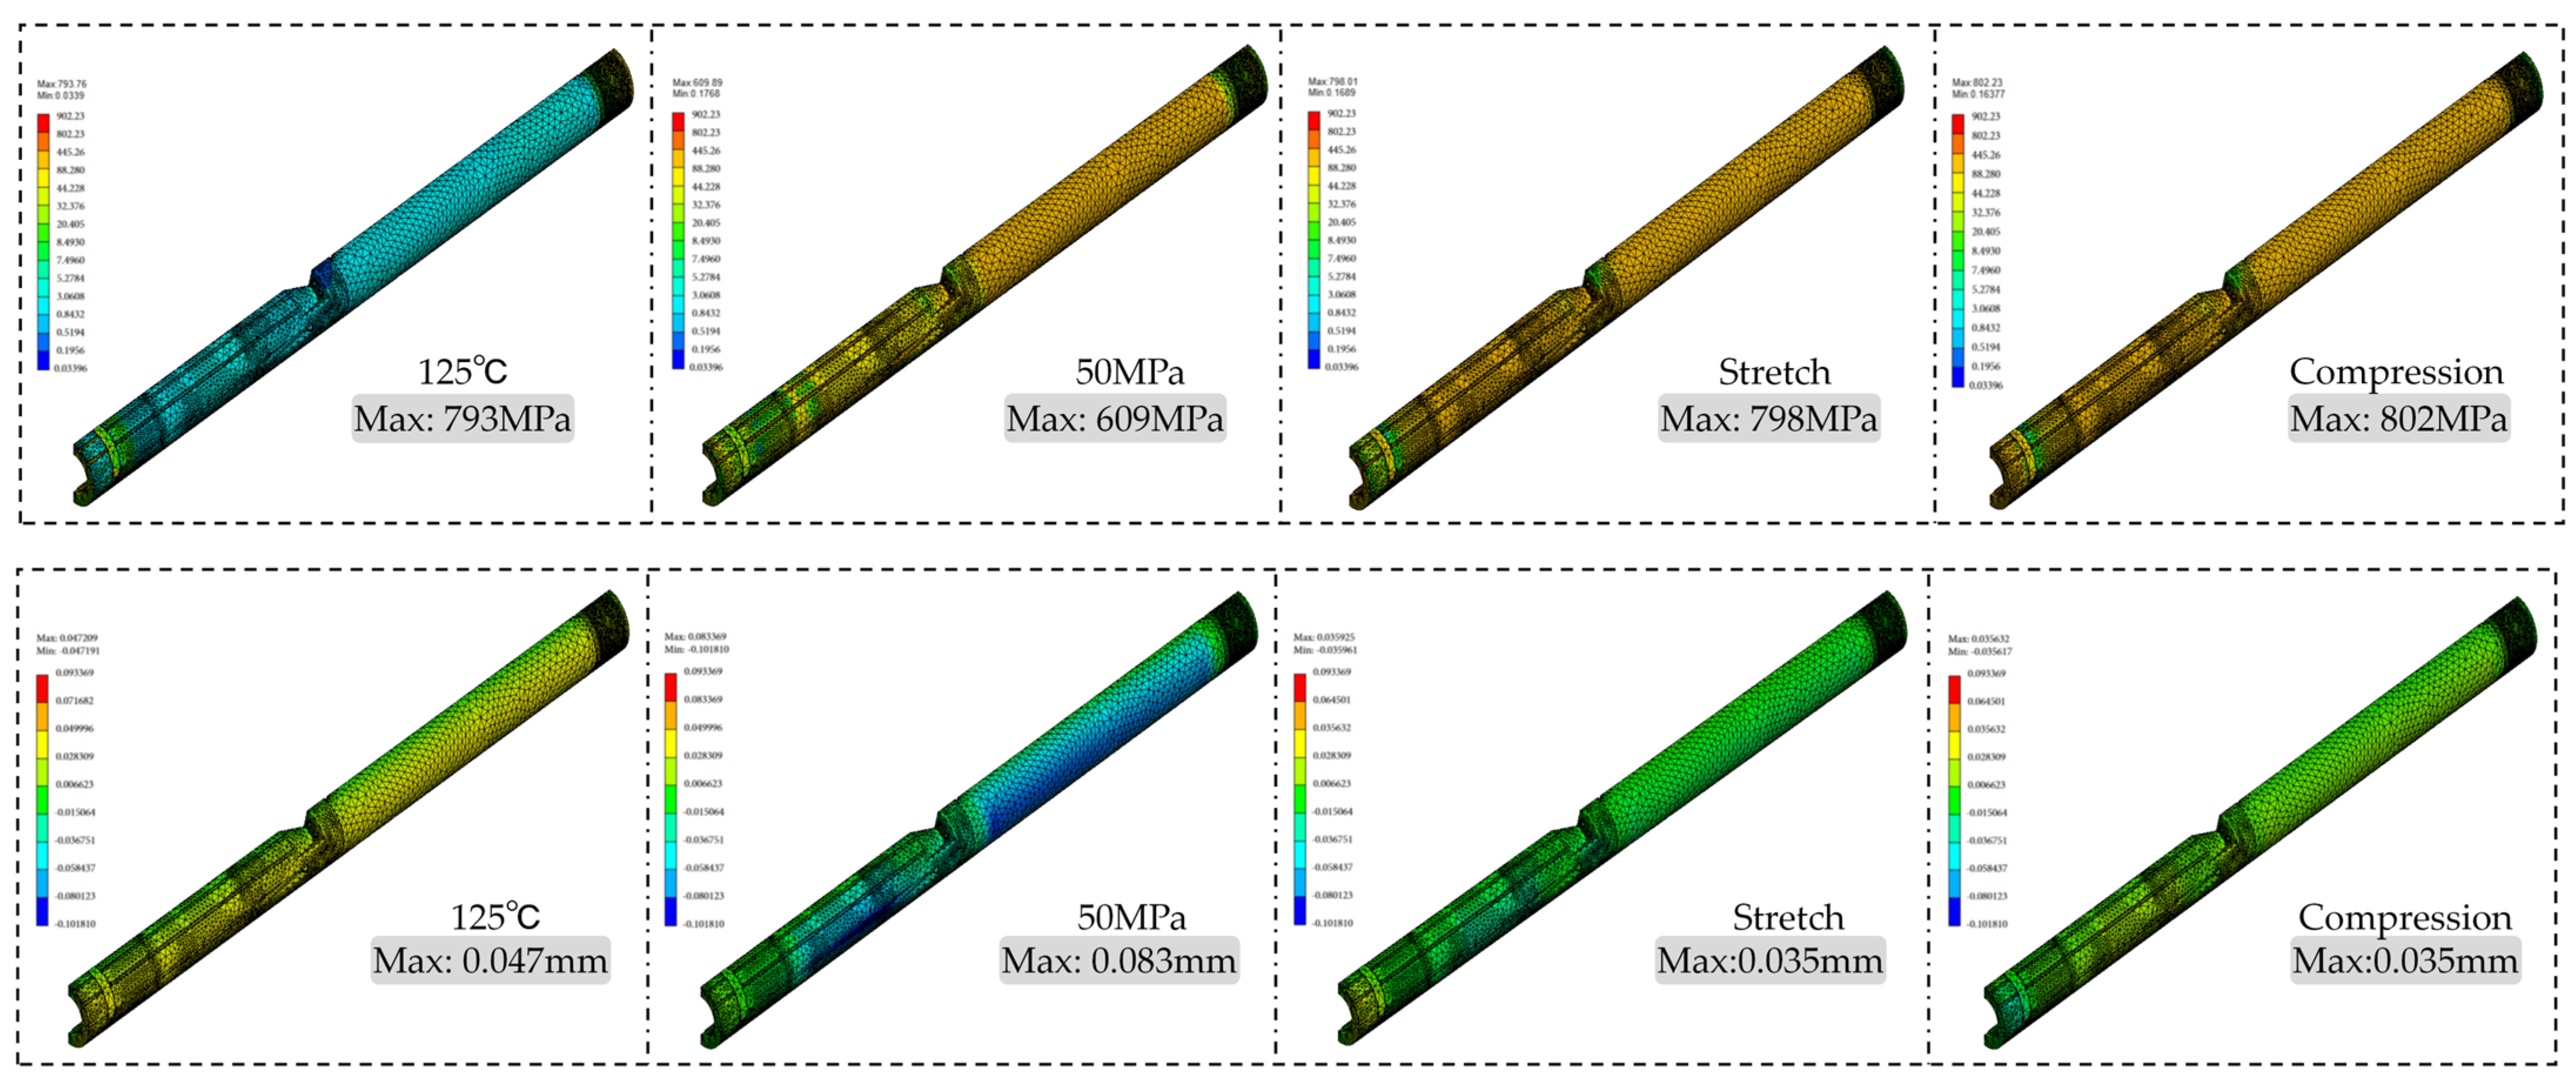
2.2. Mechanical Performance Analysis of Multi-Parameter Real-Time Monitoring Systems

The reverse-Venturi flowmeter needs to be applied in deep/ultra-deepwater wells, which belong to high temperature and high-pressure conditions, and is subjected to tensile and compressive stresses and friction in the process of working, etc. Therefore, it is necessary to check the strength of the Venturi flowmeter under extreme conditions. After research, similar downhole tools use processing and manufacturing of the main material for 42CrMo, the material yield strength of 930 MPa, the tensile strength of 1080 MPa, Poisson’s ratio μ = 0.28 [31]. A single-strength check analysis was carried out with a pressure of 50 MPa, a temperature of 125 °C, and a tensile or compressive force of 650 kN as the simulation boundary conditions. The constraints were fixed constraints applied to the inner end face at the threads of the monitoring system, axial force Fa was loaded through the force, and the radial force was loaded by the pressure due to the contact force of the monitoring system as a homogeneous force to ensure that the stresses were in line with the actual situation. The material and strength calibration boundary conditions are shown in Table 3, and the simulation results of single boundary conditions are shown in Figure 3. Finally, the monitoring silo composite load calibration analysis is carried out, and the results are shown in Figure 4. Based on the given boundary conditions, the simulation results show that the maximum stress is 841 MPa, the temperature and tensile conditions have an equal effect on the stress, the pressure has a smaller effect on the stress, and the results of the strength analysis indicate that there is a certain amount of stress concentration at the threaded connection of the valve body, which is also the maximum equivalent force of the monitoring system.
From the results of the strength analysis, there is some stress concentration at the threaded connection of the valve body, which is also the location of the maximum equivalent stress of the monitoring system, but these stress concentrations are not enough to threaten the strength. Temperature and tensile conditions are close to the radial displacement, but the pressure has a greater impact on radial displacement; the maximum radial displacement of the sealing ring contact surface is 0.083 mm, much smaller than the elasticity of the O-ring seal with a diameter of 2.65 mm is 0.58 mm, the strength and deformation to meet the design requirements, from the results of the radial displacement of the protective shell of the radial displacement of a larger amount of this conforms to the engineering reality. Still, the shell thickness is sufficient to meet the radial displacement of the shell, but it is not enough to meet the design requirements. The thickness is enough to meet the requirements of radial displacement. Based on this mechanical analysis, the subsequent reverse-Venturi fluid flow simulation analysis, in-kind processing test analysis, and research.

3. Results and Discussion

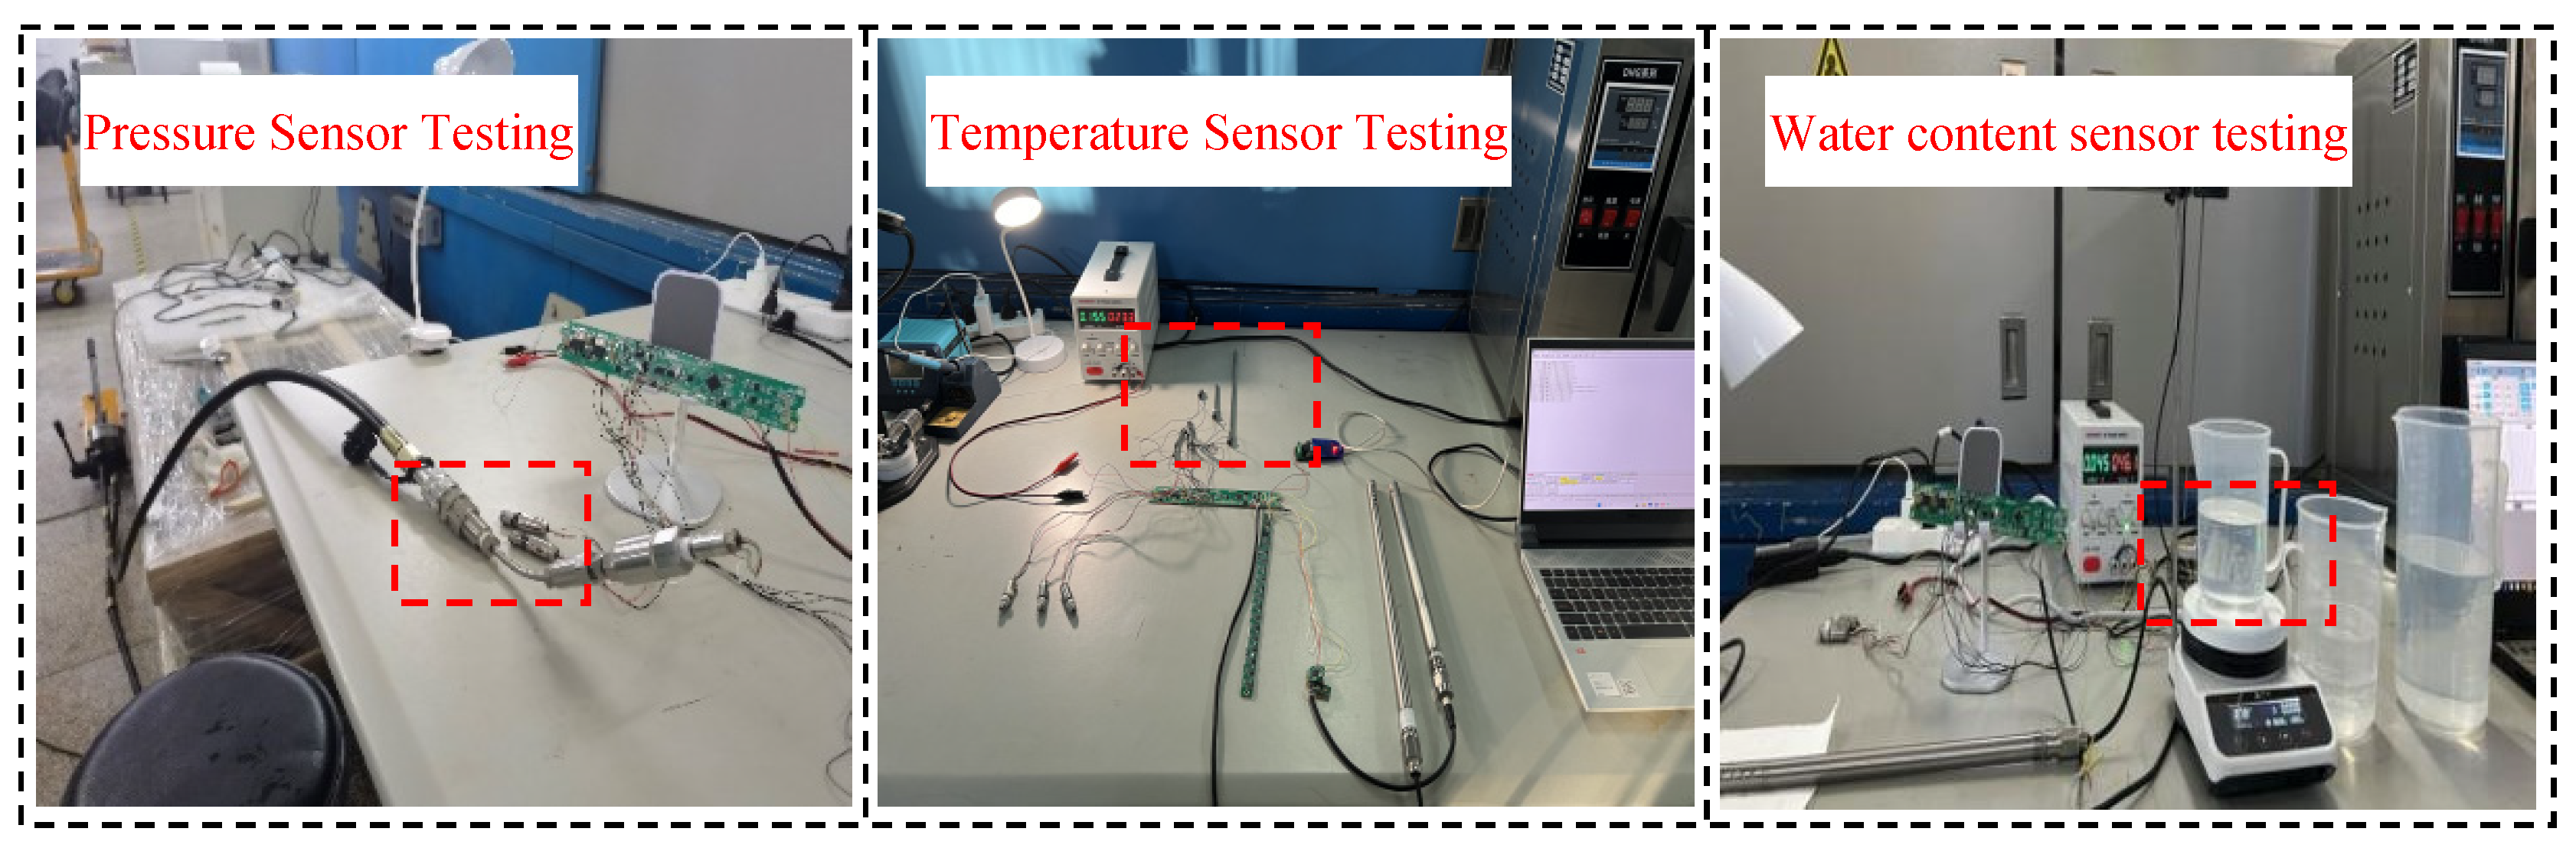
3.1. Reliability Analysis of Monitoring Parameters Such as Water Content, Temperature, and Pressure

Figure 5 shows the testing process of each sensor and the accuracy of the water content sensor. The temperature and pressure sensors were measured separately, and the capacitance sensor and the capacitance sensor were tested separately and proportioned to the oil–water mixture with different water content. The test results show that the capacitance sensor has a higher accuracy within 50% of the water content, with an error of less than 2%, and the conductivity sensor has a higher accuracy above 50% of the water content. At the same time, the temperature sensor was put into the constant temperature box for accuracy testing, and the pressure sensor was tested by pumping. Table 4 shows the test results. The measurement of each sensor is stable, and the accuracy is high.

3.2. Reliability Analysis of Flow Monitoring with Reverse Venturi Flowmeters

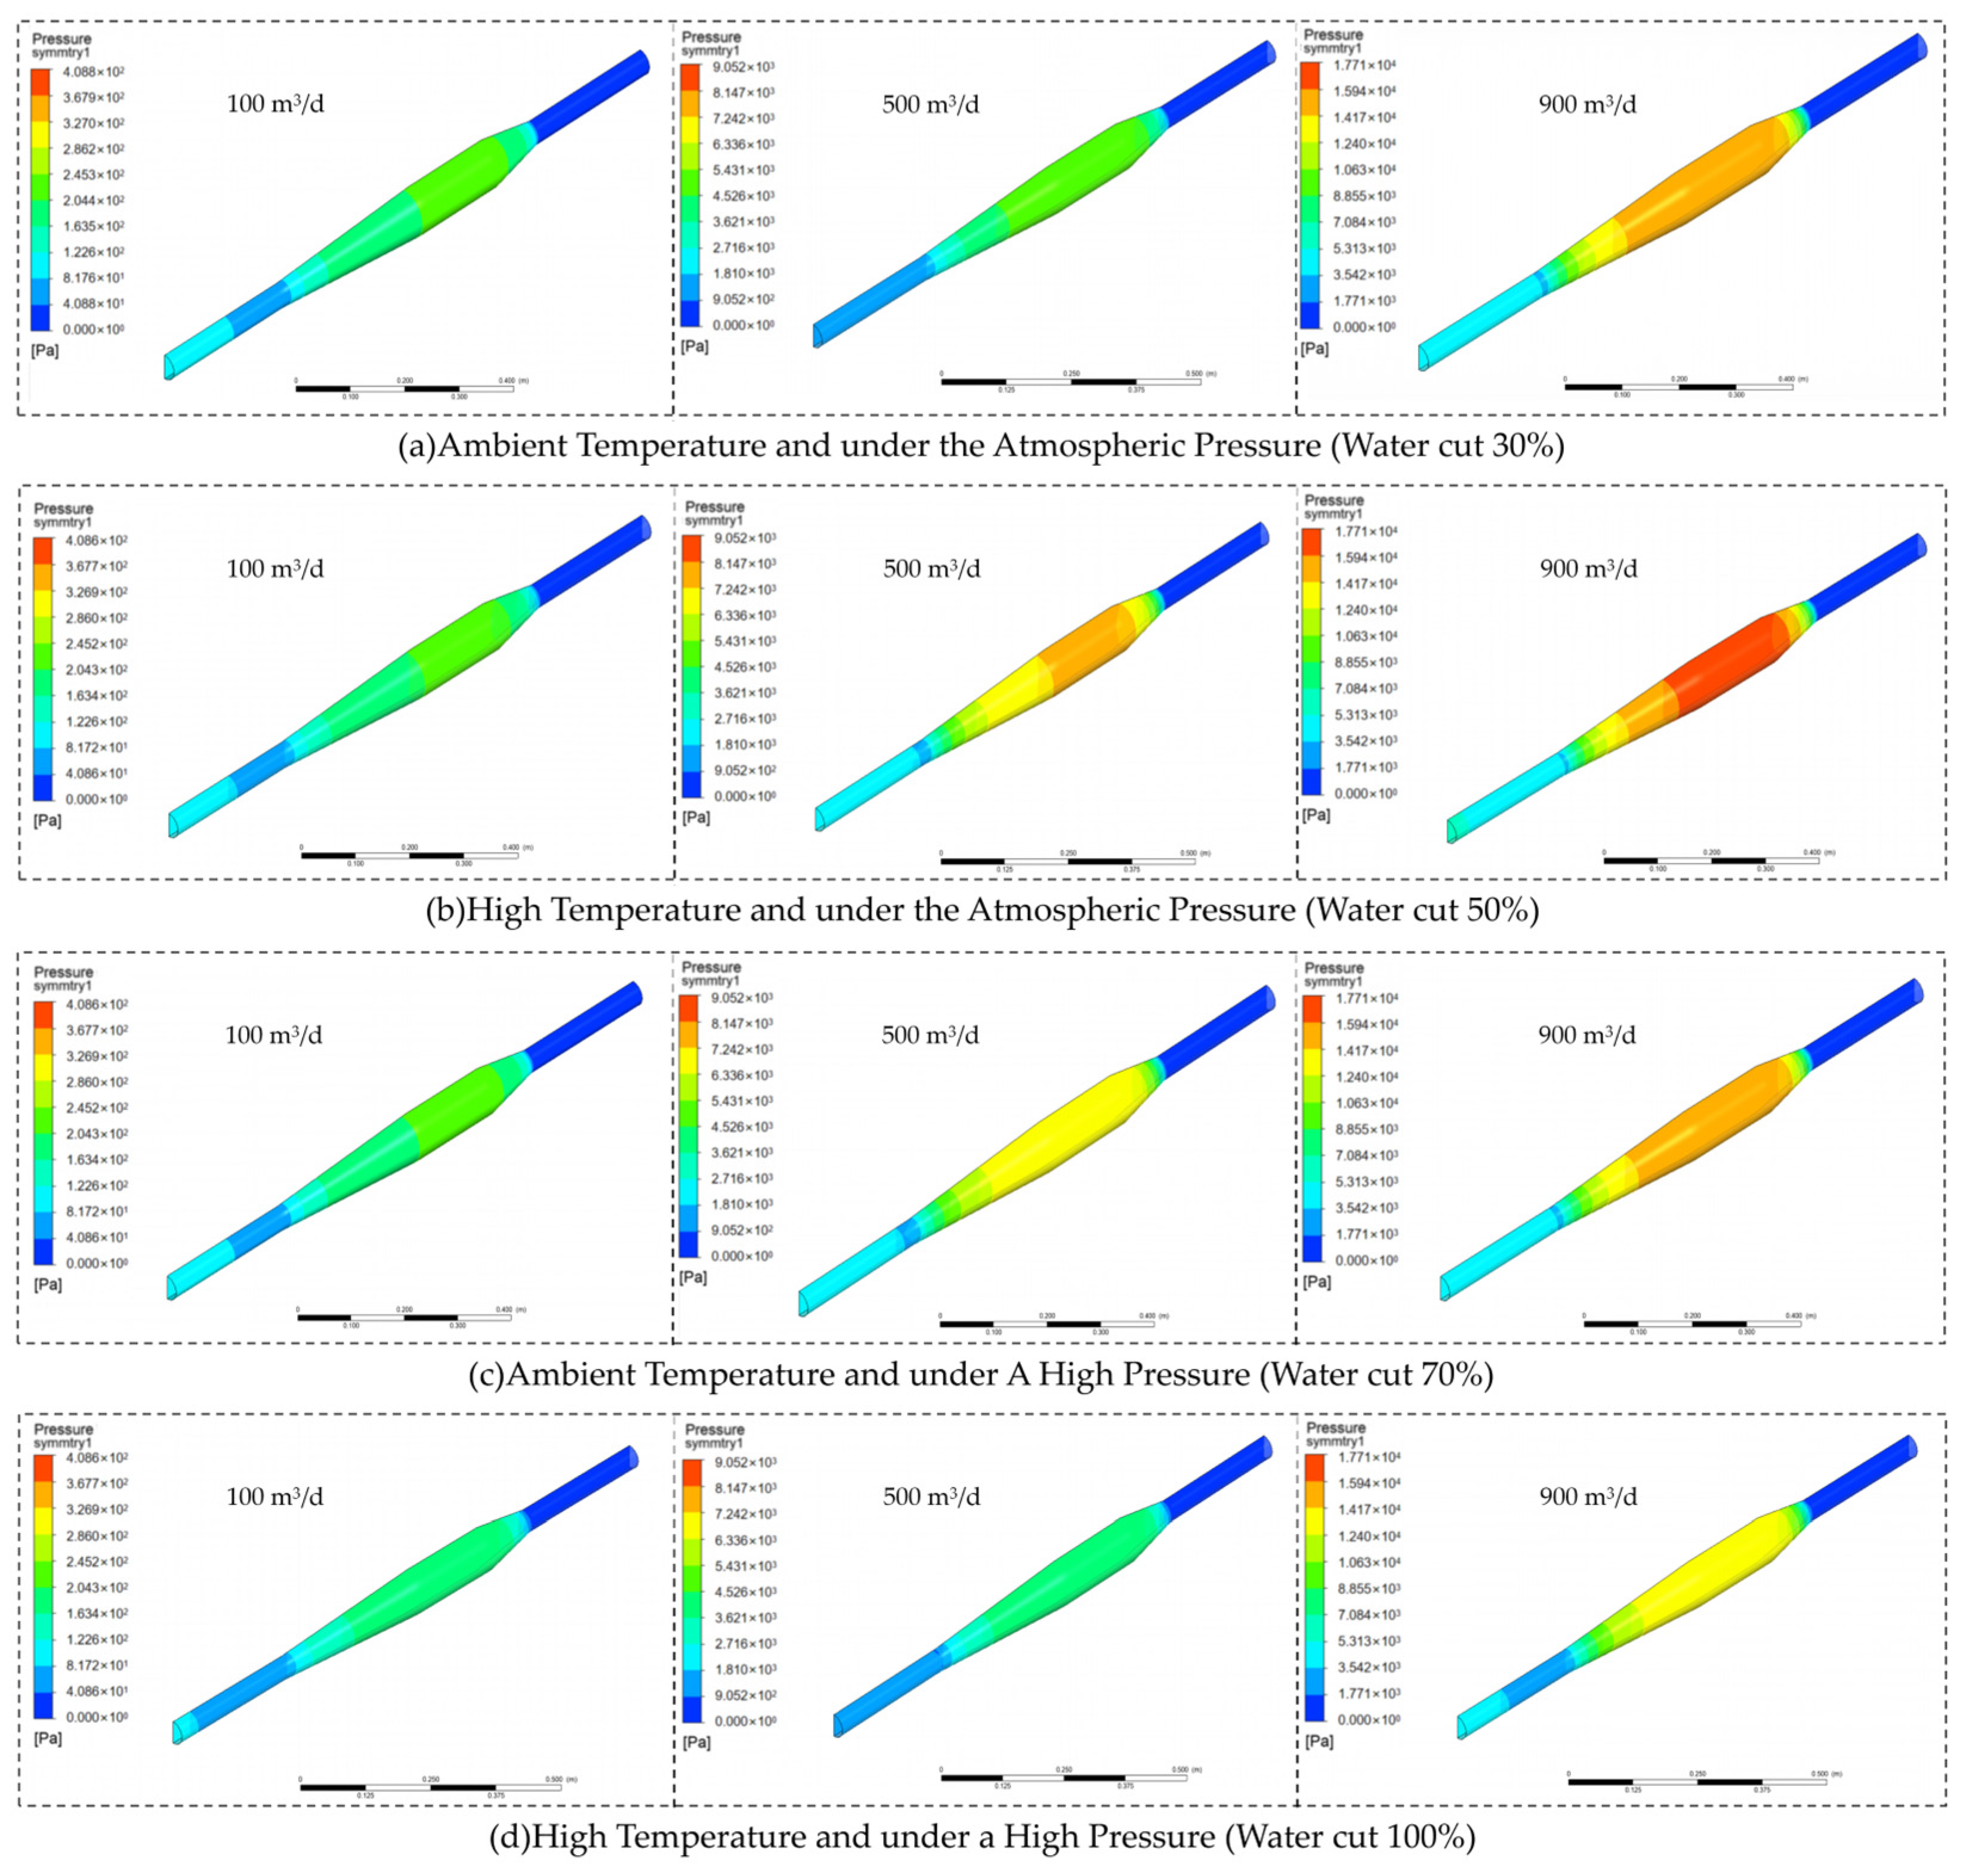
3.2.1. Numerical Simulation Analysis for Flow Monitoring of Reverse Venturi Flowmeters

Fluent is used to carry out fluid flow numerical simulation experiments to construct a finite element model of the reverse-Venturi flowmeter and set up the assumptions, mesh division, basic control equations of multiphase flow and numerical simulation. In order to study the flow characteristics of two-phase flow in the reverse-Venturi, this paper needs to establish the following assumptions: (1) the influence of surface tension is ignored; (2) there is no inter-phase mass transfer between the two phases occurs (3) oil and water phases are incompressible fluids; (4) the basic physical properties of the two-phase medium will not change during the flow process [32]. The diameter of the inlet straight pipe section and the outlet straight pipe section is the same, 48 mm, the contraction angle of the contraction pipe is 22°, the expansion angle of the expansion pipe is 12°, and the orifice-throat ratio is 0.55. The total length of the experimental pipe section is 1660 mm.
After determining the computational domain, it is necessary to mesh the computational domain and perform mesh-independence verification. Since the geometry of the Venturi is relatively simple, a structural hexahedral mesh is chosen. The quality of the meshing will have a significant impact on the final simulation results, and it is necessary to select an appropriate number of meshes while ensuring the accuracy and efficiency of the calculation. The basic conditions selected for this test are as follows: 50% water content, flow rate of 500 m3/d, at normal temperature and pressure conditions. As can be seen from Table 5, with the increase in the number of grids, the value of the differential pressure in the Venturi gradually decreases. Under the premise of ensuring the accuracy of the calculation, selecting a model with a smaller number of grids can reduce the number of calculations and accelerate the convergence speed, so the number of selected grids is about 50,000 to continue the follow-up study, the minimum grid quality of 0.56, the maximum of 0.98, with an average of 0.84 to meet the requirements.
The basic control equations for multiphase flow are chosen as the continuity and momentum equations. The continuity equation is derived from the law of conservation of mass, which indicates that the mass of fluid flowing into and out of the control body is equal per unit of time, denoted as [33]:
ρ t + ρ u = 0
ρ —Fluid density, kg/m3;
t —Time, s;
u —Velocity vector.
ρ u t + ρ u u = μ u u P + F
u —Velocity vector;
Ρ —Fluid density, kg/m3;
ρ —Pressure, Pa;
F —Volumetric force, m/s2;
μ —Fluid dynamic viscosity coefficient.
Equations (4) and (5) constitute the basic set of equations for multiphase flow. Since the temperature change of the oil–water two-phase flow before and after flowing through the Venturi is not considered. There is no interphase heat transfer, the effect of temperature on the simulation results is not investigated in the numerical simulation process of this paper, so the energy equations do not need to be considered. Only the continuity and momentum equations are used. Considering the accuracy and applicability of the experiments, the Realisable k-ε turbulence model is used in this paper, which is described in detail below [34]:
ρ k t + ρ k U i x i = x j μ 1 + μ t σ k k x j + P k + P b ρ ε Y M
ρ ε t + ρ ε U i x i = x j μ 1 + μ t σ k ε x j + ρ C 1 ε S ε C 2 ε ε 2 k + v ε + C 1 ε ε k C 3 ε P b
where k is turbulent kinetic energy, J; ε is dissipation rate, %; ρ is the density of each node; C 1 ε , C 2 ε , C 3 ε are constants; σ k is the turbulent Prandtl number of turbulent kinetic energy k; ε is the turbulent Prandtl number of dissipation rate ε ; x i is the i th coordinate direction; x j is the j th coordinate direction; μ t is turbulent viscosity; P k refers to the turbulent kinetic energy caused by velocity gradient; P b refers to the turbulent kinetic energy caused by buoyancy, J; Y M refers to the fluctuation caused by diffusion.
In the simulation of this paper, the inlet boundary condition is chosen as the mass flow rate of oil and water, and the mass flow rate does not change with time under any working condition. The outlet boundary condition is the pressure outlet, and the pressure at the outlet is atmospheric pressure, with no slippage at the wall and adiabatic piping system. The coupling of pressure and velocity is performed using the Simple algorithm of the finite volume method. The discretisation of the pressure equations is in a standard format, and the discretisation of the momentum equations is in first-order windward format [35,36].
On the basis of the above setup, the simulation and experimental study of the flow pattern of oil–water mixed fluid in the Venturi flowmeter was carried out to optimise the structure of the Venturi, which is shown in Figure 6. Developed a numerical simulation scheme for reverse-Venturi flow monitoring under different working conditions, carried out numerical simulation analysis of reverse-Venturi fluid flow under four working conditions (normal temperature and pressure, normal temperature and pressure, high temperature and pressure, high temperature and pressure) with 10 types of discharge (100–1000 m3/d) and five water contents (0%, 30%, 50%, 70%, and 100%), and the simulation scheme is shown in Table 6. The simulation scheme is shown in Table 6. Figure 7 simulation results are different water content of oil and water two-phase flow in the axial section of the Venturi along the pressure distribution; the pressure distribution is mainly related to the axial position, with the increase in flow rate of the pressure difference gradually increasing, the higher the water content, the higher the pressure difference. The throat pressure is the highest, the pressure at the inlet to the flow is the lowest, and the outlet pressure is atmospheric pressure. The lower the water content, the higher the viscosity of the mixed fluid in the flow process due to the along-the-road friction loss, it will produce along-the-road energy loss; the middle of the expansion section of the pressure head is converted to velocity head, the velocity rapidly decreases, the pressure rises. The expansion section velocity head is converted into the pressure head; the velocity rises rapidly, and the pressure falls gradually.

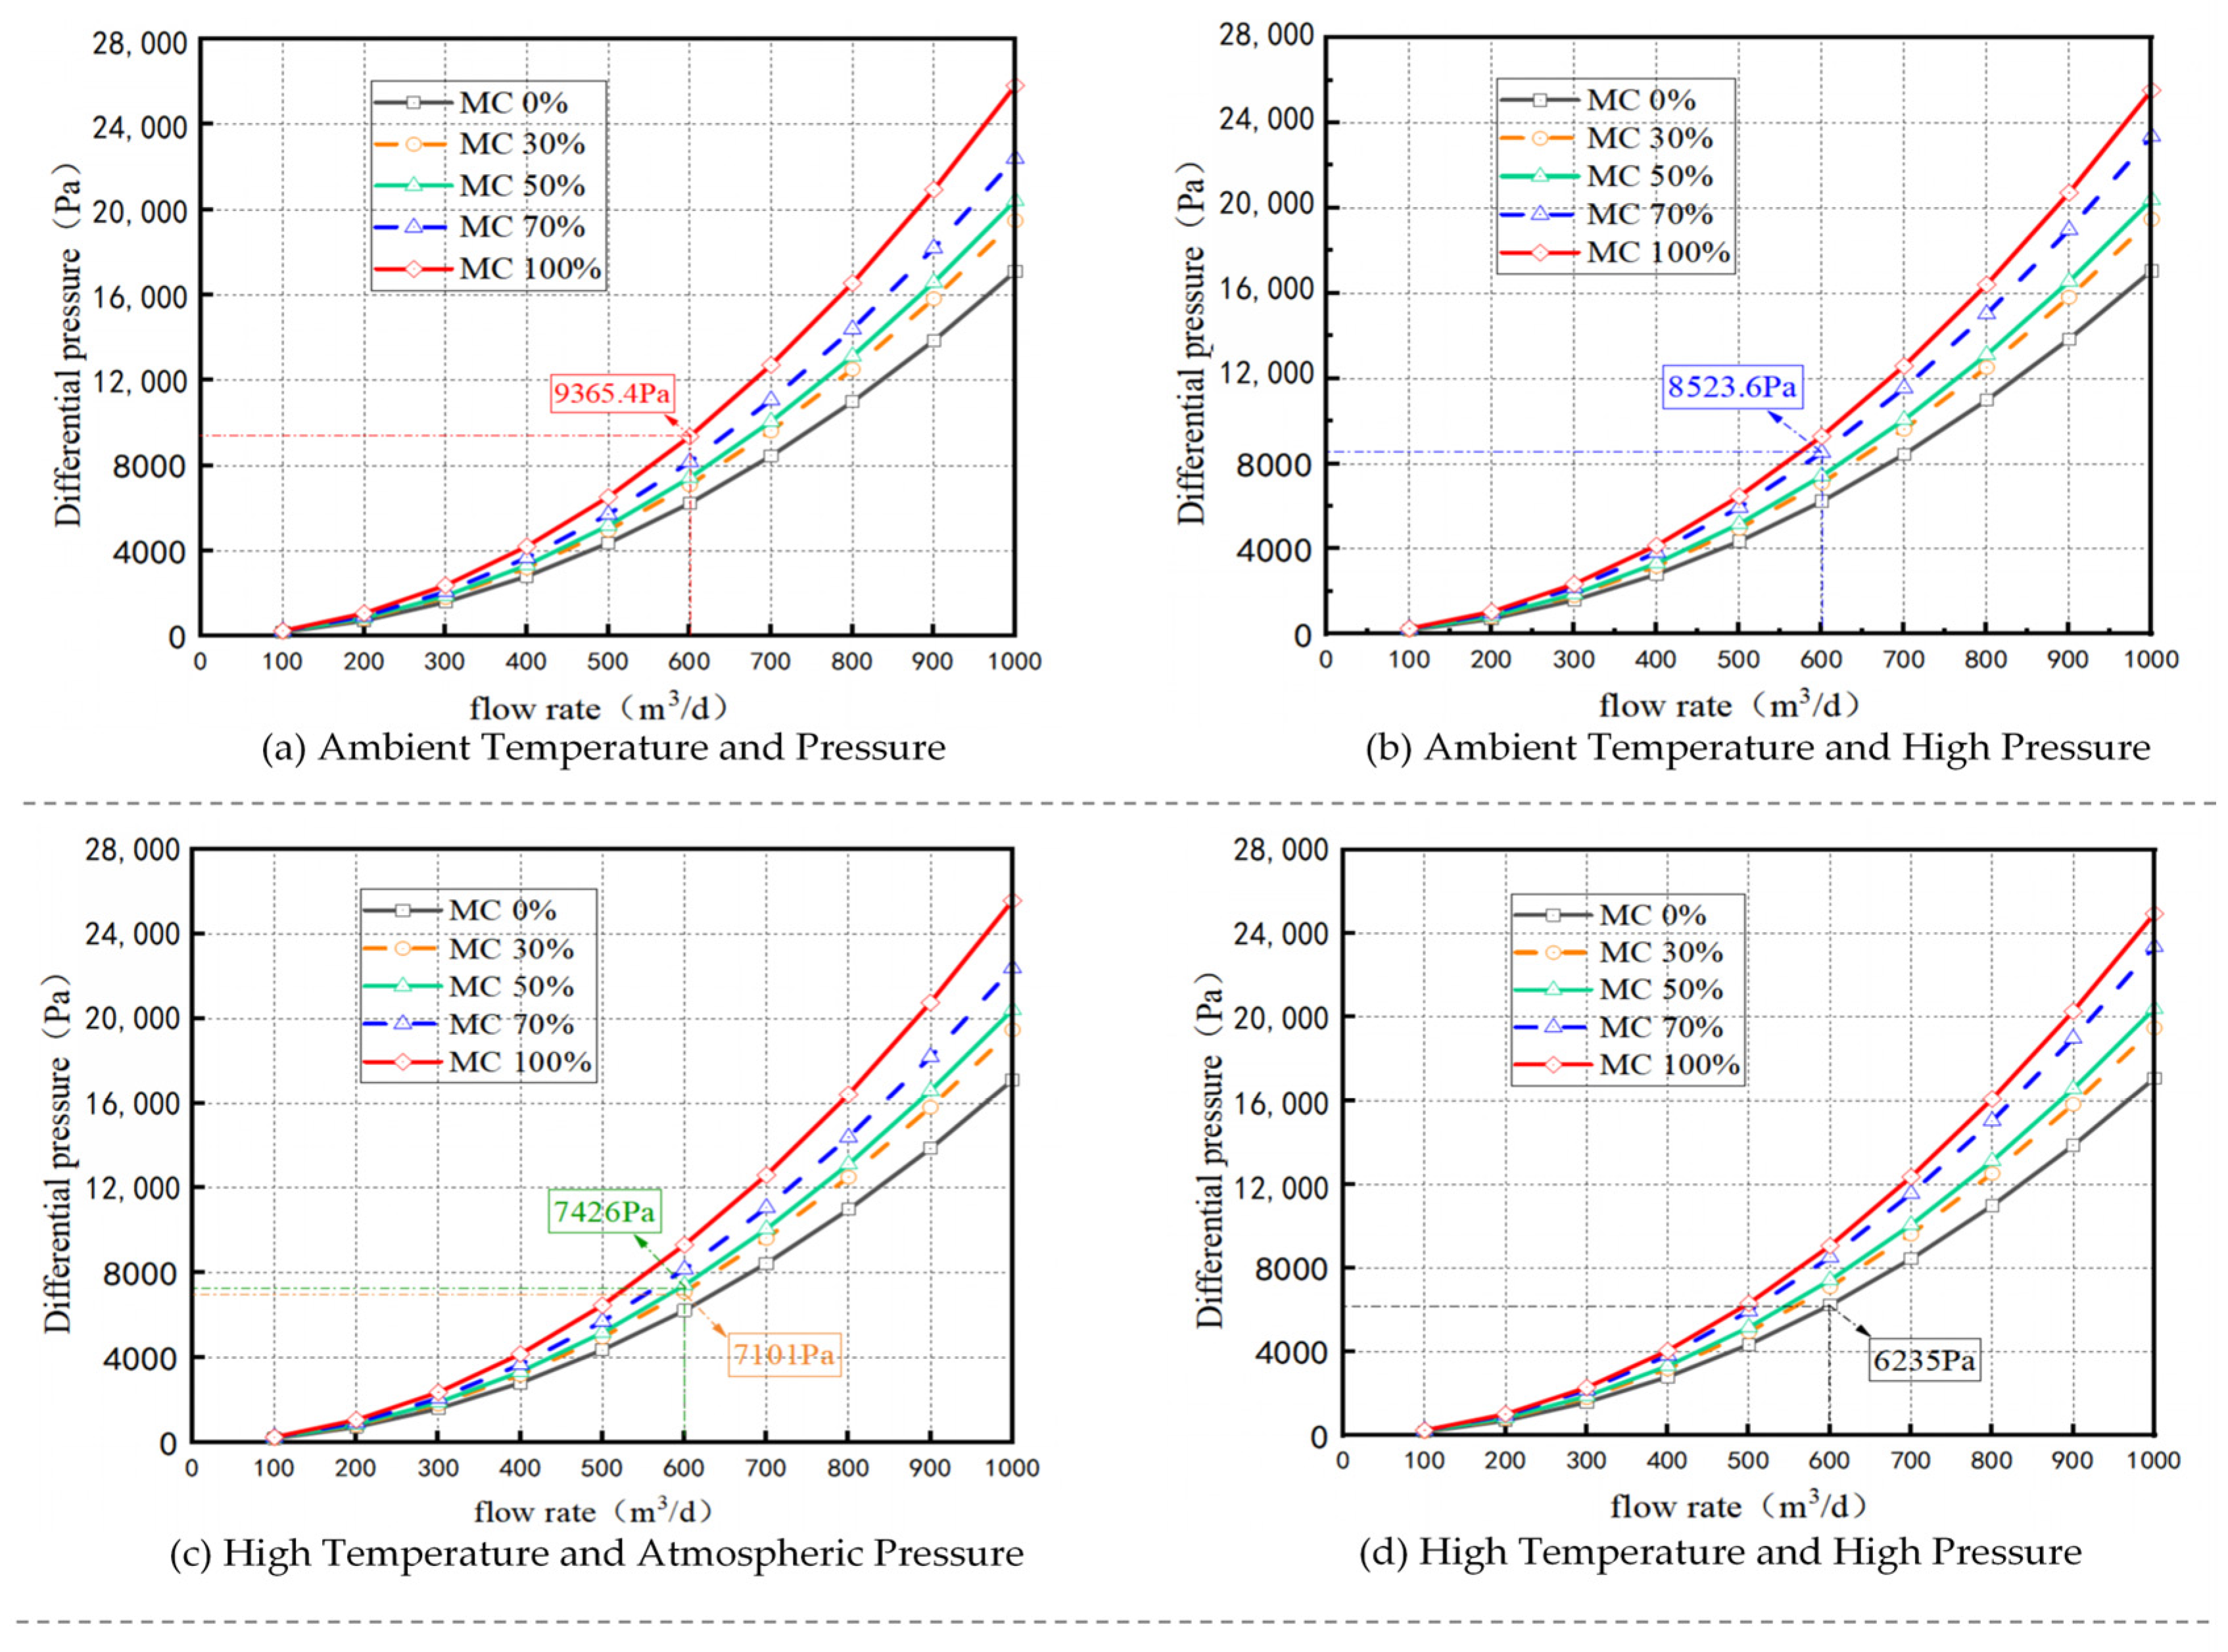
3.2.2. Comparison of Reverse Venturi Flowmeter Differential Pressure for Different Operating Conditions and Water Content

According to the simulation results, the differential pressure of the reverse Venturi under four working conditions with different water content is plotted on the curve to observe the degree of influence on the flow monitoring of the reverse Venturi under different working conditions, and the results of the simulation under the working conditions are shown in Figure 8. The simulation results show that the pressure drop curves of the reverse-Venturi at different water contents under the four operating conditions converge. Under the right-angle coordinate system, the relationship between the pressure difference between the inlet and throat of the reverse Venturi and the flow rate of the mixed fluid shows a parabolic relationship; the smaller the viscosity of the mixed fluid, the smaller the friction loss in the flow process, and the larger the pressure difference. The flow rate is proportional to the differential pressure; when the flow rate is certain, the higher the water content, the higher the differential pressure; when the water content is certain, the higher the flow rate, the higher the differential pressure, which is in line with the law of fluid flow in the Venturi, and verifies the reliability of its structural design.

3.2.3. Comparison of Combined Flow Coefficients of Reverse Venturi Flowmeters for Different Operating Conditions and Water Contents

The integrated flow coefficient of the Venturi is an important parameter that characterises the actual flow rate and the theoretical flow rate. Through simulation, the influence of different temperature and pressure conditions on the integrated flow coefficient of the reverse-Venturi is investigated. The results are shown in Figure 9 for each working condition. Simulation results show that in different working conditions, temperature and pressure conditions on the reverse-Venturi integrated flow coefficient of the influence of small, and reverse-Venturi integrated flow coefficient with the increase in flow rate there is a small increase from 400 m3/d–1000 m3/d, the integrated flow coefficient tends to stabilise, the value of the value of stability in the 0.80–0.85 between. The Venturi tube flow effective range ratio was 2–5, and the reverse-Venturi tube simulation flow monitoring range ratio was 2.5 in accordance with the law of Venturi tube flow measurement.

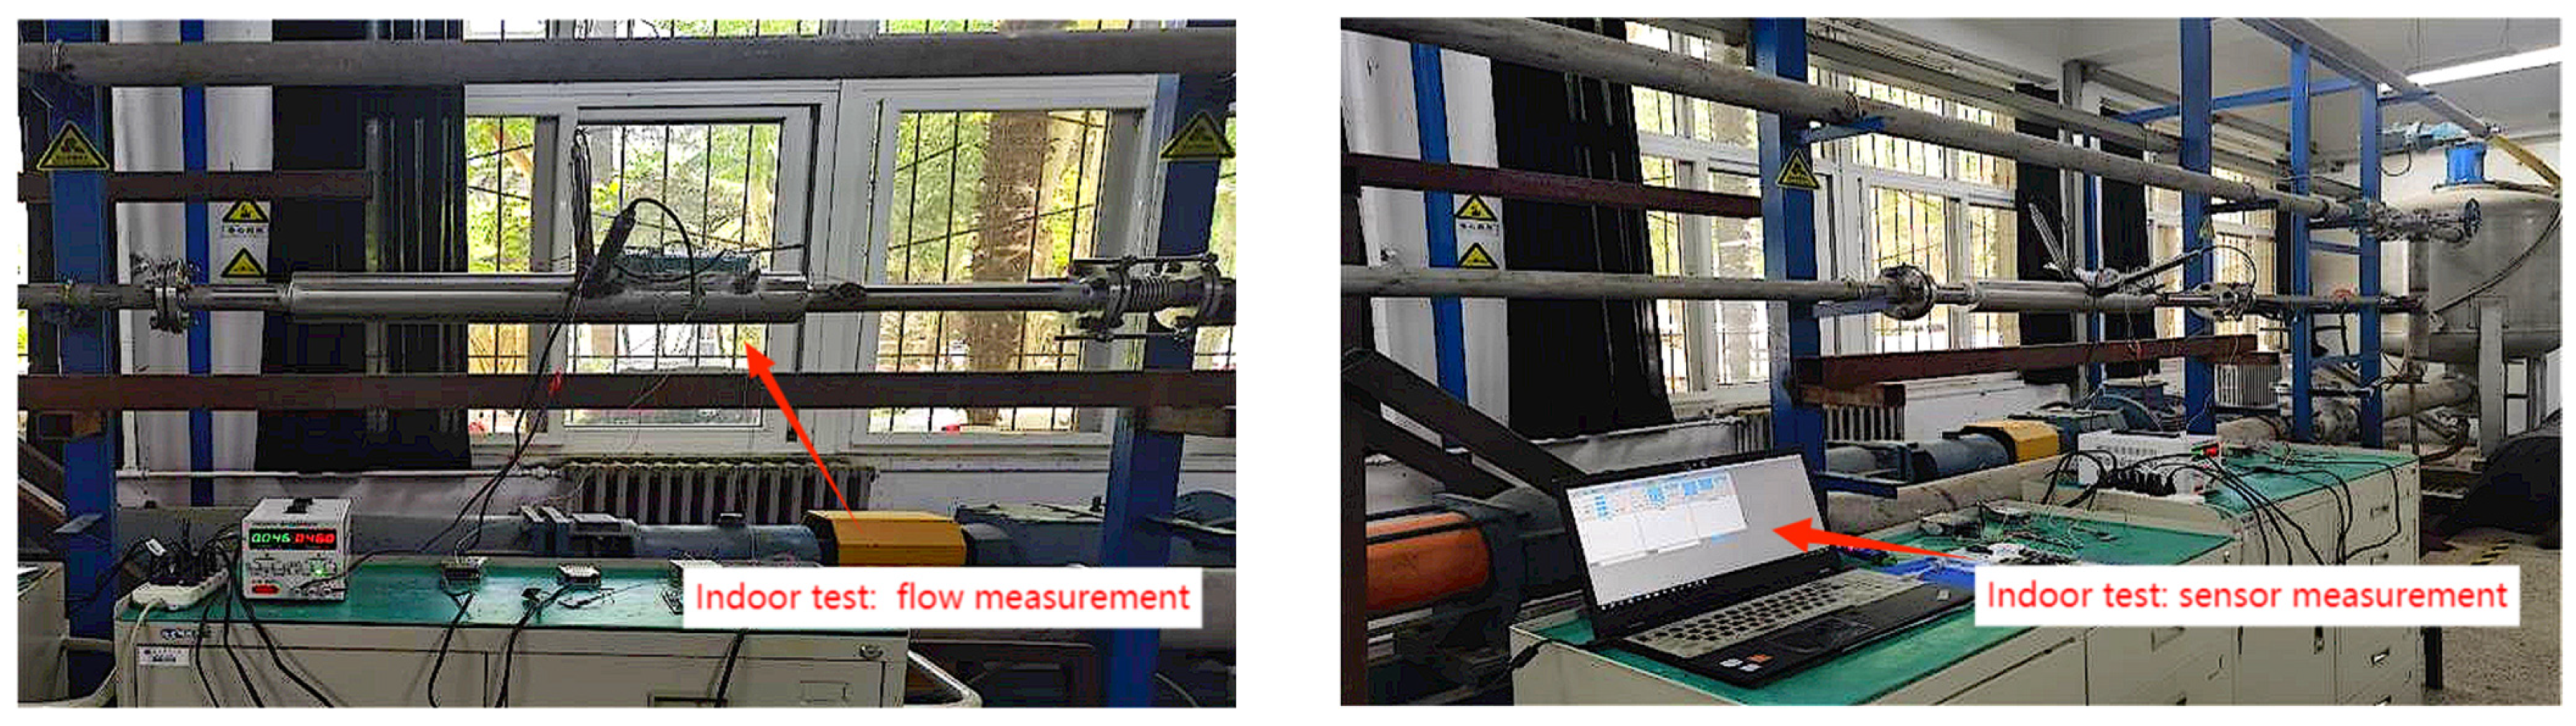
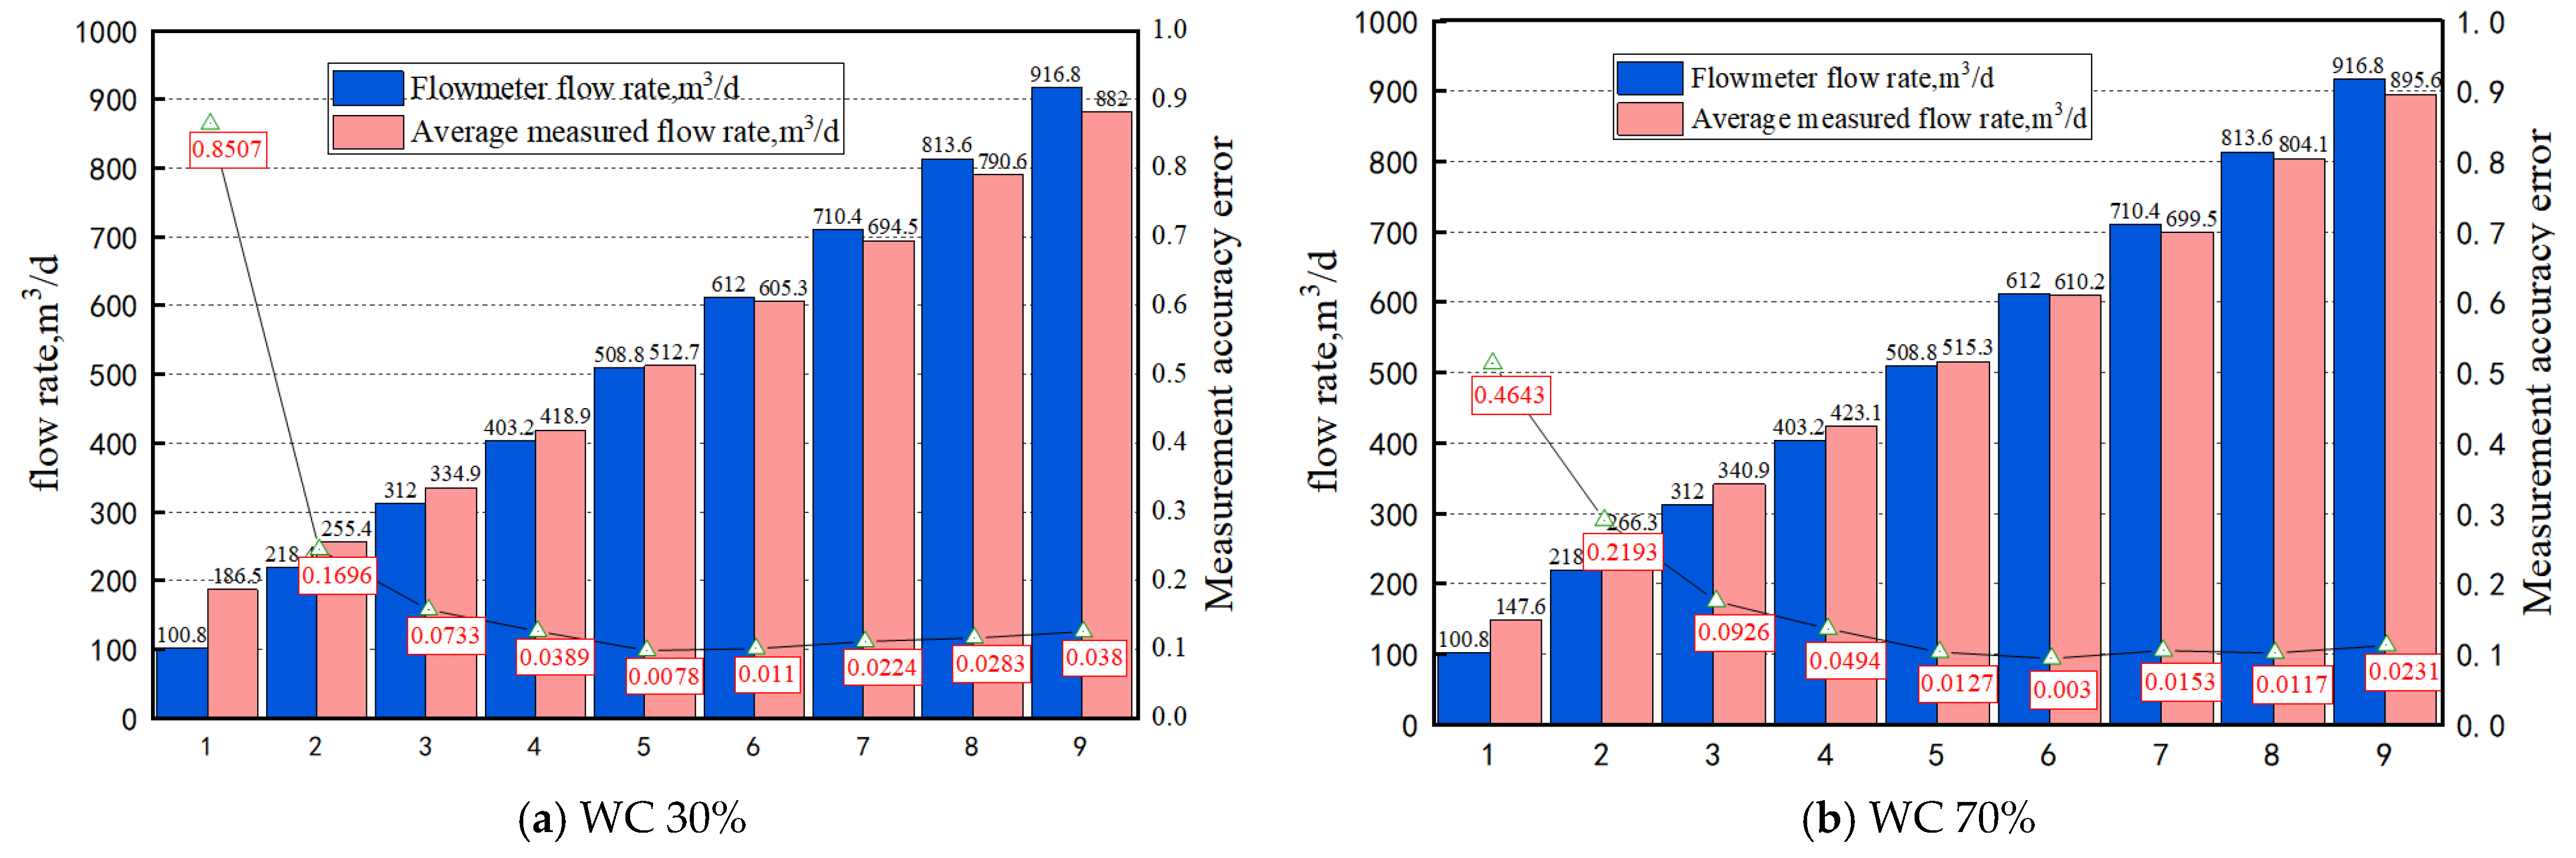
3.2.4. Analysis of Reverse Venturi Flow Monitoring Indoor Experimental Tests

According to the optimised structural design of the reverse-Venturi flowmeter prototype and indoor experimental testing, the reverse-Venturi structure is shown in Figure 10; the experimental process is shown in Figure 11. The development of indoor experimental testing programme for reverse-Venturi flow monitoring under normal temperature and pressure conditions, carried out 10 types of displacements (100–1000 m3/d), 8 water content (0%, 30%, 40%, 50%, 60%, 70%, 80%, and 100%), indoor experimental testing, 70%, 40%, 50%, 60%, 70%, 80%, and 100%) of the reverse-Venturi fluid flow indoor experimental test, the experimental results are shown in Figure 12. The experimental results show that the flow rate in the 100 m3/d~200 m3/d error range was within 30%; the flow rate in the 200 m3/d~400 m3/d measurement accuracy error range was within 20%, the flow rate in the 400 m3/d~1000 m3/d measurement was highly precise with an error range within 5%. Due to this experimental device being mostly for large-displacement experiments, the flow rate is low in the pipeline fluid flow is less, resulting in a small-displacement measurement error of 20–30%; the subsequent experimental device will be replaced for small-displacement secondary experiments. The experimental test flow measurement range of the maximum flow rate and minimum flow rate ratio of 2.5 in the Venturi flow within the effective range ratio to meet the design requirements.

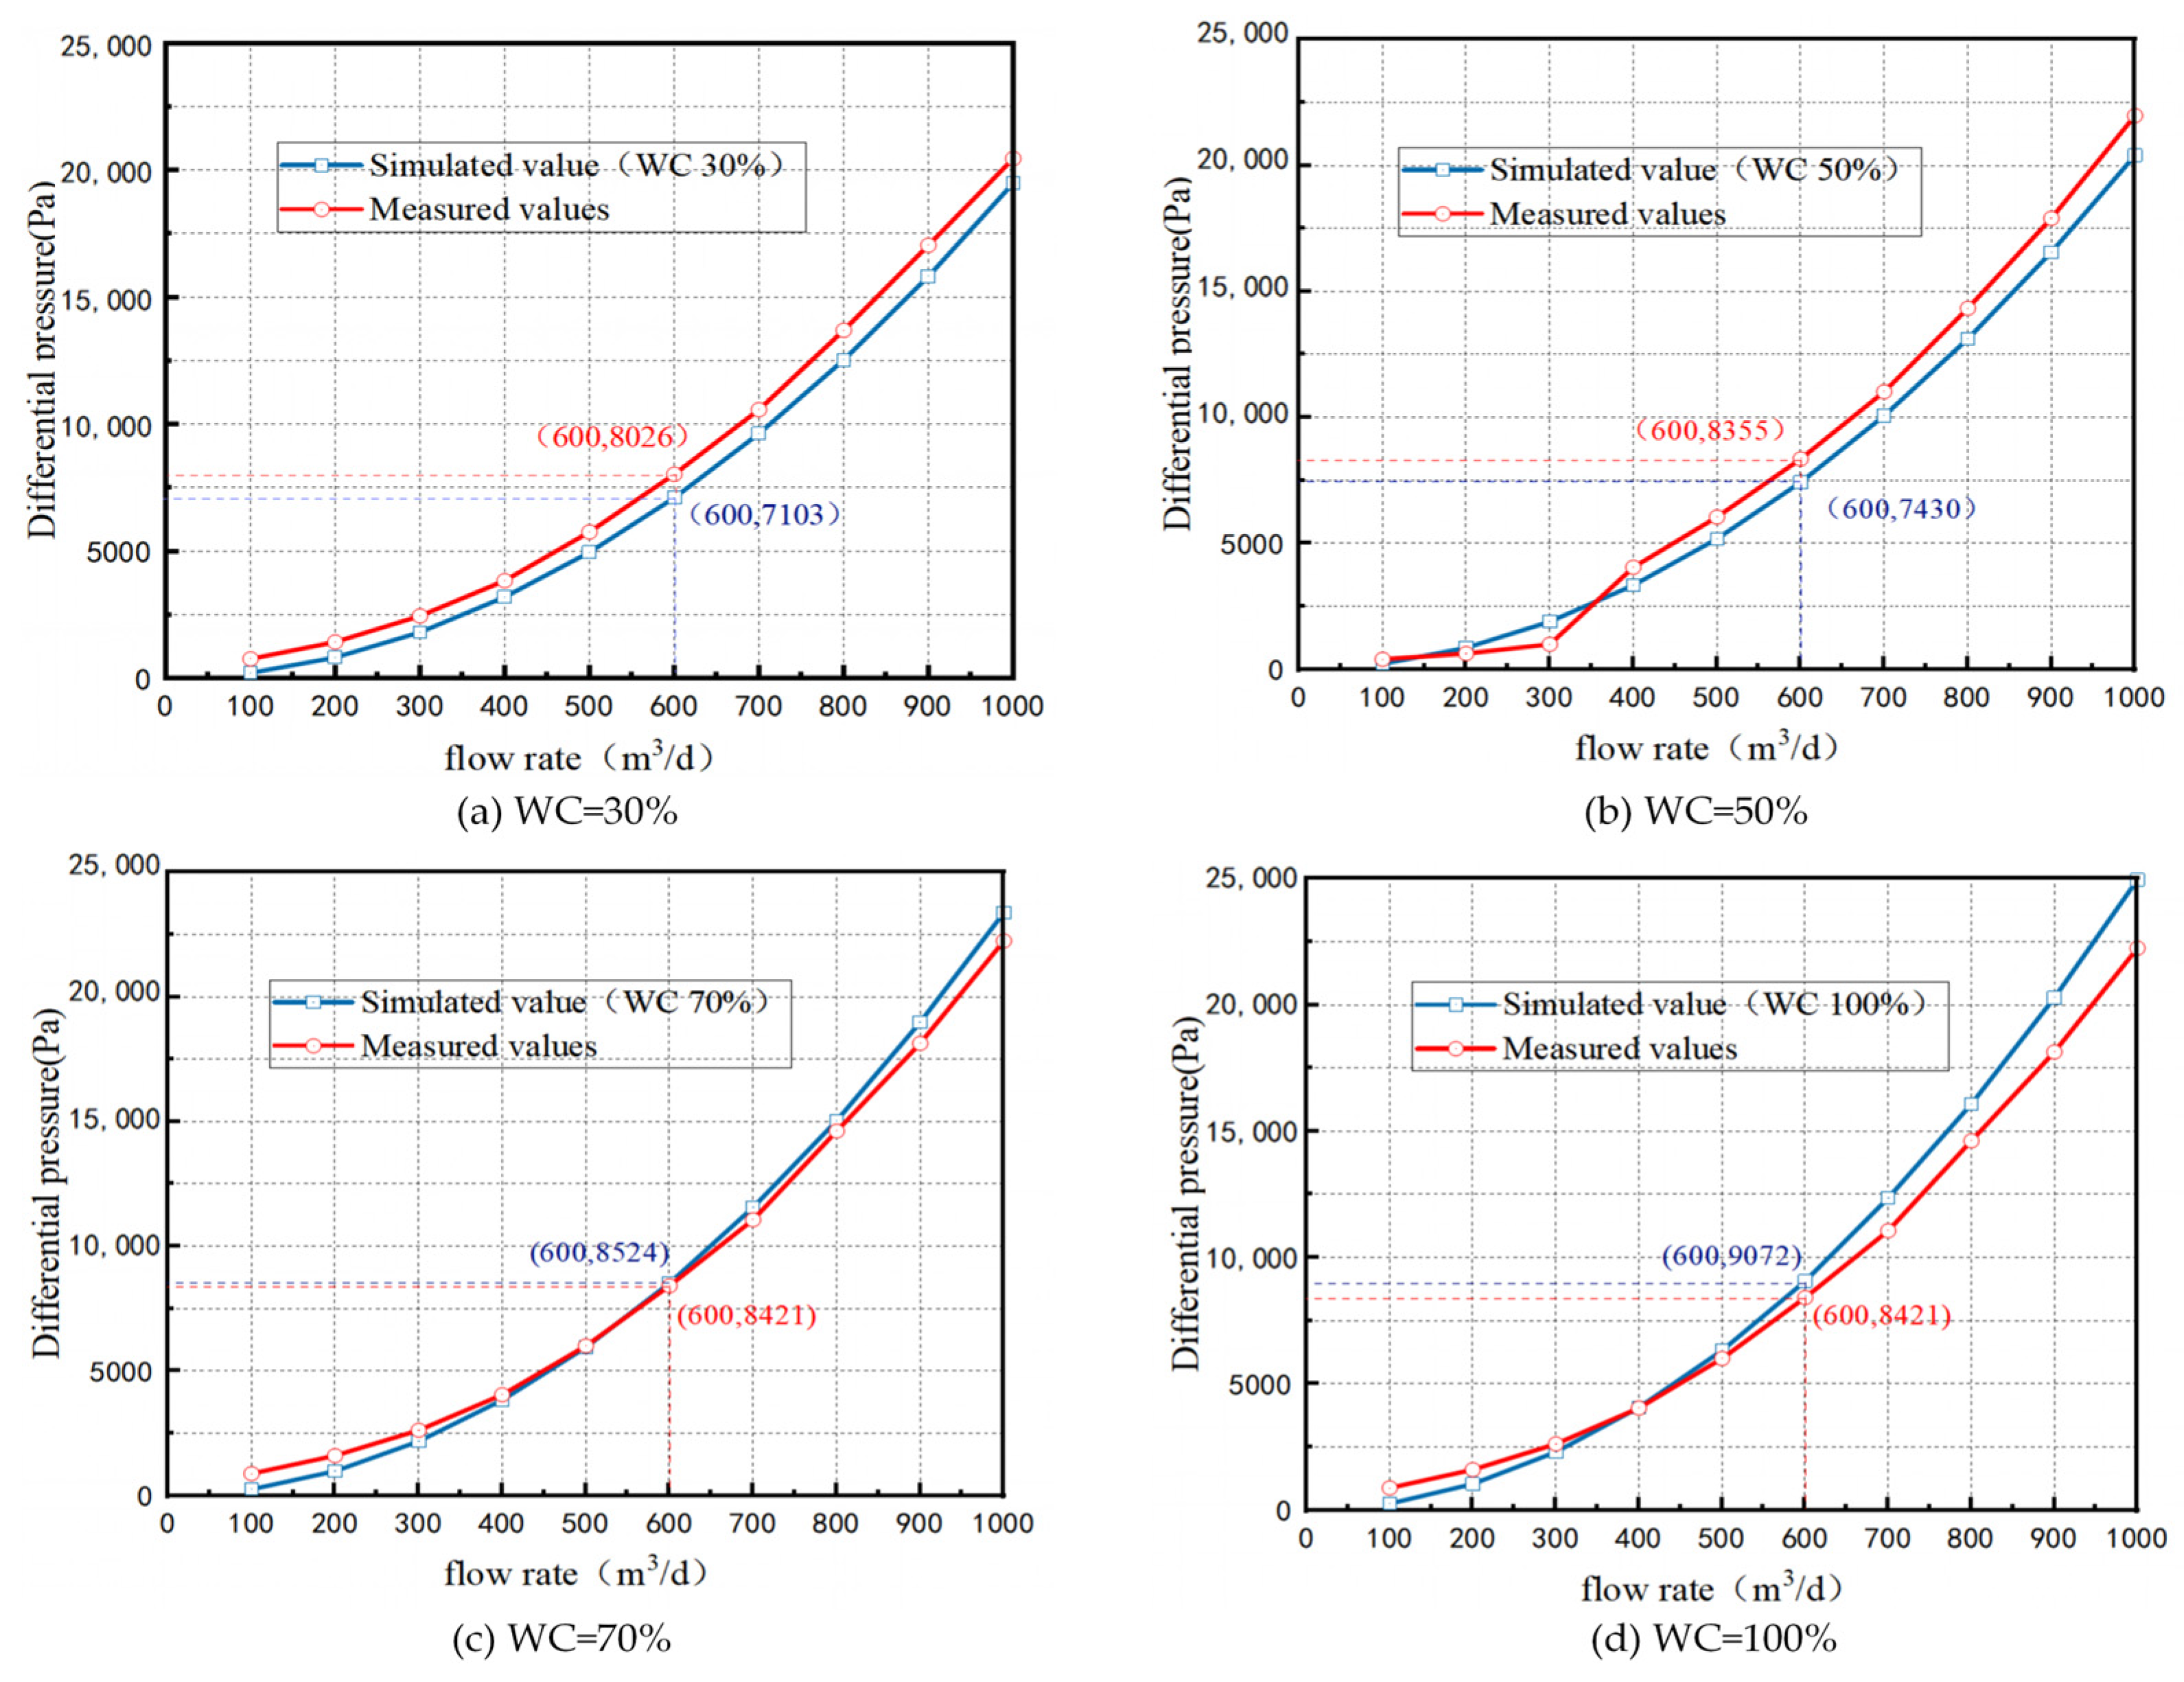
3.2.5. Comparative Analysis of Pressure Difference between Simulation and Room Test under the Same Working Condition

Under the conditions of normal temperature and pressure, different water content, the results of numerical simulation and experimental test results are compared in terms of differential pressure and integrated flow coefficients and other aspects of the comparative analysis; the two verify each other to check whether the flow monitoring design meets the requirements, the results of the experiment are shown in Figure 13. The comparison results show that under the conditions of normal temperature and pressure and different water content (0–100%), the numerical simulation test results are basically the same as the experimental test results. Both test results show that the flow rate and differential pressure are proportional to the flow rate; when the flow rate is certain, the higher the water content, the greater the differential pressure, in line with the law of the Venturi flow monitoring, indicating that the reverse-Venturi flowmeter structure design to meet the requirements.

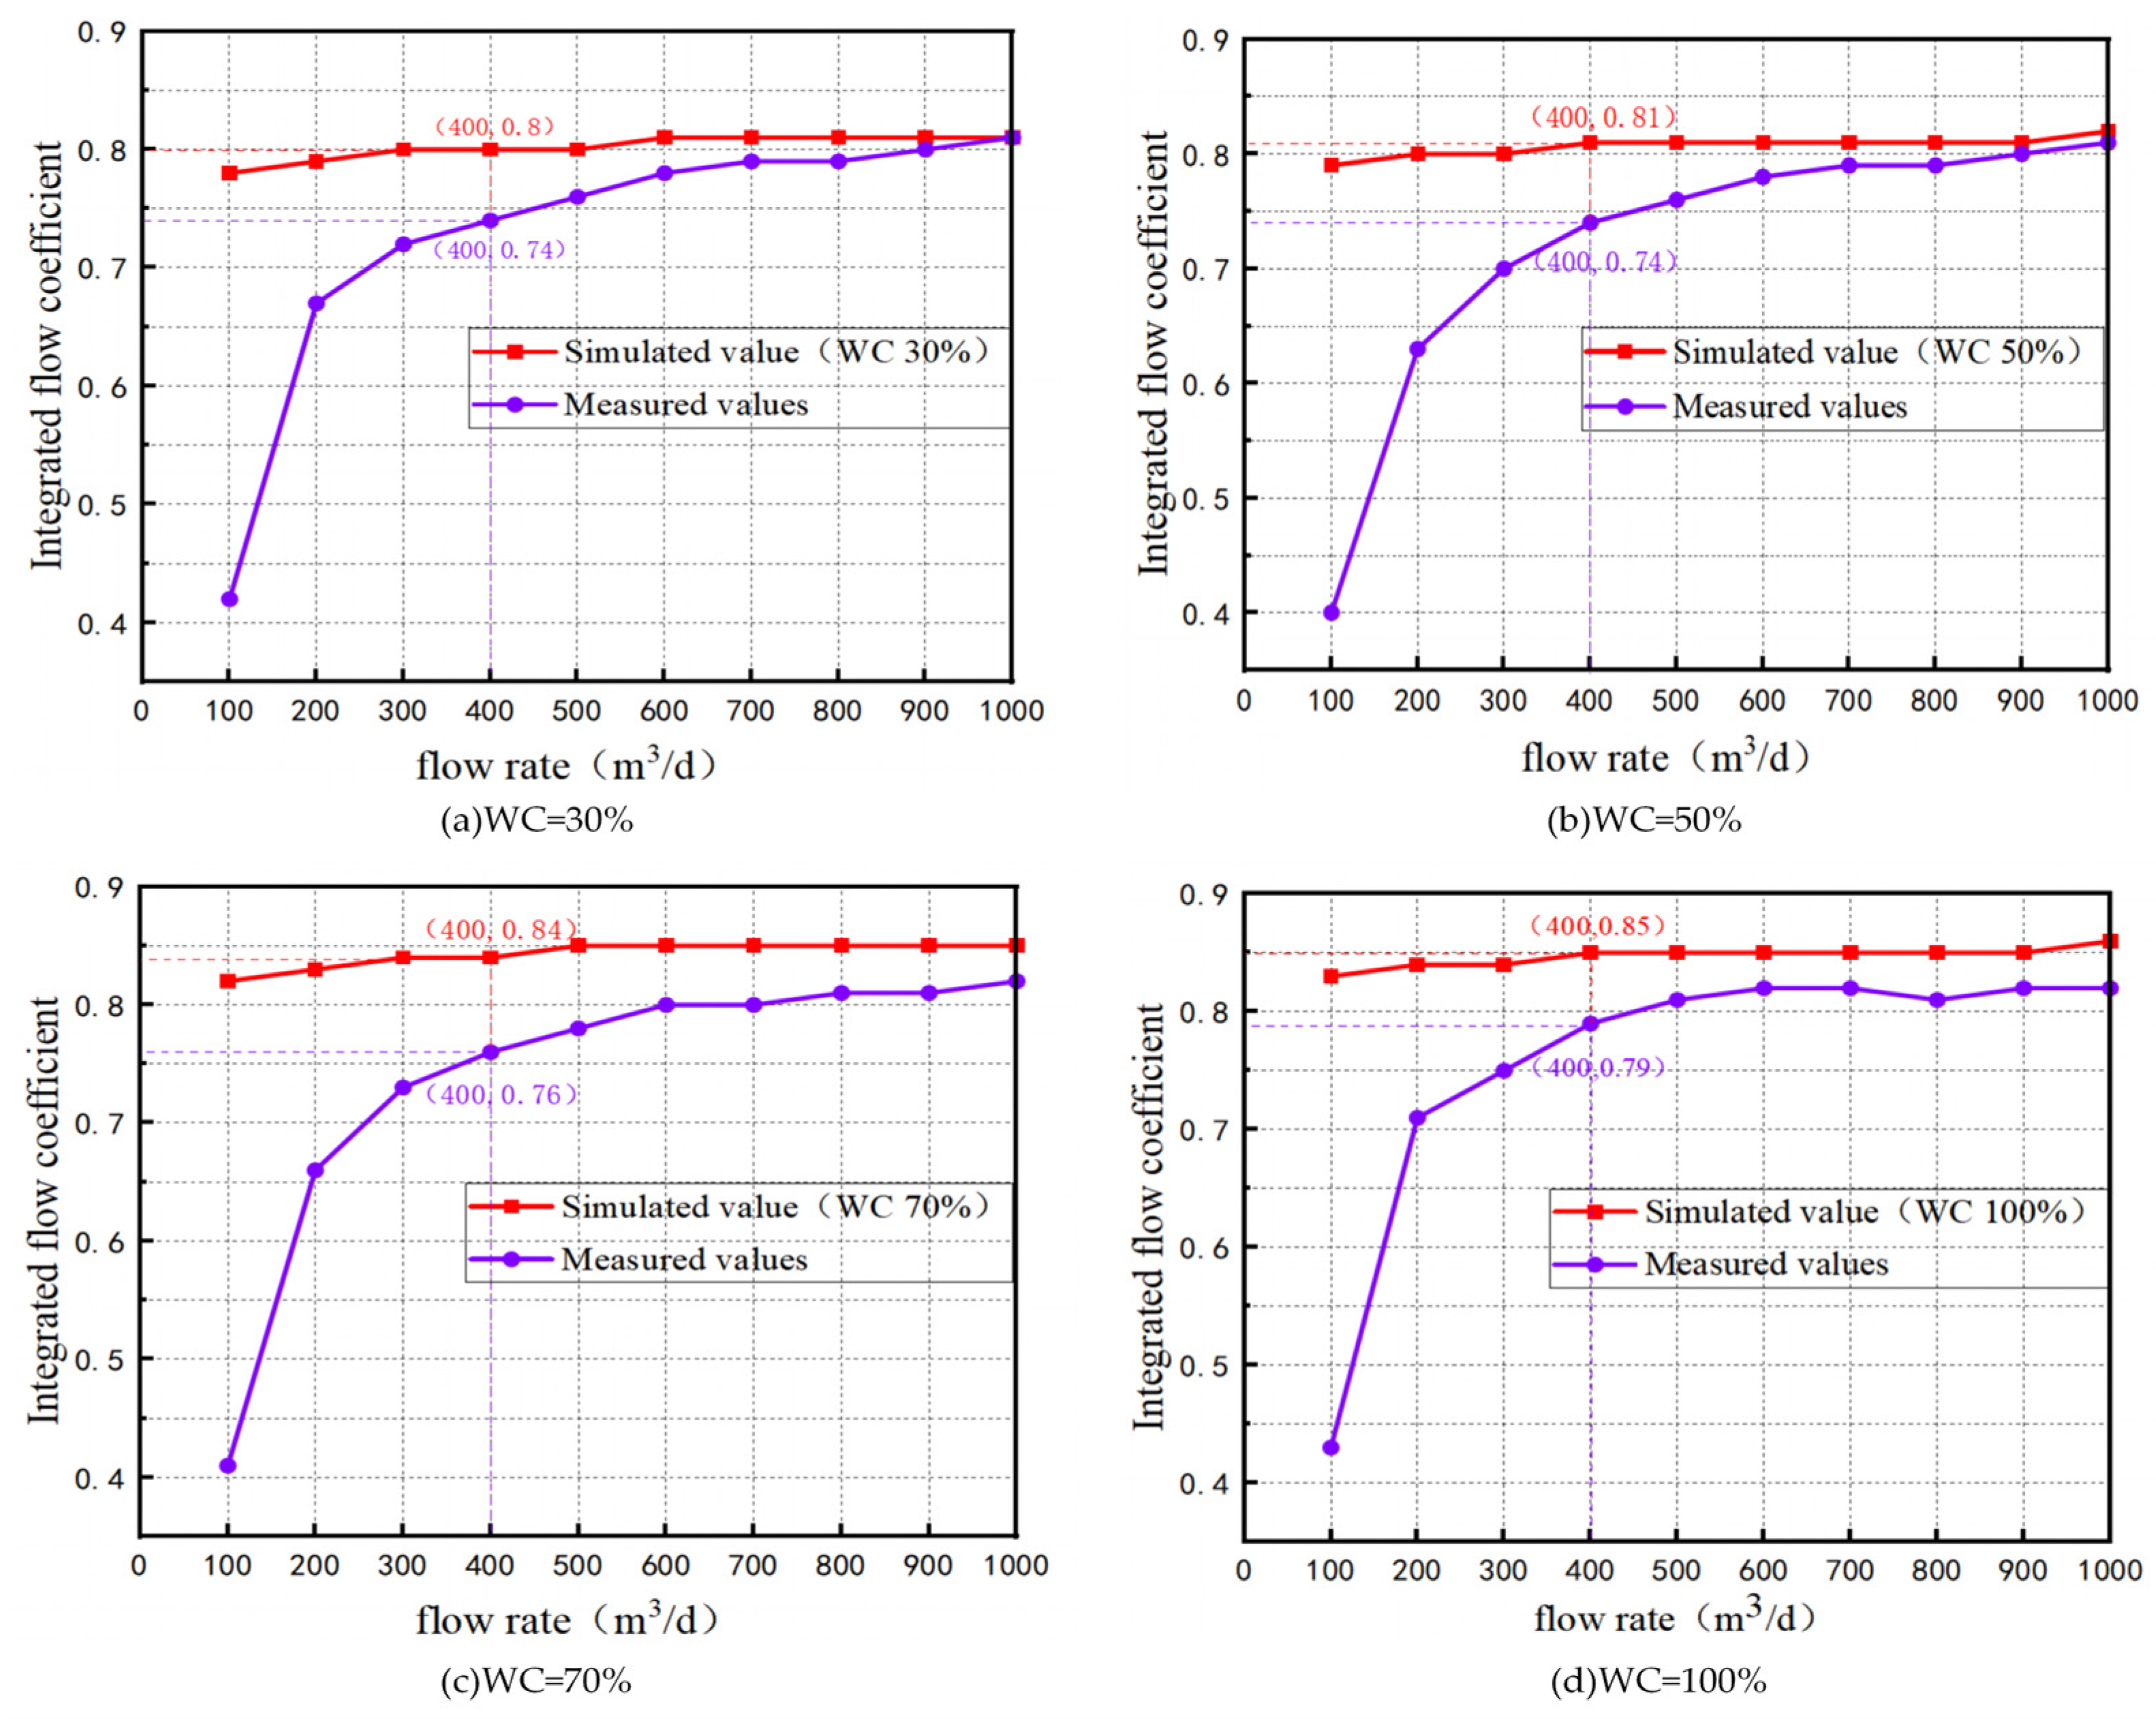
3.2.6. Comparative Analysis of Integrated Flow Coefficients between Simulation and Indoor Testing under the Same Operating Conditions

A comparison of numerical simulation and experimental results in terms of integrated flow coefficient shows that under different water content, the integrated flow coefficient of the inverted Venturi shows a slight increase with the increase in flow rate. When the flow rate is 100–200 m3/d, the deviation between the experimental value and the numerical simulation value of the integrated flow coefficient is large; when the flow rate is 200–400 m3/d, the deviation between the experimental value and the numerical simulation value of the integrated flow coefficient decreases, and the range of error is more than 15%. The reason for the error of more than 15% at small displacements is consistent with the flow monitoring; when the flow rate is low, the fluid in the experimental setup is not enough to meet the operation of the whole experimental setup, for which a secondary experiment with small displacements will be carried out subsequently. When the flow rate is 400–1000 m3/d, the simulation value is stable between 0.80–0.86, the experimental value is stable between 0.75–0.86, and the experimental value is stable between 0.75–0.86. Between the flow rate of 400–1000 m3/d, the simulated value is stable between 0.75–0.815, the numerical simulation and experimental results fit well, and the error range is within 10%, which verifies the stability of its structural design. Figure 14 shows the comparison results.

4. Conclusions

(1)
The basic structure of the reverse-turi was designed, and the reverse-Venturi monitoring bin was analysed for mechanical and mechanical properties. The simulation results showed that the maximum stress was 841 MPa, the maximum radial displacement of the seal contact surface was 0.072 mm, and the strength and deformation met the design requirements.
(2)
An oil–water mixed fluid simulation was carried out. The simulation results show that the pressure drop curves of the inverted Venturi under four working conditions with different water contents tend to be consistent. The flow rate is proportional to the differential pressure; when the flow rate is certain, the higher the water content, the higher the differential pressure; when the water content is certain, the higher the flow rate, the higher the differential pressure, which is in line with the law of fluid flow in the Venturi.
(3)
Indoor experimental testing of reverse-Venturi fluid flow was carried out. It was analysed that the flow rate in the range of 500–1000 m3/d was measured with high accuracy, the error range was between ±5% and ±10%, and the maximum/minimum flow rate ratio of the flow measurement range in the experimental test was 2.5, which meets the design requirements. Simulation results and experimental test results are basically consistent; when the flow rate is 400–1000 m3/d, the error range is within 10%, and the structure is reliable.
(4)
An intelligent well-completion multi-parameter monitoring system can monitor the pressure, temperature, flow rate and other key parameters of oil and gas wells in real time to achieve real-time monitoring and control of the completion process. In this paper, by integrating multiple sensors in the mechanical structure design and through the prototype for experimental verification, it can monitor and collect the key parameters. Still, due to the complex mechanical structure and high processing difficulty, we will continue to improve the structure and carry out field experiments to verify its performance. With the increasing difficulty of global oil and gas field development, the intelligent well-completion multi-parameter monitoring system will play a more important role in future oil and gas field development.

Author Contributions

Conceptualisation, G.B. and X.P.; Methodology, G.B., J.W. (Jinlong Wang), and X.P.; Software, S.F., J.W. (Jinlong Wang), and P.Y.; Investigation, M.W.; Writing—original draft, S.F.; Writing—review and editing, S.F. and J.W. (Jiemin Wu); Supervision, G.B. and Y.G. All authors have read and agreed to the published version of the manuscript.

Funding

The project is supported by the Foundation of Natural Science Foundation of Shaanxi Province, Grant/Award nos. 2023-JC-YB-361, the Postgraduate Innovation and Practice Ability Development Fund of Xi’an Shiyou University (YCS23113038), and the National Natural Science Foundation (Number 52104033).

Data Availability Statement

The data presented in this study are available on request from the corresponding author. The data are not publicly available due to ongoing proprietary research and analysis, which requires the preservation of data integrity and confidentiality for further in-depth studies.

Conflicts of Interest

Author Jinlong Wang was employed by the China Oilfield Services Limited. Author Jiemin Wu was employed by the Natural Gas Research Institute of Shaanxi Yanchang Petroleum. Author Min Wang was employed by the PetroChina Tarim Oilfield Company. Author Yongfeng Gong was employed by the Department of Drilling and Production Engineering. The remaining authors declare that the research was conducted in the absence of any commercial or financial relationships that could be construed as a potential conflict of interest. The company had no role in the design of the study; in the collection, analyses, or interpretation of data; in the writing of the manuscript, or in the decision to publish the results.

References

  1. Li, G.; Song, X.; Zhu, Z.; Tian, S.; Sheng, M. Research progress and prospect of intelligent well completion technology. J. Oil Drill. Technol. 2023, 51, 35–47. [Google Scholar]
  2. Cayeux, E. Mathematical Modelling of the Drilling Process for Real-Time Applications in Drilling Simulation Interpretation and Assistance; University of Stavanger: Stavanger, Norway, 2019. [Google Scholar]
  3. Afuekwe, A.; Bello, K. Use of Smart Controls in Intelligent Well Completion to Optimize Oil & Gas Recovery. J. Eng. Res. Rep. 2019, 5, 1–14. [Google Scholar]
  4. Xu, X. Analysis of the Development Status and Prospects of Intelligent Well Completion Technology. Chem. Eng. Equip. 2020, 2, 89–90. [Google Scholar]
  5. Al-Kadem, M.; Gomaa, M.; Al Yateem, K.; Al Maghlouth, A. Multiphase Flow Meter Health Monitoring Strategy: Maximizing the Value of Real-Time Sensors and Automation for Industrial Revolution 4.0. In Proceedings of the SPE Annual Technical Conference and Exhibition, Dubai, United Arab Emirates, 21–23 September 2021. [Google Scholar]
  6. Malakooti, R.; Ayop, Z.A.; Maulianda, B.; Muradov, K.; Davies, D. Integrated production optimisation and monitoring of multi-zone intelligent wells. J. Pet. Explor. Prod. Technol. 2020, 10, 159–170. [Google Scholar] [CrossRef]
  7. Schaefer, C.D.B.; Sampaio, A.M. Efficient workflow for optimizing intelligent well completion using production parameters in real-time. Oil Gas Sci. Technol.-Rev. D’IFP Energ. Nouv. 2020, 75, 69. [Google Scholar] [CrossRef]
  8. Garcia, E.; Kevin, R. Advanced Reservoir Control Systems Paving the Way for Digital Offshore Operations and Analysis. In Proceedings of the SPE Canadian Energy Technology Conference, Calgary, AB, Canada, 16–17 March 2022. [Google Scholar]
  9. Jia, D.; Pei, X.; Zhu, Z.; Zhu, S.; Liu, C.; Guo, T. Study on the Application of Whole Process Monitoring and Control Technology for Separated Layer Water Injection to Block. In Proceedings of the SPE/IATMI Asia Pacific Oil & Gas Conference and Exhibition, Jakarta, Indonesia, 17–19 October 2017. [Google Scholar]
  10. Gonzalez, L.E.; Chokshi, R.N.; Lane, W. Importance of Downhole Measurements, Visualization and Analysis in Producing Unconventional Wells. In Proceedings of the SPE Unconventional Resources Technology Conference, San Antonio, TX, USA, 20–22 July 2015. [Google Scholar]
  11. Kamal, B.; Abbasi, Z.; Hassanzadeh, H. Water-Cut Measurement Techniques in Oil Production and Processing-A Review. Energies 2023, 16, 6410. [Google Scholar] [CrossRef]
  12. Meng, Z.; Huang, Z.; Wang, B.; Ji, H.; Li, H.; Yan, Y. Air–water two-phase flow measurement using a Venturi meter and an electrical resistance tomography sensor. Flow Meas. Instrum. 2010, 21, 268–276. [Google Scholar] [CrossRef]
  13. Perumal, K.; Krishnan, J. A CFD study of the effect of venturi geometry on high pressure wet gas metering. Int. J. Oil Gas Coal Technol. 2013, 6, 549–566. [Google Scholar] [CrossRef]
  14. Xue, C. Development and Performance Study of Integrated Underwater Venturi Two Phase Wet Gas Flowmeter; Beijing University of Chemical Technology: Beijing, China, 2018. [Google Scholar]
  15. Zhan, M.; Xie, C.G.; Shu, J.J. Microwave probe sensing location for Venturi-based real-time multiphase flowmeter. J. Pet. Sci. Eng. 2022, 218, 111027. [Google Scholar] [CrossRef]
  16. Saeed, A.; Noui-Mehidi, M.N.; Black, M.J.; Abbad, M.; Shafiq, M. A Full Scale Two-Phase Flow Loop Test of Downhole Permanent Multiphase Flow Meter. In Proceedings of the SPE Middle East Oil & Gas Show and Conference, Manama, Bahrain, 8–11 March 2015. [Google Scholar]
  17. Danilko, A.; Senkov, A.; Andreev, A. Virtual Flowmetering for Intelligent Wells. In Proceedings of the SPE Russian Petroleum Technology Conference, Moscow, Russia, 22–24 October 2019. [Google Scholar]
  18. Feng, G.; Yin, Y.; Ma, L.; Zhang, L.; Wang, W. Development and Application of Intelligent Well Technology in Offshore Oilfield. J. Southwest Pet. Univ. (Nat. Sci. Ed.) 2022, 44, 153–164. [Google Scholar]
  19. Shi, H.; Ruban, A.; Timoshchenko, S.; Nikrityuk, P. Numerical Investigation of the Behavior of an Oil-Water Mixture in a Venturi Tube. Energy Fuels 2020, 34, 15061–15067. [Google Scholar] [CrossRef]
  20. Golenkin, M.Y.E.; Bulygin, I.A.; Shapovalov, A.P.; Zavyalov, A.A.; Zhirkina, A.A.; Pico, Y.L.; Knyazev, I.V. Digital Production Optimization Boost for North Caspian Field with 3-Phase Real-Time Downhole Flow Metering System from Enhanced Intelligent Completion. In Proceedings of the SPE Russian Petroleum Technology Conference, Virtual, 26–29 October 2020. [Google Scholar]
  21. Meribout, M.; Azzi, A.; Ghendour, N.; Kharoua, N.; Khezzar, L.; AlHosani, E. Multiphase Flow Meters Targeting Oil Gas Industries. Measurement 2020, 165, 108111. [Google Scholar] [CrossRef]
  22. Deng, R.; Hu, K.; Liang, D.; Hu, T. Simulation and Analysis on Dual Venturi Tube based on CFD. Technol. Ind. 2021, 21, 183–188. [Google Scholar]
  23. Liu, X.; Lao, L.; Falcone, G. A comprehensive assessment of correlations for two-phase flow through Venturi tubes. J. Nat. Gas Sci. Eng. 2020, 78, 103323. [Google Scholar] [CrossRef]
  24. Goh, K.F.G.; Gottumukkala, V.; Dyer, S.; Basak, D.; Taor, C.; Musayev, R. Digital Well Completion Solution to Complement Extreme Reservoir Contact Drilling. In Proceedings of the International Petroleum Technology Conference, Dhahran, Saudi Arabia, 13–15 January 2020. [Google Scholar]
  25. Wang, Q. Numerical Simulation of Oil-Water Two-Phase Flow in Venturi Flowmeter; Xi’an University of Petroleum: Xi’an, China, 2022. [Google Scholar]
  26. Ahn, S.; Lee, K.; Choe, J.; Jeong, D. Numerical approach on production optimization of high water-cut well via advanced completion management using flow control valves. J. Pet. Explor. Prod. Technol. 2023, 13, 1611–1625. [Google Scholar] [CrossRef]
  27. Asthana, P.; Jacob, S.; Bouldin, B.; Larbi Zeghlache, M.; Almulhim, M. Downhole Flow Control Technologies: From Simple Starts to Wireless Smarts. In Proceedings of the SPE/IATMI Asia Pacific Oil & Gas Conference and Exhibition, Jakarta, Indonesia, 10–12 October 2023. [Google Scholar]
  28. Xue, D.; Zhang, F.; Wang, L.; Yang, W.; Zhang, X.; Chao, S. Study on Hydraulic Control Intelligent Oil Recovery Technology in Offshore Oil Field. J. Pet. Mach. 2020, 48, 56–61. [Google Scholar]
  29. Chen, W.; Li, J.; Li, Y.; Zhang, M.; Peng, L. Conductance Sensor with Self-Calibration and Venturi Tube Based Flowrate Measurement for Gas-Water Slug Flow. IEEE Trans. Instrum. Meas. 2022, 71, 7503414. [Google Scholar] [CrossRef]
  30. Muradov, K.; Davies, D.; Durham, C.; Waterhouse, R. Transient Pressure and Temperature Interpretation in Intelligent Wells of the Golden Eagle Field. In Proceedings of the SPE Europec featured at 79th EAGE Conference and Exhibition, Paris, France, 12–15 June 2017. [Google Scholar]
  31. Wrasse, A.D.N.; Bertoldi, D.; Dos Santos, E.N.; Morales, R.E.; Da Silva, M.J. Gas-Liquid Flow Rate Measurement Using a Twin-Plane Capacitive Sensor and a Venturi Meter. IEEE Access 2019, 7, 135933–135941. [Google Scholar] [CrossRef]
  32. Muradov, K.; Sefat, M.H.; Dowlatabad, M.M. Fast optimization of packer locations in wells with flow control completions. J. Pet. Sci. Eng. 2021, 205, 108933. [Google Scholar] [CrossRef]
  33. Lecardonnel, A.; De Servi, C.; Colonna, P.; Laboureur, D. Two-phase flow metering of maldistribution inside a header by means of venturi flowmeter solely. Multiph. Sci. Technol. 2024, 36, 97–114. [Google Scholar] [CrossRef]
  34. Liu, F.; Hu, X.; Liang, Z.; Liu, Q. Numerical simulation of steady flow performance of Venturi tube based on FLUENT. J. Syst. Simul. 2019, 31, 1460–1468. [Google Scholar]
  35. Zhan, M.; Bin Razali, M.A.; Moitra, A.; Xie, C.G.; Loh, W.L.; Shu, J.J. Influence of design parameters of upstream Venturi pipeline on multiphase flow measurement. Eng. Appl. Comput. Fluid Mech. 2023, 17, 2182831. [Google Scholar] [CrossRef]
  36. Tang, Z.; Huang, F.; Yao, Z.; Cai, Z.; Ma, X.; Li, Z.; Gao, Z. Optimization of Flow and Mixing in a Venturi Tube Mixer with a Two-Step Method Using Numerical Simulation. Processes 2023, 11, 1083. [Google Scholar] [CrossRef]
Figure 1. Schematic diagram of the reverse-Venturi tube structure.
Processes 12 01597 g001
Figure 2. Mechanical structure of a multi-parameter real-time monitoring system.
Processes 12 01597 g002
Figure 3. Single-load stress field and displacement nephogram of monitoring bin.
Processes 12 01597 g003
Figure 4. Combined-load stress field and displacement nephogram of monitoring bin.
Processes 12 01597 g004
Figure 5. Sensor testing process for pressure, temperature, and water content.
Processes 12 01597 g005
Figure 6. Structure and mesh division used for fluid simulation analysis of reverse-Venturi tubes.
Processes 12 01597 g006
Figure 7. Simulation analysis results of fluid flow under different working conditions and water contents.
Processes 12 01597 g007
Figure 8. The relationship between flow rate and pressure difference under different operating conditions.
Processes 12 01597 g008
Figure 9. The relationship between flow rate and comprehensive flow coefficient under different operating conditions.
Processes 12 01597 g009
Figure 10. Reverse-Venturi tube flow gauge structure.
Processes 12 01597 g010
Figure 11. Reverse-Venturi flow monitoring indoor experiments.
Processes 12 01597 g011
Figure 12. Flow measurement and errors at ambient temperature and pressure.
Processes 12 01597 g012
Figure 13. Comparison of numerical simulation and room experiment differential pressure results.
Processes 12 01597 g013
Figure 14. Comparison of numerical simulation and indoor experimental combined flow coefficient results.
Processes 12 01597 g014
Table 1. The Venturi tube flow gauge utilisation downhole.
Oil Tube3–1/24–1/25–1/27
Liquid flow rate (With a high precision) m3/d1590–79501908–95403180–11,1307950–15,105
Liquid flow rate (With a medium precision) m3/d318–1590795–19082385–31803975–7950
Gas flow rate (With a high precision) m3/d113–368226–679269–933340–1981
Gas flow rate (With a medium precision) m3/d28.3–49556.6–69085–933170–340
Maximum outer diameter: mm154191210280
Inner diameter: mm7394112155
Flow measurement precision±2%–±5%
Table 2. Design parameters of Venturi tube.
TypeNominal Diameter
DN(mm)
Comhoubi
(β = d/D)
Angle of Contraction SegmentExtended Segment AngleMaterials
Precision cast shrinkage segment Venturi tube100–8000.3–0.7521 ± 1°7–15°Cast iron
Machined shrink-segment Venturi tubes50–3500.4–0.75Carbon steel, stainless steel
Rough welded iron plate shrinkage segment Venturi tube200–28000.4–0.7Carbon steel, stainless steel
Table 3. Material selection and boundary conditions.
NamesMaterialsBoundary Condition Simulation and Analysis
Real-time multi-parameter monitoring system for productionTop Connector42CrMo50 MPa, 125 °C, Stretch or compress 650 kN
Protective shell
Monitoring bin
Holistic multi-parameter real-time monitoring system for production/
Table 4. Reliability analysis results for water content, temperature, and pressure.
SensorsSetpointMeasured Value
Temperature sensor125 °C124.8 °C
125.1 °C
125.4 °C
Pressure sensors50 MPa51.98 MPa
51.32 MPa
49.95 MPa
Capacitive sensors (70 °C)WC 0%0%
WC 30%32%
WC 50%51%
WC 70%67%
WC 100%98%
Table 5. Comparison of pressure difference under different grid quantities.
NumberNumber of GridsPressure Difference/Pa
176225152.900
212,6485172.580
325,1915157.520
451,3365142.140
5181,0405142.060
6438,6065141.990
Table 6. Numerical simulation scheme for flow monitoring of the reverse-Venturi tube.
Water Cuts100 m3/d–1000 m3/d
0%1234
30%1234
50%1234
70%1234
100%1234
Note: Numeric values 1, 2, 3 and 4 represent the ambient temperature and atmospheric pressure, the ambient temperature and high pressure, as well as the high temperature and atmospheric pressure, respectively.
Disclaimer/Publisher’s Note: The statements, opinions and data contained in all publications are solely those of the individual author(s) and contributor(s) and not of MDPI and/or the editor(s). MDPI and/or the editor(s) disclaim responsibility for any injury to people or property resulting from any ideas, methods, instructions or products referred to in the content.

