Article

Pine Nutshells and Their Biochars as Sources of Chemicals, Fuels, Activated Carbons, and Electrode Materials

1
Centro de Estudos Florestais, Laboratório Associado TERRA, Instituto Superior de Agronomia, Universidade de Lisboa, Tapada da Ajuda, 1349-017 Lisbon, Portugal
2
Center of Physics and Engineering of Advanced Materials, Laboratory for Physics of Materials and Emerging Technologies, Chemical Engineering Department, Instituto Superior Técnico, Universidade de Lisboa, 1049-001 Lisbon, Portugal
3
Centro de Investigação de Montanha (CIMO), Instituto Politécnico de Bragança, Campus de Santa Apolónia, 5300-253 Bragança, Portugal
4
Laboratório Associado para a Sustentabilidade e Tecnologia em Regiões de Montanha (SusTEC), Instituto Politécnico de Bragança, Campus de Santa Apolónia, 5300-253 Bragança, Portugal
5
MEtRICs, Mechanical Engineering and Resource Sustainability Center, Department of Sciences and Technology of Biomass, Faculty of Sciences and Technology, NOVA University of Lisbon, 2829-516 Caparica, Portugal
6
VALORIZA, Research Center for Endogenous Resource Valorization, Polytechnic Institute of Portalegre, 7300-555 Portalegre, Portugal
*
Authors to whom correspondence should be addressed.
Processes 2024, 12(8), 1603; https://doi.org/10.3390/pr12081603 (registering DOI)
Submission received: 14 June 2024 / Revised: 14 July 2024 / Accepted: 27 July 2024 / Published: 31 July 2024
(This article belongs to the Special Issue Platform Chemicals and Novel Materials from Biomass)

Abstract

:
Pine nutshells (PNSs) are lignocellulosic waste materials with limited use in domestic heating. However, a biorefinery approach may be applied to fractionate PNSs and produce chemicals, materials, and improved solid fuels. In this study, we fractionated PNSs and produced antioxidant extracts, lignins, polysaccharides, chars, and activated carbons and analyzed their potential applications. Pyrolytic kinetic modeling as an alternative method to chemical fractionation was also tested. The results showed that the PNS contains low amounts of extracts with weak thiobarbituric acid reactive substances (TBARS) antioxidant properties, while its lignin content is remarkable (50.5%). Pyrolytic kinetic modeling was comparable to wet chemical analysis for estimating lignin yield. Moderate-temperature pyrolysis of the PNS resulted in a 23% char yield. The PNS chars showed improved fuel characteristics, retained 36% water, and leached 151 mg/L potassium into the water. The steam activation of PNS biochars at 750 °C resulted in oxygen-enriched activated carbons with specific surface areas up to 467 m2/g. The overall results indicate promising biochar applications of the PNS for soil amendment and supercapacitor uses.

1. Introduction

Pine nutshells (PNSs) are waste lignocellulosic materials generated as a byproduct in the industrial production of edible pine nuts of several pine tree species such as Pinus pinea L., Pinus koraiensis Siebold & Zucc., Pinus sibirica (Ledeb.) Turcz., Pinus edulis Engelm., Pinus cembra L., etc. The global production of pine nut kernels was 41,680 metric tons in 2022/2023, according to the International Nut and Dried Fruit Council Foundation (INC) data. By using a ratio of pine nutshells to pine nut kernels of three, it was estimated that approximately 120,000 tons of PNSs could be produced globally each year as a byproduct and used predominantly as a solid fuel on a domestic scale [1]. In fact, PNSs have been shown to be one of the most promising biomass fuels, with their promising calorific value [1]. The valorization of this waste in a biorefinery system is important to create economic gains in the chain and to reduce the CO2 emissions originating from their direct combustion, which can be estimated as approximately 200,000 tons of CO2 emissions per year using a conversion factor of 1.65. The valorization of PNSs in a biorefinery process will largely reduce these emissions if added-value applications are introduced to the biorefinery products. The prevalent pine nut species in the Mediterranean region is stone pine (Pinus pinea L.) and biorefinery studies may be conducted to explore its valorization.
The chemical composition of a stone pine nutshell (PNS) is dominated by lignin, which makes up approximately 50% of the shell weight, followed by an almost equal content of polysaccharides (slightly over 43 wt.%), as well as a small content of extractives (approximately 5 wt.%), inorganic material (2 wt.%), and cutin (<1 wt.%) [1]. The chemical composition of the PNS is thus different from that of wood by its higher lignin and lower polysaccharide contents [2] and of barks and agricultural wastes by its low ash and extractive contents [3]. The extractive content of the PNS, albeit low, is dominated by hydrophilic components, which make up approximately 80% of the total extractives [1]. The hydrophilic extractives of the PNS showed antioxidant activity determined by chemical in vitro 2,2-diphenyl-1-picrylhydrazyl (DPPH) and ferric-reducing antioxidant power (FRAP) antioxidant assays [1]. Another important chemical feature of the PNS is the significant amount of nitrogen (1%) and potassium as its major ash component [1]. This specific composition associated with a high lignin (carbon) content suggests that the PNS is a stable material with a high nutrient content, suitable for soil applications, and a conductive solid material for producing electrode materials [4].
PNSs are also suitable lignocellulosic raw materials for producing biochar. Biochars are charcoals produced by pyrolysis or the incomplete combustion of organic material, resulting in carbon-enriched and porous solid materials [3,5]. Thus, biochars may be considered functional or platform materials because they have a reasonable market size and economic value. Therefore, they have a comparative advantage over specialty chemicals in terms of their market size and over commodity chemicals in terms of their market value [5]. An example of platform materials is levoglucosan, produced via the pyrolysis of cellulose and converted to value-added products such as hydroxymethylfurfural and styrene [6]. Biochars are usually used as adsorbent materials or activated to produce highly porous activated carbons, which can be used as adsorbents or electrode materials [7,8].
In a previous study, we suggested a total of 13 different applications, including extracts, solid fuels, and polyurethanes, for the valorization of waste stone pine PNSs [1]. Polar extractives and macromolecular chemical components of the PNS, such as lignins and polysaccharides, are the key parameters for the valorization of the PNS because they indicate its feasibility of extraction and the thermochemical conversion of the PNS in a biorefinery. A high antioxidant activity is preferred for the extractives and a quick evaluation of lignin and polysaccharide contents is required for this thermochemical conversion since their contents play an important role in the resulting biochar and bio-oil yields. The current study continues exploring the valorization routes for waste PNSs with a focus on biochar production and activation. The overall objective is to achieve a circular economy by reducing and reusing waste PNS biomass by thermochemical conversion. The extraction route and the antioxidant properties of its hydroethanolic extracts were evaluated. Thermogravimetric analysis was applied to estimate its biomass composition by using pseudocomponent kinetic modeling as an alternative method to the time-consuming wet chemical analysis [9]. Activated carbons were produced from PNS biochars and characterized for their specific surface area, water retention, leaching properties, and capacitance, which are the key parameters in soil amendment and electrode material applications. The objective of this article is in line with UN’s Sustainable Development Goal 12 of responsible consumption and production, aiming to reduce waste production and promote a circular economy.

2. Materials and Methods

2.1. Materials

Stone pine (Pinus pinea L.) nutshell (PNS) samples were obtained from forests in Kozak, in the Aegean region of Turkey. The selection of the plant species was based on local availability in the Mediterranean region of Turkey, one of the most important pine nut producers in the world. The nuts’ shells were mechanically removed, granulated, and sieved into 40–60 mesh (250–420 μm) particle dimensions and kept at room temperature (25 °C).

2.2. Hydroethanolic Extraction and Antioxidant Activity

The PNS samples (~5 g) were stirred in 30 mL of an ethanol/water mixture (80:20 vol.) at 25 °C for 1 h and later filtered using a filter paper (Whatman No. 4). The residue was extracted with an additional 30 mL of the hydroethanolic mixture under the same conditions (80:20 vol. ethanol/water mixture at 25 °C). The combined extracts were concentrated using a Büchi R-210 rotary evaporator (BÜCHI Labortechnik AG, Flawil, Switzerland) at 40 °C and lyophilized with a FreeZone 4.5 system (Labconco, Kansas City, MO, USA).
The antioxidant activity of the hydroethanolic extracts of PNS samples were evaluated using a thiobarbituric acid reactive substances (TBARS) assay. The lyophilized hydroethanolic extracts were dissolved in water and diluted to solutions with concentrations ranging from 10 mg/mL to 0.3125 mg/mL. The inhibition of lipid peroxidation in porcine (Sus scrofa) brain cell homogenates was spectrophotometrically assessed by measuring the reduction in TBARS and the color intensity of malondialdehyde–thiobarbituric acid (MDA–TBA) using absorbance readings at 532 nm.
The lipid peroxidation inhibition ratio (%) was calculated using Equation (1):
I n h i b i t i o n % = A B A × 100
where A and B are the absorbance values of the control and extract samples, respectively. The results are expressed as EC50 values (µg/mL), indicating the extract concentration providing 50% antioxidant activity. Trolox (Sigma-Aldrich, St. Louis, MO, USA) was used as the positive control.

2.3. Chemical Fractionation

The mass yields of the PNS chemical components (extractive, lignin, holocellulose, and alpha cellulose) were determined on previously dried PNS samples (16 h at 60 °C followed by 100 °C for 2 h).
The extractive content was determined by three successive Soxhlet extractions according to TAPPI standards (T204 om-88 and T207 om-93) with dichloromethane (CH2Cl2–DCM), ethanol (C2H5OH–EtOH), and water (H2O) extractions during 6 h, 18 h, and 18 h, respectively. The Klason and acid-soluble lignin contents were determined according to TAPPI T 222 om-88 and TAPPI UM 250 standards on the previously extracted materials. For the determination of lignin content, a 3.0 mL H2SO4 (72%) was added to 0.35 g of the material, and the mixture was placed in a water bath at 30 °C for 1 h, then diluted to a concentration of 4% H2SO4, and hydrolyzed for 1 h at 120 °C [1] For the determination of the cellulose and hemicellulose contents, approximately 1.0 g of extractive-free material was treated with acidified sodium chlorite (NaClO2) at 70 °C for 6 h with 5 additions of 750 mg NaClO2 and 0.3 mL anhydrous acetic acid (C2H4O2) for delignification. The solution was filtered using 200 mL ultrapure (Milli-Q) water and 50 mL acetone into a glass filter crucible (G2), and the residue was dried and weighed. The cellulose content was determined by following the method: A 0.25 g delignified sample was treated with 17.5% and 8.3% NaOH solutions and washed with 10% acetic acid solution and ultrapure water at 20 °C. The residue from filtration on a previously weighed glass G3 crucible was dried at 60 °C overnight and 100 °C for 2 h and weighed. The alpha cellulose content was determined as a percentage of delignified material and of the initial mass of the sample. The detailed procedures for the wet chemical analysis can be consulted elsewhere [1]. All wet chemical assays were performed with four repetitions.

2.4. Thermogravimetric Analysis

Approximately 5 mg of PNS samples were analyzed with a thermogravimetric analyzer under a linear 10 °C/min heating rate and nitrogen and airflow conditions (approximately 50 mL/min). This experimental scheme was designed not only to study the thermal degradation of PNS under oxygen-free and oxidative conditions but also to estimate the yields of the PNS chemical components using pseudocomponent kinetic modeling. The detailed information on the pseudocomponent kinetic modeling can be consulted elsewhere [9].
Thermogravimetric mass loss curves were used to compute the proximate composition of the PNS biochars regarding their moisture, volatile, and ash contents. The fixed carbon content was calculated by mass difference. Proximately analyzed parameters of the PNS and PNS biochars were used to estimate the higher heating value of the PNS and PNS biochars by using the following correlation (Equation (2)):
H H V = 0.2144 × V M + 0.2599 × F C

2.5. Production of Biochars and Activated Carbons

PNS biochars were produced in an oven under oxygen-limited conditions at 600 °C during 1 h. After cooling in desiccators, the biochars were either ground and labeled as powdered biochars or kept in granular form and labeled as granular biochars. Both the powdered and granular biochars (PCs and GCs) were physically activated under steam for 15 min at 750 °C and labeled as powdered activated carbons (PACs) or granular activated carbons (GACs).

2.6. Scanning Electron Microscopy

The surfaces of the PNS biochars and of the activated carbons were observed with scanning electron microscopy (SEM) under an accelerating voltage of 20.0 kV. The samples were placed on an aluminum stub with double-sided carbon tape and sputter coated with a thin film of gold/palladium (Au/Pd) using a Quorum Technologies coater (model Q150T ES, Laughton, United Kingdom). They were then analyzed using a Hitachi scanning electron microscope (SEM, S2400) equipped with a silicon drift detector (SDD) for the energy-dispersive spectroscopy (EDS) of light elements. Digital image acquisition was conducted with Bruker’s Quantax Esprit 1.9 software.

2.7. Physical Nitrogen Adsorption

The physical nitrogen adsorption analysis of the PNS samples was performed in a Micromeritics porosimeter (ASAP 2010, Micromeritics GmbH, Unterschleißheim, Germany) at 77 K, after pretreatment at 150 °C for at least 12 h. The surface area of the activated PNS was determined using the BET model (Brunauer–Emmett–Teller).

2.8. Water Retention and Nutrient Leaching

The PNS biochars (approximately 1 g) were suspended in 10 mL of Milli-Q water and subjected to magnetic stirring for 4 h; after that period, the mixture was filtered through cellulose filter paper and left to drain interstitial water for 6 h. The filtered biochars were collected, and their water content was determined by drying at 105 °C for 12 h. The water retention capacity of the biochars was evaluated as the difference between their water content after and before the suspension in Milli-Q water.
The mineral composition of the water phase was evaluated using ICP-OES. The analysis was carried out on a Horiba Jobin Yvon ULTIMA sequential ICP, using the Horiba Jobin Yvon ICP Analyst 5.4 software. A monochromator with a Czerny Turner spectrometer was used. The used gas was argon.

2.9. Electrochemical Characterization

The materials were tested in a three-electrode system connected to a Squidstat Plus electrochemical workstation (Admiral Instruments, Tempe, AZ, USA). To prepare each working electrode, 5 mg of active material (if tested without adding conductive carbon) or 4 mg of active material and 1 mg of commercial activated carbon (Lurgi GmbH, Frankfurt, Germany) were added to 125 µL of 2% polyvinylidene fluoride (PVDF) in n-methyl pyrrolidone (NMP) and sonicated for 30 min. Afterward, 8.5 µL was drop cast onto a glassy carbon electrode and dried for 3 h at 50 °C. A platinum coil was used as a counter electrode, and a HANNA Instruments saturated calomel electrode (SCE, HI5412) was used as the reference electrode. A 6 M KOH aqueous solution was used as the electrolyte. Cyclic voltammetry (CV) tests were carried out in a potential window ranging from −0.35 V to 0.25 V at scan rates ranging from 5 to 100 mV s−1, and galvanostatic charge–discharge (GCD) curves were carried out in the same potential range, at 0.5 A g−1 and up to 10 A g−1 for one of the materials.
Based on these data, the capacitance of the biochar-based electrode materials was determined based on three different methods. The first method used Equation (3) to determine the electrodes’ capacitance [10,11]:
C a p a c i t a n c e = V c V a j   d V 2 ν V
where j represents the current density, Va and Vc the anodic and cathodic limiting potentials, ν the scan rate, and ΔV the potential window of the CV. Integrating the CV area allowed for the capacitance to be calculated for each tested scan rate.
The second method used for determining the capacitance required running multiple CVs at different scan rates and setting a potential within the CVs’ potential window where redox processes were not observed. Then, by plotting half the difference between the anodic and cathodic currents (Δj/2) at that fixed potential as a function of the scan rate, the capacitance was obtained as the slope [10,11]. Finally, Method 3 used Equation (4) to calculate the capacitance based on the GCD results [12,13,14,15,16]:
C a p a c i t a n c e = i t m V
where i represents the applied current, Δt represents the first discharge time, m represents the mass of active material, and ΔV the potential window of the GCD. All materials were tested at 0.5 A g−1.

3. Results and Discussion

3.1. Hydroethanolic Extraction and Cell-Based Antioxidant Activity

Extraction is usually applied as the first unit operation in cascaded lignocellulosic biorefineries since lignocellulosic materials often contain a significant amount of extractive material of lipophilic and hydrophilic natures [17]. For instance, certain barks have a notable extractive content [18]. Pinus pinea bark contains a significant quantity of hydrophilic extractives, particularly flavonoids such as taxifolin and catechin, along with phenolic acids [19]. However, the extractive content and composition vary among different lignocellulosic biomasses. The extractive content of pine nutshells is low (~5%) but dominated by polar compounds. This extractive composition suggests that polar PNS extracts could be used to produce natural antioxidants [1]. Mild extraction methods such as maceration are preferred for the extraction of thermally unstable antioxidants. Therefore, in our study, we applied hydroethanolic maceration to assess the antioxidant properties of the PNS.
Table 1 shows the PNS extract yield and its antioxidant properties. The results indicated that the maceration yield was smaller than the extraction yield obtained by long-term (36 h) and high-temperature (70 °C and 100 °C) Soxhlet methods with ethanol and water solvents (1.2% vs. 5.0%). Compared with the other pine biomass fractions, the PNS ones resulted in the lowest extract yield (Table 1).
The antioxidant activity, as determined by the TBARS method, was very weak compared to the Trolox control (Table 1). Interestingly, previous in vitro chemical antioxidant tests had shown promising antioxidant activity for pine nutshells [1]. This difference might be ascribed to the different antioxidant methods [20]. The structural composition of the phenolic PNS compounds may have also contributed to this weak antioxidant activity. For instance, it was shown that the sugar bonds of phenolics may weaken their bioactivity, as in the case of Fraxinus ornus bark [21]. These results imply that a comprehensive characterization of phenolic extracts is required to assess their antioxidant properties.
Table 1. Hydroethanolic extract yields and cell-based antioxidant properties of PNSs and comparison with other pine biomass components (cone, bark, and needles).
Pine Biomass ComponentExtract Yield (%)Source
Pine nutshell1.2This work
Pine nutshell5[1]
Pinecone7.0[22]
Pine bark18.8[23]
Pine needle10.9[24]
Antioxidant Activity
TBARS (EC50, μg/mL)1100 ± 500This work
Trolox reference (μg/mL)5.4 ± 0.3
From a biorefinery perspective, extraction should not be considered a primary target process for PNS as feedstock, considering the low extract yield and low TBARS antioxidant activity.

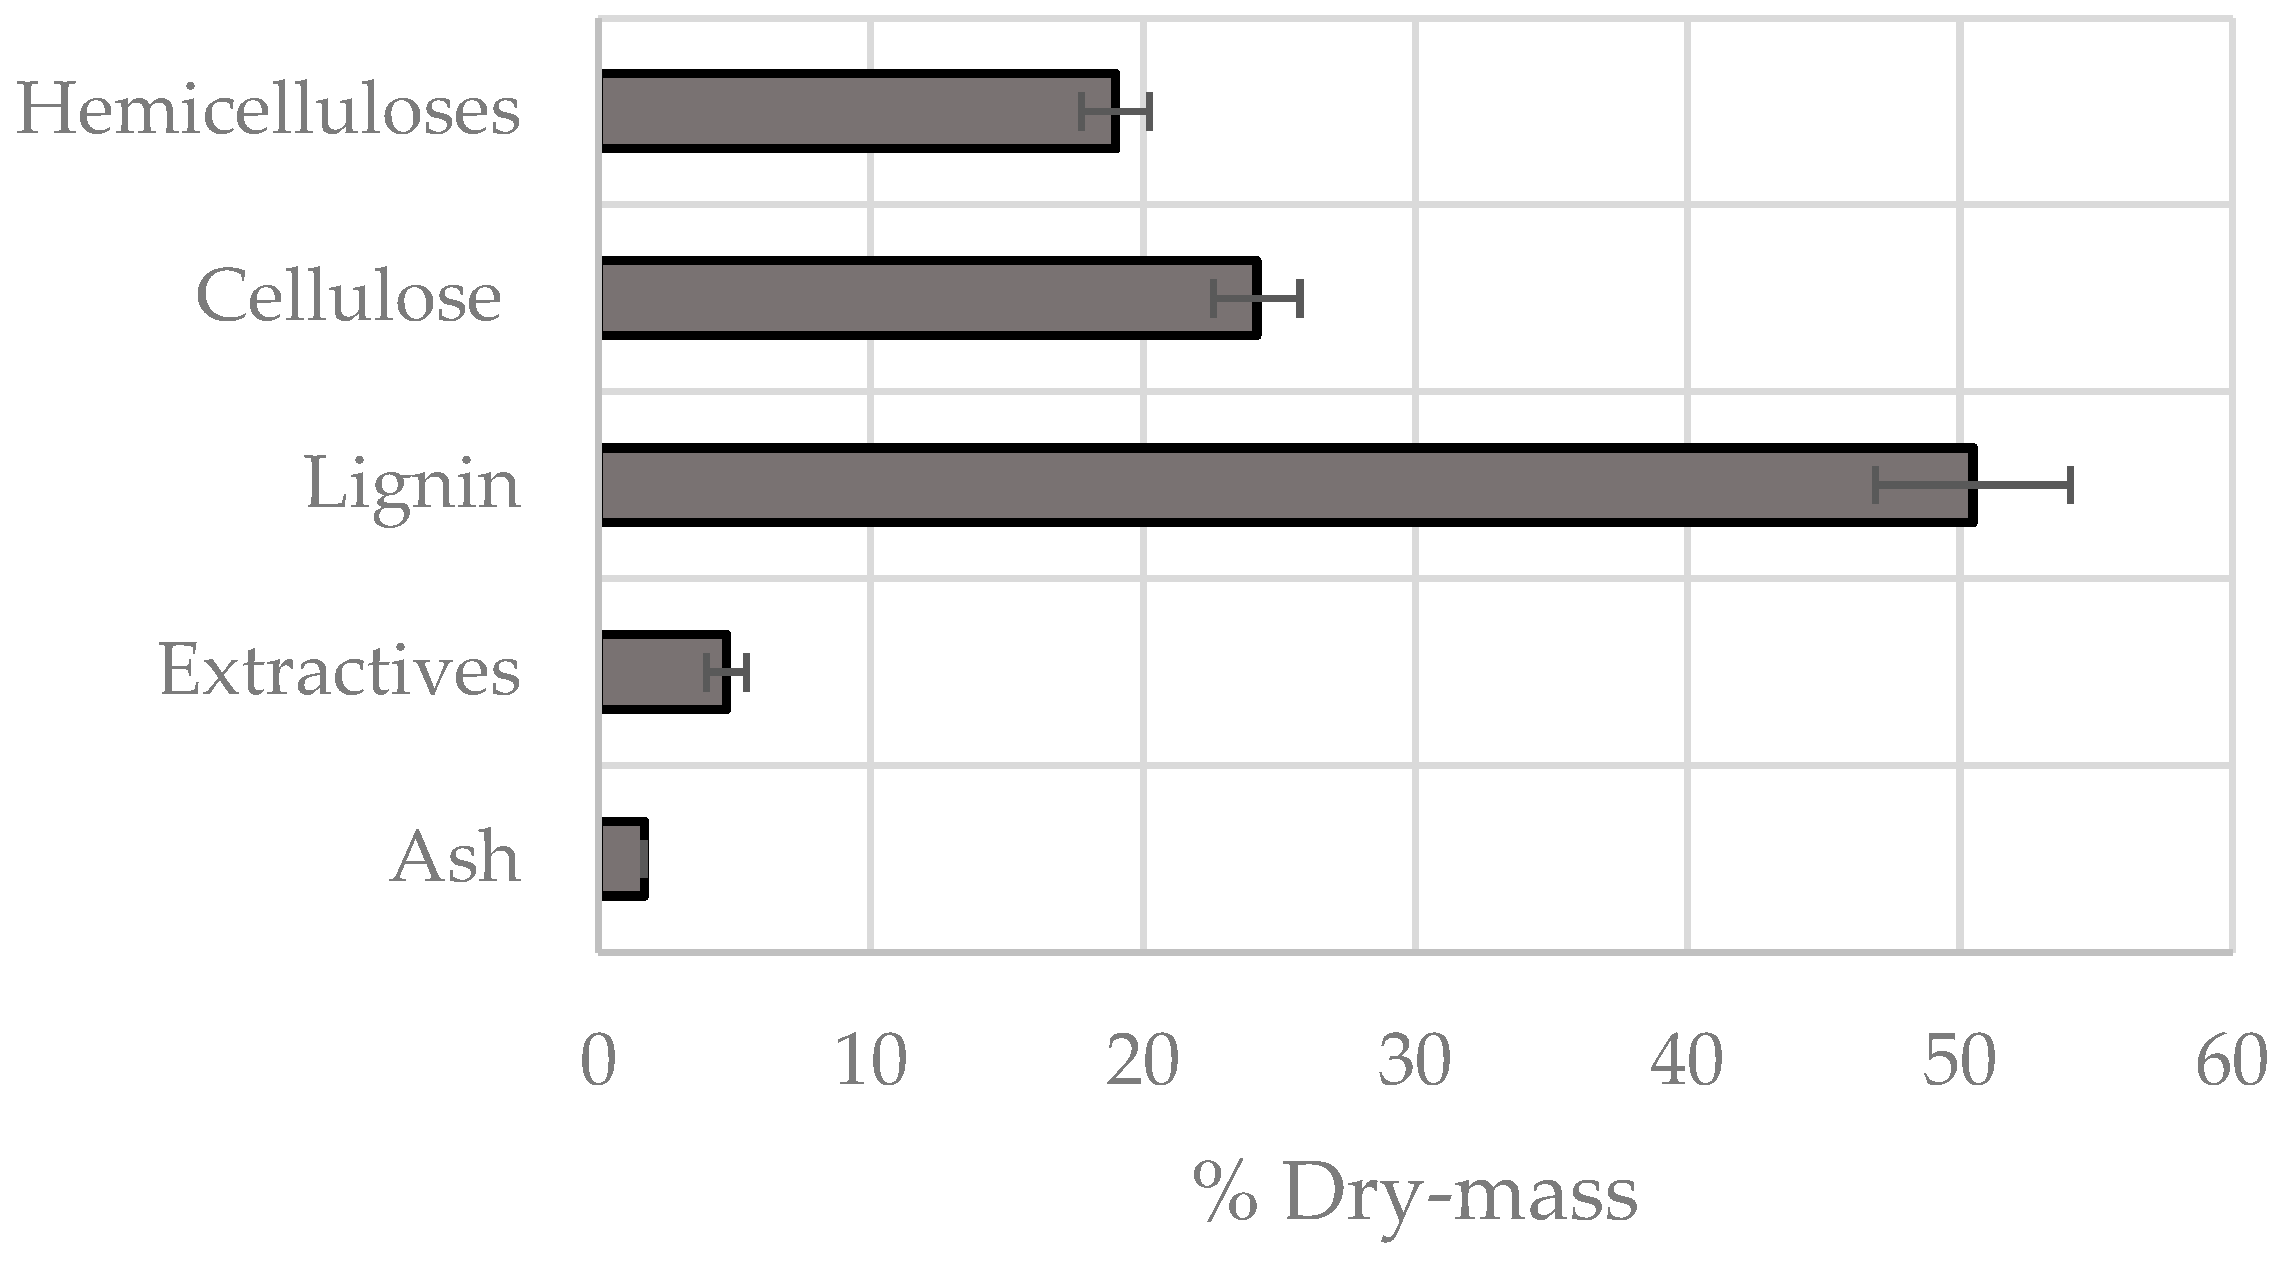
3.2. Chemical Fractionation

Lignocellulosic biomass is composed of organic and inorganic fractions. The organic fraction makes up the principal mass fraction and contains lignins and polysaccharides. The polysaccharide fraction has already been exploited to produce second-generation ethanol fuels, an attractive process for reducing waste and greenhouse gas emissions [25]. However, this process is costly, and the high lignin content of lignocellulosic biomass presents a major obstacle [25]. Second-generation ethanol production is a slower process than third-generation ethanol production (from algae) [26], while fourth-generation ethanol production (from thermochemical or CO2 capture from the atmosphere) is currently in the development phase. Other alternative avenues are being considered for the valorization of waste polysaccharides, such as the production of cellulose nanocrystals [27].
The valorization of lignin is the most challenging path of lignocellulosic valorization because of the difficulties encountered in its separation and purification. Recently, new catalysts have been developed to produce low-molecular-weight aromatics from lignin [28]. The production of C-dots is another approach to lignin valorization [29]. However, the most plausible large-scale valorization path for lignin seems to currently be the thermochemical path by gasification [30]. Lignin is widely available as a waste material in the black liquor of Kraft wood pulping, and several studies have been performed on the production of chemicals, materials, and energy from black liquor [30,31,32].
The chemical composition of the PNS was determined by wet chemical analysis and is shown in Figure 1 following well-standardized and selective methods [2,33,34]. The results show that lignin is the main chemical component of the PNS, followed by a slightly lower content of polysaccharides. Its cellulose content is higher than its hemicellulose content, and extractives and inorganic compounds (ash) are its minor compounds. The high lignin content of the PNS (corresponding to a high carbon content) favors the thermochemical conversion path, considering the increased calorific value of lignin and the lower cost of processing when compared with lignin separation and purification.

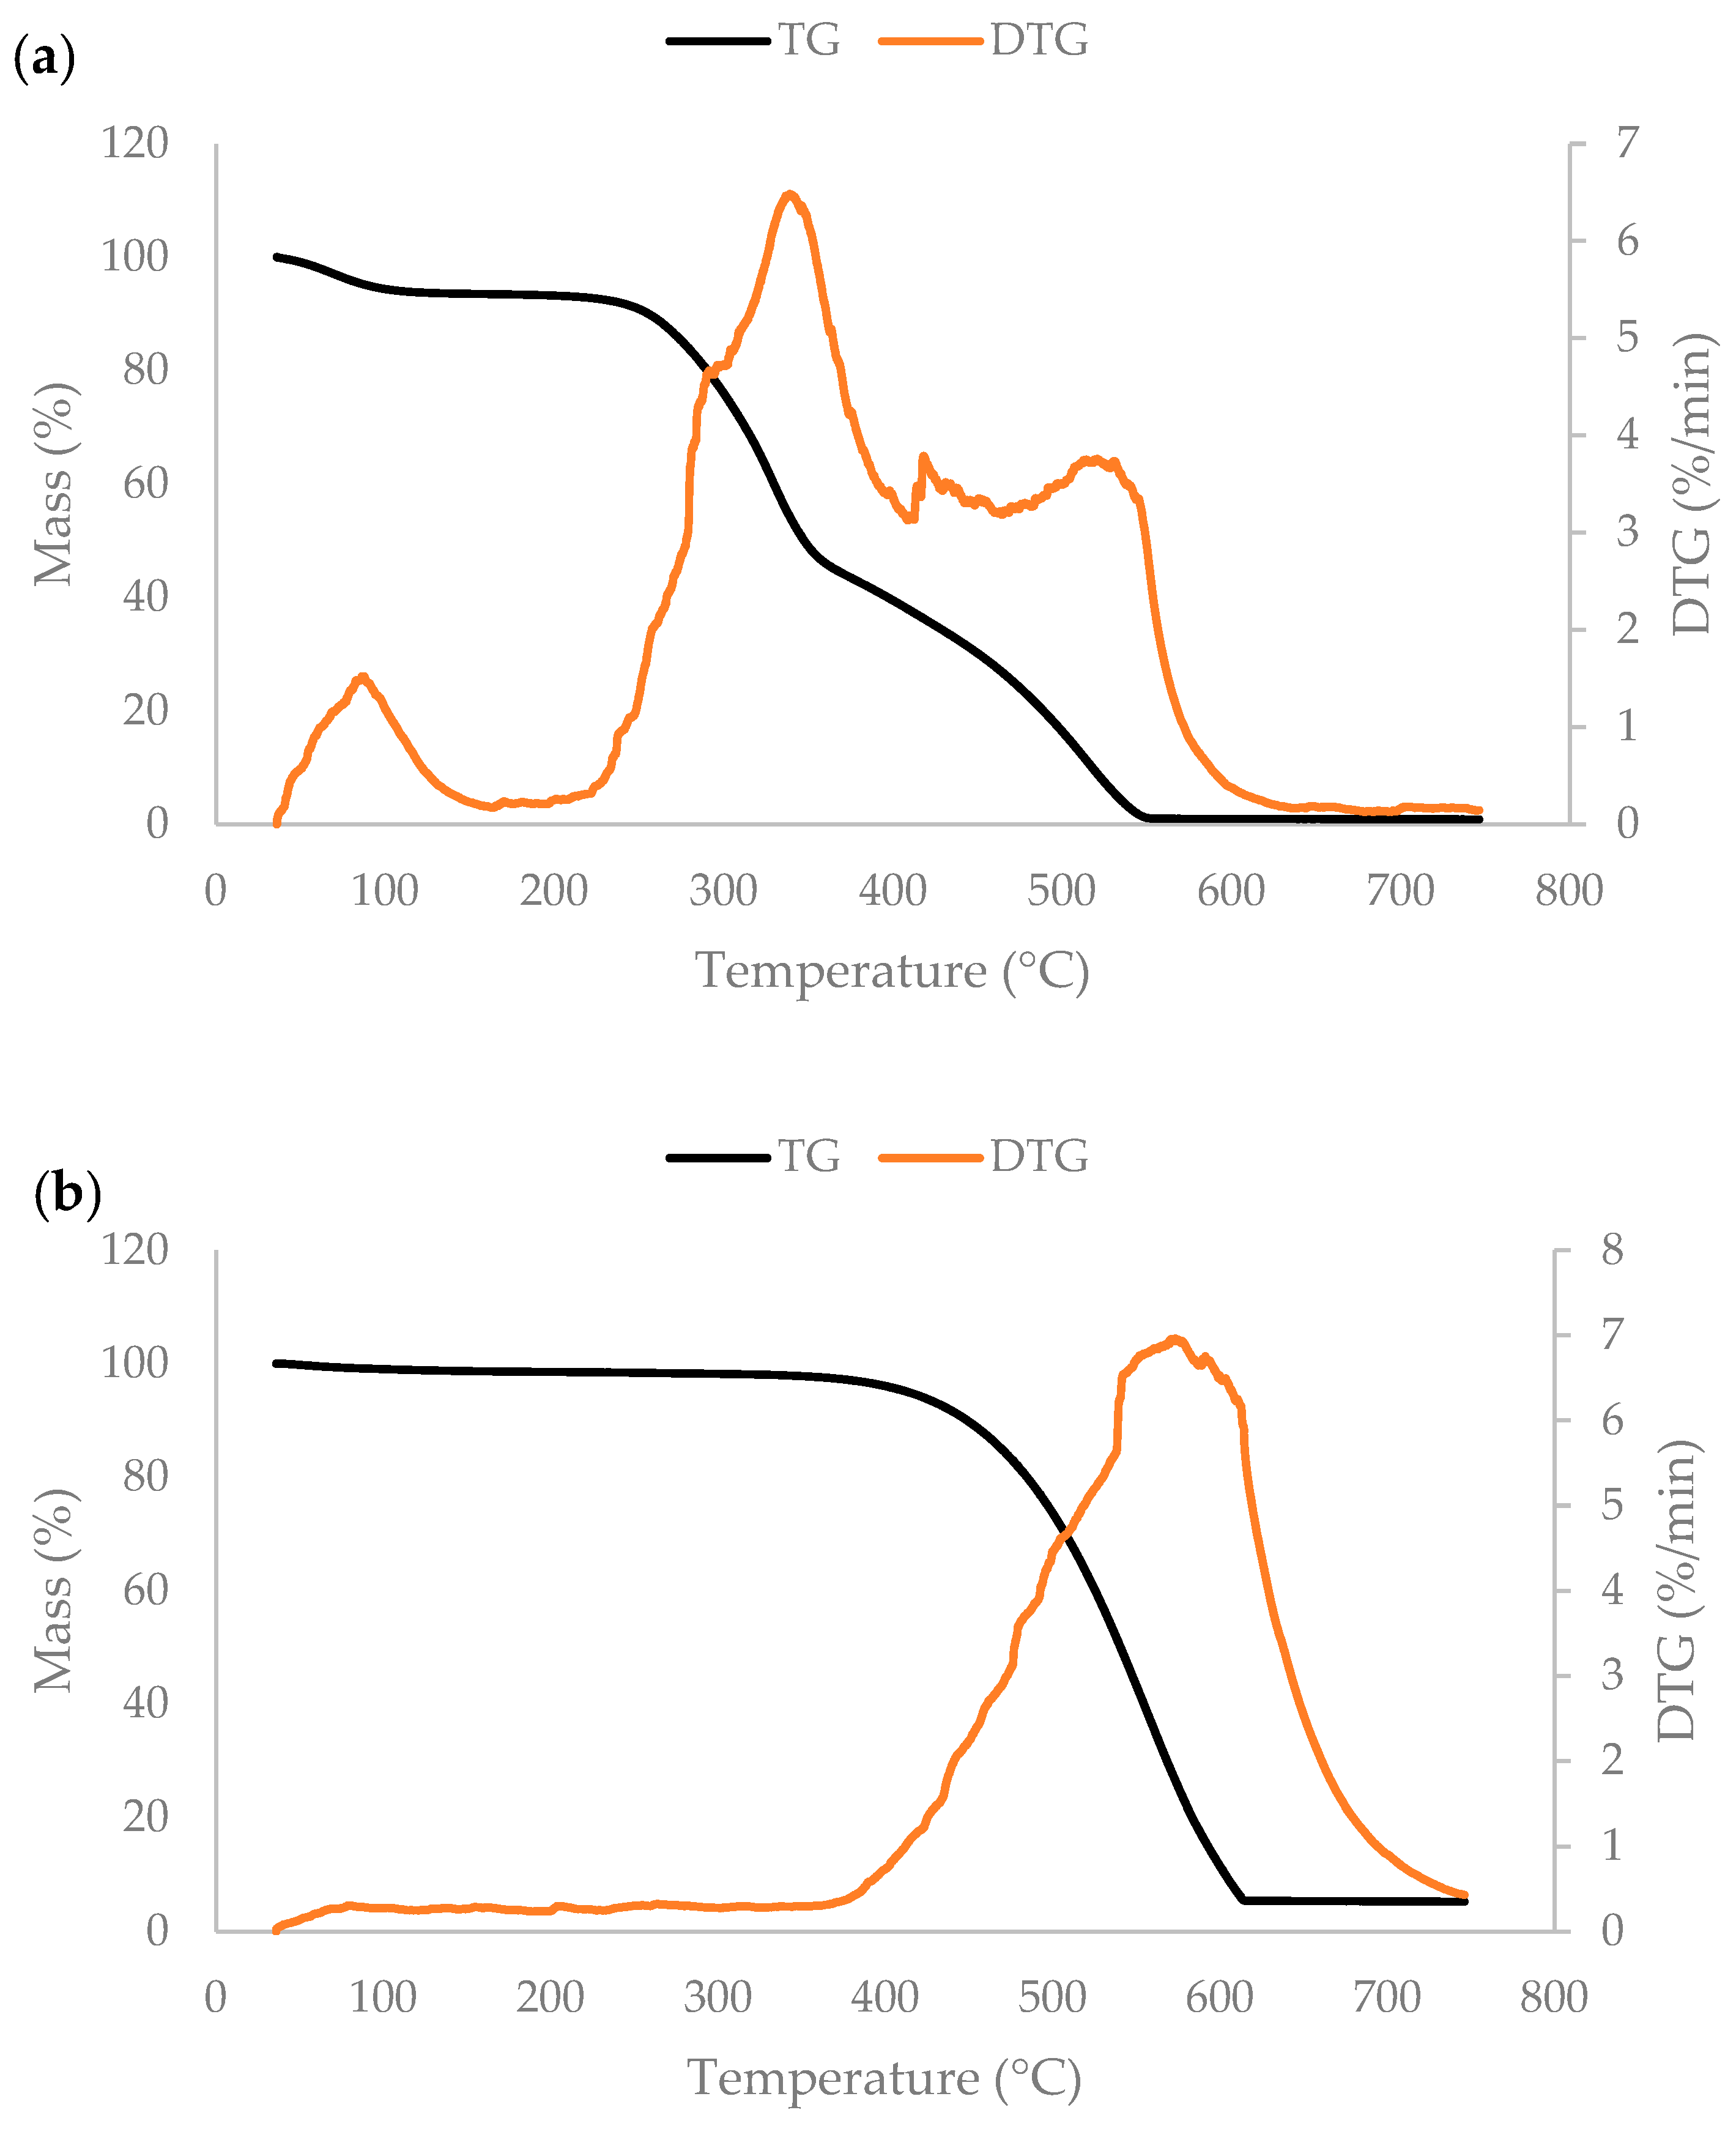
3.3. Thermogravimetric Analysis and Pseudocomponent Kinetic Modeling

Chemical fractionation of potential biomass feedstocks for biorefineries is a major analytical step because it allows the selection of the most feasible biorefinery products and evaluates their potential processing paths. However, a major problem of chemical fractionation is its long duration, with a few weeks being necessary for a complete analysis. Therefore, it would be useful to screen potentially important biomass for chemical fractionation with more rapid methods. Thermogravimetric and kinetic analyses have been suggested as alternative methods to estimating the chemical composition of lignocellulosic biomass since the biomass’ chemical components undergo an overlapping thermal degradation at different temperature ranges with different rates [9,35,36]. If the overall biomass’ thermal decomposition is assumed to be a first-order reaction comprising several parallel thermal reactions of the different biomass components with different activation energies, it is possible to compute the contribution of each component to the overall thermal degradation that is correlated to its relative mass. The application of thermogravimetry can reduce chemical characterization time to a few hours.
Figure 2 and Table 2 show the results of the kinetic approach to the thermal degradation of the PNS. The model fits the experimental data well and provides a good separation of the lumped biomass components. The activation energies of the biomass components are within the reported range of previous data and agree with the thermal degradation patterns of cellulose, lignin, hemicellulose, and extractive. This model also predicted a char yield of 22% after slow pyrolysis.
On the other hand, when both methods of wet chemical analysis and thermogravimetric analysis were compared, the thermogravimetric analysis was clearly not accurate, particularly for the cellulose/hemicellulose + extractive ratio (0.51 vs. 0.77) (Figure 3). The estimation of total lignin content was close (52% vs. 50%), which was also true for the overall polysaccharide content (48% vs. 51%). The present kinetic modeling results showed a better correlation for lignin content than for cellulose content, which had a better correlation in a previous study [36]. Therefore, it seems that thermogravimetric analysis only provides an approximate and not accurate chemical composition for pine nutshell biomass (Figure 3).
Nevertheless, the results obtained from both the chemical method and kinetic modeling show that pine nutshells are rich sources of lignin and polysaccharides and can be valorized targeting specialty applications such as in the production of C-dots, lignin nanoparticles, or carbon nanocrystals (CNCs) [27,29]. Kinetic estimation may be applied as an initial screening tool to evaluate the chemical compositions of different nutshells.

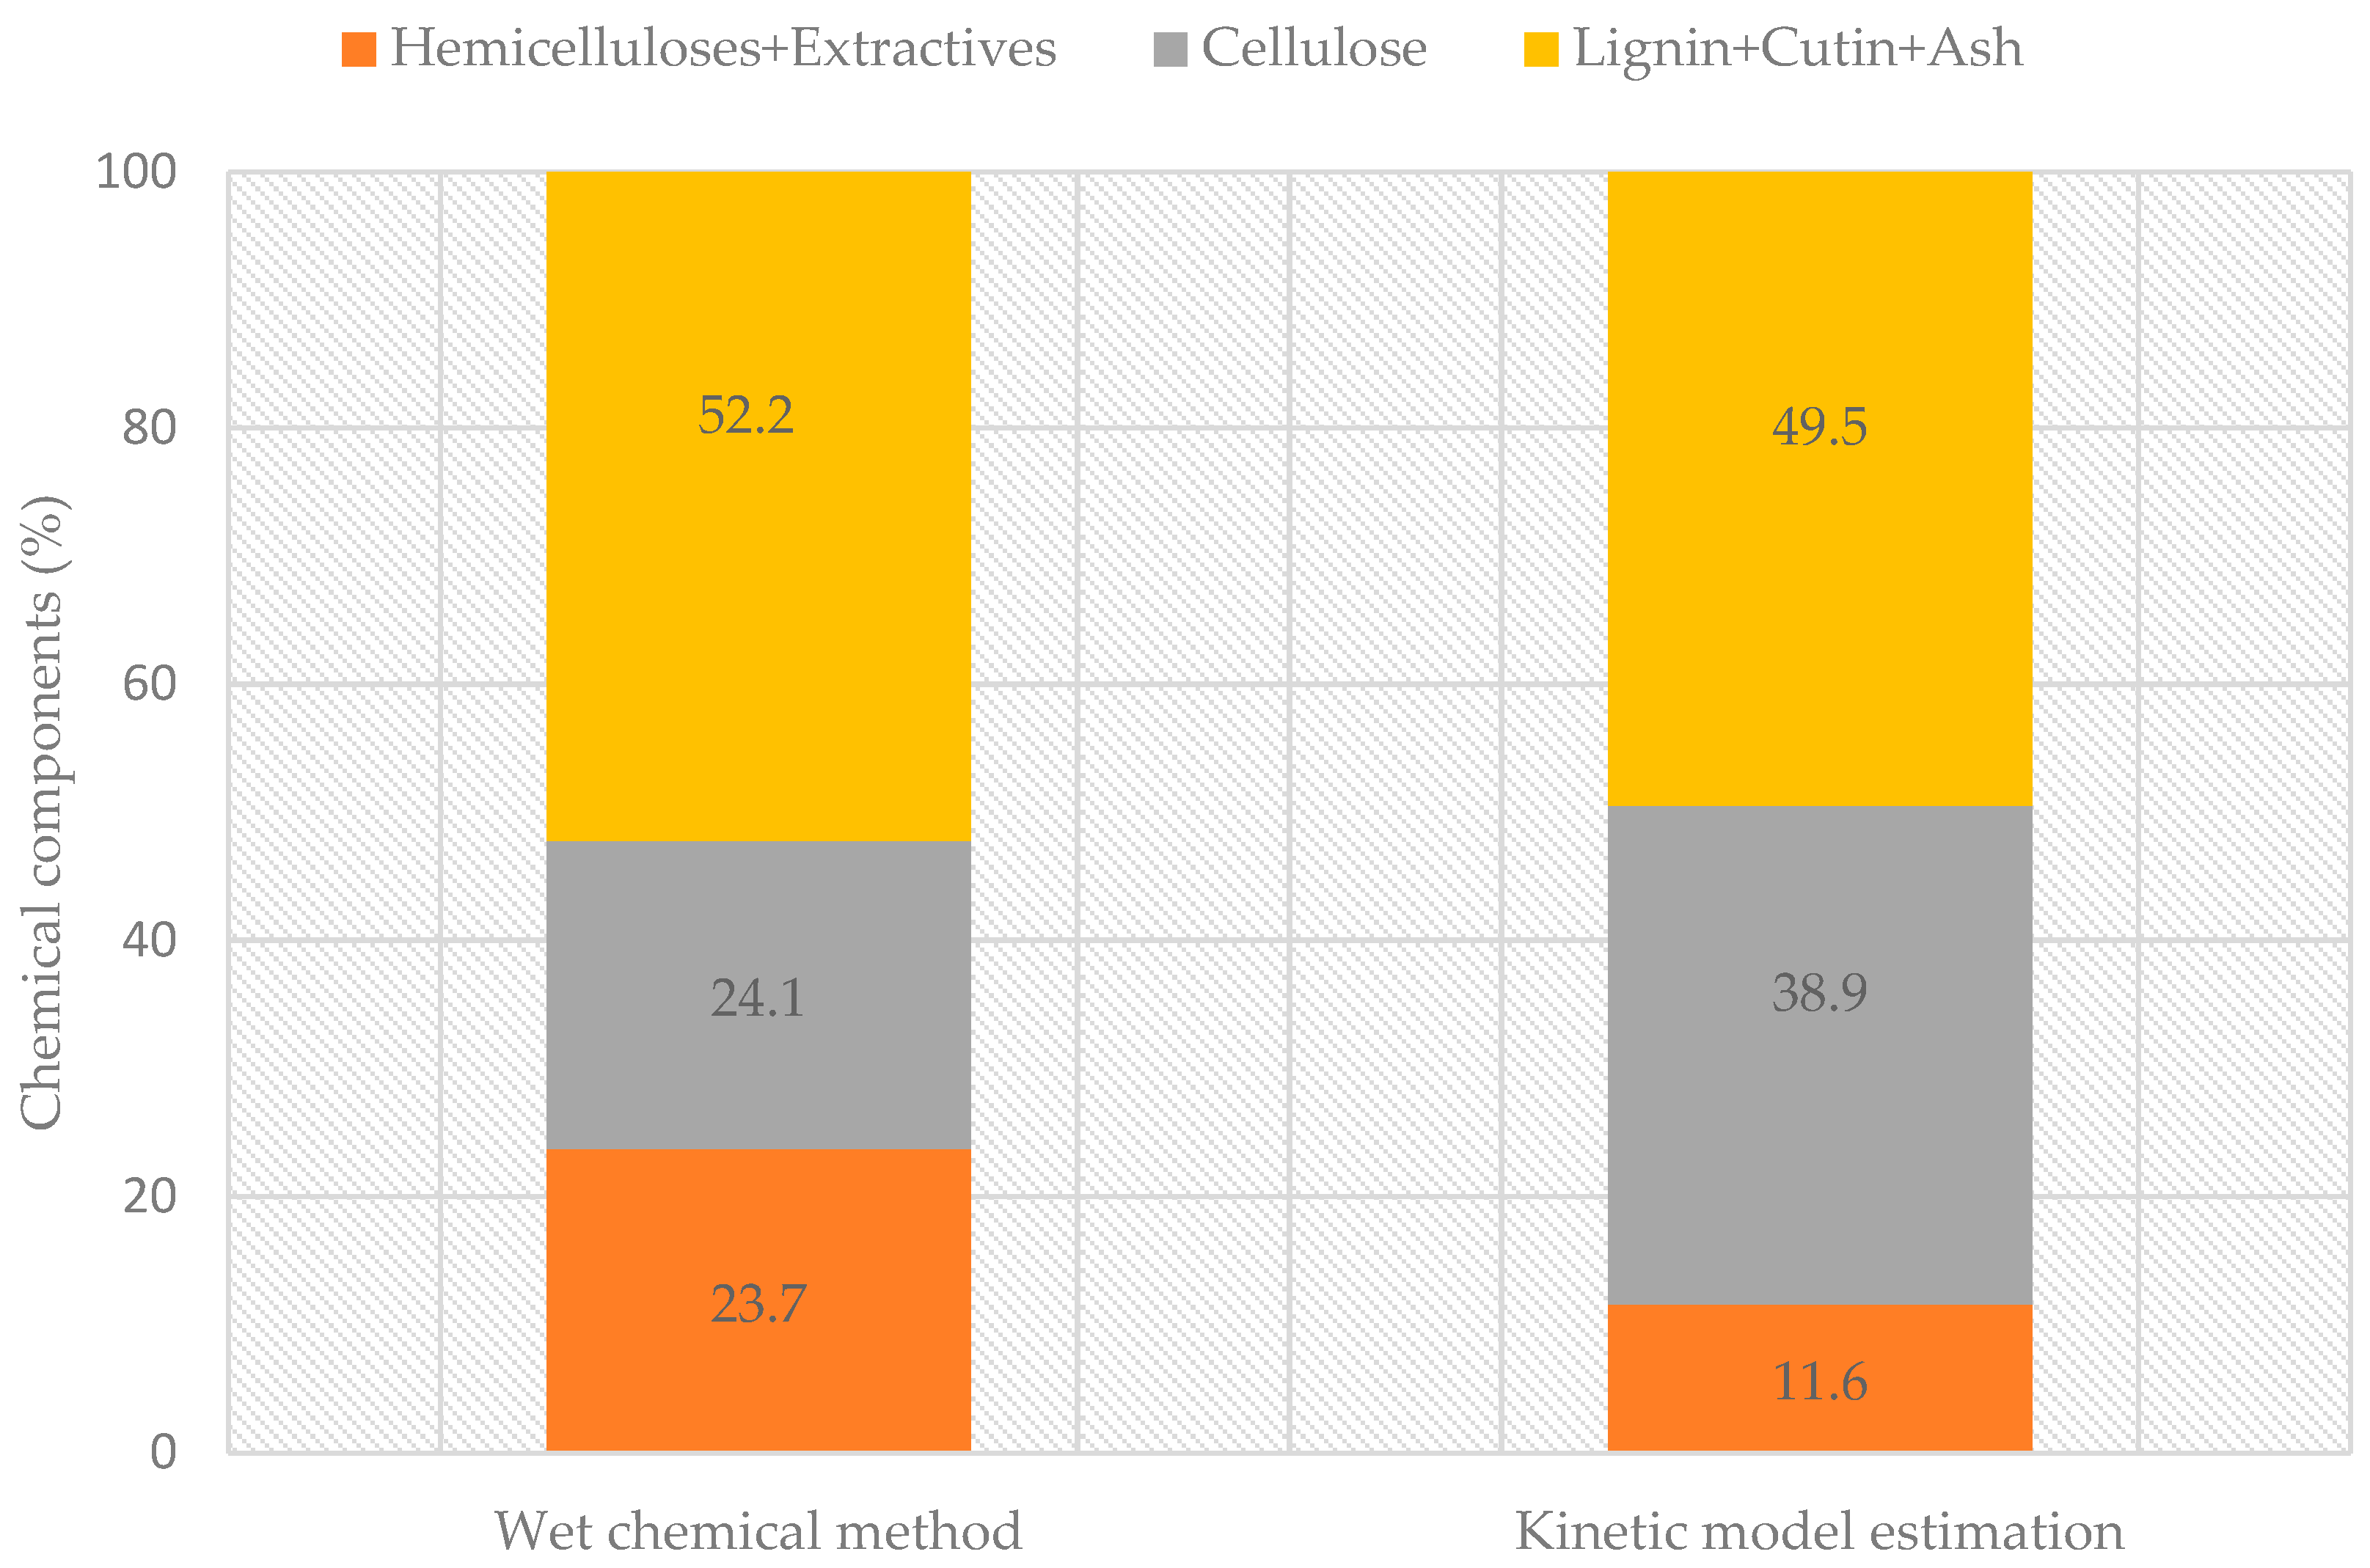
3.4. Thermochemical Fractionation

The high lignin content of PNS favors a cascade thermochemical path to produce a variety of products, including charcoals and activated charcoals. The first step was to analyze the thermal degradation characteristics and fuel properties of the pine nutshells and their charcoals using a thermal analysis method such as thermogravimetric analysis, which would give information on their proximate composition (ash, moisture, fixed carbon, volatile matter), burnout temperature, and kinetic parameters. Additionally, the fuel ratio and higher heating value could also be estimated after the thermogravimetric analysis.
PNS or PNS charcoals (biochars) are already good-grade solid fuels resulting from their high lignin content (higher calorific value) [37]. Previous reports confirmed this and explained their frequent use in domestic-scale heating systems [1]. PNS charcoals seem to be better suited for fuel applications than PNSs, with their improved fuel properties. However, it was also important to evaluate the pyrolytic yield, which would determine the economic feasibility of the pyrolysis. In this study, we obtained a charcoal yield of 23.29 ± 0.44 under moderate pyrolysis conditions (600 °C–1 h). This value agrees well with the thermogravimetric analysis results and can be taken as a reference point for economic evaluation.
The results of the thermal degradation analysis of the PNSs and PNS charcoals are shown in Figure 4a and Table 3. The PNSs were stable until 240 °C and subsequently underwent a fast degradation until approximately 350 °C and a slower degradation until approximately 540 °C, when the burnout temperature was reached (Figure 4a). The thermogravimetric mass loss curve of the PNSs shows a typical lignocellulosic degradation pattern with a shoulder at approximately 300 °C and a peak temperature at approximately 345 °C assigned to the degradation of hemicelluloses and celluloses, respectively. The PNSs contained moisture (6%) and volatile matter (75%), and they had a low fuel ratio (Table 3). The thermochemical conversion of the PNSs into PNS biochars significantly reduced the volatile content of the PNSs and improved their fuel properties (Table 3). The PNS biochar became a more homogeneous and stable solid fuel compared with the raw PNS, and the thermogravimetric mass loss curve shows that the cellulose and hemicellulose degradation peaks disappeared, and the highest degradation peak and the burnout temperatures shifted to higher temperatures (Figure 4b). The fuel ratio increased from 0.24 to 3.74, and the higher heating value (23.4 MJ/kg) of the material became comparable with that of lignite or sub-bituminous coal (Table 3).
The application of biochars as fuel in co-combustion with low-rank coals is an environmentally and economically attractive process because this addition induces a synergistic effect with coals, reducing the ignition and burnout temperatures of the mixtures and decreasing CO2, NOx, SOx emissions, therefore allowing a higher combustion efficiency [38,39,40,41].
Gasification is a powerful method for producing syngas or producer gas from lignocellulosic biomass, which can be used for heating, electricity generation, or synthetic fuel production [42]. Brown hydrogen production is another possibility [43]. Tar formation and CO2 capture seem to be the major challenges in biomass gasification [44]. Feedstock preparation, application of optimized operational conditions, or catalysts can reduce tar formation [44]. Syngas purification methods such as absorption or pressure swing adsorption are possible methods of integration into the gasification process for capturing CO2 [45,46]. Gasification has not been researched using the PNS as feedstock.

3.5. Biochar Properties and Applications

While solid fuel applications seem to be favorable for the valorization of PNS charcoals, their non-fuel (biochar) applications may be economically more attractive. These applications may be broadly grouped into adsorbents, soil amendment materials, and electrode materials, requiring highly porous materials. Thus, it is important to analyze the structures of PNSs and PNS biochars.
The structural properties of PNSs and PNS biochars are shown in Figure 5. Both solid materials are porous, and the porosity of PNS biochars is enhanced after pyrolysis. This thermal effect resembles cork expansion and thermochemical modification with high-temperature steam to produce expanded cork agglomerates [47]. PNS and PNS biochars are possibly suitable for use as adsorbents and soil amendment materials like other biochars for the removal of organic pollutants and heavy metals [48,49], but highly porous PNS biochars seem to be better suited for an additional activation process to produce activated carbons for use as electrode materials.
The particle size of biochars is also an important parameter for their use [50,51]. While larger (granular) biochars are generally applied in water and gas purification systems and soil amendment, smaller (powder) biochars are used in specialty applications such as electrode materials [52].
Biochar water retention capacity is important for soil amendment applications to retain water and improve plant yields, particularly in sandy soils [53]. The results of the water retention tests are shown in Table 4 and Table 5. Both the granular (GCs) and powder biochars (PCs) showed a similar water retention capacity (36%) but differed in nutrient leaching. The powdered biochars released a greater amount of nutrients into the water, in particular potassium. Powdered PNS biochars are, therefore, suitable for soil amendment applications because they have good water retention and release nutrients into the water, serving as a fertilizer.
To further explore the potential uses of granular and powdered PNS biochars, a simple thermal activation was applied. This single-step steam activation was selected because of its low cost and simplicity, which does not require a time-consuming washing procedure as in the case of chemical activation.
The nitrogen adsorption test showed that the granular PNS biochars had a BET surface area of 319 m2/g, while powdered PNS biochars had a slightly higher surface area of 325 m2/g. This result is interesting because it shows that their surface area was higher than low-rank activated carbons (specific surface areas of approximately 250 m2/g), even without activation [54]. Thermal activation increased the surface areas to 438 and 467 m2/g for granular (GACs) and powdered (PACs) PNS-activated carbons (Figure 6), making them comparable to commercial activated carbons. The activation process could be further optimized using chemical activation methods, and PNS-activated carbons may be utilized as electrode materials in supercapacitors in a similar way to other biomass carbons, including different pine nutshells [12,13,14,15,16]. Previously, pine nutshell-derived activated carbons showed a specific capacitance of 128 F g−1 at 0.5 A g−1 current density and a capacitance retention rate of 98% at a current density of 5 A g−1 after 10,000 cycles [16].
The PNS biochars had a similar organic elemental composition to that of the activated carbons, and the activation process resulted in an enhancement in oxygen content and a reduction in hydrogen content, which agrees with previous results [55,56]. Therefore, a solid material with increased O-functionalities was obtained for further applications, particularly for producing electrode materials, because heteroatom doping was shown to enhance the electrochemical properties of supercapacitors prepared from carbon materials [57].

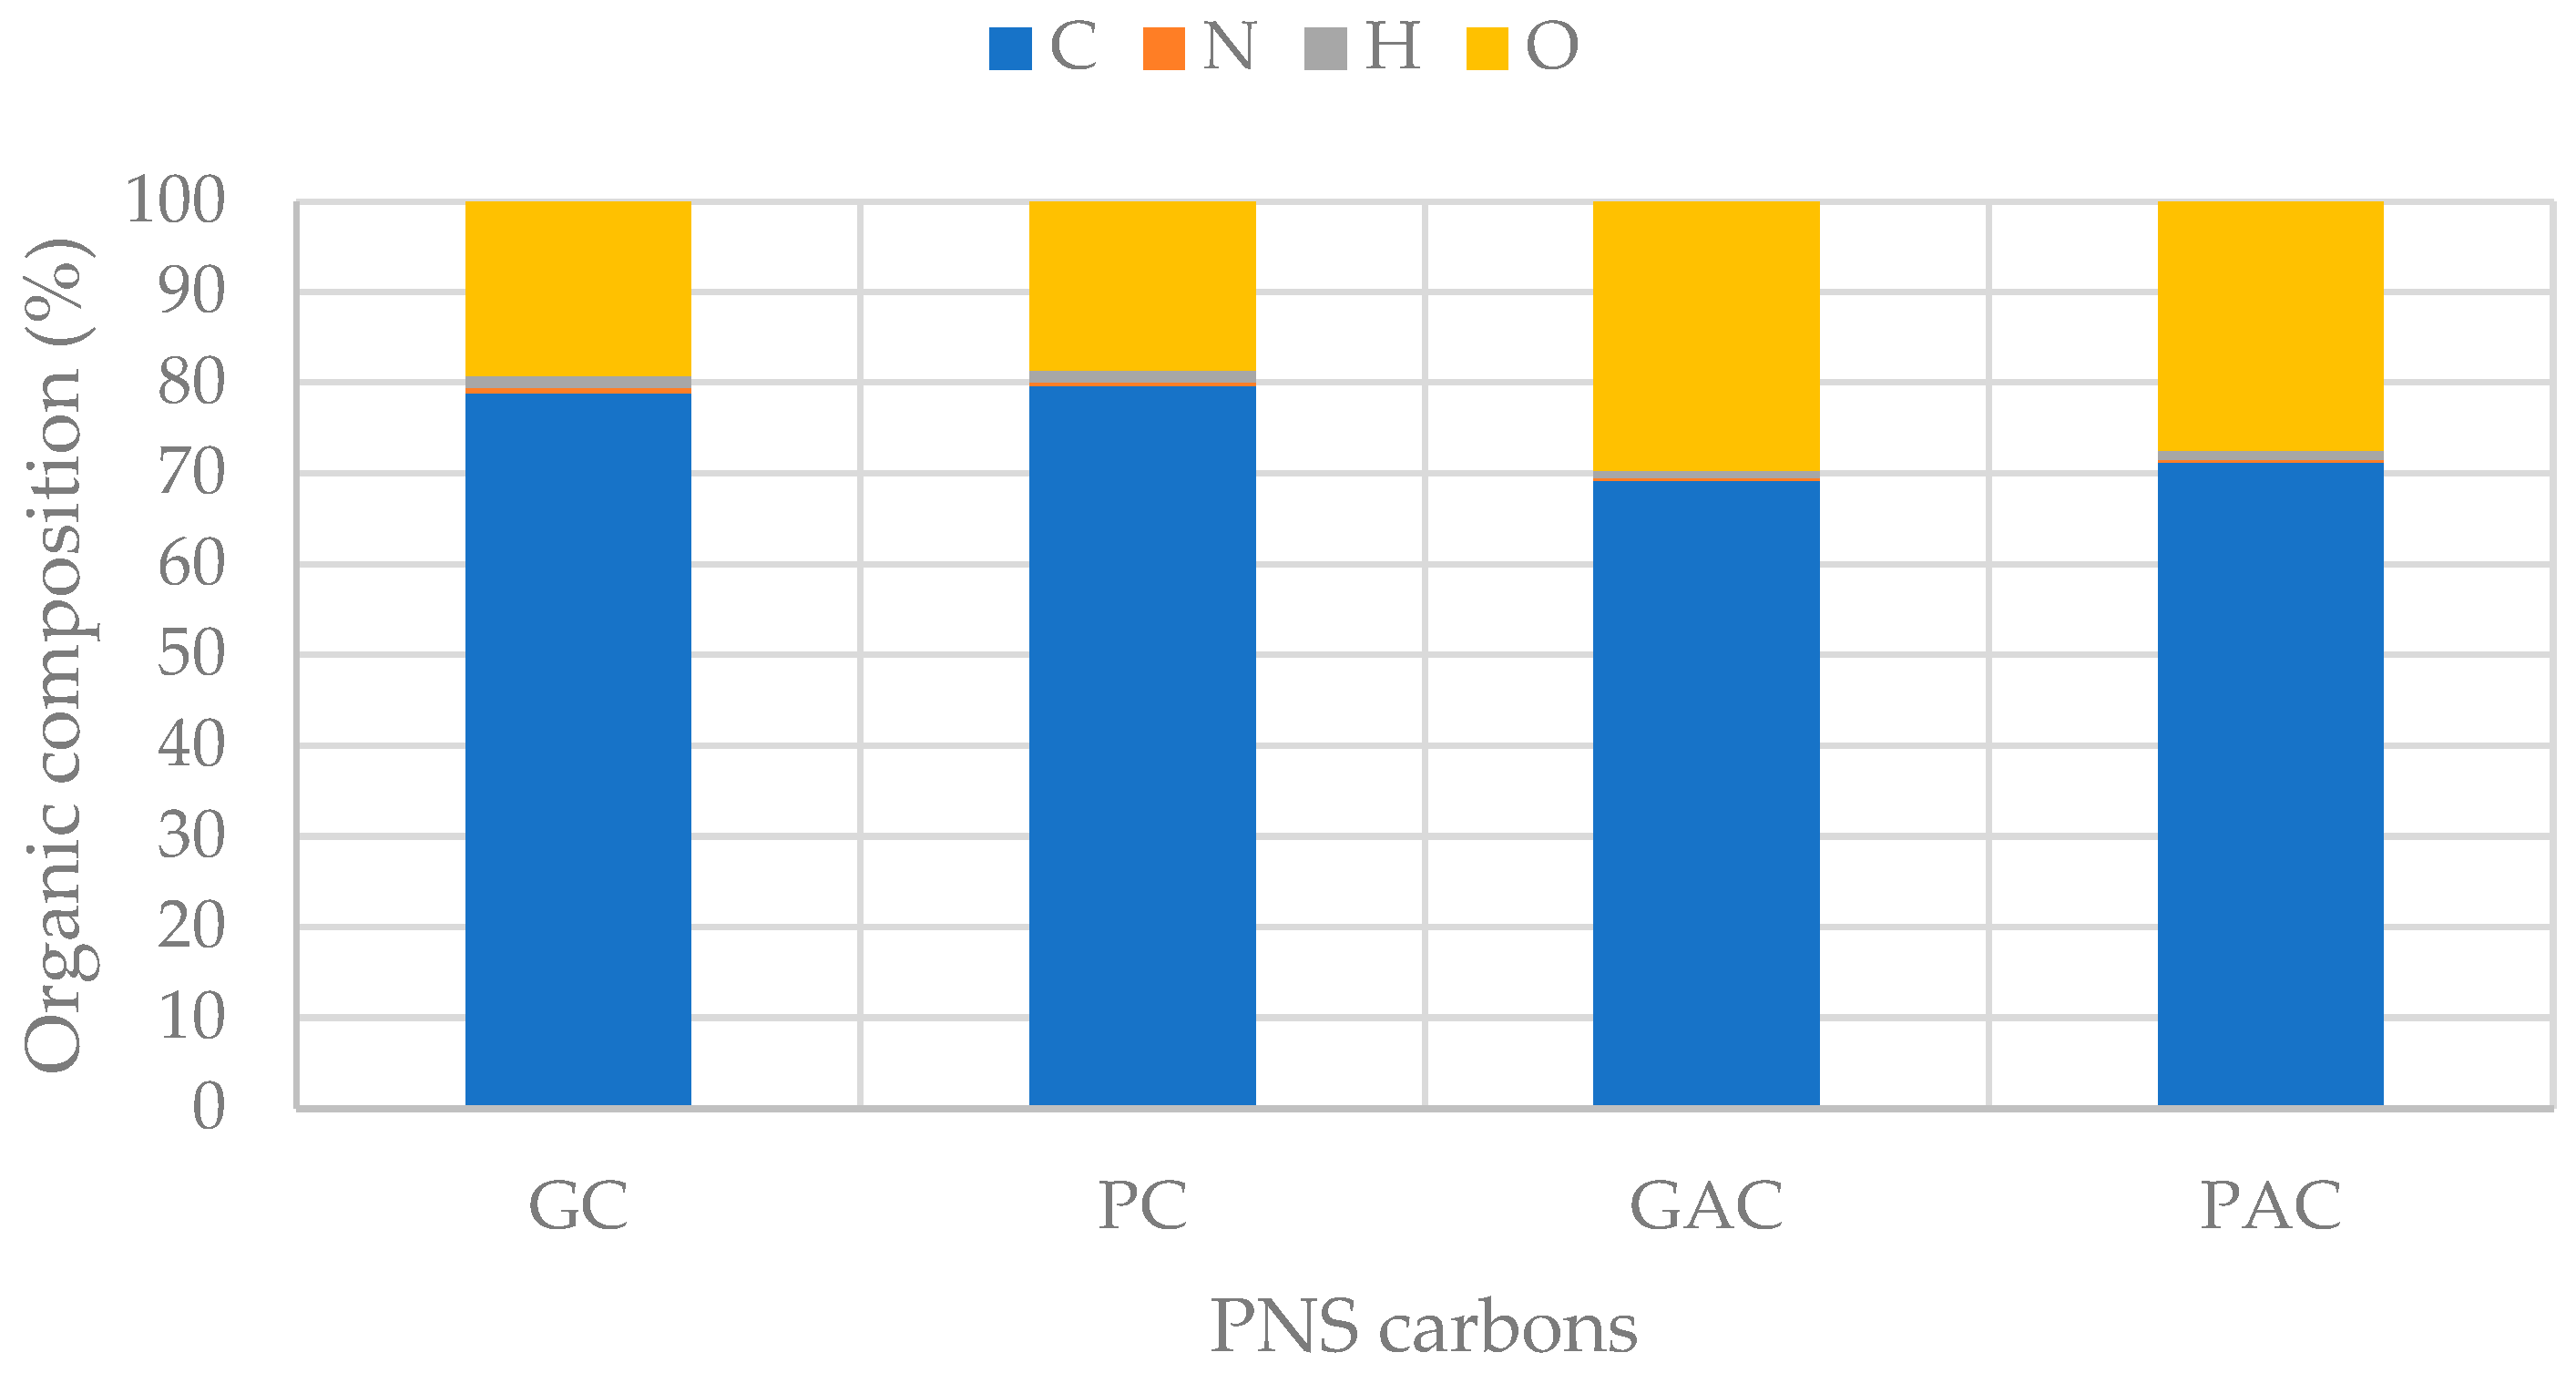
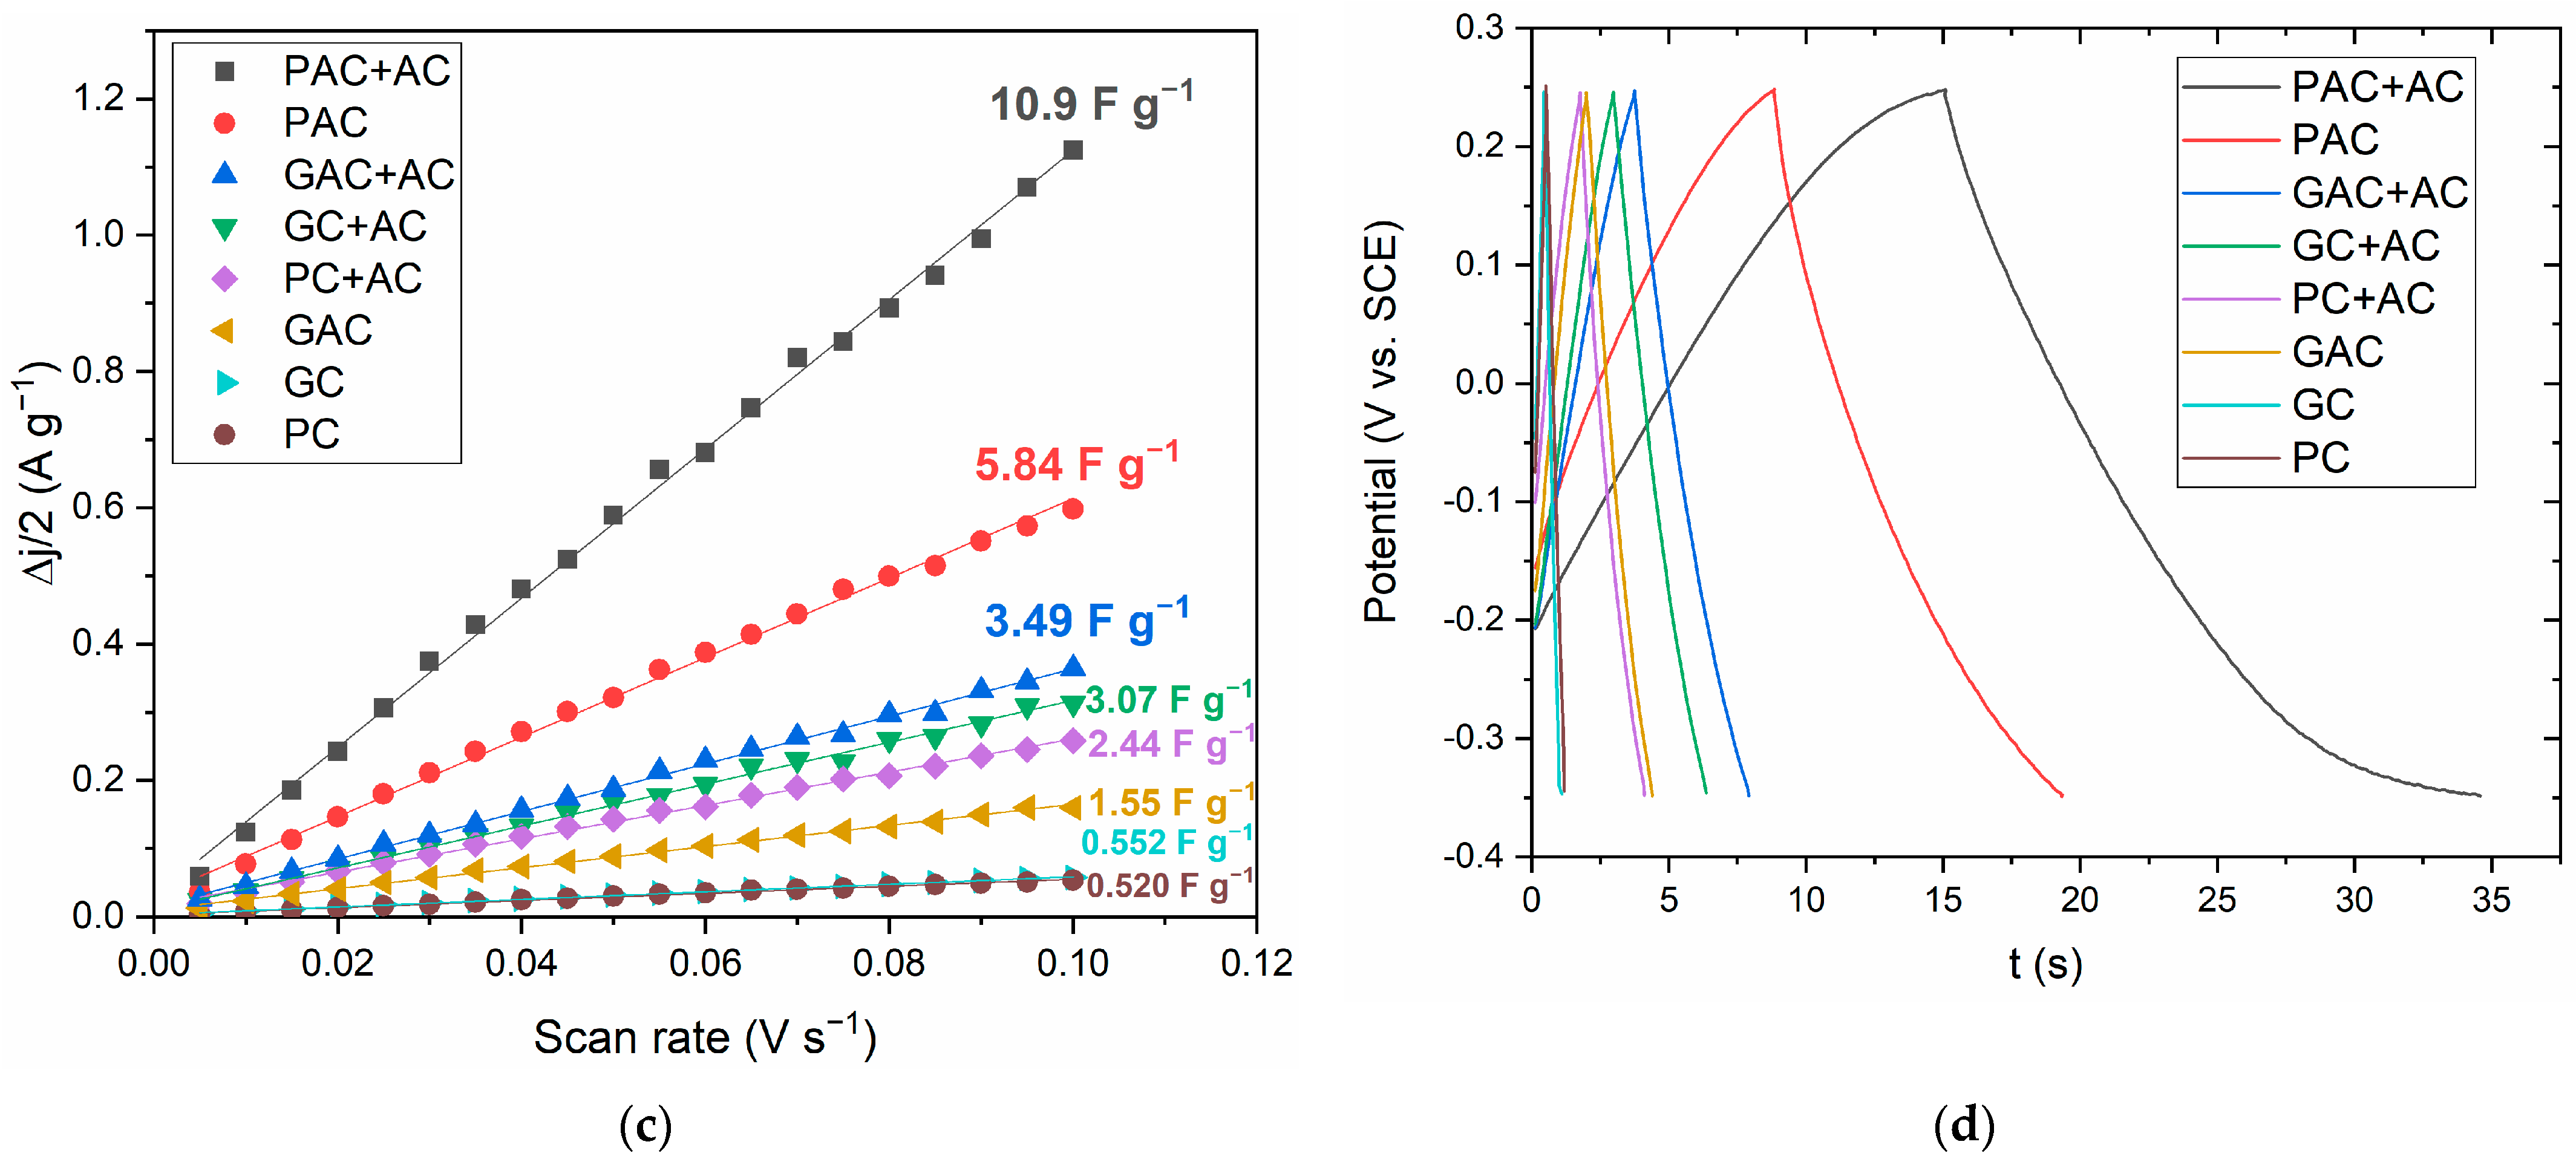
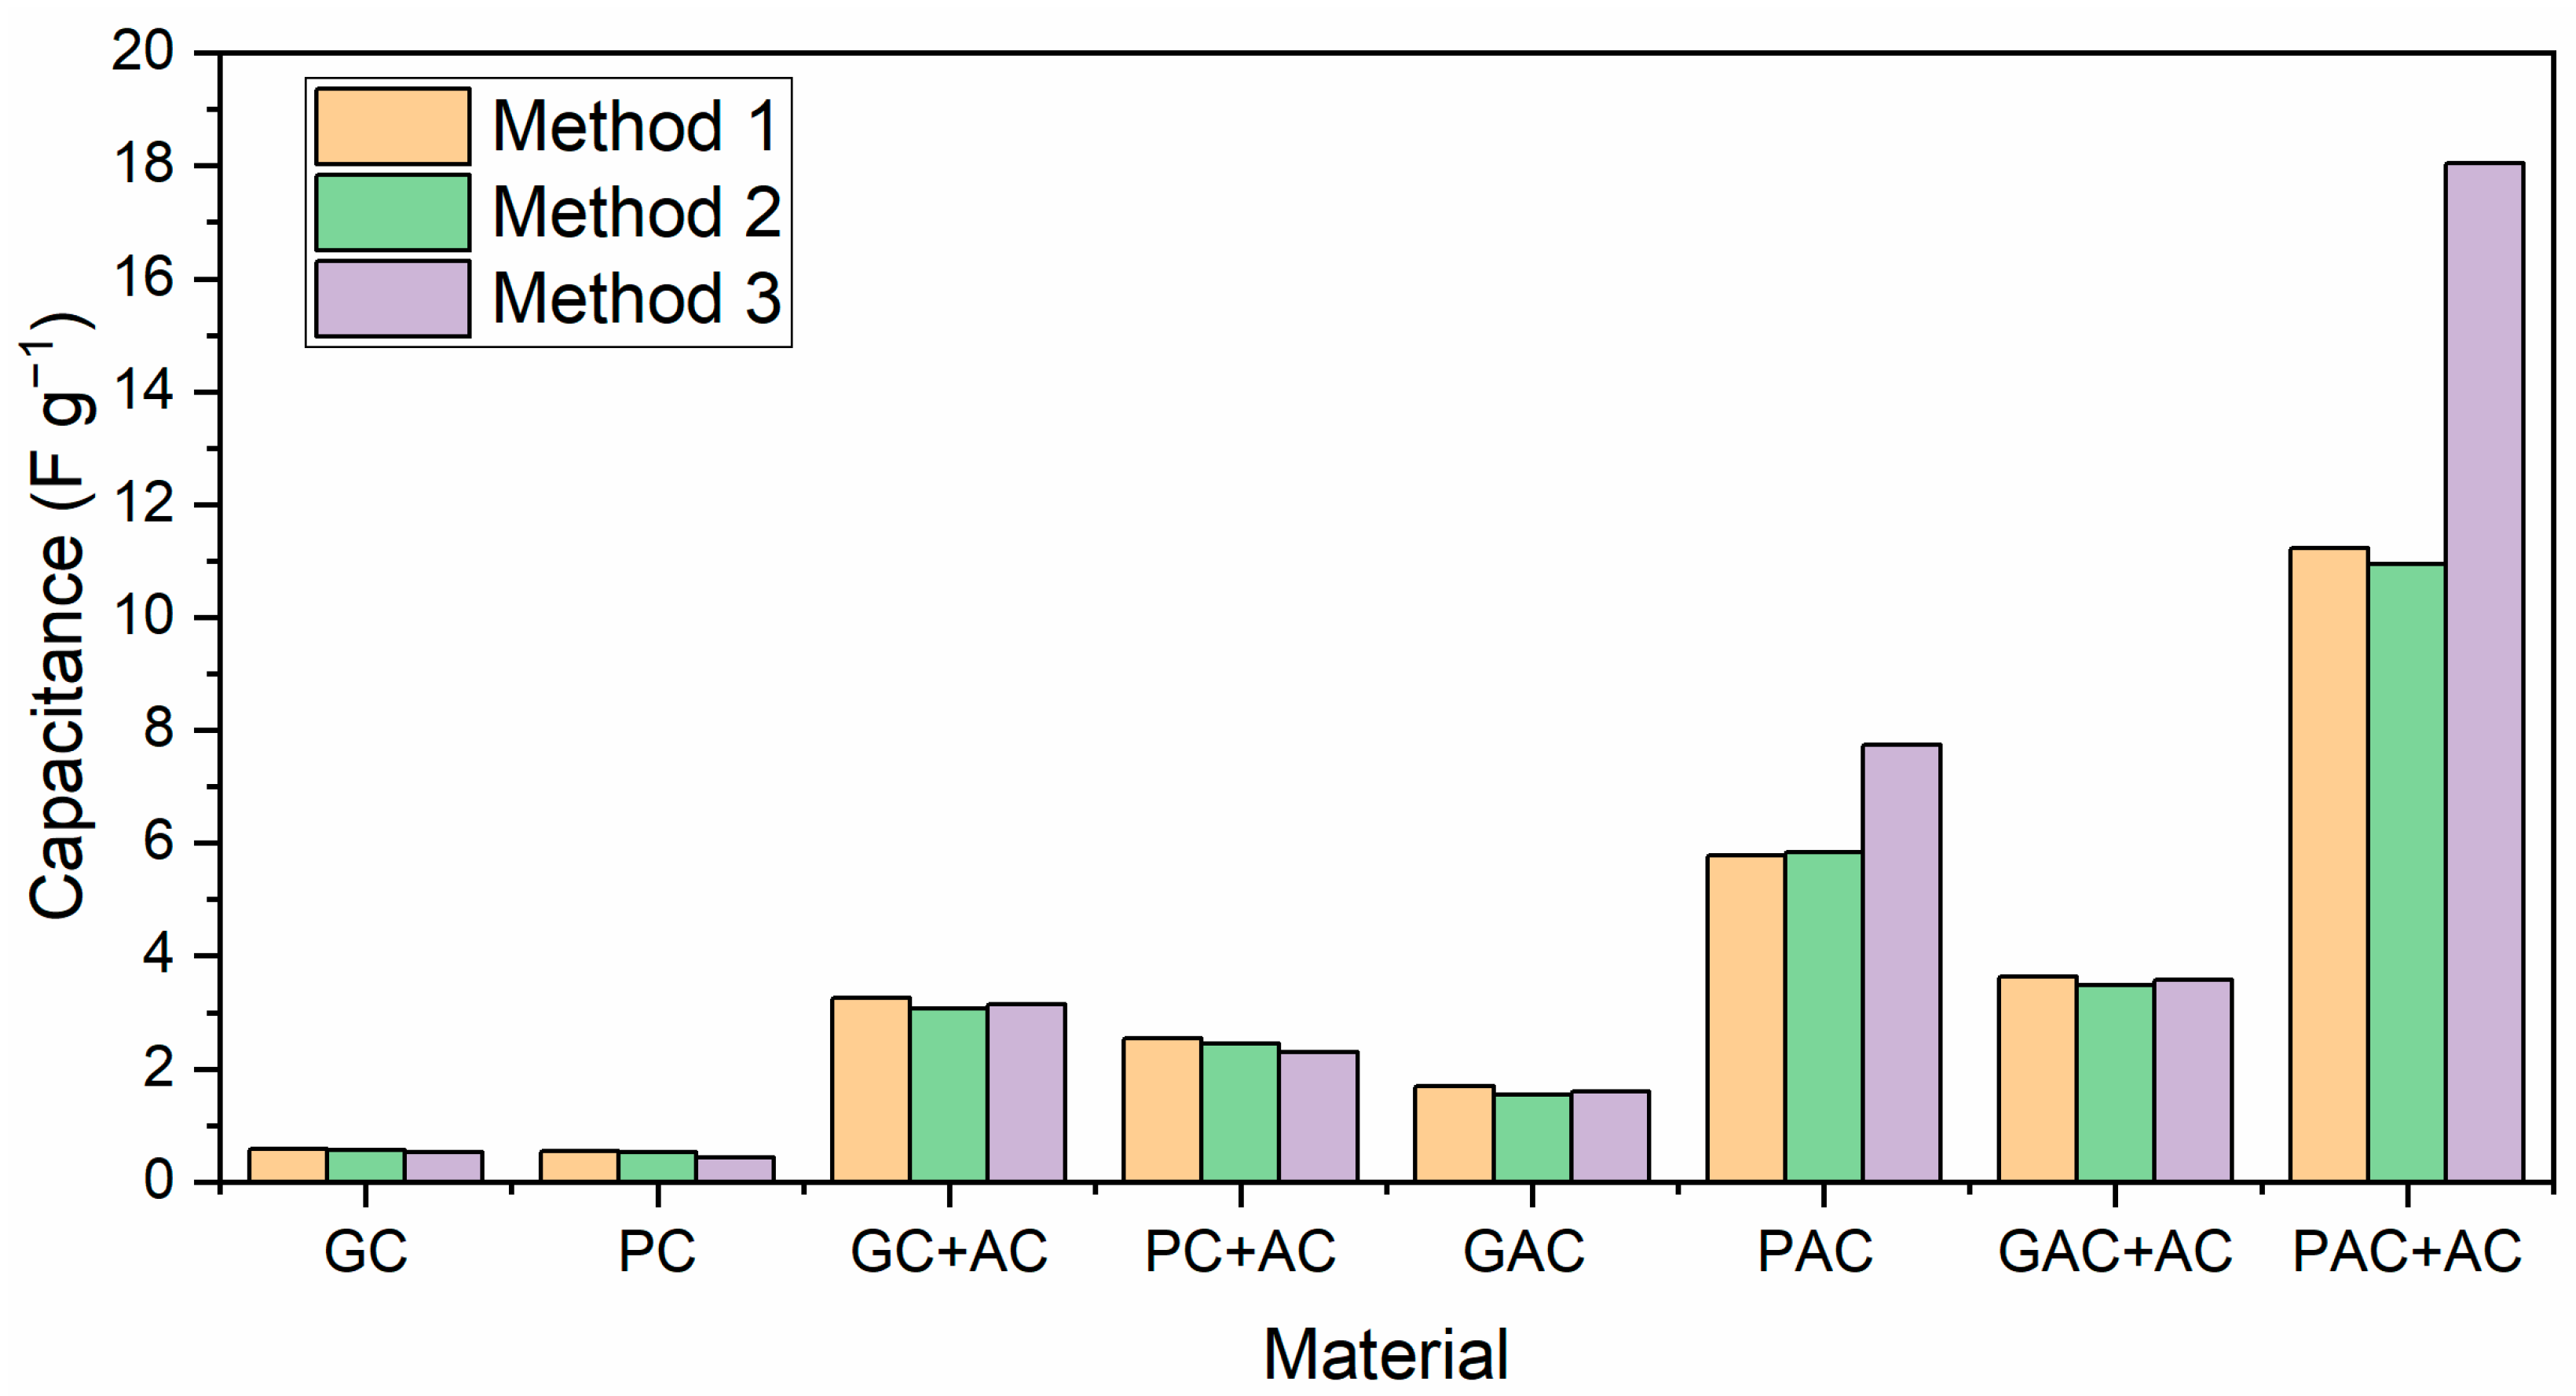
3.6. Electrochemical Properties of PNS Biochars and Activated Carbons

To determine the potential application of these materials as supercapacitors, their capacitance was calculated using three different methods. The materials were tested before and after activation as well as with and without commercial activated carbon (AC) as an additive to increase electronic conductivity. The first two methods relied on data obtained from the CVs. Figure 7a shows the cyclic voltammograms (CVs) for PAC+AC used to calculate the capacitance for Methods 1 and 2 (CVs for the remaining materials can be found in Figure S1). Figure 7b shows the capacitance values determined through Method 1 at each scan rate for each tested material. Figure 7c shows the plot of Δj/2 vs. scan rate for all materials (Method 2). Figure 7d shows the GCDs for all materials at 0.5 A g−1 (GCDs for PAC+AC at 1–4 A g−1 are shown in Figure S2).
As shown in Figure 7b, capacitance decreased as the scan rate increased. This decrease was more considerable at low scan rates but began to plateau at around 60 mV s−1. This decrease in capacitance occurred due to higher scan rates, causing the diffusion and accumulation of charge on the material’s surface to become a limiting factor. Figure 8 compares the capacitance values obtained for each method (Method 1 values taken at 100 mV s−1).
Figure 8 shows that prior to activation, both the GCs and PCs showed very low capacitance (around 0.5 F g−1). The addition of commercial activated carbon increased the capacitance considerably for both materials (ca. 3 and 2.5 F g−1 for GC+AC and PC+AC, respectively).
In GC’s case, the increase in capacitance from adding commercial activated carbon was higher than the increase from activating the material itself (GAC had a capacitance of around 1.6 F g−1) and comparable to the increase from activating the material and adding commercial activated carbon (GAC+AC had a capacity of around 3.5 F g−1).
In PC’s case, however, activating the material caused a much higher increase in capacitance than adding the commercial activated carbon. Notably, PAC and PAC+AC were the only cases with a considerable difference between Method 3 and the remaining ones. This could be explained by the fact that 0.5 A g−1 is a current density value that the remaining materials did not reach, even in CVs at 100 mV s−1, resulting in rates of potential variation over time of over 100 mV s−1. On the other hand, the PAC and PAC+AC reached 0.5 A g−1, allowing for rates of potential variation over time below 100 mV s−1. Due to this, the PAC and PAC+AC had capacitance values obtained through Method 3 that were more comparable with the capacitance values obtained through Method 1 at lower scan rates, while the remaining materials were better comparable to the values obtained at 100 mV s−1. The PAC had capacitance values of around 5.8 F g−1 (Methods 1 and 2) and 7.7 F g−1 (Method 3), while the PAC+AC had values of 11 F g−1 (Methods 1 and 2) and 18 F g−1 (Method 3), the highest value of any of the materials tested.
The results show the importance of both the preparation (granular or powdered) and activation of biochar for supercapacitor performance. Prior to activation, both the powdered and granular materials showed extremely low capacitance values, which were only slightly increased by adding commercial activated carbon. Activation caused a considerable increase in capacitance for the powdered material but a smaller increase for the granular material.
The highest capacitance value obtained for the PAC+AC (18 F g−1) is still low compared to those obtained for similar biochar-based electrode materials studied for supercapacitor applications and presented in Table 6 [12,13,14,15,16]. This can be attributed to the lower surface area of the materials in this study compared to the ones in the sources cited. The activation process should be further optimized to increase surface area and, subsequently, the electrode’s capacitance. Still, considering the quite simple and straightforward activation method, the current process allows the production of significantly low-cost electrode materials.

4. Conclusions

This study assessed the potential of utilizing waste pine nutshells in a biorefinery context by examining their cell-based antioxidant properties and lignin and polysaccharide contents. It also explored their applications for both fuel and non-fuel scenarios. The overall aim was to reduce waste and promote a circular economy from waste biomass.
The extraction and chemical valorization routes for the PNS seem unfavorable, considering the low extract yield and antioxidant activity of the extracts and the high lignin content of the PNS. Thermogravimetric analysis met the objectives and may be applied to quickly estimate the lignin and polysaccharide content of PNSs for the chemical valorization route. Thermochemical valorization seems to be the most feasible route for waste PNSs, considering the high lignin content and biochar yield of the PNSs. Further research should be performed on optimizing their activated carbon properties to produce better adsorbents and electrode materials. To this end, different activation processes as well as surface and porosity properties of the biochars and activated carbons should be analyzed in detail.
The specific conclusions drawn from this research are the following:
  • The antioxidant activity of pine nutshells is weak.
  • Pyrolytic kinetic modeling may be used to estimate the lignin and polysaccharide contents of pine nutshells.
  • Moderate-temperature slow pyrolysis of pine nutshells resulted in a 23% biochar yield.
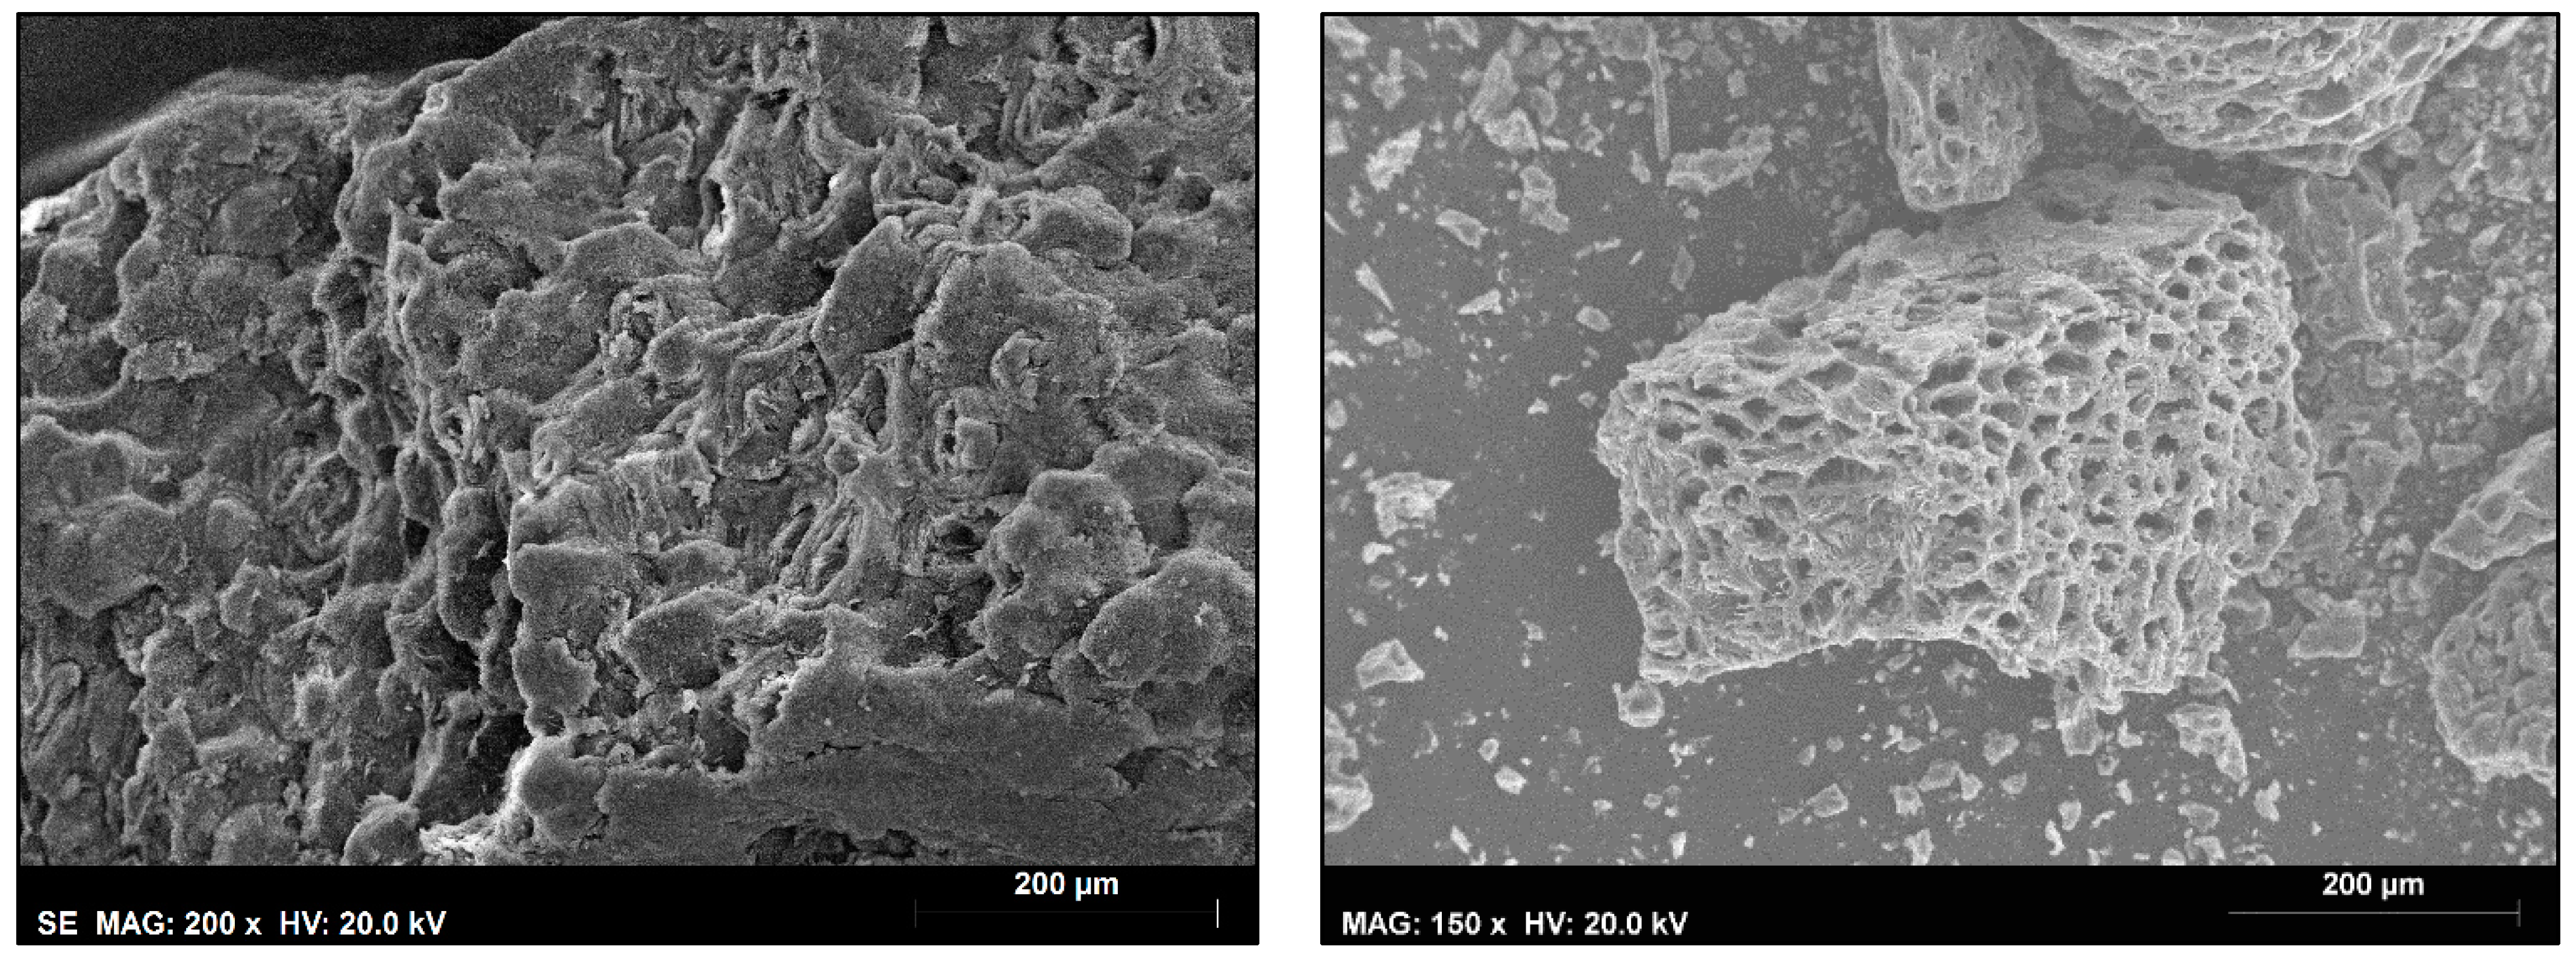
  • Pine nutshell biochars are potential soil amendment and adsorbent materials with a porous structure, 36% water retention capacity, and 151 mg/L potassium leaching.
  • Single-step steam activation of pine nutshell biochars resulted in an oxygen-enhanced activated carbon with a specific surface area between 438 and 467 m2/g.
  • Pine nutshell-activated carbons were used as electrode materials for supercapacitor applications, resulting in a capacitance value as high as 18 F g−1.

Supplementary Materials

The following supporting information can be downloaded at: https://www.mdpi.com/article/10.3390/pr12081603/s1, Figure S1: CVs in aqueous 6 M KOH solution at 5–100 mV s−1 (in 5 mV s−1 increments) for (a) GC; (b) PC; (c) GC+AC; (d) PC+AC; (e) GAC; (f) PAC; (g) GAC+AC; and (h) PAC+AC; Figure S2: Galvanic charge-discharge curves of PAC+AC at 1–4 A g−1 in 6 M KOH.

Author Contributions

Conceptualization, investigation, and writing—original draft preparation, U.Ș. and J.F.G.R.; formal analysis, U.Ș., J.F.G.R., D.A. and M.M.; funding acquisition, H.P.; research mentorship, H.P.; writing—review and editing, U.Ș., J.F.G.R., D.M.F.S., Â.F., M.G. and H.P.; visualization, H.P.; supervision, M.G., Â.F., D.M.F.S. and H.P. All authors have read and agreed to the published version of the manuscript.

Funding

U. Șen acknowledges support from the Fundação para a Ciência e a Tecnologia (FCT, Portugal) through a research contract (DL 57/2016). The authors are grateful to the FCT for its financial support through national funds to CIMO (UIDB/00690/2020 (DOI: 10.54499/UIDB/00690/2020) and UIDP/00690/2020 (DOI: 10.54499/UIDP/00690/2020)), SusTEC (LA/P/0007/2020 (DOI: 10.54499/LA/P/0007/2020)), and CEF (UIDB/00239/2020 and UIDP/00239/2020 (DOI: 10.54499/UIDB/00239/2020 and DOI: 10.54499/UIDP/00239/2020)). The contract of Â. Fernandes (DOI: 10.54499/CEECINST/00016/2018/CP1505/CT0008) was funded by the FCT through the institutional scientific employment program. FCT is also acknowledged for funding a research contract in the scope of programmatic funding UIDP/04540/2020 (D.M.F.S.).

Data Availability Statement

Data are available within this article and the Supplementary Materials.

Acknowledgments

The authors thank Joaquina Silva and Francisco Lemos for their technical assistance.

Conflicts of Interest

The authors declare no conflicts of interest.

References

  1. Şen, A.U.; Correia, R.; Longo, A.; Nobre, C.; Alves, O.; Santos, M.; Gonçalves, M.; Miranda, I.; Pereira, H. Chemical Composition, Morphology, Antioxidant, and Fuel Properties of Pine Nut Shells within a Biorefinery Perspective. Biomass Convers. Biorefin. 2022, 14, 14505–14517. [Google Scholar] [CrossRef]
  2. Fengel, D.; Wegener, G. Wood: Chemistry, Ultrastructure Reactions; Walter de Gruyter: Berlin, Germany; New York, NY, USA, 1984. [Google Scholar]
  3. Şen, A.U.; Pereira, H. State-of-the-Art Char Production with a Focus on Bark Feedstocks: Processes, Design, and Applications. Processes 2021, 9, 87. [Google Scholar] [CrossRef]
  4. Hu, S.; Zhang, S.; Pan, N.; Hsieh, Y.-L. High Energy Density Supercapacitors from Lignin Derived Submicron Activated Carbon Fibers in Aqueous Electrolytes. J. Power Sources 2014, 270, 106–112. [Google Scholar] [CrossRef]
  5. Bolan, N.; Hoang, S.A.; Beiyuan, J.; Gupta, S.; Hou, D.; Karakoti, A.; Joseph, S.; Jung, S.; Kim, K.-H.; Kirkham, M.B. Multifunctional Applications of Biochar beyond Carbon Storage. Int. Mater. Rev. 2022, 67, 150–200. [Google Scholar] [CrossRef]
  6. Junior, I.I.; Do Nascimento, M.A.; de Souza, R.O.M.A.; Dufour, A.; Wojcieszak, R. Levoglucosan: A Promising Platform Molecule? Green Chem. 2020, 22, 5859–5880. [Google Scholar] [CrossRef]
  7. Szostak, K.; Hodacka, G.; Długosz, O.; Pulit-Prociak, J.; Banach, M. Sorption of mercury in batch and fixed-bed column system on hydrochar obtained from apple pomace. Processes 2022, 10, 2114. [Google Scholar] [CrossRef]
  8. Modak, A.; Bhaumik, A. Porous carbon derived via KOH activation of a hypercrosslinked porous organic polymer for efficient CO2, CH4, H2 adsorptions and high CO2/N2 selectivity. J. Solid State Chem. 2015, 232, 157–162. [Google Scholar] [CrossRef]
  9. Şen, A.U.; Fonseca, F.G.; Funke, A.; Pereira, H.; Lemos, F. Pyrolysis Kinetics and Estimation of Chemical Composition of Quercus cerris Cork. Biomass Convers. Biorefin. 2020, 12, 4835–4845. [Google Scholar] [CrossRef]
  10. Alimi, A.; Assaker, I.B.; Mozaryn, J.; Ávila-Brande, D.; Castillo-Martínez, E.; Chtourou, R. Electrochemical Synthesis of MnO2/NiO/ZnO Trijunction Coated Stainless Steel Substrate as a Supercapacitor Electrode and Cyclic Voltammetry Behavior Modeling Using Artificial Neural Network. Int. J. Energy Res. 2022, 46, 17163–17179. [Google Scholar] [CrossRef]
  11. Mladenović, D.; Santos, D.M.F.; Bozkurt, G.; Soylu, G.S.P.; Yurtcan, A.B.; Miljanić, Š.; Šljukić, B. Tailoring Metal-Oxide-Supported PtNi as Bifunctional Catalysts of Superior Activity and Stability for Unitised Regenerative Fuel Cell Applications. Electrochem. Commun. 2021, 124, 106963. [Google Scholar] [CrossRef]
  12. Subramanian, V.; Luo, C.; Stephan, A.M.; Nahm, K.S.; Thomas, S.; Wei, B. Supercapacitors from Activated Carbon Derived from Banana Fibers. J. Phys. Chem. C 2007, 111, 7527–7531. [Google Scholar] [CrossRef]
  13. Chen, H.; Guo, Y.; Wang, F.; Wang, G.; Qi, P.; Guo, X.; Dai, B.; Yu, F. An Activated Carbon Derived from Tobacco Waste for Use as a Supercapacitor Electrode Material. New Carbon. Mater. 2017, 32, 592–599. [Google Scholar] [CrossRef]
  14. Li, M.; Xiao, H.; Zhang, T.; Li, Q.; Zhao, Y. Activated Carbon Fiber Derived from Sisal with Large Specific Surface Area for High-Performance Supercapacitors. ACS Sustain. Chem. Eng. 2019, 7, 4716–4723. [Google Scholar] [CrossRef]
  15. Qin, L.; Hou, Z.; Zhang, S.; Zhang, W.; Jiang, E. Supercapacitive Charge Storage Properties of Porous Carbons Derived from Pine Nut Shells. J. Electroanal. Chem. 2020, 866, 114140. [Google Scholar] [CrossRef]
  16. Qin, L.; Hou, Z.; Lu, S.; Liu, S.; Liu, Z.; Jiang, E. Porous Carbon Derived from Pine Nut Shell Prepared by Steam Activation for Supercapacitor Electrode Material. Int. J. Electrochem. Sci. 2019, 14, 8907–8918. [Google Scholar] [CrossRef]
  17. Sjostrom, E. Wood Chemistry: Fundamentals and Applications; Gulf Professional Publishing: Houston, TX, USA; Academic Press: New York, NY, USA, 1993; ISBN 0126474818. [Google Scholar]
  18. Şen, U.; Esteves, B.; Pereira, H. Pyrolysis and Extraction of Bark in a Biorefineries Context: A Critical Review. Energies 2023, 16, 4848. [Google Scholar] [CrossRef]
  19. Yesil-Celiktas, O.; Ganzera, M.; Akgun, I.; Sevimli, C.; Korkmaz, K.S.; Bedir, E. Determination of Polyphenolic Constituents and Biological Activities of Bark Extracts from Different Pinus Species. J. Sci. Food Agric. 2009, 89, 1339–1345. [Google Scholar] [CrossRef]
  20. Serrano, J.; Goñi, I.; Saura-Calixto, F. Food Antioxidant Capacity Determined by Chemical Methods May Underestimate the Physiological Antioxidant Capacity. Food Res. Int. 2007, 40, 15–21. [Google Scholar] [CrossRef]
  21. Kostova, I.N.; Iossifova, T. Chemical Components of Fraxinus Ornus Bark—Structure and Biological Activity. Stud. Nat. Prod. Chem. 2002, 26, 313–349. [Google Scholar] [CrossRef]
  22. Dönmez, I.E.; Hafizoğlu, H.; Kilic, A.; Tümen, I.; Sivrikaya, H. Chemical Composition of Fourteen Different Coniferous Species Cones Growing Naturally in Turkey. Wood Res. 2012, 57, 339–344. [Google Scholar]
  23. Miranda, I.; Mirra, I.; Gominho, J.; Pereira, H. Fractioning of Bark of Pinus Pinea by Milling and Chemical Characterization of the Different Fractions. Maderas Cienc. Tecnol. 2017, 19, 185–194. [Google Scholar] [CrossRef]
  24. Venkatesan, T.; Choi, Y.-W.; Kim, Y.-K. Comparative Evaluation of the Impact of Extraction Solvent and Time on the Yield and Antioxidant Potential of Pinus Densiflora Needle and Bark Extracts. Wood Sci. Technol. 2020, 54, 587–598. [Google Scholar] [CrossRef]
  25. Lee, J. Biological Conversion of Lignocellulosic Biomass to Ethanol. J. Biotechnol. 1997, 56, 1–24. [Google Scholar] [CrossRef]
  26. Dalena, F.; Senatore, A.; Iulianelli, A.; Di Paola, L.; Basile, M.; Basile, A. Ethanol from Biomass: Future and Perspectives. In Ethanol; Elsevier: Amsterdam, The Netherlands, 2019; pp. 25–59. ISBN 978-0-12-811458-2. [Google Scholar]
  27. Le Normand, M.; Moriana, R.; Ek, M. Isolation and Characterization of Cellulose Nanocrystals from Spruce Bark in a Biorefinery Perspective. Carbohydr. Polym. 2014, 111, 979–987. [Google Scholar] [CrossRef]
  28. Song, Y.; Mobley, J.K.; Motagamwala, A.H.; Isaacs, M.; Dumesic, J.A.; Ralph, J.; Lee, A.F.; Wilson, K.; Crocker, M. Gold-Catalyzed Conversion of Lignin to Low Molecular Weight Aromatics. Chem. Sci. 2018, 9, 8127–8133. [Google Scholar] [CrossRef] [PubMed]
  29. Mandal, D.D.; Singh, G.; Majumdar, S.; Chanda, P. Challenges in Developing Strategies for the Valorization of Lignin—A Major Pollutant of the Paper Mill Industry. Environ. Sci. Pollut. Res. 2023, 30, 11119–11140. [Google Scholar] [CrossRef] [PubMed]
  30. Argyropoulos, D.D.S.; Crestini, C.; Dahlstrand, C.; Furusjö, E.; Gioia, C.; Jedvert, K.; Henriksson, G.; Hulteberg, C.; Lawoko, M.; Pierrou, C. Kraft Lignin: A Valuable, Sustainable Resource, Opportunities and Challenges. ChemSusChem 2023, 16, e202300492. [Google Scholar] [CrossRef]
  31. Costa, C.A.E.; Casimiro, F.M.; Vega-Aguilar, C.; Rodrigues, A.E. Lignin Valorization for Added-Value Chemicals: Kraft Lignin versus Lignin Fractions. ChemEngineering 2023, 7, 42. [Google Scholar] [CrossRef]
  32. Oliveira, R.C.P.; Mateus, M.; Santos, D.M.F. Chronoamperometric and Chronopotentiometric Investigation of Kraft Black Liquor. Int. J. Hydrogen Energy 2018, 43, 16817–16823. [Google Scholar] [CrossRef]
  33. Rowell, R.M. Handbook of Wood Chemistry and Wood Composites; CRC Press: Boca Raton, FL, USA, 2012; ISBN 0429109091. [Google Scholar]
  34. Sjöström, E.; Alén, R. Analytical Methods in Wood Chemistry, Pulping, and Papermaking; Springer: Berlin, Germany, 1998; ISBN 354063102X. [Google Scholar]
  35. Mészáros, E.; Várhegyi, G.; Jakab, E.; Marosvölgyi, B. Thermogravimetric and Reaction Kinetic Analysis of Biomass Samples from an Energy Plantation. Energy Fuels 2004, 18, 497–507. [Google Scholar] [CrossRef]
  36. Carrier, M.; Loppinet-Serani, A.; Denux, D.; Lasnier, J.-M.; Ham-Pichavant, F.; Cansell, F.; Aymonier, C. Thermogravimetric Analysis as a New Method to Determine the Lignocellulosic Composition of Biomass. Biomass Bioenergy 2011, 35, 298–307. [Google Scholar] [CrossRef]
  37. Esteves, B.; Sen, U.; Pereira, H. Influence of Chemical Composition on Heating Value of Biomass: A Review and Bibliometric Analysis. Energies 2023, 16, 4226. [Google Scholar] [CrossRef]
  38. Chen, L.; Wen, C.; Wang, W.; Liu, T.; Liu, E.; Liu, H.; Li, Z. Combustion Behaviour of Biochars Thermally Pretreated via Torrefaction, Slow Pyrolysis, or Hydrothermal Carbonisation and Co-Fired with Pulverised Coal. Renew. Energy 2020, 161, 867–877. [Google Scholar] [CrossRef]
  39. Liu, Y.; Tan, W.; Liang, S.; Bi, X.; Sun, R.; Pan, X. Comparative Study on the Co-Combustion Behavior of Torrefied Biomass Blended with Different Rank Coals. Biomass Convers. Biorefin. 2022, 14, 781–793. [Google Scholar] [CrossRef]
  40. Vakalis, S.; Moustakas, K. Modeling the Co-Combustion of Coal and Biocoal from the Novel Process of Frictional Pyrolysis for Reducing the Emissions of Coal Plants. Biomass Convers. Biorefin. 2021, 11, 2937–2945. [Google Scholar] [CrossRef]
  41. Huang, C.-W.; Li, Y.-H.; Xiao, K.-L.; Lasek, J. Cofiring Characteristics of Coal Blended with Torrefied Miscanthus Biochar Optimized with Three Taguchi Indexes. Energy 2019, 172, 566–579. [Google Scholar] [CrossRef]
  42. Molino, A.; Chianese, S.; Musmarra, D. Biomass Gasification Technology: The State of the Art Overview. J. Energy Chem. 2016, 25, 10–25. [Google Scholar] [CrossRef]
  43. Chang, A.C.C.; Chang, H.-F.; Lin, F.-J.; Lin, K.-H.; Chen, C.-H. Biomass Gasification for Hydrogen Production. Int. J. Hydrogen Energy 2011, 36, 14252–14260. [Google Scholar] [CrossRef]
  44. Rios, M.L.V.; González, A.M.; Lora, E.E.S.; del Olmo, O.A.A. Reduction of Tar Generated during Biomass Gasification: A Review. Biomass Bioenergy 2018, 108, 345–370. [Google Scholar] [CrossRef]
  45. Dinca, C.; Slavu, N.; Cormoş, C.-C.; Badea, A. CO2 Capture from Syngas Generated by a Biomass Gasification Power Plant with Chemical Absorption Process. Energy 2018, 149, 925–936. [Google Scholar] [CrossRef]
  46. Oreggioni, G.D.; Brandani, S.; Luberti, M.; Baykan, Y.; Friedrich, D.; Ahn, H. CO2 Capture from Syngas by an Adsorption Process at a Biomass Gasification CHP Plant: Its Comparison with Amine-Based CO2 Capture. Int. J. Greenh. Gas Control 2015, 35, 71–81. [Google Scholar] [CrossRef]
  47. Pereira, H.; Ferreira, E. Scanning Electron Microscopy Observations of Insulation Cork Agglomerates. Mater. Sci. Eng. A 1989, 111, 217–225. [Google Scholar] [CrossRef]
  48. Zhang, X.; Wang, H.; He, L.; Lu, K.; Sarmah, A.; Li, J.; Bolan, N.S.; Pei, J.; Huang, H. Using biochar for remediation of soils contaminated with heavy metals and organic pollutants. Environ. Sci. Pollut. Res. 2013, 20, 8472–8483. [Google Scholar] [CrossRef] [PubMed]
  49. Liu, Z.; Xu, Z.; Xu, L.; Buyong, F.; Chay, T.C.; Li, Z.; Cai, Y.; Hu, B.; Zhu, Y.; Wang, X. Modified biochar: Synthesis and mechanism for removal of environmental heavy metals. Carbon Res. 2022, 1, 8. [Google Scholar] [CrossRef]
  50. Liu, Z.; Dugan, B.; Masiello, C.A.; Gonnermann, H.M. Biochar Particle Size, Shape, and Porosity Act Together to Influence Soil Water Properties. PLoS ONE 2017, 12, e0179079. [Google Scholar] [CrossRef] [PubMed]
  51. Liao, W.; Thomas, S.C. Biochar Particle Size and Post-Pyrolysis Mechanical Processing Affect Soil PH, Water Retention Capacity, and Plant Performance. Soil Syst. 2019, 3, 14. [Google Scholar] [CrossRef]
  52. Lyu, H.; Yu, Z.; Gao, B.; He, F.; Huang, J.; Tang, J.; Shen, B. Ball-Milled Biochar for Alternative Carbon Electrode. Environ. Sci. Pollut. Res. 2019, 26, 14693–14702. [Google Scholar] [CrossRef] [PubMed]
  53. Bruun, E.W.; Ravenni, G.; Müller-Stöver, D.; Petersen, C.T. Small Biochar Particles Added to Coarse Sandy Subsoil Greatly Increase Water Retention and Affect Hydraulic Conductivity. Eur. J. Soil Sci. 2023, 74, e13442. [Google Scholar] [CrossRef]
  54. Ntuli, V.; Hapazari, I. Sustainable Waste Management by Production of Activated Carbon from Agroforestry Residues. S. Afr. J. Sci. 2013, 109, 6. [Google Scholar] [CrossRef]
  55. Rawat, S.; Wang, C.-T.; Lay, C.-H.; Hotha, S.; Bhaskar, T. Sustainable Biochar for Advanced Electrochemical/Energy Storage Applications. J. Energy Storage 2023, 63, 107115. [Google Scholar] [CrossRef]
  56. Feng, D.; Zhao, Y.; Zhang, Y.; Gao, J.; Sun, S. Changes of Biochar Physiochemical Structures during Tar H2O and CO2 Heterogeneous Reforming with Biochar. Fuel Process. Technol. 2017, 165, 72–79. [Google Scholar] [CrossRef]
  57. Zheng, Y.; Chen, K.; Jiang, K.; Zhang, F.; Zhu, G.; Xu, H. Progress of Synthetic Strategies and Properties of Heteroatoms-Doped (N, P, S, O) Carbon Materials for Supercapacitors. J. Energy Storage 2022, 56, 105995. [Google Scholar] [CrossRef]
Figure 1. Wet chemical composition of pine nutshells.
Processes 12 01603 g001
Figure 2. (a) Pyrolytic kinetic model of pine nutshells and (b) thermal degradations of biomass pseudocomponents according to the kinetic model.
Processes 12 01603 g002
Figure 3. Comparison of chemical pine nutshell components (on a dry basis) determined by wet chemical analysis and estimated by kinetic modeling of thermogravimetric analysis.
Processes 12 01603 g003
Figure 4. (a) Thermal degradation of pine nutshells (PNSs) and (b) PNS biochar.
Processes 12 01603 g004
Figure 5. Structure of PNS (left) and PNS biochar (right) particles observed by scanning electron microscopy.
Processes 12 01603 g005
Figure 6. Organic composition of granular and powdered PNS biochars (GCs and PCs) and of the corresponding activated carbons (GACs and PACs).
Processes 12 01603 g006
Figure 7. (a) CV of PAC+AC in aqueous 6 M KOH solution at 5–100 mV s−1 (in 5 mV s−1 increments); (b) capacitance values obtained for each electrode material by integrating the CV area at each scan rate; (c) capacitance for all materials determined from the slope of the Δj/2 vs. scan rate plot; and (d) the galvanic charge–discharge curves of all materials at 0.5 A g−1 in 6 M KOH.
Processes 12 01603 g007aProcesses 12 01603 g007b
Figure 8. Comparison of the capacitance values for each material through Methods 1, 2, and 3 (values for Method 1 were taken at 100 mV s−1 and for Method 3 at 0.5 A g−1).
Processes 12 01603 g008
Table 2. Activation energy and estimated biomass mass ratios of pine nutshells according to a first-order 4-pseudocomponent + charcoal pyrolysis kinetic model.
Kinetic Model ComponentsPS1PS2PS3PS4Charcoal
AssignmentMoistureCelluloseLignin + CutinHemicellulose + ExtractiveResidual Lignin + Ash
k (min−1)0.9900.0350.0210.900
Ea (kJ mol−1)1016519147
Mass ratio (%)437251122
RMSE0.029
Table 3. Composition and fuel properties of PNSs and PNS biochar. VM, volatile matter; FC, fixed carbon; FR, fuel ratio; HHV, higher heating value; Tb, burnout temperature.
Biochar ComponentComposition of PNS (%)Composition of PNS Biochar (%)
Moisture6.0 ± 0.51.1 ± 0.0
Ash1.2 ± 0.45.7 ± 0.5
VM75.1 ± 0.718.9 ± 1.9
FC17.7 ± 0.474.3 ± 2.4
FR0.243.74
Estimated HHV (MJ/kg)20.723.4
Estimated energy densification ratio1.13
Tb (°C)544612
Table 4. Moisture content and water retention capacity of granular and powdered pine nutshell biochars.
BiocharMoisture Content (%)Water Retention (%)
Granular (GC)4.57 ± 0.5536.29 ± 0.05
Powder (PC)3.62 ± 0.1836.49 ± 1.24
Table 5. Nutrients leaching from granular (GC) and powdered pine nutshell biochars (PC).
ComponentConcentration (mg/L)
GCPC
Al0.03 ± 0.010.01 ± 0.01
B0.13 ± 0.010.16 ± 0.01
Ca14.56 ± 0.6217.34 ± 0.97
Cu0.02 ± 0.010.02 ± 0.01
Fe0.05 ± 0.010.04 ± 0.01
K150.55 ± 1.51217.48 ± 4.61
Mg8.59 ± 0.3825.35 ± 1.48
Mn0.12 ± 0.010.25 ± 0.01
Na47.48 ± 1.0849.45 ± 1.50
P9.08 ± 0.2128.98 ± 1.07
Si22.90 ± 0.3336.07 ± 0.78
Sr0.22 ± 0.010.20 ± 0.01
Zn0.03 ± 0.010.03 ± 0.01
Table 6. Comparison of capacitance values for several biochars.
Biochar SourceSurface Area (m2 g−1)Capacitance (F g−1)Source
Pine nutshell46718This work
Banana fiber109774[12]
Tobacco waste1297148[13]
Sisal2289415[14]
Pine nutshell1479241[15]
Pine nutshell956128[16]
Disclaimer/Publisher’s Note: The statements, opinions and data contained in all publications are solely those of the individual author(s) and contributor(s) and not of MDPI and/or the editor(s). MDPI and/or the editor(s) disclaim responsibility for any injury to people or property resulting from any ideas, methods, instructions or products referred to in the content.

