Article

A Comparison of the Effects of Low-Temperature Vacuum Drying and Other Methods on Cauliflower’s Nutritional–Functional Properties

by
Alexis Pasten
1,*,
Antonio Vega-Galvez
1,
Elsa Uribe
1,2,
Manuel Carvajal
1,
Nicol Mejías
1,
Michael Araya
3 and
Maria Gabriela Goñi
4,5
1
Food Engineering Department, Universidad de La Serena, Av. Raúl Bitrán 1305, La Serena 1700000, Chile
2
Instituto Multidisciplinario de Investigación y Postgrado, Universidad de La Serena, Av. Raúl Bitrán 1305, La Serena 1700000, Chile
3
Centro de Investigación y Desarrollo Tecnológico en Algas (CIDTA), Facultad de Ciencias del Mar, Universidad Católica del Norte, Larrondo 1281, Coquimbo 1780000, Chile
4
Grupo de Investigación en Ingeniería en Alimentos, Departamento de Ingeniería Química y Alimentos, Facultad de Ingeniería, Universidad Nacional de Mar del Plata, Mar del Plata 7600, Argentina
5
Consejo Nacional de Investigaciones Científicas y Tecnológicas (CONICET), Ciudad Autónoma de Buenos Aires 1425, Argentina
*
Author to whom correspondence should be addressed.
Processes 2024, 12(8), 1629; https://doi.org/10.3390/pr12081629
Submission received: 11 June 2024 / Revised: 17 July 2024 / Accepted: 26 July 2024 / Published: 2 August 2024
(This article belongs to the Special Issue Advanced Drying Technologies in Food Processing)

Abstract

:
Employing low-temperature drying methods instead of high-temperature methods can help to deal with the challenge of preserving the nutritional and functional qualities of cruciferous vegetables. In the current study, the effects of low-temperature vacuum drying (LTVD), vacuum drying (VD), convective drying (CD), infrared drying (IRD) and vacuum freeze drying (VFD) on the nutrient composition, color, bioactive compounds, and antioxidant and antiproliferative properties of cauliflower were determined. All drying methods significantly affected the color and proximate composition. LTVD stood out against CD and IRD because the samples retained a better total phenolic content (TPC) and antioxidant properties. VFD was the most suitable for preserving the total flavonoid content (TFC) and antiproliferative properties. Meanwhile, VD offered superior retention of the γ-linolenic acid, linoleic acid, TPC and antioxidant properties of the samples. In general, LTVD did not stand out compared to its VFD and VD counterparts, with VD providing the best nutritional–functional properties in cauliflower.

1. Introduction

Cauliflower (Brassica oleraceae L. var. Botrytis Linnaeus), like broccoli and cabbage, belongs to the cruciferous (Brassicaceae) family and is commonly included in diets, both for its nutritional contribution and its sensory attributes [1]. It is a nutrient-rich vegetable containing various types of vitamins, ω-3 fatty acids, dietary fiber, soluble sugars, essential amino acids and a range of minerals [2]. In fact, driven by consumer demand, new colors of cauliflowers (orange, green and purple) have started to appear on the market [3] and are used directly in food as a fresh ingredient, for instance, in salads and soups or as a condiment [4]. However, beyond its nutritional value, this cruciferous vegetable is of special interest due to its diverse biocompounds that are associated with health benefits [5]. Several studies have reported that many chronic diseases such as cancer, hyperglycemia, metabolic disorders, and cardiovascular and neurodegenerative diseases might benefit from an increased intake of phytochemicals [1,6]. Other research reports evidence of the benefits associated with the consumption of polyphenolic compounds, flavonoids, glucosinolates (GSLs) and isothiocyanates (ITCs) from plants [1,2,7,8,9], in addition to their known antioxidant potential due to reducing oxidative damage [10,11,12]. Moreover, these biocompounds are considered chemoprotective compounds against several kinds of cancer [7,13] and their antiproliferative activity is of great interest and should be explored. However, the preservation methods applied to fresh vegetables to reduce spoilage pose a challenge as they can lead to the degradation of these valuable biocompounds. Drying, a common preservation method for vegetables, can be executed through different modes, some aspects of which should be considered. One of them is the temperature, because most of the bioactive and antioxidant compounds are heat-sensitive, and high temperatures could lead to their degradation [14]. Low-temperature vacuum drying (LTVD) is one drying method that is considered non-thermal since the temperature in the drying chamber remains below the typical room temperature and temperatures exceeding the product’s freezing point [15], which provides the possibility of reducing heat abuse and thus preventing the degradation of the thermolabile compounds present in the foods [16]. In addition, the vacuum environment in the process can effectively prevent the oxidation reaction and color deterioration and reduce the loss of bioactive and antioxidant compounds in the food materials [17,18,19,20]. To date, LTVD has been scarcely used in drying food materials due to the lack of equipment and experimental conditions required to optimize such a process; hence, there is a need to carry out this research. In recent years, LTVD has been successfully used in papaya [18,19,20], banana [17], potatoes [14], broad beans [15] and bee honey [16]. However, the application of drying technology in the dehydration of cruciferous vegetables is still relatively rare. Vega-Galvez et al. [21] and Mejias et al. [22] reported the effect of LTVD on bioactive compounds and the health-promoting properties of broccoli and red cabbage, respectively, and demonstrated that LTVD caused the higher retention of some heat-sensitive bioactive compounds and a higher antiproliferative effect when compared with other methods. Regrettably, the effect of different drying methods on the nutrient composition, bioactive compounds and antiproliferative potential of cauliflower is still unclear. Therefore, it is necessary to study the effects of different drying methods on multiple qualities of cauliflower to provide more choices and references for their processing. The effects of VD, CD, IRD, LTVD and VFD on the nutritional and color parameters and on the bioactive compounds with antioxidant and antiproliferative properties in cauliflower (Brassica oleracea var. botrytis Linnaeus) were investigated in this study.

2. Materials and Methods

2.1. Preparation of Study Materials and Drying Procedure

Cauliflower (Brassica oleracea var. botrytis Linnaeus) was purchased from Palos Negros farming, Coquimbo Region, Chile. Various cauliflowers were cut into small florets after removing the leaves and stems. Subsequently, the small florets were immersed in boiling water for 30 s and then rapidly chilled in an ice–water mixture. The samples were centrifuged in a vegetable centrifuge to remove the excess water after cooling. Finally, a well-mixed batch of the florets (2.5 kg) was divided into five portions before drying. Each portion was then subjected to one of the following drying processes: (a) LTVD at 20 °C and a vacuum pressure of 1 kPa (Memmert, model VOcool 400, Schwabach, Germany); (b) VD at 60 °C where the vacuum was kept at 10 kPa (Memmert, model VO 400, Schwabach, Germany); (c) CD at 60 °C and a constant air flow rate of 1.5 ± 0.2 m/s; (d) IRD at a fixed temperature and irradiation distance of 60 °C and 15 cm, respectively, with two 175 W infrared emitters; and (e) VFD with a condenser temperature of −60 °C and a vacuum pressure of 0.027 kPa (AdVantage Plus, Gardiner, NY, USA). The drying times are shown in Figure 1. After the end of the drying process, the samples obtained by the different drying methods were ground into powder and sieved through a 1.00 mm mesh sieve. The previous process was repeated until 120 g of powder was obtained for each drying method and then sealed separately in plastic bags.

2.2. Determination of Drying Parameters

The moisture content at different intervals was determined as follows:
M t = m t m d m d
where Mt: dry base moisture content at time t; mt mass of cauliflower at time t, [g]; and md: dry weight of cauliflower, [g].
The moisture ratio (MR) was calculated as follows:
M R = M t M 0
where M0: initial dry base moisture content.

2.3. Determination of Nutritional Parameters

The proximate composition was evaluated in cauliflower, including the moisture content, fat, ash, protein and fiber [23]. The water activity was also evaluated in all samples. The fatty acid methyl esters (FAMEs) of dried cauliflower were prepared as described in a previous study [21]. The identification and quantitative analysis of fatty acids were performed on a Clarus 600 FID model, (PerkinElmer, Waltham, MA, USA) consisting of a flame ionization detector (FID) and capillary column (30 m × 0.320 mm × 0.25 μm, Supelco, St. Louis, MO, USA). The carrier gas used was nitrogen, and the total flow rate was set at 1.0 mL/min. The injection block and detector temperatures were maintained at 260 °C. The column temperature was initially set to 120 °C for 5 min, then increased at a rate of 4 °C per min until it reached 240 °C, where it was held for 25 min.

2.4. Determination of Color Parameters

A HunterLab precision colorimeter (MiniScan™ XE-Plus, Reston, VA, USA) was used to measure color changes. The illuminant mode and an observer angle were set at D65 and 10°, respectively. The chromatic parameters were calculated following Equations (3)–(5).
Δ E = ( L 0 * L * ) 2 + ( a 0 * a * ) 2 + ( b 0 * b * ) 2
C * = a * 2 + b * 2
h * = t a n 1 b * a *
where ΔE is the total color change; a*, b* and L* are the parameters of color measurement; L0, a0 and b0 are the control measured values in fresh sample (L0* = 70.48 ± 0.33, a0* = −3.68 ± 0.20, b0* = 19.74 ± 0.30); and C* (chroma) and h* (hue angle) are polar coordinates.

2.5. Extraction Procedure for Antioxidant Compounds

A dried sample (2 g) was mixed with 10 mL of 80% methanol and stirred for 1 h, then centrifuged at 4193× g for 20 min at 4 °C. The resulting supernatant was filtered through a Whatman #1 filter. In parallel, the residue was re-extracted twice using the same procedure, and all three filtrates were combined and evaporated under vacuum in a multi-vapor at 40 °C. The extract was lyophilized and subsequently dissolved in 5 mL of 80% methanol for analysis.

2.6. Determination of Total Phenolic and Flavonoid Contents

The total phenolic content of the cauliflower extracts was measured by using the Folin–Ciocalteu method described by Mejías et al. [22]. After adding 100 μL of Folin–Ciocalteu reagent (0.2 N) and 100 μL of Na2CO3 (60 mg/mL) to 15 μL of each extract placed into polystyrene microplates (OptiPlate™-96 F HB, PerkinElmer, Turku, Finland), the mixture was stored without light for 90 min. Then, the absorbance was read at 750 nm using a Victor™χ3 Multilabel Plate Reader (PerkinElmer, Turku, Finland). The results are shown as mg gallic acid equivalent (GAE)/g of d.m. On the other hand, to determine the total flavonoid content of the cauliflower extracts, an aliquot of each extract and ddH2O (2.5 mL) were mixed with 0.15 mL of NaNO2, 0.15 mL of AlCl3, and 1 mL of NaOH, with pre-established intervals of 5 and 6 min between the addition of reagents. Finally, the mixture was diluted with 1.2 mL of ddH2O. The absorbance of the mixture was read at 415 nm using a spectrophotometer. The results are expressed as mg quercetin equivalent (QE)/g d.m. [24].

2.7. Determination of Antioxidant Potential by Two Assays

The traditional DPPH methodology [25] measures the final absorbance at 515 nm after a reaction time of 30 min between the stable DPPH radical, which has a deep purple color, and the antioxidant extract, which leads to a loss of color. Assays were carried out in 96-well polystyrene microplates and the absorbance was read using a Victor™χ3 Multilabel Plate Reader. In the ORAC assay [26], radicals (R•) are produced by heating an azide compound, leading to the rapid formation of reactive peroxyl radicals (ROO•) in the presence of oxygen. The fluorescence intensity was measured every minute using a Victor™χ3 fluorescence plate reader at 37 °C (excitation: 485 nm; emission: 535 nm) until the reading decreased. The area under the curves (AUCs) for the test samples must be compared to the AUCs from Trolox standards. The results of both antioxidant assays were reported as Trolox equivalents.

2.8. Determination of Antiproliferative Potential

The lung carcinoma A549 (ATCC no. CCL-185) cell line was maintained in a standard RPMI-1640 medium (Hyclone, Logan, UT, USA) with the addition of 10% (v/v) fetal bovine serum (FBS, Hyclone, Logan, UT, USA) and 1% streptomycin–penicillin. The cell line was kept at 37 °C in a humidified atmosphere with 5% CO2 between each experiment.
The cells were plated onto 96-well cell culture plates at a density of 1 × 10⁵ cells per well and incubated under standard conditions until they reached exponential growth. Subsequently, the cells were exposed to various concentrations (5, 10, 20 and 40 mg/mL) of extracts previously reconstituted in RPMI-medium and filtered on 0.22 micron filters. At the end of the incubating time (48 h), 100 µL of propidium iodide (PI) was added to each well and incubated for a further 10 min. The fluorescence was measured using an automated microtiter plate reader (TECAN Infinite M Nano+, Maennedorf, Switzerland) with an excitation wave of 530 nm and an emission wave of 620 nm. RPMI-1640 medium was used as the negative control, while 50% DMSO (v/v) was used as the positive control.

2.9. Statistical Analyses

Analyses of the nutritional parameters, bioactive compound content, and antioxidant properties of cauliflower were performed in triplicates, whereas six measurements were carried out for the color parameters, and the results were expressed as mean ± standard deviation [SD]. All data were analyzed using Analysis of Variance (ANOVA) in the statistical software Statgraphics Centurion Version 18.1.12 (Statgraphics Technologies, Inc., The Plains, VA, USA). A one-way ANOVA was used to compare the means of all analyzed variables among the drying methods. The means were separated using Duncan’s multiple range test and their statistical significance was determined at the 5% (p < 0.05) level. For antiproliferative properties, three independent assays were performed in triplicate, and the results were expressed as hte percentage of cell viability (mean ± standard error of the mean [SEM]). GraphPad Prism 8.0.2 software was used to compute the IC50 values by non-linear regression.

3. Results and Discussion

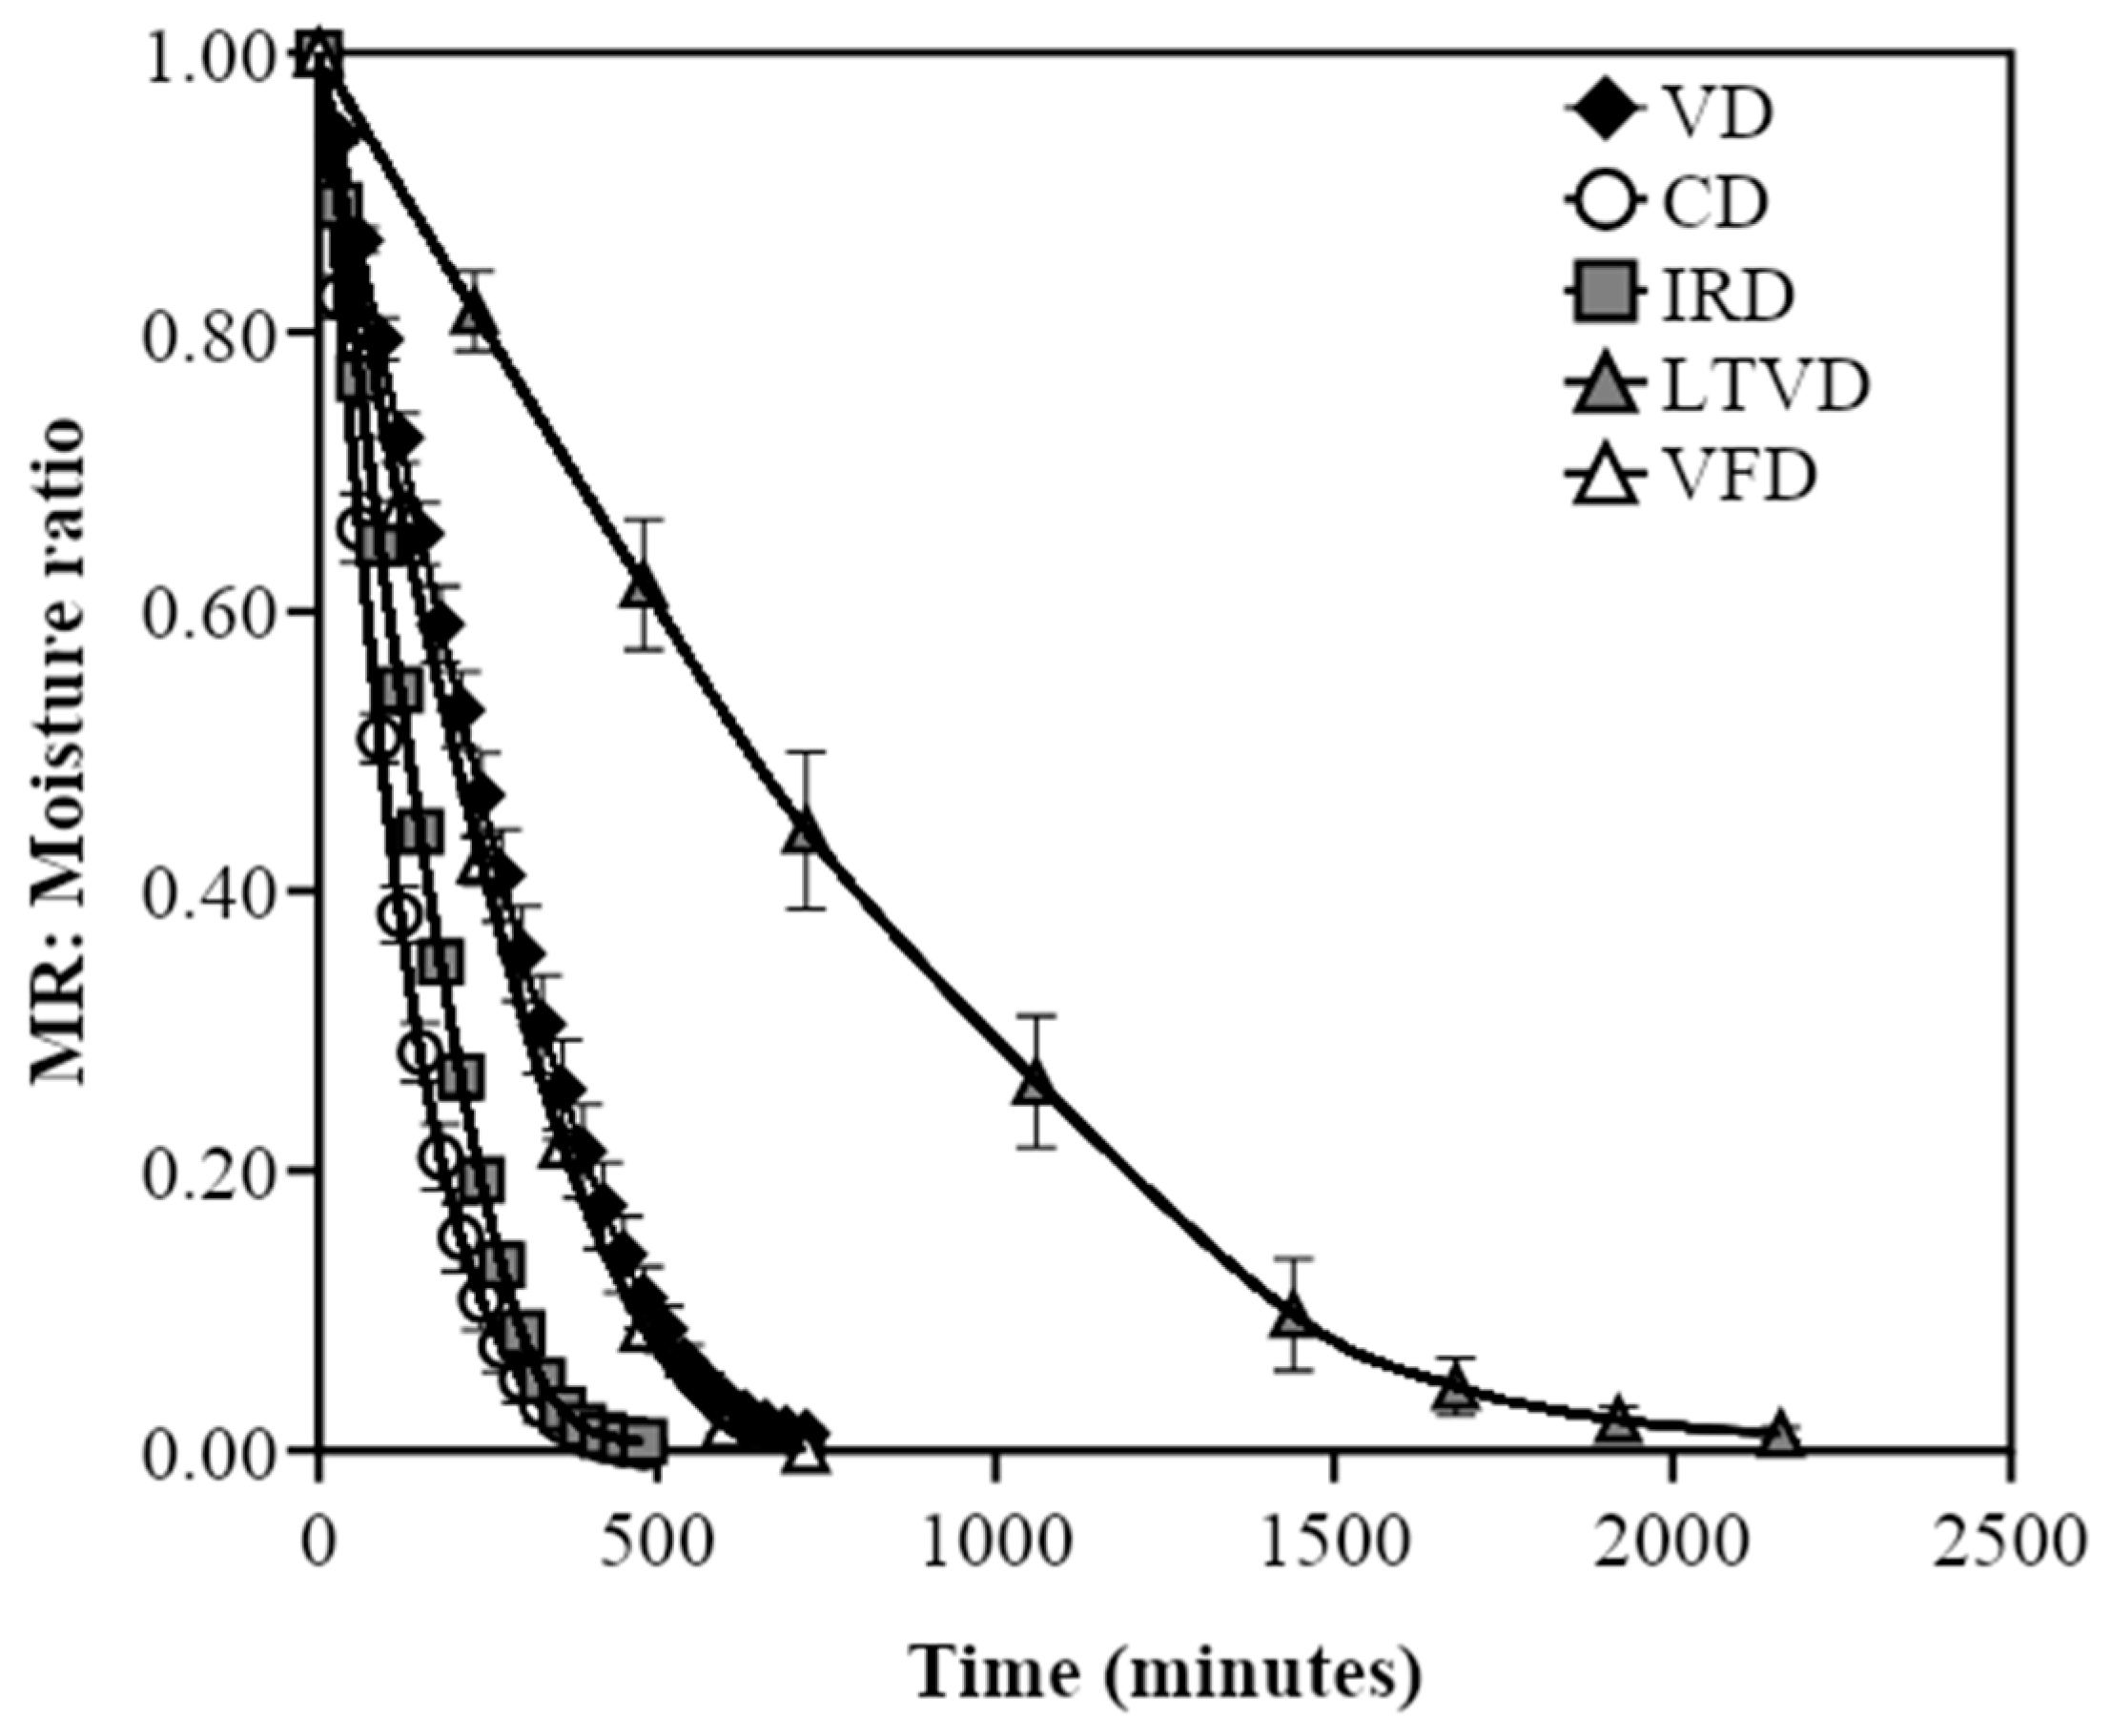
3.1. Comparative Characteristics in Dried Cauliflower

The properties of the dried cauliflower prepared using different methodologies were evaluated and the results are presented for discussion. The moisture ratio (MR) vs. time for each drying method is presented in Figure 1.
Depending on the methodology employed, different drying times are needed to reach the equilibrium moisture content. CD and IRD at 60°C were the methodologies with the lowest time needed, with only 8 h, followed by VD and VFD (12 h). As LTVD has similar operation conditions to VD and VFD [27], the MR value obtained was only slightly superior. This could be explained by the fact that under vacuum conditions, the equilibrium moisture content depends mainly on the total pressure and temperature [28].
It was likely that the temperature/vacuum ratio used in LTVD (20 °C and 1 kPa) was below the activation energy threshold required for bulk evaporation [29], restricting the outwards migration of the water inside cauliflower. In fact, to allow sublimation in VFD, a large amount of energy is required to maintain a high vacuum level (0.027 kPa) and remove bound water [30]. Therefore, achieving a vacuum pressure as low as that used in VFD might be necessary to enhance the efficiency of LTVD [19]. Instead, the temperature and vacuum ratio used in the VD method (60 °C and 10 kPa) could increase the difference between the drying temperature and saturated vapor temperature, facilitating the evaporation of water from cauliflower due to a vigorous near-boiling state [31,32]. However, it should be considered that some heat-sensible compounds in cauliflower might be damaged. Therefore, future research should focus on combining LTVD with pre-treatment techniques to improve the drying rate of vegetables and safeguard heat-sensitive compounds.

3.2. Nutritional Parameters of Dried Cauliflower

Cauliflower is known for its nutritional value and is often included in healthy diets. Therefore, a comprehensive description of its composition is always useful, especially if a process like drying has been applied. Fresh cauliflower showed an elevated moisture content and water activity (aw), which agrees well with other authors [1,33,34,35,36]. A moisture content over 90% and an aw close to 0.99 are expected in a highly perishable vegetable such as cauliflower, sustaining the claim of drying as an effective preservation technique [35]. All drying methods here were able to significantly reduce the moisture content (p < 0.05), where the samples produced by CD and VFD presented the lowest moisture contents, with a mean value of 8.98 g/100 g. These results are consistent with the lower values of aw for the VFD and CD samples, with values below and slightly over 0.3, respectively. On the other hand, both the IRD, LTVD and VD samples presented a higher moisture content, all samples had values over 10 g/100 g, and the aw showed the same trend, with values close to 0.4 (Table 1). Although aw is often known as an indicator of microbial spoilage, in cruciferous vegetables, it may also indicate the possible activity of the myrosinase enzyme [37]. As we report in Table 1, all dried samples reached values far below the limits of microbial growth (aw < 0.6), and those aw below 0.4 may hinder the activity of myrosinase and decrease its ability to degrade glucosinolates [37,38].
The ash content of the dried samples was similar to fresh cauliflower (12.06 g/100 g d.m.), except for CD, which presented a significantly lower value (10% reduction; p < 0.05). These values agree with those reported by previous authors [1,39,40]. Brassica plants have been known to have high levels of minerals, including Ca, Cu, Fe, K and Na, with a remarkably good bioavailability of Ca [13,41]. Therefore, it is a promising result that the ash value is maintained after drying.
The fiber content in fresh cauliflower was 13.65 g/100 g d.m. similar to the results obtained by Ahmed and Ali [1] and Ali [39]. No significant variation (p > 0.05) was noted between the fiber content of the fresh sample and its respective dried samples by VD, IRD and LTVD. Only the crude fiber content when CD and VFD were used was significantly lower (with an average value of 9.91 g/100 g d.m., which represents a reduction of 23% compared to the rest of the samples), probably due to the degradation or solubilization of pectin or other fiber components, such as cellulose or hemicelluloses [42].
Regarding the protein content in the fresh cauliflower (24.71 g/100 g d.m.) and that subjected to VD, IRD, LTVD and VFD, a result without major differences was obtained (p > 0.05), with an average value of 25.01 g/100 g d.m. This is only significantly different from the values obtained for the protein content when CD was used (with a value of 21.79 g/100 g d.m., which represents a 13% reduction). These results are similar to those reported in previous works [1,39,40]. The exposure to heat and air in CD may lead to changes in the molecular structure of proteins [43], as well as modifications in its composition of amino acids.
The fat content in fresh cauliflower was 0.88 g/100 g d.m., a value that is lower than the 1.79, 1.94 and 2.20 g/100 g d.m. reported by other authors [1,39,40]. Regarding dried samples, a significantly higher value (p < 0.05) was observed for VFD compared to the others, with an increase of 40% compared to VD, LTVD and IRD; this value was 24% for the case in which CD was used, probably because during VFD, the cell wall undergoes permanent changes in porosity, which facilitates solvent penetration and increases the lipid extraction efficiency [44]. As can be seen, there is a rather low amount of fat in cauliflower, but its oxidation could lead to the formation of off-flavors and affect the nutritional value of the product [45]. As shown in Table 1, dried cauliflower contained a high degree of PUFAs (mainly γ-linolenic acid and linoleic acid), which comprised between 67 to 75% of the total fatty acids, thereby making dried cauliflower highly susceptible to oxidation. Meanwhile, the main SFA was palmitic acid (C16:0), ranging from 17.74 to 19.08 g/100 g of Fatty Acid Methyl Ester Standard (FAMES). This result agrees with Scalzo et al. [46]. It is necessary to mention the presence of a peak in the MUFAs quantification chromatogram that could not be identified with the commonly used standards; however, because it represents a considerable amount, it was included as “unidentified MUFA” in Table 1 and considered in the sum of the different fractions. Only in VD samples was this peak not detected, which resulted in an increase in the PUFA content by 10% in that sample, probably being more prone to oxidation and degradation during storage [46]. Nonetheless, a former study affirmed that protein oxidation is more important than lipid oxidation in determining the shelf-life of dried cauliflower [45].

3.3. Color Parameters of Dried Cauliflower

Color is always an important characteristic to evaluate in vegetables, especially after drying due to expected changes in these parameters. The color parameters of the fresh and dried cauliflower samples were measured, and the results obtained are shown in Table 2.
Compared with fresh cauliflower, the value of L* after drying was significantly increased (p < 0.05), which is in agreement with Aksüt and Polatci [47]. In addition, the Chroma value for fresh cauliflower was 20.09 and the Hue was 100.6°, which suggests a light-pale-yellow color (Hue = 0° is red, Hue = 90° is yellow, Hue = 180° is green, [48]). These results are similar to those reported by Nasrin et al. [2] and Hodges et al. [48]. Significant differences were found among treatments for all samples (p < 0.05), but VFD presented a higher change in color, with an ΔE of 20.87. This is supported by the increase in L* and Hue, plus the reduction in b* and Chroma, meaning that there was a lighter overall color and less yellow. The VD and LTVD samples also presented a significant change in color in the fresh samples, with a ΔE of 14.48 and 12.61, respectively, due to an increase in the L*, a* and b* parameters, with a Hue value close to 90° that resulted in a darker yellow color, with a hint of red (a* was negative in Fresh samples and positive in these samples) [49]. However, VD led to a significant increase (p < 0.05) in the saturation that was not present in LTVD (Chroma value of 30.82 and 19.19, respectively). CD and IRD also led to higher values of L*, meaning an increase in luminosity, but showed differences in the a* and b* parameters, both with fresh cauliflower and between them. Meanwhile, CD presented a slight increase in a* and b*, which resulted in a moderate ΔE and a reduction in Hue (more yellow); no difference was found in Chroma with respect to fresh cauliflower (p > 0.05). The CD samples were able to maintain the pale-yellow color of fresh cauliflower. On the other hand, IRD presented a significant increase (p < 0.05) in both a* and b* that made more noticeable the presence of a red tint among the yellow, supported by the increment in Chroma and the reduction in Hue (red is indicated by 0° according to [48]).

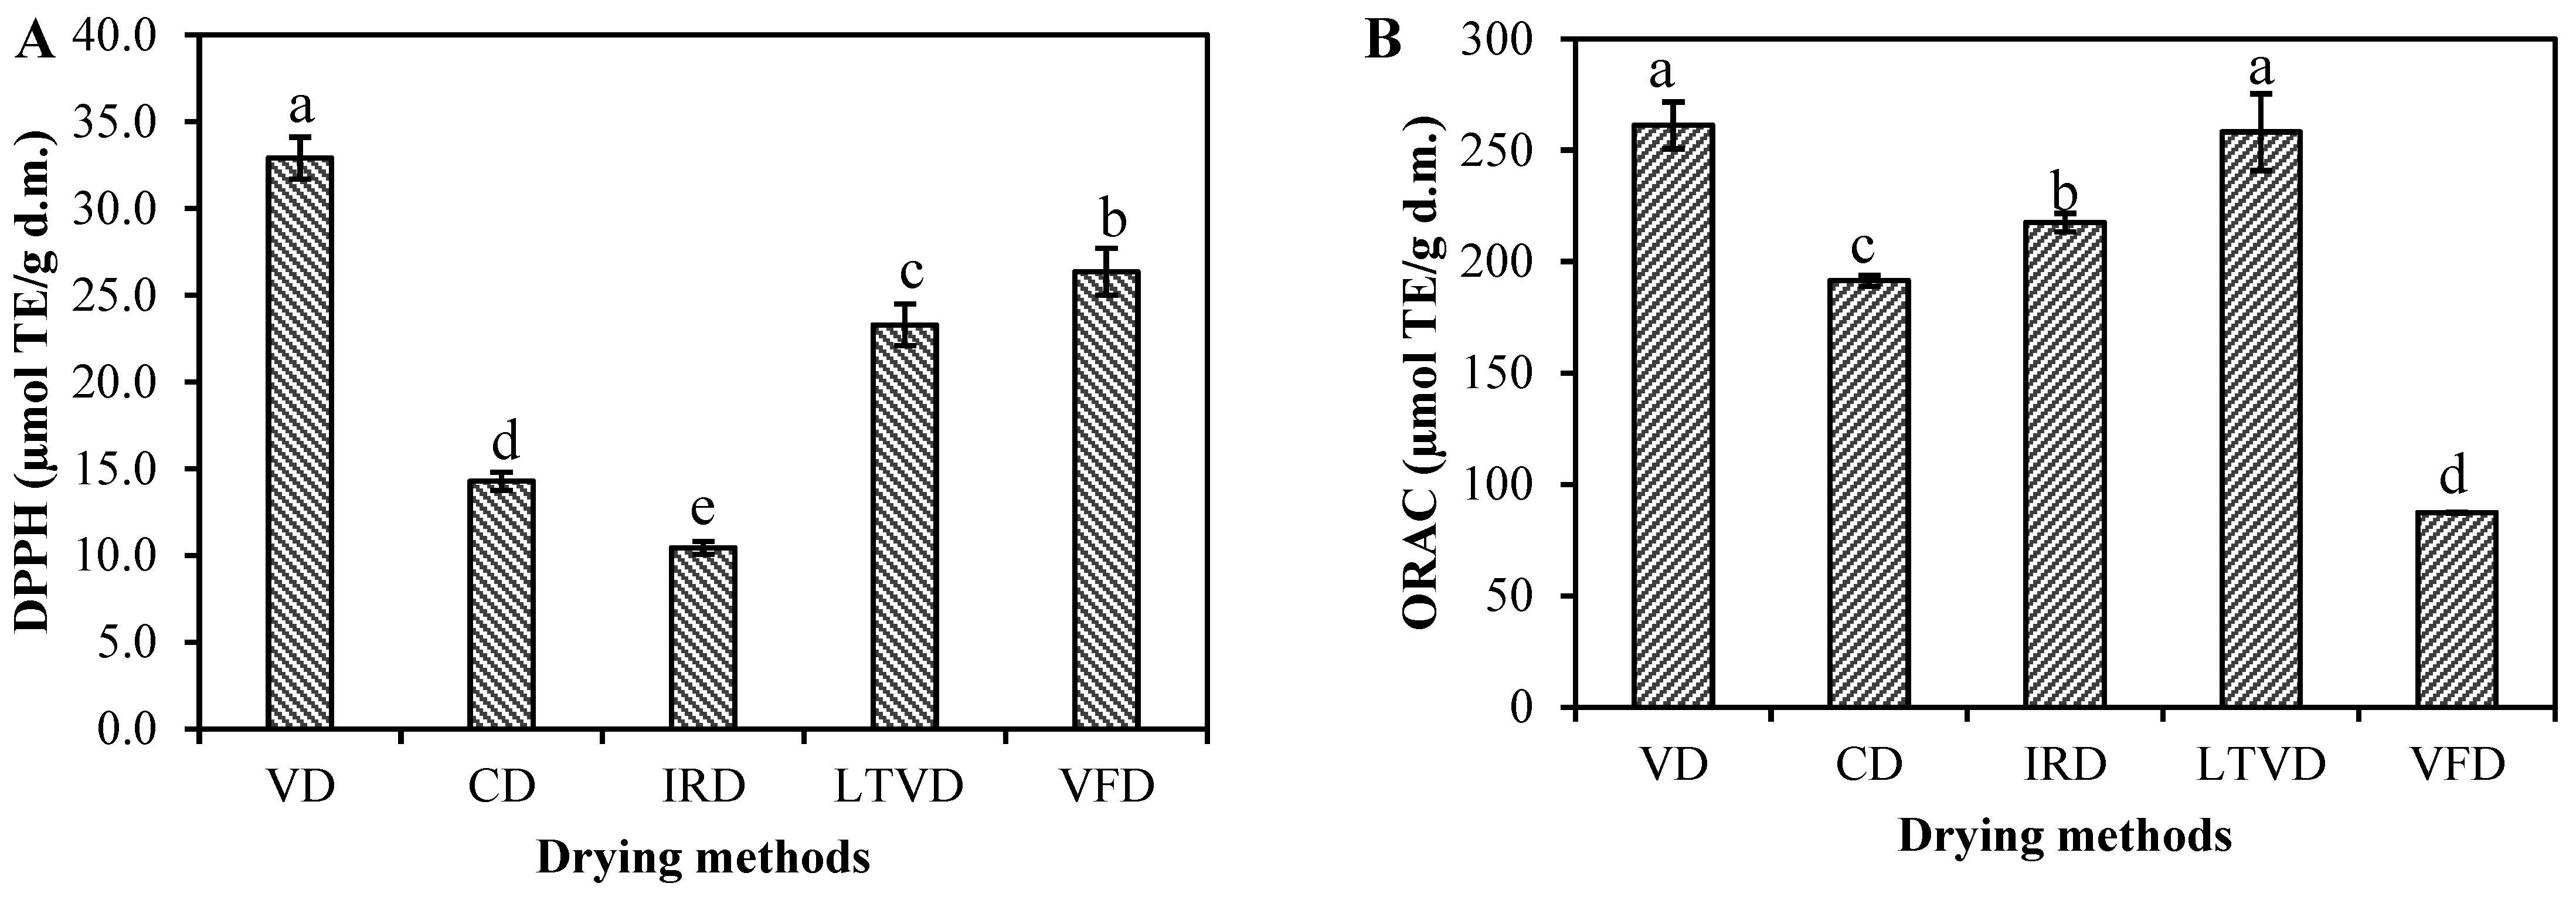
3.4. Antioxidant Potential of Dried Cauliflower

In this study, the antioxidant potential of dried cauliflower was measured in terms of the DPPH radical scavenging activity and oxygen radical absorbance capacity (ORAC), along with the quantification of the total polyphenol content (TPC) and total flavonoid content (TFC). The results obtained are shown in Figure 2.
As shown in Figure 2A for the DDPH scavenging activity, the highest scavenging was found in VD at 32.89 μmol TE/g d.m., while the IRD had a lower scavenging effect (10.44 μmol TE/g d.m.). Despite cauliflower dried by VD also having the highest value in the ORAC assay (Figure 2B; 261.18 μmol TE/g d.m.), the smallest value was obtained in the VFD sample (87.32 μmol TE/100 g dm). These results would indicate that the complex system formed by numerous antioxidant compounds generates a different response when quantifying the antioxidant potential using the different assays employed, since the radical quenching capability varies in each assay.
It is well known that polyphenols have a direct impact on the antioxidant potential, depending on the number and position of phenolic hydroxyl groups that can dispel free radicals [50]. Previous studies on cauliflower have shown that the DPPH radical scavenging activity is strongly correlated with the TPC [5,41,51,52]. According to Figure 2C, the TPC of dried cauliflower when using different methods was quantified within the range of 3.51 to 6.09 mg GAE/g d.m., exhibiting a similar overall trend than DPPH. In fact, the Pearson’s correlation coefficient between the antioxidant activity measured by the DPPH assay and the TPC was highly significant (r = 0.888). This was supported by Picchi et al. [51], who showed that the TPC of Emeraude and Magnifico cauliflower grown with different methods was primarily responsible for the antioxidant capacity obtained from the DPPH test (correlation coefficient of linear regression, r = 0.860). We also detected a positive correlation between the TPC and antioxidant capacity measured by the ORAC assay, with a correlation coefficient of r = 0.407.
Regarding the effect of drying on the TPC of cauliflower, our findings revealed that a hypoxic environment during VD, LTVD and VFD was conducive to maintaining the polyphenols. In fact, vacuum and higher-temperature conditions in VD could effectively reduce the activities of polyphenol oxidase and degrading enzymes [53]. This would explain the higher TPC value in VD compared to LTVD and VFD (Figure 2C).
Figure 2D illustrates that the TFC ranged from 1.03 to 1.54 mg QE/g d.m., in which the VFD sample showed a significantly higher value among all dried samples (p < 0.05). The use of a temperature of 60 °C in CD, VD and IRD contributed to obtaining a dried sample with a lower TFC compared to the VFD method, probably because the flavonoids react with oxidase at higher temperatures [37]. Regarding the LTVD method, though it was set at 20 °C, the prolonged drying time could have contributed to the degradation of flavonoids. In fact, when the TFC was correlated with the antioxidant potential assays, a low positive correlation coefficient was observed with the DPPH assay (r = 0.372), while it was negatively correlated with the ORAC assay (r = −0.829), suggesting that the flavonoids present in the dried cauliflower contributed to the antioxidant potential to a lesser extent than polyphenols. These results are consistent with Bhandari and Kwak [52] who reported the lower contribution of the TFC (r = 0.456) to the antioxidant activity (DPPH) of cauliflower, with TPC being the major contributor (r = 0.698).

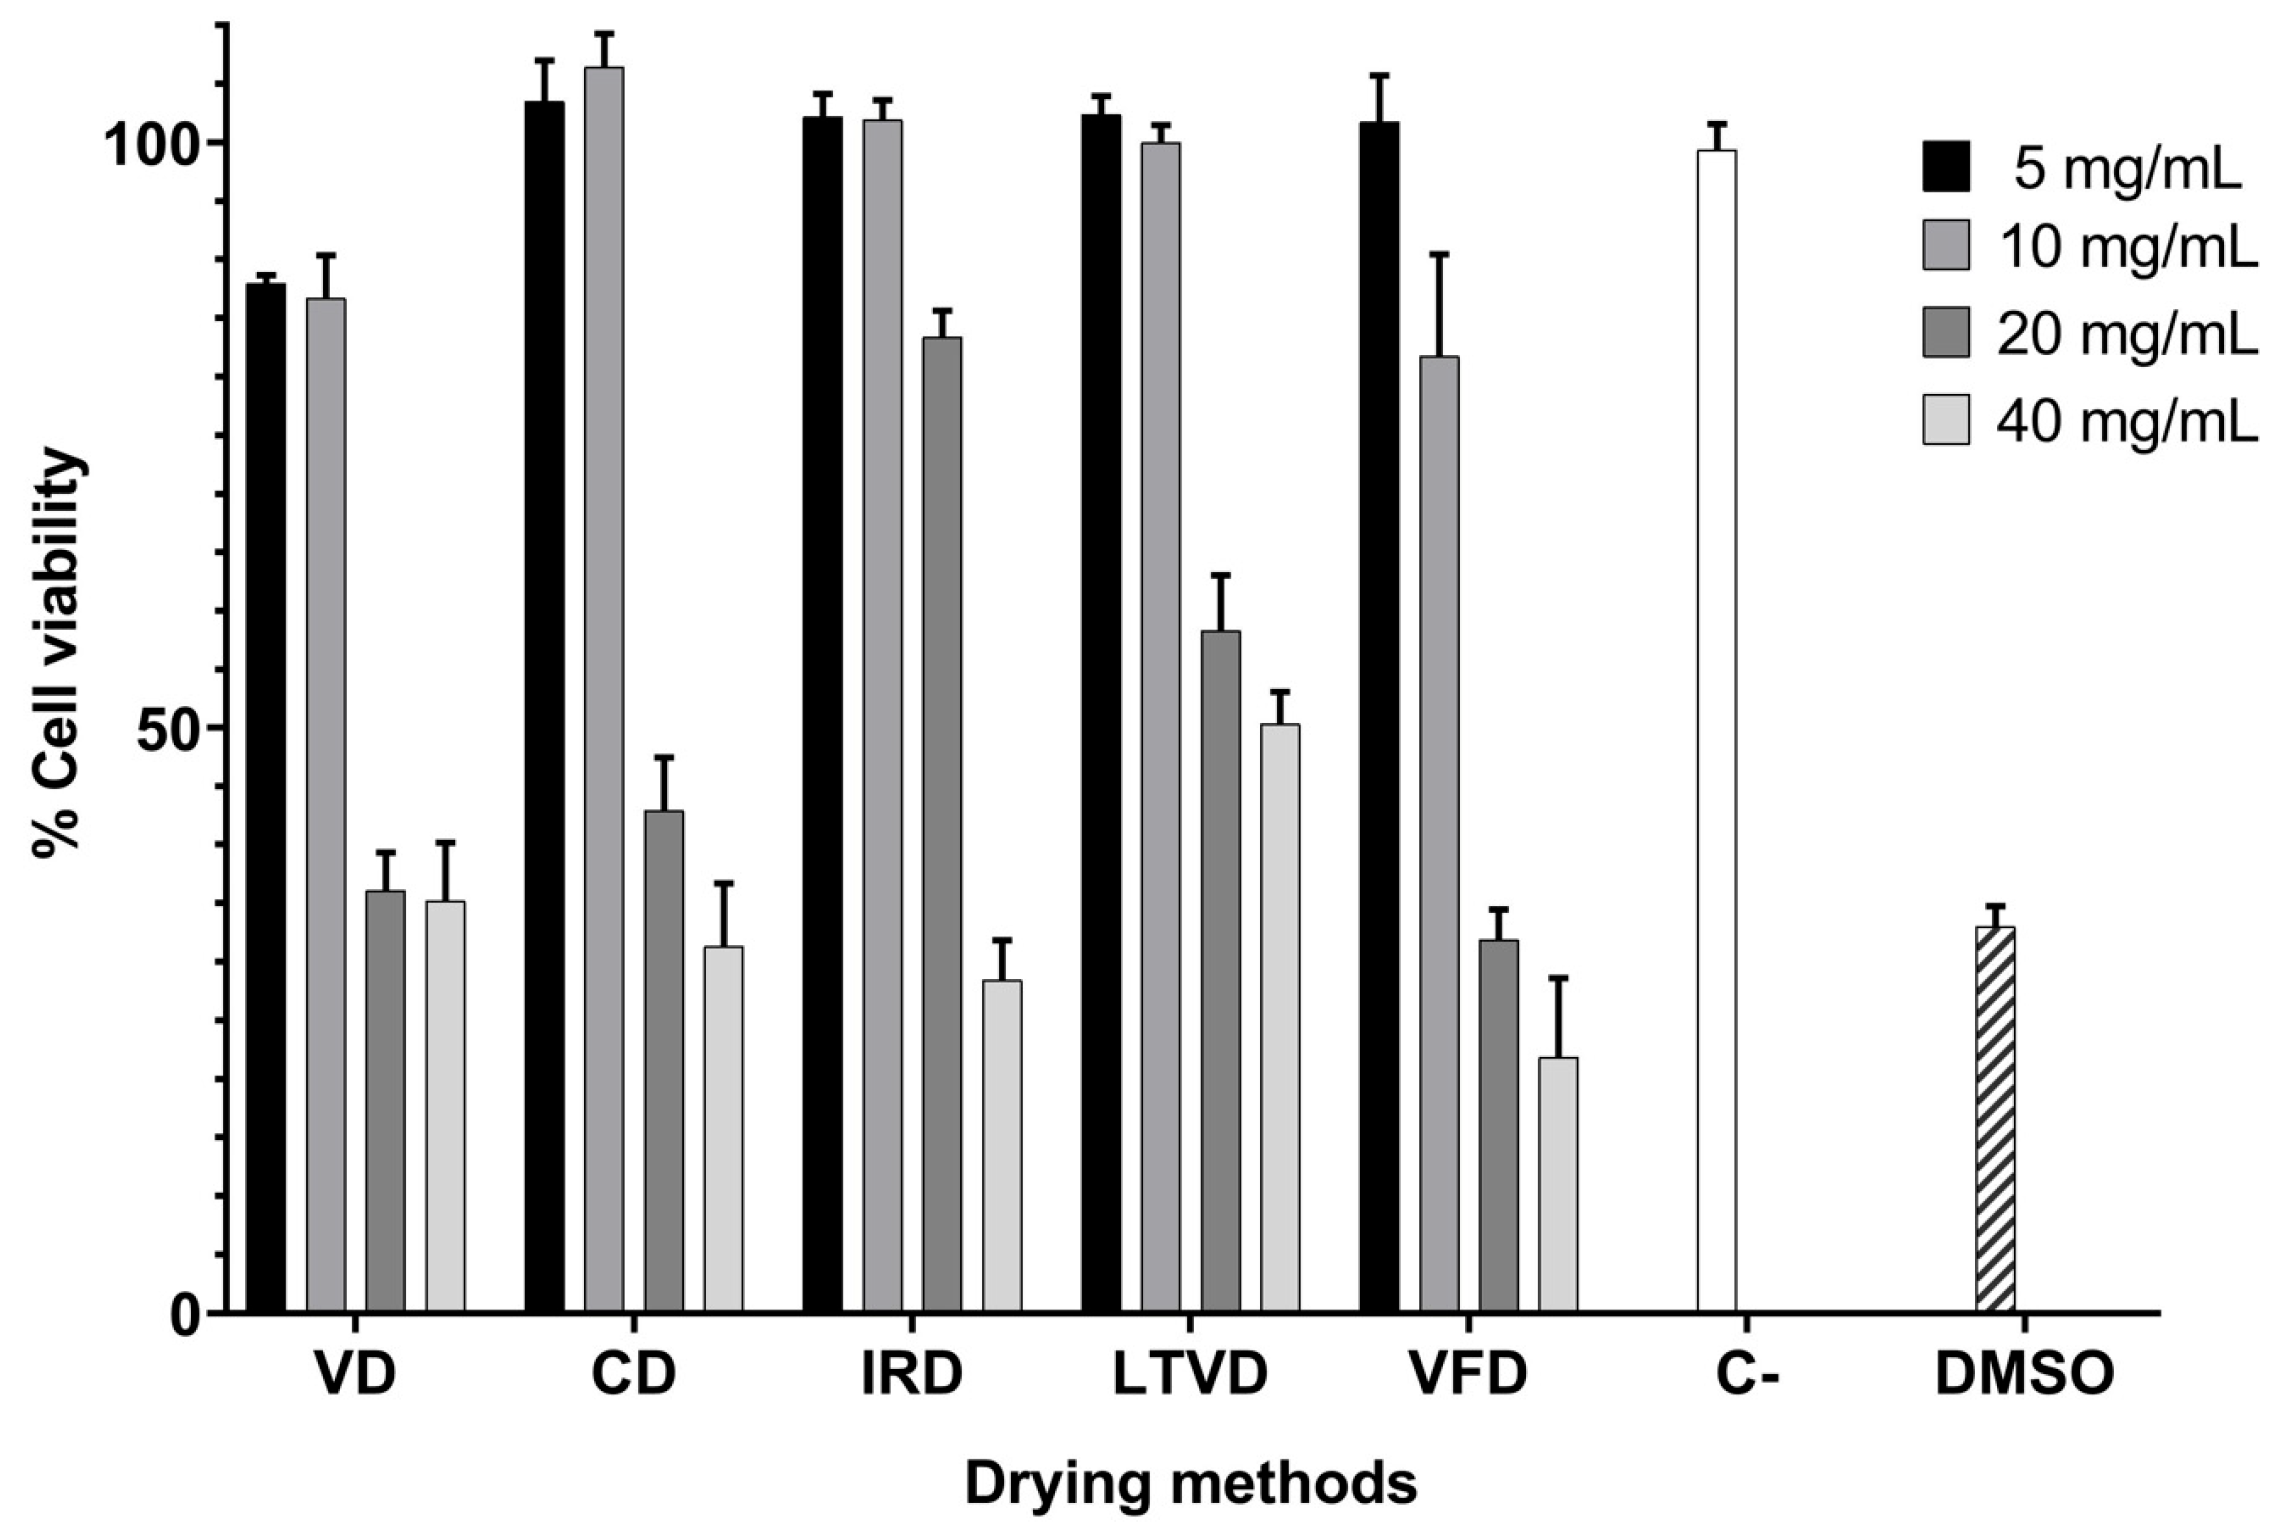
3.5. Antiproliferative Potential of Dried Cauliflower

It is generally assumed that a better evaluation of the global anticancer potential of a vegetable could be performed by measuring both its antioxidant and antiproliferative potential due to these parameters being involved in different mechanisms of chemoprevention [54]. Here, we used the propidium iodide (IP) assay at 48 h to evaluate the cell viability and IC50 values in lung cancer cells (A549), in which we used cauliflower extracts obtained from dried material using different methods. Figure 3 indicates that the cell viability of the A549 cells with different extract concentrations assayed was decreased when the extracts concentrations were 20 and 40 mg/mL in a dose-dependent manner.
Specifically, with the 40 mg/mL extract, the results showed between 50% and 78% inhibition, with VFD showing the most effective inhibition against A549 cells. These results agreed with those from the study of Zafar et al. [55], who showed 54.12% inhibition for a 40 mg/mL extract obtained from dried cauliflower under shade at room temperature against the same lung cancer cell line. In terms of IC50 values, VFD showed a strong antiproliferative effect, with an IC50 value of 17.26 mg/mL, followed by VD and CD, with values of 20.47 and 23.45 mg/mL, respectively. The highest values in both drying treatment groups were found in IRD (31.13 mg/mL) and LTVD (34.95 mg/mL), implying a weaker effect against human A549 cells.
According to the above findings, our study indicated that the inhibition percentages of cancer cells were more correlated with TFC (r = 0.4435) than TPC (r = −0.2890). The chemopreventive effects of some flavonoids may arise from their ability to interact with protein kinase and lipid kinase signaling pathways, thereby influencing various cellular functions [56]. However, it is worth mentioning that the antiproliferative potential of these compounds needs to be addressed from a more holistic perspective by considering also other compounds of cauliflower. In fact, the scarce literature to date indicates that the antiproliferative activity of cauliflower might be related to the presence of organic-sulfur-containing compounds and isothiocyanates [55,57,58]. Therefore, such compounds should be studied more thoroughly in the future to elucidate the antiproliferative effect of cauliflower extracts obtained from dried material.

4. Conclusions

The present data demonstrated that VFD provided a lighter overall color and was successful in retaining the maximum flavonoid content in cauliflower. Additionally, it effectively inhibited lung carcinoma A549 cells. However, the use of VD is recommended for preserving the highest levels of fatty acids such as γ-linolenic acid and linoleic acid. In addition, the TPC and antioxidant properties were also enhanced in VD. This study provides an initial exploration of the application of LTVD in cauliflower and is only recommended over the CD and IRD methods. Future efforts should focus on identifying specific thermosensitive compounds in cauliflower to better evaluate the effectiveness of LTVD compared to conventional drying methods.

Author Contributions

Writing—review and editing, Supervision, A.P.; Conceptualization, Project administration, Resources, Funding acquisition, A.V.-G.; Supervision, Validation, E.U.; Investigation, Formal Analysis, M.C.; Formal Analysis, N.M.; Investigation, Validation, Formal Analysis, M.A.; Writing—original draft, M.G.G. All authors have read and agreed to the published version of the manuscript.

Funding

This research was supported by the National Agency of Research and Development, ANID-Chile, through funds provided to the Project FONDECYT 1210124.

Data Availability Statement

The datasets generated for this work are available upon request from the corresponding author.

Conflicts of Interest

The authors state that they have no known financial conflicts of interest or personal relationships that could have influenced the work reported in this article.

References

  1. Ahmed, F.A.; Ali, R.F.M. Bioactive compounds and antioxidant activity of fresh and processed white cauliflower. Biomed. Res. Int. 2013, 2013, 367819. [Google Scholar] [CrossRef] [PubMed]
  2. Nasrin, T.A.A.; Yasmin, L.; Arfin, M.S.; Rahman, A.; Molla, M.M.; Sabuz, A.A.; Afroz, M. Preservation of postharvest quality of fresh cut cauliflower through simple and easy packaging techniques. Appl. Food Res. 2022, 2, 100125. [Google Scholar] [CrossRef]
  3. Nartea, A.; Fanesi, B.; Pacetti, D.; Lenti, L.; Fiorini, D.; Lucci, P.; Frega, N.G.; Falcone, P.M. Cauliflower by-products as functional ingredient in bakery foods: Fortification of pizza with glucosinolates, carotenoids and phytosterols. Curr. Res. Food Sci. 2023, 6, 100437. [Google Scholar] [CrossRef] [PubMed]
  4. Gupta, M.K.; Sehgal, V.K.; Arora, S. Optimization of drying process parameters for cauliflower drying. J. Food Sci. Technol. 2013, 50, 62–69. [Google Scholar] [CrossRef] [PubMed]
  5. Vaishnav, J.; Srivastava, A.K.; Mishra, B.B.; Suprasanna, P.; Variyar, P.S. Glucosinolates breakdown and enhanced nitrile formation in gamma irradiated minimally processed cauliflower (Brassica oleracia). Radiat. Phys. Chem. 2023, 205, 110672. [Google Scholar] [CrossRef]
  6. Purohit, S.R.; Rana, S.S.; Idrishi, R.; Sharma, V.; Ghosh, P. A review on nutritional, bioactive, toxicological properties and preservation of edible flowers. Future Foods 2021, 4, 100078. [Google Scholar] [CrossRef]
  7. Vallejo, F.; Tomás-Barberán, F.A.; García-Viguera, C. Glucosinolates and vitamin C content in edible parts of broccoli florets after domestic cooking. Eur. Food Res. Technol. 2002, 215, 310–316. [Google Scholar]
  8. Llorach, R.; Espín, J.C.; Tomás-Barberán, F.A.; Ferreres, F. Valorization of cauliflower (Brassica oleracea L. var. botrytis) by-products as a source of antioxidant phenolics. J. Agric. Food Chem. 2003, 51, 2181–2187. [Google Scholar] [CrossRef] [PubMed]
  9. Bidchol, A.M.; Wilfred, A.; Abhijna, P.; Harish, R. Free radical scavenging activity of aqueous and ethanolic extract of Brassica oleracea L. var. italica. Food Bioprocess Technol. 2011, 4, 1137–1143. [Google Scholar] [CrossRef]
  10. Podsędek, A. Natural antioxidants and antioxidant capacity of Brassica vegetables: A review. LWT-Food Sci. Technol. 2007, 40, 1–11. [Google Scholar] [CrossRef]
  11. Song, L.; Wang, X.; Zheng, X.; Huang, D. Polyphenolic antioxidant profiles of yellow camellia. Food Chem. 2011, 129, 351–357. [Google Scholar] [CrossRef] [PubMed]
  12. Sulaiman, S.F.; Sajak, A.A.; Ooi, K.L.; Supriatno; Seow, E.M. Effect of solvents in extracting polyphenols and antioxidants of selected raw vegetables. J. Food Compost. Anal. 2011, 24, 506–515. [Google Scholar] [CrossRef]
  13. Jahangir, M.; Kim, H.K.; Choi, Y.H.; Verpoorte, R. Health-affecting compounds in Brassicaceae. Compr. Rev. Food Sci. Food Saf. 2009, 8, 31–43. [Google Scholar] [CrossRef]
  14. Jin, C.-Y.; Xu, D.; Zeng, F.-K.; Zhao, Y.-C.; Yang, Y.-C.; Gao, G.-Q.; Wen, G.-H.; Liu, G. A simple method to prepare raw dehydrated potato flour by Low-Temperature Vacuum Drying. Int. J. Food Eng. 2017, 13, 20170127. [Google Scholar] [CrossRef]
  15. Wang, J.; Zhu, K.; Wang, Y.; Dai, B.; Liu, S.; Li, Y. Moisture diffusion and shrinkage characteristics of broad bean during low-temperature vacuum drying. Int. J. Food Prop. 2020, 23, 2217–2230. [Google Scholar] [CrossRef]
  16. Ramli, A.S.; Basrawi, F.; Ibrahim, T.K.; Yusof, M.H.B.; Oumer, A.N.; Johari, N.A.; Muhamad, A.; Mamat, M.R.; Habib, K. Experimental analysis on a novel low-temperature vacuum drying with induced nucleation technique for dewatering stingless bees honey. Dry. Technol. 2018, 2, 149–155. [Google Scholar] [CrossRef]
  17. Do, L.T.K.; Vu, L.T.K.; Phan, D.T.A.; Dzung, N.T. Mathematical modeling and optimization of low-temperature vacuum drying for banana. Carpathian J. Food Sci. Technol. 2021, 13, 47–61. [Google Scholar]
  18. Vega-Gálvez, A.; Stucken, K.; Cantuarias, C.; Lamas, F.; García, V.; Pastén, A. Antimicrobial properties of papaya (Vasconcellea pubescens) subjected to low-temperature vacuum dehydration. Innov. Food Sci. Emerg. Technol. 2021, 67, 102563. [Google Scholar] [CrossRef]
  19. Vega-Gálvez, A.; Uribe, E.; Pastén, A.; Vega, M.; Poblete, J.; Bilbao-Sainz, C.; Chiou, B.-S. Low-temperature vacuum drying as novel process to improve papaya (Vasconcellea pubescens) nutritional-functional properties. Future Foods 2022, 5, 100117. [Google Scholar] [CrossRef]
  20. Uribe, E.; Vega-Gálvez, A.; Pasten, A.; Cantuarias, C.; Stucken, K.; García, V.; Rodríguez, A.; Valenzuela-Barra, G.; Delporte, C. Effect of high- and low-temperature drying methods on fatty acid profile, antimicrobial and anti-inflammatory traits of papaya (Vasconcellea pubescens). ACS Food Sci. Technol. 2023, 3, 77–84. [Google Scholar] [CrossRef]
  21. Vega-Galvez, A.; Uribe, E.; Pasten, A.; Camus, J.; Rojas, M.; Garcia, V.; Araya, M.; Valenzuela-Barra, G.; Zambrano, A.; Goñi, M.G. Low-temperature vacuum drying on broccoli: Enhanced anti-inflammatory and anti-proliferative properties regarding other drying methods. Foods 2023, 12, 3311. [Google Scholar] [CrossRef] [PubMed]
  22. Mejías, N.; Vega-Galvez, A.; Gomez-Perez, L.S.; Pasten, A.; Uribe, E.; Cortés, A.; Valenzuela-Barra, G.; Camus, J.; Delporte, C.; Bernal, G. Health-promoting properties of processed red cabbage (Brassica oleracea var. capitata f. rubra): Effects of drying methods on bio-compound retention. Foods 2024, 13, 830. [Google Scholar] [CrossRef] [PubMed]
  23. AOAC (Association of Official Analytical Chemists). Official Method of Analysis; Association of Official Analytical Chemists: Washington, DC, USA, 1990; Volume 1. [Google Scholar]
  24. Dini, I.; Tenore, G.C.; Dini, A. Antioxidant compound contents and antioxidant activity before and after cooking in sweet and bitter Chenopodium quinoa seeds. LWT-Food Sci. Technol. 2010, 43, 447–451. [Google Scholar] [CrossRef]
  25. Grajeda-Iglesias, C.; Salas, E.; Barouh, N.; Baréa, B.; Panya, A.; Figueroa-Espinoza, M.C. Antioxidant activity of protocatechuates evaluated by DPPH, ORAC, and CAT methods. Food Chem. 2016, 194, 749–757. [Google Scholar] [CrossRef]
  26. Ou, B.; Hampsch-Woodill, M.; Prior, R.L. Development and validation of an improved oxygen radical absorbance capacity assay using fluorescein as the fluorescent probe. J. Agric. Food Chem. 2001, 49, 4619–4626. [Google Scholar] [CrossRef] [PubMed]
  27. King, V.A.-E.; Zall, R.R.; Ludington, D.C. Controlled low-temperature vacuum dehydration a new approach for low-temperature and low-pressure food drying. J. Food Sci. 1989, 54, 1573–1579. [Google Scholar] [CrossRef]
  28. Espinoza, O.; Bond, B. Vacuum drying of wood—State of the art. Curr. For. Rep. 2016, 2, 223–235. [Google Scholar] [CrossRef]
  29. Luqmani, B.; Brookes, A.; Moore, A.; Vale, P.; Pidou, M.; McAdam, E.J. Transitioning through the vapour-liquid equilibrium for low energy thermal stripping of ammonia from wastewater: Enabling transformation of NH3 into a zero-carbon fuel. Water Res. 2024, 248, 120856. [Google Scholar] [CrossRef] [PubMed]
  30. Silva, A.C.C.; Schmidt, F.C. Intensification of freeze-drying rate of coffee extract by vacuum freezing. Innov. Food Sci. Emerg. Technol. 2022, 78, 103022. [Google Scholar] [CrossRef]
  31. Pingniang, S.; Zhiyuan, L.; Kaizhong, H.; Qiong, X. An engineering study and analysis of the factors affecting evaporation rate under the vacuum drying process. Mode. Tradit. Chin. Med. Mater. Med. 2010, 12, 118–121. [Google Scholar] [CrossRef]
  32. Xu, P.; Zhang, Z.; Peng, X.; Yang, J.; Li, X.; Yuan, T.; Jia, X.; Liu, Y.; Abdullaev, O.; Jenis, J. Study on vacuum drying kinetics and processing of the Lonicera japonica Thunb. aqueous extracts. LWT-Food Sci. Technol. 2022, 167, 113868. [Google Scholar] [CrossRef]
  33. Shukla, B.D.; Singh, S.P. Osmo-convective drying of cauliflower, mushroom and greenpea. J. Food Eng. 2007, 80, 741–747. [Google Scholar] [CrossRef]
  34. Jambrak, A.R.; Mason, T.J.; Paniwnyk, L.; Lelas, V. Accelerated drying of button mushrooms, Brussels sprouts and cauliflower by applying power ultrasound and its rehydration properties. J. Food Eng. 2007, 81, 88–97. [Google Scholar] [CrossRef]
  35. Sahin, M.; Doymaz, I. Estimation of cauliflower mass transfer parameters during convective drying. Heat Mass Transfer 2017, 53, 507–517. [Google Scholar] [CrossRef]
  36. Tapia, M.S.; Alzamora, S.M.; Chirife, J. Effects of water activity (aw) on microbial stability as a hurdle in food preservation. In Water Activity in Foods: Fundamentals and Applications, 2nd ed.; Barbosa-Cánovas, G.V., Fontana, A.H., Jr., Schmidt, S.J., Labuza, T.P., Eds.; John Wiley & Sons, Inc.: Hoboken, NJ, USA, 2020; Chapter 14; pp. 323–355. [Google Scholar]
  37. Wang, Y.; Sun, J.; Ma, D.; Li, X.; Gao, X.; Miao, J.; Gao, W. Improving the contents of the active components and bioactivities of Chrysanthemum morifolium Ramat.: The effects of drying methods. Food Biosci. 2019, 29, 9–16. [Google Scholar] [CrossRef]
  38. Liu, B.; Tao, Y.; Manickam, S.; Li, D.; Han, Y.; Yu, Y.; Liu, D. Influence of sequential exogenous pretreatment and contact ultrasound-assisted air drying on the metabolic pathway of glucoraphanin in broccoli florets. Ultrason. Sonochem. 2022, 84, 105977. [Google Scholar] [CrossRef] [PubMed]
  39. Ali, A.M. 2015. Effect of food processing methods on the bioactive compound of cauliflower. Egypt. J. Agric. Res. 2015, 93, 117–131. [Google Scholar]
  40. Drabińska, N.; Jeż, M.; Nogueira, M. Variation in the accumulation of phytochemicals and their bioactive properties among the aerial parts of cauliflower. Antioxidants 2021, 10, 1597. [Google Scholar] [CrossRef] [PubMed]
  41. Wang, J.; Liu, Z.; Dou, J.; Lv, J.; Jin, N.; Jin, L.; Li, Z.; Zhang, B.; Tang, Z.; Yu, J. A comparative study on the nutrients, mineral elements, and antioxidant compounds in different types of Cruciferous vegetables. Agronomy 2022, 12, 3121. [Google Scholar] [CrossRef]
  42. Tadesse, A.Y.; Mohammed, H.H.; Andersa, K.N. Proximate composition and selected phytochemical component of Dawrach (Raphanus raphanistrum L.) as affected by blanching temperature. Heliyon 2023, 9, e19240. [Google Scholar] [CrossRef]
  43. Cheng, R.; Liao, X.; Addou, A.M.; Quian, J.; Wang, S.; Cheng, Z.; Wang, L.; Huang, J. Effects of “nine steaming nine sun-drying” on proximate composition, oil properties and volatile compounds of black sesame seeds. Food Chem. 2021, 344, 128577. [Google Scholar] [CrossRef] [PubMed]
  44. Suri, K.; Singh, B.; Kaur, A.; Yadav, M.P.; Singh, N. Impact of infrared and dry air roasting on the oxidative stability, fatty acid composition, Maillard reaction products and other chemical properties of black cumin (Nigella sativa L.) seed oil. Food Chem. 2019, 295, 537–547. [Google Scholar] [CrossRef] [PubMed]
  45. Raitio, R.; Orlien, V.; Skibsted, L.H. Storage stability of cauliflower soup powder: The effect of lipid oxidation and protein degradation reactions. Food Chem. 2011, 128, 371–379. [Google Scholar] [CrossRef]
  46. Scalzo, R.L.; Bianchi, G.; Genna, A.; Summa, C. Antioxidant properties and lipidic profile as quality indexes of cauliflower (Brassica oleracea L. var. botrytis) in relation to harvest time. Food Chem. 2007, 100, 1019–1025. [Google Scholar] [CrossRef]
  47. Aksüt, B.; Polatci, H. The effect of drying processes on model and quantitative color quality characteristics of cauliflower (Brassica oleracea L.). Turk. J. Agr. Eng. Res. 2022, 3, 170–180. [Google Scholar] [CrossRef]
  48. Hodges, D.M.; Munro, K.D.; Forney, C.F.; McRae, K.B. Glucosinolate and free sugar content in cauliflower (Brassica oleracea var. botrytis cv. Freemont) during controlled-atmosphere storage. Postharvest Biol. Tec. 2006, 40, 123–132. [Google Scholar] [CrossRef]
  49. Kurek, M.A.; Finnseth, C.; Skipnes, D.; Rode, T.M. Impact of high-pressure processing (HPP) on selected quality and nutritional parameters of cauliflower (Brassica oleracea var. Botrytis). Appl. Sci. 2022, 12, 6013. [Google Scholar] [CrossRef]
  50. Xu, H.; Lei, M.; Li, J.; Zou, S.; Yin, W.; Jiang, Y.; Xianyu, D.; Li, D.; Zhao, C.; Yu, L. Effects of different drying methods on the physicochemical and functional properties of Pyracantha fortuneana (Maxim.) Li fruit. LWT-Food Sci. Technol. 2023, 187, 115383. [Google Scholar] [CrossRef]
  51. Picchi, V.; Migliori, C.; Lo Scalzo, R.; Campanelli, G.; Ferrari, V.; Di Cesare, L.F. Phytochemical content in organic and conventionally grown Italian cauliflower. Food Chem. 2012, 130, 501–509. [Google Scholar] [CrossRef]
  52. Bhandari, S.R.; Kwak, J.-H. Chemical composition and antioxidant activity in different tissues of brassica vegetables. Molecules 2015, 20, 1228–1243. [Google Scholar] [CrossRef]
  53. Hu, D.; Liu, X.; Qin, Y.; Yan, J.; Li, R.; Yang, Q. The impact of different drying methods on the physical properties, bioactive components, antioxidant capacity, volatile components and industrial application of coffee peel. Food Chem. X 2023, 19, 100807. [Google Scholar] [CrossRef] [PubMed]
  54. Boivin, D.; Lamy, S.; Lord-Dufour, S.; Jackson, J.; Beaulieu, E.; Côté, M.; Moghrabi, A.; Barrette, S.; Gingras, D.; Béliveau, R. Antiproliferative and antioxidant activities of common vegetables: A comparative study. Food Chem. 2009, 112, 374–380. [Google Scholar] [CrossRef]
  55. Zafar, I.; Hussain, A.I.; Fatima, T.; Abdullah Alnasser, S.M.; Ahmad, A. Inter-varietal variation in phenolic profile, sugar contents, antioxidant, anti-proliferative and antibacterial activities of selected brassica species. Appl. Sci. 2022, 12, 5811. [Google Scholar] [CrossRef]
  56. Wall-Medrano, A.; Olivas-Aguirre, F.J. 11—Antioxidant phytochemicals in cancer prevention and therapy—An update. In Functional Foods in Cancer Prevention and Therapy; Kabir, Y., Ed.; Academic Press: Cambridge, MA, USA, 2020; pp. 195–220. [Google Scholar]
  57. Cuellar-Nuñez, M.L.; Luzardo-Ocampo, I.; Lee-Martínez, S.; Larrauri-Rodríguez, M.; Zaldívar-Lelo de Larrea, G.; Pérez-Serrano, R.M.; Camacho-Calderón, N. Isothiocyanate-rich extracts from cauliflower (Brassica oleracea Var. Botrytis) and radish (Raphanus sativus) inhibited metabolic activity and induced ROS in selected human HCT116 and HT-29 colorectal cancer cells. Int. J. Environ. Res. Public Health 2022, 19, 14919. [Google Scholar] [CrossRef]
  58. Boškovic, S.; Mimica-Dukić, N.; Četojević-Simin, D.; Orčić, D.; Karaman, M.; Bogavac, M.; Lozanov-Crvenković, Z.; Simin, N. Antioxidant, antimicrobial and antiproliferative activity of Brassica oleracea varieties broccoli, cauliflower and kohlrabi under organic and conventional cropping. J. Food Nutr. Res. 2023, 62, 224–235. [Google Scholar]
Figure 1. Effects of drying methods on the moisture ratio (MR) versus drying time curve of cauliflower. Values represent the means of triplicate analyses (n = 3), with error bars indicating the standard deviation.
Processes 12 01629 g001
Figure 2. Changes in antioxidant potential of cauliflower after drying processes measured by (A) DPPH, (B) ORAC, (C) TPC and (D) TFC assays. Values are means of triplicate analyses (n = 3) and error bars are standard deviation. Different letters on the bars indicate statistically significant differences (p < 0.05). Abbreviations: vacuum drying (VD), convective drying (CD), infrared drying (IRD), low temperature vacuum drying (LTVD), vacuum freeze drying (VFD), 2,2-diphenyl-1-picryl-hydrazyl (DPPH), Oxygen Radical Absorbance Capacity (ORAC), Total Polyphenol Content (TPC), Total Flavonoid Content (TFC), Trolox equivalent (TE), Gallic acid equivalent (GAE), Quercetin equivalent (QE).
Processes 12 01629 g002aProcesses 12 01629 g002b
Figure 3. Changes in the antiproliferative properties of extracts obtained from dried cauliflower using different methods, assessed by the propidium iodide (PI) assay. Values are mean ± SEM of three independent assays (n = 3). RPMI-1640 medium was used as a negative control (white bar), while 50% DMSO (v/v) was used as the positive control (shadow bar).
Processes 12 01629 g003
Table 1. Changes in the nutritional values of cauliflower after drying processes.
ParametersDrying Methods
VDCDIRDLTVDVFD
1 Moisture11.65 ± 0.13 b9.05 ± 0.02 d10.31 ± 0.15 c12.87 ± 0.16 a8.88 ± 0.05 d
2 Water activity0.4161 ± 0.0031 a0.3224 ± 0.0008 d0.3628 ± 0.0006 c0.4007 ± 0.0018 b0.2565 ± 0.0045 e
3 Ash12.06 ± 0.21 a10.81 ± 0.17 b12.03 ± 0.18 a11.90 ± 0.10 a11.84 ± 0.10 a
3 Crude fiber12.76 ± 0.45 a9.31 ± 0.51 b12.21 ± 0.93 a12.67 ± 1.20 a10.52 ± 0.97 b
3 Fat2.69 ± 0.04 bc2.95 ± 0.05 b2.51 ± 0.15 c2.68 ± 0.11 bc3.66 ± 0.16 a
3 Crude protein25.05 ± 0.11 ab21.79 ± 0.04 b23.35 ± 1.07 ab26.90 ± 0.57 a23.39 ± 0.17 ab
Saturated fatty acids (SFAs)
4 C12:0 0.01 ± 0.00 b0.11 ± 0.07 a0.02 ± 0.00 ab0.03 ± 0.00 ab0.03 ± 0.00 ab
4 C14:0 0.16 ± 0.01 b0.11 ± 0.04 c0.18 ± 0.00 ab0.19 ± 0.00 ab0.22 ± 0.01 a
4 C15:0 0.37 ± 0.01 ab0.31 ± 0.05 b0.39 ± 0.00 a0.40 ± 0.00 a0.39 ± 0.01 a
4 C16:0 19.08 ± 0.10 a18.24 ± 0.42 b17.91 ± 0.09 b17.74 ± 0.12 b18.35 ± 0.39 b
4 C17:0 0.83 ± 0.00 ab0.76 ± 0.03 c0.77 ± 0.04 bc0.75 ± 0.01 c0.85 ± 0.02 a
4 C18:0 1.82 ± 0.02 a1.60 ± 0.02 b1.66 ± 0.06 b1.64 ± 0.09 b1.54 ± 0.01 b
4 C20:0 0.43 ± 0.02 a0.24 ± 0.07 b0.35 ± 0.03 ab0.33 ± 0.05 ab0.34 ± 0.05 ab
4 C22:00.19 ± 0.02 a0.12 ± 0.06 b0.14 ± 0.01 bNDND
4 C24:00.53 ± 0.09 a0.33 ± 0.15 a0.38 ± 0.02 a0.49 ± 0.16 a0.40 ± 0.08 a
Monounsaturated fatty acids (MUFAs)
4 C16:1 0.47 ± 0.01 a0.37 ± 0.08 b0.41 ± 0.02 bNDND
4 C17:1 0.30 ± 0.00 a0.27 ± 0.02 a0.29 ± 0.01 b0.30 ± 0.03 b0.28 ± 0.02 b
4 C18:1 n9 c/C18:1 n9 t0.37 ± 0.01 a0.26 ± 0.04 a0.27 ± 0.05 a0.20 ± 0.01 b0.27 ± 0.02 b
4 C20:1 n9 0.07 ± 0.01 a0.03 ± 0.00 a0.02 ± 0.00 aNDND
4 C24:1 n9 0.48 ± 0.03 a0.39 ± 0.18 a0.49 ± 0.06 a0.72 ± 0.18 a0.66 ± 0.03 a
4 Unidentified MUFAND9.26 ± 0.05 a8.47 ± 0.04 b9.21 ± 0.00 a9.03 ± 0.31 a
Polyunsaturated fatty acids (PUFAs)
4 C18:2 n6 c 11.00 ± 0.17 a9.38 ± 0.08 d9.75 ± 0.08 c9.32 ± 0.03 d10.66 ± 0.07 b
4 C18:3 n663.63 ± 0.21 a58.14 ± 0.13 b58.48 ± 0.20 b58.44 ± 0.23 b56.25 ± 0.44 c
4 C20:2 0.11 ± 0.01 ab0.06 ± 0.02 ab0.09 ± 0.01 ab0.10 ± 0.02 ab0.13 ± 0.03 a
4 C20:3 n3 0.15 ± 0.01 a0.09 ± 0.03 b0.13 ± 0.01 ab0.14 ± 0.01 a0.17 ± 0.02 a
Values represent the mean ± standard deviation from three measurements (n = 3). Values in the same row with different superscript letters differ significantly (p < 0.05). 1 Expressed as g/100 g. 2 Dimensionless. 3 Expressed as g/100 g of dry matter (d.m.). 4 Expressed as g/100 g of Fatty Acid Methyl Ester Standard (FAMES). Abbreviations: Not detected (ND), vacuum drying (VD), convective drying (CD), infrared drying (IRD), low-temperature vacuum drying (LTVD), vacuum freeze drying (VFD).
Table 2. Changes in the color parameters of the cauliflower after drying processes.
FreshVDCDIRDLTVDVFD
L*70.48 ± 0.33 e78.79 ± 0.68 c81.58 ± 0.23 b76.12 ± 0.36 d82.59 ± 0.20 b89.18 ± 0.31 a
a*−3.68 ± 0.20 e0.52 ± 0.10 b−0.14 ± 0.08 c3.01 ± 0.13 a−0.25 ± 0.06 c−3.12 ± 0.03 d
b*19.74 ± 0.30 cd30.82 ± 0.11 a20.16 ± 0.55 c24.67 ± 0.28 b19.19 ± 0.22 d10.49 ± 0.36 e
ΔE-14.48 ± 0.18 b11.67 ± 0.23 d10.06 ± 0.46 e12.61 ± 0.22 c20.87 ± 0.10 a
Chroma20.09 ± 0.26 c30.82 ± 0.11 a20.16 ± 0.55 c24.86 ± 0.28 b19.19 ± 0.22 d10.95 ± 0.35 e
Hue100.61 ± 0.70 b89.04 ± 0.20 d90.40 ± 0.23 c83.04 ± 0.26 e90.75 ± 0.16 c106.58 ± 0.47 a
Values represent the mean ± standard deviation from six measurements (n = 6). Values in the same row with different superscript letters differ significantly (p < 0.05). Abbreviations: vacuum drying (VD), convective drying (CD), infrared drying (IRD), low temperature vacuum drying (LTVD), vacuum freeze drying (VFD).
Disclaimer/Publisher’s Note: The statements, opinions and data contained in all publications are solely those of the individual author(s) and contributor(s) and not of MDPI and/or the editor(s). MDPI and/or the editor(s) disclaim responsibility for any injury to people or property resulting from any ideas, methods, instructions or products referred to in the content.

